multi-trophic level ecology of wolves, elk, and … · multi-trophic level ecology of wolves, elk,...
TRANSCRIPT

MULTI-TROPHIC LEVEL ECOLOGY OF WOLVES, ELK, AND VEGETATION IN YELLOWSTONE NATIONAL PARK: ELK CALF MORTALITY STUDY
NRPP Project #71604
Final Completion Report, FY2003-FY2005
November 28, 2005
Report Prepared By:
P. J. White1, Wildlife Biologist, Yellowstone Center for Resources, Yellowstone National Park, Mammoth, WY 82190;
L. David Mech2, Senior Research Scientist, U.S. Geological Survey, Northern Prairie
Wildlife Research Center, Jamestown, ND 58401-7317; and
Shannon M. Barber3, Research Assistant, Department of Fisheries, Wildlife and Conservation Biology, University of Minnesota, St. Paul, MN 55108.
1 Mailing address: P.O. Box 168, Yellowstone Center for Resources, Yellowstone National Park,
Mammoth, WY 82190 2 Mailing address: U.S. Geological Survey, The Raptor Center, 1920 Fitch Ave., University of
Minnesota, St. Paul, MN 55108 3 Mailing address: 200 Hodson Hall, 1980 Folwell Avenue, University of Minnestoa, St. Paul,
MN 55108-6124 Data in this report are preliminary and may not be published, reproduced, or otherwise used without written
permission from the authors. This information is distributed solely for the purpose of pre-dissemination peer review
under applicable information quality guidelines. It has not been formally disseminated by the National Park Service
or U.S. Geological Survey and should not be construed to represent any agency determination or policy.
1

Introduction Annual trend counts of northern Yellowstone elk decreased from 19,045 to 9,545 during 1994-2005 and indices of recruitment during 2002-2005 were among the lowest recorded during the past several decades. Many people attributed these changes to the restoration of wolves in Yellowstone since elk comprised more than 85% of documented wolf kills during 1997-2002 (Smith et al. 2003b). Prior to wolf restoration (1987-1990), survival rates for northern Yellowstone elk calves during summer were 50-85% and 72% of all calf deaths during summer were due to predators (i.e., bears and coyotes; Singer et al. 1997). We conducted a similar study of radio-tagged elk calves during 2003-2005 to: 1) estimate the relative causes and timing of calf deaths; 2) estimate survival rates; and 3) evaluate factors that may predispose calves to death. Methods To the extent feasible, we replicated the methodology and experimental design used by Singer et al. (1997) to capture and monitor elk neonates during 1987–1990. This study provided a baseline for comparison post-wolf restoration data. Each year, we captured a sample of 44–56 calves <6 days old. Calves were captured from four general areas, including: 1) Sepulcher Mountain foothills and Mammoth; 2) Swan Lake and Gardners Hole; 3) Blacktail Deer Plateau and Tower; and 4) Lamar Valley. We captured calves born in the early (May 17–26), middle (May 27–June 5), and late (June 6–15) portions of the calving season. Ground searches for calves were conducted during May 15–June 15 from vehicles or by using spotting scopes to survey areas where calves were suspected based on maternal behavior or information from park visitors or staff. Aerial searches using a helicopter were conducted during three 2- or 3-day periods in the early, middle, and late portions of the calving season (i.e., a total of 6–9 days during each calving season). When a calf was spotted, the pilot landed in the vicinity and two biologists manually captured the calf. We did not attempt to capture calves if predators were observed nearby. During captures, we collected age, sex, and weight measurements, general body condition data, and blood samples. We aged calves by examining their wobbly stance, incisor eruption, attached umbilicus, and status of hooves and dew claws (Johnson 1951). Each calf was fit with an ear-tag transmitter (Model 3430, Advanced Telemetry Systems, Inc., Isanti, Minnesota) weighing approximately 23 grams and designed to emit a radio signal for approximately a year. Each transmitter was designed to change pulse rate if it remained motionless for more than 4 hours. This change in pulse rate (i.e., “mortality mode/signal”) alerted us that the animal was likely dead and enabled us to examine the carcass soon after death. Thus, the transmitters allowed us to quickly and conveniently monitor daily survival without visually locating each animal. Signals of radio-tagged calves were monitored via airplane each day at dawn during mid-May through mid-July, when the risk of mortality to calves was relatively high. As calves became older and less prone to mortality, aerial monitoring was reduced to three times per week during mid-to-late July, twice per week during August–September, and bi-monthly thereafter. The pilot obtained locations for all dead calves using a Global Positioning System (GPS) unit and searched around carcasses for predators to reduce the risk that ground crews might walk in on a carcass with large predators nearby. Ground crews also monitored transmitter frequencies 3-4 times per
2

day until approximately July 15 and once per day from July 15-September 30. Ground crews investigated mortality sites and conducted necropsies of dead calves to evaluate causes of death based on evidence such as predator tracks, consumption patterns, canine puncture measurements, and scat measurements. Crews also collected hair samples for predator identification and both a femur mid-section and metatarsus for calf-condition analyses. Preliminary Results One hundred and fifty-one elk were captured and processed during the summers of 2003–2005 (Table 1). Both sexes were captured across all areas fairly evenly, with slightly more female captures than males (Table 2). Estimated ages of elk calves at capture ranged from <0.5-6 days and were not significantly different between females and males among years (Table 3). Estimated birth dates of calves ranged between May 16 and June 10, with most calves born around June 1 each year (Table 4). Birth weights were estimated from capture weights using linear regression of estimated age versus capture weight (Figure 1). The estimated daily growth rate for each sex was applied to each calf’s estimated age at capture to back-calculate estimated birth weights. Calf capture and birth weights were similar across years, averaging approximately 17–18 kg and 14–15 kg respectively, with males tending to be heavier (Tables 3 and 5). One hundred and three tagged calves (68%) died within their first year of life (Table 6). Two calves were classified as missing and six calves lost their ear tag transmitters. Predators caused >90% of the deaths and >70% of this predation occurred within the first 15 days of life (Tables 7 and 8). Bears accounted for approximately 55–60% of all deaths (including both predation and non-predation) for tagged elk calves during their first 30 days of life, while coyotes and wolves each accounted for approximately 10–15% of deaths (Table 6). Causes of death for elk calves during summers 2003–2005 were generally similar. Annual and seasonal survival rates for calves were not significantly different during 2003-2005 (Table 8). The annual survival (0.32) of 2003-2005 cohorts was within the range (0.14-0.63) reported for calves during 1987-1990, but significantly lower than mean survival (0.43) during 1987-1990 (Singer et al. 1997). There was significantly more predation and less winter-kill of elk calves during 2003-2005 compared to 1987-1990. Blood samples collected from captured calves were sent to various laboratories for assays of bovine viral diarrhea (BVD-1), infectious bovine rhinotracheitis (IBR), bovine respiratory synctial virus (BRSV), Brucella abortus (BR/CF), and bovine parainfluenza-3 (PI3). Potential condition indicators including blood urea nitrogen (BUN, Kunkel and Mech 1994), thyroxine (T4), gamma-globulins (GG), gamma-glutamyl transferase (GGT), and cytokines (e.g., IGF-1, IL-6, and TNF-α) will also be investigated. Blood condition values will be compared between surviving calves and those killed by predators once we receive the results. Discussion Seventy-two percent of all calf deaths during summers in 1987-1990 were due to predators, primarily grizzly bears and coyotes (Singer et al. 1997). However, the ratio of predators to prey on the northern range has increased since that study. The minimum population estimate for
3

grizzly bears in the greater Yellowstone area increased from 150 bears in 1987 to 431 bears in 2004 (Haroldson et al. 1998, Haroldson and Frey 2005; Figure 2). Similarly, the number of unduplicated sightings of female grizzly bears with cubs of the year increased from 13 sows in 1987 to 49 sows in 2004 (Haroldson et al. 1998, Haroldson and Frey 2005; Figure 3). Grizzly and black bears appear to concentrate in elk calving areas on the northern range during May and June. Thus, it was not unexpected that bear predation was a significant factor on the survival of elk calves during early summer. Additionally, wolves were restored to Yellowstone National Park during 1995 and 1996 and rapidly increased in abundance and distribution throughout the park and the greater Yellowstone area (Figure 4). Approximately 171 wolves resided in Yellowstone National Park during 2004 and elk calves accounted for 15 percent of documented wolf kills (Smith et al. 2005). Thus, wolves could be a significant limiting factor for elk recruitment if much of this predation is additive to other mortality sources. Our results indicate some form of compensatory mortality is likely occurring because summer predation increased from 72% of deaths during 1987-1990 to 94% during 2003-2005, but winter-kill decreased from 58% to zero during the same time period (Table 8). However, these cause-specific mortality results could easily be misinterpreted because they are necessarily biased towards early calf mortality and do not include possible sources of mortality during the winter season. Studies of caribou calf mortality in Denali National Park, Alaska, found that bear predation was predominant early in the calving season and declined with calf age, while wolf predation peaked later in the season (Adams et al. 1995). Thus, we anticipated that bear predation may be a relatively high source of early calf mortality in northern Yellowstone elk, with wolf predation increasing during winter. In May and June, bears search in grid-like patterns for hiding neonate calves (Gunther and Renkin 1990), whereas wolves tend to select vulnerable prey while testing groups of elk (Smith et al. 2003a). Thus, wolves may be more likely to kill calves in groups of elk during winter when bears are in their winter torpor. In addition, the survival and relative causes of death for northern Yellowstone elk calves may change substantially among years (e.g., Singer et al. 1997) due to numerous factors. For example, poor foraging conditions may prompt bears to find alternate food sources such as elk calves to meet their nutritional requirements (Smith and Anderson 1996). Thus, the extent of bear predation on northern Yellowstone elk calves may vary among years in response to the availability of a seasonally important alternative food sources such as carcasses of ungulate winter-kills or whitebark pine (Pinus albicaulis) nuts. Ungulate carcasses can be prevalent on the northern range during severe winters, but have decreased since the restoration of wolves which selectively prey on chronically undernourished animals (Singer et al. 1989, DelGuidice et al. 1991, Northern Yellowstone Cooperative Wildlife Working Group 2004). Also, whitebark pine is a masting species that yields abundant nut crops in some years and poor crops in others (Felicetti et al. 2003). When bears emerge from their dens in spring, they depend upon the previous year’s crop of white-bark pine as a food source. Therefore, in the spring following a year of poor nut crops, other food, including elk calves, could become more important for emerging bears (Mattson 1997, Mattson et al. 1991, Felicetti et al. 2003).
4

Furthermore, our study was designed for comparison to the results of Singer et al. (1997) on northern Yellowstone elk calves during 1987-1990. Calves sampled during both of these studies likely constituted <1% of the total calf population, based on gross estimates derived from aerial trend counts and classifications, and are only representative of calves born on the northern range. These samples are not representative of calves born along migration routes of northern Yellowstone elk or in other areas of the park. In addition, results from this study cannot be fairly compared to results from other areas or periods with different complexes of predators and prey, different ratios of predators to prey, different elk behaviors (e.g., migratory versus nonmigratory), or different wolf management scenarios without considerably more study and qualification. The results of this study have immediate relevance to resource managers of the Yellowstone ecosystem, the Montana Department of Fish, Wildlife, and Parks in setting harvest quotas for local elk hunts, and to the United States Fish and Wildlife Service regarding the delisting of wolves. The Montana Department of Fish, Wildlife and Parks has already decreased antlerless elk permits from 1,100 to 100 for the 2006 Gardiner Late Elk Hunt based on evidence of continued low recruitment of elk calves. Furthermore, information regarding the effects of wolves on ungulate population dynamics and, in turn, other interactions (e.g., elk–vegetation) has implications to areas throughout the United States and abroad where wolves and other large predators are recolonizing and increasing in density. We will continue to monitor radio-tagged calves through winter 2006. The final results of the project will be summarized in a Ph.D. dissertation and one or more publications in peer-reviewed scientific journals. Budget The total project cost during FY2003-2005 was $386,500 of which $174,500 was NRPP funds (Table 9). Funding for this study was provided by the Natural Park Service, Biological Resources Discipline of the U.S. Geological Survey, Graduate School of the University of Minnesota, Annie and Bob Graham, Yellowstone Park Foundation, and Montana Fish, Wildlife, and Parks,. Acknowledgements Special thanks to Dr. Francis Singer and Troy Davis for consultation and assistance during project design and implementation. We also thank Erin Albers, Tasha Bedgood, Billy Bering, Traci Caddy, Trevor Clark, Bianca Colasuonno, Chris Crowe, Troy Davis, Vince Green, Corinna Hanson, Tom Lemke, Karen Loveless, Michelle St. Martin, Will Neighbors, Daniel Ravenel, and Jordan Smith for assisting with field work. Doug Chapman and Ben Walton of Montana Aircraft conducted monitoring flights. Hawkins & Powers (Greybull, Wyoming) and Central Helicopters (Bozeman, Montana) conducted helicopter flights during elk calf captures. Dan Krapf, Wendy Hafer, and Mike Wagner served as helicopter managers. Neil Anderson performed necropsies and tissue samples were analyzed by the State of Montana Department of Livestock Diagnostic Laboratory. Lisette Waits and Cort Anderson of the University of Idaho, and Kristy Pilgrim of Carnivore Conservation Genetics Laboratory, performed DNA analyses of predator hair and scat
5

samples. James Halfpenny provided training on predator hair identification. Doug Smith and Rick McIntyre shared information on elk calf natality and mortality. Literature Cited Adams, L.G., F.J. Singer, and B.W. Dale. 1995. Caribou calf mortality in Denali National Park,
Alaska. Journal of Wildlife Management 59:584-594. DelGuidice, G.D, F.J. Singer, and U.S. Seal. 1991. Physiological assessment of winter
nutritional deprivation in elk of Yellowstone National Park. Journal of Wildlife Management 55:653-664.
Felicetti, L.A., C.C. Schwartz, R.O. Rye, M.A. Haroldson, K.A. Gunther, and C.T. Robbins. 2003. Use of sulfur and nitrogen stable isotopes to determine the importance of whitebark pine nuts to Yellowstone grizzly bears. Canadian Journal of Zoology 81:763-770.
Gunther, K. and R. Renkin. 1990. Grizzly bear predation on elk calves and other fauna of Yellowstone National Park. International Conference on Bear Research and Management 8:329-334.
Haroldson, M.A. and K. Frey. 2005. Grizzly Bear Mortalities. Pages 24-29 in C.C. Schwartz and M.A. Haroldson, editors. Yellowstone grizzly bear investigations: annual report of the Interagency Grizzly Bear Study Team, 2003. U.S. Geological Survey, Bozeman, Montana.
Haroldson, M.A., R. A. Swalley, S. Podruzny, C.C. Schwartz, M. Ternet, G. Holm, and D. Moody. 1998. Yellowstone Grizzly Bear Investigations: Report of the Interagency Grizzly Bear Study Team, 1997. U.S. Geological Survey, Bozeman, Montana.
Johnson, D.E. 1951. Biology of the elk calf, Cervus canadensis nelsoni. Journal of Wildlife Management 15:396-410.
Kunkel, K.E. and L.D. Mech. 1994. Wolf and bear predation on white-tailed deer fawns. Canadian Journal of Zoology 72:1557-1565.
Mattson, D.J. 1997. Use of ungulates by Yellowstone grizzly bears Ursus arctos. Biological Conservation 81:161-177.
Mattson, D.J., C.M. Gillin, S.A. Benson, and R.R. Knight. 1991. Bear use of alpine insect aggregations in the Yellowstone ecosystem. Canadian Journal of Zoology 69:2430-2435.
Northern Yellowstone Cooperative Wildlife Working Group. 2004. Annual Report. Unpublished report issued May 20, 2005, by the National Park Service (Yellowstone National Park), Montana Fish, Wildlife, and Parks, U.S. Forest Service (Gallatin National Forest), and U.S. Geological Service (Northern Rocky Mountain Science Center). Copy on file at the Yellowstone Center for Resources, Yellowstone National Park, Wyoming, USA.
Singer, F.J., A. Harting, K.K. Symonds, and M.B. Coughenour. 1997. Density dependence, compensation, and environmental effects on elk calf mortality in Yellowstone National Park. Journal of Wildlife Management 61:12-25.
Singer, F.J., W. Schreir, J. Oppenheim, and E.O. Garton. 1989. Drought, fires and large mammals. Bioscience 39:716-722.
Smith, B.L., and S.H. Anderson. 1996. Patterns of neonatal mortality of elk in northwest Wyoming. Canadian Journal of Zoology 74:1229-1237. Smith, D.W., R.O. Peterson, and D.B. Houston. 2003a. Yellowstone After Wolves. Bioscience
53:330-340.
6

7
Smith, D.W., D.R. Stahler, and D.S. Guernsey. 2003b. Yellowstone Wolf Project: Annual Report, 2002. National Park Service, Yellowstone Center for Resources, Yellowstone National Park, Wyoming, YCR-NR-2003-04.
Smith, D.W., D.R. Stahler, and D.S. Guernsey. 2005. Yellowstone Wolf Project: Annual Report, 2004. National Park Service, Yellowstone Center for Resources, Yellowstone National Park, Wyoming, YCR-NR-2005-02.
U.S. Fish and Wildlife Service, Nez Perce Tribe, National Park Service, Montana Fish, Wildlife and Parks, Idaho Fish and Game, and USDA Wildlife Services. 2005. Rocky Mountain Wolf Recovery 2004 Annual Report. D. Boyd, ed. USFWS, Ecological Services, 100 N Park, Suite 320, Helena, Montana.
Table 1. Summary of capture methods, locations, and timing for northern Yellowstone elk calves during 2003-2005 in Yellowstone National Park, Montana and Wyoming, USA.
CAPTURES SUMMER 2003 SUMMER 2004 SUMMER 2005 TOTAL
TOTAL CAPTURED 51 44 56 151
Ground captures 6 4 1 11
Aerial captures 45 40 55 140
CAPTURE PERIODS
Early season 14 11 26 51
Middle season 17 20 18 55
Late season 20 13 12 45
CAPTURE AREAS
Sepulcher foothills/Mammoth
14 12 13 39
Swan Lake/Gardners Hole
11 14 14 39
Blacktail Deer Plateau 9 10 11 30
Lamar Valley 17 8 18 43

C
APT
UR
E
PER
IOD
SE
PUL
CH
ER
FO
OT
HIL
LS/
MA
MM
OT
H
SWA
N L
AK
E/
GA
RD
NE
RS
HO
LE
B
LA
CK
TA
IL D
EE
R
PLA
TE
AU
/TO
WE
R
L
AM
AR
VA
LL
EY
TO
TA
L
G
roun
d 4
(3M
,1F)
1
(1F)
0
0 5
(3M
,2F)
Air
13
(4M
,9F)
4
(4F)
8(
5M,3
F)
21 (1
0M,1
1F)
46 (1
9M,2
7F)
Ear
ly
(mid
to
late
May
)
T
otal
17
(7M
,10F
) 5
(5F)
8
(5M
,3F)
21
(10M
,11F
) 51
(22M
,29F
)
Gro
und
4 (2
M,2
F)
1 (1
F)
0 1
(1M
) 6
(3M
,3F)
Air
6
(2M
,4F)
22
(11M
,11F
) 11
(3M
,8F)
10
(4M
,6F)
49
(20M
,29F
)
Mid
dle
(late
May
to
early
Ju
ne)
Tot
al
10 (4
M,6
F)
23 (1
1M,1
2F)
11 (3
M,8
F)
11 (5
M,6
F)
55 (2
3M,3
2F)
Gro
und
0 0
0 0
0
Air
12
(5M
,7F)
11
(6M
,5F)
11
(6M
,5F)
11
(6M
,5F)
45
(23M
,22F
)
Lat
e
(ear
ly to
m
id Ju
ne)
Tot
al
12 (5
M,7
F)
11 (6
M,5
F)
11 (6
M,5
F)
11 (6
M,5
F)
45 (2
3M,2
2F)
Ove
rall
Gro
und
8 (5
M,3
F)
2 (2
F)
0 1
(1M
) 11
(6M
,5F)
A
ir
31 (1
1M,2
0F)
37 (1
7M,2
0F)
30 (1
4M,1
6F)
42 (2
0M,2
2F)
140
(62M
,78F
)
T
ol
ta39
(16M
,23F
) 39
(17M
,22F
) 30
(14M
,16F
) 43
(21M
,22F
) 15
1 (6
8M,8
3F)
Tabl
e 2.
Gen
eral
loca
tions
and
rela
tive
timin
g of
cap
ture
s for
nor
ther
n Y
ello
wst
one
elk
calv
es d
urin
g 20
03-2
005
in Y
ello
wst
one
Nat
iona
l Par
k, M
onta
na a
nd W
yom
ing,
USA
(M =
mal
es; F
= fe
mal
es).
8

Table 3. Average estimated birth weights, capture ages, and capture weights of northern Yellowstone elk calves during 2003-2005 in Yellowstone National Park, Montana and Wyoming, USA.
CALF CHARACTERISTICS SUMMER 2003 SUMMER 2004 SUMMER 2005 2003-2005
MALE:FEMALE 19:32 21:23 28:28 68:83
CAPTURE AGE (DAYS) 2.5 (1.6 SD) 2.9 (1.5 SD) 2.4 (1.4 SD) 2.56 (1.53 SD)
- female 2.4 (1.5 SD) 2.7 (1.7 SD) 2.1 (1.3 SD) 2.38 (1.49 SD)
- male 2.7 (1.8 SD) 3.1 (1.4 SD) 2.6 (1.5 SD) 2.79 (1.55 SD)
CAPTURE WEIGHT (KG) 17.05 (2.48 SD) 17.35 (3.30 SD) 18.37 (3.41 SD) 17.64 (3.14 SD)
- female 16.91 (2.61 SD) 17.07 (4.23 SD) 17.03 (2.74 SD) 17.00 (3.15 SD)
- male 17.26 (2.32 SD) 17.65 (1.88 SD) 19.82 (3.52 SD) 18.41 (2.96 SD)
BIRTH WEIGHT (KG) BY
YEARS
14.42 (1.94 SD)
14.17 (3.31 SD)
14.47 (2.20 SD) 14.36 (2.49 SD)
- female 13.87 (1.78 SD) 11.93 (2.72 SD) 13.75 (1.83 SD) 13.27 (2.25 SD)
- male 15.27 (1.90 SD) 16.62 (1.82 SD) 15.24 (2.32 SD) 15.68 (2.13 SD)
BIRTH WEIGHT (KG)
POOLED YEARS
13.80 (2.01 SD)
13.77 (2.58 SD)
15.51 (2.85 SD) 14.44 (2.64 SD)
-female 13.18 (1.83 SD) 12.94 (2.80 SD) 13.93 (2.04 SD) 13.37 (2.23 SD)
-male 14.75 (1.94 SD) 14.67 (2.01 SD) 17.10 (2.68 SD) 15.70 (2.55 SD)
9

Table 4. Estimated birth dates of northern Yellowstone elk calves by primary calving area during 2003-2005, Yellowstone National Park, Montana and Wyoming, USA.
BIRTH DATE
CALVING AREA
NO.
MEAN STANDARD DEVIATION
MINIMUM
MAXIMUM
Sepulcher foothills/Mammoth 39 May 28 7.5 May 18 June 9
Swan Lake/Gardners Hole 39 May 30 5.0 May 16 June 10
Blacktail Deer Plateau/Tower 30 May 30 7.3 May 16 June 9
Lamar Valley 43 May 27 7.0 May 18 June 9
Table 5. Estimated birth weights (kg) of northern Yellowstone elk calves by primary calving area during 2003-2005, Yellowstone National Park, Montana and Wyoming, USA.
BIRTH WEIGHT
CALVING AREA
NO.
MEAN STANDARD DEVIATION
MINIMUM
MAXIMUM
Sepulcher foothills/Mammoth 37 14.3 2.5 8.8 18.7
Swan Lake/Gardners Hole 38 14.8 2.6 7.2 21.0
Blacktail Deer Plateau/Tower 30 14.2 3.0 5.4 18.5
Lamar Valley 43 14.1 2.0 10.8 20.5
10

Table 6. Fates of northern Yellowstone elk calves radio-tagged during 2003-2005 in Yellowstone National Park, Montana and Wyoming, USA.
2003 2004 2005 2003-2005
CAUSEa NO. % NO. % NO. % NO. % Bear 20 54 17 49 23 55 60 53
Grizzly Bear (11) (30) (7) (20) (15) (36) (33) (29)
Black Bear (6) (16) (7) (20) (8) (19) (21) (18)
Unknown Bear (3) (8) (3) (8) (0) (6) (5)
Wolf 4 11 4 11 7 17 15 13
Coyote 4 11 4 11 2 5 10 9
Wolf or Bear (both at scene)
1 3 1 3 0 2 2
Mountain Lion 1 3 0 2 5 3 3
Wolverine 1 3 0 0 1 1
Golden Eagle 0 1 3 0 1 1
Hunter 1 3 0 0 1 1
Unknown Predator 1 3 1 3 3 7 5 4
Not Predationb 2 5 2 6 1 2 5 4
Missing 1 2 1 3 0 2 2
Transmitter pull-out 0 4 11 3 7 7 6
Unknownc 1 2 0 1 2 2 2
TOTAL FATES (CAPTURES)
37 (51)
73% 35 (44)
80% 42 (56)
75% 114 (151)
75%
a Includes missing animals and possible transmitter pull-outs. b In 2003, one calf likely drowned and another possibly died from excess fluoride. In 2004, one calf’s lungs never fully expanded and another likely died from exposure to cold. In 2005, one calf likely died from pneumonia.
c In 2003, one possible mortality was unable to be examined due to fires near Mt. Chittenden. In 2005, one possible mortality was unable to be examined due to high waters in Cache Creek.
11

Table 7. Estimated age at death (days) for northern Yellowstone elk calves radio-tagged during 2003-2005 in Yellowstone National Park, Montana and Wyoming, USA.
CAUSE OF DEATHa NO. MEAN + SD RANGE (days)
Bear 60 10 (8) 0.5 - 42
Grizzly Bear (33) (9 (7)) (0.5 - 42)
Black Bear (21) (12 (10)) (1.5 – 42)
Unknown Bear (6) (9 (3)) (4.5 – 14)
Wolf 15 35 (53) 3.5 - 213
Coyote 10 29 (72) 2 - 235
Wolf or Bear (both at scene) 2 9 (9) 3 - 15
Mountain Lion 3 107 (24) 80 – 122
Wolverine 1 4 --
Golden Eagle 1 42 --
Hunter 1 239 --
Unknown Predator 5 33 (63) 1.5 – 145
Not Predationb 5 11 (10) 0.5 - 25
Missing 2 54 (69) 6 - 103
Transmitter pull-out 7 137 (106) 2.5 - 333
Unknownc 2 45 (32) 23 - 68
Overall 114 30 (56) 0.5 - 333
a Includes missing animals and possible transmitter pull-outs. b In 2003, one calf likely drowned and another possibly died from excess fluoride. In 2004, one calf’s lungs never fully expanded and another likely died from exposure to cold. In 2005, one calf likely died from pneumonia. c In 2003, one possible mortality was unable to be examined due to fires near Mt. Chittenden. In 2005 one possible mortality was unable to be examined due to high waters in Cache Creek.
12

Table 8. Gross estimates of survival and mortality for northern Yellowstone elk calves radio-tagged during 2003-2005 and 1987-1990 (Singer et al. 1997) in Yellowstone National Park, Montana and Wyoming, USA.
Survival/Mortalitya 2003 2004 2005b 2003 - 2005 1987-1990 Annual survival 0.31 0.32 0.34 0.32 0.43 (0.14-0.63)
Annual mortality due to predation
0.94 0.93 0.97 0.95 0.45
Summer survival c 0.35 0.32 0.34 0.34 0.65
Summer mortality due to predation
0.94 0.93 0.97 0.95 0.72
Winter survival d 0.89 1.00 0.94 0.72
Winter mortality due to malnutrition
0 0 0 0.58
Bear predatione 0.57 0.57 0.62 0.59 0.23
a Annual or seasonal survival was estimated as ( )nds −=1ˆ , where d was the number of calves that died and n was the number of calves at risk. Estimates do not include missing, unknown, or possible transmitter pull-outs. b Estimates for 2005 are based on monitoring through October 31, 2005.
c Summer is defined as capture through October 31. d Winter is defined as November 1 through May 15. e Percent of deaths due to bear predation.
13

Table 9. FY2003-FY2005 budget ($1000) for the elk calf mortality study on the northern range of Yellowstone National Park, Montana and Wyoming, USA. Costs FY03
NRPP FY03 USGS
FY03 Othera
FY04 NRPP
FY04 USGS
FY04 Othera
FY05 NRPP
FY05 USGS
FY05 Othera
Personnel Services Term GS-6 (5mo) 14 14 1 Graduate student stipend 3 15 3 15 18 Volunteers (6 @ $15/day for 60 days)
4 1.5 4 1.5 4 1.5
Volunteer housing 2 1.5 2 1.5 2 1.5 Travel and Transportation Travel (collaborators) 2 2 2 Contractors and Cooperators Helicopter capture – elk calves 38 3 38 3 38 3 Aerial monitoring of elk calves 23 10 23 10 18 15 Blood and condition analyses 2 2 2 Supplies and Equipment Mortality transmitters (ear tag) 10 9 8.5 Telemetry and other miscellaneous equipment
5 5 5
TOTAL 59 30 45 58 30 45 57.5 18 44
a The Yellowstone Park Foundation committed $15,000 during FY 2003 and FY 2004 for a graduate student stipend. In addition, Ms. Annie Graham donated $10,000 through the Yellowstone Park Foundation and Doug Smith during FY 2003.
14

Figure 1. Linear regression to determine growth rates of northern Yellowstone elk calves during their first six days of life using capture weights and estimated age at capture by gender during 2003–2005, Yellowstone National Park, Montana and Wyoming, USA.
Elk Calf Capture Weights (kg) Vs. Estimated Age At Capture (days) Pooled By Sex
Males = 15.7726 + 0.9454*xFemales = 13.3382 + 1.5323*x
Estimated Age At Capture (days)
Males: r=0.4930, p=0.000 / Females: r=0.7304, p=0.000
Cap
ture
Wei
ght (
kg)
Males
0 1 2 3 4 5 6 7
5.0
10.0
15.0
20.0
25.0
30.0
Females
0 1 2 3 4 5 6 7
15
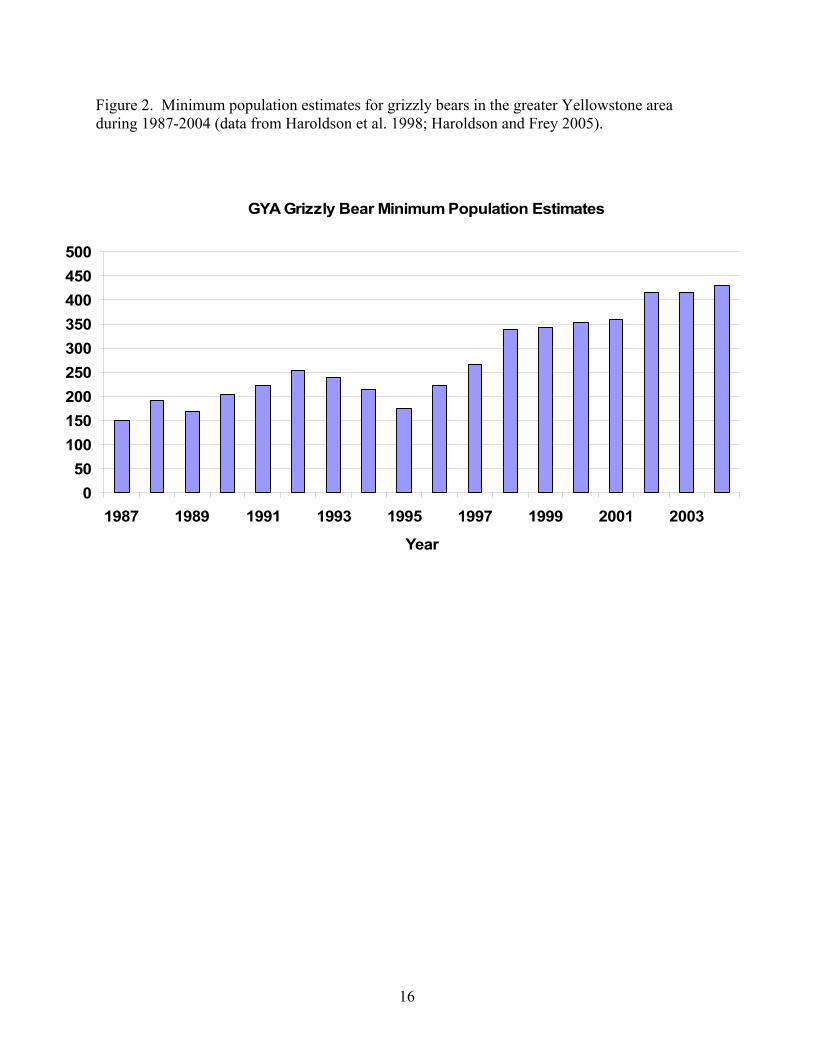
Figure 2. Minimum population estimates for grizzly bears in the greater Yellowstone area during 1987-2004 (data from Haroldson et al. 1998; Haroldson and Frey 2005).
GYA Grizzly Bear Minimum Population Estimates
050
100150200250300350400450500
1987 1989 1991 1993 1995 1997 1999 2001 2003
Year
16

Figure 3. Unduplicated sightings of female grizzly bears with cubs of the year in the greater Yellowstone area during 1987-2004 (data from Haroldson et al. 1998, Haroldson and Frey 2005).
GYA Grizzly Bear Unduplicated Female Sightings with Cubs of the Year
0
10
20
30
40
50
60
1987 1989 1991 1993 1995 1997 1999 2001 2003
Year
17

Figure 4. Wolf population estimates for the greater Yellowstone area during 1995-2004 (data from Smith et al. 2005, USFWS et al. 2005).
0
50
100
150
200
250
300
350
1995 1996 1997 1998 1999 2000 2001 2002 2003 2004
YEAR
WO
LVES
Northern RangeYellowstone National ParkGreater Yellowstone Area
18