multiproduct firms and outward foreign direct investment · 3 literature review: ... permitted by...
TRANSCRIPT

Multiproduct Firms and Outward Foreign Direct Investment
Salma KageeKGXSAL001
Supervisors: Lawrence Edwards and Asha Sundaram
Abstract
This paper investigates the relationship between internationalisation offirms and the firm’s domestic product scope. The investigation is appliedto Indian firms. Thus, the insights of a new dataset is added to thegrowing (but still infant) literature in this field. Indian firms that investabroad are the most productive firms in the home country. The mostproductive firms in the home country have the greatest scope of products.This paper shows that outward investor firms have the greatest range ofproducts in the home country. As a result of engaging in OFDI, theseoutward investor firms consolidate their product range and their productscope shrinks.
Univers
ity of
Cap
e Tow
n

The copyright of this thesis vests in the author. No quotation from it or information derived from it is to be published without full acknowledgement of the source. The thesis is to be used for private study or non-commercial research purposes only.
Published by the University of Cape Town (UCT) in terms of the non-exclusive license granted to UCT by the author.
Univers
ity of
Cap
e Tow
n

Contents
1 Introduction 2
2 Background 32.1 The Turning Point . . . . . . . . . . . . . . . . . . . . . . . . . . . . . . . . . . . 32.2 The Growth of Indian Multinationals . . . . . . . . . . . . . . . . . . . . . . . . . 4
3 Literature Review: Early Theories 53.1 Motives to Invest Abroad . . . . . . . . . . . . . . . . . . . . . . . . . . . . . . . 53.2 The Initial Framework . . . . . . . . . . . . . . . . . . . . . . . . . . . . . . . . . 6
4 Literature Review: The Simple Model 94.1 Monopolistic Competition . . . . . . . . . . . . . . . . . . . . . . . . . . . . . . . 104.2 The Proximity-Concentration Trade-off . . . . . . . . . . . . . . . . . . . . . . . 104.3 Firm Heterogeneity . . . . . . . . . . . . . . . . . . . . . . . . . . . . . . . . . . . 114.4 The Proximity-Concentration Trade-off with Heterogeneous Firms . . . . . . . . 124.5 The Multi-Product Firm . . . . . . . . . . . . . . . . . . . . . . . . . . . . . . . . 134.6 The Proximity-concentration Trade-off with Multi-product Firms . . . . . . . . . 154.7 Limitations of the Theory and Overlooked Mechanisms . . . . . . . . . . . . . . . 194.8 The Road from OFDI to Product Scope . . . . . . . . . . . . . . . . . . . . . . . 20
5 Data 215.1 OFDI Data Source . . . . . . . . . . . . . . . . . . . . . . . . . . . . . . . . . . . 215.2 Firm-Level Financial and Product Data . . . . . . . . . . . . . . . . . . . . . . . 225.3 Descriptive Statistics of OFDI Data . . . . . . . . . . . . . . . . . . . . . . . . . 235.4 Descriptive Statistics of Prowess Data . . . . . . . . . . . . . . . . . . . . . . . . 25
6 Empirical Evidence 306.1 Relative Productivity of Domestic Producers, Exporters and OFDI Firms . . . . 306.2 Unconditional Comparisons . . . . . . . . . . . . . . . . . . . . . . . . . . . . . . 336.3 Relative Product Range of Domestic Producers, Exporters and OFDI Firms . . . 346.4 Unconditional Comparison . . . . . . . . . . . . . . . . . . . . . . . . . . . . . . . 356.5 Conditional Comparisons . . . . . . . . . . . . . . . . . . . . . . . . . . . . . . . 366.6 The Relationship between Investment and Trade Receptiveness, and OFDI . . . 386.7 Investment and Trade Receptiveness and the Entry and Exit of OFDI Firms . . 416.8 FDI Receptiveness and Product Scope . . . . . . . . . . . . . . . . . . . . . . . . 42
7 Conclusion 44
8 References 45
1

1 Introduction
In “new” international trade, investigations into the reallocation of scarce resources are focusedon the inter-firm resource exchange that occurs between entering and exiting firms. Entry andexit occurs as a result of the productivity differences across these firms and symmetric changesin the fixed costs of doing business abroad. However, resource reallocations need not only occuracross firms, they can also occur within a firm.
The central question that this paper seeks to answer is what effect, if any, does an engage-ment in outward foreign direct investment (OFDI) have on the investing firm’s domestic productscope. The product scope of a firm is the number of products that the firm produces. In re-sponse to a shock, a firm can reallocate it’s own resources from unproductive product lines tomore productive product lines. Thus, the adding and dropping of products (product churning)within a firm is akin to the mechanism of the entering and exiting of firms in the market. Thispaper seeks to determine the relationship between these internal efficiency adjustments, namelyproduct churning, and the OFDI.
The study of the internal dynamics of resource reallocation is relatively new and, in the area ofinternational trade, the focus has been on the effects of a decrease in the fixed cost of exporting.However, in this paper, the focus is placed on overseas investments and the fixed cost of overseasinvestment. There are a variety of different avenues available to an internationalising firm bywhich it may access the foreign market. Thus, globalisation can affect the firm’s internal resourcereallocation through different avenues.
The internationalising firm can export its products abroad, it can locate its production facil-ity abroad and supply the foreign market from within the foreign market, or it can issue licensesto other firms in the foreign market to produce those products in the foreign market (Helpmanet al., 2004). In this work, the focus will be on the substitutability of OFDI and exports, or theproximity-concentration trade-off.
This paper studies the nexus of the theories of the proximity-concentration trade-off and productchurning with a focus on India, as a developing country. India experienced a rapid expansion inOFDI in a very short space of time, from the late 1990s to the present day (see figure 1). It isone of the largest sources of foreign direct investment (FDI) in the developing world (UNCTAD,2013). In addition, there is a rich pool of firm-level product and financial data on Indian firms.The analysis of the changes in product scope is done using a panel dataset, constructed forthis purpose by the author, that contains detailed firm-level data of Indian manufacturing firmsover the period 2005 to 2011 and firm-level overseas investment data over the period 2007 to 2011.
To analyse these firms, this paper will draw on theory of multi-product firms and productswitching developed by Bernard, Redding and Schott (2010, 2011) and on the theory of theproximity-concentration trade-off, which has a longer history. Using these strands of “new”trade theory, a story is developed about the expected relationship between OFDI and productscope. The story culminates with the theory developed by Stephen Yeaple (2013) that modelsthe relationship more precisely. This paper analyses the productivity implications of engagingin OFDI. The theoretical prediction in Yeaple’s (2013) model, and the expectation in this work,is that an increase in OFDI from a firm results in a decrease in the firm’s product scope.
The newly constructed dataset shows that firms that engage in OFDI are the firms that have
2

the highest total factor productivity (TFP). Furthermore, the firms that produce the greatestnumber of products are the firms with the highest TFP. A decrease in the fixed costs of OFDIfaced by a firm is related to a decrease in the number of products produced by the firm.
The rest of the paper is laid out as follows. Section 2 describes the evolution of Indian OFDIand how this makes it uniquely placed in answering the central question of this paper. Section3 looks back at some of the early literature on the motives of OFDI and applies it to the caseof India. Section 4 uses “new” trade theory in both the areas of OFDI and product scope tocreate a coherent picture of the types of firms that engage in OFDI, their expected product scoperelative to others, the expected changes in product scope in response to OFDI and changes inthe OFDI of these firms. Section 5 describes the data in more detail. Section 6 explains theestimation procedure, and reports and discusses the findings that have been found to supportthe testable hypotheses of section 4. Section 7 concludes.
2 Background
2.1 The Turning Point
Prior to the mid-1990s, there had been little to no incidence of OFDI from India. Indian firmsinvested around US$32million, US$87million and US$152million in the 1960s, 1970s and 1980srespectively (Khan, 2012). However, it is clear from figure 1, which illustrates the volume ofOFDI from India over time, that the late 1990s marked a turning point for Indian OFDI. Theinvestment that has occurred since the 1990s dwarfs that of the earlier periods. In the 2010-2011period alone, the value of OFDI reached US$16843.37million, which is more than sixty times thetotal OFDI during the entire period 1960-1989.
Figure 1: Foreign Direct Investment Outflow (in US$millions) from IndiaSource: UNCTAD (2013) FDI Database
The first stirrings of Indian multinational overseas activity can be traced back to the early 1960s.
3

Young versions of the now large conglomerates like the Tata Group and the Birla Group werethe first outward investors (Sauvant et al., 2010). The OFDI in the decades prior to 1990 mostlyoriginated from the manufacturing sector and the recipient nations were predominantly otherdeveloping countries, particularly Sri Lanka and countries in Africa. These initial investmentswere motivated by a need to escape a restrictive growth environment in India (Sauvant et al.,2010).
The post-1990 wave of OFDI is dominated by the manufacturing and service sectors and therecipients have, for the most part, been primarily developed economies (Khan, 2012). Indiaundertook widespread policy reforms during the 1990s. India’s industrial licensing system (Li-cense Raj), which required the approval of sometimes up to 80 different government agenciesand restricted investment both domestically and internationally, was systematically dismantledfrom 1991 (Khan, 2012). This formed part of the International Monetary Fund (IMF) bailoutagreement, which included trade reforms, privatisation and increased competition (Sauvant etal., 2010).
The Foreign Exchange Regulation Act (FERA), which prohibited all transactions except thosepermitted by the Reserve Bank of India (RBI), was only repealed in 1998, but it had been loos-ened slightly in 1992 to comply with imposed reforms. The RBI allowed for automatic approvalof investments less than a specified cutoff point (see table 1). The cut off restriction was gradu-ally relaxed over time (see table 1).
Table 1: Cut offs for automatic approval of investments (Khan, 2012)
Date Cut off1992 US$2million1995 US$15million2001 US$50million2003 US$100million2004 100% of net worth2005 200% of net worth2007, June 300% of net worth2007, September 400% of net worth
An explanation of the explosion in OFDI and the pressure to loosen OFDI policy lies with thefirm internationalisation decision and the political and economic environment of India at thetime. This evolving environment and the resultant multinational firms that developed within it,will be discussed in section 2.2.
2.2 The Growth of Indian Multinationals
The early 1990s was a turbulent time for the Indian economy. The protectionist License Rajfacilitated the development of large family-owned corporations. However, the overly bureaucraticenvironment became too stifling for growth prospects to remain robust (Sauvant et al, 2010).Early OFDI by these large corporations was partially motivated by the need to escape the re-strictive legislation (Khan, 2012).
Until 1990, India had a fixed exchange regime; the Rupee was pegged to a basket of curren-cies (Dua et al, 2010). Following the rising oil price in the wake of the Gulf war, the fiscal
4

and trade deficit expanded. Investor confidence slumped after the sequential assassinations oftwo prime ministers (McCartney, 2010). IThe Rupee rapidly depreciated and India’s foreignexchange reserves plummeted. By July 1991, India only had enough exchange reserves to financethree weeks worth of imports (McCartney, 2010).
The interim Indian government secured a bailout from the IMF using India’s gold reserves ascollateral. This helped carry the country through the crisis (McCartney, 2010). The swearingin of the new Prime Minister, Narasimha Rao, and appointment of the new finance minister,Manmohan Singh, catalysed extensive policy reforms by the new conservative government aspart of the IMF loan agreement (McCartney, 2010).
These significant reforms created a more favourable environment for global expansion. Thelarge corporations that had once benefitted from a restrictive environment were now able to ben-efit from a more open policy environment by leveraging off their size and market share in India toexpand their market share abroad (Khan, 2012). Furthermore, smaller corporations were givenmore room to expand in the new policy regime. However, international transactions continuedto be dominated by the larger corporations producing multiple products on the internationalmarket place (Sauvant et al., 2010).
The increasing importance of Indian multinationals in the international market makes thema very interesting case for evaluating the impact of outward investment on firm product scope.It may seem that standard theory cannot explain the unique transformation of Indian outwarddirect investment. However, the standard assumption in economics underlying a firm’s decision-making is profit maximisation. Thus, this paper assumes that the impetus behind the decisionto invest abroad is an internal decision by the firm to enhance profit potential. The profit motivecan operate through different avenues: revenue boosting, cost reducing, or efficiency improving.The following section will review the early literature on the multinational corporation, whichbest describes the internal strategic decision-making of the internationalising firm.
3 Literature Review: Early Theories
3.1 Motives to Invest Abroad
The corporate strategy literature was the first to deal with the internationalising activity of firmsthrough cross-border investments. The literature highlights four broad motives to invest abroad:the resource-seeking motive, the market-seeking motive, the efficiency-seeking motive, and thestrategic asset-seeking motive (Behrman, 1972; Dunning et al., 2008). These motives arise wheninvesting abroad becomes a more attractive option that outsourcing, importing, and exporting.
Following Dunning and Lundan (2008), the resource seeking motive arises from the possibil-ity of obtaining “particular and specific resources” that the firm is either incapable of obtainingat home or can obtain at a lower real cost in a different country. These resources can either benatural resources, or unskilled and skilled labour (Franco et al., 2010).
Market-seeking OFDI is the establishment of a production facility in a foreign market eitherto supply that market or some other market that is more easily accessible from the OFDI des-tination. There are two factors that could possibly lead to this kind of investment. First, thegoods or services are difficult to trade from the home country. Second, there could be a lack ofadequate patent protection in the home country. This produces a trade-off between exports and
5

OFDI.
The third motive, efficiency seeking, optimises profit by taking advantage of the differencesin product and factor prices in different countries; either because it is cheaper, or to diversifyrisk. Diversification that spreads risk and arbitrages on factor prices is known as global sourcing.If the strategic assets of the investing firm are significant and the investment is motivated by theabove three motives, then the preferred method of engaging in OFDI would be through green-field investments. A greenfield investment is the creation of a subsidiary from scratch instead ofbuying an existing firm in the country. The latter is classified as a merger and acquisition (M&A).
Strategic asset-seeking OFDI targets non-marketable assets that cannot be acquired throughnormal market transactions. They can only be used inside the foreign country. A firm willtypically acquire these assets by taking over an existing firm (M&A) or by acquiring that firm’sassets. Either they are composed of agglomeration economies or the asset being sought out couldbe a sticky resource that is a characteristic of a specific firm (e.g. organisation principles). Tocapitalise on the sticky resource, these are usually joint ventures.
Section 3.2 outlines the framework proposed by Dunning (1980) and the later augmentationby the same author (Dunning et al., 1981), both of which attempt to explain OFDI in termsof these motives. An alternative suggestion, the latecomer theory (Matthews, 2006), is alsoexplained in terms of these motives, but within the context of a developing country.
3.2 The Initial Framework
In 1980, Dunning developed the eclectic paradigm or ownership-location-internalization (OLI)framework from the corporate strategy literature. To engage in OFDI, three conditions haveto be met. First, the firm must have a strong ownership advantage. The firm must have somecompetitive advantage over other firms in the same industry. Some (Helpman et al., 2004) preferto refer to this as an index for firm productivity.
Secondly, the recipient country must have stronger location advantages than the home coun-try. Thus, the firm must find it profitable to locate the production process there rather thanat home. In terms of the motives, there must be an attractor for that location. These mayinclude untapped markets, resources, lower factor prices, attractor firms ripe for a buyout, or acombination of all of these attractors.
Thirdly, the firm must have a strong internalization advantage. High trade costs or high costsof enforcing contracts could incentivise the firm to produce the goods themselves, rather thanexporting, or licensing the rights to produce to another firm already located in the host country.
This framework cannot explain why some of the firms from developing countries do invest abroad,but do not possess ownership advantages. The model treats country-specific anomalies as exoge-nous and considers only the investment decision of the firm in isolation. It fails to acknowledgethat the firm’s investment decision could be intimately related to the home country environment1.
Dunning recognised these shortcomings. Hence, he postulated that the country-specific anoma-lies were not country-specific per se, but development-specific. Thus, the investment development
1“Environment” encompasses the institutional environment including, but not limited to, capital markets,regulation and industrial structure
6

path (IDP) theory was proposed as an alternative to the OLI framework. IDP incorporated thecountry’s stage of development into the conventional OLI framework. Thus, the firm’s invest-ment decision adjusts depending on the country’s stage of development.
There were five stages of development classified by Dunning (1981). They are classified ac-cording to the balance and volume of inward and outward investment. The first is described asthe plight of most of the least developed countries. In these countries there will be little to noinvestment, neither inward nor outward. The little investment that does take place is inwardforeign direct investment (IFDI) and is used mainly to exploit resource advantages. At this stage,the role of government is merely to provide basic infrastructure and to improve human capitalthrough education.
A country in the second stage of development sees rising inward investment, but still insignificantoutward investment. At this stage, the normal form of government intervention is to developdomestic industries through trade barriers and subsidies. The location advantages of the homecountry are more apparent in the second stage than the first. This attracts investment fromabroad. There are four consequences of the intervention. The ownership advantages in the homecountry improves, the government intervention raises the internalisation advantages of the do-mestic firms, development improves, and outward investment emerges, rising at the same rate asinward investment.
The third stage of development is characterised by a fall in the growth of inward investment.The domestic firms have stronger ownership advantages. The international exposure of domesticfirms through second stage outward investment leads to strategic asset upgrading in the domes-tic firms. There is likely to be a strong surge in outward investment due to the new ownershipadvantages. The volume of outward investment converges on that of inward investment. Anygovernment intervention at this stage is micro managing at a sector level. This promotes inwardinvestment in sectors where there are little domestic ownership advantages and promotes out-ward investment where there are few domestic location advantages.
The fourth stage is characterised by outward investment outstripping inward investment in termsof stock and growth. Created assets are now, almost exclusively, the source of any location ad-vantages of the domestic economy. The ownership advantages are more likely to be related tominimising transaction costs than on the internal public goods (intangible assets). The roleof government becomes that of a facilitator, improving the efficiency of markets and removingdistortions.
At the fifth stage of development, the dominance of OFDI or IFDI fluctuates but the volume ofboth will increase. The internalisation advantages of multinationals become more pronounced asfirms become more efficient; organizational costs fall below market transaction costs. As own-ership advantages are augmented by firm efficiency, they become more dependent on efficientexploitation of strategic assets.
To arbitrage against the different location advantages, multinationals relocate different func-tions. Thus, their behaviour is reminiscent of “mini-markets”. Due to the location advantagesof highly developed economies and other five-stagers who are engaging in similar arbitrage in-vestment, IFDI rises in countries in the lower stages of development.
The IDP goes some way to explaining how in development stage two firms lacking significant
7

ownership advantages can engage in OFDI if government provides incentives for internalisation.Both the eclectic paradigm and the IDP predict a gradual rise in OFDI in India. However,neither theory can explain the rapid rate of OFDI growth in India.
The latecomer theory (Matthew, 2006) addresses this shortcoming. The theory suggests thata new breed of multinational has emerged. They are more capable of exploiting the myriadopportunities offered by globalisation. The lack of ownership advantages that would ordinarilyconstrain OFDI in the earlier stages of development is overcome through the acquisition of com-plementary assets.
Complementary assets are defined as those assets necessary to exploit the knowledge generatedby innovation. Firms obtain these assets by developing relationships with established multi-nationals in a combination of three ways: by setting up a joint venture (JV), by becoming asupplier to them, or buying complementary assets on the open market. These opportunitieswere not accessible to the early multinationals.
In addition to complementary assets, the latecomer theory suggests that the new breed of multi-national is not constrained by the traditional organisational structures of Western multinationals(Matthew, 2006). They can innovate. These innovations are called linkage, leverage and learn-ing (Matthew, 2006). The latecomer firm obtains strategic assets through alliances and jointventures (linkage) and are able to efficiently diffuse these assets internally (leverage) and buildupon them to create new advantages (learning). This asset augmenting capability, coupled witha low cost base, has allowed the latecomer firm to expand its capabilities at a much lower costand faster rate than the early multinationals were capable of. Thus, the internationalisation ofthese firms could occur faster.
Some argue that the differences among developing country MNEs themselves may be more signif-icant than the difference between developing and developed country MNEs. If so, generalizationsabout developing countries would be a mistake. The reason for this is that the national institu-tional structure of the home country has a significant impact on corporate strategy.
It is tempting to fall into the trap of weaving ever more specialised and complex ideas aboutcorporate strategy to explain the phenomenon of OFDI. However, while this literature is usefulin describing the characteristics of investing firms they are either too simple to explain the Indiancase, or they are too descriptive to be useful in a research framework.
The primary motive of a firm is the profit motive. The overarching motive of foreign directinvestment is to maximise future expected profits. Future expected profits are affected by vari-ous different factors in terms of how they impact a firm’s cost and future revenue streams. Thus,when the aim of OFDI is market seeking, the firm is attempting to expand future revenue streams.
The ownership and internalization features of the IDP framework are easily connected to conven-tional economic theory in terms of lowering transaction costs and scale economies. The locationfeature does link into factor price arbitrage and the expansion of the available resources. However,the framework does not explain why some firms invest abroad and others do not in a coherentmodel. Furthermore, there is no recourse in this literature for the incorporation of a multiprod-uct firm, except in a purely descriptive manner. The corporate strategy insights outlined in thissection will not be tested in this paper. The limitation of the framework in providing testablehypotheses is addressed by applying the “micro-foundations” of “new” trade theory to the ideas
8
of corporate strategy. The “new” trade theory contributions are outlined and elaborated on inthe next section.
4 Literature Review: The Simple Model
The aim of this paper is to investigate the product turnover behaviour of Indian firms that engagein outward foreign direct investment (OFDI). The model that would ideally be used is one thatis able to predict the relationship between engaging in OFDI and the product scope of a firm.There are models that describe the decision-making process of a firm when it comes to choosingbetween exports and OFDI (also known as the proximity-concentration trade-off). Furthermore,there are models that describe the implications of engaging in exports for the firm’s product mix.
In the proximity-concentration trade-off theory and the theory of multiproduct firm productchurning, both areas of “new” trade theory; the focus has mainly been leveled at developedcountries. There are a few exceptions in the area of multiproduct firm product churning. TheArkolakis and Muendler study (2011) investigates the changes in the product scope of Brazilianfirms. Ma, Tang, and Zhang (2014) investigated product churning in Chinese firms that haveengaged in exports. They compare them to firms in countries that do not export, but havesimilar characteristics. Considering OFDI as a substitute to exports, Bhattacharya, Patnaik andShah (2012) have studied chemical and software industries in India. Foster-McGregor, Isakssonand Kaulich (2013) analysed sub-Saharan African firms in the manufacturing and services sectors.
The proximity-concentration trade-off predicts that only the most productive firms can engagein OFDI (Helpman, 2004). The multi-product firm and product switching literature predictsthat the most productive firms have the broadest product scope (Bernard et al, 2010). Fur-thermore, the literature predicts that a positive productivity shock in a firm (specifically due totrade liberalization in the existing literature) results in a decrease in the product scope of thefirm (Bernard et al., 2011).
This section navigates a short route from the proximity-concentration trade-off models to themultiproduct firm models. The existing product scope models implicitly make the assumptionthat the decision between export and OFDI has already been made and that the decision was“export”. It is possible to track the impact of OFDI on product scope by altering this initialdecision and carrying through the implications from one model to the next. The combination ofthese types of models allows firms to produce multiple products in multiple locations for multiplemarkets (Yeaple, 2013).
New theories of OFDI incorporate the later advances of trade theory into the traditional modelsof corporate strategy. They include ideas such as imperfect competition and firm heterogeneity.The latter is first done implicitly (Brainard, 1997). Later, in Helpman, Melitz and Yeaple (2004),these ideas are incorporated explicitly in terms of productivity in the tradition of Melitz (2003).Finally, the theory developed by Yeaple (2013) includes the multi-product element to the theoriesof OFDI. The limitation of these models is that they are unable to account for all the motivesof OFDI.
When there is an exogenous trade liberalisation shock, firm heterogeneity causes a realloca-tion of resources from the low productivity firms to the high productivity firms. This increasesthe efficiency of the factors of production. However, this is not the only reallocation that can
9

occur. There can also be an intra-firm reallocation of resources, from low productivity productsto high productivity products. Firms can drop low productivity products in favour of high pro-ductivity products.
In this study, the motive to export is linked back to the strategic decision between OFDI andexports in the proximity-concentration trade-off. The decision between the two methods of ac-cessing the foreign market will be different across different products, differing according to theability of each to generate profits. Any change in exports or investment will affect this decisionacross products and the reallocation of resources across these products, thereby determiningwhich products get dropped or added. The question that this paper answers is how a change ininternational investment affects this product churning. The theory of monopolistic competitionis the basis of the models used.
4.1 Monopolistic Competition
The new trade theory builds on a monopolistic competition framework with product differen-tiation. It illustrates the internalization advantage for firms due to increasing returns to scale(Brainard, 1997). Krugman (1983) highlighted the necessity of imperfect competition in modelsof OFDI as a crucial aspect of the multinational firm.
There are three basic features of new trade theory. The consumer problem incorporates a tastefor many differentiated products, there is a fixed component of total production costs and thusdeclining average costs, and the structure of the market is characterised by monopolistic com-petition with firms setting marginal revenue to equal marginal costs and free entry resulting inzero profits (Krugman, 1979). The firms are identical and only differ implicitly in the productthat they produce.
To characterise these firms as multinationals, Krugman (1979) redefined the fixed productioncost as a headquarter service cost. Thus, expanding production abroad results in a decline inaverage costs in the same way that expanding production at home would. The impetus in thismodel, for expanding abroad instead of intensifying home production and exporting instead,would be to exploit differences in production costs (Krugman, 1979).
The location advantage, in this model, stems from differences in factor costs in the destina-tion country. Thus, it would not predict a situation where there are high volumes of both IFDIand OFDI in a specific country. This makes it a poor model for the Indian situation, which wasdescribed in the World Investment Report of 2013 to be the “dominant recipient of FDI inflowsto South Asia in 2012” and the “region’s largest FDI source.” The next section describes a modeldeveloped by Brainard (1997) that is not dependent on factor price differentials as a motive forOFDI, yet still incorporates the advantages of the monopolistic competition model.
4.2 The Proximity-Concentration Trade-off
The Brainard (1997) model differs from the earlier model by explicitly introducing a trade-offbetween economies of scale advantages and proximity advantages. The internationally competi-tive firm has multiple options for gaining access to foreign markets. The export option has theadvantage of concentrating production in one plant, resulting in scale economies. The horizontalFDI option has the advantage of gaining proximity to the foreign market by setting up a produc-tion facility in that market. The trade-off occurs because concentration is lost once production
10

is spread over multiple production facilities and close proximity is lost when production is con-centrated in the home facility.
Following Krugman (1983), scale economies at the headquarter level would not be lost in spread-ing production facilities abroad. Thus, if scale economies are larger at the headquarter levelrelative to facility level, then proximity may be favoured over concentration. The trade-off be-tween horizontal overseas investments versus exports will now arise due to variable transportationcosts and tariff barriers (Brainard, 1997). If these costs are prohibitive, then producing abroadmay be cheaper. However, locating the production process abroad will also incur the fixed costof opening the additional plant. Thus, by gaining proximity to the end consumer, trade costsare eliminated, but by exporting instead of gaining proximity, the fixed costs are eliminated.When the benefit of eliminating transportation costs (by incurring the fixed cost of opening afully functional affiliate abroad) is greater than zero (Helpman et al, 2004), then the firm willchoose to invest abroad.
The imposition of a restriction on outward investment distorts the trade-off. The distortioncan be modeled as an additional fixed cost to investing abroad. Since it inflates the cost ofproximity, a policy environment that is unfriendly towards outward investment would bias thetrade-off in favour of concentration. A loosening of these restrictions would increase the attrac-tiveness of proximity and the outward investment to export ratio of the country should rise. Thisexplains Indian outward investment growth. A reduction in trade barriers would increase theattractiveness of concentration; and a rise in trade barriers would favour proximity.
The Brainard (1997) model assumes that the firms are symmetric in their response to theproximity-concentration trade-off. Like the traditional models of monopolistic competition onwhich it is based, the firm heterogeneity is implied but not explicitly incorporated into the theory.However, a major stylised fact apparent from analyzing the data is that firms differ in terms ofsize and productivity (Melitz, 2003).
4.3 Firm Heterogeneity
The incorporation of firm heterogeneity in new trade models was a necessary consequence of theinability of the gravity-style models to account for the differences between firms that do exportand firms that do not export. First, it was shown that exporters are not only different fromnon-exporters, but they are also very special. The most noteworthy aspect of their uniquenessis the fact that they are more productive on average than non-exporters (Bernard et al, 2003).Secondly, subsequent to a trade liberalization shock, the least productive firms will exit the mar-ket, which increases the overall productivity of the industry (Bernard et al, 1999; Pavcnik, 2002).Similarly, OFDI firms are different from non-OFDI firms in terms of productivity (Helpman etal., 2004). Thus, it is necessary to incorporate firm heterogeneity into the analysis.
Melitz (2003) developed a trade framework incorporating monopolistic competition and increas-ing returns with heterogenous firms. The firms are heterogenous with respect to their marginalproductivity of labour, which will hereupon be referred to as productivity. The productivity ofthe firm is not observed by the firm prior to entry and is drawn randomly from a distributionupon entry. Differences in productivity create a profitability hierarchy in the economy, wherethe most productive firms are the most profitable. There are two cost components added to themodel: variable trade costs (transportation and tariff costs) and a fixed cost component (Melitz,2003).
11
There is a fixed cost for all markets. The fixed cost has to be paid for domestic productionand, once trade liberalisation occurs, to enter a foreign market through exports. There is a prof-itability requirement in production, which divides the industry by productivity into those thatcan cover the fixed cost of production with their expected future profits and those that cannotdue to an insufficient level of productivity (who subsequently exit). The domestic industry isfurther divided along productivity lines into those that can cover the additional fixed cost ofexporting with their expected future profits and those that cannot due to having a lower levelof productivity than the absolute minimum required to cover the cost. The latter firms will stillproduce for the domestic market only. The former produce for the domestic market and servicethe international market through exports.
Introducing this heterogeneity to the proximity-concentration trade-off models allows the choicebetween exports and OFDI to differ across firms operating in the same industry (Greenawayet al, 2007). The productivity draw upon entry determines the profitability hierarchy in theindustry, which establishes the difference in the choice between the exports and OFDI.
4.4 The Proximity-Concentration Trade-off with Heterogeneous Firms
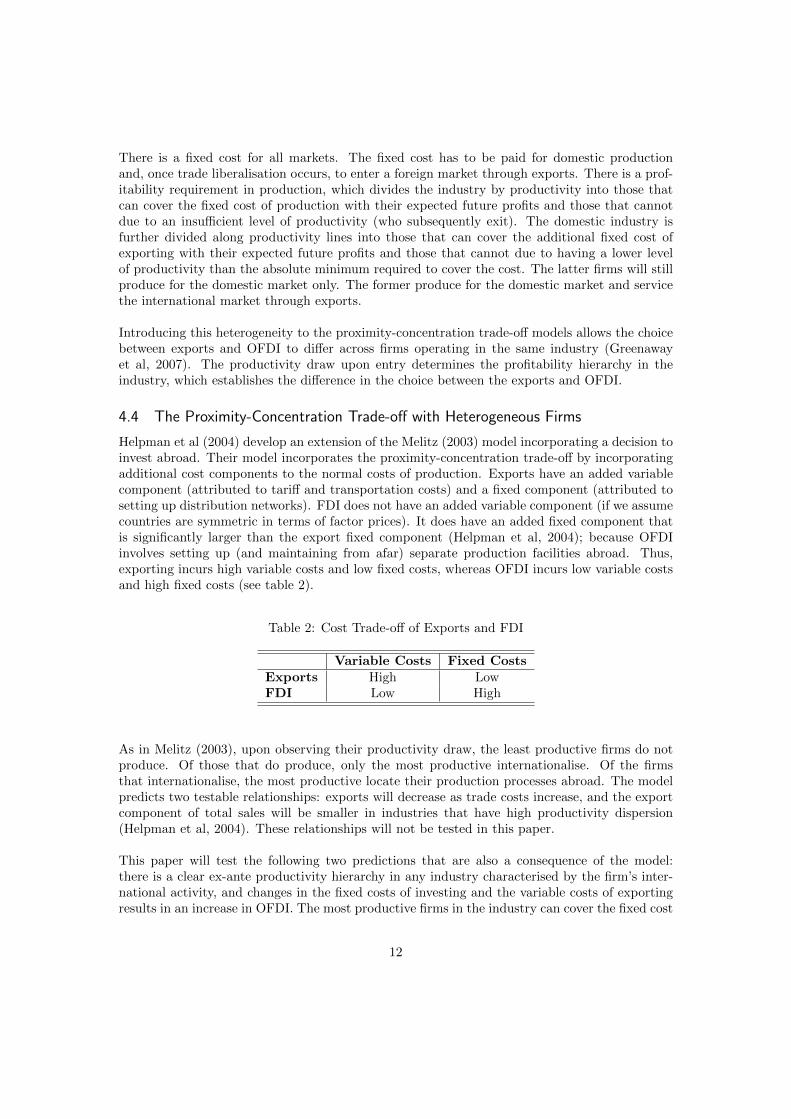
Helpman et al (2004) develop an extension of the Melitz (2003) model incorporating a decision toinvest abroad. Their model incorporates the proximity-concentration trade-off by incorporatingadditional cost components to the normal costs of production. Exports have an added variablecomponent (attributed to tariff and transportation costs) and a fixed component (attributed tosetting up distribution networks). FDI does not have an added variable component (if we assumecountries are symmetric in terms of factor prices). It does have an added fixed component thatis significantly larger than the export fixed component (Helpman et al, 2004); because OFDIinvolves setting up (and maintaining from afar) separate production facilities abroad. Thus,exporting incurs high variable costs and low fixed costs, whereas OFDI incurs low variable costsand high fixed costs (see table 2).
Table 2: Cost Trade-off of Exports and FDI
Variable Costs Fixed CostsExports High LowFDI Low High
As in Melitz (2003), upon observing their productivity draw, the least productive firms do notproduce. Of those that do produce, only the most productive internationalise. Of the firmsthat internationalise, the most productive locate their production processes abroad. The modelpredicts two testable relationships: exports will decrease as trade costs increase, and the exportcomponent of total sales will be smaller in industries that have high productivity dispersion(Helpman et al, 2004). These relationships will not be tested in this paper.
This paper will test the following two predictions that are also a consequence of the model:there is a clear ex-ante productivity hierarchy in any industry characterised by the firm’s inter-national activity, and changes in the fixed costs of investing and the variable costs of exportingresults in an increase in OFDI. The most productive firms in the industry can cover the fixed cost
12

associated with maintaining multiple plants at home and abroad. Therefore, they can engage inOFDI and produce for the domestic market. The firms that are not productive enough to investabroad (but still highly productive) can export and produce for the domestic market. The firmsthat are not productive enough to service the market abroad through either OFDI or exports,but are still productive enough to make non-negative profits by producing can only service thedomestic market. The rest of the firms do not produce.
The productivity hierarchy is based on the assumption that exports and OFDI are substitutes.Thus, the most realistic scenario for observing this phenomenon is in the context of horizontalOFDI. A fall in the fixed cost of investing abroad is expected to cause a fall in the firm’s exportsand a rise in the firm’s outward investment. Similarly, a rise in the variable cost of exporting isexpected to have the same effect.
This model assumes that the market-seeking motive is the only motive for OFDI. The model isonly useful in explaining the market seeking outflows. So, it may not be useful if outflows arepredominantly attributed to the other motives. A concern may be that investments in the pri-mary sector are predominantly resource seeking. It is expected that investment into the primarysector may contradict the conclusions of this model. The model is, therefore, not a comprehen-sive explanation of OFDI.
Another shortcoming of this model is that it operates in the single-product firm context andit is only in this context that exports and OFDI are substitutes. In reality, most OFDI firms alsoexport. There needs to be some measure of complementarity in the model to induce a positivecorrelation between exports and OFDI within firms. A model of firms with multiple productlines does this.
The assumption of complementarity is not the only way to induce a positive correlation be-tween aggregate firm exports and aggregate firm outward investment. Substitution can stillbe assumed in the case of multiple product lines, because the substitution could be occurringwithin product lines only. The choice between proximity and concentration is determined atthe product level. A particular product line is not produced abroad and produced at home forexport, therefore allowing the assumption that the two international activities are substitutes tohold. Thus, the correlation between OFDI and exports is a spurious relationship caused by theproductivity draw and lack of cross-line substitution. Some product lines are produced at homefor export and some product lines are produced abroad. Therefore, firms can both export andinvest abroad. Multiple product lines are necessary in explaining certain empirical anomalies(Baldwin et al., 2001; Greenaway et al., 2007; Yeaple, 2013) irrespective of the assumption ofcomplementarity.
4.5 The Multi-Product Firm
There are two main reasons for the necessity of including multiple product lines in the model.The first is the potential explanatory value that multiple product lines have for the lack of evi-dence for substitution between OFDI and export volumes. The second is to determine whetherthe intra-firm reallocation of resources occurs in response to shocks. In a single product world,the reallocation of resources occurs across firms in the form of entry and exit according to pro-ductivity. In a multi-product world, the reallocation can also occur within a firm across productlines (depending on how productive the firm is at producing each of those product lines). Thisimplies that the incidence of export and OFDI can vary across products.
13

The idea of the multi-product firm is not unreasonable (particularly in an international tradeframework where cross-border economic activity is predominantly undertaken by multi-productfirms in various destinations). The inclusion of the multiproduct firm to explain the lack ofempirical substitutability between exports and OFDI has mostly occurred on an empirical levelin the literature. It has only recently been formalised by Yeaple (2013). Intra-firm reallocationof resources has been studied extensively in models for international trade.
Bernard, Redding, and Schott (2010) developed a model of endogenous product selection. Firmsare heterogenous in terms of productivity. The firms observe their productivity draw upon entry,which determines firm capability across all products. The firm observes its relative capabilitiesin producing each specific product (Bernard et al, 2010). It decides the range of products toproduce and which of those products to export. The firm incurs a fixed cost to produce; the firmincurs a fixed cost to export. Each product also has a fixed cost of production and a fixed costfor exporting. Both are common across all products.
In the steady state industrial equilibrium, there is, for each product at each level of productivity,a cutoff product capability value for domestic production and for export. The profitability of allproduct lines is improved with an across the board productivity premium. Therefore, the modelconcludes that the most productive firms are capable of sustaining the largest set of products.The fixed costs associated with maintaining multiple product lines can be covered (Bernard etal, 2010). Thus, their cutoff capability thresholds for each product production and export arelower for all product lines.
There are also firm-level cutoffs for becoming a producer and/or an exporter. The firm’s pro-ductivity draw determines whether it can produce enough variable profits to cover the fixed costof entry in the production market and the export market. Therefore, the productivity drawdetermines whether the firm can produce and whether it can export.
An exogenous drop in trade costs in the standard Melitz model would result in an industry-widereallocation. The cutoff productivity would rise, so that resources could be funneled towards theirmost productive use. Low productivity firms would exit of the market. In the multi-productaugmentation, the reallocation would occur both across and within firms. The zero-profit cutofffor firm productivity and the zero-profit product capability (for each level of productivity) cutoffswould both rise. The least productive firms exit. Surviving firms reallocate their resources to-wards products that they are more capable of producing and drop marginal products. Thus, theproduct scope of surviving firms shrinks and they experience an internal increase in productivity.
Only the most productive products of an exporting firm will be exported. In the scenario ofan exogenous shock resulting in a fall in trade barriers (which is investigated in the study byBernard et al, 2010), the product scope of all firms (both exporters and non-exporters) woulddiminish. Furthermore, this narrowed focus on core products is expected to improve productivityof the firms and improve the overall productivity of the industry as a whole.
The following subsection will link the existing bits of literature and outline the model developedby Yeaple (2013). The nexus of the two strands of heterogenous firm international behaviouris the role of firm productivity. It is indelibly connected with the firm’s internationalisationdecision and with the choice of the firm product scope.
14
4.6 The Proximity-concentration Trade-off with Multi-product Firms
The baseline implication of the models is that firms that are capable of investing abroad shouldbe producing the greatest range of products, because they are the most productive firms in thehome country. Firms that are capable of exporting, but not investing abroad, will have a smallerrange of products than those firms capable of outward investment. Firms that can only producefor the domestic market will have the smallest range of products. The product ranges of succes-sive types of firms will follow the productivity hierarchy of investment.
According to both models, a reduction in variable trade costs would result in an inter-firmand intra-firm reallocation of resources. The least productive firms exit. Surviving firms dropmarginal products to focus on their core capabilities. The most productive firms export theproducts in line with their core capabilities. The firms that are capable of investing abroad stillproduce the greatest variety of products. They export the greatest variety of products. Thus,the hierarchy is expected to persist.
The resources and factor inputs can be purchased in the recipient market, so a reduction inthe cost of investment would not necessarily require a reallocation of resources. Firms thatinvest abroad are not constrained by domestic resource limits. Thus, it is not clear from the ex-isting models whether an internal reallocation would occur. However, a reduction in investmentcosts imply that more firms are capable of investing abroad and this will be done with their mostproductive products. Furthermore, firms that already invest are capable of investing more thanbefore and to relocate the production processes of more products abroad.
To invest abroad, the firms have to be generating sufficient variable profits to cover the highfixed cost of investing. Only the most productive firms can make this investment. Thereafter,the variable profits of those products produced abroad should increase as the variable tradecosts are eliminated. The variable profits of the outward investing firm should increase post-investment. This improves their ability to cover the fixed costs of producing, exporting, andinvesting abroad for each product line. The increase in variable profits implies that the firmis capable of sustaining a broader product scope after engaging in OFDI. However, the largervariable profits also implies that the firm is capable of relocating the production processes ofmore product lines abroad, implying a reduction in the domestic product scope of the firm.
The impact of investment is similar to a productivity shock in domestic production, whether fordomestic consumption or export purposes. An internal productivity shock reallocates resourceswithin the firm and across all the firms based in the home economy. The least productive firmsexit. The most productive firms drop their marginal products to focus on their core competen-cies in order to compete with the increased productivity of the outward investors. The outwardinvestors undergo the same internal reallocation to compete with each other. They drop theirmarginal products and focus on their core competencies in home production.
The Yeaple (2013) model is a slight simplification of the Bernard et al. (2011) model to in-corporate the ability to produce in multiple locations. Yeaple reduces multiple locations to twoidentical countries. In the two locations framework, the normal production inputs - capital,labour and raw materials - are no longer constrained to that which the home country can pro-vide. To incorporate the opportunity cost of producing a certain set of products (rather thanan alternative set of products or a larger set of products) Yeaple introduces a scarce internalresource: organisational capital.
15

Like the Bernard et al. model (2010), there is a continuous set of products available in eachcountry, Ωj , each produced by an industry, normalised to the interval [0, 1]. Within each in-dustry, there is a continuum of horizontally differentiated varieties (Bernard et al., 2011). Theelasticity of substitution across varieties (σ) is constant and greater than one; it is assumed tobe the same for all goods. The sub utility function developed by Yeaple (2013) describes thepreferences across varieties within each industry and is of the Dixit-Stiglitz (1977) form.
Q(i) =
[∫ω∈Ωi
q(ω)σσ−1 dω
]σ−1σ
, 0 < σσ−1 < 1 (1)
A representative consumer in each country (since the two countries are identical) has a Cobb-Douglas utility function over all the products.
U =
∫ 1
0
lnC(i)di (2)
Yeaple (2013) assumes there is a continuum of identical potential entrepreneurs, which is analo-gous to the Bernard et al. (2011) assumption of unbounded identical potential firms. There is afixed cost of entry, ubiquitous to all Melitz-type models, equal to fE > 0 units of labour. Uponentering the market, the firm obtains a blueprint for a specific variety of all the products, anendowment of organisational capital, and a cost of employing the organisational capital abroad.Each of these characteristics is drawn from ex-ante known distributions. The blueprint of firm-specific varieties for each product indirectly indicates the firm’s productivity draw (Z) from thedistribution G(Z) = 1− Z−κ, where κ > 1.
The endowment of organisational capital, K, and the cost of employing the organisational capitalabroad, λ ∈ [1, λ] are drawn from the bivariate distribution H with a density function h (Yeaple,2013). The productivity of the particular plant (φ) is dependent on the amount of organisationalcapital allocated to that plant by the firm (kj(Z)), as well as the firm productivity draw (Z)implied by the variety blueprint. The allocated organisational capital is exponentiated by theproduct level degree of control of organisational capital (Yeaple, 2013).
ϕ(kj(Z), Z) = Z · kj(Z)θ, θ ∈(
0, 1σ−1
)(3)
The constraint on the number of different products produced is dependent on the endowment oforganisational capital and on the firm’s allocation choice.
K ≥∫ ∞
0
∑j
λjkj(Z)dG(Z), λj =
λ if j is foreign,
1 if j is domestic.(4)
Once it has incurred the fixed cost of entry, the firm observes product variety blueprint, the en-dowment of organisational capital, and the cost of employing the organisational capital abroad.Then it decides where to produce each product for each market. Home production incurs afixed cost, F , per product. The decision to export to the foreign country incurs an additionalfixed cost, F x, plus variable trade costs, τ ≥ 1, which are assumed to take the form of melting“iceberg” costs. The trade costs are transformed to a parameter (ρ) denoting the “freeness” oftrade to confine the set of possible values capturing trade costs to a compact set (Baldwin et al.,2003). The parameter is a function of trade costs and the elasticity of substitution.
16

Alternatively, the firm can choose to locate the production of the product abroad to servicethe foreign market, thus circumventing the costs of exporting. Opening a foreign affiliate incursa fixed cost, Fm. The following relationship between the costs is assumed:
F <F x
(1 + ρ)1
1−θ − 1< Fm, 0 < ρ ≡ τ1−σ < 1 (5)
Thereafter, the firm decides how much organisational capital to allocate to each plant, thus de-termining the organisational capital allocated to each product produced at those plants.
The price index also takes the constant elasticity of substitution form:
Pl =
[∫ω∈Ωl
p(ω)1−σdω
] 11−σ
(6)
In the monopolistic competition setting, the firm will set a price (pjl) for each product of pro-ductivity, Z, consisting of a constant mark-up on marginal cost. The marginal cost of the firmthat locates its plant at home is the inverse of the productivity of the plant, whereas if the firmlocates the plant abroad the marginal cost is inflated by the trade cost.
Cjl(Z) =
1
ϕ(kj(Z),Z) if j = l,τ
ϕ(kj(Z),Z) if j 6= l.(7)
Thus,
pjl(Z) =
σ
(σ−1)ϕ(kj(Z),Z) if j = l,στ
(σ−1)ϕ(kj(Z),Z) if j 6= l.(8)
Given the pricing index and the cost function, and if A is defined as the level of demand in eachcountry adjusted by the mark-up, then the profit from domestic (πD), export (πX), and foreignproduction (πM ) can be written as follows:
πD(kd, Z) = AZσ−1(kd)θ − F, (9)
πX(kd, Z) = (1 + ρ)AZσ−1(kd)θ − F − F x, (10)
πM (kd, Z) = AZσ−1((kd)θ + (kf )θ)− F − Fm, (11)
where A ≡ 1
σ
(σ
σ − 1
)1−σ
EPσ−1
The first problem that the domestic firm faces is to choose the optimal allocation of organisationalcapital to the different product lines in such a way that the total profit (which is a combinationof equations 9, 10, and 11) is maximised. Suppose that all the products that the firm producescan be allocated into three sets: the set of product lines produced domestically for the domesticmarket only (ΦD), the set of product lines produced domestically and exported only (ΦX), andthe set of product lines produced abroad for the foreign market only (ΦM ). All other productsare not produced by the domestic firm. Further suppose that B denotes the burden from the
17

total network of plants of the firm for organisational capital. Then, the first-order conditions forthe optimal allocation choice are:
kj(K;λ,K) =
KBZ
σ−11−θ if j = d and Z ∈ ΦD,
KB (1 + ρ)
11−θZ
σ−11−θ if j = d and Z ∈ ΦX ,
KB λ− 1
1−θZσ−11−θ if j = d and Z ∈ ΦM
(12)
where B = ∫Z∈ΦD
Zσ−11−θ dG(Z) +
∫Z∈ΦX
(1 + ρ)1
1−θZσ−11−θ dG(Z) + λ−
θ1−θ
∫Z∈ΦM
Zσ−11−θ dG(Z)
Substituting the optimal allocation choices into the profit equations yields the following systemof equations:
πD(kd, Z) = AKθB−θZσ−11−θ − F, (13)
πX(kd, Z) = AKθB−θZσ−11−θ (1 + ρ)
11−θ − F − F x, (14)
πM (kd, Z) = AKθB−θZσ−11−θ (1 + λ−
θ1−θ )− F − Fm (15)
The optimal organisational capital allocations capture the opportunity costs of the firms. Addinganother product to a firm’s portfolio reduces the overall productivity of the firm as organisa-tional capital is spread more thinly across products. The allocation is skewed in favour of thoseproducts that dominate the firm’s blueprint productivity (i.e. those products that have a dis-proportionately higher Z in the firm blueprint), thereby enhancing the differences. Running aforeign affiliate requires less organisational capital than producing at home and exporting abroad,but maintaining a domestic headquarter and running a plant abroad requires more organsationalcapital than just maintaining a domestic plant (Yeaple, 2013).
As is expected in the Meltiz-type (2003) model, there exist zero-profit productivity cutoffs foreach mode of operation for each product line. If the firm’s productivity at producing its varietyof a certain product (Z) is not greater than that product’s zero-profit productivity cutoff fordomestic production (zD), then it will not produce that product. If Z is greater than zD, butnot greater than that product’s zero-profit productivity cutoff for export (zX), then the firm willproduce the product for the domestic market, but not export it. Suppose the firm’s productvariety productivity is greater than the zero-profit productivity cutoff for export, but not thezero-profit productivity cutoff for producing abroad (zM ), then the firm will export the product,but not produce it abroad. Now suppose that there exists some firms that are endowed with“sufficient finesse” in adapting to maintaining a foreign affiliate that some subset of the productsproduced by that firm can be produced abroad. “Sufficient finesse” is defined as:
λ−θ
1−θ > ∆, where ∆ ≡ (1 + ρ)1
1−θ − 1
If this criterion is satisfied and the firm’s productivity at producing it’s variety of a product isgreater than the zero-profit productivity cutoff for producing abroad, then the firm will produceboth domestically at the headquarters, and abroad, in an overseas subsidiary. Thus, yielding thefollowing relationship between the cut-offs:
zD > zX > zM
18

Using the defined characteristics of the zero-profit cut-offs and the profit equations (13, 14, 15),the firm’s total profit from all modes of operation can be written as follows:
π = AKθB(zD, zX , zM )1−θ − (1−G(zD))F − (1−G(zM ))Fm − (G(zM )−G(zX))F x (16)
with B redefined as B(zD, zX , zM ) =∫ zX
zD
Zσ−11−θ dG(Z) + (1 + ρ)
11−θ
∫ zM
zX
Zσ−11−θ dG(Z) +
(1 + λ−
θ1−θ
)∫ ∞zM
Zσ−11−θ dG(Z) (17)
Maximising the profit function (16) and obtaining the first-order conditions allows for the zero-profit cut-offs to be denoted as follows:
zD =
((1− θ)AKθB(zD, zX , zM )−θ
1
F
)− 1−θσ−1
(18)
zX =
((1− θ)AKθB(zD, zX , zM )−θ
∆
F x
)− 1−θσ−1
(19)
zM =
((1− θ)AKθB(zD, zX , zM )−θ
(λ−θ
1−θ −∆)
Fm − F x
)− 1−θσ−1
(20)
To solve the integration problem in equation 17, the zero-profit cut-offs (18, 19, 20) are sub-stituted into 17. The distribution, from which the firm productivity is drawn from, is assumedto the Pareto distribution (Yeaple, 2013).
B(K,λ) =
(a((1− θ)AKθ)a−1
a− 1Θ(λ)
) 11−θ+aθ
, where a ≡ κ 1− θσ − 1
> 1
and Θ(λ) ≡ F 1−a + ∆a(F x)1−a + (λ−θ
1−θ −∆)a(F I)1−a (21)
Expressions 18 to 21 are used in the key analysis. Suppose there is a reduction in the fixed costof OFDI. This is equivalent to observing a decrease in the parameter, Fm. Thus, the zero-profitcut-off for engaging in foreign production decreases. For some products, it will now be moreprofitable to relocate production abroad to serve the foreign market, than to export to thatmarket. While it may be more profitable to do so, producing those products abroad requiresmore organisational capital on average than exporting them did. The additional organisationalcapital requirements are diverted from the production of marginal domestically produced goods(for both domestic consumption and export) resulting in the closure of some product plants.Therefore, it is expected that the number of products produced by the firm in the domesticmarket will fall.
4.7 Limitations of the Theory and Overlooked Mechanisms
This analysis is restricted to horizontal OFDI and it is based on the assumption of symmetricfactor prices. Furthermore, productivity is drawn from a distribution. Thus, there is only scope
19
within the model to explain market-seeking OFDI. However, efficiency seeking and resource seek-ing OFDI also stem from a desire to cut costs. If the resource requirements are the same acrossall product lines, then resource-seeking investments will decrease costs in the future across allproduct lines produced domestically by that firm. This increases the profitability of all productlines and is expected to increase the product scope, as it will be feasible to produce productsthat were not profitable beforehand. If all firms engage in this form of OFDI, then across firmreallocation of factors and internal reallocation of factors result in the opposite effect. However,if the resource requirements are asymmetric across product lines, then the products that areresource heavy will have the greatest drop in costs in the future. Thus, production is expectedto be concentrated in these products, and less profitable marginal products are expected to bedropped, resulting in a fall in product scope.
Factor price arbitrage (efficiency-seeking OFDI), shifts the production of those products thatrely intensely on a factor that is cheaper in the destination country abroad. The first roundeffect is that product scope will fall. However, the result is that variable profits will increase.Domestic production may expand into a greater range of product lines, but only for the productsnot intensely reliant on the factor that is cheaper abroad. Thus, there will be an increase inthe number of product lines that are intensive in the factor that is most abundant in the homecountry.
The strategic asset-seeking motive is concerned with directly improving the productivity of thefirm through the ownership advantages. Assume the productivity improvement is restricted tothe product lines produced in the destination country. The firm experiences an increase in vari-able profits after relocating processes abroad. Some product production is relocated abroad, sothe product scope will decrease. Across firm reallocations creates a competitive environment andpressurises firms to make internal efficiency adjustment, so the product scope will fall further.
4.8 The Road from OFDI to Product Scope
Helpman, Melitz and Yeaple (2004) predicts that exporting firms are more productive thanpurely domestic firms, but OFDI firms are the most productive firms in the industry. Thus, aninvestigation into the productivity of firms by their mode of production is expected to reveal aclear productivity hierarchy based on their degree of commitment to outward expansion.
The Bernard, Redding, and Schott (2010) model predicts that the most productive firms cansustain more product lines. So, the number of products produced by a firm has a positive rela-tionship with firm productivity. A simple count of the number of product lines produced by afirm should have a positive and significant relationship with the firm productivity measure.
A simple integration of the relationships derived from these papers suggests that there is arelationship between the international activity of the firm and the number of products that thefirm produces. This relationship operates through the firm productivity. It is expected from theinterlinked relationship that firms that engage in exports can sustain more product lines thanfirms that produce solely for the domestic market, but firms that engage in OFDI are capable ofsustaining the greatest amount of product lines. The firm’s international activity determines theproduct number hierarchy. Furthermore, a positive relationship between the number of productsproduced by firms and engaging in OFDI is expected.
Yeaple (2013) formalised the relationship between international activity and product scope. His
20

model suggests that a decrease in the cost of investing abroad will divert organisational capitalfrom domestic production (geared towards domestic sales and exports), because for at least someproducts it is more profitable to engage in foreign production. The drain of organisational capitalin domestic production drops the marginal products from the domestic plants’ repertoire. Thus,there is a negative expected relationship between the number of products produced domesticallyby a firm and the fixed costs of investment faced by the firm.
This narrative is used to guide the empirical analysis, but before this is done, the data willbe described in the next section.
5 Data
The hypotheses outlined in the previous section are tested using a newly constructed datasetthat incorporates OFDI data, detailed firm-level financial information and product-level data ofIndian firms. The OFDI data is published monthly by the Reserve Bank of India (RBI) and itis freely available from their website (RBI, 2012). Firm-level financial information and productdata is available by subscription from the Prowess database produced by the Centre for Moni-toring the Indian Economy (CMIE, 2012).
The financial year of India is at the end of March. In the paper, results from a particularyear are referring to the year-end that occurs in the following March. For example, the resultsof 2008 are referring to the results in the financial statements published in March 2009. TheOFDI data is disaggregated by month. In order to match OFDI data to the firm-level data,the OFDI data has been aggregated to a gross yearly outflow from that firm. The OFDI dataremains disaggregated on the basis of other key characteristics of the OFDI, such as destination,sector and subsidiary. Several companies in the Prowess database have financials published fora different year-end from March. In order to render all the companies comparable, companieswith a year end in all the months up to and including June will be assumed to be referring tothe previous year’s results.
5.1 OFDI Data Source
The RBI signaled the intention to publish monthly overseas direct investment statistics on itswebsite in June 2011. The RBI defines overseas direct investment (equivalent to OFDI) as“...investment by way of contribution to the capital or subscription to the Memorandum of As-sociation of a foreign entity or by way of purchase of existing shares of a foreign entity either bymarket purchase or private placement or through stock exchange, but does not include portfolioinvestment” (Reserve Bank of India, 2004). The declassifying process began in July 2011 andincluded data for the period July 2007 to May 2011. The constructed dataset used for this paperonly has overseas direct investment figures from July 2007 to October 2012. Thus, the data isincomplete for the year 2007 and the year 2012.
All international transactions must be conducted through an authorised dealer (AD). ADs areauthorised by the RBI to deal in foreign exchange or foreign securities. It applies to the RBI toget this role, except for financial institutions, which are already granted this role. The OFDI datamade available by the RBI is collected from the reports filed by the Authorized Dealer Category-IBanks who receive the Form ODI from the Indian parties engaging in OFDI. All firms engagingin OFDI, even those firms eligible for the automatic route, are required to complete the FormODI.
21

The automatic route implies that approval from the RBI is not necessary to invest abroad.Eligible investors are allowed to invest up to 400% of their net worth through the automaticroute. This limit does not apply to investments of funds from the Exchange Earner’s ForeignCurrency (EEFC) account; or raised abroad through an American Depository Receipt (ADR), orGlobal Depository Receipt (GDR); or investments made by Indian parties operating in the natu-ral resource sector. The approval route applies to investments that do not satisfy the criteria forthe automatic route. To obtain permission from the RBI through the approval route, the entitycompletes and submits the Form ODI through an AD. It must submit an Annual PerformanceReview and repatriate funds owed by the entity to India. It submits the same form when usingthe automatic route, but only within 30 days of having already effected the transaction (ReserveBank of India, 2004).
OFDI is classified as either joint venture (JV), or wholly-owned subsidiary (WOS). Both types ofOFDI involve the formation of a “foreign entity [that is] registered or incorporated in accordancewith the laws and regulations of the host country” (Reserve Bank of India, 2004). However, ifthe capital ownership of the entity is entirely held by Indian parties, then the OFDI is classifiedas a WOS. Otherwise, the OFDI is classified as a JV.
The Foreign Exchange Management Act of 1999 regulates the governance of OFDI in India.Any such investment can occur through one of two routes: the automatic route, and the ap-proval route. However, there is a blanket ban on such investments in real estate, banking, andany activity in Pakistan.
The OFDI data is reported and published online. It consists of the following fields: the name ofthe investing firm, the name of the subsidiary, categorization of the subsidiary (joint venture/wholly-owned), the destination country, the major activity of the subsidiary, and the amount in US$millionscommitted in the form of equity, loans and guarantee issued. Monthly transaction data betweenthe firm and it’s subsidiary is reported, but the reports do not indicate when the first transactionbetween the firm and this subsidiary took place.
5.2 Firm-Level Financial and Product Data
The firm-level financial data has been obtained from the Prowess database, collected by theCMIE. Prowess contains firm-level data on 27548 Indian companies. The data is from the fi-nancial statements of the companies and from stock exchanges (for publicly listed companies).There is firm-level data available from the 1989-90 financial year until the most recent financialyear-end, 2012-13. For the purpose of this study, the analysis will be restricted to manufacturingfirms and the period 2005-06 to 2011-12 (which will be referred to as 2005-11 from here on).
There is firm-level data on 7017 firms spanning one or more years in the period 2005-11. Ofthose firms, 545 have been matched to the OFDI database in the period 2007-11. If there hasbeen positive financial inflows from exporting activity, then firms are classified as an exporter ina particular year. 3592 firms engaged in exporting activity in at least one of the years in ques-tion. Of the 545 Prowess firms matched to OFDI, 489 of them also engaged in exporting activity.
The data set contains the sales data of products where each product is classified accordingto the product material name. This data is used to determine whether certain products weretraded during a particular period and determine the number of different products that are pro-
22

duced by the firm. For each product material name, a unique product is counted only if the salesvolume of that product is greater than zero. The Prowess database does not contain productdisaggregated export data.
5.3 Descriptive Statistics of OFDI Data
Since the OFDI data for 2007 and 2012 is incomplete, the analysis is restricted to the period2008 to 2011. It is apparent from figure 2 that 2010 was a very signigicant year for OFDI. Thetotal OFDI more than doubled from 2009 to 2010. It dipped slightly in the following year, butnot back to the levels of 2008 and 2009. This level of an increase has not been observed in theIndian OFDI data since the 2006 period after the first rounds of OFDI liberalization (Khan,2012).
Figure 2: OFDI Values in US$millions
However, from table 3 and figure 3, it is not clear that this increase is as dramatic as was atfirst glance. Breaking down the total OFDI into its component parts reveals a different story.Most of the observed increase in OFDI can be attributed to a massive increase in the amountof guarantees issued in that year. Issuing a guarantee does not imply an immediate outflow ofcapital to the subsidiary abroad. The amount of guarantees that are actually invoked in a givenyear are an insubstantial fraction of the amounts issued in each year (Khan, 2012). Thus, theoutflow of these commitments has not been effectively realised as of yet.
Separating out the equity and loan component of OFDI suggests that dramatic jump figure 1can be misleading (see figure 3). The equity contributions have been somewhat erratic overthe period, but the loan component has been steadily increasing in a vaguely logistic shape.Separating out the guarantee issued OFDI from total OFDI leaves the actual outflows of FDIin a particular year. Not all guarantees issued in a year will be invoked; thus these cannot becounted as actual outflows. Interestingly, the total actual outflow (see figure 4) is still higher
23
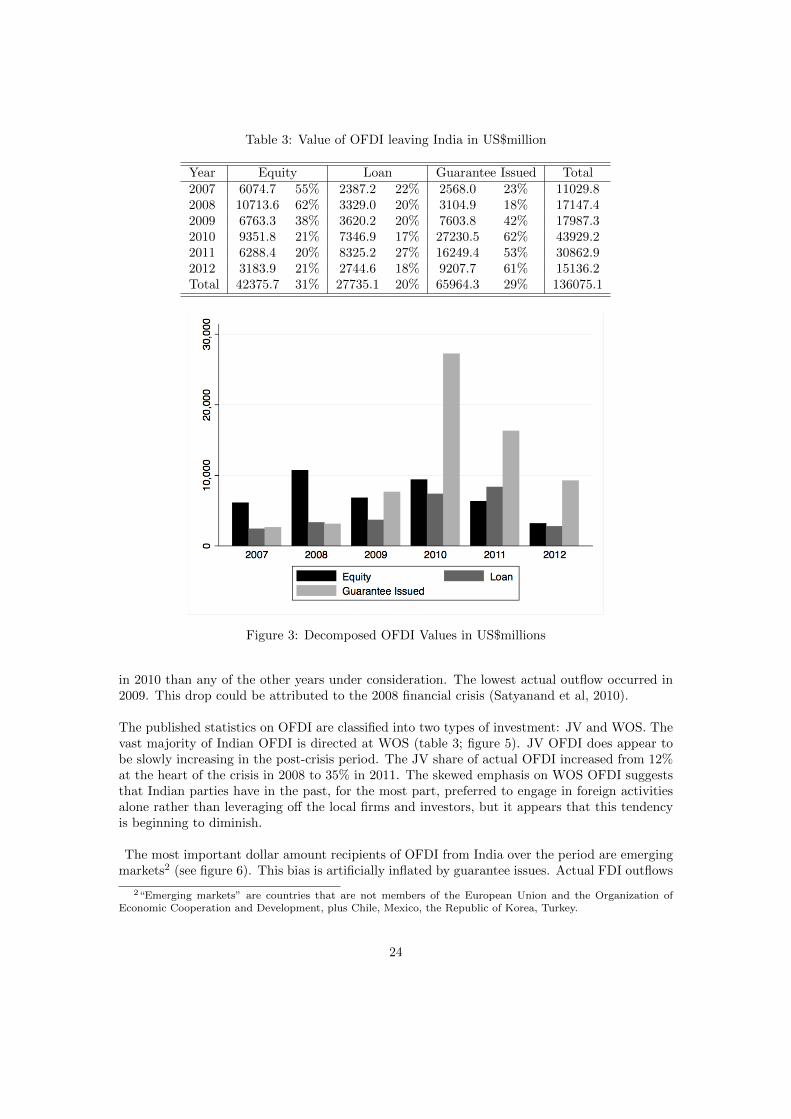
Table 3: Value of OFDI leaving India in US$million
Year Equity Loan Guarantee Issued Total2007 6074.7 55% 2387.2 22% 2568.0 23% 11029.82008 10713.6 62% 3329.0 20% 3104.9 18% 17147.42009 6763.3 38% 3620.2 20% 7603.8 42% 17987.32010 9351.8 21% 7346.9 17% 27230.5 62% 43929.22011 6288.4 20% 8325.2 27% 16249.4 53% 30862.92012 3183.9 21% 2744.6 18% 9207.7 61% 15136.2Total 42375.7 31% 27735.1 20% 65964.3 29% 136075.1
Figure 3: Decomposed OFDI Values in US$millions
in 2010 than any of the other years under consideration. The lowest actual outflow occurred in2009. This drop could be attributed to the 2008 financial crisis (Satyanand et al, 2010).
The published statistics on OFDI are classified into two types of investment: JV and WOS. Thevast majority of Indian OFDI is directed at WOS (table 3; figure 5). JV OFDI does appear tobe slowly increasing in the post-crisis period. The JV share of actual OFDI increased from 12%at the heart of the crisis in 2008 to 35% in 2011. The skewed emphasis on WOS OFDI suggeststhat Indian parties have in the past, for the most part, preferred to engage in foreign activitiesalone rather than leveraging off the local firms and investors, but it appears that this tendencyis beginning to diminish.
The most important dollar amount recipients of OFDI from India over the period are emergingmarkets2 (see figure 6). This bias is artificially inflated by guarantee issues. Actual FDI outflows
2“Emerging markets” are countries that are not members of the European Union and the Organization ofEconomic Cooperation and Development, plus Chile, Mexico, the Republic of Korea, Turkey.
24
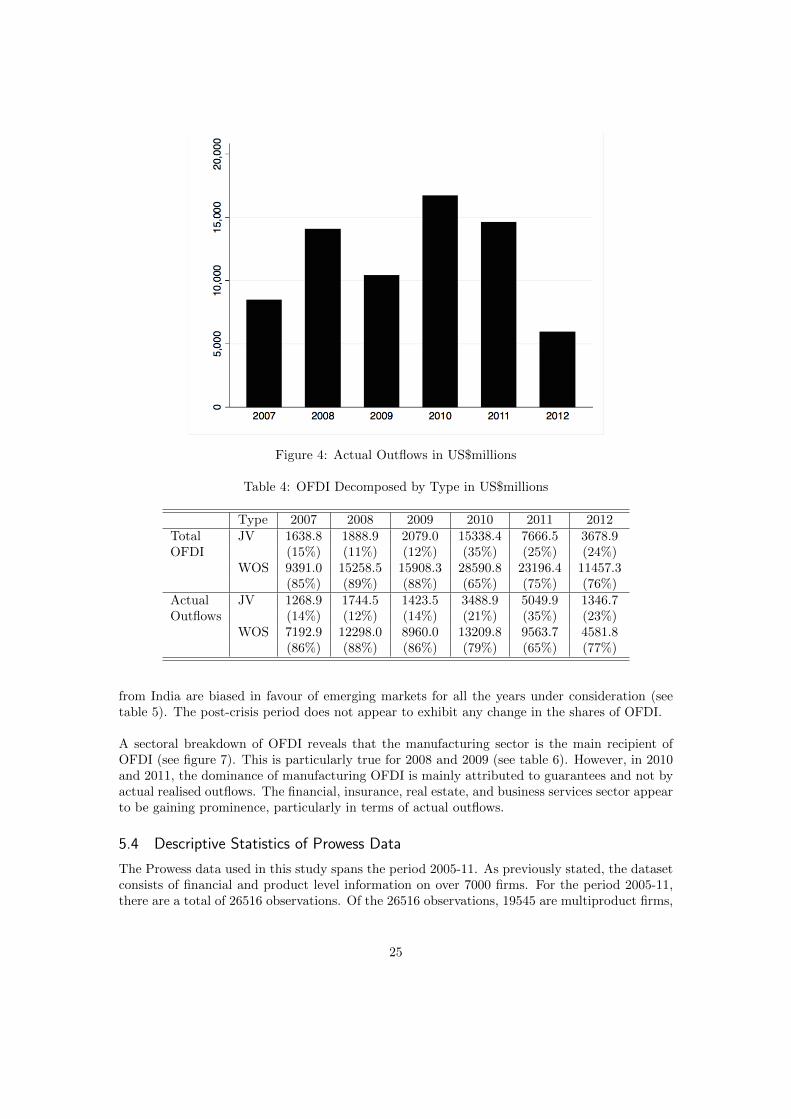
Figure 4: Actual Outflows in US$millions
Table 4: OFDI Decomposed by Type in US$millions
Type 2007 2008 2009 2010 2011 2012Total JV 1638.8 1888.9 2079.0 15338.4 7666.5 3678.9OFDI (15%) (11%) (12%) (35%) (25%) (24%)
WOS 9391.0 15258.5 15908.3 28590.8 23196.4 11457.3(85%) (89%) (88%) (65%) (75%) (76%)
Actual JV 1268.9 1744.5 1423.5 3488.9 5049.9 1346.7Outflows (14%) (12%) (14%) (21%) (35%) (23%)
WOS 7192.9 12298.0 8960.0 13209.8 9563.7 4581.8(86%) (88%) (86%) (79%) (65%) (77%)
from India are biased in favour of emerging markets for all the years under consideration (seetable 5). The post-crisis period does not appear to exhibit any change in the shares of OFDI.
A sectoral breakdown of OFDI reveals that the manufacturing sector is the main recipient ofOFDI (see figure 7). This is particularly true for 2008 and 2009 (see table 6). However, in 2010and 2011, the dominance of manufacturing OFDI is mainly attributed to guarantees and not byactual realised outflows. The financial, insurance, real estate, and business services sector appearto be gaining prominence, particularly in terms of actual outflows.
5.4 Descriptive Statistics of Prowess Data
The Prowess data used in this study spans the period 2005-11. As previously stated, the datasetconsists of financial and product level information on over 7000 firms. For the period 2005-11,there are a total of 26516 observations. Of the 26516 observations, 19545 are multiproduct firms,
25

Figure 5: Type of OFDI by year in US$millions
Table 5: OFDI Decomposed by Destination in US$millions
Destination 2007 2008 2009 2010 2011 2012Total Developed 4712.8 6676.1 5200.6 13033.5 10896.4 7697.9OFDI (43%) (39%) (29%) (30%) (35%) (51%)
Emerging 6317.1 10471.3 12786.7 30895.7 19966.5 7438.3(57%) (61%) (71%) (70%) (65%) (49%)
Actual Developed 3186.8 5604.8 3315.2 4753.5 4327.3 2465.5Outflows (38%) (40%) (32%) (28%) (30%) (42%)
Emerging 5275.0 8437.8 7068.3 11945.2 10286.2 3463.0(62%) (60%) (68%) (72%) (70%) (58%)
15309 are exporters, and 2773 are outward investors (see table 6).The mean of sales of multiproduct exporters is higher overall than the mean sales of all firms.The same can be said of exporters and outward investors, to an even greater degree. Outwardinvestors are much larger in terms of sales than all other types of firms.
This observation is robust to disaggregation over time. OFDI firms are larger on average interms of sales values than any other type of firm. Exporters are larger than multiproduct firms.Multiproduct firms are larger than the average firm. Average sales for all types of firms fell in2008 (probably because of the financial crisis) but sales recovered quickly in the period after.
An alternative measure of size is number of employees employed by the firms. In this paper, themeasure will only be used descriptively, because the measure is severely underreported (22239missing). The size hierarchy established by the firm sales holds for the employee measure of size.Over the whole period, multiproduct firms, exporters and outward investors are larger than the
26

Tab
le6:
OF
DI
Dec
omp
osed
by
Sec
tor
inU
S$m
illi
ons
Majo
rA
ctiv
ity
2007
2008
2009
2010
2011
2012
OF
DI
Agr
icu
ltu
re,
Min
ing,
Hu
nti
ng,
For
estr
y&
Fis
hin
g60
7.5
591.
286
8.1
2593
.027
67.1
302.4
Com
mu
nit
y,S
oci
alan
dP
erso
nal
Ser
vic
es23
6.3
459.
635
4.8
730.
246
1.1
763.6
Con
stru
ctio
n70
5.7
409.
694
7.3
848.
333
62.2
1406
.6E
lect
rici
ty,
Gas
and
Wat
er29
.112
5.3
814.
117
2.4
316.
510
4.3
Fin
anci
al,
Insu
ran
ce,
Rea
lE
stat
e&
Bu
sin
ess
Ser
vic
es24
69.3
3908
.328
93.3
7068
.460
83.6
3063
.6M
anu
fact
uri
ng
4137
.090
48.1
7250
.214
732.
097
20.4
5065
.0M
isce
llan
eou
s16
1.7
353.
511
0.6
735.
516
1.6
165.7
Tra
nsp
ort,
Sto
rage
and
Com
mun
icat
ion
Ser
vic
es11
43.1
1005
.930
27.6
1390
5.3
4470
.927
78.7
Wh
oles
ale,
Ret
ail
trad
e,R
esta
ura
nts
and
hot
els
1540
.312
46.0
1721
.331
44.1
3519
.614
86.3
Act
ual
Ou
tflow
Agr
icu
ltu
re,
Min
ing,
Hu
nti
ng,
For
estr
y&
Fis
hin
g60
7.5
531.
679
8.6
1344
.522
96.7
170.2
Com
mu
nit
y,S
oci
alan
dP
erso
nal
Ser
vic
es84
.845
0.4
178.
272
0.3
208.
932
5.5
Con
stru
ctio
n70
5.7
331.
733
9.3
407.
342
5.5
418.1
Ele
ctri
city
,G
asand
Wat
er29
.112
5.3
813.
985
.410
2.6
34.7
Fin
anci
al,
Insu
ran
ce,
Rea
lE
stat
e&
Bu
sin
ess
Ser
vic
es18
52.9
3172
.919
36.6
5800
.842
12.1
1830
.1M
anu
fact
uri
ng
3233
.073
50.0
4742
.853
95.6
3343
.517
71.1
Mis
cell
aneo
us
156.
733
4.3
110.
627
6.5
117.
135
.6T
ran
spor
t,S
tora
gean
dC
omm
un
icat
ion
Ser
vic
es84
3.1
705.
634
0.5
778.
419
95.5
871.5
Wh
oles
ale,
Ret
ail
trad
e,R
esta
ura
nts
and
hot
els
949.
210
40.7
1122
.918
89.7
1911
.547
1.7
27

Figure 6: OFDI by Destination in US$millions
Table 7: Summary Statistics of Prowess Firms
Description Number of Observations Mean SalesYears 2005-2011 -Firms 26516 125.9Multiproduct Firms 19545 161.5Exporters 15309 199.3Outward Investors 2773 620.2
Table 8: Sales, Multiproduct Firms and Internationalising Firms in US$millions
Total Mean Mean Sales of Mean Sales of Mean Sales ofYear Sales Sales Multiproduct Firms Exporters OFDI Firms2005 301039.6 68.0 89.9 115.2 348.52006 387703.8 86.2 112.2 141.4 437.32007 491233.4 110.6 142.4 176.8 549.12008 438441.2 98.7 125.8 154.7 492.02009 518659.3 124.8 158.7 196.6 608.72010 601035.9 227.8 274.7 325.5 942.12011 597317.3 307.1 373.7 409.3 1201.7
average firm. Internationalising firms are larger on average than multiproduct firms. Outwardinvestors are the largest of the internationalising firms.
The mean number of products per firm ranges from 3.3 to 4.0 products. The number of productsper multiproduct firm ranges from 4.3 to 4.8 products. In 2010, there is a sudden drop in the
28

Figure 7: OFDI by Sector in US$millions
Table 9: Number of Employees, Multiproduct Firms and Internationalising Firms
Mean Mean Employees of Mean Employees of Mean Employees ofYear Employees Multiproduct Firms Exporters OFDI Firms2005 2256.2 2467.0 2599.1 3983.92006 2206.0 2431.3 2567.9 4066.32007 2150.8 2402.0 2506.7 4013.92008 2135.0 2345.7 2474.1 4081.32009 2396.4 2523.8 2846.4 4427.72010 2659.8 2753.8 3049.8 4823.12011 2708.3 2837.3 3029.8 4782.5
total number of products. There are a number of explanations for this phenomenon, including acrisis hangover and rising inflation in that particular period (Government of India, 2012). Thiswill need to be kept in mind in the empirical analysis in the next section.
The product scope investigation will be investigated in greater detail in the next section. Thefollowing section presents the empirical evidence for the narrative of subsection 4.8 using thedataset described in section 5.
29

Table 10: Products and Multiproduct Firms by year
Total Mean Mean Product perYear Products Products Multiproduct Firm2005 14619 3.3 4.32006 15259 3.4 4.32007 15354 3.5 4.42008 15727 3.5 4.42009 15062 3.6 4.52010 10503 4.0 4.82011 7432 3.8 4.5
6 Empirical Evidence
An early implication of the theory, based on the proximity-concentration trade-off model withheterogenous firms, is that there is a clear productivity hierarchy of firms in terms of their inter-national activity. The least productive firms exit the market. Slightly productive firms servicethe domestic market. More productive firms export. The most productive firms engage in OFDI.
The heterogenous firm model is empirically testable and several authors have tested for differ-ences in the relative productivity of domestic producers, exporters, and multinationals (Arnoldand Hussinger, 2005; Castellani and Zanfei, 2007; Girma et al, 2004; Girma et al, 2005; Headand Ries, 2003; Kimura and Kiyota, 2004; Wagner, 2005). These authors test for substitutionbetween exporting and OFDI due to productivity differences within an industry (Greenaway etal, 2007).
There are two main statistical methods for doing this. The ordinary least squares (OLS) re-gression compares mean productivity values of domestic producers, exporter, and investors (andcombinations thereof). The Kolmogrov-Smirnov tests of stochastic dominance (Greenaway et al,2007) compares the cumulative distributions of each type of combinatory firm. The predictionthat multinationals are more productive than exporters is supported by all the above studies,except for Head and Ries (2003).
To confirm whether the productivity hierarchy exists in this dataset, the first step is to finda good estimate of total factor productivity (TFP) as an approximate measure of productivity.The estimation procedure is conducted using observed input and output data obtained from theProwess database.
6.1 Relative Productivity of Domestic Producers, Exporters and OFDI Firms
The first step in the TFP estimation procedure is to estimate the logarithmic form of the pro-duction function.
lnYit = β0 + β1lnKit + β2lnLit + βlnxit + εit (22)
Total factor productivity is estimated using the residuals of this estimation. There is a simul-taneity problem in direct estimation methods such as ordinary least squares (OLS), because thechoice of factor inputs is correlated with the firm’s unobserved productivity. Thus, the errorterm is likely to be correlated with the factor input values. The error term is a function of the
30
unobserved (by the researcher) productivity (ωit) and determines the amount of factor inputsemployed. The OLS estimates are likely to be biased.
εit = ωit + µit (23)
Ordinarily, a fixed effect panel regression would be an option in estimating consistent parameters.However, in order to do so, it must be assumed that the aspect of TFP that influences firms be-haviour is invariant over time. This assumption may be an oversimplification particularly since itis expected that TFP will increase after the internal reallocation in response to changes on OFDI.
The endogeneity problem can also be addressed using Olley and Pakes (1996) semi-parametricestimator, which also yield consistent estimates. It utilises the firm’s investment decisions asa proxy for shocks in the unobserved (by the researcher) element of TFP. The level of invest-ment signals productivity and is correlated with capital, but current investment does not impactproductivity in the current period. Current investment is a function of the firm-observed pro-ductivity element and capital. The investment rule illustrates this relationship.
Iit = I(ωit,Kit) (24)
Inverting the investment rule to make ωit the subject of the formula yields a function that canreplace ωit in equation 2 and create an unbiased form of equation 1.
lnYit = β0 + δ1lnKit + β2lnLit + βlnxit + δ2lnIit + µit (25)
This will yield more accurate estimates of TFP from the residuals, as the estimates in the func-tion will be more consistent.
In order for these estimates to be consistent, the method requires that there be a strictlymonotonous relationship between investment and sales. It is not unreasonable to expect thatthere will be a not insignificant number of observations with zero investment in any particularyear. Unfortunately, these observations will be dropped in the Olley-Pakes correction in order tosatisfy the monotonicity condition. An alternative, but similar method developed by Levinsohnand Petrin (2003) uses intermediate inputs, such as materials (Mit), instead of investment.
lnYit = β0 + β1Kit + β2lnLit + β3lnMit(lnKit, ωit) + βlnxit + ωit + µit (26)
Intermediate inputs confers the benefit of very rarely being zero (Petrin et al, 2004), thus itis more receptive to the strict monotonicity assumption. In addition, intermediate inputs areeasier to adjust in the short-term in response to productivity shocks. The decision to alterintermediate input spend is a less costly decision than the decision to alter investment spend.Thus, as indicated in equation 5, it is expected that intermediate inputs (materials, M) is afunction of the observable (capital, K) and unobservable (ω) state variables. This relationshipcan be inverted under the monotonicity assumption, such that the unobservable state variable(ω) can be written as a function of the intermediate input and the observable state variable(capital).
ωit = ωit(lnMit, lnKit) (27)
Part of the production function can be fully specified (with an error term) by the observablevariables, capital and intermediate inputs. Capital and raw materials have an additional indirect
31
effect on output through the unobserved productivity. The total effect (direct and indirect) ofcapital and raw materials is denoted by φit(lnMit, lnKit).
lnYit = β2lnLit + φit(lnMit, lnKit) + βlnxit + µit (28)
φit(lnMit, lnKit) = β0 + β1Kit + β3lnMit + ωit (29)
The estimation procedure is a two-stage process. The first step is an OLS estimation of theproduction function (equation 27). An approximation of φit(lnMit, lnKit) using a third-orderpolynomial expansion of lnMit and lnKit is incorporated into the estimation procedure. Sub-tracting the expression β2lnLit, where β2 is the estimate of the β2 coefficient on the natural log oflabour in equation 27, from the residual of this estimation gives estimates for φit(lnMit, lnKit).Then, using estimates for the coefficients on the log of capital and materials, estimates can beobtained for the unobservable (by the researcher) firm characteristics, ωit.
ωit = φit(lnMit, lnKit)− β∗1Kit − β∗3 lnMit (30)
A consistent non-parametric approximation of E[ωit|ωi,t−1] is estimated using the estimatesconstructed according to equation 29 and the regression:
ωit = γ0 + γ1ωi,t−1 + γ2ω2i,t−1 + γ3ω
3i,t−1 + εit (31)
In the final stage of the procedure, a generalized method of moments minimization of the squaredresidual of the production function is conducted by choosing the coefficients on the log of capitaland the log of materials. The two coefficients need to be identified separately. Including anothermoment condition does this: materials from the former period is uncorrelated with the error inthe current period. Thus, if the previous period’s amount for raw materials usage is incorporatedinto the minimization problem in place of the present period materials usage, then there exists asingle candidate estimator that solves the minimization problem. Newton’s method is employedto find the unique solution to the minimization problem.
In conducting the estimation procedure, the dependent variable used is sales of goods. Netfixed assets is used in lieu of capital. Salaries and wages are used to denote labour stock, asthere were insufficient observations reporting the number of employees employed. The variableraw materials expenses is used as the materials variable, and plant and machinery additions isused as the variable for investment. The size dummies are based on sales values.
The results of the different methods of estimation are presented in table 11. The coefficientson the controls for each year are not included. The robust standard errors are reported. Thecompany identifier is the panel variable. Except for the estimate of the coefficient of capitalusing the Levinsohn-Petrin method, all the coefficients are statistically significant at the 1%level. The coefficient estimates on the factor inputs must be interpreted as elasticities, becausethe dependent variable and the factor input independent variables are in the form of the naturallogarithm. The estimates for the coefficients are capital are much lower than expected, particu-larly in the case of the Olley-Pakes estimation. The OP estimates for capital would normally belarger than the same for OLS and FE. However, the estimates for the coefficients on labour andmaterials are lower in the OP estimation than in the OLS and FE estimations, which is expected.
The economically and statistically insignificant estimation of coefficient on the capital variable
32

in the LP estimation procedure is not entirely unexpected. If there is not enough variation inthe data, then the LP method has a tendency to produce strange results when the dependentvariable is gross sales as has been used here (Petrin, 2004).
Table 11: Productivity Estimation results
Variable OLS Fixed Effects Olley-Pakes Levinsohn-PetrinlnCapital 0.070*** 0.020*** 0.049*** 0.006
(0.003) (0.006) (0.016) (0.027)lnLabour 0.203*** 0.221*** 0.167*** 0.190***
(0.003) (0.012) (0.006) (0.006)lnMaterial 0.566*** 0.612*** 0.494*** 0.689***
(0.007) (0.016) (0.013) (0.057)Small 0.462*** 0.276*** 0.623*** 0.586***
(0.014) (0.020) (0.028) (0.027)Medium 0.679*** 0.461*** 0.984*** 0.963***
(0.021) (0.030) (0.041) (0.046)Large 1.026*** 0.625*** 1.385*** 1.413***
(0.030) (0.041) (0.056) (0.065)Number ofObservations 25338 25338 13599 25338R-Squared 0.9605 0.9584
A short note should be made on the use of exporter and investor dummies in both the uncon-ditional and conditional comparisons to follow. Their use is premised on the assumption thatthere is no difference between the way investors, non-investors, exporters, and non-exportersutilise capital and labour. In order to overcome this assumption, the dummies would have to beinteracted with the explanatory variables in the production function.
6.2 Unconditional Comparisons
A comparison of the means and standard deviations of the TFP estimates that have been ac-quired using the FE and OP procedures are presented in table 12. The estimates using OLSare expected to be biased, thus the need for alternative methods of estimation, so the OLSTFP summary statistics will not be included here. Though the accuracy of the LP estimates isdoubtful given the strange coefficient on capital, it is also presented in the table. For all threeestimation techniques, the mean of the TFP of the outward investors is the highest, followed bythat of the exporters and the domestic producers have the lowest mean.
The comparison of means does not take into account productivity heterogeneity across the dis-tribution. There may just be a handful of outward investing and exporting firms that have sucha large productivity premium over domestic firms, that the mean is skewed into misleading thereader into believing that all outward investors and exporters are more productive than domesticproducers. In order to improve the robustness of the comparison, the Kolmogrov-Smirnov (K-S)tests for first-order stochastic dominance of the productivity distributions of OFDI firms relativeto domestic firms will also be used. Two hypotheses tests need to be conducted in order to con-firm dominance: whether the distributions are equal or not, and whether the former distrbutionis less than equal to the latter or greater than the latter.
33

Table 12: Comparative TFP: Means and Standard Deviations
International Activity Fixed Effects Olley-Pakes Levinsohn-PetrinOutward Investor 1.927 2.465 1.712
(0.423) (0.602) (0.394)Exporter 1.575 1.840 1.417
(0.438) (0.601) (0.414)Domestic Producer 1.355 1.390 1.237
(0.571) (0.727) (0.544)
The first test is a two-sided K-S test and the second test is a one-sided K-S test. In the two-sidedtest, the null hypothesis states that the different between the two distributions is zero and thealternative hypothesis states that the difference is not equal to zero. The null hypothesis of theone-sided test states that the difference between the productivity distribution of OFDI firmsand domestic firms is non-positive, and the alternative hypothesis states that this difference isstrictly positive. In order to illustrate that the distributions are different and that the differenceis not caused by the first distribution lying to the left of the second, the null hypothesis in thefirst test needs to be rejected and in the second test fail to be rejected. As illustrated in table13, this criterion is met for all three estimation procedures.
Table 13: P-Values of Kolmogrov-Smirnov Tests of First-order Stochastic Dominance
Investors vs Non-investorsFE OP LP
Test 1 0.000 0.000 0.000Test 2 0.997 1.000 0.997
Exporters vs Non-exportersTest 1 0.000 0.000 0.000Test 2 0.795 1.000 0.350
Investor vs Non-Investor ExportersTest 1 0.000 0.000 0.000Test 2 0.998 0.999 0.996
6.3 Relative Product Range of Domestic Producers, Exporters and OFDI Firms
A testable hypothesis in the Bernard, Redding and Schott (2010) model is that the most produc-tive firms are capable of sustaining the largest array of products. In the previous section, it wasshown that OFDI firms are more productive than exporting firms, which are more productivethan solely domestic producers. The implication is that OFDI firms should have a larger range ofproducts than exporting firms, which should have a larger range of products than solely domesticproducers.
Detailed product data is provided in the Prowess database. From this information, it is possibleto calculate the number of different products produced by a firm in each year. A preliminarystep in comparing firm product scope would be an investigation as to whether there is a re-lationship between product scope and productivity. The natural logarithm of the number of
34

products is used as the dependent variable. Table 14 reports the results using TFP as a proxyfor productivity. The OLS and FE estimates are expected to be biased due to the correlation ofthe factor inputs with the residual TFP in the productivity estimation. The LP TFP estimateis flawed when the gross sales dependent variable is used in the production function estimation.Therefore, the OP estimate of TFP is used in the regressions. Size controls are included in thesecond regression of each method in order to address ambiguous sources of endogeneity. Table14 reports the robust standard errors in brackets.
Table 14: Product and Productivity Estimation Results
OLS Fixed EffectsTFP 0.375*** 0.044** 0.041** 0.015
(0.013) (0.020) (0.016) (0.018)Small 0.247*** 0.041***
(0.025) (0.015)Medium 0.472*** 0.069***
(0.031) (0.022)Large 0.796*** 0.120***
(0.039) (0.028)Intercept 0.351*** 0.541*** 0.902*** 0.892***
(0.021) (0.021) (0.027) (0.027)Number ofObservations 25338 25338 25338 25338R-Squared 0.1255 0.1751 0.0845 0.1522
The productivity estimate is significant in both the OLS regressions, but only the simple fixedeffects regression estimate is significant at the 5% level. The OLS estimate treats gives equalweight to within-firm and between-firm variation by treating the dataset like a cross-section.Time dummies were included in the regression (but are not reported) in order to control forintertemporal variation. The fixed effect estimate captures the within firm variation in productscope and it’s relationship with the within firm variation in productivity. The significance of theOLS estimate and the insignificance of the fixed effects estimate indicates that there is a pos-itive and significant relationship between TFP and product scope across firms, but there is norelationship (that is statistically different from zero) between a change in TFP and a change inproduct scope within firms. A different explanation for the lack of significance once size controlsare included, it may be symptomatic of insufficient within-firm variation in both product scopeand productivity.
6.4 Unconditional Comparison
In the previous section, it was shown that outward investors are the most productive firms. Inthe above estimation, it was shown that there is a positive relationship between productivity andproduct scope. Therefore, it is expected that OFDI firms will have the largest product scope. Acomparison of the means and standard deviations of product number by firm type is presentedin table 15. Outward investors have the largest mean product scope, followed by exporters, anddomestic producers have the lowest mean product scope.
Once again, in order to take into account the heterogeneity in the product scope across the dis-
35

Table 15: Comparative Product Scope: Means and Standard Deviations
International Activity Mean (Standard Deviation)Outward Investor 1.534 (0.696)Exporter 1.152 (0.747)Domestic Producer 0.740 (0.677)
tribution within each firm type and improve the robustness of the comparison, the K-S test forfirst-order stochastic dominance is employed comparing investors to non-investors and exportersto non-exporters.
The procedure is the same as before: the first test is used to evaluate whether the distribu-tions are equal, and the second test is used to evaluate whether the distribution of the firm thatengages in the international activity is everywhere at least as large as the distribution of theother firms. A rejection of equality in the first test, and a failure to reject weak dominance inthe second test is required to confirm the mean comparisons of the previous table. The p-valuesof these tests are reported in table 16.
Table 16: P-values of K-S Tests of First-Order Stochastic Dominance in Product Scope
Investor vs Exporter vs Investor Exporter vsDomestic Domestic Non-investor Exporter
Test 1 0.000 0.000 0.000Test 2 0.998 1.000 0.991
The mean product scope comparison is supported by the Kolmogorov-Smirnov test of first-orderstochastic dominance, thus confirming the hypothesis that OFDI firms have a larger productscope than non-OFDI firms, and exporting firms have a larger product scope than non-exportingfirms.
6.5 Conditional Comparisons
In the previous section, it was shown that exporters and outward investors have a larger productscope than domestic producers. This section explores whether there is a relationship betweeninternational activity and product scope. Once again, the OLS estimates are used to analysethe cross-section relationship and the fixed effects estimates are used to analyse the relationshipbetween within firms variation of product scope and international activity (see table 17). Timedummies are included (but not reported) in both methods to control for intertemporal variation.
The simple OLS regression directly on the exporter and outward investor dummies yield positiveand significant estimates. In the second and third regression, an interaction term on the twodummies is also included in order to investigate whether the two activities augment each other.This is not the case according to both regressions. The second regression indicates the oppositein fact. There is no evidence of complementarity of exports and OFDI in this data. This sup-ports the proximity-concentration trade-off theory, which assumes substitutability of OFDI andexports. The inclusion of the capital, labour and materials in the third regression decreases thesignificant of the coefficient on the outward investor dummy, but it is still significant at the 10%
36
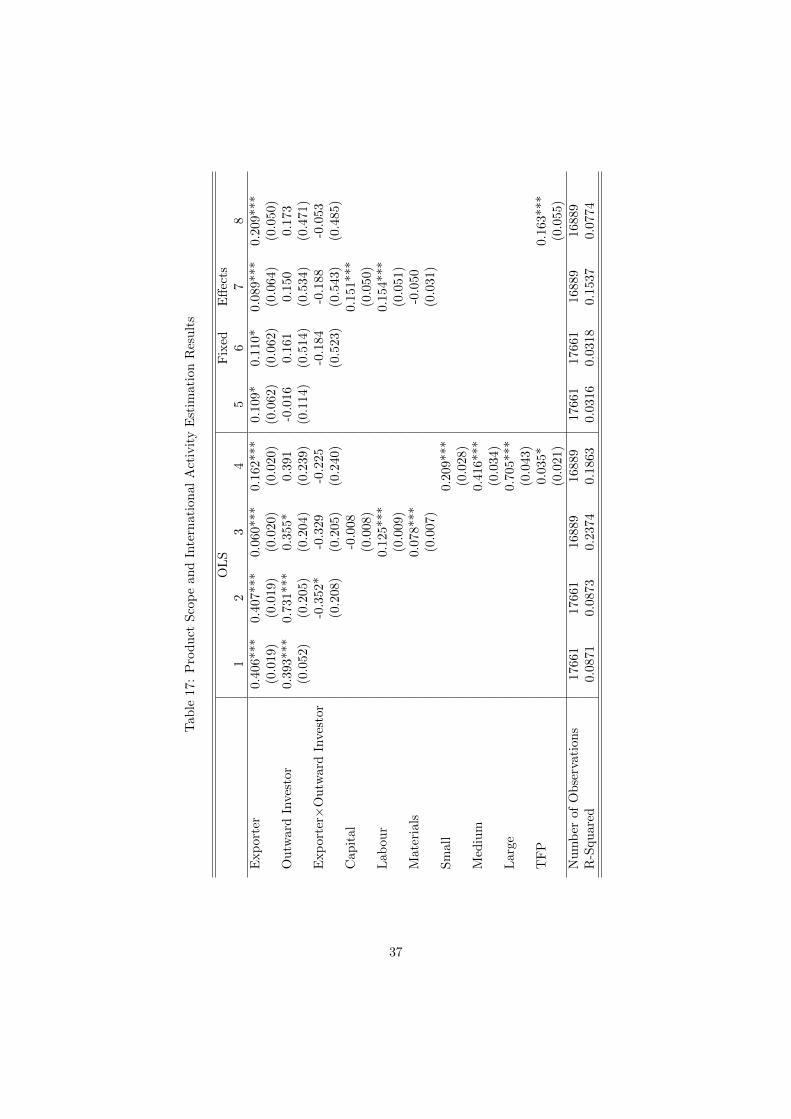
Tab
le17
:P
rod
uct
Sco
pe
and
Inte
rnat
ion
alA
ctiv
ity
Est
imat
ion
Res
ult
s
OL
SF
ixed
Eff
ects
12
34
56
78
Exp
orte
r0.
406*
**0.
407*
**0.
060*
**0.
162*
**0.
109*
0.11
0*0.
089*
**0.
209*
**(0
.019
)(0
.019
)(0
.020
)(0
.020
)(0
.062
)(0
.062
)(0
.064
)(0
.050
)O
utw
ard
Inve
stor
0.39
3***
0.73
1***
0.35
5*0.
391
-0.0
160.
161
0.15
00.
173
(0.0
52)
(0.2
05)
(0.2
04)
(0.2
39)
(0.1
14)
(0.5
14)
(0.5
34)
(0.4
71)
Exp
orte
r×O
utw
ard
Inve
stor
-0.3
52*
-0.3
29-0
.225
-0.1
84-0
.188
-0.0
53(0
.208
)(0
.205
)(0
.240
)(0
.523
)(0
.543
)(0
.485
)C
ap
ital
-0.0
080.
151*
**(0
.008
)(0
.050
)L
abou
r0.
125*
**0.
154*
**(0
.009
)(0
.051
)M
ater
ials
0.07
8***
-0.0
50(0
.007
)(0
.031
)S
mall
0.20
9***
(0.0
28)
Med
ium
0.41
6***
(0.0
34)
Lar
ge0.
705*
**(0
.043
)T
FP
0.03
5*0.
163*
**(0
.021
)(0
.055
)N
um
ber
ofO
bse
rvat
ion
s17
661
1766
116
889
1688
917
661
1766
116
889
1688
9R
-Squ
ared
0.08
710.
0873
0.23
740.
1863
0.03
160.
0318
0.15
370.
0774
37

level. Labour and materials coefficients are significant, but the capital coefficient is not.
The relationship between product scope and international activity is motivated using the theorieson both through firm productivity. It is expected that the inclusion of the productivity estimatein the OLS regression will eliminate the relationship between product scope and the dummies.The fourth regression estimates indicate that this outcome is observed for the outward investordummy only. The exporter dummy is still significant. Firm size dummies are also included andhave a positive and significant relationship with product scope.
The fixed effects regression for within firm variation paints a different picture. The coefficienton the exporter dummy is significant at the 10% level for the fifth and sixth regressions, but theoutward investor dummy is not statistically different from zero. The inclusion of the factor in-puts in regression seven results in an increase in the significance of the coefficient of the exporterdummy. The coefficients on capital and labour are significant, but the materials coefficient is not.
The inclusion of TFP in the last regression does not affect the significance of the exporterdummy coefficient estimate. The estimate of the coefficient on the TFP variable is positive andsignificant. Size dummies are not included here, because they are redundant in the fixed effectsregression that accounts for invariant firm characteristics such as size.
The next section will investigate whether an exogenous change in the costs of internationalinvestment and trade has a relationship with the engagement of firms in OFDI.
6.6 The Relationship between Investment and Trade Receptiveness, and OFDI
In the previous section, it was shown that in a cross-section analysis, there exists a positive re-lationship between engaging in international activity and the product scope of the firm. Firm’sthat do engage in international activity, exporting and investing abroad, have larger productscopes on average than non-internationalising firms. Furthermore, it appears that this relation-ship operates through firm productivity. However, this relationship does not establish the causalrelationship of OFDI on product scope. The next subsection will attempt to establish whethersuch a relationship exists.
The international activity of interest in this paper is OFDI. In order to tease out the causalrelationship between OFDI and product scope, it helps to find a factor that generates a changein OFDI without having a direct effect on product scope, except through OFDI. The proximity-concentration trade-off theory suggests that a change in the fixed cost of OFDI and changes inthe variable and fixed costs of exports would be such factors. Furthermore, it would be usefulif these factors did not affect all outward investing firms equally. The changes in Indian OFDIregulation are not a very useful factor in this respect. Although the relaxing of the restric-tions on Indian OFDI had been an exogenous reduction in the fixed costs of OFDI that has nodirect relationship with product scope, it was applied to all manufacturing firms at the same time.
The Indian OFDI data does indicate the recipient country of the investments made by eachfirm. There are about 59 different recipients of OFDI from India. In table 18, the total flows ofthe top ten recipients of OFDI are presented over the period 2007 to 2011. The top recipientsover the period consist of a mixture of emerging and developed economies that each has theirown set of factors (attractors and obstacles) that influences the fixed cost of investing in thosecountries. These factors no doubt change over time. The changes in these factors are often unique
38

to each country. The changes that these factors have on the fixed costs of inward foreign directinvestment (IFDI) in these countries is expected to have an affect on the amount of investmentfrom Indian firms to these countries, both in total and by firm.
Table 18: Top ten recipients of OFDI from India over the period 2007-2011
Country IFDI from India in US$ millions Share of TotalSingapore 30210.047 24.98%Mauritius 27085.52 22.39%Netherlands 14974.742 12.38%United States of America 7459.5698 6.17%United Arab Emirates 6169.7729 5.10%Cyprus 5092.3281 4.21%British Virgin Islands 4344.2383 3.59%United Kingdom 4076.1492 3.37%Australia 2838.8389 2.35%Panama 2208.1057 1.83%Other 16497.31 13.64%Total 120956.62 100%
The individual firm invests in a basket of countries that may change from year to year. Thecombination of factors from all the different countries in the basket that affect OFDI can be ag-gregated by weight to calculate a total impact on OFDI by that Indian firm. This total impactchanges from year to year as certain countries are added or dropped from the basket, or theinternal factors of countries in the basket change. Therefore, the fixed cost of OFDI faced by theIndian firm changes over time in a manner independent of the changes of the fixed cost of OFDIin other firms. Thus, it is expected that the firm-level outward investment can change based onfactors unique to each firm in every year.
The global competitiveness index measures international competitiveness of 151 countries andis composed of a variety of different measures. The specific measures that are of interest tothis paper is the trade-weighted average tariff rate as a measure of variable export costs, theprevalence of trade barriers as a measure of fixed export costs, and the business impact of ruleson FDI as a measure of the fixed costs of overseas investment. Other measures, such as GDP,the domestic market size, country development status and the OFDI recipient sector, are also ofinterest as controls.
This subsection establishes whether the trade and investment attractors and obstacles do havea relationship with the volume of FDI received by these countries from India. The results aresensitive to the choice of firms that are included in the analysis, so the subset of these firms, forwhich there is firm-level product data, that is used in the later analysis may not exactly mimicthe results obtained here.
Table 19 presents the results of the analysis of the relationship between country-specific fac-tors and the amount of OFDI received by those countries. It is expected that the tariff scorewill have a positive relationship with total FDI flows to the country, but there is no apparentrelationship in this database. The trade barriers score is derived from the Executive OpinionSurvey of the World Economic Forum and is a measure of the limits to imports by non-tariff
39

barriers, where one denotes “strongly limit(s)” and seven denotes “(does) not limit at all” (WorldEconomic Forum, 2013).
Table 19: Total OFDI Flows and Trade and IFDI Competitiveness Measures by Recipient
Total OFDI 1 2Tariff Score -0.033 0.014
(0.108) (0.094)ln(Trade Barriers Score) 0.190 -1.493
(3.390) (5.097)ln(FDI Rules Score) 6.406** 8.259**
(2.227) (3.780)ln(GDP in US$ billion) 0.112
(0.221)Emerging -0.367
(1.320)Manufacturing 1.260
(1.041)Other 3.810***
(0.949)No. of Observations 80 71
It is expected that the trade barrier score would have a negative relationship with total FDIinflows, but the relationship in this dataset is not statistically different from zero. Time controldummies are included but not reported to control for unobserved variations over time. Thedummy variable, Emerging, controls for the recipient country’s level of development, where“emerging” is defined as before in section 5.3. The coefficient on the development dummy isnot statistically different from zero. Sector controls, which indicate the sector in the recipientcountry that received the investment, are also included. The base sector is the primary sector.The manufacturing sector does not receive a statistically different amount of OFDI than theprimary sectors, but the sector classified as “Other” (which includes retail, business services,construction, electricity and water) receives a statistically significant amount more than the pri-mary sector.
The FDI rules score is also a measure derived from the Executive Opinion Survey of the WorldEconomic Forum indicating whether the regulatory environment of the host country is encour-aging towards FDI. One denotes “strongly discourage(s)” and seven denotes “strongly encour-age(s)” (World Economic Forum, 2013) FDI. It is expected that there would be a positive re-lationship between total FDI received by the country and the FDI rules score. The analysisindicates that there is a positive and statistically significant (at the 5% level) relationship andthat this result is robust to the inclusion of country and sector controls in regression 2. Thus,there is a relationship between the measure of OFDI costs and actual OFDI flows. The substi-tution between OFDI and exports is not explicitly tested here, because the export destination isnot included in this dataset.
40

6.7 Investment and Trade Receptiveness and the Entry and Exit of OFDI Firms
Another method for testing the sensitivity of investment flows to changes in the destinationcountry receptiveness to IFDI (whether regulations encourage IFDI) and exports (extent of tariffand non-tariff barriers) is to analyse the relationship of these measures to the entry and exit offirms into OFDI activity with each destination country. The focus is changed from aggregateOFDI flows by recipient country to firm-level flows by recipient country. An increase in coun-tries receptiveness to OFDI effectively lowers the fixed cost of engaging in OFDI. A decreasein countries receptiveness to exports effectively raises the variable cost of engaging in exports.Both changes in receptiveness should be associated with an increased probability of firm entryinto OFDI activity in that country, as per the proximity-concentration trade-off.
This method is more consistent than the previous method with the analysis that will take placein the next subsection, because the focus is changed to firm-level behaviour rather than aggregateflows of OFDI. In order to incorporate firm entry and exit into OFDI, the dataset has been filledwith zero flows, where a firm-destination-year combination is not accounted for in the existingdataset. When a firm does not invest to one of the countries in the dataset, an observation iscreated with a zero flow amount.
Following the method employed by Aw and Lee (2014) with a few modifications, a fixed effectsmultinomial logistic model is employed to analyse the effect of trade and IFDI receptiveness onthe likelihood of a firm engaging in FDI with a specific country. Aw and Lee (2014) employ amultinomial logit model with time and sector dummies and investigate the likelihood of a firmengaging in OFDI relative to a purely domestic base group of firms. In this analysis, the likeli-hood of a firm engaging in OFDI with a particular country is compared to a firm that does notengage in OFDI with that country.
The results of the analysis are reported in table 20. An improvements in a country’s busi-ness impact of FDI rules is associated with a higher probability of engaging in OFDI to thatcountry. This association is significant and robust to the inclusion of country, firm, and timecontrols (regression 2). Both regressions in table 19 include a lag of the dependent variable inorder to capture the persistence of OFDI engagement to a specific country by a specific firm as aresult of having covered a portion of the fixed cost of investment. The regressions include fixedeffects for the firm-destination combination. Thus, the relationship that is being captured is thewithin firm-destination relationship. The second regression includes controls for country charac-teristics that may be relevant to overall investment climate in the country, such as the domesticmarket size, taxes on businesses and level of development. The second regression also includesthe firm total factor productivity measure to control for other firm characteristics influencing thefirm’s ability to invest in general.
Thus, it appears that country FDI rules do have a positive relationship with FDI flows fromIndia to that country, as expected. However, tariffs and trade barriers do not appear to have asignificant relationship with FDI flows in this dataset, which is contrary to expectations. Thesignificance of the coefficient on the tariffs in the second method is undercut by the relativelysmall size of the coefficient. In the next section, the relationship between FDI rules and FDIflows will be used to tease out the relationship between OFDI and the product scope of theIndian outward investor.
41
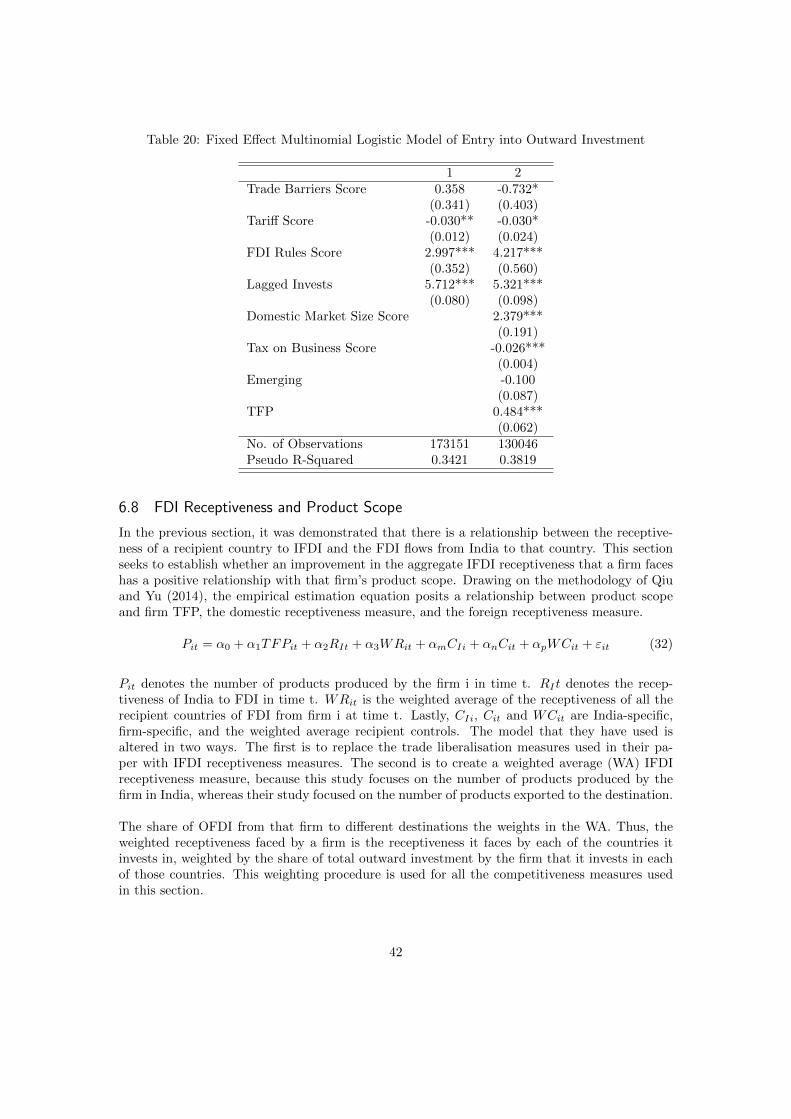
Table 20: Fixed Effect Multinomial Logistic Model of Entry into Outward Investment
1 2Trade Barriers Score 0.358 -0.732*
(0.341) (0.403)Tariff Score -0.030** -0.030*
(0.012) (0.024)FDI Rules Score 2.997*** 4.217***
(0.352) (0.560)Lagged Invests 5.712*** 5.321***
(0.080) (0.098)Domestic Market Size Score 2.379***
(0.191)Tax on Business Score -0.026***
(0.004)Emerging -0.100
(0.087)TFP 0.484***
(0.062)No. of Observations 173151 130046Pseudo R-Squared 0.3421 0.3819
6.8 FDI Receptiveness and Product Scope
In the previous section, it was demonstrated that there is a relationship between the receptive-ness of a recipient country to IFDI and the FDI flows from India to that country. This sectionseeks to establish whether an improvement in the aggregate IFDI receptiveness that a firm faceshas a positive relationship with that firm’s product scope. Drawing on the methodology of Qiuand Yu (2014), the empirical estimation equation posits a relationship between product scopeand firm TFP, the domestic receptiveness measure, and the foreign receptiveness measure.
Pit = α0 + α1TFPit + α2RIt + α3WRit + αmCIi + αnCit + αpWCit + εit (32)
Pit denotes the number of products produced by the firm i in time t. RIt denotes the recep-tiveness of India to FDI in time t. WRit is the weighted average of the receptiveness of all therecipient countries of FDI from firm i at time t. Lastly, CIi, Cit and WCit are India-specific,firm-specific, and the weighted average recipient controls. The model that they have used isaltered in two ways. The first is to replace the trade liberalisation measures used in their pa-per with IFDI receptiveness measures. The second is to create a weighted average (WA) IFDIreceptiveness measure, because this study focuses on the number of products produced by thefirm in India, whereas their study focused on the number of products exported to the destination.
The share of OFDI from that firm to different destinations the weights in the WA. Thus, theweighted receptiveness faced by a firm is the receptiveness it faces by each of the countries itinvests in, weighted by the share of total outward investment by the firm that it invests in eachof those countries. This weighting procedure is used for all the competitiveness measures usedin this section.
42

Table 21: IFDI Receptiveness and Product Scope
FE FE PoissonTFP -0.637 -0.118
(0.846) (0.153)Indian Receptiveness 6.727***
(1.974)WA Foreign Receptiveness -3.016** -0.446**
(1.500) (0.200)Indian GDP 2.368***
(0.635)WA Foreign GDP 0.029 0.007
(0.068) (0.011)
ln(CapitalLabour ) 0.250 0.041(0.252) (0.046)
WA Ease of Financing 2.879** 0.420**(1.457) (0.195)
No. of Observations 633 495R-Squared 0.0069
Both regressions have firm fixed effects (FE) and robust standard errors are reported for both.Time dummies are included in both regressions, but not reported here. The results in columnone of table 21 clearly illustrates a negative relationship between product scope and a change inthe IFDI receptiveness faced by a firm. The coefficient is -3.016 and is statistically significant atthe 5% level. Thus, when IFDI barriers are lowered abroad, holding all else equal, the domesticfirm will reduce their domestic product scope.
However, the use of the OLS with fixed effects estimation method may not be the best route totake to tease out this relationship and may produce biased results. The product scope or numberof products produced by a firm does not follow a normal distribution (Qiu et al, 2014). Mostfirms produce very few products, but a handful of firms produce very many products. Further-more, all the data points fall in the set of non-negative integers. Better estimates can be obtainedusing a Poisson distribution. The Poisson estimation technique is more suitable in dealing withcount data models (Qiu et al, 2014). Furthermore, given that at the simplest level the modelused is a gravity-type model (Qui et al., 2013), it is expected that the GDP of India is likely to bean important time variant variable. Also, the ability to engage in any type of investment in thecountry may an important time-variant factor having an affect on the ability of the subsidiaryto engage in production. Thus, these variables are also included in the regression.
The results of the fixed effects Poisson estimation is reported in column two of table 20. The coef-ficient is smaller on weighted IFDI receptiveness measure, but still negative and significant. Theseregressions provide the required evidence for the hypothesis proximity-concentration trade-off atthe product level, supporting the expectation that engaging in OFDI is likely to be associatedwith a fall in the number of product produced by the firm. This is in line with the hypothesispostulated in the theoretical narrative of section 4.7. The next section concludes.
43

7 Conclusion
This study focuses its attention on multiproduct multinationals. Drawing from a broad array oftheoretical contributions, a narrative is developed to postulate a plausible relationship betweenthe firm’s outward investment behaviour and the firm’s choice of product scope. Several testablehypotheses were raised in the paper. First, it is expected that outward investing firms are moreproductive than domestic and exporting firms. Second, it is expected that the most productivefirms produce the largest scope of products. Third, a corollary to the first and second hypotheses,it is expected that outward investing firms produce the largest scope of products. The fourthand final hypothesis, an outward investing firm is expected to consolidate its range of productsin response to an exogenous decrease in the barriers to outward investment.
These hypotheses were tested using detailed Indian firm-level data and overseas direct investmentdata. The empirical results were consistent with the hypothesized predictions. Outward invest-ing firms are the most productive firms in the domestic market. There is a positive relationshipbetween firm productivity and the range of products it chooses to produce. Outward investorshave the largest product scope in the domestic market, but an exogenous increase in the amountit invests abroad results in product consolidation.
The implication of this analysis is that there are productivity gains from creating policy en-vironment encouraging outward investment. This manifests in an associated fall in the range ofproducts produced at home, in addition to the exit of unproductive firms and reallocation of re-sources to the most productive firms as predicted in the proximity-concentration trade-off theorydeveloped by Helpman (2004). This selection at the product level indicates that the reallocationof factors to the most productive uses occurs to a greater extent than predicted in the standardproximity-concentration trade-off models.
44
8 References
Arkolakis, C. and Muendler, M. (2011), “The Extensive Margin of Exporting Products: A Firm-level Analysis”, NBER Working Paper, 16641
Arnold, J. and Hussinger, K. (2005). “Exports versus FDI in German Manufacturing: FirmPerformance and Participation in International Markets”, mimeo, World Bank
Aw, B. Y. and Lee, Y. (2014), “A Model of Demand, Productivity, and Foreign Location Deci-sion among Taiwanese Firms”, Journal of Internatioal Economics, 92(2), 304-316
Baldwin, R. E., Ottaviano, G. I. P. (2001) “Multiproduct Multinationals and Reciprocal FDIDumping”, Journal of International Economics, 54(2), 429-448
Baldwin, R. E., Forslid, R., Martin, P., Ottaviano, G., and Robert-Nicoud, F. (2003), Eco-nomic Geography and Public Policy, Princeton University Press, New Jersey
Behrman, J. N. (1972), The Role of International Companies in Latin American Integration:Autos and Petrochemicals, Lexington Books, D. C. Heath
Bernard, J. N. and Jensen, B. (1999), “ Exceptional Exporter Performance: Cause, Effect,or Both?”, Journal of International Economics, 47, 1-25
Bernard, A. B., Eaton, J., Jensen, B. and Kortum, S. (2003), “Plants and Productivity inInterational Trade”, American Economic Review, 93(4), 1268-1290
Bernard, A. B., Redding, S. J. and Schott, P. K. (2010), “Multiple-product Firms and ProductSwitching”, American Economic Review, 100(1), 70-97
Bernard, A. B., Redding, S. J. and Schott, P. K. (2011), “Multiproduct Firms and Trade Liber-alization”, The Quarterly Journal of Economics, 126, 1271–1318
Bhattacharya, R., Patnaik, I. and Shah, A. (2012), “Export vs FDI in Services”, The WorldEconomy, 35(1), 61-78
Brainard, S. L. (1997), “An Empirical Assessment Of The Proximity-Concentration Trade-OffBetween Multinational Sales And Trade”, American Economic Review, 87(4), 520-544
Castellani, D. and Zanfei, A. (2007), “Internationalisation, Innovation and Productivity: HowDo Firms Differ in Italy?”, The World Economy, 30(1), 156-176
Centre for Monitoring the Indian Economy (2013), Data derived from: Manufacturing FirmFinancial Statements 2005-2012 [Online]. Available at: Prowess (Accessed on 4 December 2012)
Dixit, A. and Stiglitz, J. (1977), “Monopolistic Competition and Optimum Product Diversity”,American Economic Review, 67, 297-308
Dua, P. and Ranjan, R. (2010), “Exchange Rate Policy and Modelling in India”, Department ofEconomic Analysis and Policy, Reserve Bank of India, Study No. 33
45

Dunning, J. H. (1980), “Toward an Electric Theory of International Production: Some Em-pirical Tests, Journal of International Business Studies, 11(1), 177-199
Dunning, J. H. (1981), Explaining the International Direct Investment Position of Countries:Towards a Dynamic and Development Approach, Weltwirtschaftliges Archiv, 117, 30-64
Dunning, J. H. and Lundan, S. M. (2008), Multinational Enterprises and the Global Economy,Edward Elgar Publishing Limited, Cheltenham
Foster-McGregor, N., Isaksson, A. and Kaulich, F. (2013), “Outward Foreign Direct Investment,Exporting and Firm-Level Performance in Sub-Saharan Africa”, The Journal of DevelopmentStudies, 50(2), 244-257
Franco, C., Rentocchini, F. and Marzetti, G. (2010), “Why do Firms Invest Abroad? An Anal-ysis of the Motives Underlying Foreign Direct Investments”, emphIUP Journal of InternationalBusiness Law, 9(1/2), 42-65
Girma, S., Greenaway, D. and Kneller, R. (2004), “ Does Exporting increase Productivity?A Microeconometric Analysis of Matched Firms”, Review of International Economics, 12, 855-866
Girma, S, Kneller, R. and Pisu, M. (2005), “Exports versus FDI: An Empirical Test”, WeltwirtschaftlichesArchiv, 12, 855-866
Greenaway, D. and Kneller, R. (2007), “Firm Heterogeneity, Exporting and Foreign Direct In-vestment”, The Economic Journal, 117(517), F134-F161
Head, K. and Ries, J. (2003), “ Heterogeneity and the Foreign Direct Investment versus Ex-ports Decision of Japanese Manufacturers”, Journal of Japanese and International Economies,17, 448-467
Helpman, E., Melitz, M. J. and Yeaple, S. J. (2004), “Export Versus FDI with HeterogeneousFirms”, The American Economic Review, 94(1), 300-316
Khan, H. R. (2012), “Outward Indian FDI - Recent Trends and Emerging Issues”, Reserve Bankof India, http://rbi.org.in/scripts/BS SpeechesView.aspx?Id=674#F4 (accessed on 19 February2013)
Kimura, F. and Kiyota, K. (2004), “Exports, FDI and Productivity of Firm: Cause and Ef-fect”, Faculty of Business Administration, Yokohama National University, Working Paper 216
Krugman, P. (1979), “Increasing Returns, Monopolistic Competition and International Trade”,Journal of International Economics, 9, 469–479
Ma, Y., Tang, H. and Zhang, Y. (2014), “Journal of International Economics”, Journal of Inter-national Economics, 92(2), 349-362
Matthews, J. A. (2006), “Catch-up Strategies and the Latecomer Effect in Industrial Devel-
46

opment”, New Political Economy, 11(3), 313-335
McCartney, M. (2010), “Political Economy, Growth and Liberalisation in India, 1991-2008”,Routledge, Oxon, United Kingdom
Melitz, M. (2003), “The Impact of Trade on Intra-Industry Reallocations and Aggregate In-dustry Productivity”, Econometrica, 71(6), 1695-1726
Pavcnik, N. (2002), “Trade Liberalization, Exit, and Productivity Improvements: Evidence fromChilean Plants”, Review of Economic Studies, 69(1), 245-276
Petrin, A., Poi, B. P., and Levinsohn, J. (2004), “Production Function Estimation in Statausing Inputs to Control for Unobservables”, The Stata Journal, 4(2), 113-123
Qiu, L. D. and Yu, M. (2014), “ Multiproduct Firms, Export Product Scope, and Trade Liber-alization: The Role of Managerial Efficiency”, HKIMR Working Paper, No. 02/2014
Reserve Bank of India (2004), “Foreign Exchange Management (Transfer or Issue of Any ForeignSecurity)(Amendment) Regulations”, Reserve Bank of India (Foreign Exchange Department),Mumbai
Reserve Bank of India (2011), “Overseas Direct Investment 2007-2011”, Department of Commu-nication, Mumbai, http://rbidocs.rbi.org.in/rdocs/content/docs/OFDIM220611.xls, (accessed 4December 2012)
Reserve Bank of India (2012), Data derived from: Press releases of Firm Outward Foreign DirectInvestment Data 2007-2012. Available at: http://www.rbi.org.in/scripts/BS PressReleaseDisplay.aspx?prid=24600,(Accessed: 4 December 2012)
Satyanand, P. N. and Raghavendran, P. (2010), “Outward FDI from India and its Policy Con-text”, Vale Columbia Center on Sustainable International Investment, New York
Sauvant, K. P., Pradhan, J. P., Chatterjee, A. and Harley, B. (2010), “The Rise of IndianMultinationals: Perspectives on Indian Outward Foreign Direct Investment”, Palgrave MacMil-lan, New York
The World Bank (2014), “World Development Indicators”, The World Bank Data Catalog,http://data.worldbank.org/indicator/NY.GDP.MKTP.KD, (accessed on 11 March 2014)
UNCTAD (2013), “World Investment Report 2013”, United Nations, New York and Geneva
Wagner, J. (2005), “Exports, Foreign Direct Investment and Productivity: Evidence from Ger-man Firm Level Data”, mimeo, University of Leuneberg
World Economic Forum (2013), “The Global Competitiveness Report 2013-2014”, WEF, Geneva
Yeaple, S. R. (2013), “Scale, Scope, and the International Expansion Strategies of MultiproductFirms”, NBER Working Paper, No. 19166
47