multistatic adaptive microwave imaging for early breast cancer
TRANSCRIPT
IEEE TRANSACTIONS ON BIOMEDICAL ENGINEERING, VOL. 53, NO. 8, AUGUST 2006 1647
Multistatic Adaptive Microwave Imaging for EarlyBreast Cancer Detection
Yao Xie*, Student Member, IEEE, Bin Guo, Student Member, IEEE, Luzhou Xu, Student Member, IEEE,Jian Li, Fellow, IEEE, and Petre Stoica, Fellow, IEEE
Abstract—We propose a new multistatic adaptive microwaveimaging (MAMI) method for early breast cancer detection. MAMIis a two-stage robust Capon beamforming (RCB) based imageformation algorithm. MAMI exhibits higher resolution, lowersidelobes, and better noise and interference rejection capabilitiesthan the existing approaches. The effectiveness of using MAMIfor breast cancer detection is demonstrated via a simulated 3-Dbreast model and several numerical examples.
Index Terms—Breast cancer detection, microwave imaging, mul-tistatic, robust capon beamforming.
I. INTRODUCTION
BREAST cancer persists to be the top threat to women’shealth. In the U.S. alone, in 2006 the number of new cases
of breast cancer in women was estimated to be 212 920.1 Asexplained in [1], early diagnosis is the key to beating the breastcancer. Hence detecting tumors at a nonpalpable early stagebecomes the philosophy that drives the breast cancer screeningtechnology. Although X-ray mammography remains the stan-dard for tumor screening, its inherent limitations are also wellrecognized [2]. Among the emerging breast cancer imagingtechnologies, microwave imaging is one of the most promisingand attractive methods. It is nonionizing, comfortable, sensitiveto tumors, and specific to malignancies. The physical basisfor microwave imaging lies in the significant contrast in thedielectric properties between the normal breast tissue and themalignant tissue at microwave frequencies [3]–[7].
During the past several decades, many modalities of mi-crowave imaging have been considered [1], including passive,hybrid, and active approaches. The passive microwave imagingapproaches mainly refer to the microwave radiometry [8], [9],which uses radiometers to measure temperature differencesbetween the normal breast tissue and tumor due to their dif-ferent metabolism rate. Hybrid methods use microwave to
Manuscript received July 11, 2005; revised March 10, 2006. This workwas supported in part by the National Science Foundation under GrantCCR-0104887 and in part by the Swedish Science Council (VR). Asteriskindicates corresponding author.
*Y. Xie is with the Department of Electrical and Computer Engineering, P.O. Box 116130, University of Florida, Gainesville, FL 32611 USA (e-mail:[email protected]).
B. Guo, L. Xu and J. Li are with the Department of Electrical and ComputerEngineering, University of Florida, Gainesville, FL 32611 USA.
P. Stoica is with the Department of Information Technology, Systems andControl Division, Uppsala University, SE-75105 Uppsala, Sweden.
Color version of Figs. 2–8 are available online at http://ieeexplore.orgDigital Object Identifier 10.1109/TBME.2006.878058
1American Cancer Society. [Online]. Available: www.cancer.org.
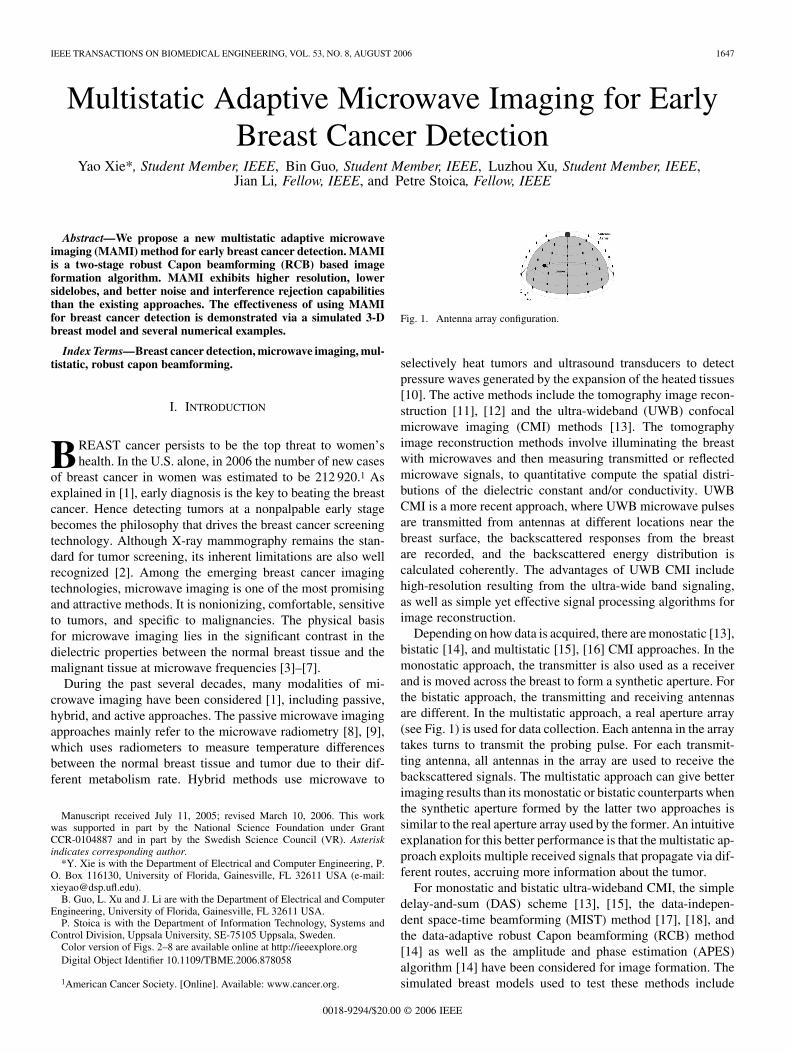
Fig. 1. Antenna array configuration.
selectively heat tumors and ultrasound transducers to detectpressure waves generated by the expansion of the heated tissues[10]. The active methods include the tomography image recon-struction [11], [12] and the ultra-wideband (UWB) confocalmicrowave imaging (CMI) methods [13]. The tomographyimage reconstruction methods involve illuminating the breastwith microwaves and then measuring transmitted or reflectedmicrowave signals, to quantitative compute the spatial distri-butions of the dielectric constant and/or conductivity. UWBCMI is a more recent approach, where UWB microwave pulsesare transmitted from antennas at different locations near thebreast surface, the backscattered responses from the breastare recorded, and the backscattered energy distribution iscalculated coherently. The advantages of UWB CMI includehigh-resolution resulting from the ultra-wide band signaling,as well as simple yet effective signal processing algorithms forimage reconstruction.
Depending on how data is acquired, there are monostatic [13],bistatic [14], and multistatic [15], [16] CMI approaches. In themonostatic approach, the transmitter is also used as a receiverand is moved across the breast to form a synthetic aperture. Forthe bistatic approach, the transmitting and receiving antennasare different. In the multistatic approach, a real aperture array(see Fig. 1) is used for data collection. Each antenna in the arraytakes turns to transmit the probing pulse. For each transmit-ting antenna, all antennas in the array are used to receive thebackscattered signals. The multistatic approach can give betterimaging results than its monostatic or bistatic counterparts whenthe synthetic aperture formed by the latter two approaches issimilar to the real aperture array used by the former. An intuitiveexplanation for this better performance is that the multistatic ap-proach exploits multiple received signals that propagate via dif-ferent routes, accruing more information about the tumor.
For monostatic and bistatic ultra-wideband CMI, the simpledelay-and-sum (DAS) scheme [13], [15], the data-indepen-dent space-time beamforming (MIST) method [17], [18], andthe data-adaptive robust Capon beamforming (RCB) method[14] as well as the amplitude and phase estimation (APES)algorithm [14] have been considered for image formation. Thesimulated breast models used to test these methods include
0018-9294/$20.00 © 2006 IEEE
1648 IEEE TRANSACTIONS ON BIOMEDICAL ENGINEERING, VOL. 53, NO. 8, AUGUST 2006
a two-dimensional (2-D) model based on a breast magneticresonance imaging scan, which was used with the monostaticDAS [13] and MIST [17], [18]; simple three-dimensional (3-D)cylindrical and planar models were used with the monostaticDAS [19], [20]; the more realistic 3-D hemispherical modelwas used with the monostatic DAS [21], [22] as well as RCBand APES [14]. For multistatic CMI, only DAS was consideredso far for image formation using the simulated 2-D [15] and3-D hemispherical breast models [22].
In this paper, we present a multistatic adaptive microwaveimaging (MAMI) method for UWB CMI for early-stage breastcancer detection. MAMI employs the data adaptive RCB algo-rithm [23], [24] in two-stages. We use it with a realistic 3-Dbreast model to demonstrate its performance. The 3-D breastmodel is simulated using the finite-difference time-domain(FDTD) [25], [26] method. We show that MAMI has muchbetter resolution and much better interference rejection capa-bility than the existing methods.
The remainder of this paper is organized as follows. InSection II, we describe the pre-processing of the receivedsignals, which precedes adaptive beamforming. Section IIIpresents the MAMI algorithm for image formation. Numer-ical examples are presented in Section IV. Finally, Section Vcontains our conclusions.
II. PROBLEM FORMULATION AND DATA PREPROCESSING
A. Problem Formulation
We consider a multistatic imaging system, where antennasare arranged on a hemisphere relatively close to the breast skin,at known locations ( ). Here,
denotes the transpose. The configuration of the arrayis shown in Fig. 1. The antennas are arranged on layerswith antennas per layer, where . Each an-tenna takes turns to transmit an UWB probing pulse whileall of the antennas record the backscattered signals. Let
, denote the backscat-tered signal generated by the probing pulse sent by the thtransmitting antenna and received by the th receiving antenna.The 3 1 vectors and denote the locations of the thtransmitting and th receiving antennas, respectively, anddenotes an imaging location.
Our goal herein is to form a 3-D image of the backscatteredenergy on a grid of points within the breast, with thegoal of detecting the tumor. In our algorithm, the locationis varied to cover the entire grid points of the breast model. Thebackscattered energy is estimated from the complete receiveddata for each location of interest.
B. Data Preprocessing
Before employing the MAMI for image formation, we pre-process the received signals to remove, as much as possible,backscattered signals (other than the tumor response), and tocompensate for the propagation loss of the signal amplitude.
First, to remove the undesired content in the received sig-nals, we use a removal method similar to that in [13]. Notethat the received signals contain the tumor responses but also
other backscattered signals, such as the incident pulse, reflec-tions from the skin, fatty and glandular tissues and the chestwall, as well as parasitic signals due to the couplings among theantennas. In fact the undesired signals are usually much strongerthan the tumor responses. A calibration signal is formed as anaverage of the signals containing similar strong undesired sig-nals. Then the calibration signal is subtracted out from these sig-nals to remove the undesired signals as much as possible. Thissimple removal method could be improved, but the residual ofundesired content can be tolerated by our robust adaptive al-gorithm to some extent. Advanced methods such as those pre-sented in [17] can be used here and a better performance maybe achieved. Let denote the signal after subtracting outthe calibration signal.
In the second step, to process the signals coherently, we time-shift by a number of samples to align the returnsfrom the focal point (at location ). The discrete time delays forthe received signals can be determined from the correspondingtransmitter and receiver locations , and the imaging lo-cation of interest
(1)
where stands for rounding to the greatest integer less than ,denotes the Euclidean norm, is the approximate velocity
of the microwaves propagating in the normal breast tissues, andis the sampling interval, which is assumed to be well below
the Nyquist interval. Note that (1) assumes that the breast tissueis homogeneous, which in fact is not true. However, this approx-imation causes little performance degradations when used withour robust adaptive algorithm. Let be the time shiftedsignal. Then,
(2)
where is the maximum round-trip discrete-time delay re-quired for a pulse to propagate from the transmitter to the skinor chest wall and back to the receiver. Hence defines themaximum duration of interest of the received signal.
Next, we apply a time-window to the time-shifted signals.The window is given by
otherwise(3)
where is the approximate time duration of the backscat-tered signal from the focal point . Note that is determinedby the duration of the known transmitted pulse and the samplinginterval. Let , , denote the windowedsignal.
Finally, we consider the effects of propagation attenuation inthe lossy breast tissues. The major attenuation is caused by adecrease in the amplitude of the spherical wave as it expands.To eliminate this attenuation, we multiply each received signalby a suitable compensation factor. The compensation factor can
XIE et al.: MULTISTATIC ADAPTIVE MICROWAVE IMAGING FOR EARLY BREAST CANCER DETECTION 1649
be determined from the locations of the transmitter and receiver,, , and of the focal point, , as follows:
(4)
Then the compensated signal is given by
(5)
We remark that since our problem is interference (due to un-desired reflections) limited, rather than noise limited, the loss ofSNR caused by the aforementioned attenuation compensation isinsignificant.
III. MAMI
MAMI is a two-stage adaptive imaging method. First, thedata-adaptive RCB algorithm is used spatially to obtain a vectorof multiple backscattered waveforms for each probing signal.Second, RCB is employed to recover a scalar waveform basedon the estimated vector of waveforms obtained in the first stage.The estimated scalar waveform is used to compute the backscat-tered energy .
A. MAMI-Stage I
For notational simplicity, the dependence of on thegeneric location vector is omitted in what follows. Considerthe following model for the preprocessed signal vector:
(6)
where . The scalar denotesthe backscattered signal (from the focal point at location )corresponding to the probing signal from the th transmittingantenna. The vector in (6) is referred to as the array steeringvector; note that is approximately equal to since allthe signals have been aligned temporally and their attenuationscompensated for. The vector denotes the residual term atpoint , which includes the unmodeled noise and interferencedue to undesired reflections.
There are two assumptions with this model. First, we assumethat the steering vector varies with , and is nearly a constantwith respect to . Second, we assume that the backscatteredsignal waveform depends only on but not on , the th re-ceiving antenna. The truth, however, is that the steering vector isnot exactly known and changes slightly with both and due toarray calibration errors and other factors. The signal waveformshould also vary with both and , due to the frequency-de-pendent lossy medium within the breast [27]. These assump-tions simplify the problem slightly and cause little performancedegradations when used with robust adaptive algorithms. By as-suming that the true steering vector is time-varying, we allocatemore “room” for robustness.
Due to the errors induced by waveform distortions, antennalocation uncertainties, time-delay roundoffs, etc., the steering
vector will be imprecise in practice, in the sense that theelements of may differ slightly from 1. This uncertaintyin the steering vector motivates us to consider using RCB forwaveform estimation. To make the paper as self-contained aspossible, we give a review of the RCB algorithm. RCB is de-rived from the Standard Capon Beamforming (SCB) algorithm.SCB aims at estimating the signal waveform (or signal energy),by choosing a weight vector for the data, which minimizes thearray output power and passes the signal of interest without anydistortion. To improve the performance of SCB in the presenceof steering vector errors and in the case of a low number of snap-shots, RCB makes an explicit use of an uncertainty set for thearray steering vector. Therefore, we assume that the true steeringvector lies in the vicinity of the assumed steering vector
, and that the only knowledge we have aboutis that
(7)
where is used to describe the uncertainty of about , thechoice of which will be discussed later on.
In Stage I, for a given time , , we canestimate the true steering vector via the following covari-ance fitting approach [23] of RCB
(8)
where is the power of the “signalof interest,” and
(9)
is the sample covariance matrix with
(10)Observe that both the signal power and the steeringvector are treated as unknowns in (8). Hence there is a“scaling ambiguity” between these two unknowns (see [28]),in the sense that and(for any ) give the same term . Toeliminate this ambiguity, we later impose the norm constraint
(11)
For any given , the solution to (8) is [28]
(12)
1650 IEEE TRANSACTIONS ON BIOMEDICAL ENGINEERING, VOL. 53, NO. 8, AUGUST 2006
Hence, (8) can be reduced to the following quadratic optimiza-tion problem with quadratic constraint:
(13)To exclude the trivial solution , we need to assumethat the uncertainty parameter is sufficiently small
(14)
To determine the solution of (13) under (14), we use the La-grange multiplier methodology and consider the following func-tion:
(15)where is the real-valued Lagrange multiplier satisfying
, so that (15) can be minimized with respectto . For the unconstrained minimization of , fora fixed , the solution is given by
(16)
where the matrix inversion lemma [14] has been used to obtainthe second equality. Let denote the uncertainty set definedin (7). It can be shown that the solution belongs to theboundary of and, hence, satisfies
(17)
By using (16) in (17), we can obtain the Lagrange multiplier asthe solution to the constraint equation
(18)
Let the eigendecomposition of be
(19)
where the columns of are the eigenvectors of and thediagonal elements of the diagonal matrix ,
, are the corresponding eigenvalues. Here, the dependenciesof and on are omitted for simplicity. Let and
denote its th element. Then, (18) can be rewritten as
(20)
Note that is a monotonically decreasing function of .Also, it is clear that by (14), and
. Hence, there is a unique solution to (20), whichcan be solved efficiently, say, by the Newton’s method. Inserting
in (16), we readily determine the solution . To eliminatethe aforementioned “scaling ambiguity,” by (11), we replace thesolution with
(21)
To obtain the signal waveform, we apply a weight vector tothe received signals. The weight vector is determined by usingthe estimated steering vector in the weight vector expres-sion formula of SCB (see, e.g., [28]). The weight vector used inStage I of MAMI has the form given by
(22)
(23)
The equality to obtain (23) is due to inserting (16) and (21)in (22). Note that (23) has a diagonal loading form. Diagonalloading is a popular approach to mitigate the performance degra-dations of SCB in the presence of steering vector errors or smallsample size problems. The distinction between RCB and theconventional diagonal loading methods is that RCB directly de-termines the optimal diagonal loading level needed for a givensteering vector uncertainty set. Note that by diagonal loading,we can even allow the sample covariance matrix to be rank-de-ficient.
The beamformer output can be written as a vector
(24)
Here, contains the waveform estimates at of thebackscattered signals (from the focal point ) due to all theprobing signals indexed from 1 to . Repeating the aboveprocess from to , we obtain the completemultiple backscattered signal waveform estimates.
Note that, at this stage, we have obtained estimates ofthe backscattered waveforms corresponding to the probingsignals sent by each of the transmitting antenna. Since theseprobing signals are UWB pulses with the same waveform, wecan assume that the backscattered signal waveforms fromdue to all the probing signals are (nearly) identical. To estimatethe backscattering energy coherently, in the next stage, ascalar waveform is recovered from these estimated
-dimensional signal waveform vectors .

XIE et al.: MULTISTATIC ADAPTIVE MICROWAVE IMAGING FOR EARLY BREAST CANCER DETECTION 1651
B. MAMI-Stage II
In the second stage of MAMI, the signal waveform vector, , is treated as a snapshot from an -ele-
ment (fictitious) “array”
(25)
where is approximately equal to for the same reasonas in Stage I. However, the “steering vector” may again beimprecise, and hence RCB is needed again. In (25), denotesthe nominal backscattered signal waveform, due to all probingsignals, and each element of contains the differences be-tween the corresponding element in and . Parallelingthe description of Stage I, we estimate via the followingRCB formulation:
(26)
where is the power of the signal ofinterest, is a user parameter, and is the following temporalsample covariance matrix:
(27)
Note that here we can use the same assumed steering vector asin Stage I. To eliminate the scaling ambiguity, we again imposethe norm constraint
(28)
Similarly to Stage I, the solution to (26) is
(29)
where is the corresponding Lagrange multiplier used insolving (26), which can be determined similarly to obtaining .Similar to (28), we replace with
(30)
Therefore, the adaptive weight vector for Stage II isdetermined by a formula similar to (23)
(31)
(32)
where (32) shows again the diagonal loading form of the weightvector.
The weighted output is the estimate of
(33)
Finally, the backscattered energy for the focal point is com-puted as
(34)
In summary, the MAMI method can be described as follows.
Step 1: Preprocess the received signal, i.e., remove theunwanted content, time-shift, apply the time-window andcompensate for the propagation loss.
Step 2: From the preprocessed signals, obtain multiplebackscattered signal waveform estimates via RCB.
Step 3: Estimate the scalar waveform from via RCB.Finally compute the backscattered energy via (34).
For RCB used in Stages I and II of MAMI, the choice ofand should be made as small as possible. It can be experimen-tally observed that as or increases, the resolution of RCBdecreases. When or is large, the ability of RCB to suppressinterferences that are close to the signal of interest degrades.Also, the smaller the sample size or the larger the steeringvector and the system errors, the larger should and be chosen[23], [24]. Such qualitative guidelines are usually sufficient forthe choice of uncertainty size parameters, as the performance ofRCB dose not depend very critically on them (as long as theytake on “reasonable values”) [28]. In our numerical examples,we choose two reasonable initial values of them and then makeadjustment experimentally to obtain the best image quality.
Regarding the computational complexity of MAMI, themajor computational cost of MAMI is due to RCB used inStages I and II. The major flop count of using RCB comes fromthe eigen-decomposition of the sample covariance matrices[23], [24] ( for Stage I and for Stage II), eachrequiring flops. Also, RCB is used times in StageI and once in Stage II. Hence MAMI requires flopsfor a given focal point, which is larger than the flopsof DAS.
IV. NUMERICAL EXAMPLES
A. Breast Model and Data Acquisition
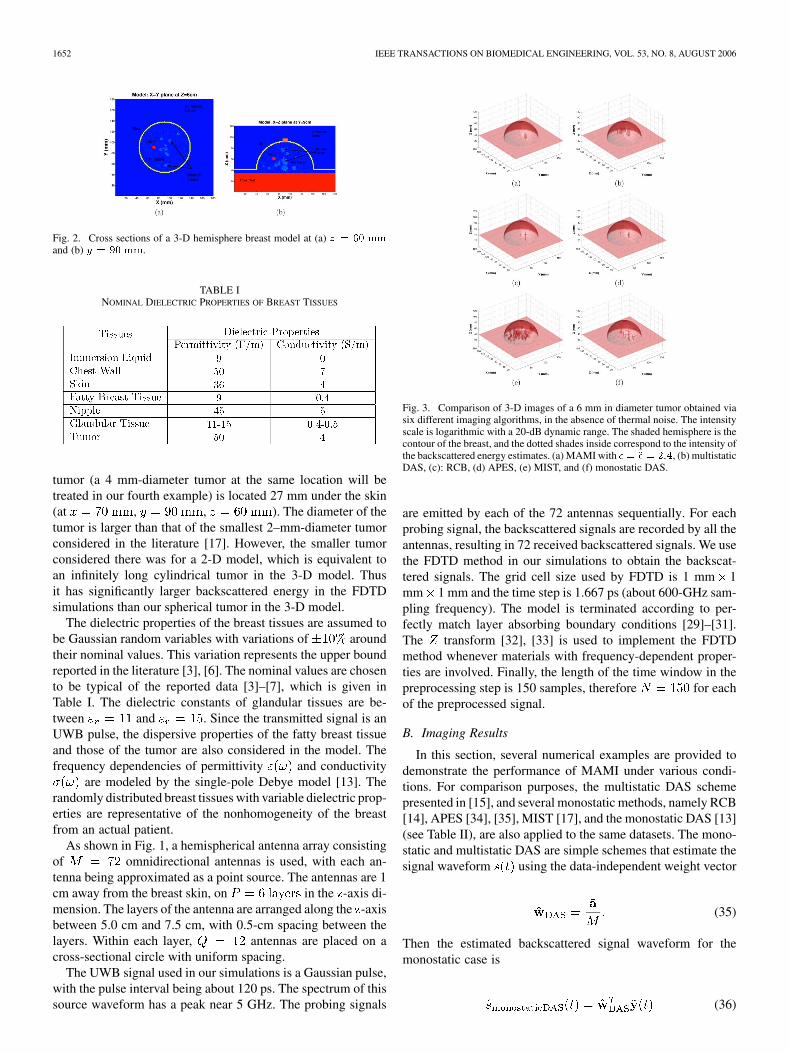
In our numerical examples, we consider a 3-D simulatedbreast model. Two cross sections of the model are shown inFig. 2. The 3-D model includes randomly distributed fattybreast tissue, glandular tissue, 2-mm-thick skin, as well asthe nipple and chest wall. To reduce the reflections from theskin, the breast model is immersed in a lossless liquid withpermittivity similar to that of the breast fatty tissue. The breastis a hemisphere with 100 mm in diameter. A 6 mm-diameter
1652 IEEE TRANSACTIONS ON BIOMEDICAL ENGINEERING, VOL. 53, NO. 8, AUGUST 2006
Fig. 2. Cross sections of a 3-D hemisphere breast model at (a) z = 60 mm
and (b) y = 90 mm.
TABLE INOMINAL DIELECTRIC PROPERTIES OF BREAST TISSUES
tumor (a 4 mm-diameter tumor at the same location will betreated in our fourth example) is located 27 mm under the skin(at , , ). The diameter of thetumor is larger than that of the smallest 2–mm-diameter tumorconsidered in the literature [17]. However, the smaller tumorconsidered there was for a 2-D model, which is equivalent toan infinitely long cylindrical tumor in the 3-D model. Thusit has significantly larger backscattered energy in the FDTDsimulations than our spherical tumor in the 3-D model.
The dielectric properties of the breast tissues are assumed tobe Gaussian random variables with variations of aroundtheir nominal values. This variation represents the upper boundreported in the literature [3], [6]. The nominal values are chosento be typical of the reported data [3]–[7], which is given inTable I. The dielectric constants of glandular tissues are be-tween and . Since the transmitted signal is anUWB pulse, the dispersive properties of the fatty breast tissueand those of the tumor are also considered in the model. Thefrequency dependencies of permittivity and conductivity
are modeled by the single-pole Debye model [13]. Therandomly distributed breast tissues with variable dielectric prop-erties are representative of the nonhomogeneity of the breastfrom an actual patient.
As shown in Fig. 1, a hemispherical antenna array consistingof omnidirectional antennas is used, with each an-tenna being approximated as a point source. The antennas are 1cm away from the breast skin, on in the -axis di-mension. The layers of the antenna are arranged along the -axisbetween 5.0 cm and 7.5 cm, with 0.5-cm spacing between thelayers. Within each layer, antennas are placed on across-sectional circle with uniform spacing.
The UWB signal used in our simulations is a Gaussian pulse,with the pulse interval being about 120 ps. The spectrum of thissource waveform has a peak near 5 GHz. The probing signals
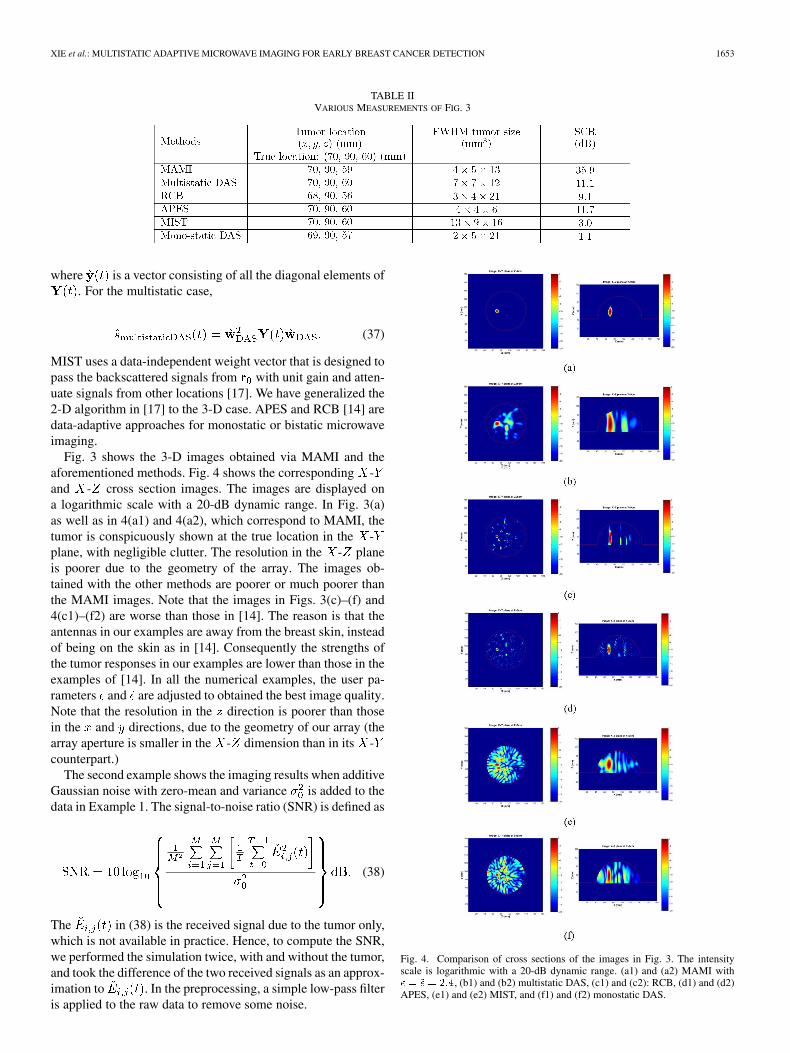
Fig. 3. Comparison of 3-D images of a 6 mm in diameter tumor obtained viasix different imaging algorithms, in the absence of thermal noise. The intensityscale is logarithmic with a 20-dB dynamic range. The shaded hemisphere is thecontour of the breast, and the dotted shades inside correspond to the intensity ofthe backscattered energy estimates. (a) MAMI with � = ~� = 2:4, (b) multistaticDAS, (c): RCB, (d) APES, (e) MIST, and (f) monostatic DAS.
are emitted by each of the 72 antennas sequentially. For eachprobing signal, the backscattered signals are recorded by all theantennas, resulting in 72 received backscattered signals. We usethe FDTD method in our simulations to obtain the backscat-tered signals. The grid cell size used by FDTD is 1 mm 1mm 1 mm and the time step is 1.667 ps (about 600-GHz sam-pling frequency). The model is terminated according to per-fectly match layer absorbing boundary conditions [29]–[31].The transform [32], [33] is used to implement the FDTDmethod whenever materials with frequency-dependent proper-ties are involved. Finally, the length of the time window in thepreprocessing step is 150 samples, therefore for eachof the preprocessed signal.
B. Imaging Results
In this section, several numerical examples are provided todemonstrate the performance of MAMI under various condi-tions. For comparison purposes, the multistatic DAS schemepresented in [15], and several monostatic methods, namely RCB[14], APES [34], [35], MIST [17], and the monostatic DAS [13](see Table II), are also applied to the same datasets. The mono-static and multistatic DAS are simple schemes that estimate thesignal waveform using the data-independent weight vector
(35)
Then the estimated backscattered signal waveform for themonostatic case is
(36)
XIE et al.: MULTISTATIC ADAPTIVE MICROWAVE IMAGING FOR EARLY BREAST CANCER DETECTION 1653
TABLE IIVARIOUS MEASUREMENTS OF FIG. 3
where is a vector consisting of all the diagonal elements of. For the multistatic case,
(37)
MIST uses a data-independent weight vector that is designed topass the backscattered signals from with unit gain and atten-uate signals from other locations [17]. We have generalized the2-D algorithm in [17] to the 3-D case. APES and RCB [14] aredata-adaptive approaches for monostatic or bistatic microwaveimaging.
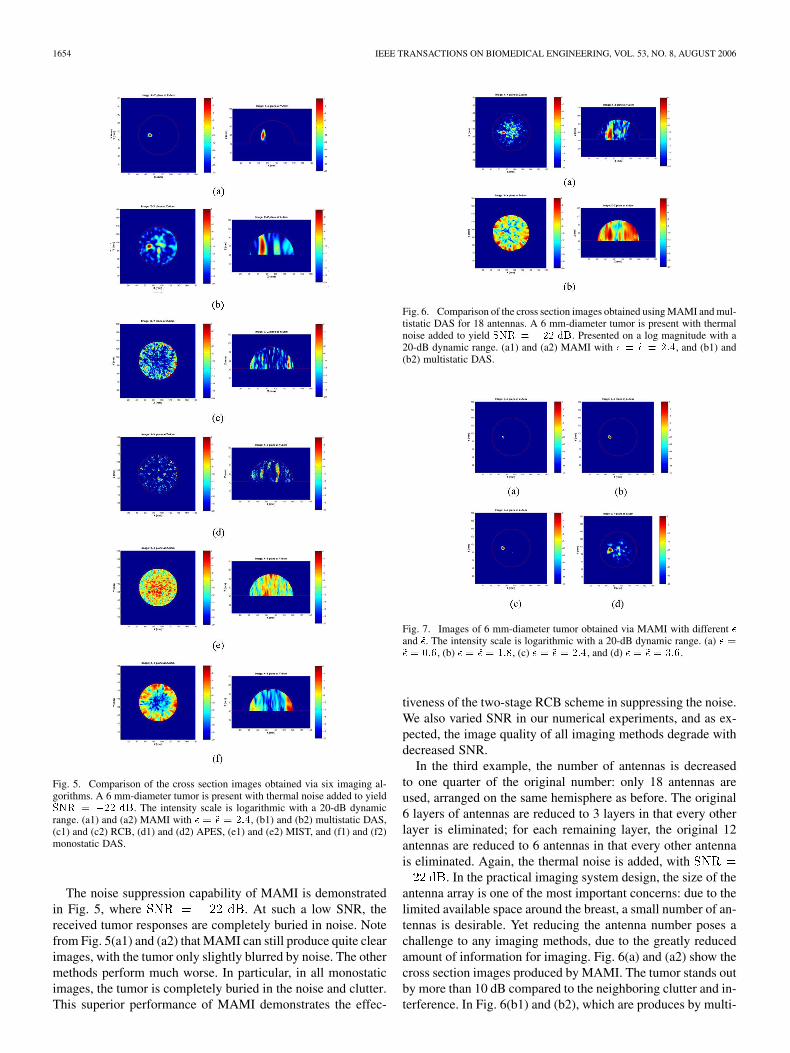
Fig. 3 shows the 3-D images obtained via MAMI and theaforementioned methods. Fig. 4 shows the corresponding -and - cross section images. The images are displayed ona logarithmic scale with a 20-dB dynamic range. In Fig. 3(a)as well as in 4(a1) and 4(a2), which correspond to MAMI, thetumor is conspicuously shown at the true location in the -plane, with negligible clutter. The resolution in the - planeis poorer due to the geometry of the array. The images ob-tained with the other methods are poorer or much poorer thanthe MAMI images. Note that the images in Figs. 3(c)–(f) and4(c1)–(f2) are worse than those in [14]. The reason is that theantennas in our examples are away from the breast skin, insteadof being on the skin as in [14]. Consequently the strengths ofthe tumor responses in our examples are lower than those in theexamples of [14]. In all the numerical examples, the user pa-rameters and are adjusted to obtained the best image quality.Note that the resolution in the direction is poorer than thosein the and directions, due to the geometry of our array (thearray aperture is smaller in the - dimension than in its -counterpart.)
The second example shows the imaging results when additiveGaussian noise with zero-mean and variance is added to thedata in Example 1. The signal-to-noise ratio (SNR) is defined as
(38)
The in (38) is the received signal due to the tumor only,which is not available in practice. Hence, to compute the SNR,we performed the simulation twice, with and without the tumor,and took the difference of the two received signals as an approx-imation to . In the preprocessing, a simple low-pass filteris applied to the raw data to remove some noise.
Fig. 4. Comparison of cross sections of the images in Fig. 3. The intensityscale is logarithmic with a 20-dB dynamic range. (a1) and (a2) MAMI with� = ~� = 2:4, (b1) and (b2) multistatic DAS, (c1) and (c2): RCB, (d1) and (d2)APES, (e1) and (e2) MIST, and (f1) and (f2) monostatic DAS.
1654 IEEE TRANSACTIONS ON BIOMEDICAL ENGINEERING, VOL. 53, NO. 8, AUGUST 2006
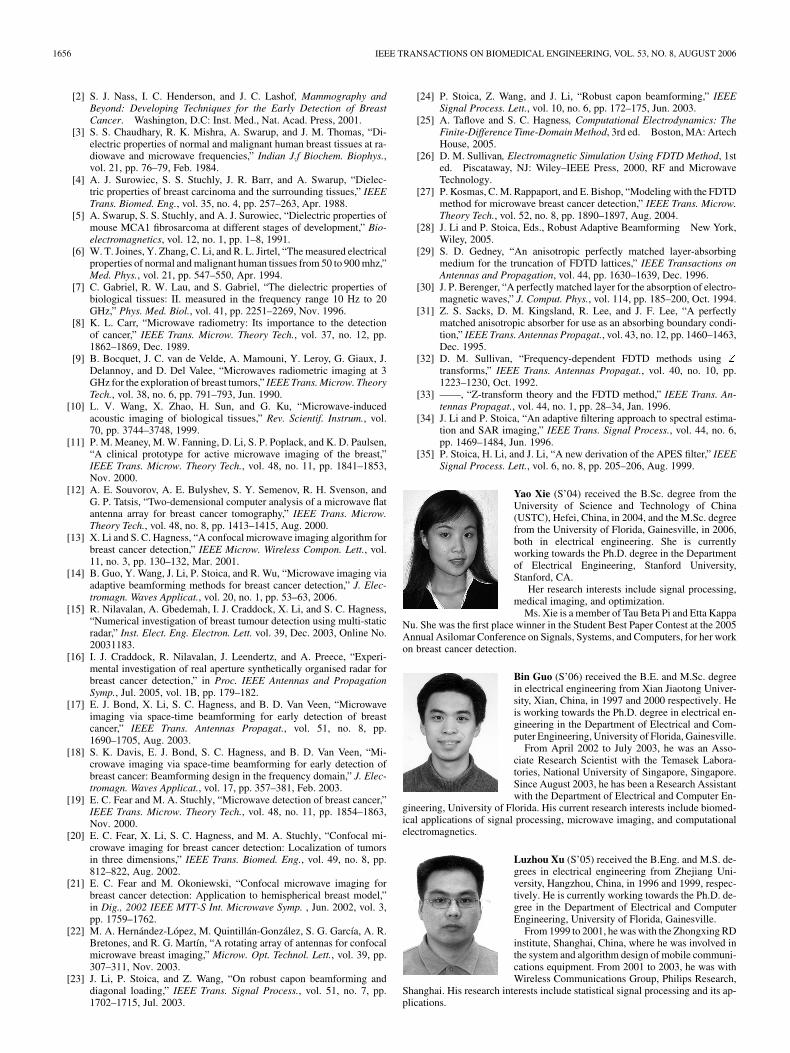
Fig. 5. Comparison of the cross section images obtained via six imaging al-gorithms. A 6 mm-diameter tumor is present with thermal noise added to yieldSNR = �22 dB. The intensity scale is logarithmic with a 20-dB dynamicrange. (a1) and (a2) MAMI with � = ~� = 2:4, (b1) and (b2) multistatic DAS,(c1) and (c2) RCB, (d1) and (d2) APES, (e1) and (e2) MIST, and (f1) and (f2)monostatic DAS.
The noise suppression capability of MAMI is demonstratedin Fig. 5, where . At such a low SNR, thereceived tumor responses are completely buried in noise. Notefrom Fig. 5(a1) and (a2) that MAMI can still produce quite clearimages, with the tumor only slightly blurred by noise. The othermethods perform much worse. In particular, in all monostaticimages, the tumor is completely buried in the noise and clutter.This superior performance of MAMI demonstrates the effec-
Fig. 6. Comparison of the cross section images obtained using MAMI and mul-tistatic DAS for 18 antennas. A 6 mm-diameter tumor is present with thermalnoise added to yield SNR = �22 dB. Presented on a log magnitude with a20-dB dynamic range. (a1) and (a2) MAMI with � = ~� = 2:4, and (b1) and(b2) multistatic DAS.
Fig. 7. Images of 6 mm-diameter tumor obtained via MAMI with different �
and ~�. The intensity scale is logarithmic with a 20-dB dynamic range. (a) � =
~� = 0:6, (b) � = ~� = 1:8, (c) � = ~� = 2:4, and (d) � = ~� = 3:6.
tiveness of the two-stage RCB scheme in suppressing the noise.We also varied SNR in our numerical experiments, and as ex-pected, the image quality of all imaging methods degrade withdecreased SNR.
In the third example, the number of antennas is decreasedto one quarter of the original number: only 18 antennas areused, arranged on the same hemisphere as before. The original6 layers of antennas are reduced to 3 layers in that every otherlayer is eliminated; for each remaining layer, the original 12antennas are reduced to 6 antennas in that every other antennais eliminated. Again, the thermal noise is added, with
. In the practical imaging system design, the size of theantenna array is one of the most important concerns: due to thelimited available space around the breast, a small number of an-tennas is desirable. Yet reducing the antenna number poses achallenge to any imaging methods, due to the greatly reducedamount of information for imaging. Fig. 6(a) and (a2) show thecross section images produced by MAMI. The tumor stands outby more than 10 dB compared to the neighboring clutter and in-terference. In Fig. 6(b1) and (b2), which are produces by multi-

XIE et al.: MULTISTATIC ADAPTIVE MICROWAVE IMAGING FOR EARLY BREAST CANCER DETECTION 1655
TABLE IIIVARIOUS MEASUREMENTS OF THE 2-D X-Y CROSS SECTION IMAGES IN FIG. 4–8
Fig. 8. Cross section images in the presence of a 4 mm-diameter tumor, in theabsence of thermal noise, and with 72 antennas. The intensity scale is loga-rithmic with a 20-dB dynamic range. (a1) and (a2) MAMI with � = ~� = 2:4,(b1) and (b2) multistatic DAS, (c1) and (c2) RCB, (d1) and (d2) APES, (e1) and(e2) MIST, and (f1) and (f2) monostatic DAS.
static DAS, the tumor is complete buried in clutter. The qualityof the images produced by MAMI using 18 antennas is compa-
rable to that corresponding to the best monostatic methods using72 antennas.
In the fourth example, we vary and . Fig. 7(a)–(c) showsthe images of the 6-mm-diameter tumor formed by MAMI withdifferent and (here we choose for simplicity). We notethat the image quality does not vary significantly with and .
The fifth example is similar to the first one except that thetumor size is now reduced to 4 mm in diameter. The backscat-tered microwave energy is much smaller in this case since thebackscattered energy from tumor is proportional to the squareof the tumor diameter. Fig. 8(a1) and (a2) show the MAMI im-ages, where the tumor is still observable, about 10 dB higherthan the neighboring clutter. The other methods, as shown inFig. 8(b1)–(f2), give much poorer performance.
We measure the tumor localization accuracy based on themaximum pixel value in the image, and measure the tumor sizebased on the full-width at half-maximum the tumor response[20]. To quantify the image quality, we use the signal-to-clutterratio [20], which is defined as the ratio of the maximum tumorresponse to the maximum clutter value in the same image. Themaximum clutter value is determined as the maximum pixelvalue outside the volume containing the tumor. Such measure-ments for the images in Figs. 3–8 are summarized in Tables IIand III.
V. CONCLUSION
We have considered adaptive multistatic microwave imagingfor breast cancer detection. A real aperture array is used for datacollection. Each antenna in the array takes turns to transmit anultra-wideband pulse while all antennas receive the backscat-tered signals. The data-adaptive algorithm, referred to as theMAMI algorithm, is a two-stage robust Capon beamformingalgorithm. Using a 3-D breast model simulated via the finite-difference time-domain (FDTD) method, we have shown thatMAMI exhibits higher resolution, lower sidelobes, and betternoise and interference rejection capability than other existingapproaches.
ACKNOWLEDGMENT
The authors would like to thank Mr. W. Roberts for hishelpful comments on the paper.
REFERENCES
[1] E. C. Fear, S. C. Hagness, P. M. Meaney, M. Okoniewski, and M. A.Stuchly, “Enhancing breast tumor detection with near-field imaging,”IEEE Microw. Magazine, vol. 3, no. 1, pp. 48–56, Mar. 2002.
1656 IEEE TRANSACTIONS ON BIOMEDICAL ENGINEERING, VOL. 53, NO. 8, AUGUST 2006
[2] S. J. Nass, I. C. Henderson, and J. C. Lashof, Mammography andBeyond: Developing Techniques for the Early Detection of BreastCancer. Washington, D.C: Inst. Med., Nat. Acad. Press, 2001.
[3] S. S. Chaudhary, R. K. Mishra, A. Swarup, and J. M. Thomas, “Di-electric properties of normal and malignant human breast tissues at ra-diowave and microwave frequencies,” Indian J.f Biochem. Biophys.,vol. 21, pp. 76–79, Feb. 1984.
[4] A. J. Surowiec, S. S. Stuchly, J. R. Barr, and A. Swarup, “Dielec-tric properties of breast carcinoma and the surrounding tissues,” IEEETrans. Biomed. Eng., vol. 35, no. 4, pp. 257–263, Apr. 1988.
[5] A. Swarup, S. S. Stuchly, and A. J. Surowiec, “Dielectric properties ofmouse MCA1 fibrosarcoma at different stages of development,” Bio-electromagnetics, vol. 12, no. 1, pp. 1–8, 1991.
[6] W. T. Joines, Y. Zhang, C. Li, and R. L. Jirtel, “The measured electricalproperties of normal and malignant human tissues from 50 to 900 mhz,”Med. Phys., vol. 21, pp. 547–550, Apr. 1994.
[7] C. Gabriel, R. W. Lau, and S. Gabriel, “The dielectric properties ofbiological tissues: II. measured in the frequency range 10 Hz to 20GHz,” Phys. Med. Biol., vol. 41, pp. 2251–2269, Nov. 1996.
[8] K. L. Carr, “Microwave radiometry: Its importance to the detectionof cancer,” IEEE Trans. Microw. Theory Tech., vol. 37, no. 12, pp.1862–1869, Dec. 1989.
[9] B. Bocquet, J. C. van de Velde, A. Mamouni, Y. Leroy, G. Giaux, J.Delannoy, and D. Del Valee, “Microwaves radiometric imaging at 3GHz for the exploration of breast tumors,” IEEE Trans. Microw. TheoryTech., vol. 38, no. 6, pp. 791–793, Jun. 1990.
[10] L. V. Wang, X. Zhao, H. Sun, and G. Ku, “Microwave-inducedacoustic imaging of biological tissues,” Rev. Scientif. Instrum., vol.70, pp. 3744–3748, 1999.
[11] P. M. Meaney, M. W. Fanning, D. Li, S. P. Poplack, and K. D. Paulsen,“A clinical prototype for active microwave imaging of the breast,”IEEE Trans. Microw. Theory Tech., vol. 48, no. 11, pp. 1841–1853,Nov. 2000.
[12] A. E. Souvorov, A. E. Bulyshev, S. Y. Semenov, R. H. Svenson, andG. P. Tatsis, “Two-demensional computer analysis of a microwave flatantenna array for breast cancer tomography,” IEEE Trans. Microw.Theory Tech., vol. 48, no. 8, pp. 1413–1415, Aug. 2000.
[13] X. Li and S. C. Hagness, “A confocal microwave imaging algorithm forbreast cancer detection,” IEEE Microw. Wireless Compon. Lett., vol.11, no. 3, pp. 130–132, Mar. 2001.
[14] B. Guo, Y. Wang, J. Li, P. Stoica, and R. Wu, “Microwave imaging viaadaptive beamforming methods for breast cancer detection,” J. Elec-tromagn. Waves Applicat., vol. 20, no. 1, pp. 53–63, 2006.
[15] R. Nilavalan, A. Gbedemah, I. J. Craddock, X. Li, and S. C. Hagness,“Numerical investigation of breast tumour detection using multi-staticradar,” Inst. Elect. Eng. Electron. Lett. vol. 39, Dec. 2003, Online No.20031183.
[16] I. J. Craddock, R. Nilavalan, J. Leendertz, and A. Preece, “Experi-mental investigation of real aperture synthetically organised radar forbreast cancer detection,” in Proc. IEEE Antennas and PropagationSymp., Jul. 2005, vol. 1B, pp. 179–182.
[17] E. J. Bond, X. Li, S. C. Hagness, and B. D. Van Veen, “Microwaveimaging via space-time beamforming for early detection of breastcancer,” IEEE Trans. Antennas Propagat., vol. 51, no. 8, pp.1690–1705, Aug. 2003.
[18] S. K. Davis, E. J. Bond, S. C. Hagness, and B. D. Van Veen, “Mi-crowave imaging via space-time beamforming for early detection ofbreast cancer: Beamforming design in the frequency domain,” J. Elec-tromagn. Waves Applicat., vol. 17, pp. 357–381, Feb. 2003.
[19] E. C. Fear and M. A. Stuchly, “Microwave detection of breast cancer,”IEEE Trans. Microw. Theory Tech., vol. 48, no. 11, pp. 1854–1863,Nov. 2000.
[20] E. C. Fear, X. Li, S. C. Hagness, and M. A. Stuchly, “Confocal mi-crowave imaging for breast cancer detection: Localization of tumorsin three dimensions,” IEEE Trans. Biomed. Eng., vol. 49, no. 8, pp.812–822, Aug. 2002.
[21] E. C. Fear and M. Okoniewski, “Confocal microwave imaging forbreast cancer detection: Application to hemispherical breast model,”in Dig., 2002 IEEE MTT-S Int. Microwave Symp. , Jun. 2002, vol. 3,pp. 1759–1762.
[22] M. A. Hernández-López, M. Quintillán-González, S. G. García, A. R.Bretones, and R. G. Martín, “A rotating array of antennas for confocalmicrowave breast imaging,” Microw. Opt. Technol. Lett., vol. 39, pp.307–311, Nov. 2003.
[23] J. Li, P. Stoica, and Z. Wang, “On robust capon beamforming anddiagonal loading,” IEEE Trans. Signal Process., vol. 51, no. 7, pp.1702–1715, Jul. 2003.
[24] P. Stoica, Z. Wang, and J. Li, “Robust capon beamforming,” IEEESignal Process. Lett., vol. 10, no. 6, pp. 172–175, Jun. 2003.
[25] A. Taflove and S. C. Hagness, Computational Electrodynamics: TheFinite-Difference Time-Domain Method, 3rd ed. Boston, MA: ArtechHouse, 2005.
[26] D. M. Sullivan, Electromagnetic Simulation Using FDTD Method, 1sted. Piscataway, NJ: Wiley–IEEE Press, 2000, RF and MicrowaveTechnology.
[27] P. Kosmas, C. M. Rappaport, and E. Bishop, “Modeling with the FDTDmethod for microwave breast cancer detection,” IEEE Trans. Microw.Theory Tech., vol. 52, no. 8, pp. 1890–1897, Aug. 2004.
[28] J. Li and P. Stoica, Eds., Robust Adaptive Beamforming New York,Wiley, 2005.
[29] S. D. Gedney, “An anisotropic perfectly matched layer-absorbingmedium for the truncation of FDTD lattices,” IEEE Transactions onAntennas and Propagation, vol. 44, pp. 1630–1639, Dec. 1996.
[30] J. P. Berenger, “A perfectly matched layer for the absorption of electro-magnetic waves,” J. Comput. Phys., vol. 114, pp. 185–200, Oct. 1994.
[31] Z. S. Sacks, D. M. Kingsland, R. Lee, and J. F. Lee, “A perfectlymatched anisotropic absorber for use as an absorbing boundary condi-tion,” IEEE Trans. Antennas Propagat., vol. 43, no. 12, pp. 1460–1463,Dec. 1995.
[32] D. M. Sullivan, “Frequency-dependent FDTD methods using Z
transforms,” IEEE Trans. Antennas Propagat., vol. 40, no. 10, pp.1223–1230, Oct. 1992.
[33] ——, “Z-transform theory and the FDTD method,” IEEE Trans. An-tennas Propagat., vol. 44, no. 1, pp. 28–34, Jan. 1996.
[34] J. Li and P. Stoica, “An adaptive filtering approach to spectral estima-tion and SAR imaging,” IEEE Trans. Signal Process., vol. 44, no. 6,pp. 1469–1484, Jun. 1996.
[35] P. Stoica, H. Li, and J. Li, “A new derivation of the APES filter,” IEEESignal Process. Lett., vol. 6, no. 8, pp. 205–206, Aug. 1999.
Yao Xie (S’04) received the B.Sc. degree from theUniversity of Science and Technology of China(USTC), Hefei, China, in 2004, and the M.Sc. degreefrom the University of Florida, Gainesville, in 2006,both in electrical engineering. She is currentlyworking towards the Ph.D. degree in the Departmentof Electrical Engineering, Stanford University,Stanford, CA.
Her research interests include signal processing,medical imaging, and optimization.
Ms. Xie is a member of Tau Beta Pi and Etta KappaNu. She was the first place winner in the Student Best Paper Contest at the 2005Annual Asilomar Conference on Signals, Systems, and Computers, for her workon breast cancer detection.
Bin Guo (S’06) received the B.E. and M.Sc. degreein electrical engineering from Xian Jiaotong Univer-sity, Xian, China, in 1997 and 2000 respectively. Heis working towards the Ph.D. degree in electrical en-gineering in the Department of Electrical and Com-puter Engineering, University of Florida, Gainesville.
From April 2002 to July 2003, he was an Asso-ciate Research Scientist with the Temasek Labora-tories, National University of Singapore, Singapore.Since August 2003, he has been a Research Assistantwith the Department of Electrical and Computer En-
gineering, University of Florida. His current research interests include biomed-ical applications of signal processing, microwave imaging, and computationalelectromagnetics.
Luzhou Xu (S’05) received the B.Eng. and M.S. de-grees in electrical engineering from Zhejiang Uni-versity, Hangzhou, China, in 1996 and 1999, respec-tively. He is currently working towards the Ph.D. de-gree in the Department of Electrical and ComputerEngineering, University of Florida, Gainesville.
From 1999 to 2001, he was with the Zhongxing RDinstitute, Shanghai, China, where he was involved inthe system and algorithm design of mobile communi-cations equipment. From 2001 to 2003, he was withWireless Communications Group, Philips Research,
Shanghai. His research interests include statistical signal processing and its ap-plications.

XIE et al.: MULTISTATIC ADAPTIVE MICROWAVE IMAGING FOR EARLY BREAST CANCER DETECTION 1657
Jian Li (S’88–M’90–SM’97–F’05) received theM.Sc. and Ph.D. degrees in electrical engineeringfrom The Ohio State University, Columbus, in 1987and 1991, respectively.
From July 1991 to June 1993, she was an Assis-tant Professor with the Department of Electrical En-gineering, University of Kentucky, Lexington. SinceAugust 1993, she has been with the Department ofElectrical and Computer Engineering, University ofFlorida, Gainesville, where she is currently a Pro-fessor. Her current research interests include spectral
estimation, statistical and array signal processing, and their applications.Dr. Li is a fellow of Institution of Electrical Engineers (IEE). She received
the 1994 National Science Foundation Young Investigator Award and the 1996Office of Naval Research Young Investigator Award. She has been a member ofthe Editorial Board of Signal Processing, a publication of the European Associ-ation for Signal Processing (EURASIP), since 2005. She is presently a memberof two of the IEEE Signal Processing Society technical committees: the SignalProcessing Theory and Methods (SPTM) Technical Committee and the SensorArray and Multichannel (SAM) Technical Committee.
Petre Stoica (SM’91–F’94) received the D.Sc. de-gree in automatic control from the Polytechnic Insti-tute of Bucharest (BPI), Bucharest, Romania, in 1979and an honorary doctorate degree in science from Up-psala University (UU), Uppsala, Sweden, in 1993.
He is a Professor of Systems Modeling with theDivision of Systems and Control, the Departmentof Information Technology, UU. He was a Professorof System Identification and Signal Processing withthe Faculty of Automatic Control and Computers,BPI. He held longer visiting positions with Eind-
hoven University of Technology, Eindhoven, The Netherlands; ChalmersUniversity of Technology, Gothenburg, Sweden (where he held a JubileeVisiting Professorship); UU; The University of Florida, Gainesville, FL; andStanford University, Stanford, CA. His main scientific interests are in theareas of system identification, time series analysis and prediction, statisticalsignal and array processing, spectral analysis, wireless communications, andradar signal processing. He has published nine books, ten book chapters,and some 500 papers in archival journals and conference records. The mostrecent book he coauthored, with R. Moses, is Spectral Analysis of Signals(Prentice-Hall, 2005). He is on the editorial boards of six journals: Journalof Forecasting, Signal Processing, Circuits, Signals, and Signal Processing,Digital Signal Processing, ICA Review Journal, Signal Processing Magazine,and Multidimensional Systems and Signal Processing. He was a co-guest editorfor several special issues on system identification, signal processing, spectralanalysis, and radar for some of the aforementioned journals, as well as for theIEE Proceedings.
Dr. Stoica was corecipient of the IEEE ASSP Senior Award for a paper onstatistical aspects of array signal processing. He was also recipient of the Tech-nical Achievement Award of the IEEE Signal Processing Society. In 1998, hewas the recipient of a Senior Individual Grant Award of the Swedish Founda-tion for Strategic Research. He was also co-recipient of the 1998 EURASIP BestPaper Award for Signal Processing for a work on parameter estimation of ex-ponential signals with time-varying amplitude, a 1999 IEEE Signal ProcessingSociety Best Paper Award for a paper on parameter and rank estimation of re-duced-rank regression, a 2000 IEEE Third Millennium Medal, and the 2000 W.R. G. Baker Prize Paper Award for a paper on maximum likelihood methodsfor radar. He was a member of the international program committees of manytopical conferences. From 1981 to 1986, he was a Director of the InternationalTime-Series Analysis and Forecasting Society, and he was also a member of theIFAC Technical Committee on Modeling, Identification, and Signal Processing.He is also a member of the Royal Swedish Academy of Engineering Sciences,an honorary member of the Romanian Academy, and a fellow of the Royal Sta-tistical Society.