n. denisova, g.revalde, a. skudra institute of theoretical and applied mechanics, novosibirsk,...
TRANSCRIPT
N. DenisovaN. Denisova, G.Revalde, A. , G.Revalde, A. SkudraSkudra
Institute of Theoretical and Applied Mechanics, Institute of Theoretical and Applied Mechanics, Novosibirsk, Russia Novosibirsk, Russia
Institute of Atomic Physics and Spectroscopy, Institute of Atomic Physics and Spectroscopy, University of Latvia, Riga, LatviaUniversity of Latvia, Riga, Latvia
30 March-3 April 2006, Eindhoven,Netherlands
““Tomographic diagnostics Tomographic diagnostics of plasma light sources”.of plasma light sources”.
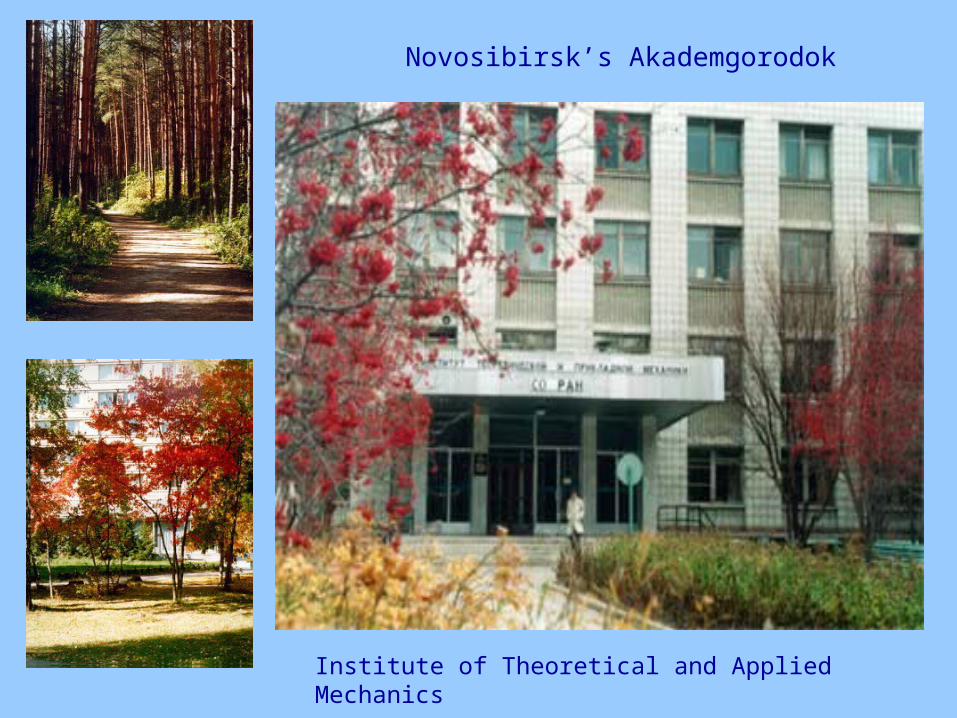
Institute of Theoretical and Applied Mechanics
Novosibirsk’s Akademgorodok
Riga, Latvia
Computed tomography is a powerful tool for plasma light sources diagnostics.
*A better understanding of physical processes occurring in a plasma.
*A verification of the theoretical models.
*An optimization of the light sources performance.
Optical diagnostics provide usually integral data.
Local plasma characteristics can be derived from the measured data by combining of an integrating measurement techniques and computer tomography algorithms and methods.
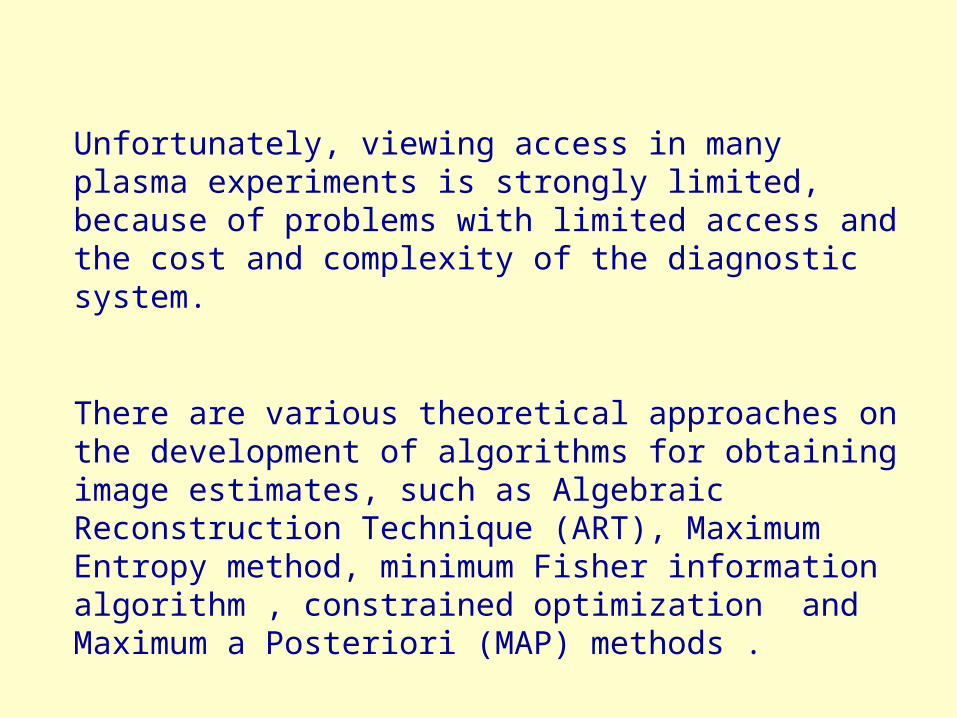
Unfortunately, viewing access in many plasma experiments is strongly limited, because of problems with limited access and the cost and complexity of the diagnostic system.
There are various theoretical approaches on the development of algorithms for obtaining image estimates, such as Algebraic Reconstruction Technique (ART), Maximum Entropy method, minimum Fisher information algorithm , constrained optimization and Maximum a Posteriori (MAP) methods .
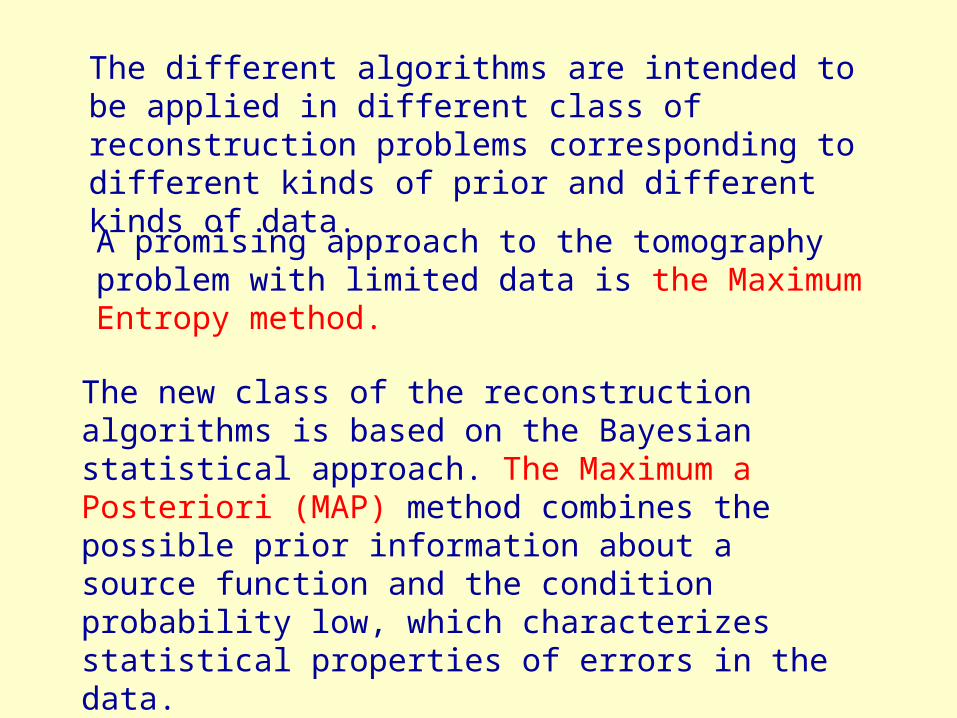
A promising approach to the tomography problem with limited data is the Maximum Entropy method.
The new class of the reconstruction algorithms is based on the Bayesian statistical approach. The Maximum a Posteriori (MAP) method combines the possible prior information about a source function and the condition probability low, which characterizes statistical properties of errors in the data.
The different algorithms are intended to be applied in different class of reconstruction problems corresponding to different kinds of prior and different kinds of data.
Some recent publications:
1. N.Denisova, G.Revalde, A.Skudra, E.Bogans “Tomographic diagnostics of high-frequency electrodeless lamps in argon-mercury mixtures” 2006 J.Phys.D:Appl.Phys 39 1069-1077.
2. N.Denisova “ A maximum a posteriori (MAP) reconstruction method for plasma tomography” 2004 Plasma Sources Sci.Technol. 14 531.
3. N.Denisova “Bayesian Reconstruction in SPECT With Entropy Prior and Iterative Statistical Regularization “2004 IEEE Trans. on Nuclear Science v.51 p.136-141.
4. N.Denisova “Two view tomography” 2000 J. Phys. D: Appl.Phys. 33 313.
5. N.Denisova “ Maximum Entropy based tomography for gas and plasma diagnostics “1998 J. Phys. D: Appl. Phys. 31 1888.
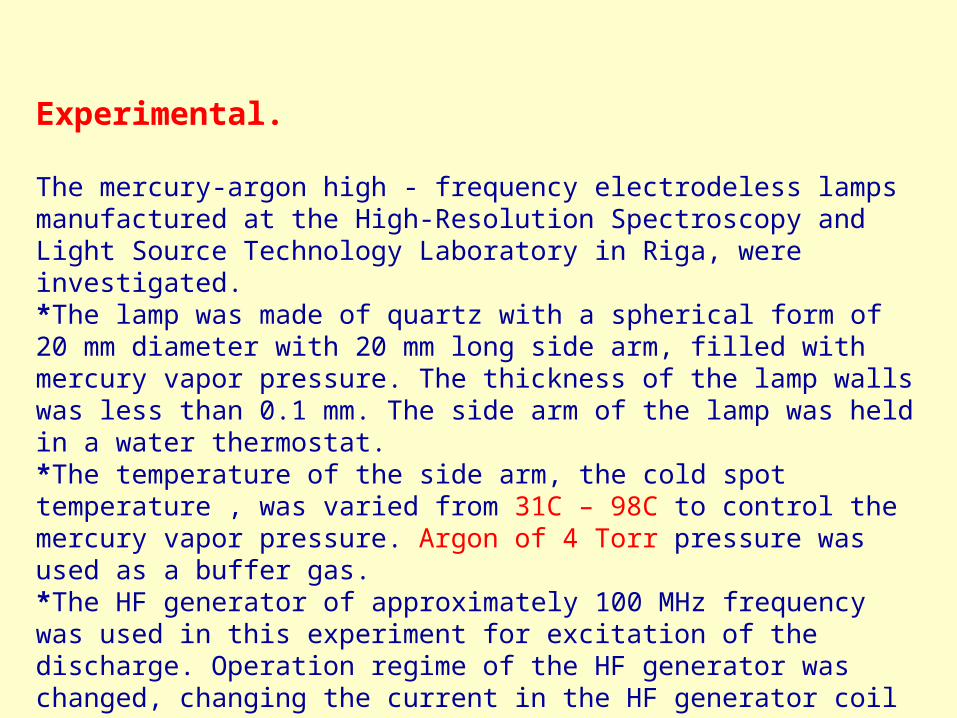
Experimental.
The mercury-argon high - frequency electrodeless lamps manufactured at the High-Resolution Spectroscopy and Light Source Technology Laboratory in Riga, were investigated.*The lamp was made of quartz with a spherical form of 20 mm diameter with 20 mm long side arm, filled with mercury vapor pressure. The thickness of the lamp walls was less than 0.1 mm. The side arm of the lamp was held in a water thermostat. *The temperature of the side arm, the cold spot temperature , was varied from 31C – 98C to control the mercury vapor pressure. Argon of 4 Torr pressure was used as a buffer gas. *The HF generator of approximately 100 MHz frequency was used in this experiment for excitation of the discharge. Operation regime of the HF generator was changed, changing the current in the HF generator coil in the region of 50 mA – 200 mA.*The distance from the lamp to the registering camera was kept constant (40 cm).
Z
X
Y3
2
21
5
4
6
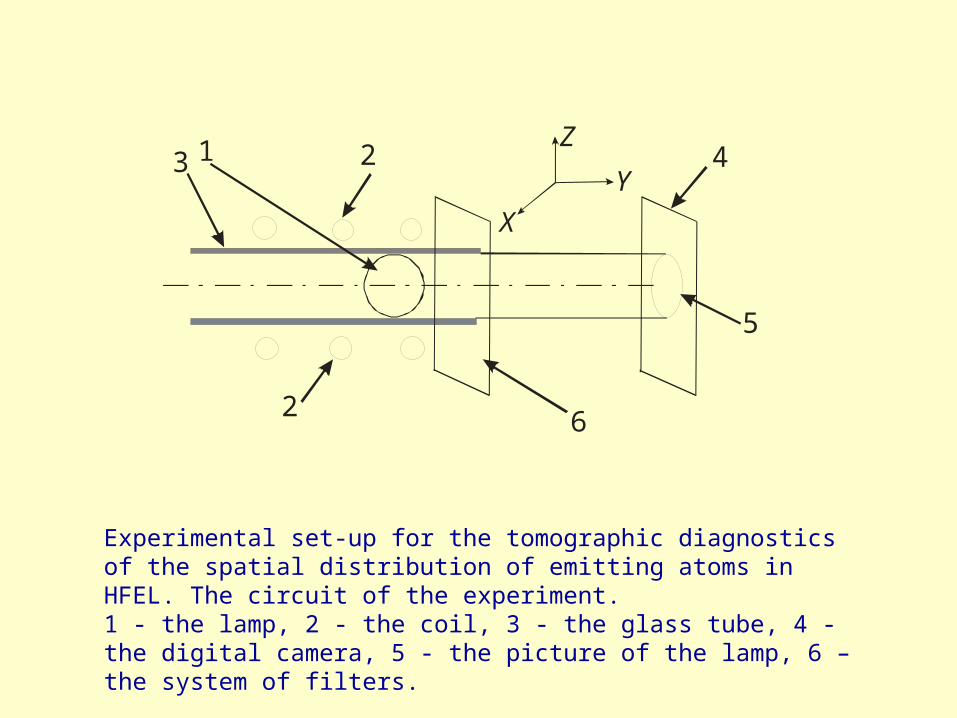
Experimental set-up for the tomographic diagnostics of the spatial distribution of emitting atoms in HFEL. The circuit of the experiment.1 - the lamp, 2 - the coil, 3 - the glass tube, 4 - the digital camera, 5 - the picture of the lamp, 6 – the system of filters.
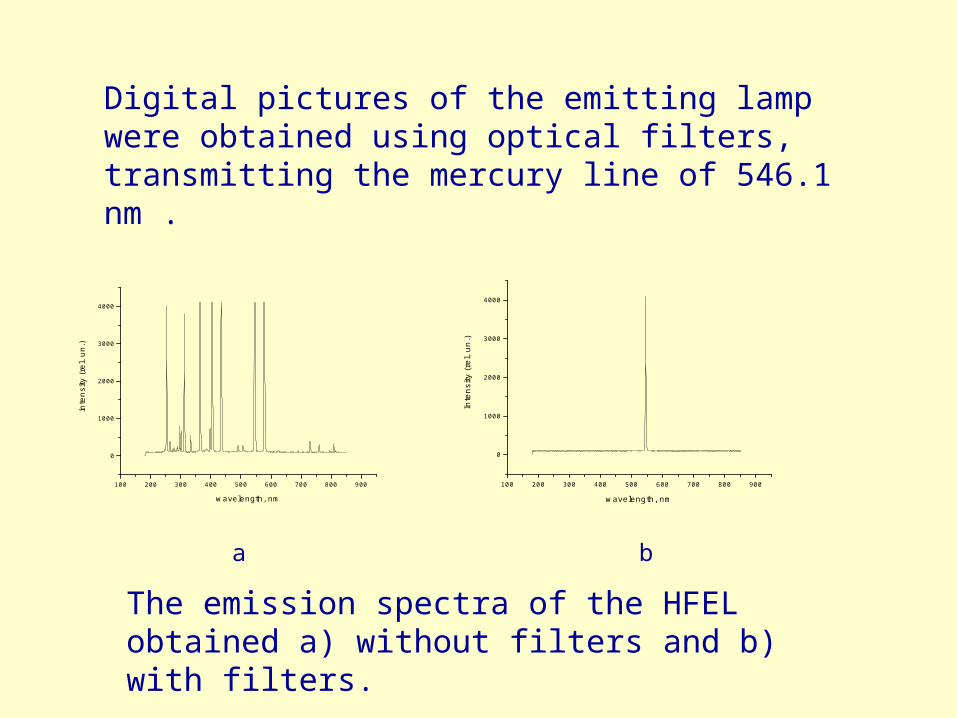
Digital pictures of the emitting lamp were obtained using optical filters, transmitting the mercury line of 546.1 nm .
100 200 300 400 500 600 700 800 900
0
1000
2000
3000
4000
inte
nsi
ty (
rel.
un
.)
wavelength, nm
100 200 300 400 500 600 700 800 900
0
1000
2000
3000
4000
Inte
nsity
(re
l. un
.)
wavelength, nm
The emission spectra of the HFEL obtained a) without filters and b) with filters.
a b
Hg
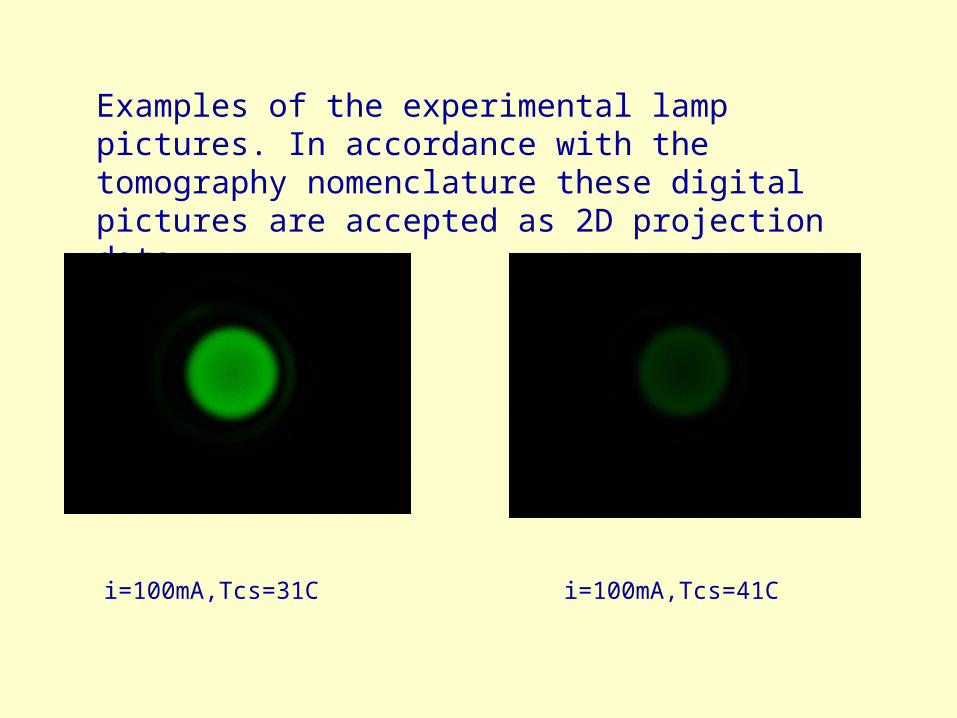
Examples of the experimental lamp pictures. In accordance with the tomography nomenclature these digital pictures are accepted as 2D projection data.
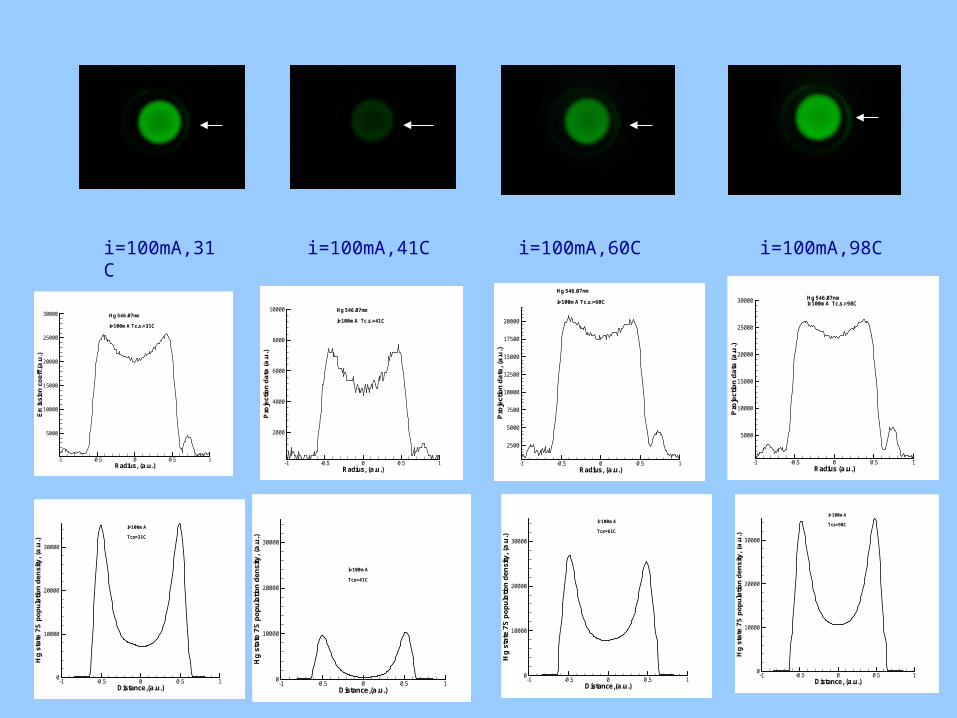
i=100mA,Tcs=31C
i=100mA,Tcs=41C
Tomographic reconstruction of local plasma parameters.
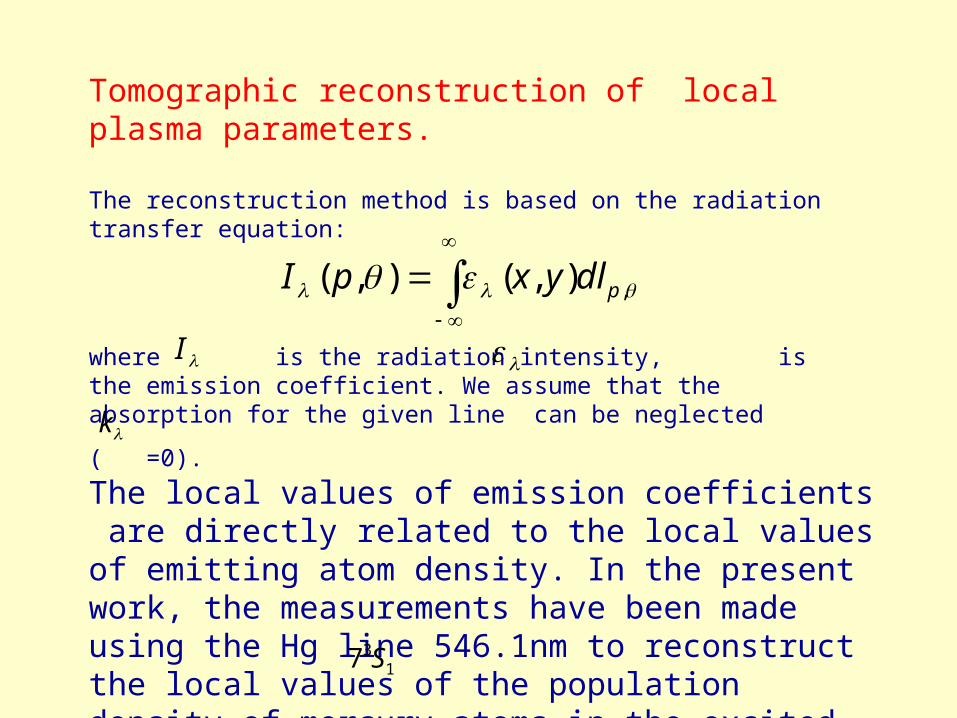
The reconstruction method is based on the radiation transfer equation:
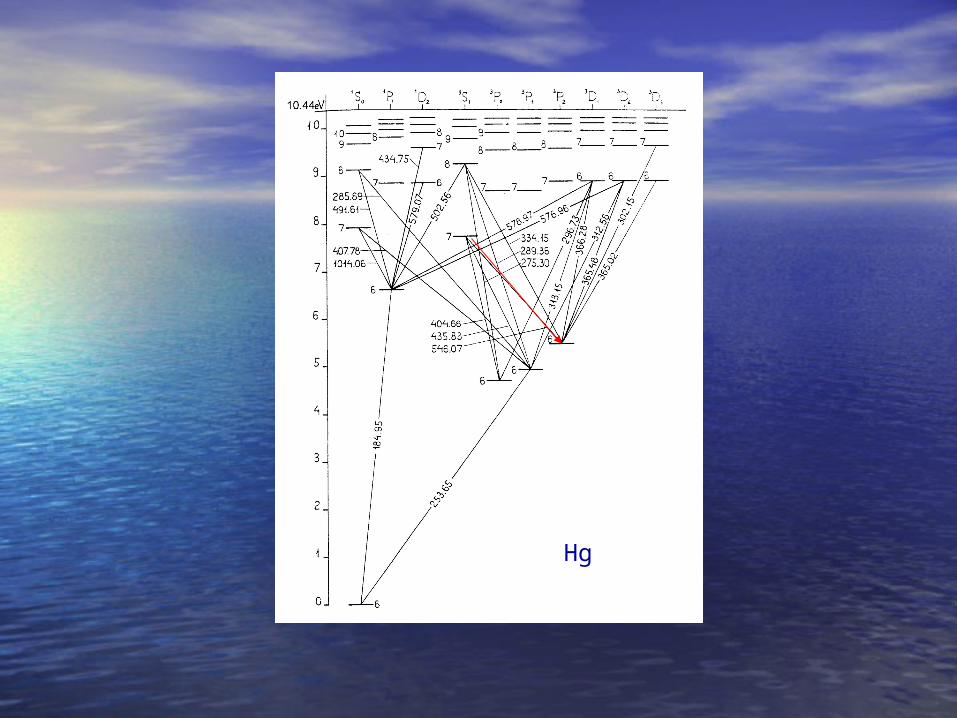
The local values of emission coefficients are directly related to the local values of emitting atom density. In the present work, the measurements have been made using the Hg line 546.1nm to reconstruct the local values of the population density of mercury atoms in the excited state .
137 S
,),(),( pdlyxpI
where is the radiation intensity, is the emission coefficient. We assume that the absorption for the given line can be neglected
( =0).
I
k
*The problem is to define the local characteristics from the measured integral data .
One of the promising approaches for this problem is based on the Maximum Entropy (ME) principle. In the present work, ME algorithm is applied for the ‘slice-by-slice’ reconstruction of the circular symmetry plasma. Theoretically, in this situation one could have obtained the same result by using a ‘slice-by-slice’ Abel-inversion. But, our aim is to develop a general approach suitable for the reconstruction of emitting atom densities for both symmetrical and non-symmetrical plasma sources.
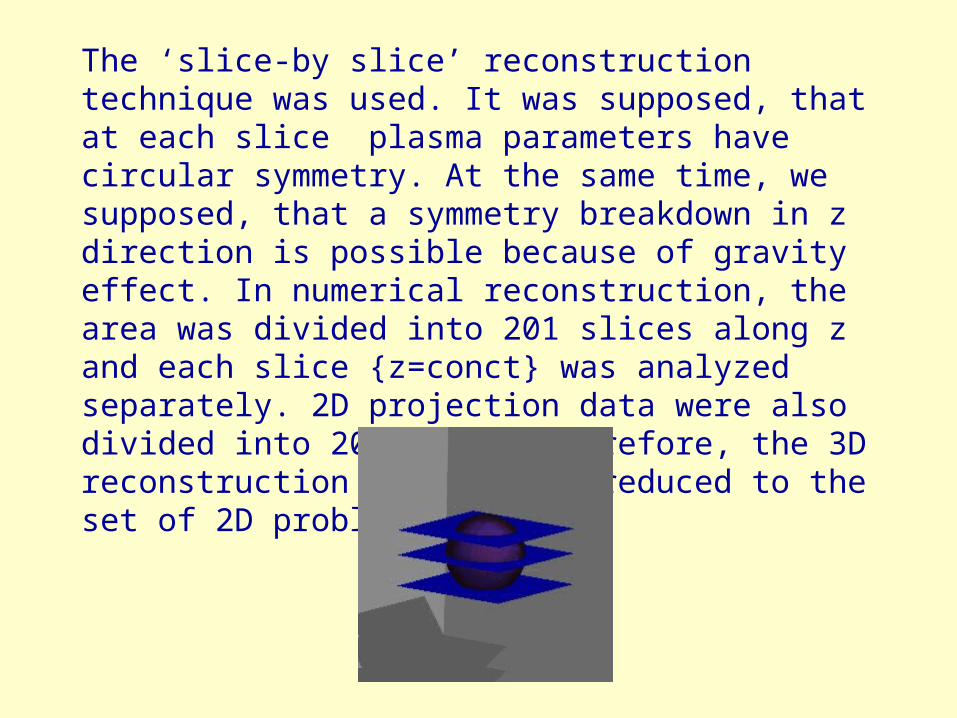
The ‘slice-by slice’ reconstruction technique was used. It was supposed, that at each slice plasma parameters have circular symmetry. At the same time, we supposed, that a symmetry breakdown in z direction is possible because of gravity effect. In numerical reconstruction, the area was divided into 201 slices along z and each slice {z=conct} was analyzed separately. 2D projection data were also divided into 201 lines. Therefore, the 3D reconstruction problem was reduced to the set of 2D problems.
-1 -0.5 0 0.5 1Distance, (a.u.)
2000
4000
6000
8000
Projectiondata,(a.u.)
i = 50mA
Tcs = 31C
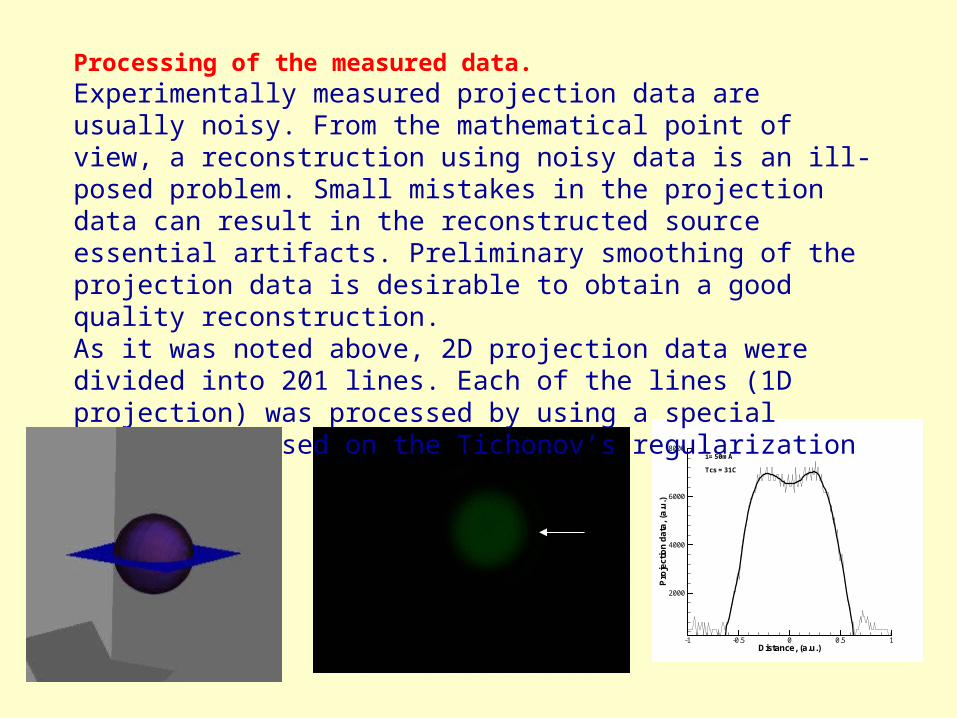
Processing of the measured data.Experimentally measured projection data are usually noisy. From the mathematical point of view, a reconstruction using noisy data is an ill-posed problem. Small mistakes in the projection data can result in the reconstructed source essential artifacts. Preliminary smoothing of the projection data is desirable to obtain a good quality reconstruction.As it was noted above, 2D projection data were divided into 201 lines. Each of the lines (1D projection) was processed by using a special algorithm, based on the Tichonov’s regularization method .
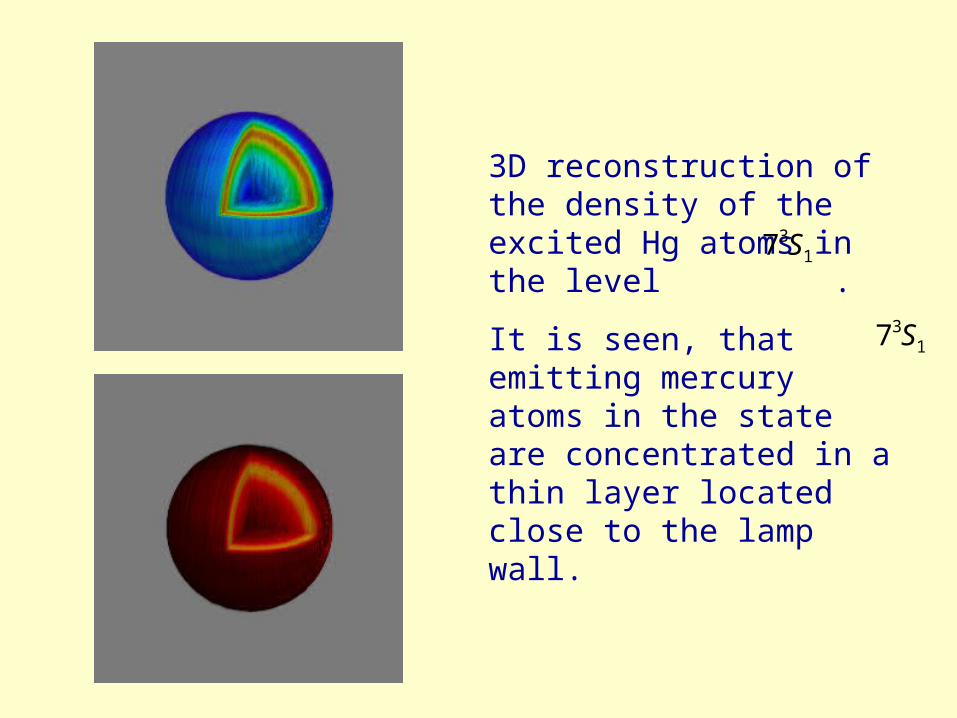
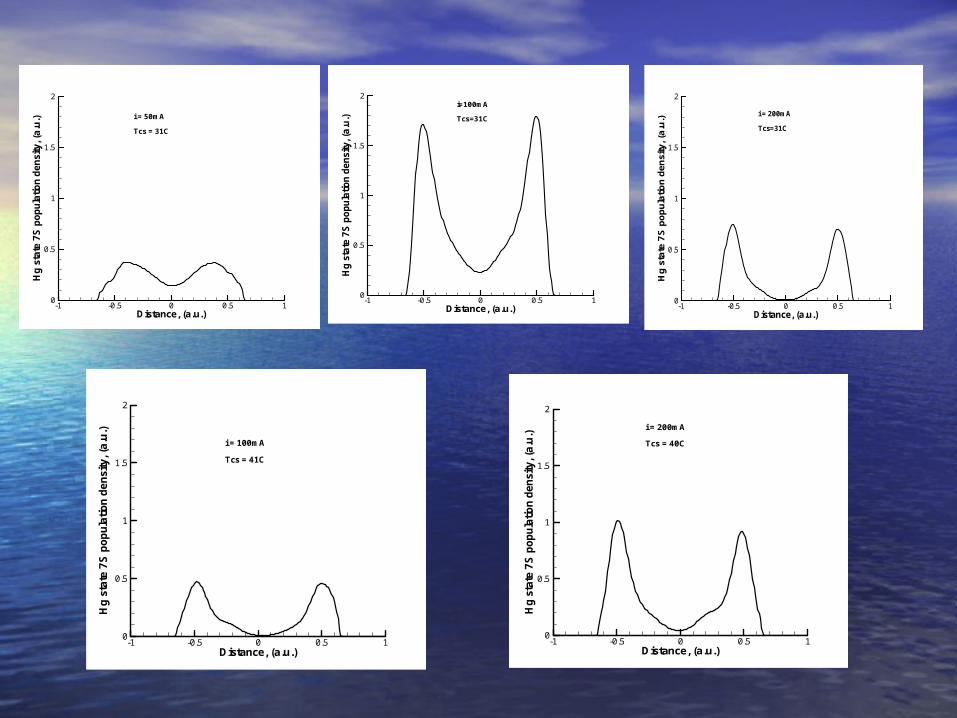
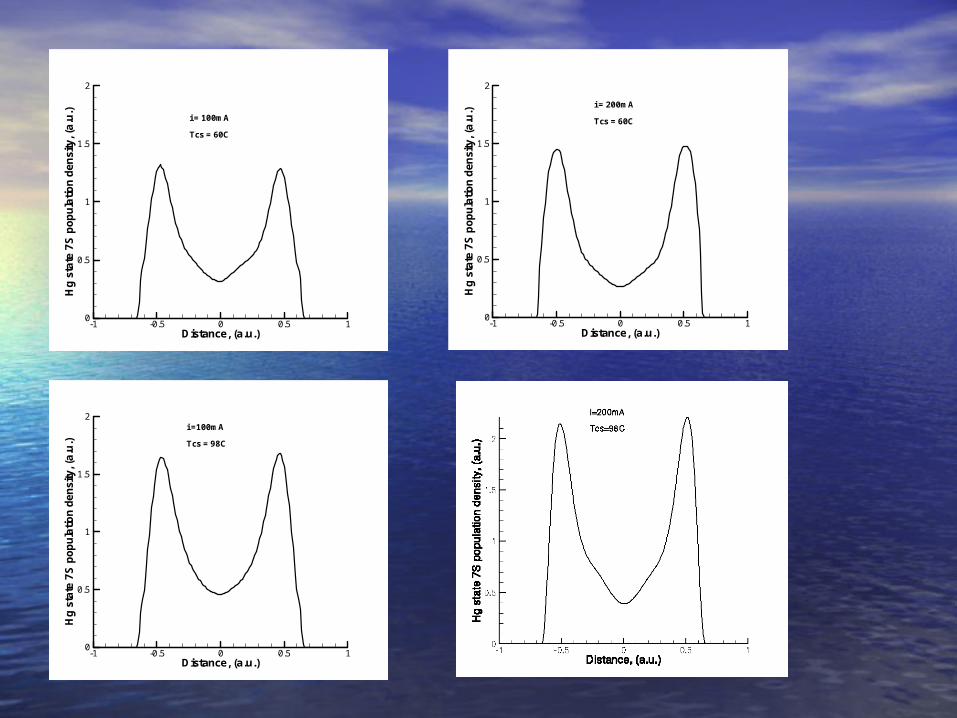
3D reconstruction of the density of the excited Hg atoms in the level .
It is seen, that emitting mercury atoms in the state are concentrated in a thin layer located close to the lamp wall.
137 S
137 S
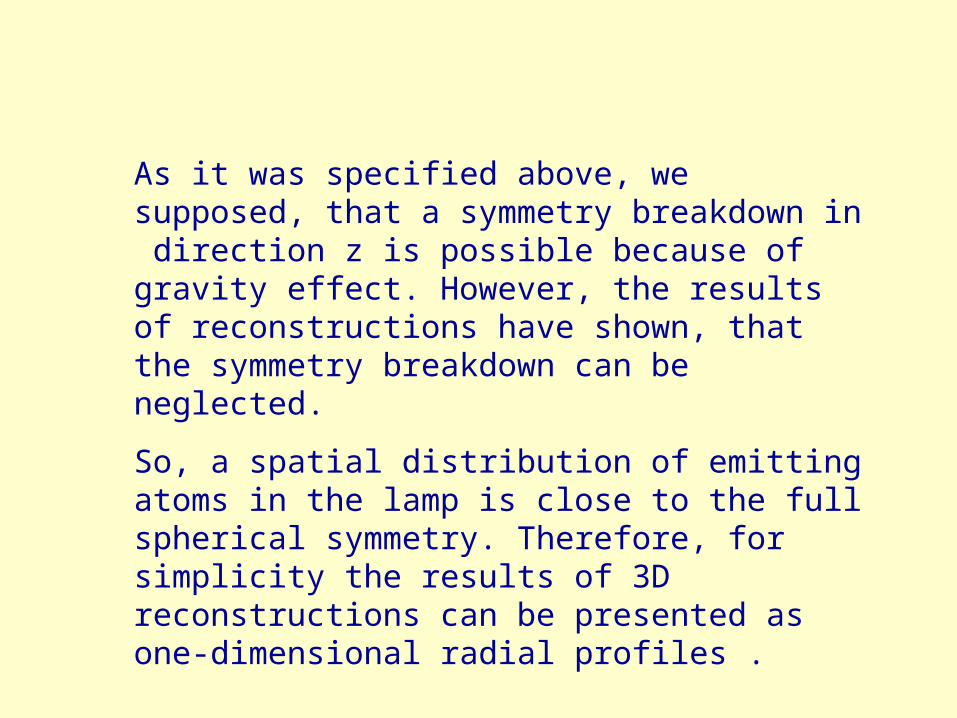
As it was specified above, we supposed, that a symmetry breakdown in direction z is possible because of gravity effect. However, the results of reconstructions have shown, that the symmetry breakdown can be neglected.
So, a spatial distribution of emitting atoms in the lamp is close to the full spherical symmetry. Therefore, for simplicity the results of 3D reconstructions can be presented as one-dimensional radial profiles .
-1 -0.5 0 0.5 1Distance, (a.u.)
0
0.5
1
1.5
2
Hgstate7Spopulationdensity,(a.u.) i = 50mA
Tcs = 31C
-1 -0.5 0 0.5 1Distance, (a.u.)
0
0.5
1
1.5
2
Hgstate7Spopulationdensity,(a.u.)
i=100mA
Tcs=31C
-1 -0.5 0 0.5 1Distance, (a.u.)
0
0.5
1
1.5
2
Hgstate
7Spopulatio
ndensity,(a.u.)
i = 200mA
Tcs=31C
-1 -0.5 0 0.5 1Distance, (a.u.)
0
0.5
1
1.5
2
Hgstate7Spopulationdensity,(a.u.)
i = 100mA
Tcs = 41C
-1 -0.5 0 0.5 1Distance, (a.u.)
0
0.5
1
1.5
2
Hgstate7Spopulationdensity,(a.u.)
i = 200mA
Tcs = 40C
-1 -0.5 0 0.5 1Distance, (a.u.)
0
0.5
1
1.5
2
Hgstate7Spopulationdensity,(a.u.)
i = 100mA
Tcs = 60C
-1 -0.5 0 0.5 1Distance, (a.u.)
0
0.5
1
1.5
2
Hgstate7Spopulationdensity,(a.u.)
i = 200mA
Tcs = 60C
-1 -0.5 0 0.5 1Distance, (a.u.)
0
0.5
1
1.5
2
Hgstate7Spopulationdensity,(a.u.)
i =100mA
Tcs = 98C
-1 -0.5 0 0.5 1x
-1
-0.5
0
0.5
1
y 0.2
0.5
1.2
0.2
-1 -0.5 0 0.5 1x
-1
-0.5
0
0.5
1
y 0.2
0.5
1.4
0.2
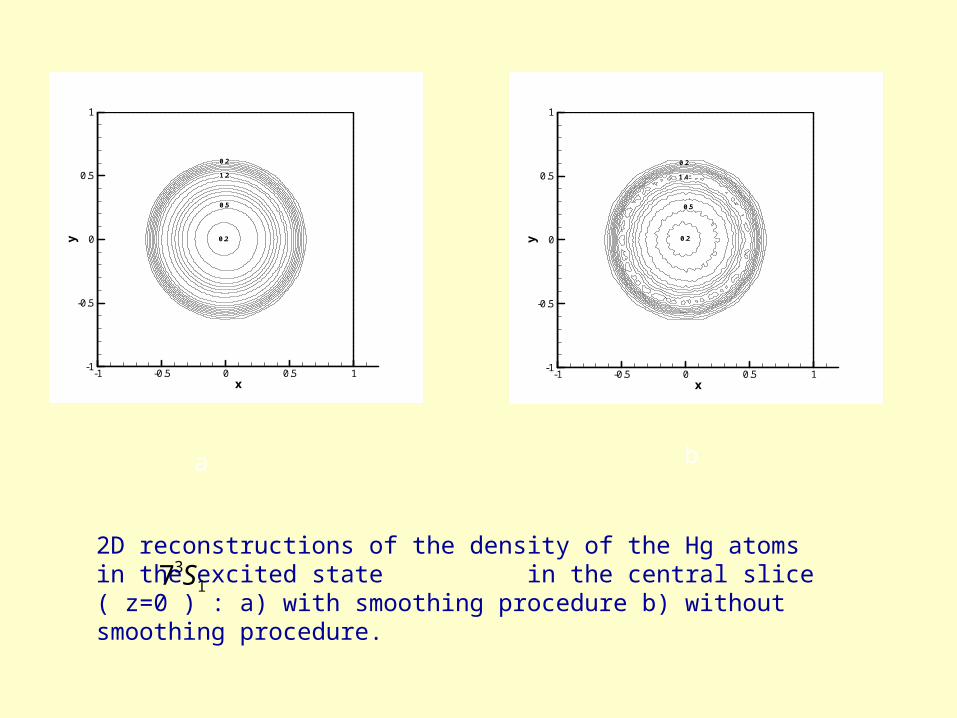
2D reconstructions of the density of the Hg atoms in the excited state in the central slice ( z=0 ) : a) with smoothing procedure b) without smoothing procedure.
a b
137 S
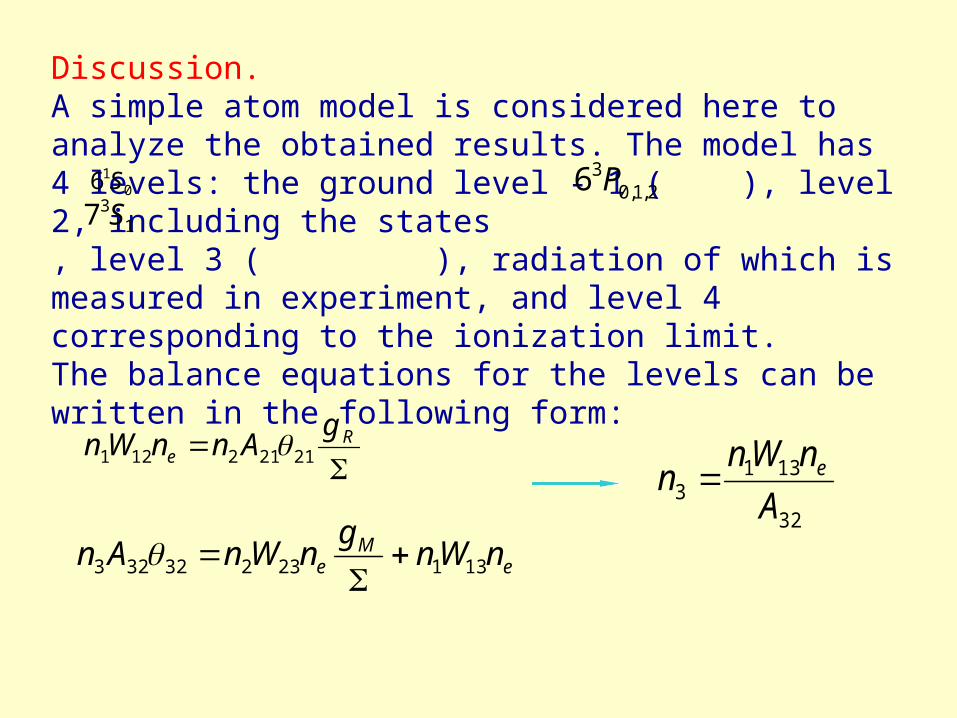
Discussion.A simple atom model is considered here to analyze the obtained results. The model has 4 levels: the ground level - 1 ( ), level 2, including the states , level 3 ( ), radiation of which is measured in experiment, and level 4 corresponding to the ionization limit. The balance equations for the levels can be written in the following form:
R
e
gAnnWn 21212121
eM
e nWng
nWnAn 13123232323
016 S 2,1,0
36 P1
37 S
32
1313 A
nWnn e

)1)(0()( 2rnrn ee
22
1( ( ))a ion
nr D S
r r r
22
1 ( / )( ( )) Hg
ion
n Nr DN S
r r r
Hgion ionS S
r
NnDN
r
nDa
)/(
)()()( rnD
DRnrn a
( ) ( ) ( )aDn r n R n rD
20 30 40 50 60cold spot temperature
104
105
106
ionizationrate(a.u.)
Ar-e Hg-e
Ar*-Hg
Hg*-Hg*
PAr = 4Torr H0=0.7oe
1 2
2
1
3
4 <<131csT C
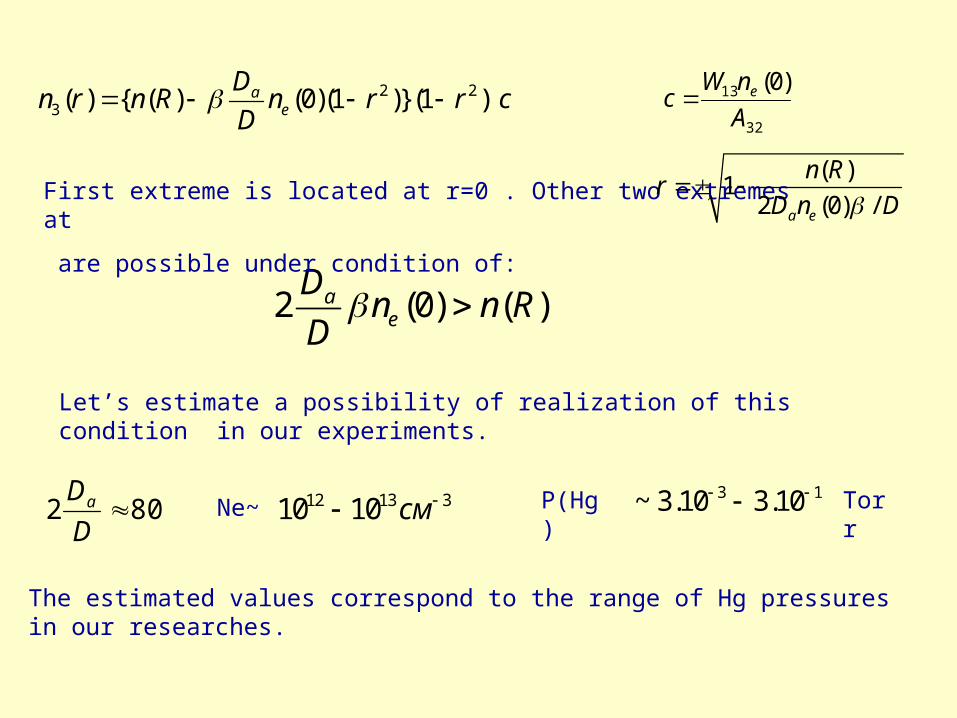
2 23( ) { ( ) (0)(1 )}(1 )a
e
Dn r n R n r r c
D
32
13 )0(
A
nWc e
2 (0) ( )ae
Dn n R
D
First extreme is located at r=0 . Other two extremes at
are possible under condition of:
( )1
2 (0) /a e
n Rr
D n D
Let’s estimate a possibility of realization of this condition in our experiments.
802 D
Da 12 13 310 10 см3 1~ 3.10 3.10 TorrNe
~
P(Hg)
The estimated values correspond to the range of Hg pressures in our researches.
2 (0) ( )ae
Dn n R
D
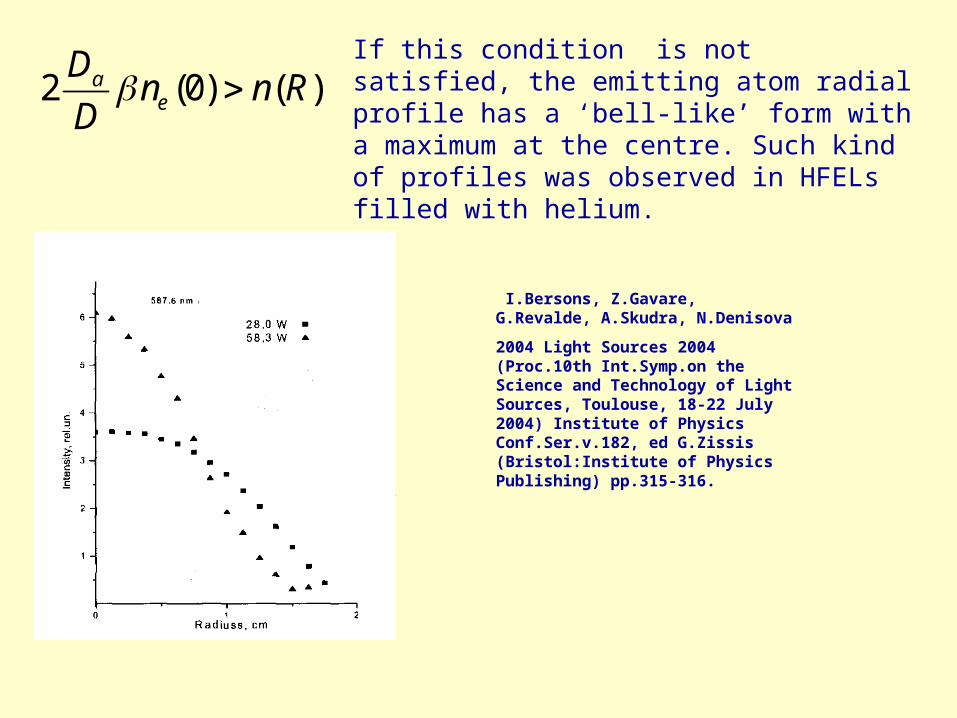
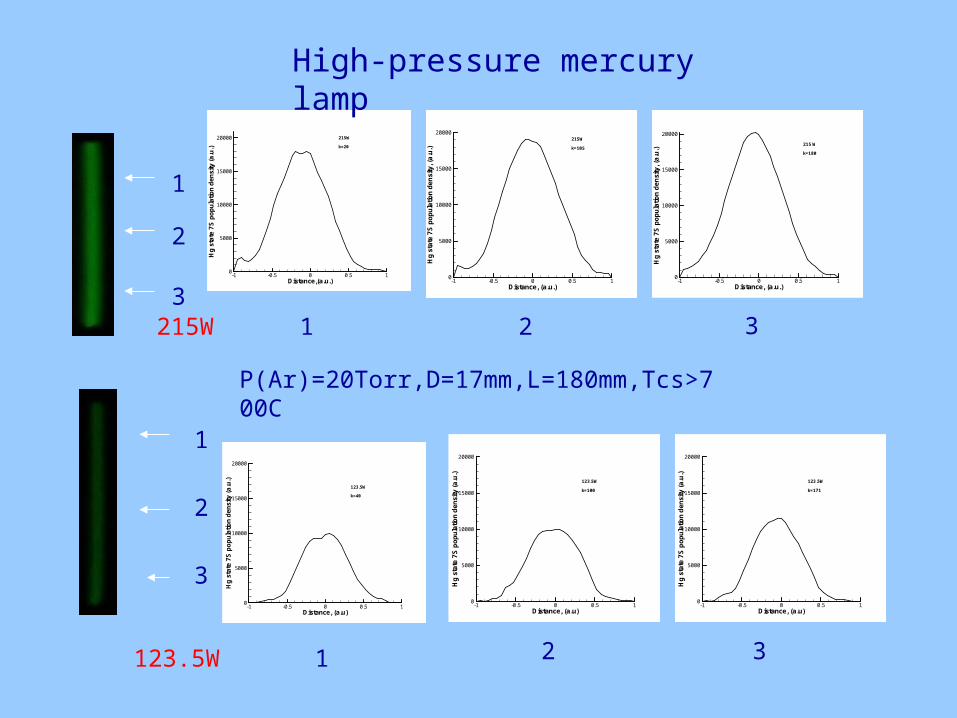
If this condition is not satisfied, the emitting atom radial profile has a ‘bell-like’ form with a maximum at the centre. Such kind of profiles was observed in HFELs filled with helium.
I.Bersons, Z.Gavare, G.Revalde, A.Skudra, N.Denisova
2004 Light Sources 2004 (Proc.10th Int.Symp.on the Science and Technology of Light Sources, Toulouse, 18-22 July 2004) Institute of Physics Conf.Ser.v.182, ed G.Zissis (Bristol:Institute of Physics Publishing) pp.315-316.
i=100mA,31C
i=100mA,41C i=100mA,60C i=100mA,98C
-1 -0.5 0 0.5 1Radius, (a.u.)
2000
4000
6000
8000
10000
Projectiondata
(a.u.)
Hg 546.07nm
i=100mA Tc.s.=41C
-1 -0.5 0 0.5 1Radius, (a.u.)
2500
5000
7500
10000
12500
15000
17500
20000
Projectiondata,(a.u.)
Hg 546.07nm
i=100mA Tc.s.=60C
-1 -0.5 0 0.5 1Radius, (a.u.)
5000
10000
15000
20000
25000
30000
Emissioncoeff.(a.u.)
Hg 546.07nm
i=100mA Tc.s.=31C
-1 -0.5 0 0.5 1Radius (a.u.)
5000
10000
15000
20000
25000
30000
Projectiondata
(a.u.)
Hg 546.07nmi=100mA Tc.s.=98C
-1 -0.5 0 0.5 1Distance,(a.u.)
0
10000
20000
30000
Hgstate
7Spopulatio
ndensity,(a.u.)
i=100mA
Tcs=31C
-1 -0.5 0 0.5 1Distance,(a.u.)
0
10000
20000
30000
Hgstate
7Spopulatio
ndensity,(a.u.)
i=100mA
Tcs=41C
-1 -0.5 0 0.5 1Distance,(a.u.)
0
10000
20000
30000
Hgstate
7Spopulatio
ndensity,(a.u.)
i=100mA
Tcs=61C
-1 -0.5 0 0.5 1Distance, (a.u.)
0
10000
20000
30000
Hgstate
7Spopulatio
ndensity,(a.u.)
i=100mA
Tcs=98C
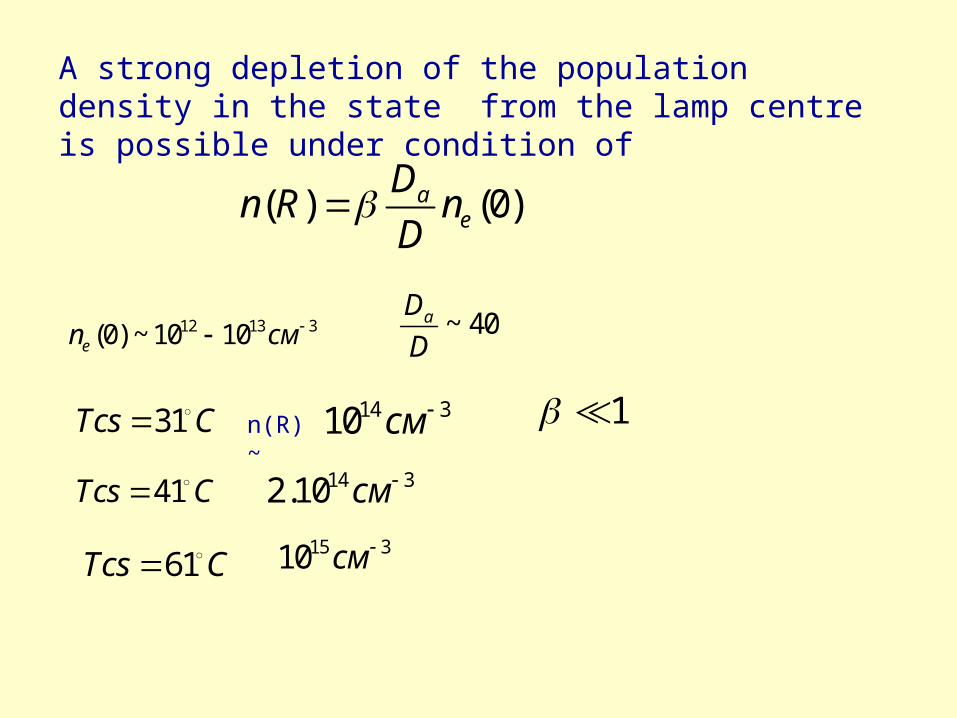
A strong depletion of the population density in the state from the lamp centre is possible under condition of
( ) (0)ae
Dn R n
D
12 13 3(0) ~ 10 10en см ~ 40aD
D
31Tcs C 14 310 смn(R)~
41Tcs C 14 32.10 см
61Tcs C 15 310 см
1
-1 -0.5 0 0.5 1Distance,(a.u.)
0
5000
10000
15000
20000
Hgstate7Spopulationdensity(a.u.)
215W
k=20
-1 -0.5 0 0.5 1Distance, (a.u.)
0
5000
10000
15000
20000
Hgstate7Spopulationdensity,(a.u.)
215W
k=105
-1 -0.5 0 0.5 1Distance, (a.u.)
0
5000
10000
15000
20000
Hgstate7Spopulationdensity,(a.u.)
215 W
k=180
1
2
31 2 3215W
123.5W
-1 -0.5 0 0.5 1Distance, (a.u)
0
5000
10000
15000
20000Hgstate7Spopulationdensity(a.u.)
123.5W
k=100
2
2
-1 -0.5 0 0.5 1Distance, (a.u)
0
5000
10000
15000
20000
Hgstate7Spopulationdensity(a.u.)
123.5W
k=40
-1 -0.5 0 0.5 1Distance, (a.u)
0
5000
10000
15000
20000
Hgstate7Spopulationdensity(a.u.)
123.5W
k=171
1 3
1
3
High-pressure mercury lamp
P(Ar)=20Torr,D=17mm,L=180mm,Tcs>700C
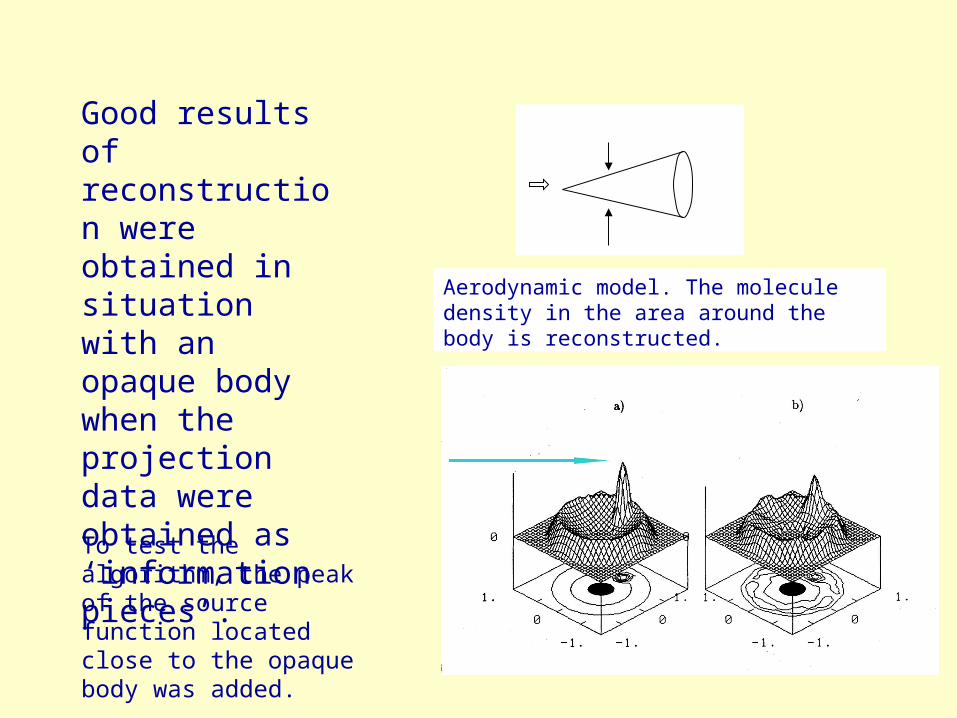
Aerodynamic model. The molecule density in the area around the body is reconstructed.
Good results of reconstruction were obtained in situation with an opaque body when the projection data were obtained as ‘information pieces’.
To test the algorithm, the peak of the source function located close to the opaque body was added.
Conclusions.
*Non-invasive tomographic diagnostics of the spatial distribution of emitting atoms is very important for better understanding of the physical processes occurring in plasma, verification of theoretical plasma models and optimization of the performance of the plasma light sources.
*In the present work, the measurements of the Hg 546.1nm line emission intensity have been performed in the low-pressure electrodeless lamp and the high-pressure arc lamp in argon-mercury mixtures in dependence on the operation regime by different cold spot temperatures in the range of .
СС 9831
*A general ‘slice-by-slice’ approach for the reconstruction of emitting atom densities in both symmetrical and non-symmetrical plasma objects has been developed.*We have found that in low pressure lamps the emitting mercury atoms in the state are concentrated in a thin layer located close to the lamp wall. It seems, this behavior is typical for the low-pressure lamps with metal vapor and can be explained in the context of the radial cataphoresis phenomenon.*In the high-pressure arc lamp the emitting atom radial profile has a ‘bell-like’ form with a maximum at the centre.
137 S