nada market review: shifting luxury vehicle … perspective/2014...nada market review: shifting...
TRANSCRIPT

April 2014
NADA Market Review:
Shifting Luxury Vehicle Preferences

Perspective | April 2014
NADA Used Car Guide | 8400 Westpark Drive | McLean, VA 22102 | 800.544.6232 | nada.com/b2b 2
© 2014 NADA Used Car Guide
TABLE OF CONTENTS
Introduction ................................................................................................................................. 2
Emerging Trends in Market Share for Luxury Cars & Utility Vehicles ........................................ 2
Value Retention for Luxury Vehicles Revisited ........................................................................... 3
Changes in Used Supply .............................................................................................................. 4
Impact of Supply Growth on Used Prices .................................................................................... 5
Thoughts on the Future ............................................................................................................... 7
At NADA Used Car Guide ............................................................................................................. 8
NADA Market Review: Shifting Luxury Vehicle Preferences
Introduction
Since the Great Recession ended in 2009, the auto industry gradually
recovered as consumer appetite for big purchases returned after
spending fell due to poor economic conditions. With the U.S.
economic recovery in its fifth year, it is interesting to see how much
the luxury automobile market has changed over time, especially with
the increased importance of perceived value. Buyers are becoming
more mindful of how they spend their money, opting for practical
purchases of expensive items rather than frivolous and excessive buys.
This change in mindset was evident in the NADA Spring 2013 Car
Shopper Preference Survey, which revealed quality/dependability as
the most important element in a new vehicle purchase decision. By
looking at the market share of each segment, we can identify
emerging developments in luxury demand and provided insight on
expectations for the future.
Emerging Trends in Market Share for Luxury Cars & Utility Vehicles
Between 2009 and 2013, total light vehicle sales in the United States increased by over
49%; when excluding mainstream vehicle deliveries, we see that luxury sales increased
by over 62%. The growth in luxury consumption translates into a 1.03-percentage point
improvement in market share, which climbed to 12.8% of the total market in 2013.
With the U.S. economic
recovery in its fifth year, it is
interesting to see how much
the luxury automobile market
has changed over time,
especially with increased
importance of perceived
value.

Perspective | April 2014
NADA Used Car Guide | 8400 Westpark Drive | McLean, VA 22102 | 800.544.6232 | nada.com/b2b 3
© 2014 NADA Used Car Guide
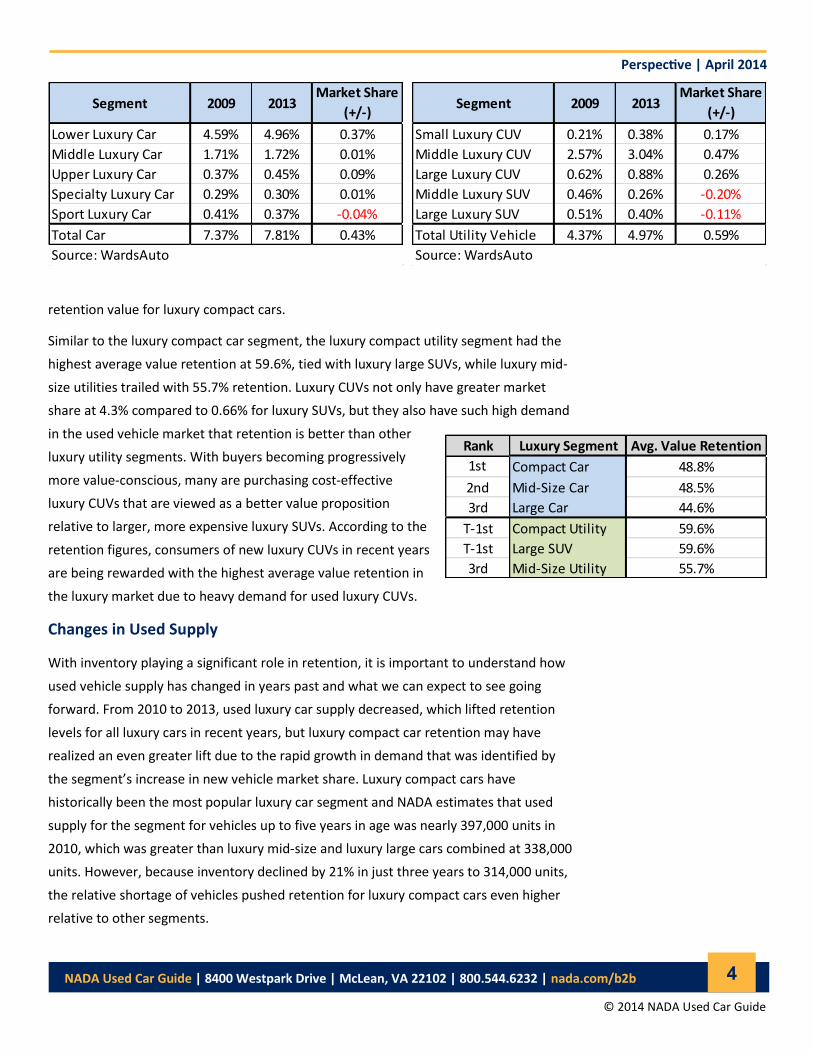
Examining each luxury segment individually shows
that both cars and trucks claimed greater share, but
in different ways. Luxury car share went up by 0.43-
percentage points, primarily due to 0.37-percentage
point growth in the lower luxury car segment while
all others had relatively unchanged market share. As
competition among automakers intensifies in the
entry-level luxury marketplace, the data suggests that
the growth was almost exclusively due to new buyers
entering the market as opposed to a cannibalization
of upper luxury sales taking place.
An examination of market share among luxury utility
vehicles tells a different story: a definitive shift in
consumer preferences has occurred with SUV
demand falling in favor of CUVs. While total luxury
utility vehicle share was up 0.59-percentage points,
middle and large luxury SUVs were down a combined
0.31-percentage points. On the other hand, luxury
CUVs were up 0.9-percentage points, which means
the disparity in market share growth between luxury
CUVs and SUVs was 1.21-percentage points after only
a few years. Thus, a distinct trend in the luxury
segment has been forming with buyers shifting away
from SUV purchases toward more practical CUVs, in addition to the expansion of the
lower luxury car segment.
Value Retention for Luxury Vehicles Revisited
In the February and March 2014 releases of NADA Perspective, which covered value
retention for three-year-old cars and trucks, respectively, we analyzed each segment
individually and discussed how they compare to one another. The average model in the
luxury compact car segment retained 48.8% of its value, besting both the luxury mid-
size and luxury large car segments, which achieved respective averages of 48.5% and
44.6%. Therefore, not only do new luxury compact cars cost less to purchase than their
mid-size and large counterparts, but they also exhibit superior value retention. The
popularity of new lower luxury cars can be seen in the segment’s 4.96% market share
compared to 2.85% for all other luxury car segments combined. Demand also remains
high relative to supply on the used side of the market as is exhibited in the high
4.6% 4.9% 5.1% 4.8% 5.0%
1.7%1.7% 1.5%
1.5%1.7%
0.4%0.5% 0.5%
0.5%0.5%0.3%
0.3% 0.3%0.3%
0.3%0.4%0.3% 0.3%
0.3%0.4%
0.0%
1.0%
2.0%
3.0%
4.0%
5.0%
6.0%
7.0%
8.0%
2009 2010 2011 2012 2013
Mar
ket
Shar
e
Period
Luxury Car Market Share by Segment
Lower Luxury Car Middle Luxury Car Upper Luxury Car Specialty Luxury Car Sport Luxury Car
Source: WardsAuto
0.2% 0.2% 0.2% 0.3% 0.4%
2.6%2.9% 3.0%
3.1% 3.0%
0.6%
0.8% 0.7%
0.8% 0.9%0.5%
0.5%0.3%
0.3%0.3%
0.5%
0.5%0.5%
0.4%0.4%
0.0%
1.0%
2.0%
3.0%
4.0%
5.0%
2009 2010 2011 2012 2013
Mar
ket S
hare
Period
Luxury Utility Vehicle Market Share by Segment
Small Luxury CUV Middle Luxury CUV Large Luxury CUV Middle Luxury SUV Large Luxury SUV
Source: WardsAuto
Perspective | April 2014
NADA Used Car Guide | 8400 Westpark Drive | McLean, VA 22102 | 800.544.6232 | nada.com/b2b 4
© 2014 NADA Used Car Guide
retention value for luxury compact cars.
Similar to the luxury compact car segment, the luxury compact utility segment had the
highest average value retention at 59.6%, tied with luxury large SUVs, while luxury mid-
size utilities trailed with 55.7% retention. Luxury CUVs not only have greater market
share at 4.3% compared to 0.66% for luxury SUVs, but they also have such high demand
in the used vehicle market that retention is better than other
luxury utility segments. With buyers becoming progressively
more value-conscious, many are purchasing cost-effective
luxury CUVs that are viewed as a better value proposition
relative to larger, more expensive luxury SUVs. According to the
retention figures, consumers of new luxury CUVs in recent years
are being rewarded with the highest average value retention in
the luxury market due to heavy demand for used luxury CUVs.
Changes in Used Supply
With inventory playing a significant role in retention, it is important to understand how
used vehicle supply has changed in years past and what we can expect to see going
forward. From 2010 to 2013, used luxury car supply decreased, which lifted retention
levels for all luxury cars in recent years, but luxury compact car retention may have
realized an even greater lift due to the rapid growth in demand that was identified by
the segment’s increase in new vehicle market share. Luxury compact cars have
historically been the most popular luxury car segment and NADA estimates that used
supply for the segment for vehicles up to five years in age was nearly 397,000 units in
2010, which was greater than luxury mid-size and luxury large cars combined at 338,000
units. However, because inventory declined by 21% in just three years to 314,000 units,
the relative shortage of vehicles pushed retention for luxury compact cars even higher
relative to other segments.
Segment 2009 2013Market Share
(+/-)
Lower Luxury Car 4.59% 4.96% 0.37%
Middle Luxury Car 1.71% 1.72% 0.01%
Upper Luxury Car 0.37% 0.45% 0.09%
Specialty Luxury Car 0.29% 0.30% 0.01%
Sport Luxury Car 0.41% 0.37% -0.04%
Total Car 7.37% 7.81% 0.43%
Source: WardsAuto
Segment 2009 2013Market Share
(+/-)
Small Luxury CUV 0.21% 0.38% 0.17%
Middle Luxury CUV 2.57% 3.04% 0.47%
Large Luxury CUV 0.62% 0.88% 0.26%
Middle Luxury SUV 0.46% 0.26% -0.20%
Large Luxury SUV 0.51% 0.40% -0.11%
Total Utility Vehicle 4.37% 4.97% 0.59%
Source: WardsAuto
Rank Luxury Segment Avg. Value Retention
1st Compact Car 48.8%
2nd Mid-Size Car 48.5%
3rd Large Car 44.6%
T-1st Compact Utility 59.6%
T-1st Large SUV 59.6%
3rd Mid-Size Utility 55.7%

Perspective | April 2014
NADA Used Car Guide | 8400 Westpark Drive | McLean, VA 22102 | 800.544.6232 | nada.com/b2b 5
© 2014 NADA Used Car Guide
Interestingly, used luxury compact utility supply
increased between 2010 and 2013 while inventory
has mostly fallen for luxury mid-size utilities and
luxury large SUVs. This was unlike the result found
with luxury compact cars versus luxury mid-size and
luxury large cars. Supply for luxury compact utilities
was only 7,101 units as recently as 2006, but grew to
nearly 70,000 by 2013 while inventory declined by
26% for all other luxury utilities combined between
2008 and 2012, as the trend in demand for luxury
CUVs has largely been opposite that of luxury SUVs
over the past several years. Inventory for used luxury
compact utilities up to five years in age grew in the
last few years just as demand increased in the new
retail market, captured by the segment’s expanded
market share. Thus, the value retention of three-year-
old luxury compact utilities may have been slightly
depressed compared to other luxury utilities.
Impact of Supply Growth on Used Prices
For many expensive products across various
industries, the growth in demand for new goods
inevitably leads to the existence of a used
marketplace (cellular phones, sporting equipment,
etc.). However, the demand in the used market generally does not lag much – if at all –
behind the new retail side, which means that even if new product sales climb, until
those items reach the used market, the shortage in used supply will inflate prices of
secondhand goods. The concept of supply and demand helps explain how retention
values have been affected thus far in the luxury segments, and by forecasting changes in
future used supply, we can anticipate shifts in prices and present our expectations going
forward.
NADA’s used luxury car supply estimates for 2014 and 2015 show that much of the
growth is concentrated in two segments: compact and mid-size cars. Between 2013 and
2015, used inventory is expected to rise by 23% and 21% for luxury compact and luxury
mid-size cars, respectively, while falling by 2% for luxury large cars. This translates over
to the used market in that prices for units up to eight years in age are expected to drop
further for luxury compact cars compared to the other luxury car segments as used
0
50
100
150
200
250
300
350
400
450
2010 2011 2012 2013 2014 2015
Use
d V
eh
icle
Su
pp
ly (T
ho
usa
nd
s)
Period
NADA Used Luxury Car Supply EstimatesUnits up to five years in age
Luxury Large Car Luxury Mid-Size Car Luxury Compact Car
Source: NADA Used Car Guide
0
50
100
150
200
250
300
350
2010 2011 2012 2013 2014 2015
Use
d V
eh
icle
Su
pp
ly (T
ho
usa
nd
s)
Period
NADA Used Luxury Utility Vehicle Supply EstimatesUnits up to five years in age
Luxury Compact Utility Luxury Large SUV Luxury Mid-Size Utility
Source: NADA Used Car Guide
Perspective | April 2014
NADA Used Car Guide | 8400 Westpark Drive | McLean, VA 22102 | 800.544.6232 | nada.com/b2b 6
© 2014 NADA Used Car Guide
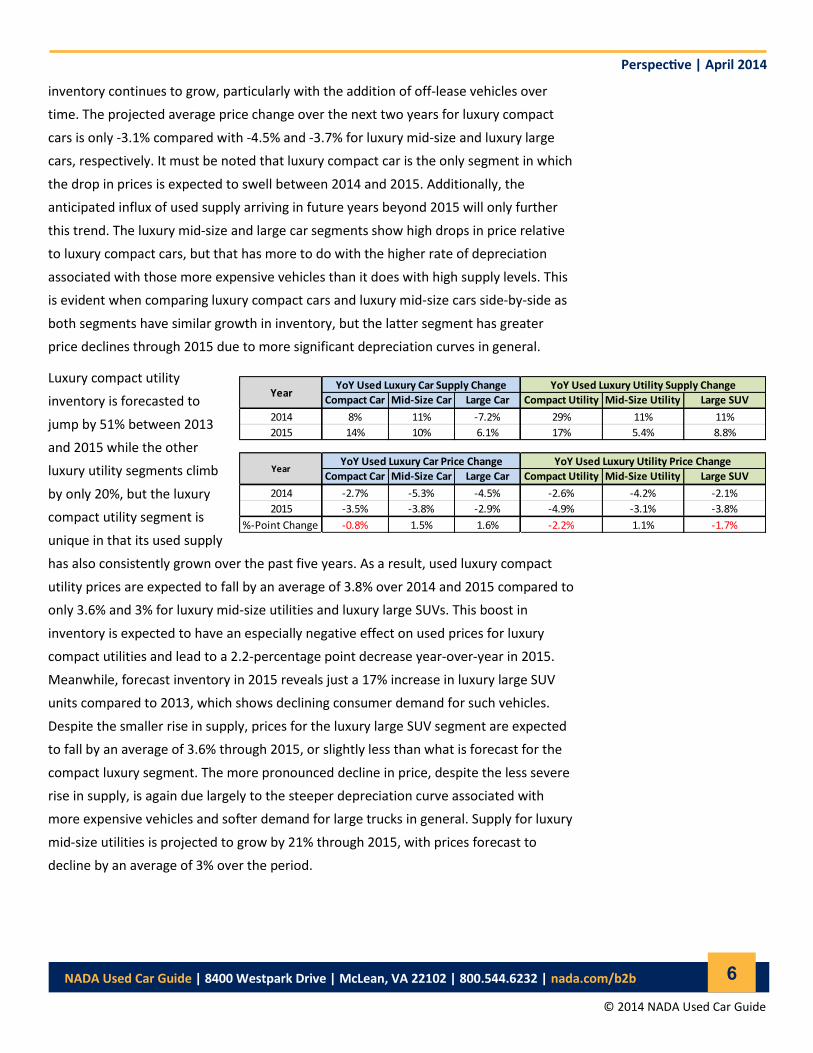
inventory continues to grow, particularly with the addition of off-lease vehicles over
time. The projected average price change over the next two years for luxury compact
cars is only -3.1% compared with -4.5% and -3.7% for luxury mid-size and luxury large
cars, respectively. It must be noted that luxury compact car is the only segment in which
the drop in prices is expected to swell between 2014 and 2015. Additionally, the
anticipated influx of used supply arriving in future years beyond 2015 will only further
this trend. The luxury mid-size and large car segments show high drops in price relative
to luxury compact cars, but that has more to do with the higher rate of depreciation
associated with those more expensive vehicles than it does with high supply levels. This
is evident when comparing luxury compact cars and luxury mid-size cars side-by-side as
both segments have similar growth in inventory, but the latter segment has greater
price declines through 2015 due to more significant depreciation curves in general.
Luxury compact utility
inventory is forecasted to
jump by 51% between 2013
and 2015 while the other
luxury utility segments climb
by only 20%, but the luxury
compact utility segment is
unique in that its used supply
has also consistently grown over the past five years. As a result, used luxury compact
utility prices are expected to fall by an average of 3.8% over 2014 and 2015 compared to
only 3.6% and 3% for luxury mid-size utilities and luxury large SUVs. This boost in
inventory is expected to have an especially negative effect on used prices for luxury
compact utilities and lead to a 2.2-percentage point decrease year-over-year in 2015.
Meanwhile, forecast inventory in 2015 reveals just a 17% increase in luxury large SUV
units compared to 2013, which shows declining consumer demand for such vehicles.
Despite the smaller rise in supply, prices for the luxury large SUV segment are expected
to fall by an average of 3.6% through 2015, or slightly less than what is forecast for the
compact luxury segment. The more pronounced decline in price, despite the less severe
rise in supply, is again due largely to the steeper depreciation curve associated with
more expensive vehicles and softer demand for large trucks in general. Supply for luxury
mid-size utilities is projected to grow by 21% through 2015, with prices forecast to
decline by an average of 3% over the period.
Compact Car Mid-Size Car Large Car Compact Utility Mid-Size Utility Large SUV
2014 8% 11% -7.2% 29% 11% 11%
2015 14% 10% 6.1% 17% 5.4% 8.8%
Compact Car Mid-Size Car Large Car Compact Utility Mid-Size Utility Large SUV
2014 -2.7% -5.3% -4.5% -2.6% -4.2% -2.1%
2015 -3.5% -3.8% -2.9% -4.9% -3.1% -3.8%
%-Point Change -0.8% 1.5% 1.6% -2.2% 1.1% -1.7%
YoY Used Luxury Car Price Change YoY Used Luxury Utility Price ChangeYear
YearYoY Used Luxury Car Supply Change YoY Used Luxury Utility Supply Change

Perspective | April 2014
NADA Used Car Guide | 8400 Westpark Drive | McLean, VA 22102 | 800.544.6232 | nada.com/b2b 7
© 2014 NADA Used Car Guide
Thoughts on the Future
Just as every action has an equal and opposite reaction, the shifting preferences of
luxury buyers toward more practical, value-oriented compact cars and utilities has
caused a boost in new vehicle sales that will inevitably result in rising used supply and
softer used prices. With the high volume of new sales units in these segments during
2012 and 2013 returning in 2015 and 2016 for three-year off-lease vehicles, it will not be
a surprise to see declining used prices continuing beyond 2015 for both luxury compact
cars and luxury compact utilities. Over the years, luxury compact cars and utilities have
progressively shown to be great values for the money, but with the rising popularity of
these products continuing into the future, the laws of supply and demand will
unavoidably impact value retention and used prices.

Perspective | April 2014
NADA Used Car Guide | 8400 Westpark Drive | McLean, VA 22102 | 800.544.6232 | nada.com/b2b 8
© 2014 NADA Used Car Guide
AT NADA USED CAR GUIDE
Financial Industry, Accounting, Legal, OEM Captive Steve Stafford 800.248.6232 x7275 [email protected]
Director, Sales and Customer Service Dan Ruddy 800.248.6232 x4707 [email protected]
Credit Unions, Fleet, Lease, Rental Industry, Government Doug Ott 800.248.6232 x4710 [email protected]
Automotive OEMs Stu Zalud 800.248.6232 x4636 [email protected]
Automotive Dealers, Auctions, Insurance Jim Dodd 800.248.6232 x7115 [email protected]
PR Manager Allyson Toolan 800.248.6232 x7165 [email protected]
Business Development Manager James Gibson 800.248.6232 x7136 [email protected]
What’s New
Available on iPhone, iPad and Android devices, the recently enhanced NADA MarketValues is
the fastest, easiest and most cost-efficient way to make smart vehicle decisions on the go. This
native app allows you to get your NADA values anywhere, anytime without an Internet
connection. Subscriptions start at $50 per month and when you download NADA
MarketValues from Google Play or the Apple Store for $1.99, you’ll receive a FREE 30-day trial!
On the Road
Jonathan Banks and Steve Stafford are attending the Auto Finance Risk Summit 2014 from May 5 – 6 in Newport Beach, California.
On Tuesday, May 6 at 11:15 a.m., Banks is participating on a panel titled “Collateral Values: How Much Will Valuations Drop?” The
panel will focus on the state of collateral values today, a possible timeline for a steeper decline and metrics for better portfolio
management.
Doug Ott is attending the Georgia Association of Tax Officials Conference on May 12—15 in Athens, Georgia. Stop by our booth to
see him. Larry Dixon is attending and speaking on a panel at the 18th Annual Non-Prime Auto Financing Conference on May 28—30
in Forth Worth Texas. Held by the National Automotive Finance Association, the event provides an excellent forum for education and
networking for those within the non-prime auto finance sector.
About NADA Used Car Guide
Since 1933, NADA Used Car Guide has earned its reputation as the leading provider of
vehicle valuation products, services and information to businesses throughout the United
States and worldwide. NADA’s editorial team collects and analyzes over one million
combined automotive and truck wholesale and retail transactions per month. Its
guidebooks, auction data, analysis and data solutions offer automotive/truck, finance,
insurance and government professionals the timely information and reliable solutions
they need to make better business decisions. Visit nada.com/b2b to learn more.

Perspective | April 2014
NADA Used Car Guide | 8400 Westpark Drive | McLean, VA 22102 | 800.544.6232 | nada.com/b2b 9
© 2014 NADA Used Car Guide
NADA CONSULTING SERVICES
NADA’s market intelligence team leverages a database of nearly 200 million automotive transactions and more than
100 economic and automotive market-related series to describe the factors driving current trends to help industry
stakeholders make more informed decisions. Analyzing data at both wholesale and retail levels, the team continuously
provides content that is both useful and usable to the automotive industry, financial institutions, businesses and
consumers.
Complemented by NADA’s analytics team, which maintains and advances NADA’s internal forecasting models and
develops customized forecasting solutions for automotive clients, the market intelligence team is responsible for
publishing white papers, special reports and the Used Car & Truck Blog. Throughout every piece of content, the team
strives to go beyond what is happening in the automotive industry to confidently answer why it is happening and how it
will impact the market in the future.
Senior Director, Vehicle Analysis & Analytics Jonathan Banks 800.248.6232 x4709 [email protected]
Senior Manager, Market Intelligence Larry Dixon 800.248.6232 x4713 [email protected]
Automotive Analyst David Paris 800.248.6232 x7044 [email protected]
Automotive Analyst Joseph Choi 800.248.6232 x4706 [email protected]
ADDITIONAL RESOURCES
Connect with NADA
White Papers NADA’s white papers and special reports aim to inform industry stakeholders on current and expected used vehicle price movement to better maximize today’s opportunities and manage tomorrow’s risk.
Used Car & Truck Blog Written and managed by the Market Intelligence team, the Used Car & Truck Blog analyzes market data, lends insight into industry trends and highlights relevant events.
NADA Perspective
Leveraging data from various industry
sources and NADA’s analysts, NADA
Perspective takes a deep dive into a
range of industry trends to determine
why they are happening and what to
expect in the future.
Guidelines Updated monthly with a robust data set from various industry sources and NADA’s own proprietary analytical tool, Guidelines provides the insight needed to make decisions in today’s market.
Read our Blog
nada.com/usedcar
Follow Us on Twitter
@NADAUsedCarGde
Find Us on Facebook
Facebook.com/NADAUsedCarGuide
Watch Us on YouTube
Youtube.com/NADAUsedCarGuide
Disclaimer: NADA Used Car Guide makes no representations about future performance or results based on the data and the contents available in this report (“Guidelines”). Guidelines is provided for informational purposes only and is provided AS IS without warranty or guarantee of any kind. By accessing Guidel ines via email or the NADA website, you agree not to reprint, reproduce, or distribute Guidelines without the express written permission of NADA Used Car Guide.