naiop northern virginia 2017 annual forecast · no update reduce corporate ... cushman &...
TRANSCRIPT

NAIOP Northern Virginia
2017 Annual Forecast

Today’s Discussion
U.S. Economic &Market Outlook
Ken McCarthy, Principal Economist
February 16, 2017

Today’s Discussion
The Longest Expansion Ever?
Cyclical Drivers
Long Term Drivers
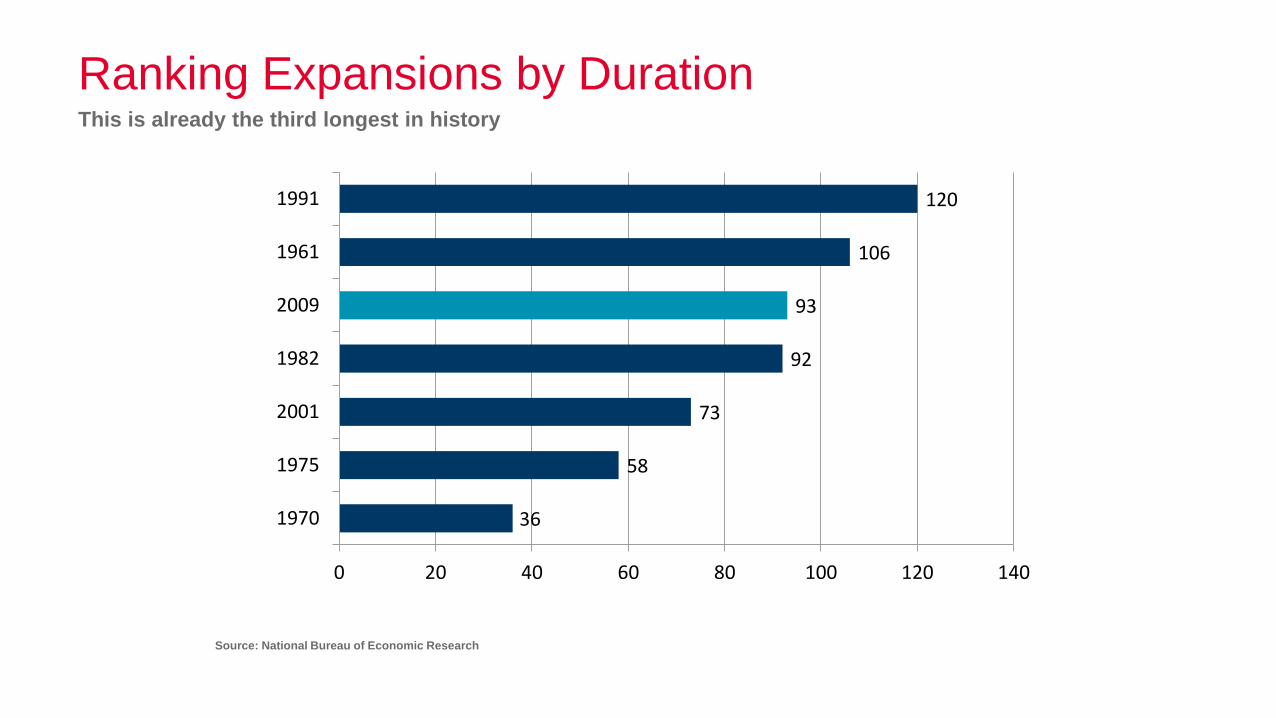
Ranking Expansions by DurationThis is already the third longest in history
36
58
73
92
93
106
120
0 20 40 60 80 100 120 140
1970
1975
2001
1982
2009
1961
1991
Source: National Bureau of Economic Research
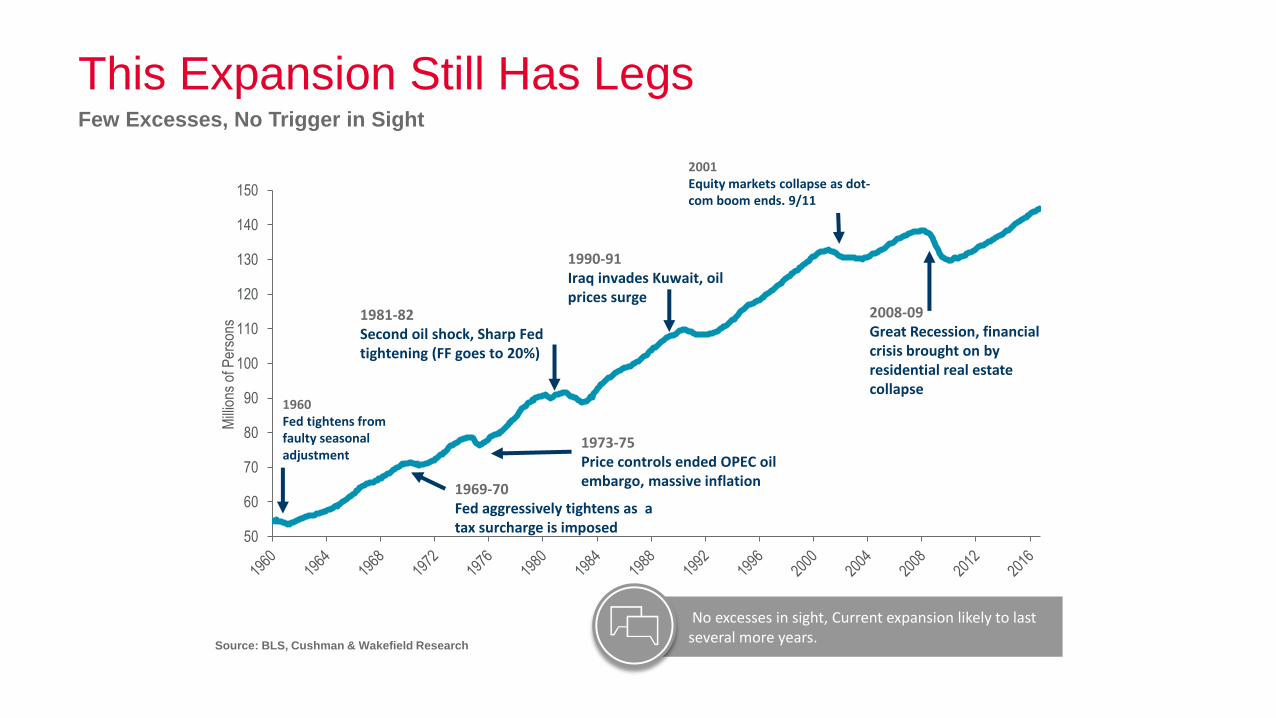
This Expansion Still Has LegsFew Excesses, No Trigger in Sight
50
60
70
80
90
100
110
120
130
140
150
Mill
ions
of P
erso
ns
1969-70Fed aggressively tightens as a tax surcharge is imposed
1973-75Price controls ended OPEC oil embargo, massive inflation
1981-82Second oil shock, Sharp Fed tightening (FF goes to 20%)
1990-91Iraq invades Kuwait, oil prices surge
2008-09Great Recession, financial crisis brought on by residential real estate collapse
1960Fed tightens from faulty seasonal adjustment
2001Equity markets collapse as dot-com boom ends. 9/11
Source: BLS, Cushman & Wakefield Research
No excesses in sight, Current expansion likely to last several more years.
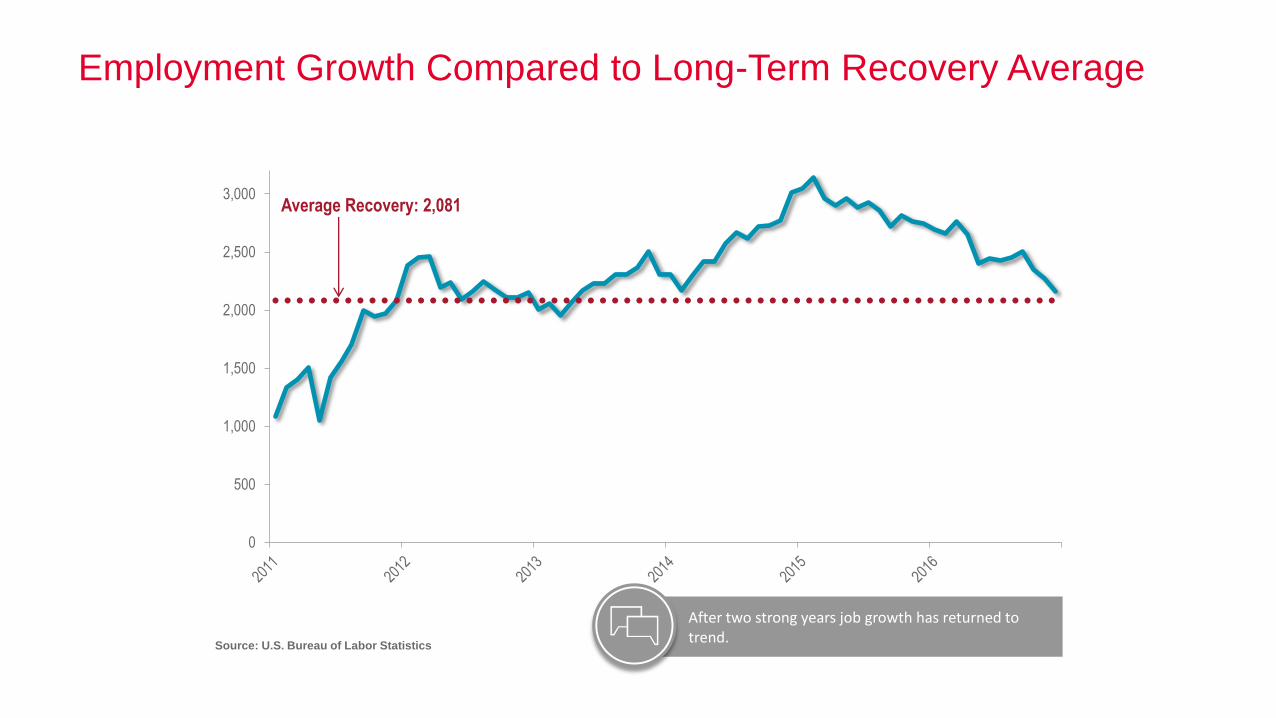
Employment Growth Compared to Long-Term Recovery Average
Average Recovery: 2,081
0
500
1,000
1,500
2,000
2,500
3,000
Source: U.S. Bureau of Labor Statistics
After two strong years job growth has returned to trend.
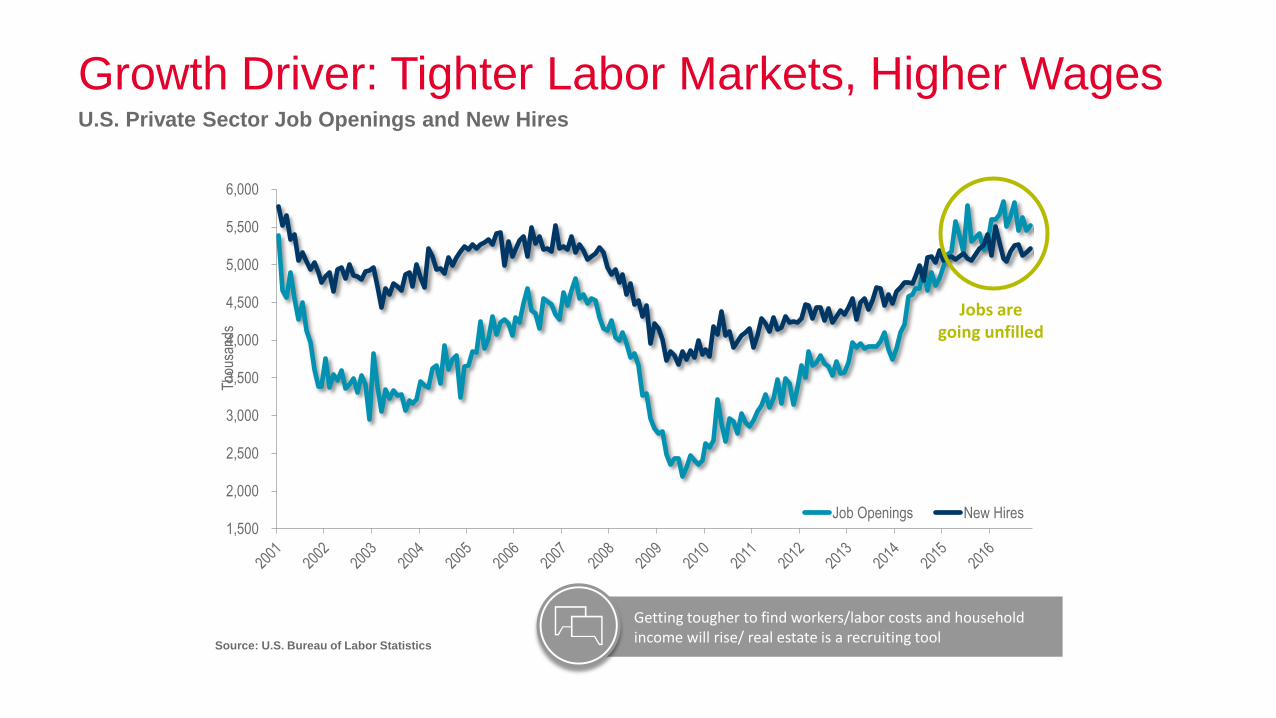
Growth Driver: Tighter Labor Markets, Higher WagesU.S. Private Sector Job Openings and New Hires
Source: U.S. Bureau of Labor Statistics
1,500
2,000
2,500
3,000
3,500
4,000
4,500
5,000
5,500
6,000
Tho
usan
ds
Job Openings New Hires
Jobs are going unfilled
Getting tougher to find workers/labor costs and household income will rise/ real estate is a recruiting tool

Atlanta Fed Wage Growth TrackerY-O-Y
1.5%
2.0%
2.5%
3.0%
3.5%
4.0%
4.5%
5.0%
5.5%
Per
cent
Cha
nge
from
1 Y
ear A
go 3
-mon
th m
ovin
g av
erag
e
Source: Federal Reserve Bank of Atlanta
Wages will continue to accelerate over the next two years, boosting income
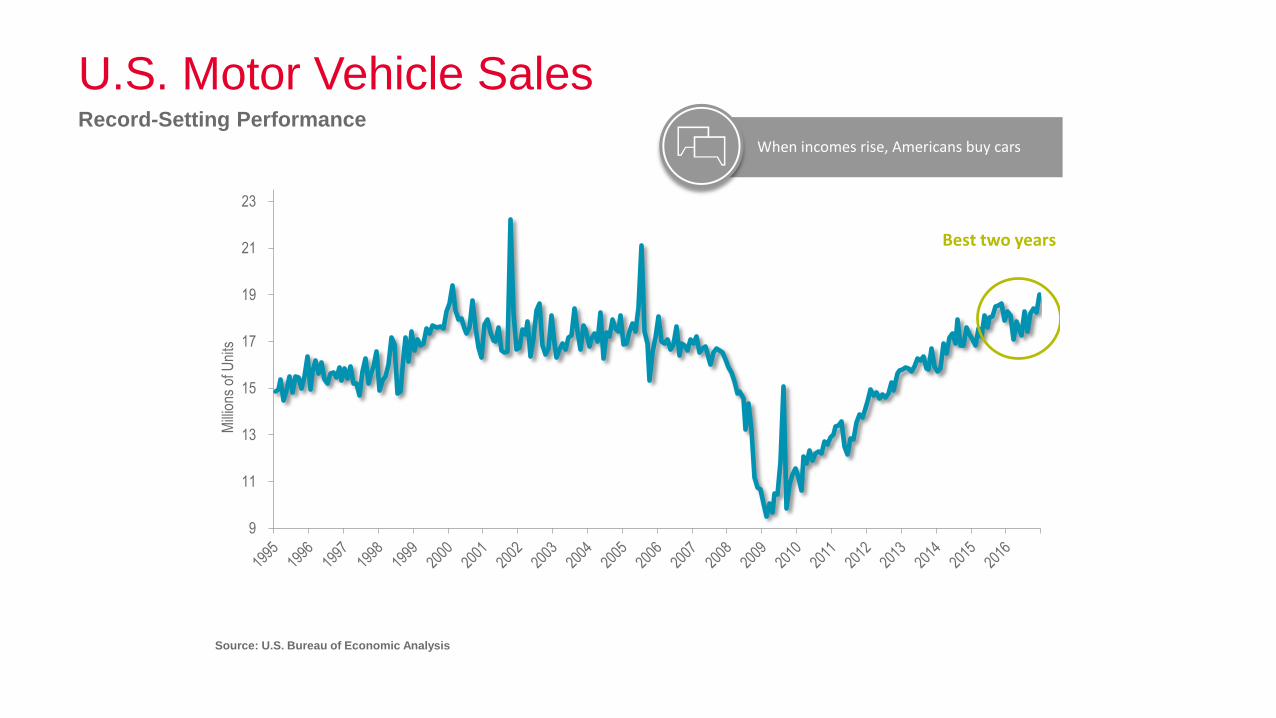
U.S. Motor Vehicle SalesRecord-Setting Performance
9
11
13
15
17
19
21
23
Mill
ions
of U
nits
Best two years
Source: U.S. Bureau of Economic Analysis
When incomes rise, Americans buy cars

Now What?
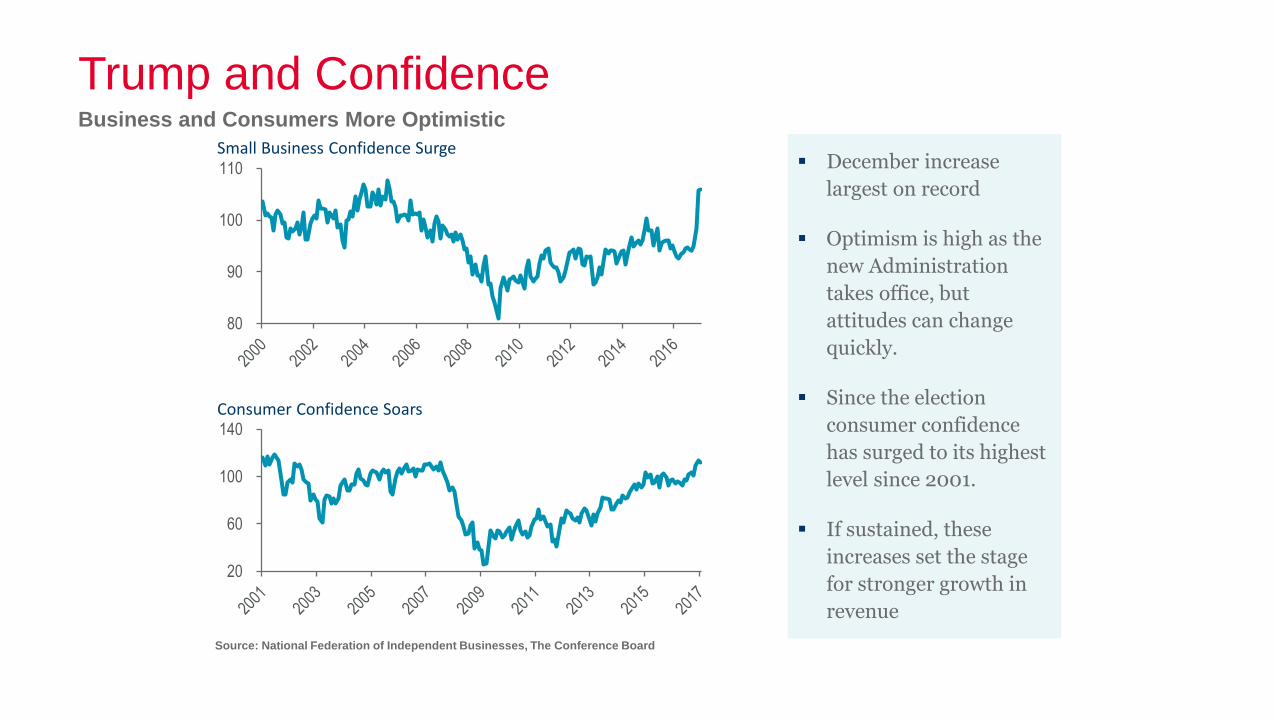
Trump and ConfidenceBusiness and Consumers More Optimistic
December increase
largest on record
Optimism is high as the
new Administration
takes office, but
attitudes can change
quickly.
Since the election
consumer confidence
has surged to its highest
level since 2001.
If sustained, these
increases set the stage
for stronger growth in
revenue
80
90
100
110
20
60
100
140
Small Business Confidence Surge
Consumer Confidence Soars
Source: National Federation of Independent Businesses, The Conference Board
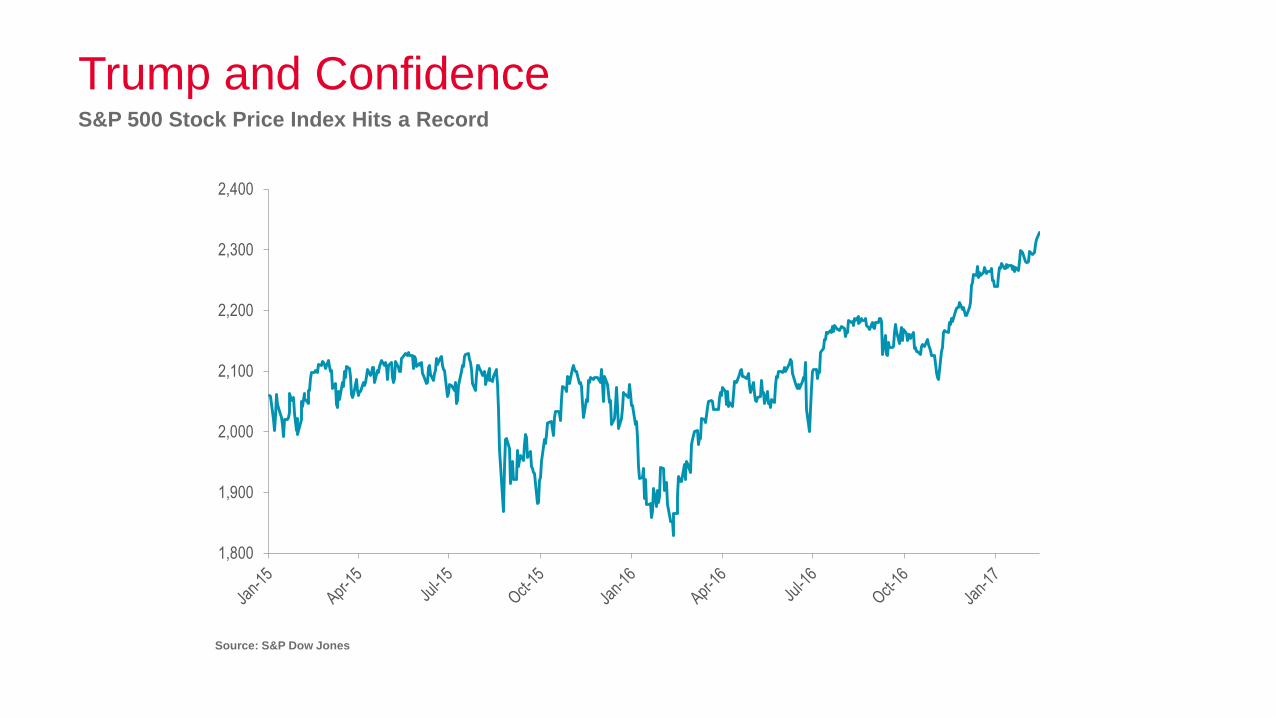
Trump and ConfidenceS&P 500 Stock Price Index Hits a Record
1,800
1,900
2,000
2,100
2,200
2,300
2,400
Source: S&P Dow Jones
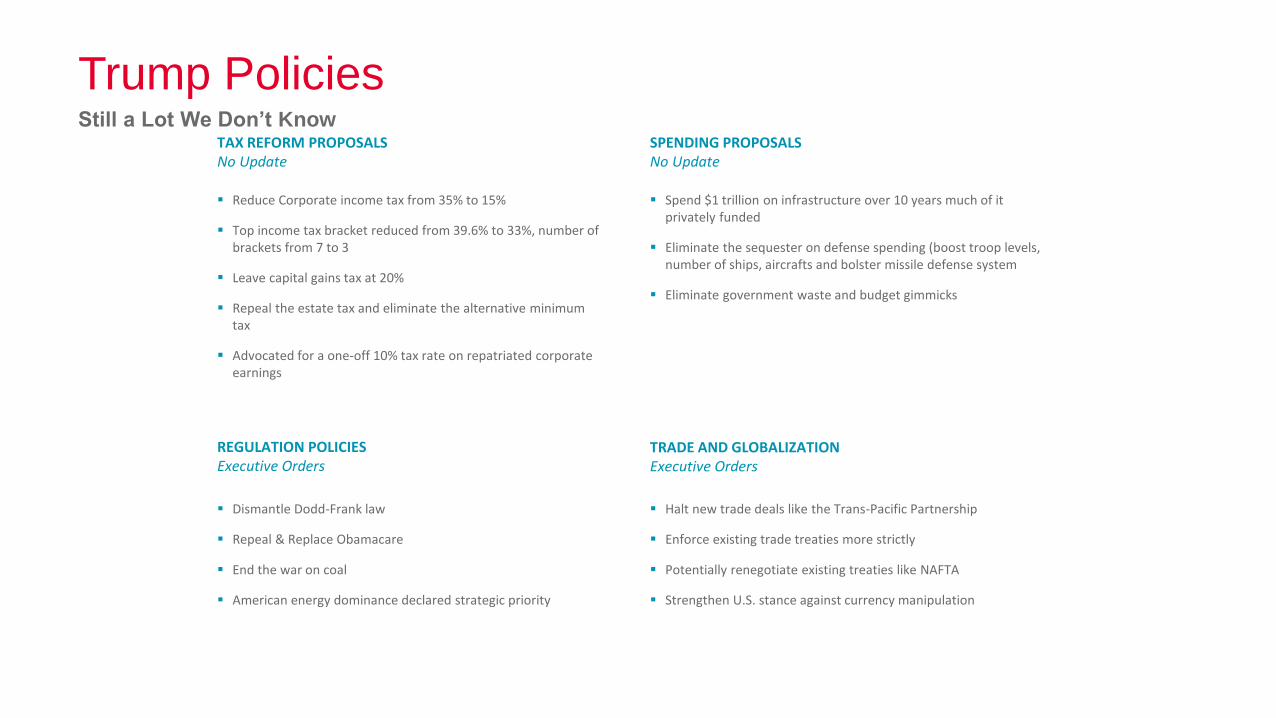
Trump PoliciesStill a Lot We Don’t Know
TAX REFORM PROPOSALSNo Update
Reduce Corporate income tax from 35% to 15%
Top income tax bracket reduced from 39.6% to 33%, number of brackets from 7 to 3
Leave capital gains tax at 20%
Repeal the estate tax and eliminate the alternative minimum tax
Advocated for a one-off 10% tax rate on repatriated corporate earnings
REGULATION POLICIESExecutive Orders
Dismantle Dodd-Frank law
Repeal & Replace Obamacare
End the war on coal
American energy dominance declared strategic priority
SPENDING PROPOSALSNo Update
Spend $1 trillion on infrastructure over 10 years much of it privately funded
Eliminate the sequester on defense spending (boost troop levels, number of ships, aircrafts and bolster missile defense system
Eliminate government waste and budget gimmicks
Halt new trade deals like the Trans-Pacific Partnership
Enforce existing trade treaties more strictly
Potentially renegotiate existing treaties like NAFTA
Strengthen U.S. stance against currency manipulation
TRADE AND GLOBALIZATIONExecutive Orders
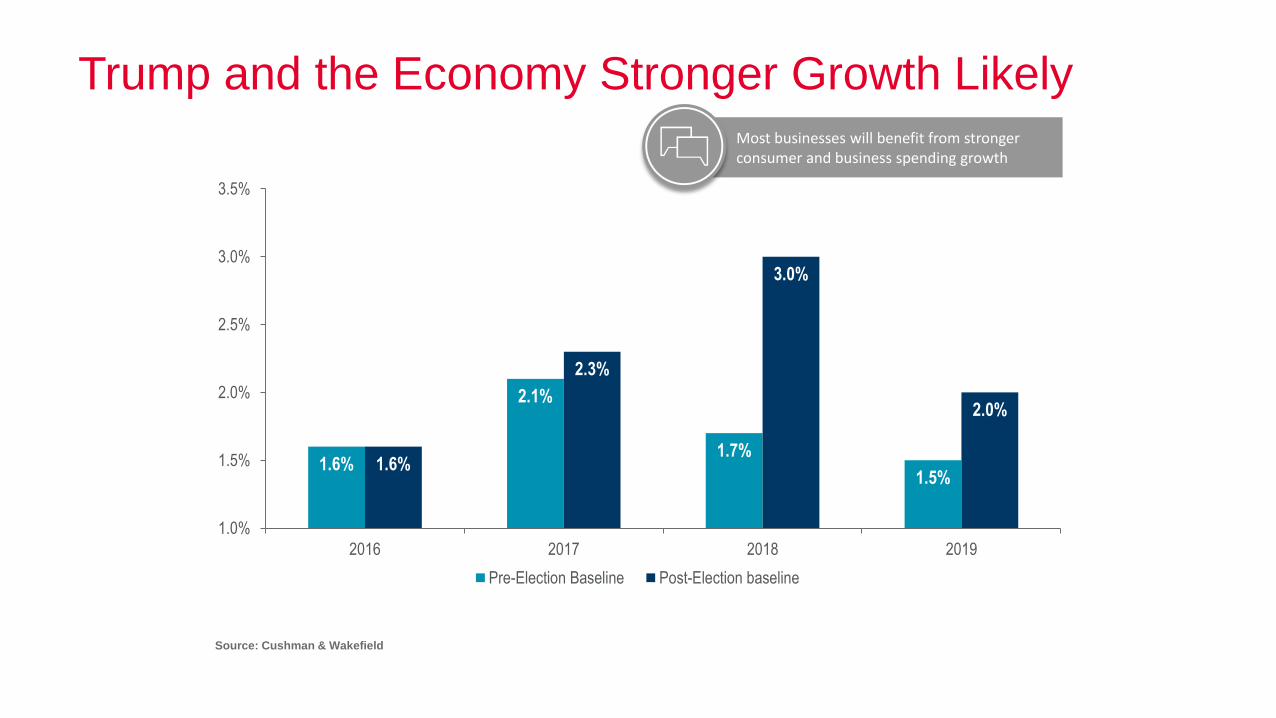
Trump and the Economy Stronger Growth Likely
1.6%
2.1%
1.7%
1.5%1.6%
2.3%
3.0%
2.0%
1.0%
1.5%
2.0%
2.5%
3.0%
3.5%
2016 2017 2018 2019
Pre-Election Baseline Post-Election baseline
Most businesses will benefit from stronger consumer and business spending growth
Source: Cushman & Wakefield
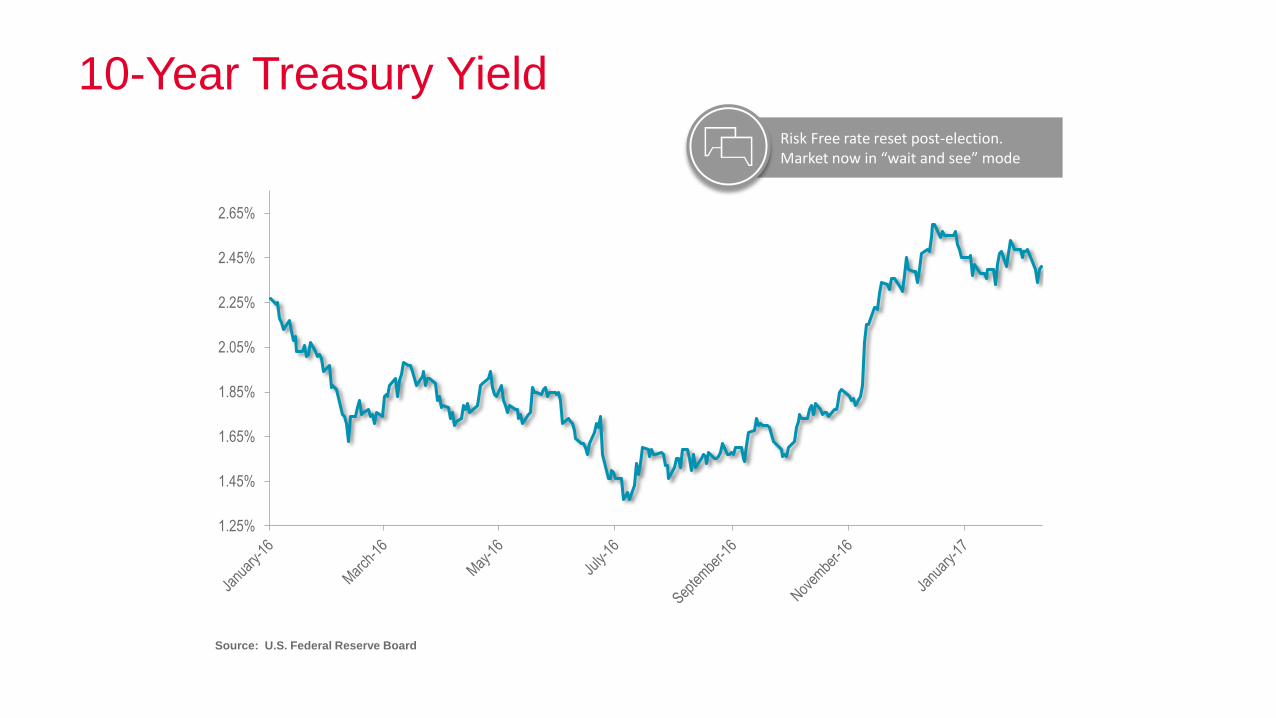
10-Year Treasury Yield
Source: U.S. Federal Reserve Board
1.25%
1.45%
1.65%
1.85%
2.05%
2.25%
2.45%
2.65%
Risk Free rate reset post-election. Market now in “wait and see” mode
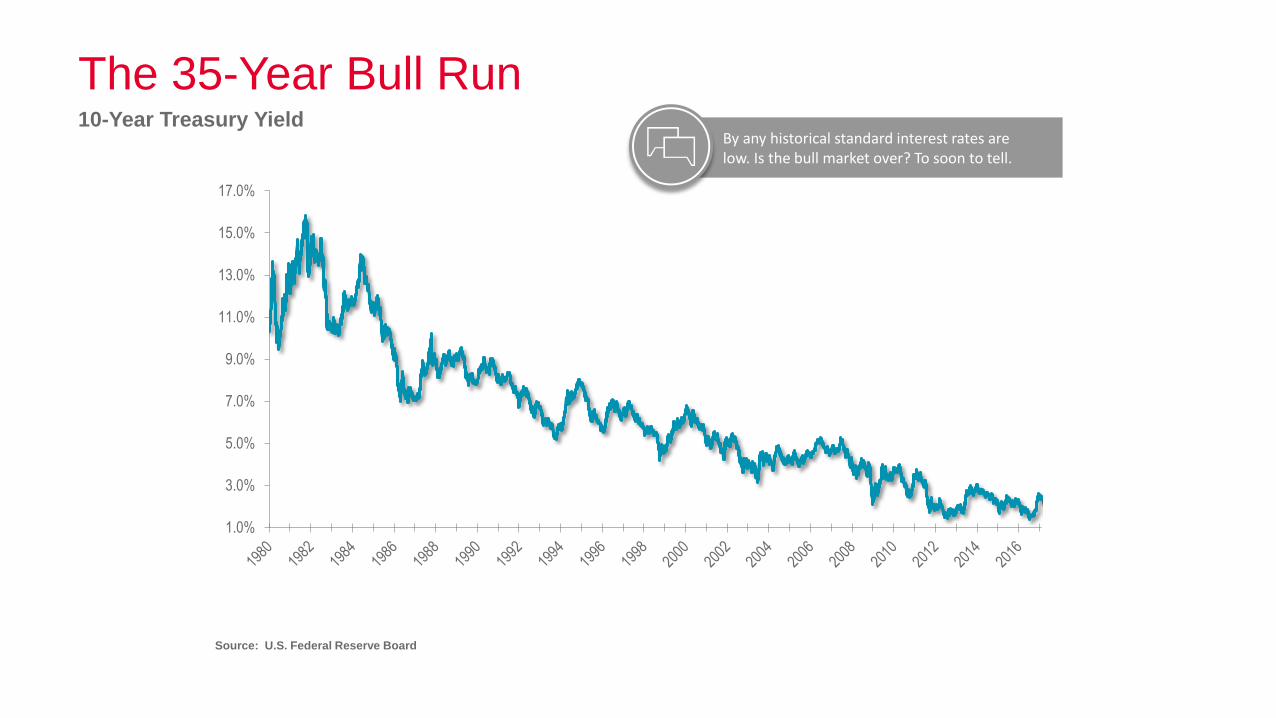
The 35-Year Bull Run10-Year Treasury Yield
Source: U.S. Federal Reserve Board
By any historical standard interest rates are low. Is the bull market over? To soon to tell.
1.0%
3.0%
5.0%
7.0%
9.0%
11.0%
13.0%
15.0%
17.0%
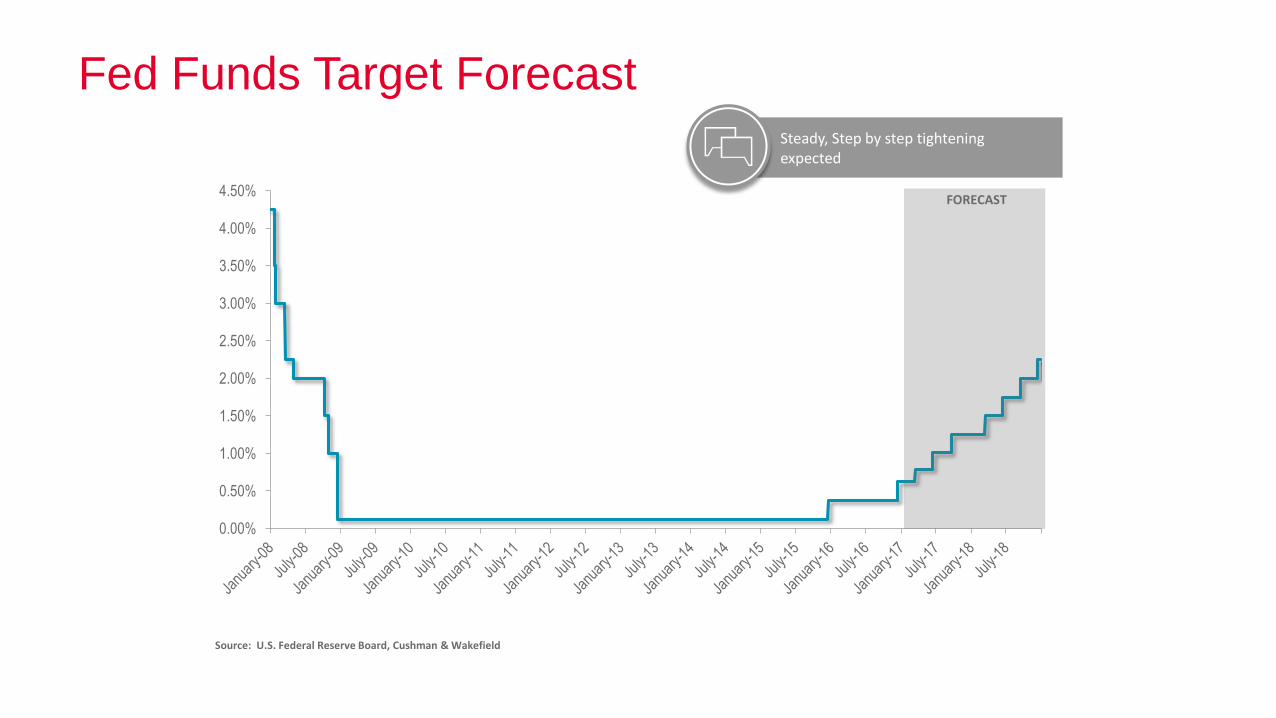
Fed Funds Target Forecast
Source: U.S. Federal Reserve Board, Cushman & Wakefield
0.00%
0.50%
1.00%
1.50%
2.00%
2.50%
3.00%
3.50%
4.00%
4.50%
Steady, Step by step tightening expected
FORECAST

Long-TermTrends Millennials and Real Estate:
The Urbanization Trend will Continue

0.00 0.50 1.00 1.50 2.00 2.50 3.00 3.50 4.00 4.50 5.00
15
18
21
24
27
30
33
36
39
42
45
48
51
54
57
60
63
66
69
Millions of Persons
Age
Millennials: 90.8 Million
Boomers: 79.1 Million
Millennials Are Now the Largest Component of the Labor Force
Source: U.S. Census Bureau
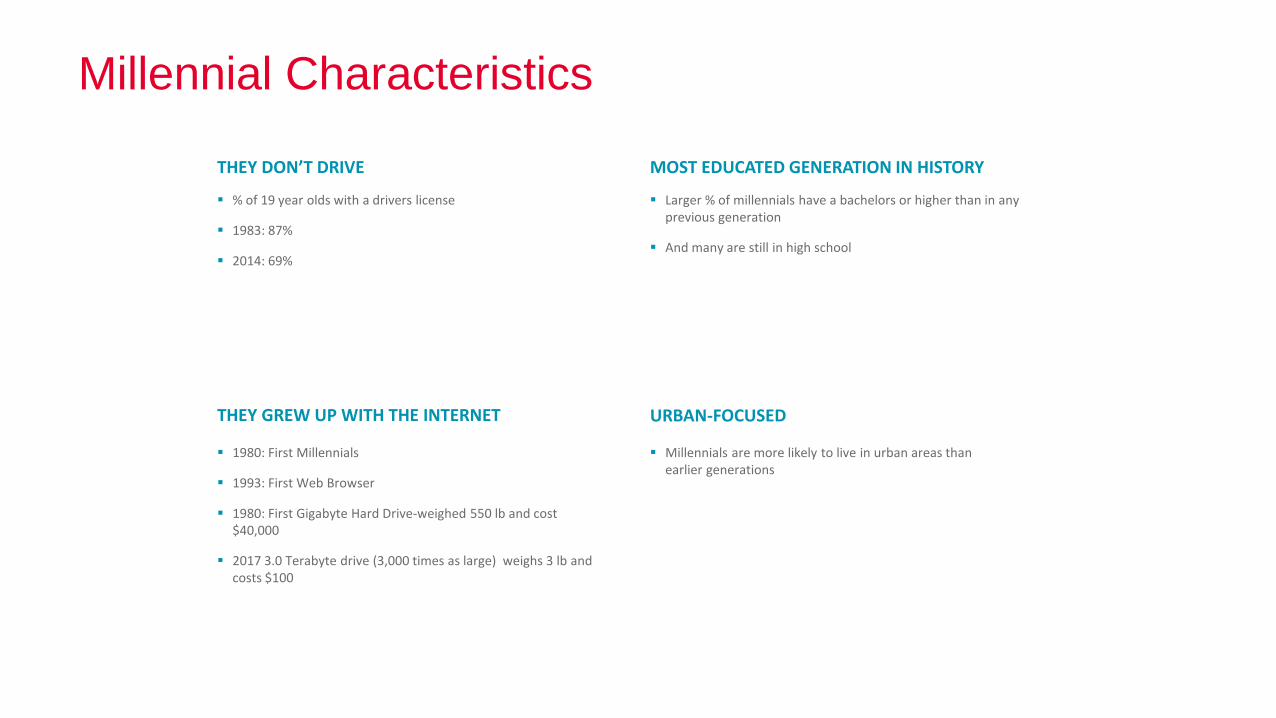
Millennial Characteristics
THEY DON’T DRIVE
% of 19 year olds with a drivers license
1983: 87%
2014: 69%
THEY GREW UP WITH THE INTERNET
1980: First Millennials
1993: First Web Browser
1980: First Gigabyte Hard Drive-weighed 550 lb and cost $40,000
2017 3.0 Terabyte drive (3,000 times as large) weighs 3 lb and costs $100
MOST EDUCATED GENERATION IN HISTORY
Larger % of millennials have a bachelors or higher than in any previous generation
And many are still in high school
Millennials are more likely to live in urban areas than earlier generations
URBAN-FOCUSED

They are Mostly in Their 20s
Source: U.S. Census Bureau
3,000
3,200
3,400
3,600
3,800
4,000
4,200
4,400
4,600
4,800
16 18 20 22 24 26 28 30 32 34 36 38 40 42 44 46 48 50 52 54 56 58 60 62 64
Num
ber
of P
eopl
e
Age
Population
Aged 20 to 29

Change in Employment Core Vs. Periphery
Source: CityObservatory Surging Center City Job Growth
0.10%
0.5%
1.2%
-0.1%
-0.2%
0.0%
0.2%
0.4%
0.6%
0.8%
1.0%
1.2%
2002-2007 2007-2011
Core Periphery

Today’s Discussion
Fact Checker
Millenials?
Trump Effect?
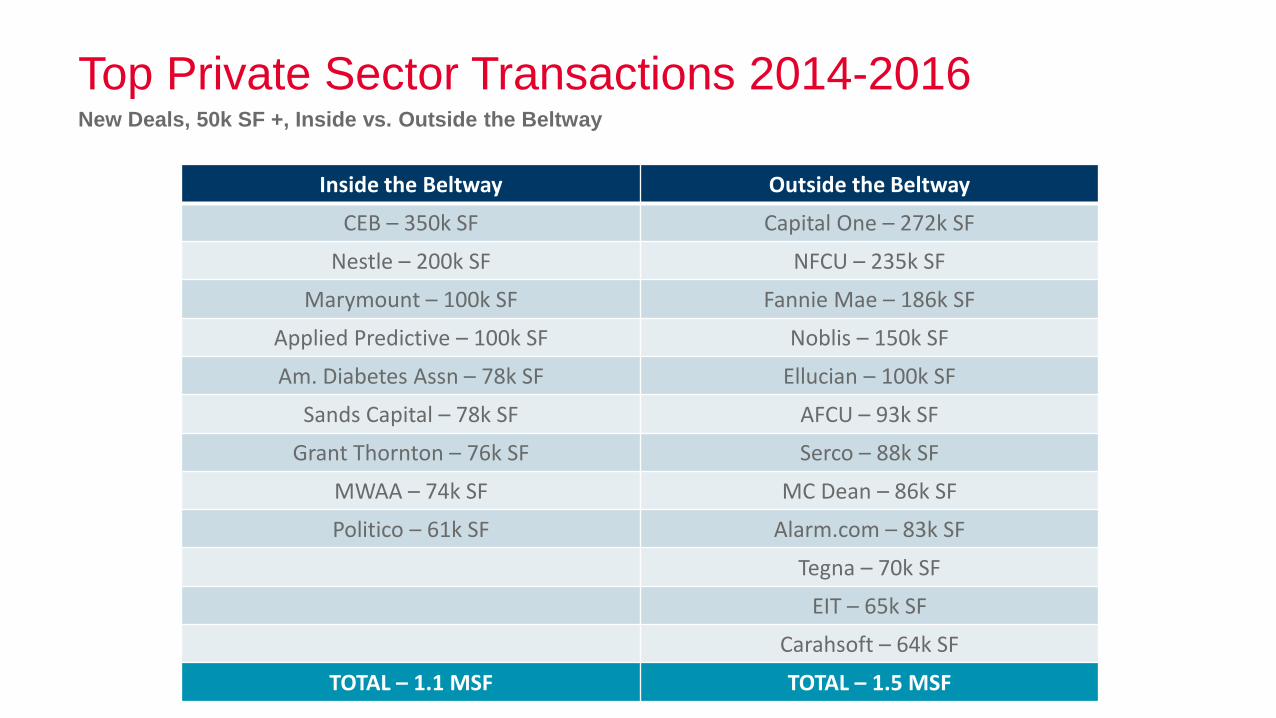
Top Private Sector Transactions 2014-2016New Deals, 50k SF +, Inside vs. Outside the Beltway
Inside the Beltway Outside the Beltway
CEB – 350k SF Capital One – 272k SF
Nestle – 200k SF NFCU – 235k SF
Marymount – 100k SF Fannie Mae – 186k SF
Applied Predictive – 100k SF Noblis – 150k SF
Am. Diabetes Assn – 78k SF Ellucian – 100k SF
Sands Capital – 78k SF AFCU – 93k SF
Grant Thornton – 76k SF Serco – 88k SF
MWAA – 74k SF MC Dean – 86k SF
Politico – 61k SF Alarm.com – 83k SF
Tegna – 70k SF
EIT – 65k SF
Carahsoft – 64k SF
TOTAL – 1.1 MSF TOTAL – 1.5 MSF
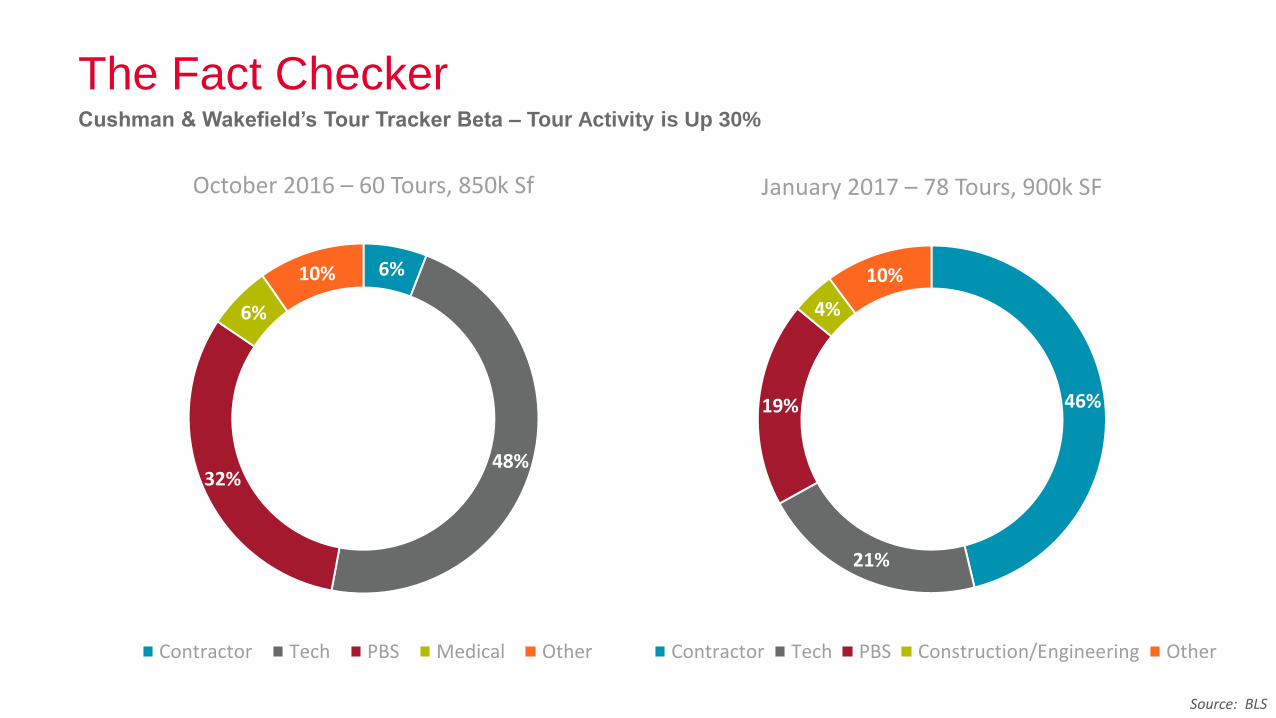
6%
48%32%
6%
10%
October 2016 – 60 Tours, 850k Sf
Contractor Tech PBS Medical Other
The Fact CheckerCushman & Wakefield’s Tour Tracker Beta – Tour Activity is Up 30%
Source: BLS
46%
21%
19%
4%
10%
January 2017 – 78 Tours, 900k SF
Contractor Tech PBS Construction/Engineering Other

Today’s Discussion
Northern Virginia Economic &Market Outlook
Nate Edwards, Regional Director
February 16, 2017
Today’s Discussion
NoVA Economy
The Trump Impact
Office Leasing
Capital Markets

Current Local Economy - Very Strong
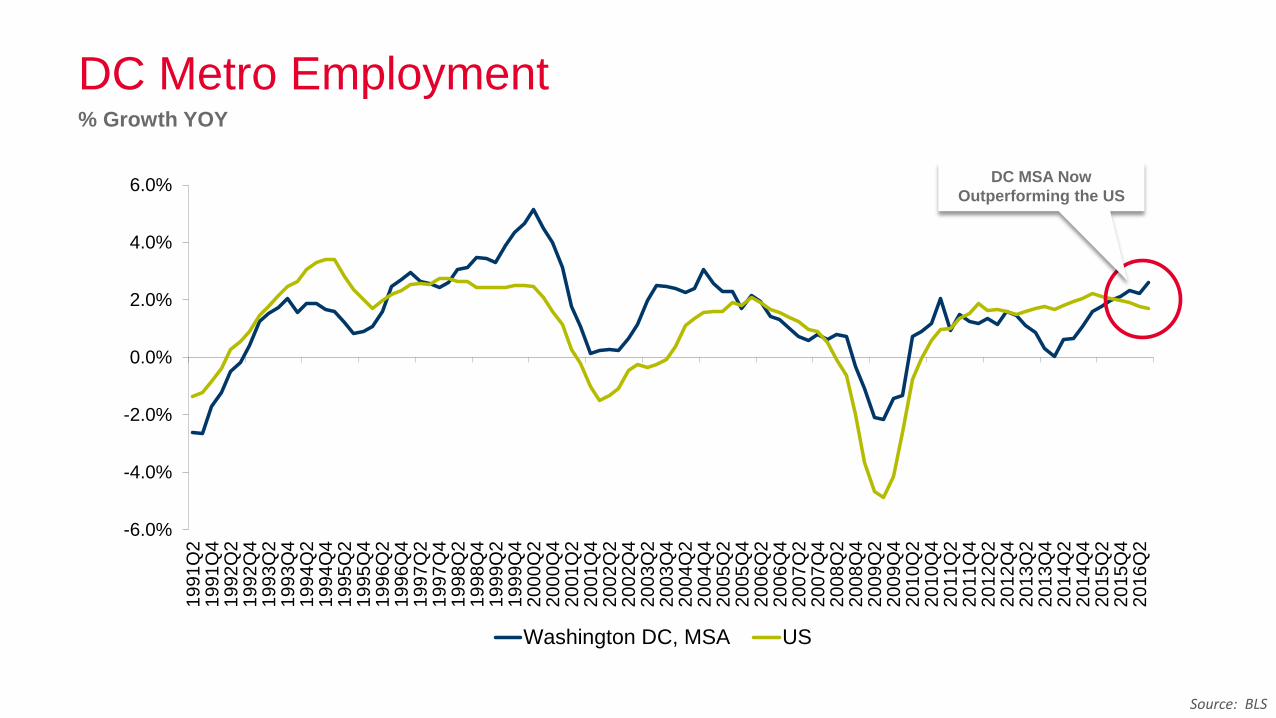
DC Metro Employment% Growth YOY
-6.0%
-4.0%
-2.0%
0.0%
2.0%
4.0%
6.0%1
99
1Q
21
99
1Q
41992Q
21
99
2Q
41
99
3Q
21
99
3Q
41
99
4Q
21
99
4Q
41
99
5Q
21
99
5Q
41
99
6Q
21996Q
41
99
7Q
21
99
7Q
41
99
8Q
21
99
8Q
41
99
9Q
21
99
9Q
42
00
0Q
22
00
0Q
42001Q
22
00
1Q
42
00
2Q
22
00
2Q
42
00
3Q
22
00
3Q
42
00
4Q
22
00
4Q
42
00
5Q
22005Q
42
00
6Q
22
00
6Q
42
00
7Q
22
00
7Q
42
00
8Q
22
00
8Q
42
00
9Q
22
00
9Q
42010Q
22
01
0Q
42
01
1Q
22
01
1Q
42
01
2Q
22
01
2Q
42
01
3Q
22
01
3Q
42
01
4Q
22
01
4Q
42
01
5Q
22
01
5Q
42
01
6Q
2
Washington DC, MSA US
DC MSA Now
Outperforming the US
Source: BLS
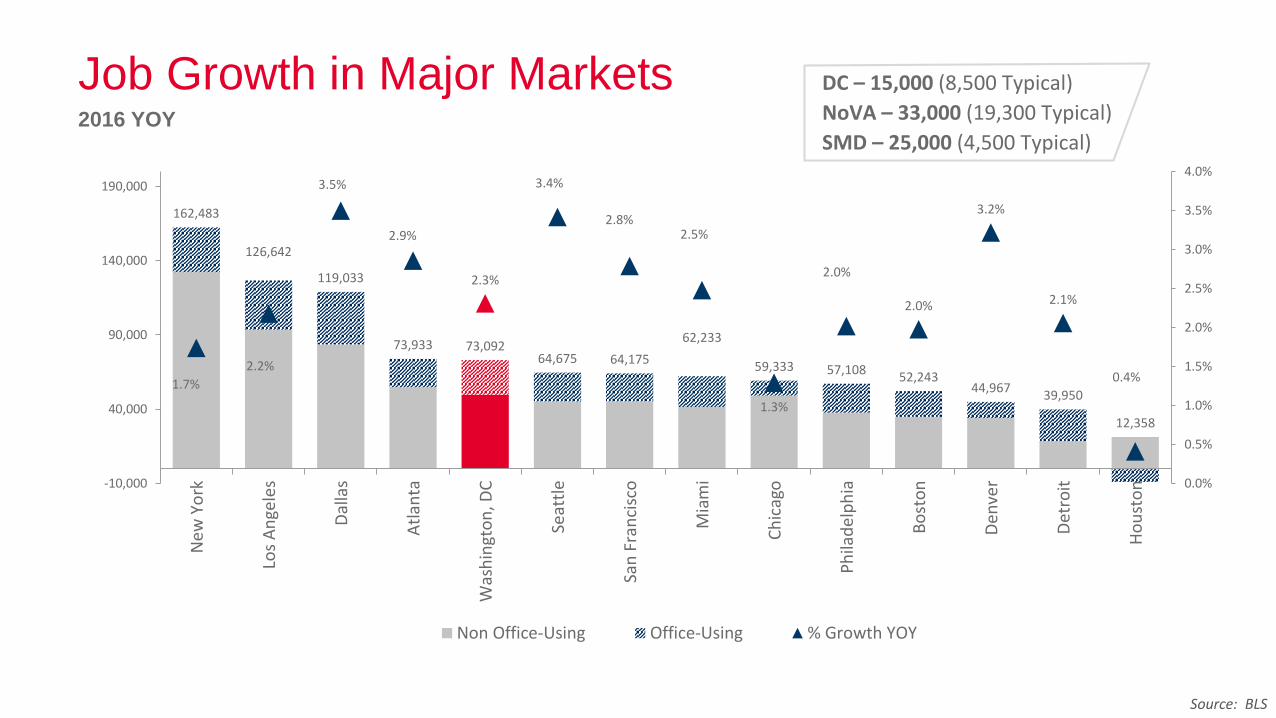
Job Growth in Major Markets2016 YOY
Source: BLS
162,483
126,642
119,033
73,933 73,09264,675 64,175
62,233
59,333 57,10852,243
44,96739,950
12,358
1.7%
2.2%
3.5%
2.9%
2.3%
3.4%
2.8%2.5%
1.3%
2.0%
2.0%
3.2%
2.1%
0.4%
0.0%
0.5%
1.0%
1.5%
2.0%
2.5%
3.0%
3.5%
4.0%
-10,000
40,000
90,000
140,000
190,000N
ew Y
ork
Los
An
gele
s
Dal
las
Atl
anta
Was
hin
gto
n, D
C
Seat
tle
San
Fra
nci
sco
Mia
mi
Ch
icag
o
Ph
ilad
elp
hia
Bo
sto
n
Den
ver
Det
roit
Ho
ust
on
Non Office-Using Office-Using % Growth YOY
DC – 15,000 (8,500 Typical)
NoVA – 33,000 (19,300 Typical)
SMD – 25,000 (4,500 Typical)

-2,090
390
4,760
7,400
8,810
11,110
12,220
20,510
-5,000 0 5,000 10,000 15,000 20,000
Information (75k)
Financial (156k)
Federal Government (370k)
Manufacturing & Construction (210k)
Retail (288k)
Leisure & Hospitality (321k)
Education & Healthcare (431k)
Professional & Business Services (742k)
# of Jobs
Employment by SectorDC Metro, 2016 YOY
(total sector employment)
Source: BLS
-110
90
1,640
490
4,920
3,840
3,580
12,220
-5,000 0 5,000 10,000 15,000 20,000
Information (42k)
Financial (70k)
Manufacturing & Construction (95k)
Federal Government (85k)
Retail (148k)
Leisure & Hospitality (142k)
Education & Healthcare (160k)
Professional & Business Services (400k)
# of Jobs
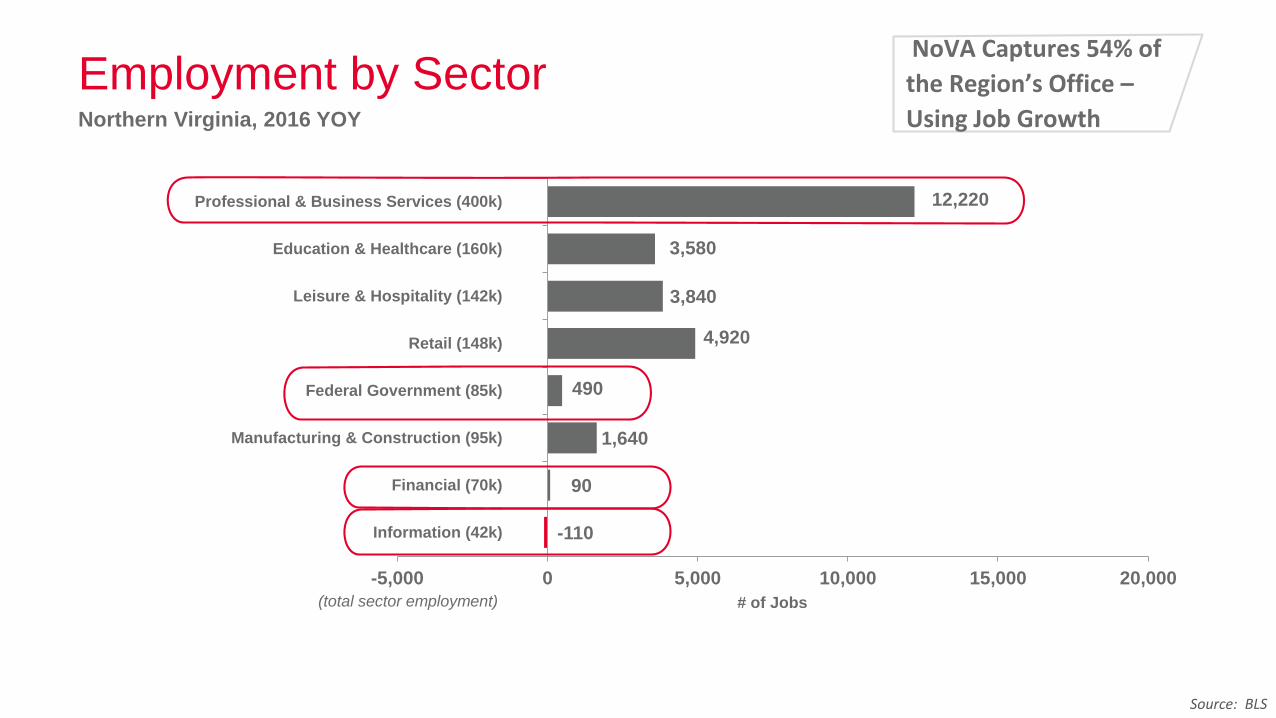
Employment by SectorNorthern Virginia, 2016 YOY
(total sector employment)
Source: BLS
NoVA Captures 54% of
the Region’s Office –
Using Job Growth

DC Metro Unemployment RateDC Metro vs. the US and Major Markets, Yearend 2016.
2.7%2.7%
3.7%3.7%
3.9%4.3%
4.5%4.7%4.8%4.9%
5.1%5.1%
5.5%5.6%5.7%
0% 2% 4% 6%
Boston
Denver
Washington, DC
San Francisco
Dallas
Seattle
New York
Los Angeles
United States
Philly
Atlanta
Miami
Houston
Detroit
Chicago
Source: BLS
2.8% 2.9%3.2% 3.3% 3.4%
3.9%4.2%
5.8%
0%
1%
2%
3%
4%
5%
6%
7%
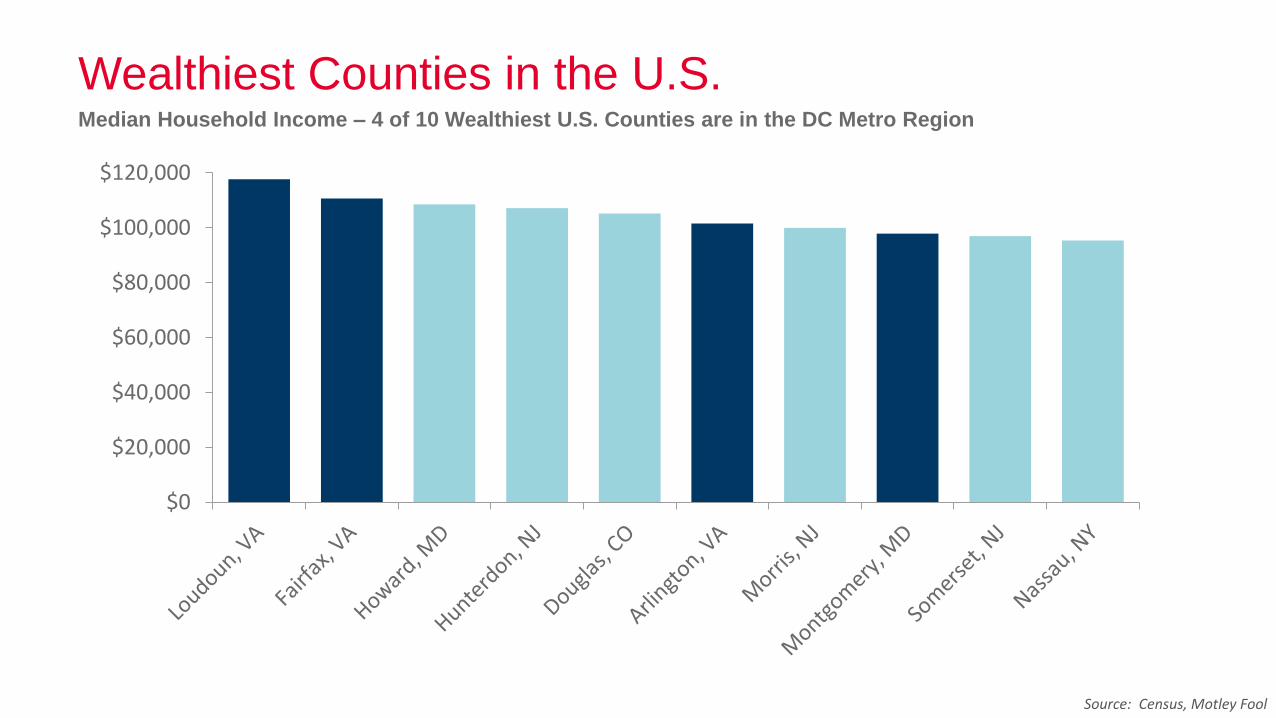
Wealthiest Counties in the U.S.Median Household Income – 4 of 10 Wealthiest U.S. Counties are in the DC Metro Region
$0
$20,000
$40,000
$60,000
$80,000
$100,000
$120,000
Source: Census, Motley Fool

DC Metro Economic Indicators
0%
10%
20%
30%
40%
50%
60%
$0$10,000$20,000$30,000$40,000$50,000$60,000$70,000$80,000$90,000
$100,000
Was
hin
gto
n, D
C
San
Fra
nci
sco
Bo
sto
n
New
Yo
rk
Den
ver
Ch
icag
o
Los
An
gele
s
Dal
las
Ho
ust
on
Atl
anta
Un
ited
Sta
tes
Det
roit
Mia
mi
Incomes and Education
Median Incomes
Educational Attainment - % of Population with Bachelor's
21
5
4
Fortune 1,000 HQ’s
NoVA DC Maryland
The Smartest, most Well-Paid Workforce in the Nation with Great Companies to Work For
Source: US Census, Forbes
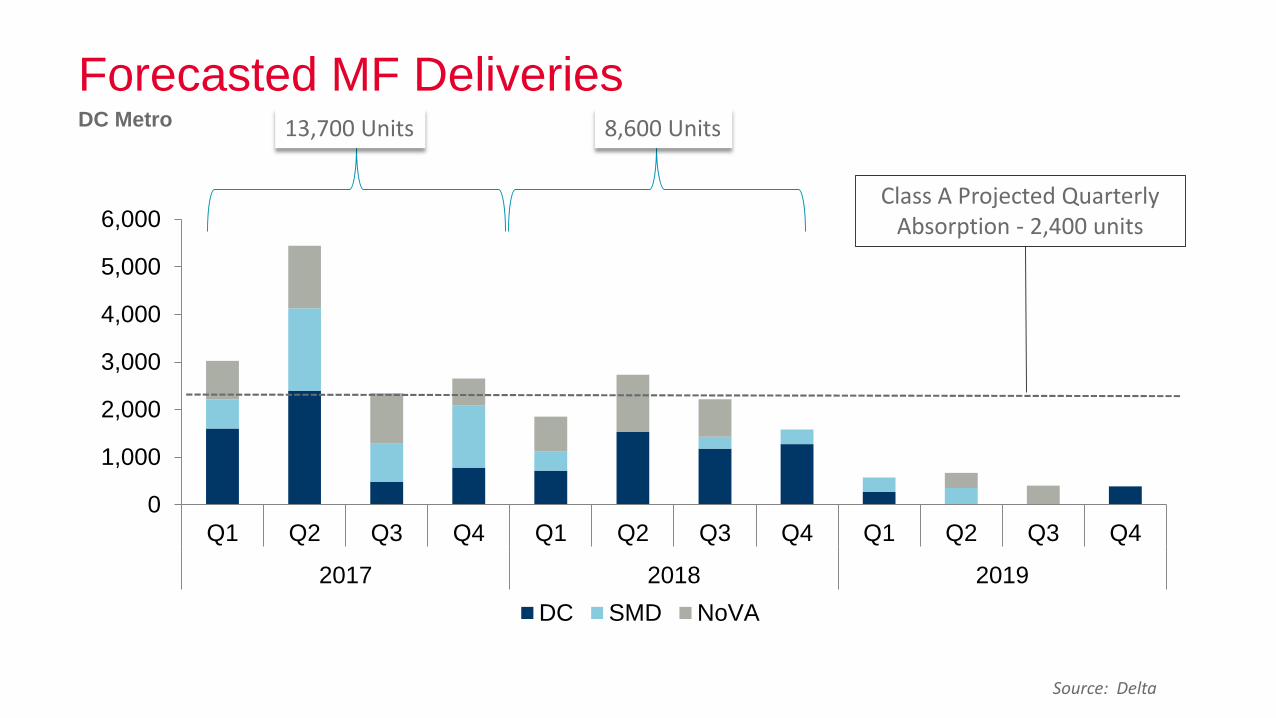
Forecasted MF Deliveries
0
1,000
2,000
3,000
4,000
5,000
6,000
Q1 Q2 Q3 Q4 Q1 Q2 Q3 Q4 Q1 Q2 Q3 Q4
2017 2018 2019
DC SMD NoVA
Source: Delta
13,700 Units 8,600 Units
Class A Projected Quarterly Absorption - 2,400 units
DC Metro

MF AbsorptionDC Metro
2,379
4,063
2,589
1,574
735
7,741
1,776
2,646
4,436
8,081
6,782
5,176
6,849
5,926
10,14710,631
8,266
0
2,000
4,000
6,000
8,000
10,000
12,0002
00
0
20
01
20
02
20
03
20
04
20
05
20
06
20
07
20
08
20
09
20
10
20
11
20
12
20
13
20
14
20
15
20
16
DC MD VA
Source: REIS, CoStar

By 2025…
850,000
Additional People327,000 Households 33,000 Units/Year 13,000 MF Units/Year
Source: Cushman & Wakefield

Trump Policies Could Mean Big Things for NoVA
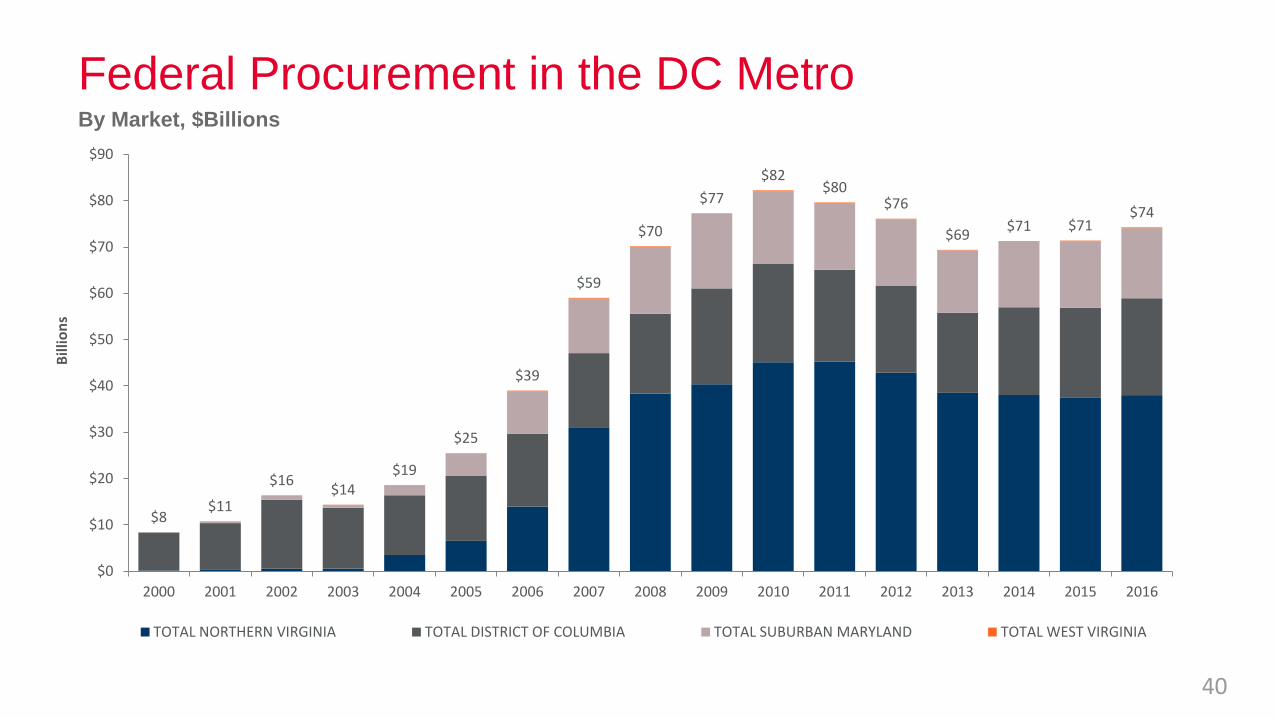
Federal Procurement in the DC MetroBy Market, $Billions
40
$8$11
$16$14
$19
$25
$39
$59
$70
$77
$82$80
$76
$69$71 $71
$74
$0
$10
$20
$30
$40
$50
$60
$70
$80
$90
2000 2001 2002 2003 2004 2005 2006 2007 2008 2009 2010 2011 2012 2013 2014 2015 2016
Bill
ion
s
TOTAL NORTHERN VIRGINIA TOTAL DISTRICT OF COLUMBIA TOTAL SUBURBAN MARYLAND TOTAL WEST VIRGINIA
$0
$10
$20
$30
$40
$50
$60
$70
$80
$90
Bill
ion
s
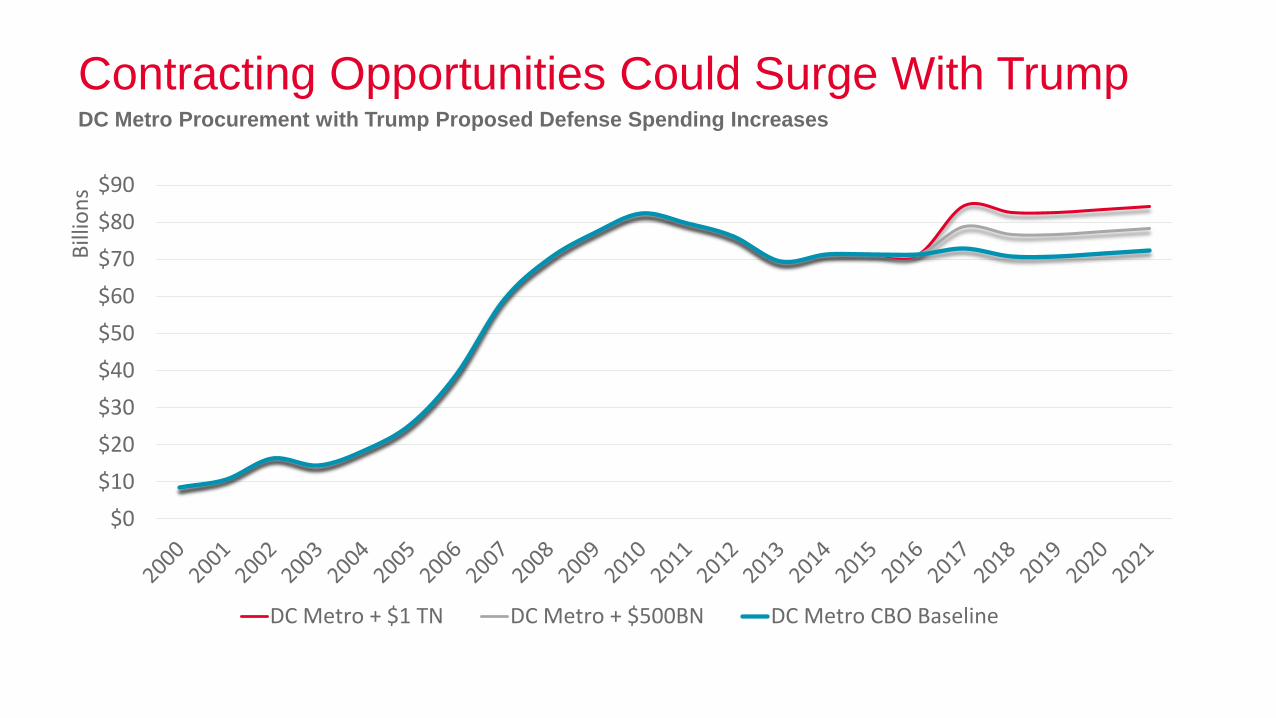
DC Metro + $1 TN DC Metro + $500BN DC Metro CBO Baseline
Contracting Opportunities Could Surge With TrumpDC Metro Procurement with Trump Proposed Defense Spending Increases
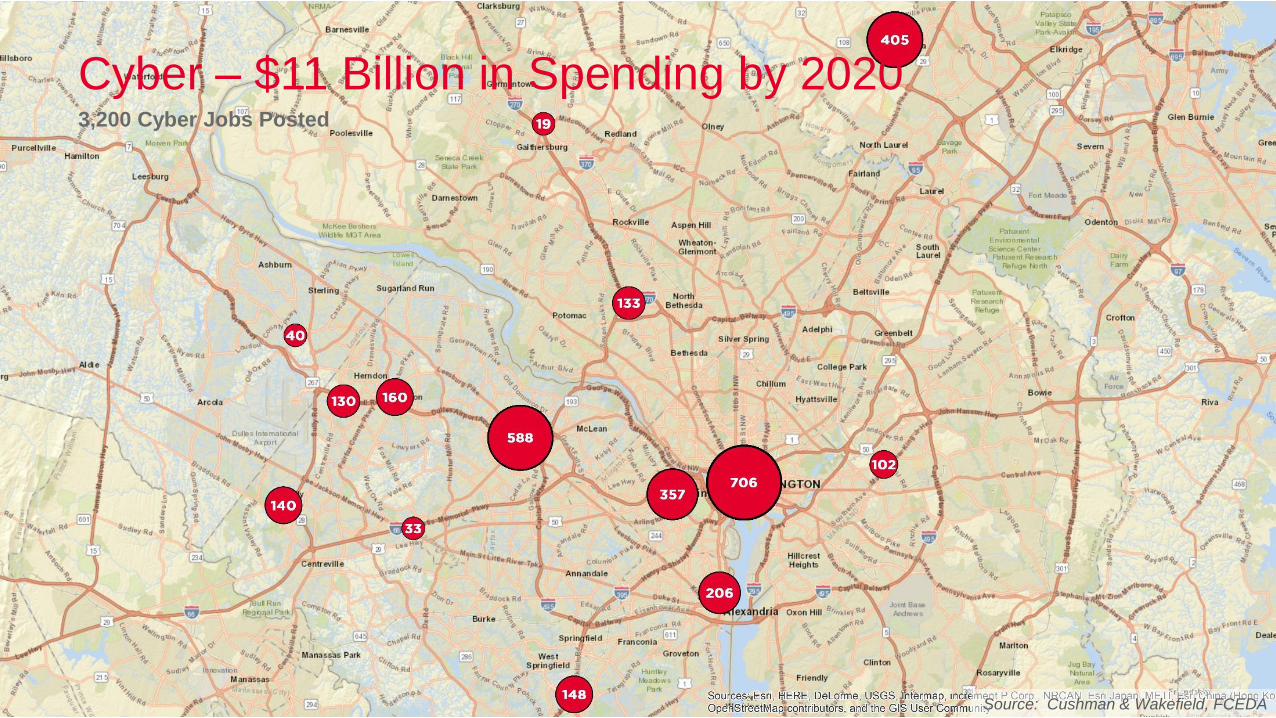
Cyber – $11 Billion in Spending by 20203,200 Cyber Jobs Posted
Source: Cushman & Wakefield, FCEDA
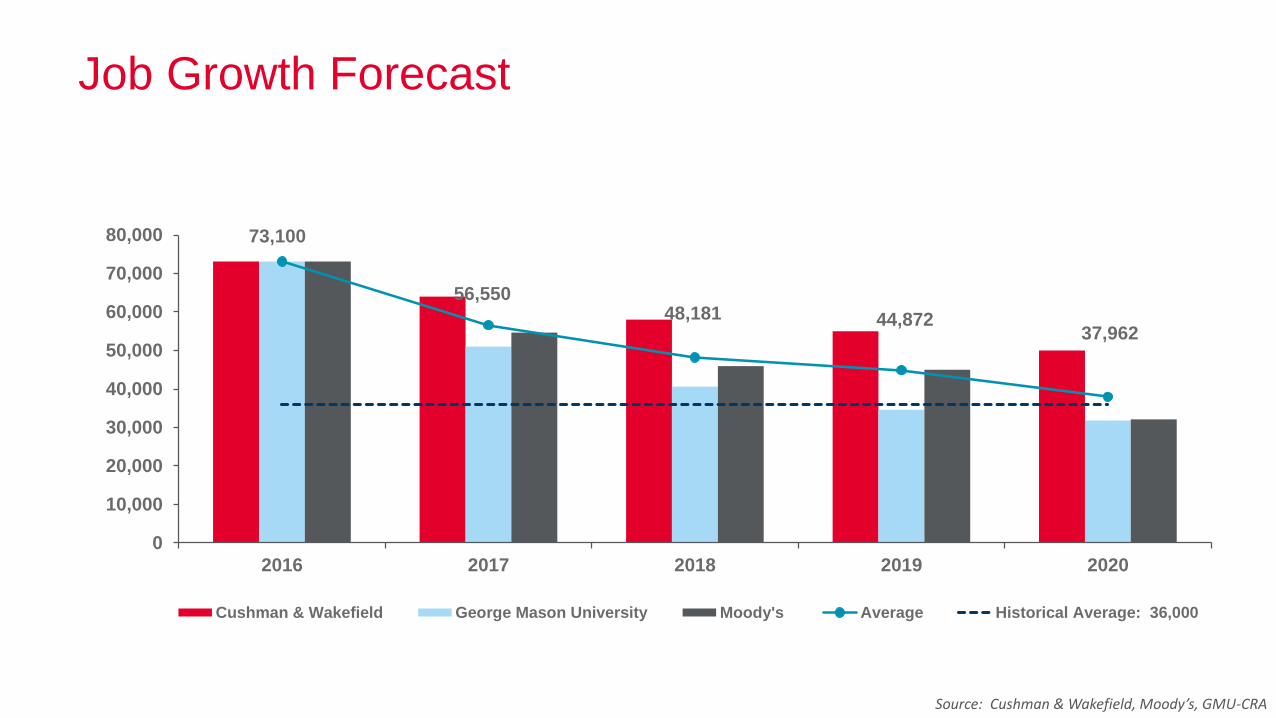
Job Growth Forecast
73,100
56,55048,181 44,872
37,962
0
10,000
20,000
30,000
40,000
50,000
60,000
70,000
80,000
2016 2017 2018 2019 2020
Cushman & Wakefield George Mason University Moody's Average Historical Average: 36,000
Source: Cushman & Wakefield, Moody’s, GMU-CRA
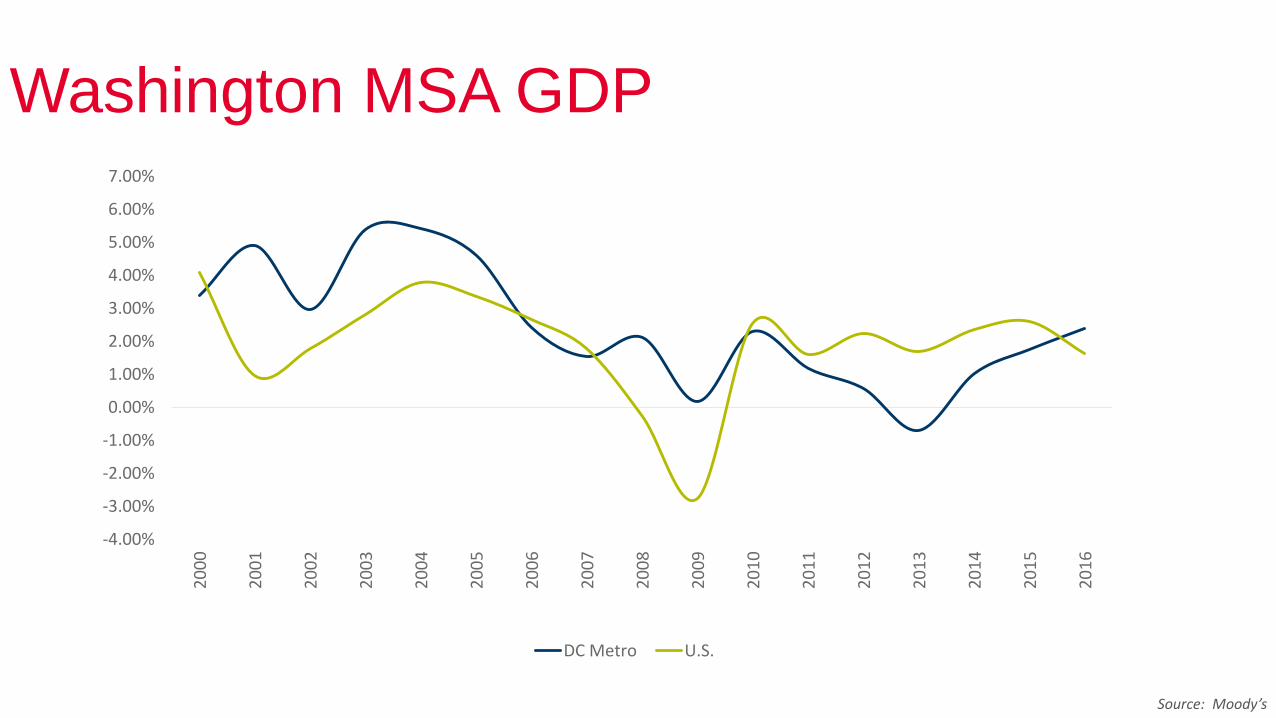
Washington MSA GDP
-4.00%
-3.00%
-2.00%
-1.00%
0.00%
1.00%
2.00%
3.00%
4.00%
5.00%
6.00%
7.00%
20
00
20
01
20
02
20
03
20
04
20
05
20
06
20
07
20
08
20
09
20
10
20
11
20
12
20
13
20
14
20
15
20
16
DC Metro U.S.
Source: Moody’s

Economic Growth Expected to AccelerateDC Metro: Gross Metro Product (GMP)
2.6%
3.7%
3.2%
-1.0%
0.0%
1.0%
2.0%
3.0%
4.0%
5.0%
6.0%
2002 2003 2004 2005 2006 2007 2008 2009 2010 2011 2012 2013 2014 2015 2016 2017 2018
DC Metro GMP Growth (AR, right)
Source: Cushman & Wakefield Research, Bureau of Economic Analysis, NCREIF

Northern Virginia Leasing
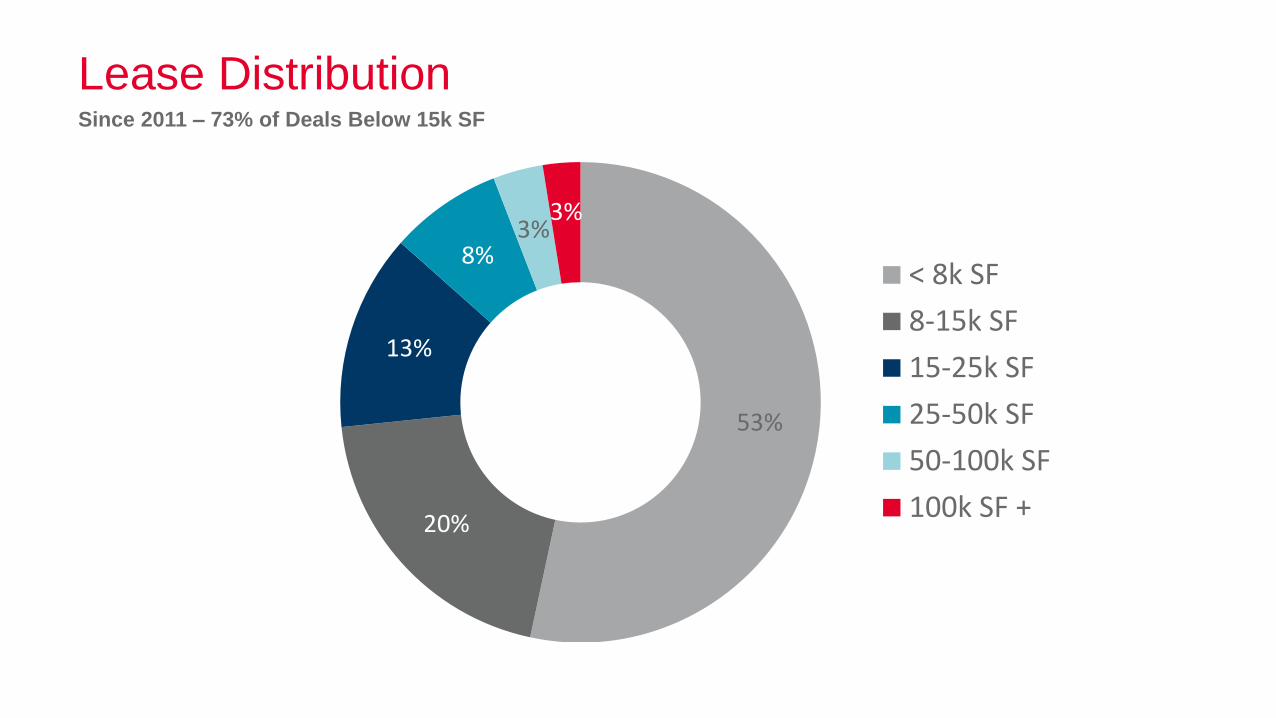
Lease DistributionSince 2011 – 73% of Deals Below 15k SF
53%
20%
13%
8%3%
3%
< 8k SF
8-15k SF
15-25k SF
25-50k SF
50-100k SF
100k SF +
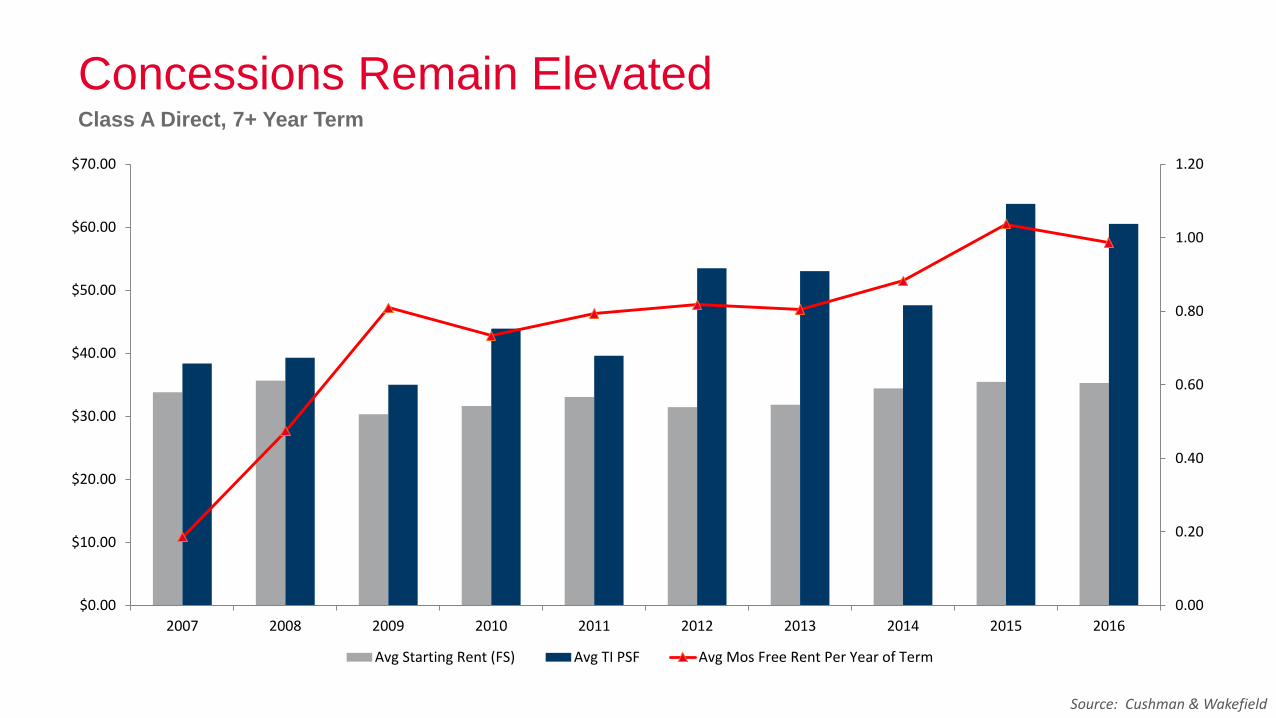
Concessions Remain ElevatedClass A Direct, 7+ Year Term
0.00
0.20
0.40
0.60
0.80
1.00
1.20
$0.00
$10.00
$20.00
$30.00
$40.00
$50.00
$60.00
$70.00
2007 2008 2009 2010 2011 2012 2013 2014 2015 2016
Avg Starting Rent (FS) Avg TI PSF Avg Mos Free Rent Per Year of Term
Source: Cushman & Wakefield
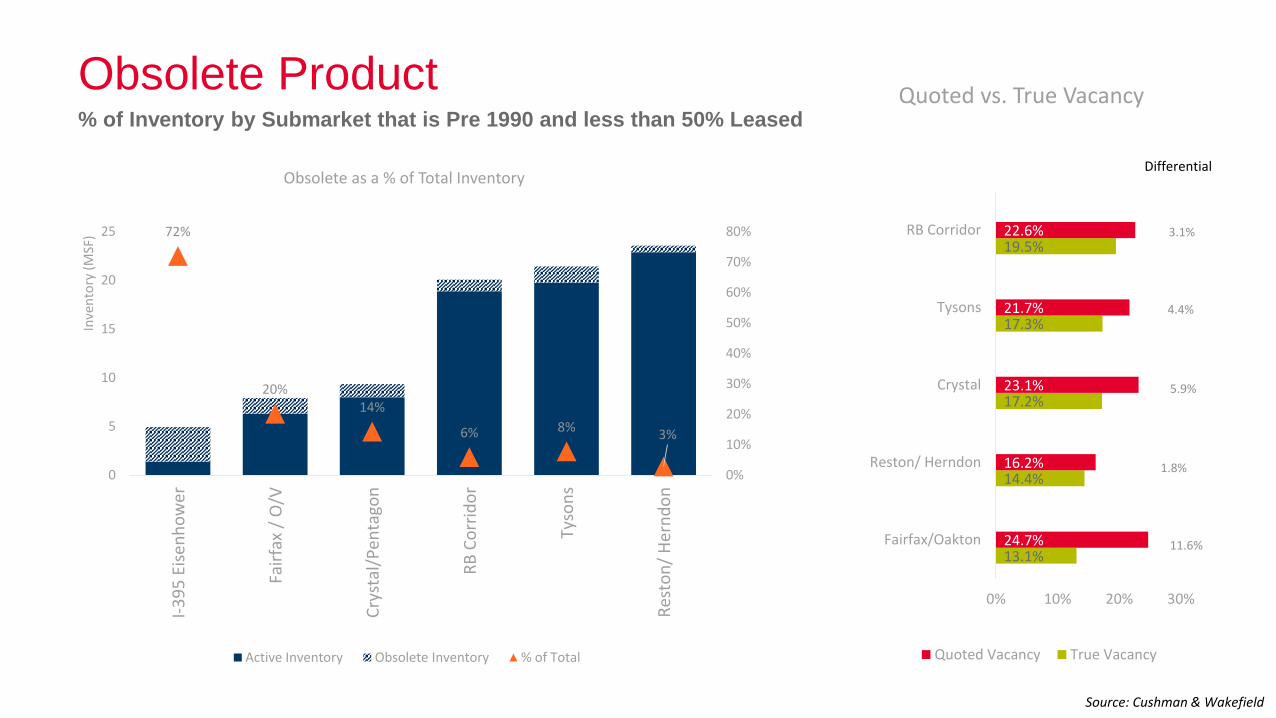
Obsolete Product% of Inventory by Submarket that is Pre 1990 and less than 50% Leased
Source: Cushman & Wakefield
72%
20%14%
6% 8%3%
0%
10%
20%
30%
40%
50%
60%
70%
80%
0
5
10
15
20
25
I-3
95
Eis
enh
ow
er
Fair
fax
/ O
/V
Cry
stal
/Pen
tago
n
RB
Co
rrid
or
Tyso
ns
Res
ton
/ H
ern
do
n
Inve
nto
ry (
MSF
)
Obsolete as a % of Total Inventory
Active Inventory Obsolete Inventory % of Total
13.1%
14.4%
17.2%
17.3%
19.5%
24.7%
16.2%
23.1%
21.7%
22.6%
11.6%
1.8%
5.9%
4.4%
3.1%
0% 10% 20% 30%
Fairfax/Oakton
Reston/ Herndon
Crystal
Tysons
RB Corridor
Quoted vs. True Vacancy
Quoted Vacancy True Vacancy
Differential
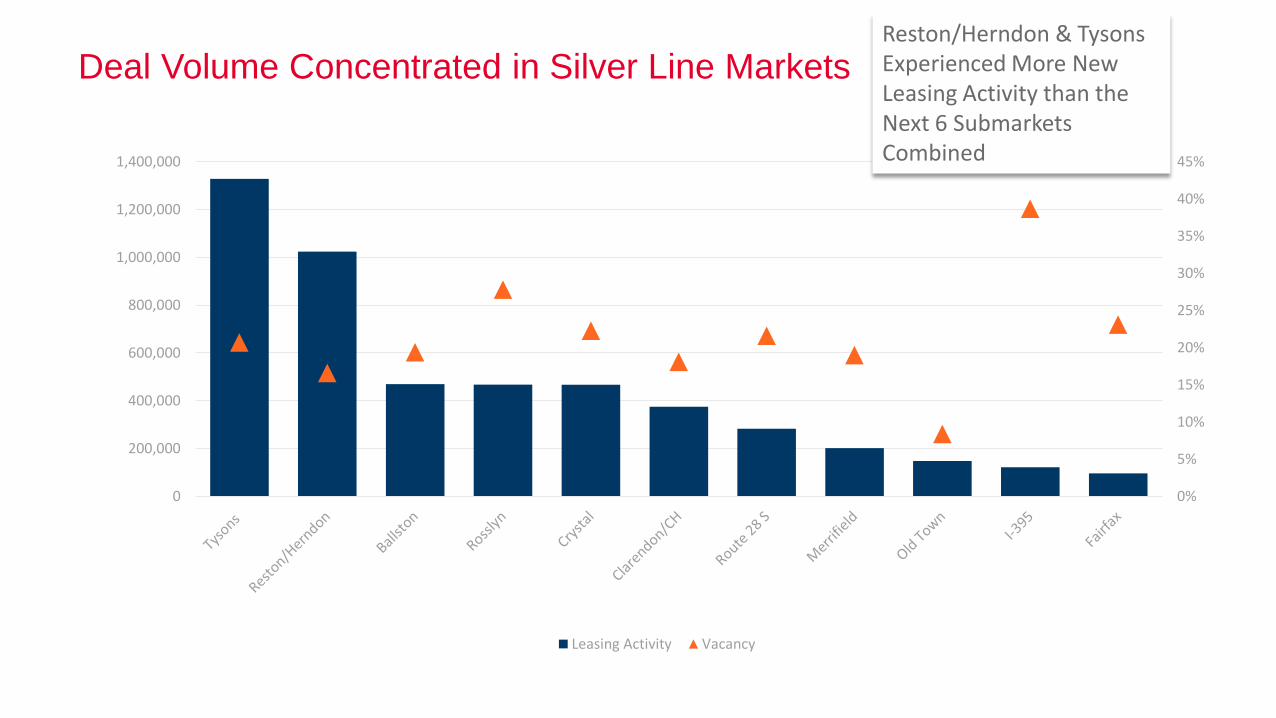
Deal Volume Concentrated in Silver Line Markets
0%
5%
10%
15%
20%
25%
30%
35%
40%
45%
0
200,000
400,000
600,000
800,000
1,000,000
1,200,000
1,400,000
Leasing Activity Vacancy
Reston/Herndon & Tysons Experienced More New Leasing Activity than the Next 6 Submarkets Combined
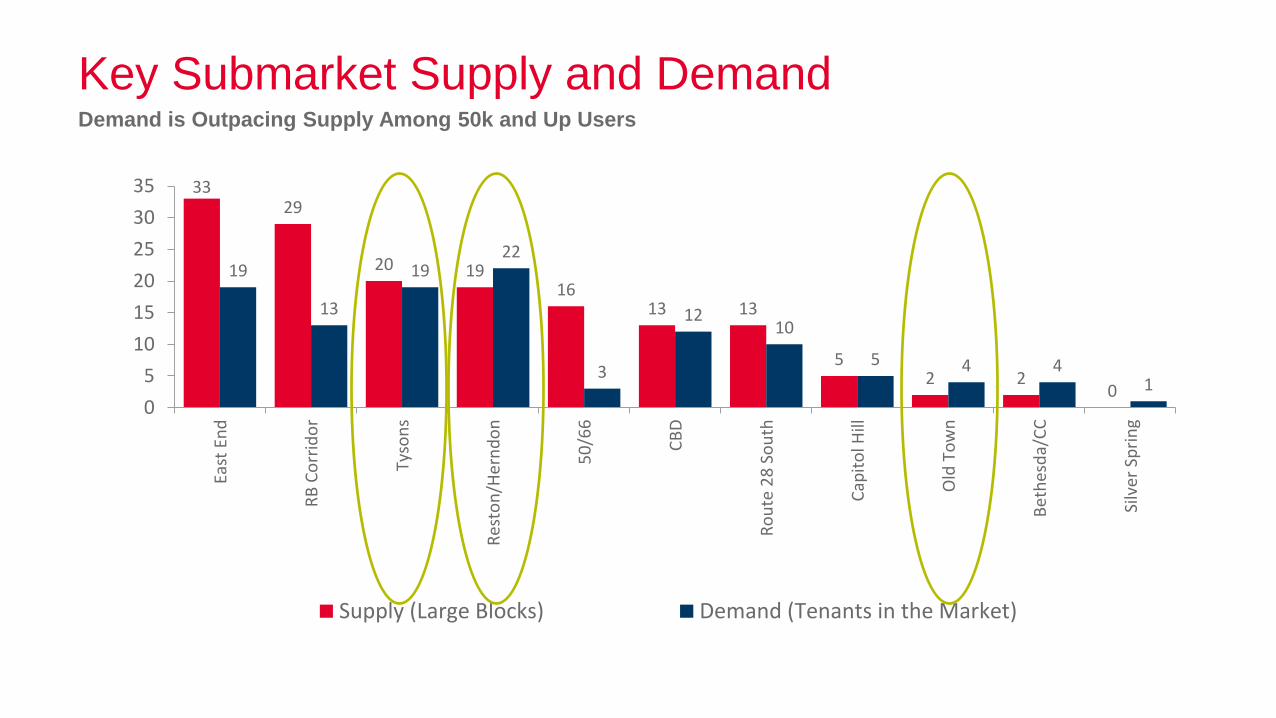
Key Submarket Supply and DemandDemand is Outpacing Supply Among 50k and Up Users
3329
20 1916
13 13
52 2
0
19
13
1922
3
1210
5 4 41
0
5
10
15
20
25
30
35
East
En
d
RB
Co
rrid
or
Tyso
ns
Res
ton
/Her
nd
on
50
/66
CB
D
Ro
ute
28
So
uth
Cap
ito
l Hill
Old
To
wn
Be
thes
da/
CC
Silv
er S
pri
ng
Supply (Large Blocks) Demand (Tenants in the Market)
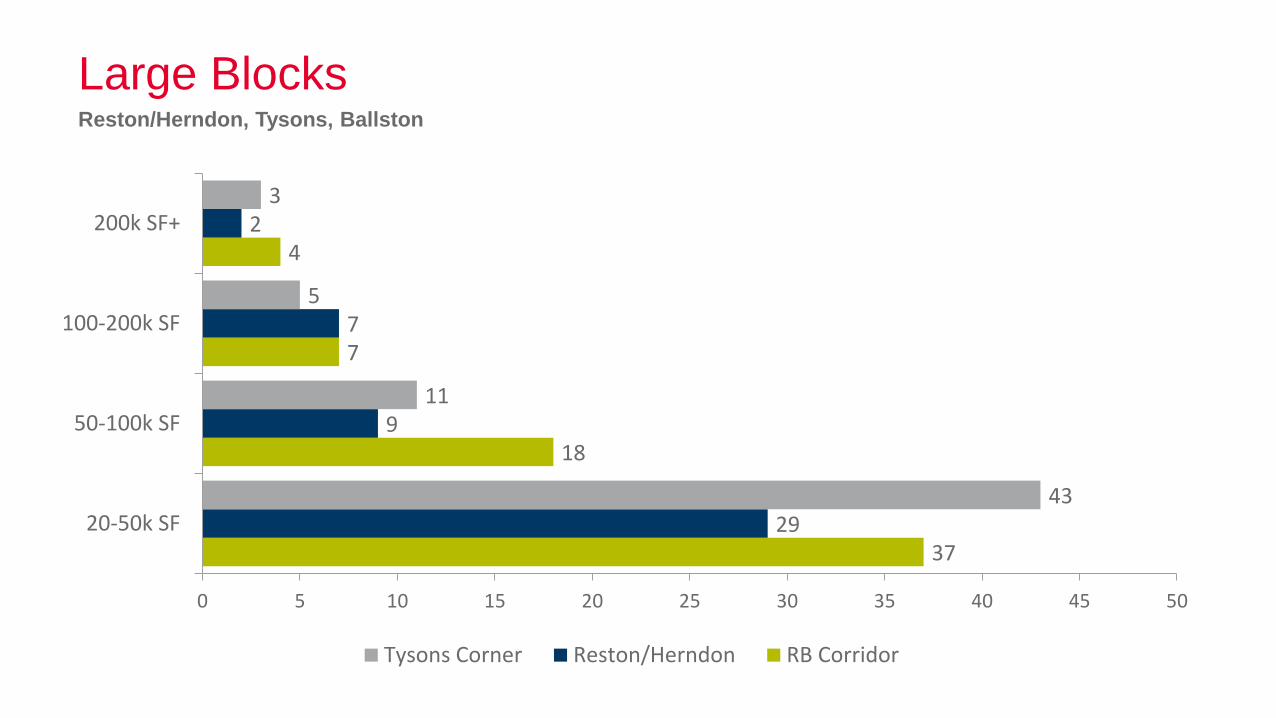
Large BlocksReston/Herndon, Tysons, Ballston
37
18
7
4
29
9
7
2
43
11
5
3
0 5 10 15 20 25 30 35 40 45 50
20-50k SF
50-100k SF
100-200k SF
200k SF+
Tysons Corner Reston/Herndon RB Corridor
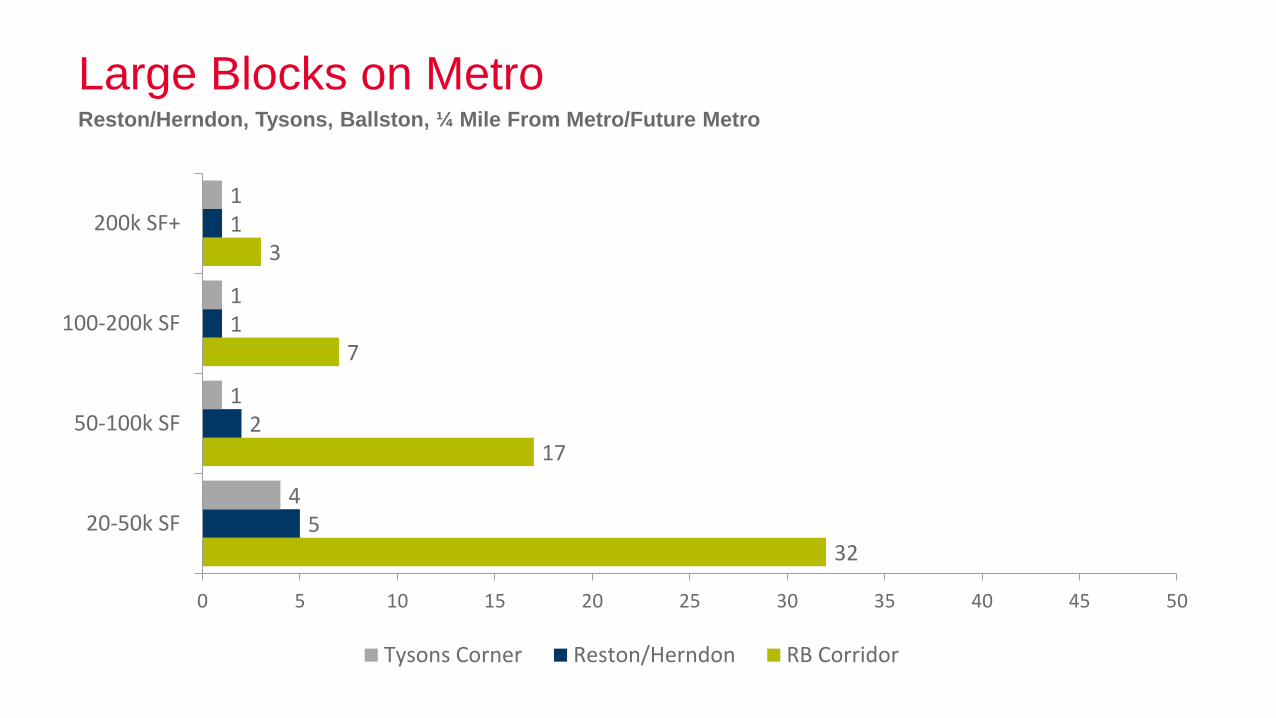
Large Blocks on MetroReston/Herndon, Tysons, Ballston, ¼ Mile From Metro/Future Metro
32
17
7
3
5
2
1
1
4
1
1
1
0 5 10 15 20 25 30 35 40 45 50
20-50k SF
50-100k SF
100-200k SF
200k SF+
Tysons Corner Reston/Herndon RB Corridor
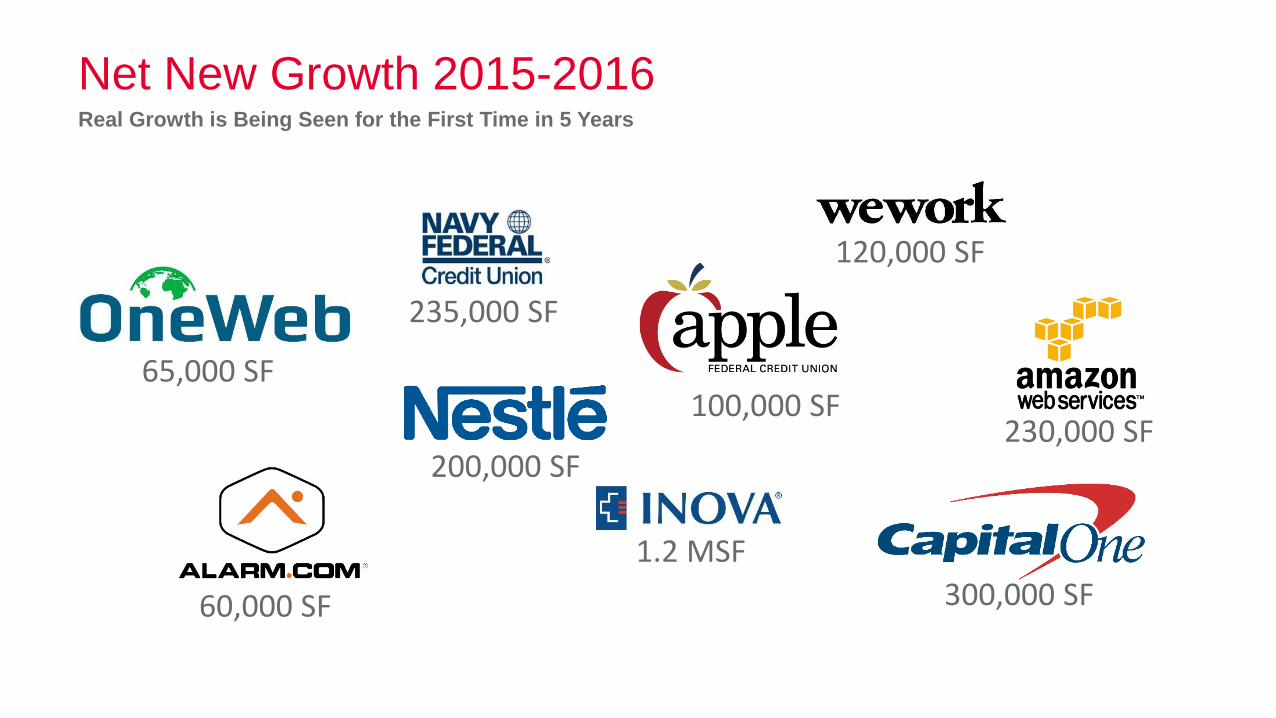
Net New Growth 2015-2016 Real Growth is Being Seen for the First Time in 5 Years
65,000 SF
235,000 SF
100,000 SF
200,000 SF
120,000 SF
230,000 SF
300,000 SF60,000 SF
1.2 MSF

NoVA GSA ExposureGSA Northern Virginia Expirations 2017-2020 by Submarket
2,050,489
1,413,580
1,045,345980,768
880,776
698,465 659,550
270,599 266,436150,485
93,650 141,716 125,142 116,233 99,27224,209
0
500,000
1,000,000
1,500,000
2,000,000
2,500,000C
ryst
al/P
enta
gon
Cit
y
Ro
ssly
n
Spri
ngf
ield
Bal
lsto
n
Her
nd
on
I-3
95
Eise
nh
ow
erA
ve Tyso
ns
Lou
do
un
Co
un
ty
Ro
ute
28
S
Res
ton
Cla
ren
do
n/
CH
Old
To
wn
Mer
rifi
eld
Fair
fax
Cen
ter
Pri
nce
Will
iam
Source: GSA

Capital Markets

Office Sales Volume YTD 2016Among Major Metros
$29.4
$14.4 $14.4
$7.8 $7.0$5.8 $5.4 $5.1 $4.5
$2.7 $1.9 $0.9
$272
$0
$50
$100
$150
$200
$250
$300
$350
$400
$450
$500
$0.0
$5.0
$10.0
$15.0
$20.0
$25.0
$30.0
$35.0
NYC Metro SF Metro LA Metro Boston DC Metro Dallas Chicago Seattle Atlanta Philly Metro Denver Houston
$B
illio
ns
Sales Volume 2016 YTD Average Price Per SF
Source: C&W, RCA

Office Investment Sales VolumeWashington DC Metro
$10.2
$14.1
$12.5
$3.4
$2.3
$4.3
$7.2
$5.4
$6.8
$8.0
$9.7
$7.0
-$1.0
$1.0
$3.0
$5.0
$7.0
$9.0
$11.0
$13.0
$15.0
2005 2006 2007 2008 2009 2010 2011 2012 2013 2014 2015 2016
Bil
lio
ns
DC NoVA SMD Historical Average: $7.6 Billion
Source: Cushman & Wakefield
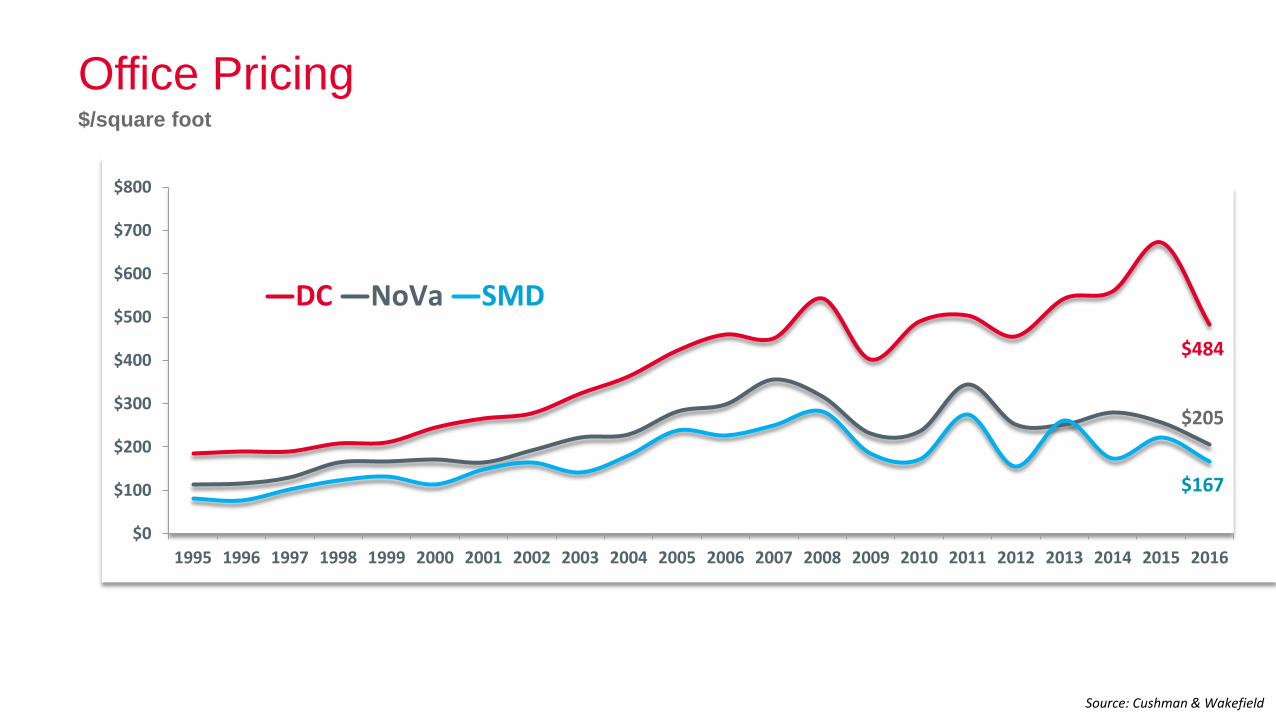
Office Pricing$/square foot
$484
$205
$167
$0
$100
$200
$300
$400
$500
$600
$700
$800
1995 1996 1997 1998 1999 2000 2001 2002 2003 2004 2005 2006 2007 2008 2009 2010 2011 2012 2013 2014 2015 2016
DC NoVa SMD
Source: Cushman & Wakefield
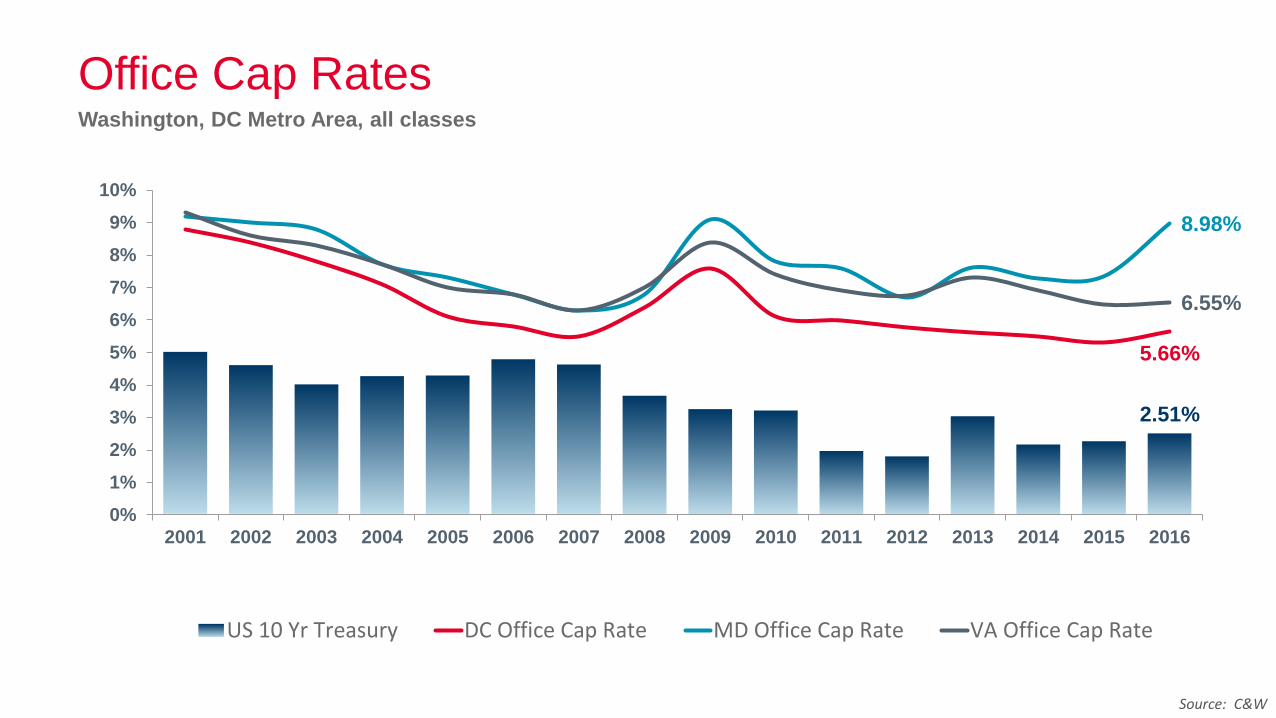
Office Cap RatesWashington, DC Metro Area, all classes
2.51%
5.66%
8.98%
6.55%
0%
1%
2%
3%
4%
5%
6%
7%
8%
9%
10%
2001 2002 2003 2004 2005 2006 2007 2008 2009 2010 2011 2012 2013 2014 2015 2016
US 10 Yr Treasury DC Office Cap Rate MD Office Cap Rate VA Office Cap Rate
Source: C&W
Office Cap RatesWashington, DC Metro Area, all classes
2.22%
5.39%
6.99%
7.05%
0%
1%
2%
3%
4%
5%
6%
7%
8%
9%
10%
2001 2002 2003 2004 2005 2006 2007 2008 2009 2010 2011 2012 2013 2014 2015
US 10 Yr Treasury DC Office Cap Rate MD Office Cap Rate VA Office Cap Rate
Source: Cushman & Wakefield61

Where Foreign Buyers Are Most ActiveCross-border office sales as % of total sales volume – 2016
DC Metro 36%
New York 35%U.S. = 21%
Foreign acquisitionsunder 10% of investor composition YTD 2015
Dallas 28%
Miami 42%
Philly 32%
Source: Cushman & Wakefield, RCA
Boston 20%
Denver 15%
Seattle 22%
Los Angeles 17%
Chicago 10%
Austin 13%
San Francisco 21%
Atlanta 12%
Tampa 17%
Minneapolis 29%
Phoenix 12%
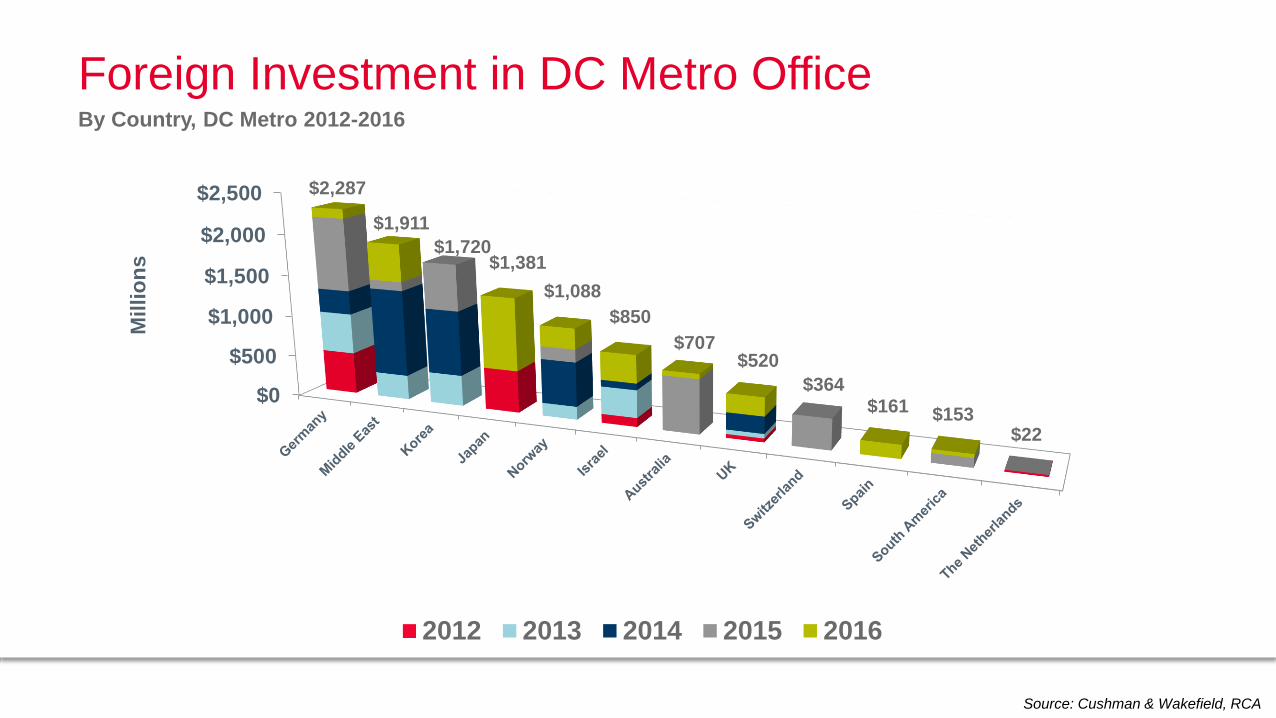
$0
$500
$1,000
$1,500
$2,000
$2,500 $2,287
$1,911
$1,720$1,381
$1,088
$850
$707$520
$364$161 $153
$22
Millio
ns
2012 2013 2014 2015 2016
Source: Cushman & Wakefield, RCA
Foreign Investment in DC Metro OfficeBy Country, DC Metro 2012-2016

Today’s Discussion
Fact Checker
Is the Local Recovery Helping the Office Market?
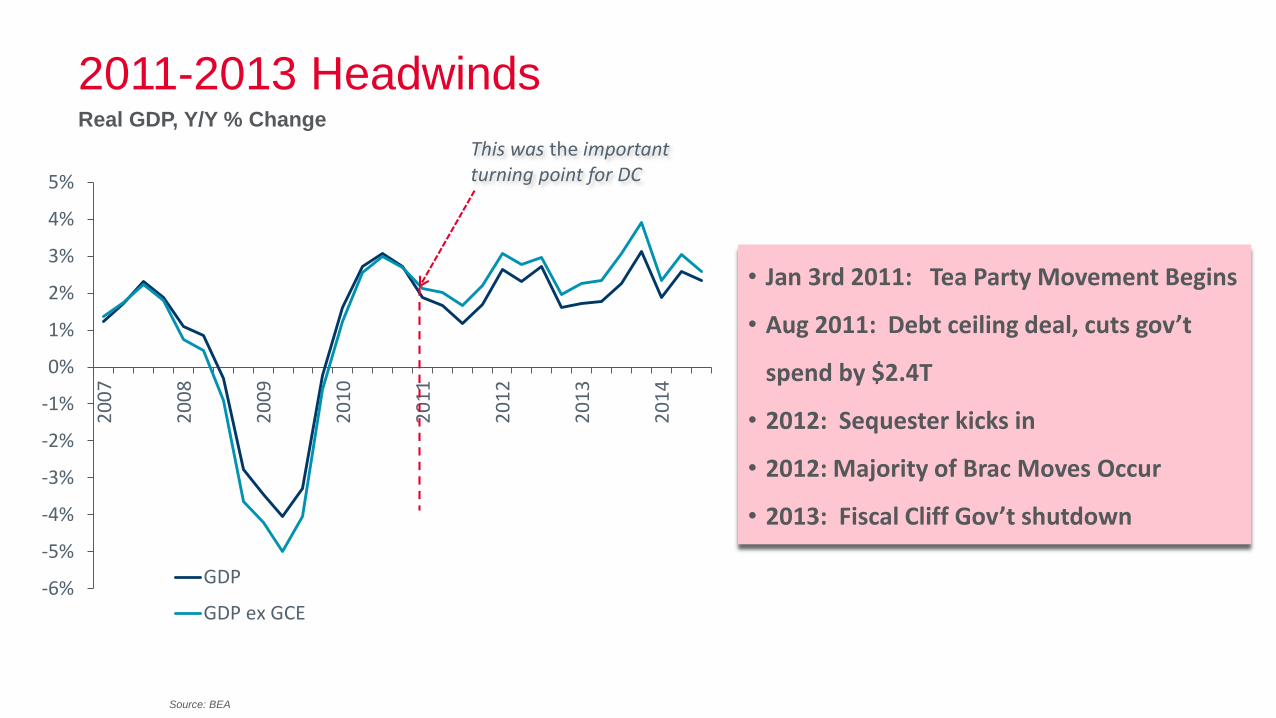
2011-2013 HeadwindsReal GDP, Y/Y % Change
-6%
-5%
-4%
-3%
-2%
-1%
0%
1%
2%
3%
4%
5%
20
07
20
08
20
09
20
10
20
11
20
12
20
13
20
14
GDP
GDP ex GCE
This was the important turning point for DC
• Jan 3rd 2011: Tea Party Movement Begins
• Aug 2011: Debt ceiling deal, cuts gov’t
spend by $2.4T
• 2012: Sequester kicks in
• 2012: Majority of Brac Moves Occur
• 2013: Fiscal Cliff Gov’t shutdown
Source: BEA
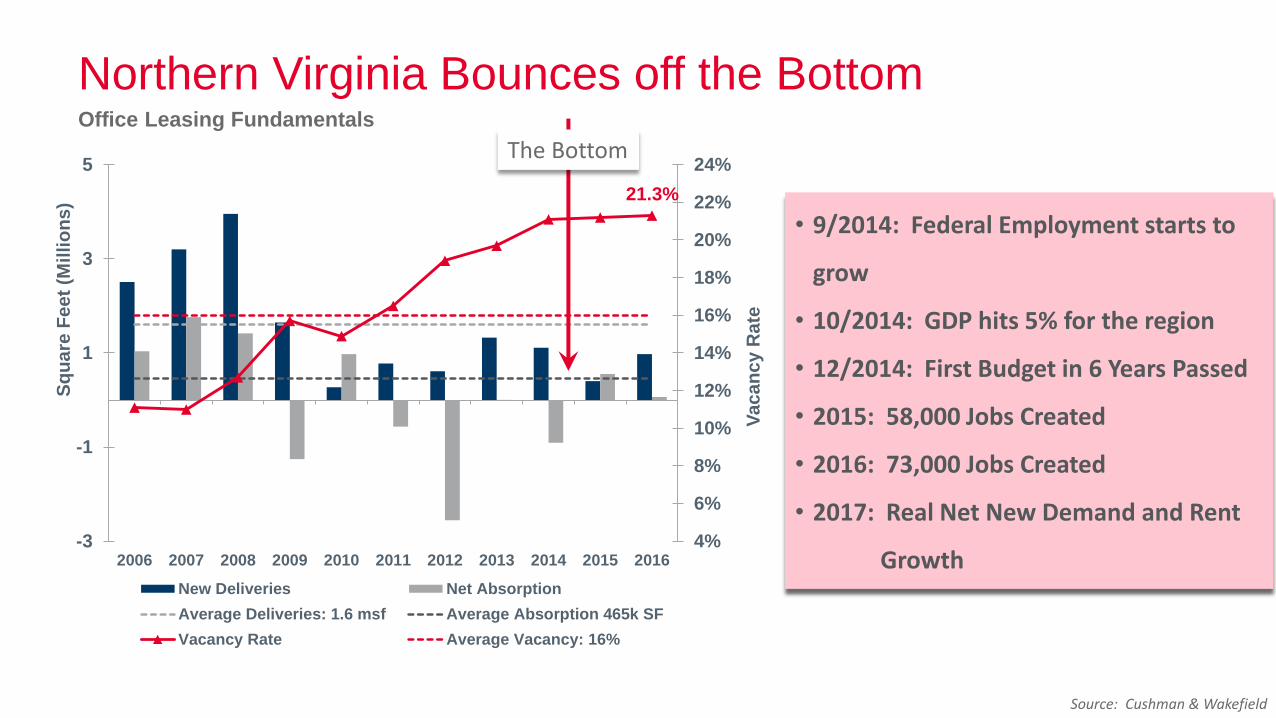
Northern Virginia Bounces off the Bottom Office Leasing Fundamentals
21.3%
4%
6%
8%
10%
12%
14%
16%
18%
20%
22%
24%
-3
-1
1
3
5
2006 2007 2008 2009 2010 2011 2012 2013 2014 2015 2016
Va
ca
nc
y R
ate
Sq
ua
re F
ee
t (M
illio
ns
)
New Deliveries Net Absorption
Average Deliveries: 1.6 msf Average Absorption 465k SF
Vacancy Rate Average Vacancy: 16%
Source: Cushman & Wakefield
The Bottom
• 9/2014: Federal Employment starts to
grow
• 10/2014: GDP hits 5% for the region
• 12/2014: First Budget in 6 Years Passed
• 2015: 58,000 Jobs Created
• 2016: 73,000 Jobs Created
• 2017: Real Net New Demand and Rent
Growth
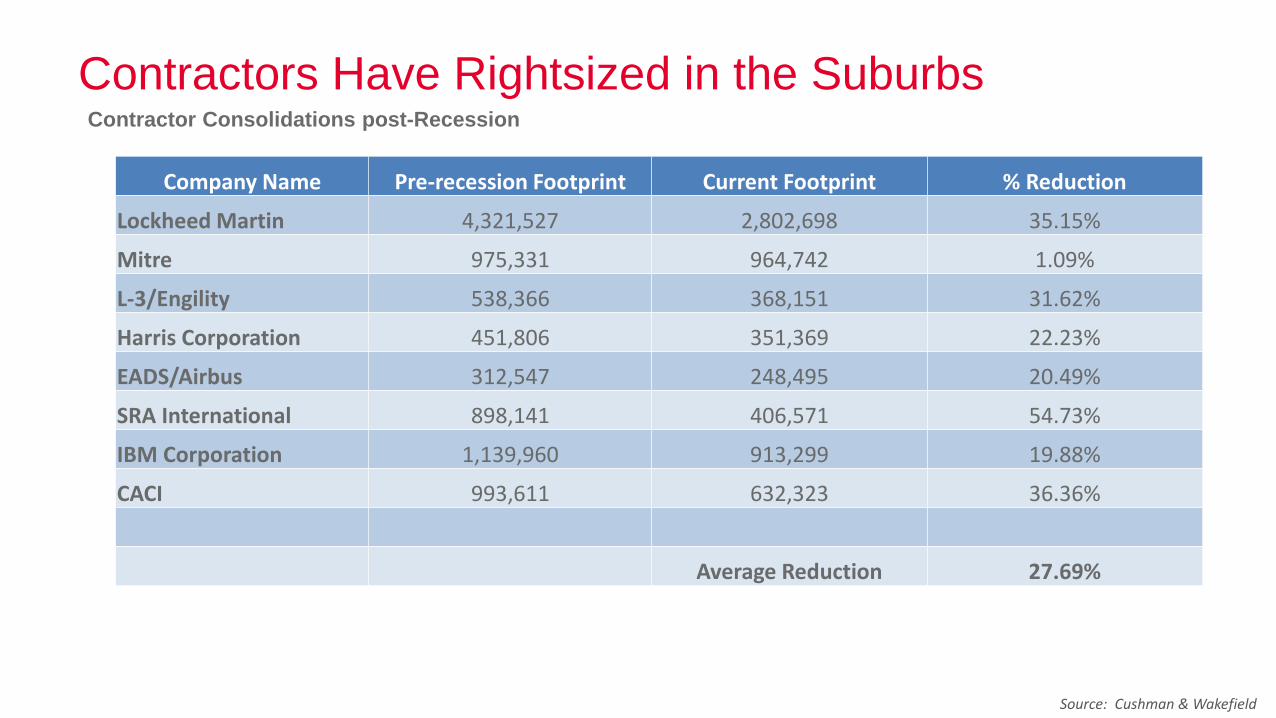
Contractors Have Rightsized in the Suburbs
San Jose
Washington, DC
Detroit
Source: Cushman & Wakefield
Contractor Consolidations post-Recession
Company Name Pre-recession Footprint Current Footprint % Reduction
Lockheed Martin 4,321,527 2,802,698 35.15%
Mitre 975,331 964,742 1.09%
L-3/Engility 538,366 368,151 31.62%
Harris Corporation 451,806 351,369 22.23%
EADS/Airbus 312,547 248,495 20.49%
SRA International 898,141 406,571 54.73%
IBM Corporation 1,139,960 913,299 19.88%
CACI 993,611 632,323 36.36%
Average Reduction 27.69%

7 YEARS AGO TODAY
Department Finance Human Resources
Driver Expense Management Labor
Outlook Liability Asset
Criteria Pro-Forma Employee Experience
What’s Different Now?Tenant Leasing Decisions
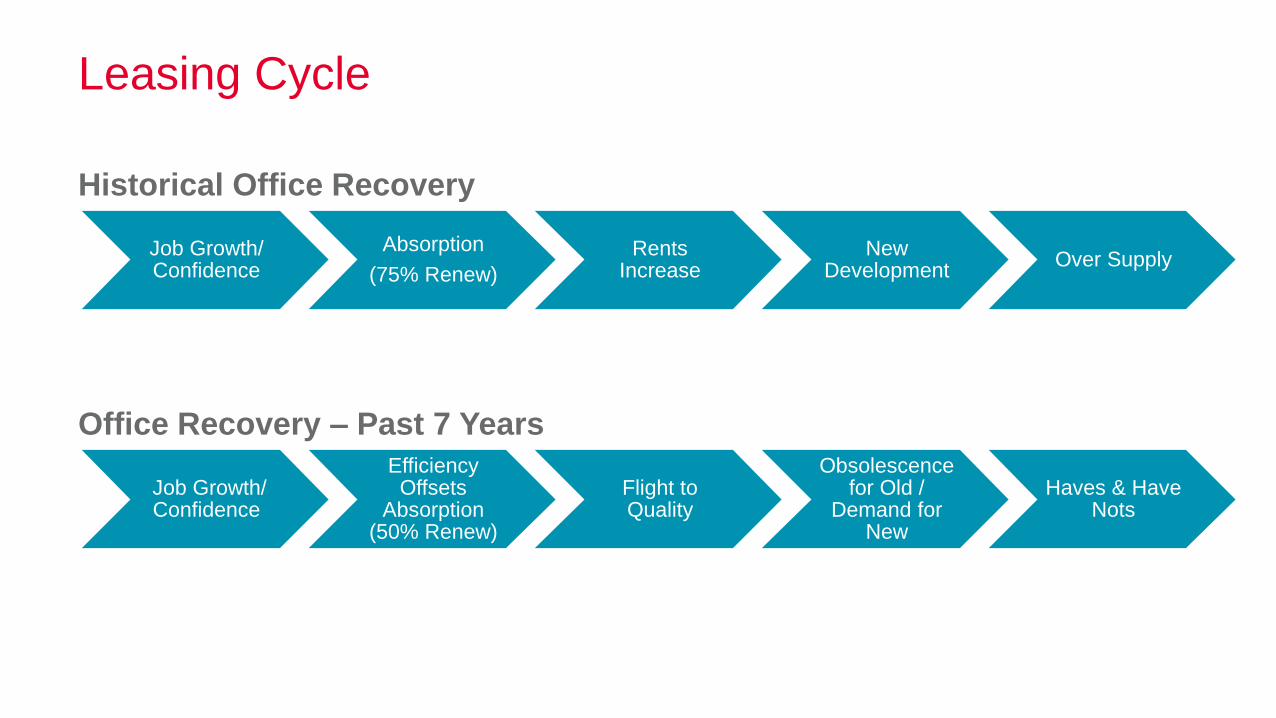
Job Growth/ Confidence
Absorption
(75% Renew)
Rents Increase
New Development
Over Supply
Leasing Cycle
Historical Office Recovery
Job Growth/ Confidence
Efficiency Offsets
Absorption (50% Renew)
Flight to Quality
Obsolescence for Old /
Demand for New
Haves & Have Nots
Office Recovery – Past 7 Years

Today’s Discussion
Transactional Perspectives
Spencer Stouffer, Vice Chairman
February 16, 2017

Today’s Discussion
Demand
Supply
Tysons – the Bellwether
Predictions

DEMAND
San Jose
Washington, DC
Detroit
Source: Cushman & Wakefield
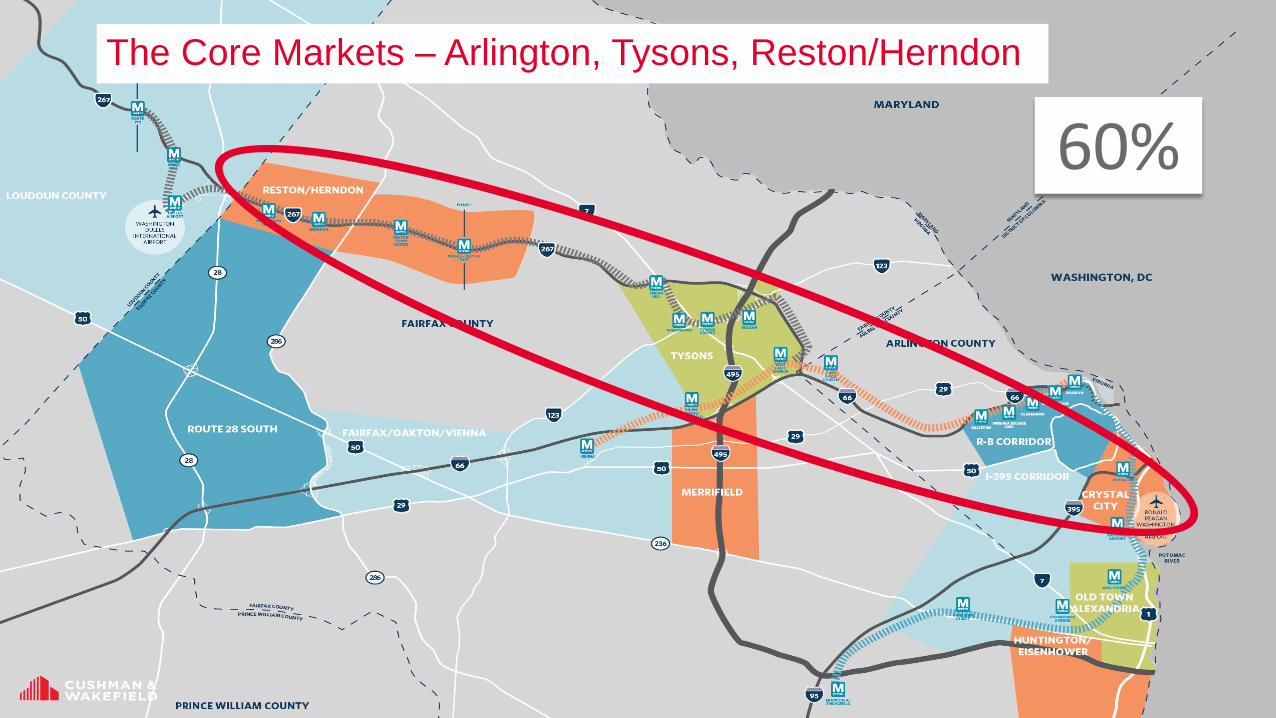
60%
The Core Markets – Arlington, Tysons, Reston/Herndon
And Tysons Continues to Attract Tenants from Other Submarkets
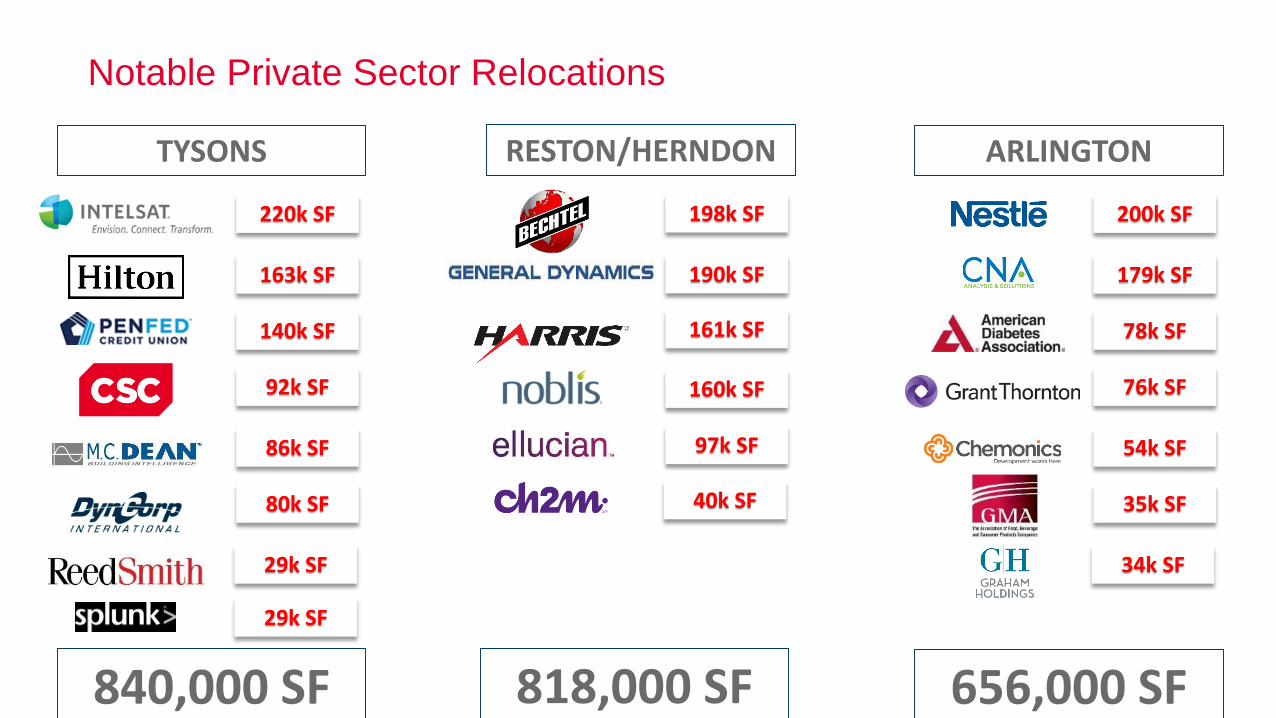
220k SF
29k SF
163k SF
29k SF
92k SF
140k SF
80k SF
Notable Private Sector Relocations
840,000 SF
86k SF
TYSONS
198k SF
40k SF
190k SF
161k SF
97k SF
160k SF
RESTON/HERNDON
818,000 SF
200k SF
34k SF
179k SF
76k SF
78k SF
35k SF
54k SF
ARLINGTON
656,000 SF
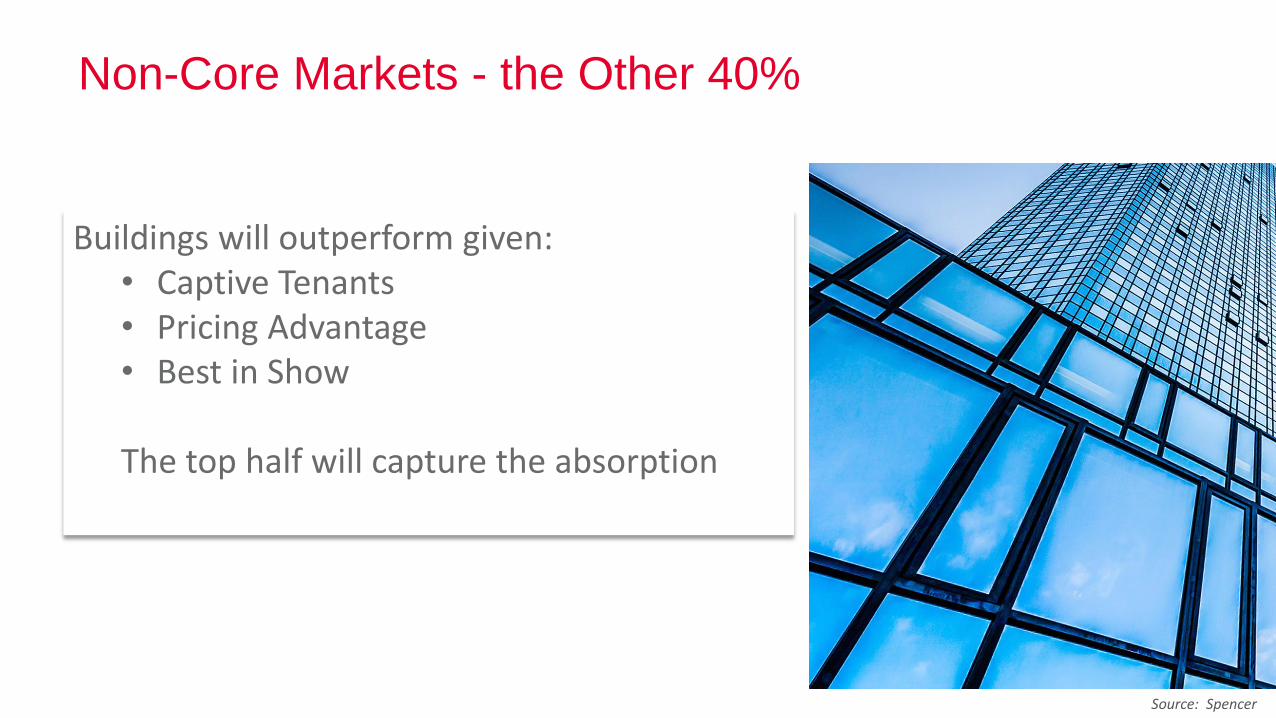
Non-Core Markets - the Other 40%
San Jose
Washington, DC
Detroit
Source: Spencer
Buildings will outperform given:• Captive Tenants• Pricing Advantage• Best in Show
The top half will capture the absorption

Supply
Source: Cushman & Wakefield
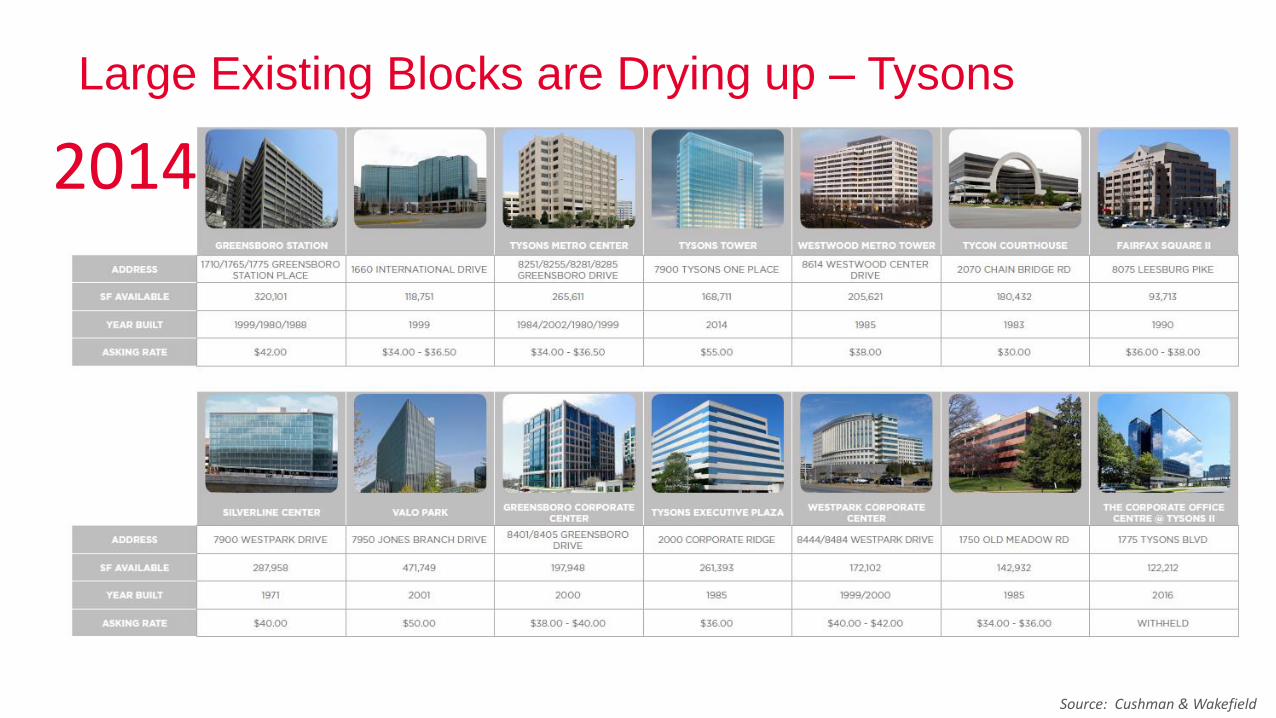
2014
Large Existing Blocks are Drying up – Tysons
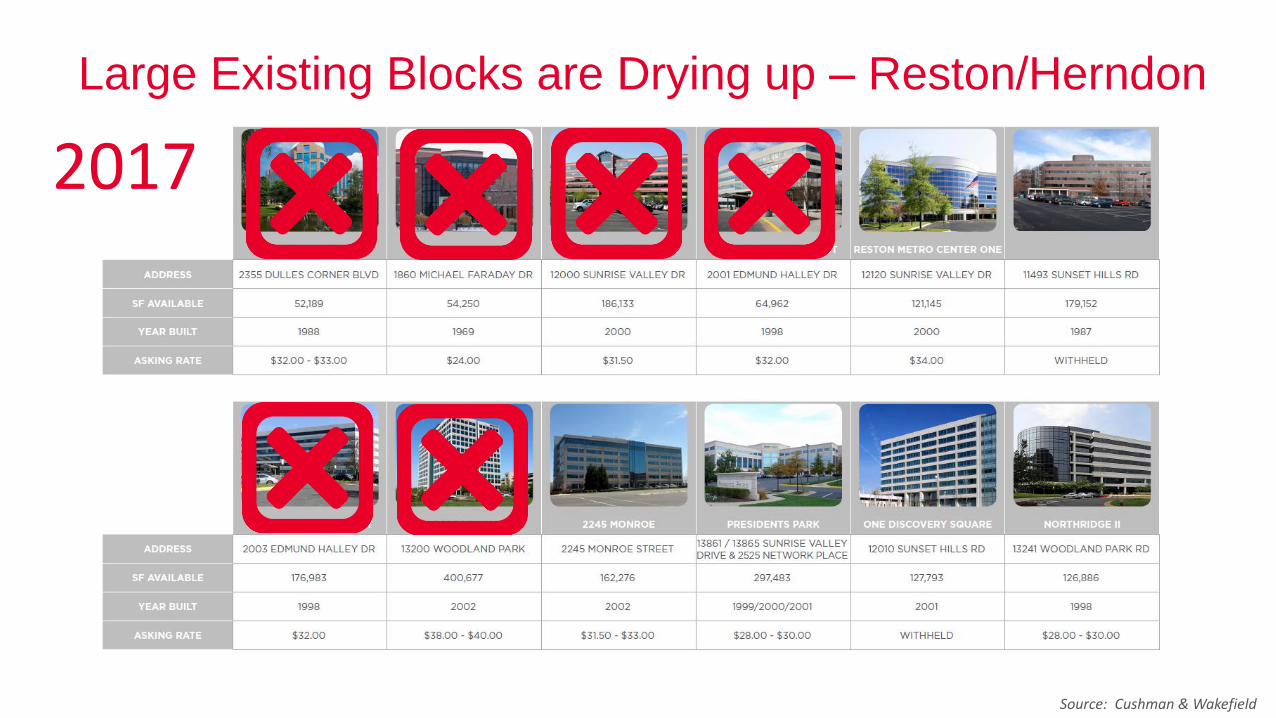
Source: Cushman & Wakefield
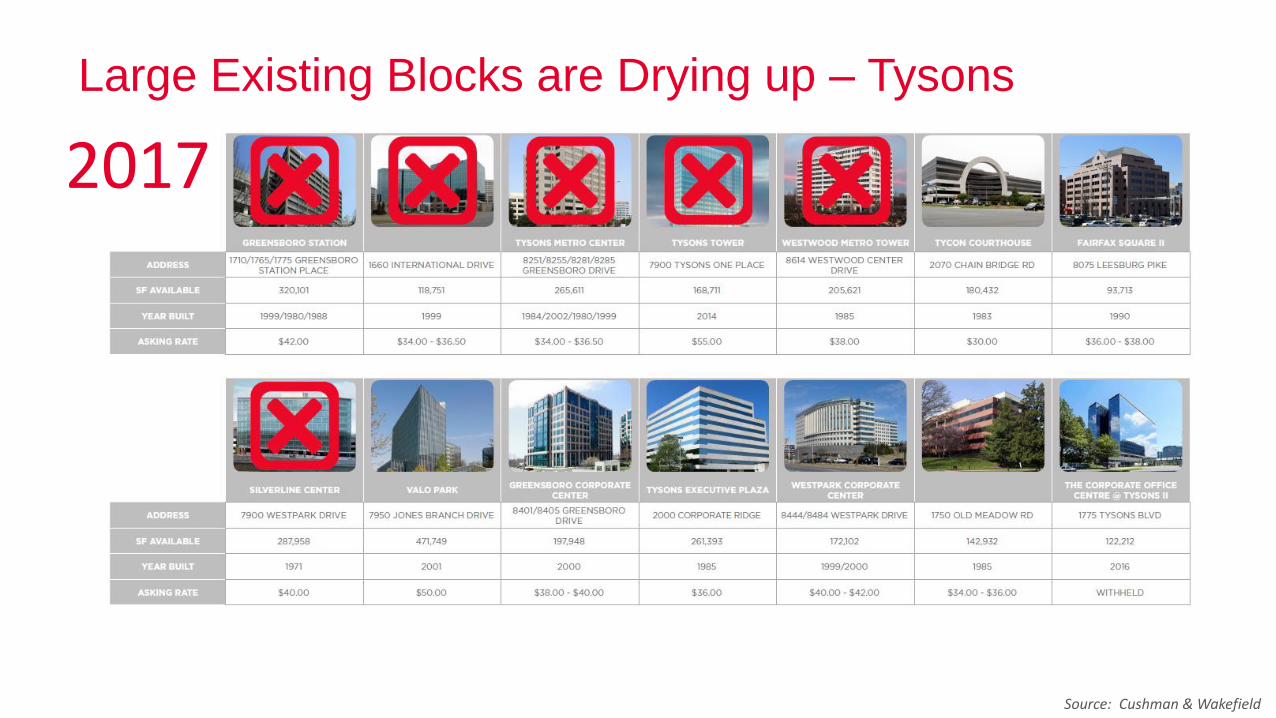
2017
Large Existing Blocks are Drying up – Tysons
San Jose
Washington, DC
Detroit
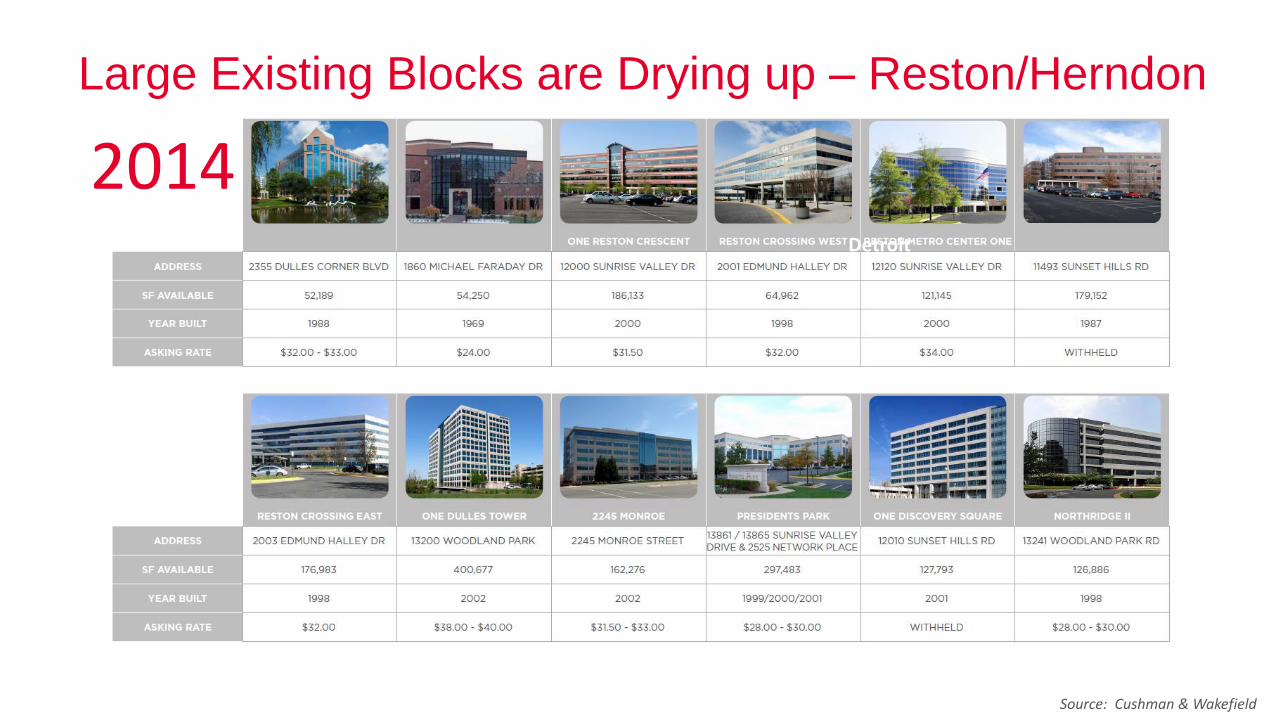
Source: Cushman & Wakefield
2014
Large Existing Blocks are Drying up – Reston/Herndon
San Jose
Washington, DC
Detroit
Source: Cushman & Wakefield
Large Existing Blocks are Drying up – Reston/Herndon
2017

Demand for New SpaceNorthern Virginia New vs. Relet
(4,000,000)
(3,000,000)
(2,000,000)
(1,000,000)
-
1,000,000
2,000,000
3,000,000
4,000,000
5,000,000
6,000,000
2008 2009 2010 2011 2012 2013 2014 2015 2016
Sq
uare
Fe
et
Deliveries New Space Absorption Relet Absorption Sublet Absorption
Since 200815.4 msf absorbed in New
-15.2 msf absorbed in Relet/Sublet
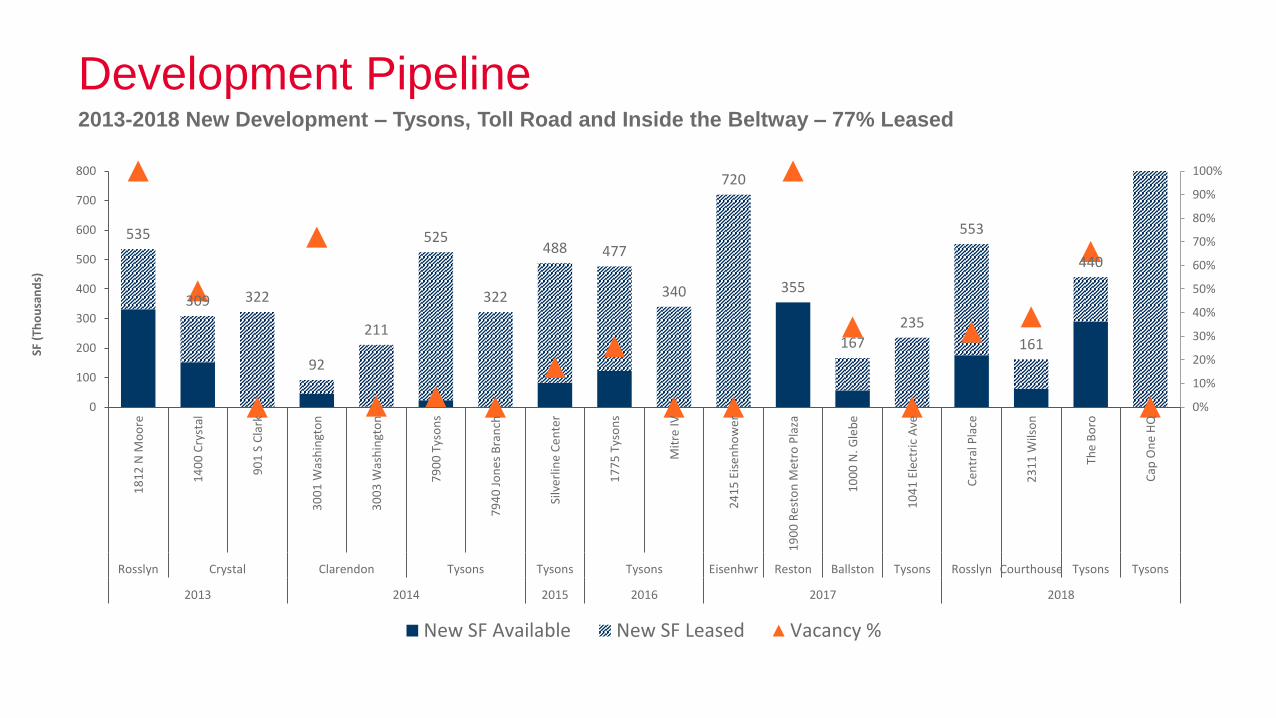
Development Pipeline2013-2018 New Development – Tysons, Toll Road and Inside the Beltway – 77% Leased
535
309 322
92
211
525
322
488 477
340
720
355
167
235
553
161
440
0%
10%
20%
30%
40%
50%
60%
70%
80%
90%
100%
0
100
200
300
400
500
600
700
800
18
12
N M
oo
re
14
00
Cry
stal
90
1 S
Cla
rk
30
01
Was
hin
gto
n
30
03
Was
hin
gto
n
79
00
Tys
on
s
79
40
Jo
ne
s B
ran
ch
Silv
erl
ine
Ce
nte
r
17
75
Tys
on
s
Mit
re IV
24
15
Eis
en
ho
wer
19
00
Re
sto
n M
etro
Pla
za
10
00
N. G
leb
e
10
41
Ele
ctri
c A
ve
Ce
ntr
al P
lace
23
11
Wils
on
The
Bo
ro
Cap
On
e H
Q
Rosslyn Crystal Clarendon Tysons Tysons Tysons Eisenhwr Reston Ballston Tysons Rosslyn Courthouse Tysons Tysons
2013 2014 2015 2016 2017 2018
SF (
Tho
usa
nd
s)
New SF Available New SF Leased Vacancy %

Tysons – the Bellwether

Source: DTZ Research, CoStar
$29.00$28.00
$30.50 $30.50
$32.00
$26.00
$31.00$32.25
$28.50
$32.50 $32.00
$35.50
$27.50
$38.00
$33.50
$31.00
$35.00$34.00
$37.50$38.50
$40.00
$20
$25
$30
$35
$40
$45
8180/8200Greenboro
American Center Tysons DullesPlaza
Tysons MetroCenter
1765 GreensboroStation
Westwood MetroTower
Silverline Center
16% 11% 15% 12% 17% 48% 29%
2014 2015 2016
Rent Growth – 2014 to NowAs Quality Space Becomes More Scare – Rents are Popping in Select Tysons Assets
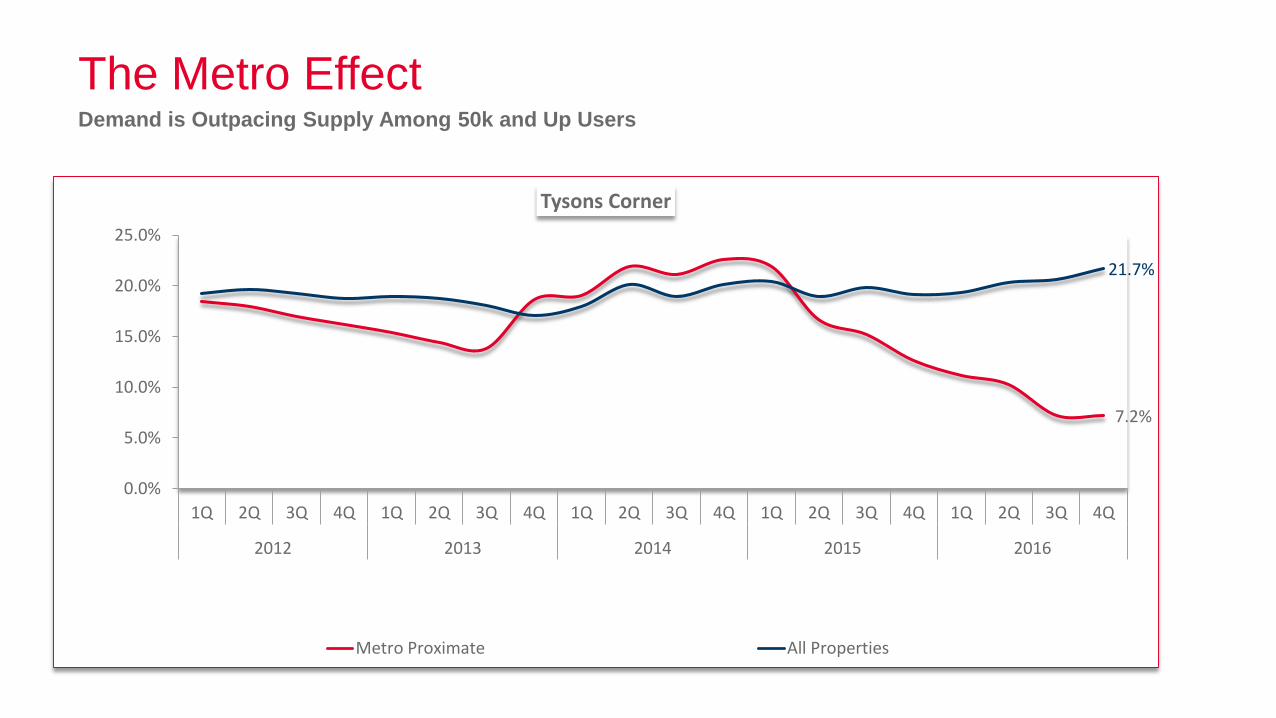
The Metro EffectDemand is Outpacing Supply Among 50k and Up Users
7.2%
21.7%
0.0%
5.0%
10.0%
15.0%
20.0%
25.0%
1Q 2Q 3Q 4Q 1Q 2Q 3Q 4Q 1Q 2Q 3Q 4Q 1Q 2Q 3Q 4Q 1Q 2Q 3Q 4Q
2012 2013 2014 2015 2016
Tysons Corner
Metro Proximate All Properties

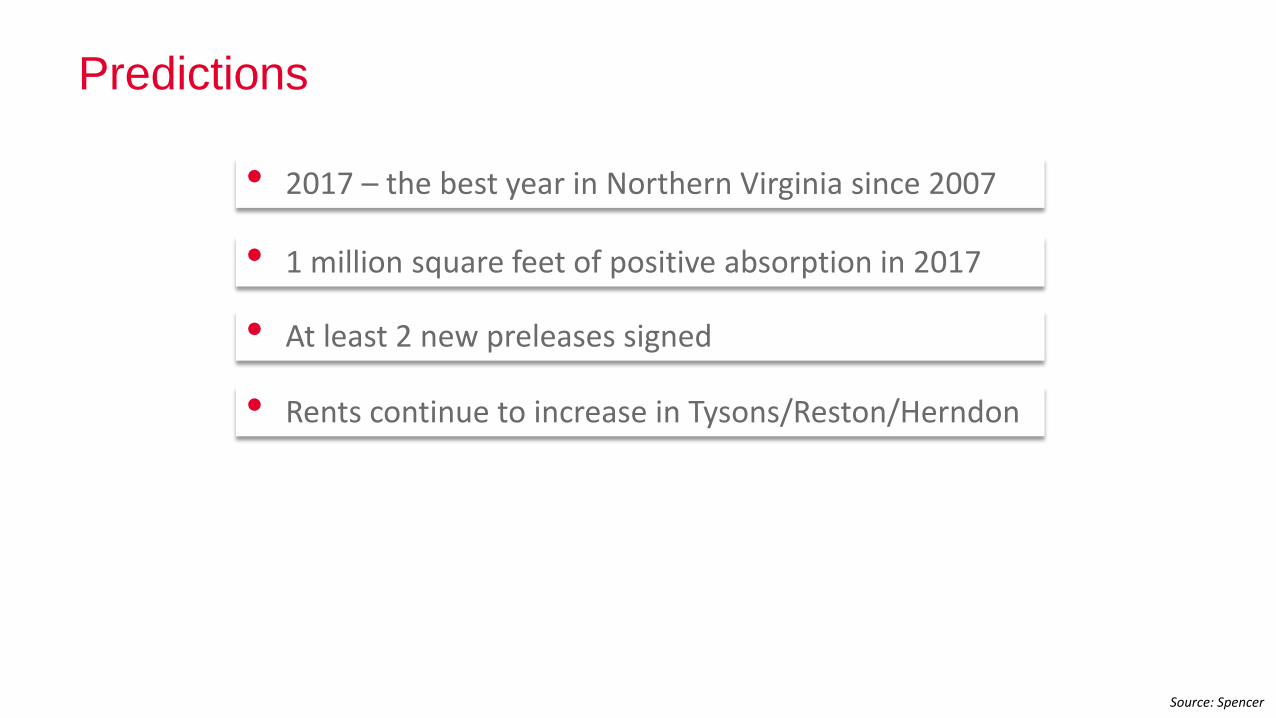
Predictions
Predictions
Source: Spencer
• 2017 – the best year in Northern Virginia since 2007
• 1 million square feet of positive absorption in 2017
• At least 2 new preleases signed
• Rents continue to increase in Tysons/Reston/Herndon
501 K Street, NW
Owner
Notes
Thank You