naip technical presentation david davis & brian vanderbilt gis specialists usda farm service...
TRANSCRIPT
NAIP Technical Presentation
David Davis & Brian VanderbiltGIS Specialists
USDA Farm Service AgencyAerial Photography Field Office
[email protected]@slc.usda.gov

File Extensions&
Coordinate Systems
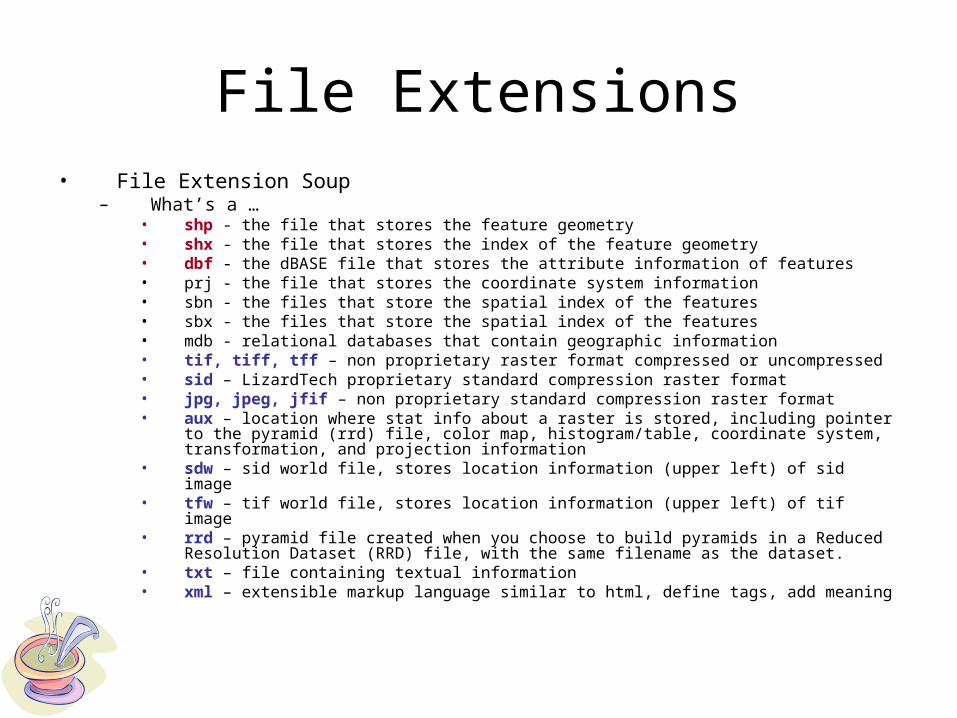
File Extensions• File Extension Soup
– What’s a …• shp - the file that stores the feature geometry • shx - the file that stores the index of the feature geometry • dbf - the dBASE file that stores the attribute information of features • prj - the file that stores the coordinate system information • sbn - the files that store the spatial index of the features • sbx - the files that store the spatial index of the features • mdb - relational databases that contain geographic information • tif, tiff, tff – non proprietary raster format compressed or uncompressed• sid – LizardTech proprietary standard compression raster format• jpg, jpeg, jfif – non proprietary standard compression raster format• aux – location where stat info about a raster is stored, including pointer to the
pyramid (rrd) file, color map, histogram/table, coordinate system, transformation, and projection information
• sdw – sid world file, stores location information (upper left) of sid image• tfw – tif world file, stores location information (upper left) of tif image• rrd – pyramid file created when you choose to build pyramids in a Reduced
Resolution Dataset (RRD) file, with the same filename as the dataset. • txt – file containing textual information• xml – extensible markup language similar to html, define tags, add meaning
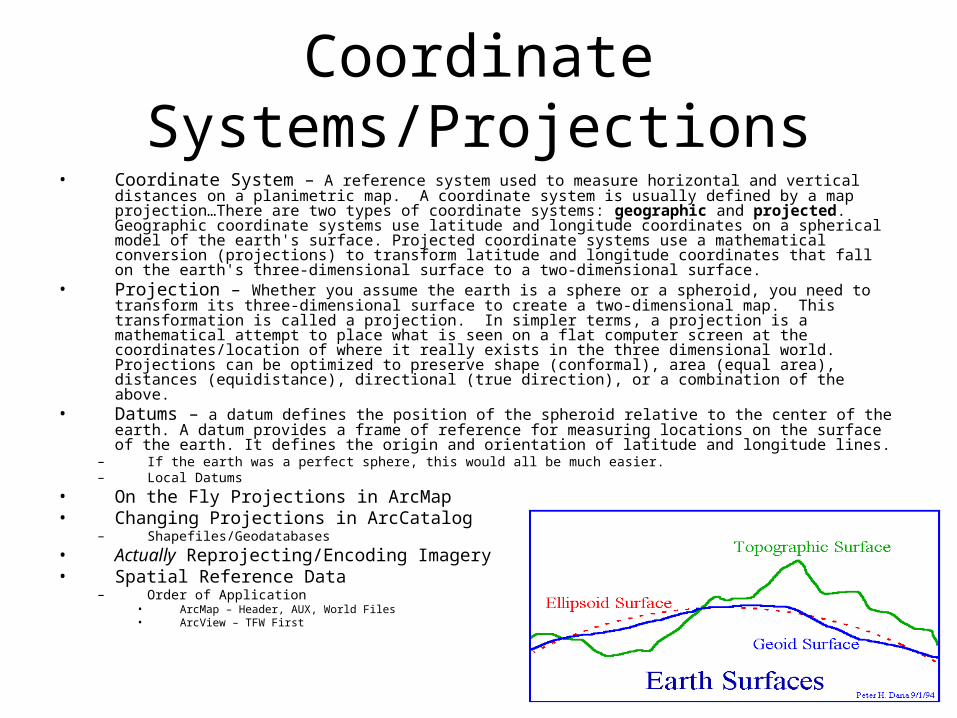
Coordinate Systems/Projections• Coordinate System – A reference system used to measure horizontal and vertical distances on a
planimetric map. A coordinate system is usually defined by a map projection…There are two types of coordinate systems: geographic and projected. Geographic coordinate systems use latitude and longitude coordinates on a spherical model of the earth's surface. Projected coordinate systems use a mathematical conversion (projections) to transform latitude and longitude coordinates that fall on the earth's three-dimensional surface to a two-dimensional surface.
• Projection – Whether you assume the earth is a sphere or a spheroid, you need to transform its three-dimensional surface to create a two-dimensional map. This transformation is called a projection. In simpler terms, a projection is a mathematical attempt to place what is seen on a flat computer screen at the coordinates/location of where it really exists in the three dimensional world. Projections can be optimized to preserve shape (conformal), area (equal area), distances (equidistance), directional (true direction), or a combination of the above.
• Datums – a datum defines the position of the spheroid relative to the center of the earth. A datum provides a frame of reference for measuring locations on the surface of the earth. It defines the origin and orientation of latitude and longitude lines.
– If the earth was a perfect sphere, this would all be much easier.– Local Datums
• On the Fly Projections in ArcMap• Changing Projections in ArcCatalog
– Shapefiles/Geodatabases
• Actually Reprojecting/Encoding Imagery• Spatial Reference Data
– Order of Application• ArcMap – Header, AUX, World Files• ArcView – TFW First
Color, Light, and Atmospheric Conditions
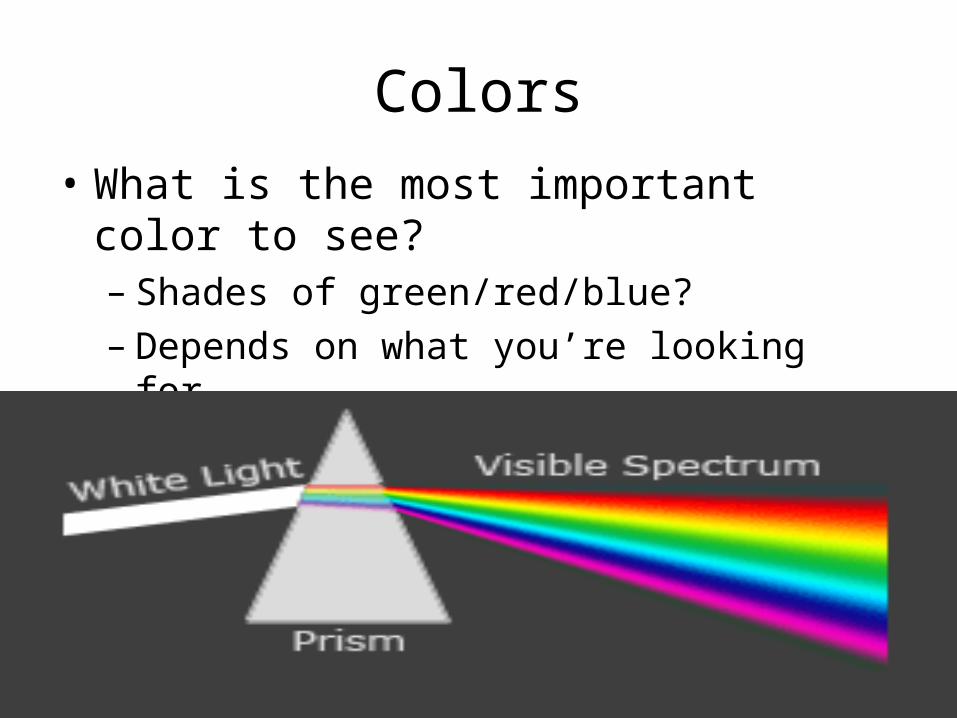
Colors
• What is the most important color to see?– Shades of green/red/blue?– Depends on what you’re looking for…

Color Samples
• NAIP Color Samples– For Each State
• Approved by APFO Color Team• Approved by State Coordinator/Specialist• Forwarded to Vendor as Part of Award Package

Color Balancing
• NAIP Contract Requires Color Balancing– But what is your target image?
• Color adjusted/balanced image– adds contrast, more interpretable, pleasing to the eye
• Unbalanced/raw data– may lead to an inconsistent, patchwork CCM
NAIP04 CCM Christiansen County, Illinois
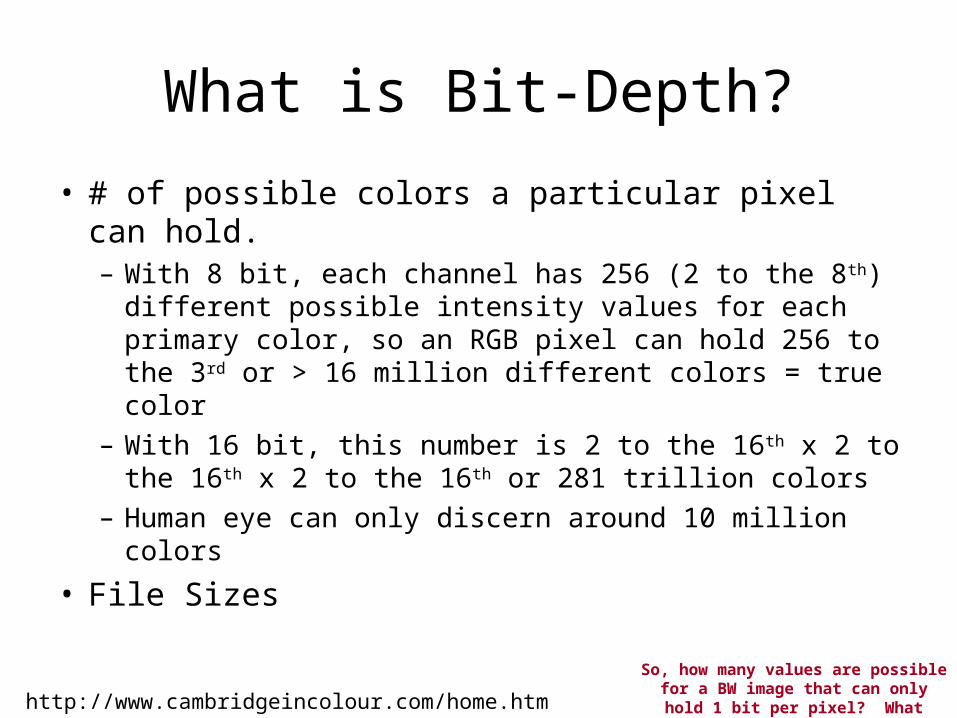
What is Bit-Depth?
• # of possible colors a particular pixel can hold.– With 8 bit, each channel has 256 (2 to the 8th)
different possible intensity values for each primary color, so an RGB pixel can hold 256 to the 3rd or > 16 million different colors = true color
– With 16 bit, this number is 2 to the 16th x 2 to the 16th x 2 to the 16th or 281 trillion colors
– Human eye can only discern around 10 million colors
• File Sizes
http://www.cambridgeincolour.com/home.htm
So, how many values are possible for a BW image that can only hold 1 bit per pixel? What about 2 bits per pixel?

Understanding Light
http://imagine.gsfc.nasa.gov

Understanding Light
• Four Electromagnetic Radiation (EMR) Interactions With Matter– Transmission
• Process by which incident radiation passes through matter w/o measurable attenuation
– Reflection (spectral reflection)• Process by which incident radiation “bounces off” the surface
of a substance in a single, predictable manner– Scattering (diffuse reflection)
• Incident radiation is dispersed or spread out unpredictably in many directions
– Absorption• Incident radiation is taken into the medium
Avery, Thomas Eugene, and Graydon, Lennis Berlin. Fundamentals of Remote Sensing and Airphoto Interpretation, Fifth Edition, Prentice Hall, 1992
Who can give real world examples of each of the four interactions?

Clouds
• Clouds– Reflect Light (EMR)– Absorb Light (EMR)– Obscure View!!!
• Cloud cover and cloud shadow
– 10% Rule• Cloud cover or cloud
shadow (DOQQs)

Atmospheric Scattering
• Visible Light– Rayleigh Scattering (molecular)
• Caused by oxygen and nitrogen molecules• Most influential at altitudes above 4.5 km (~15,000 ft)• Scattering inversely proportional to fourth power of
wavelength– So, blue at .4um scattered five times as readily as red at .6um. – Why is the sky blue?
– Mie Scattering (non-molecular)• Important scattering agents include: water vapor, smoke,
dust, volcanic ash, salt crystals, etc.• Most influential at altitudes below 4.5 km• Depending on factors, blue scattered more readily than red
Avery, Thomas Eugene, and Graydon, Lennis Berlin. Fundamentals of Remote Sensing and Airphoto Interpretation, Fifth Edition, Prentice Hall, 1992 Average flying altitude for NAIP?
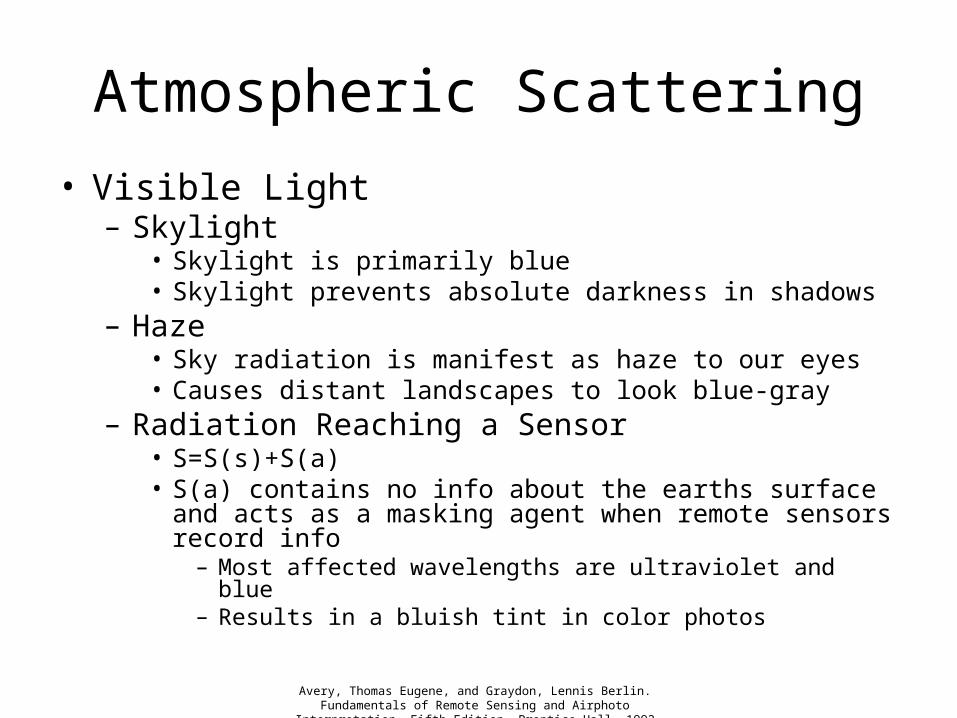
Atmospheric Scattering
• Visible Light– Skylight
• Skylight is primarily blue• Skylight prevents absolute darkness in shadows
– Haze• Sky radiation is manifest as haze to our eyes• Causes distant landscapes to look blue-gray
– Radiation Reaching a Sensor• S=S(s)+S(a)• S(a) contains no info about the earths surface and acts as a
masking agent when remote sensors record info– Most affected wavelengths are ultraviolet and blue– Results in a bluish tint in color photos
Avery, Thomas Eugene, and Graydon, Lennis Berlin. Fundamentals of Remote Sensing and Airphoto Interpretation, Fifth Edition, Prentice Hall, 1992
Sun Angle
• Function of latitude, time of day/year
• Low Verses High– Shadow– Goal of Image
• Ex. Agricultural land verses archeological sites
Avery, Thomas Eugene, and Graydon, Lennis Berlin. Fundamentals of Remote Sensing and Airphoto Interpretation, Fifth Edition, Prentice Hall, 1992
Map Accuracy Standards
Map Accuracy Standards
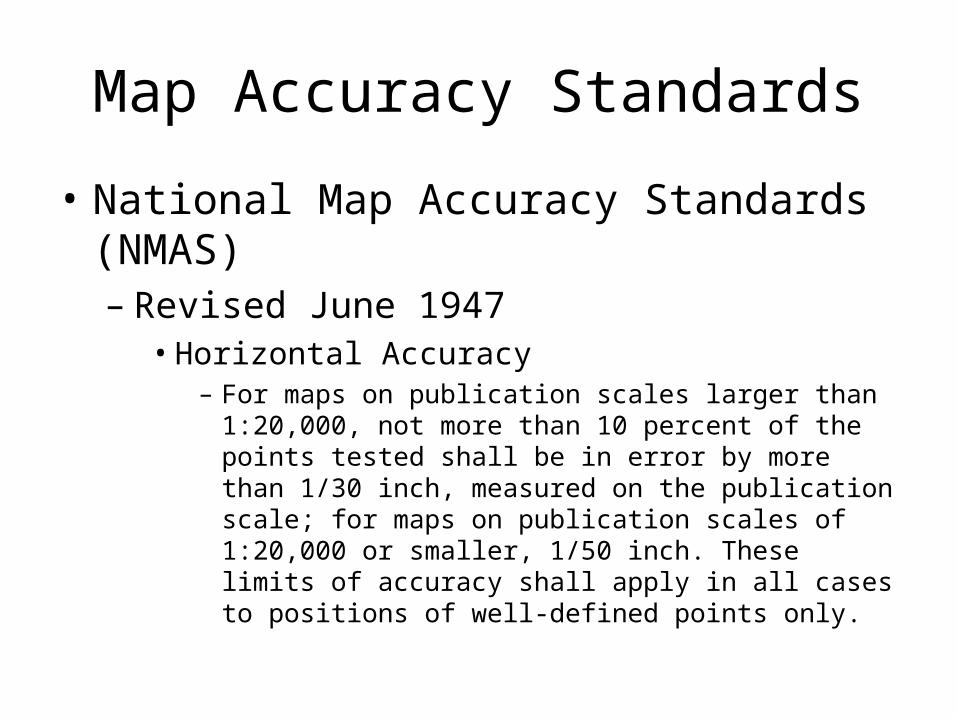
• National Map Accuracy Standards (NMAS)– Revised June 1947
• Horizontal Accuracy– For maps on publication scales larger than 1:20,000, not
more than 10 percent of the points tested shall be in error by more than 1/30 inch, measured on the publication scale; for maps on publication scales of 1:20,000 or smaller, 1/50 inch. These limits of accuracy shall apply in all cases to positions of well-defined points only.
Map Accuracy Standards
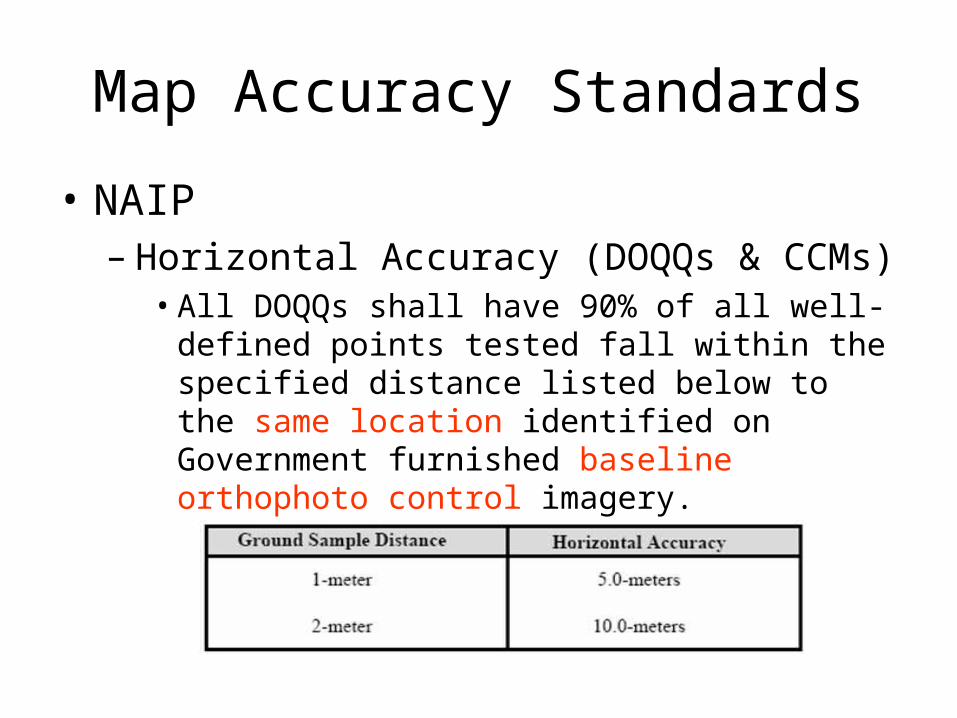
• NAIP– Horizontal Accuracy (DOQQs & CCMs)
• All DOQQs shall have 90% of all well-defined points tested fall within the specified distance listed below to the same location identified on Government furnished baseline orthophoto control imagery.

Map Accuracy Standards
• Service Center Agency Data Management Plan for Ortho Imagery (NAIP)– Horizontal Accuracy Applies to Scale
• Hardcopy plots of the compressed county ortho mosaics can be horizontally accurate to NMAS for 1:12,000 maps. Map accuracy also applies to a display scale of 1:12,000
• Why does map accuracy apply to scale?
Map Accuracy Standards
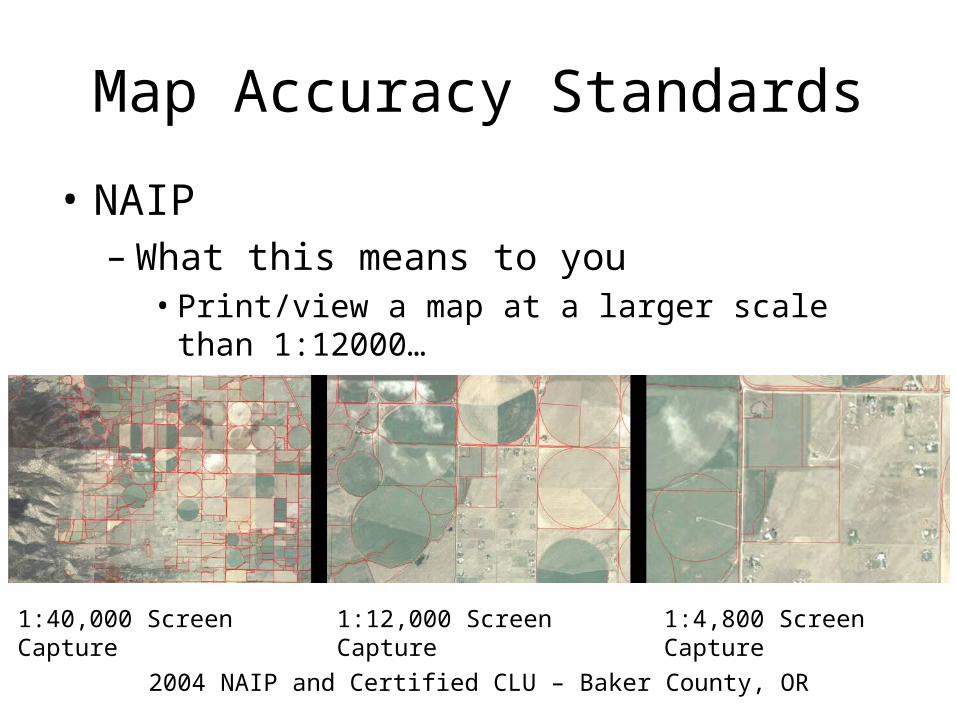
• NAIP– What this means to you
• Print/view a map at a larger scale than 1:12000…
1:40,000 Screen Capture 1:12,000 Screen Capture 1:4,800 Screen Capture
2004 NAIP and Certified CLU – Baker County, OR
Map Accuracy Standards
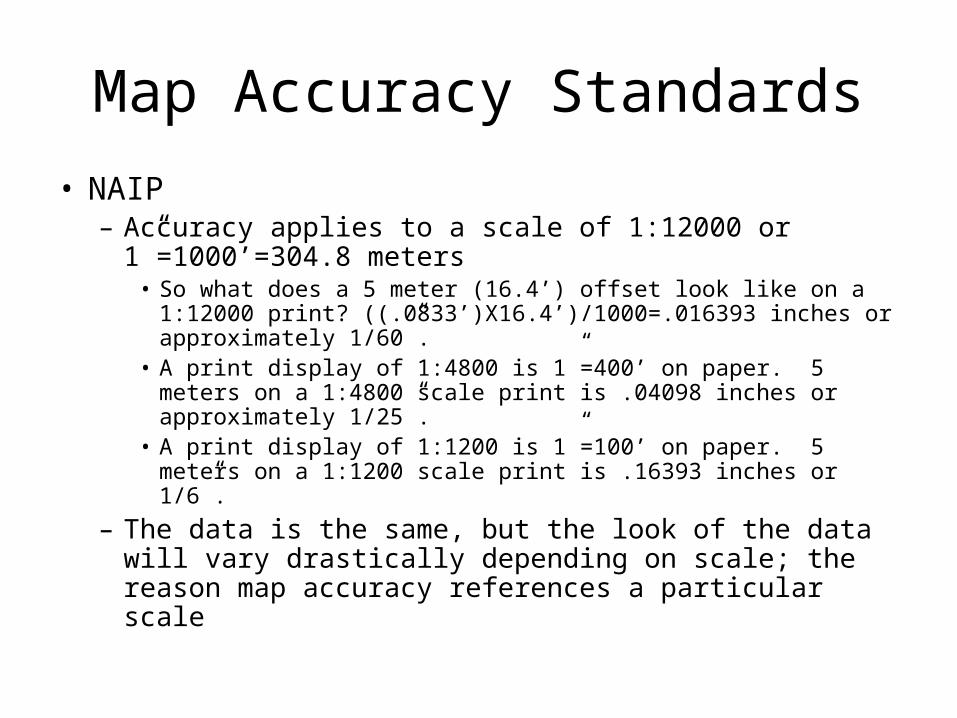
• NAIP– Accuracy applies to a scale of 1:12000 or
1”=1000’=304.8 meters• So what does a 5 meter (16.4’) offset look like on a 1:12000
print? ((.0833’)X16.4’)/1000=.016393 inches or approximately 1/60”.
• A print display of 1:4800 is 1”=400’ on paper. 5 meters on a 1:4800 scale print is .04098 inches or approximately 1/25”.
• A print display of 1:1200 is 1”=100’ on paper. 5 meters on a 1:1200 scale print is .16393 inches or 1/6”.
– The data is the same, but the look of the data will vary drastically depending on scale; the reason map accuracy references a particular scale
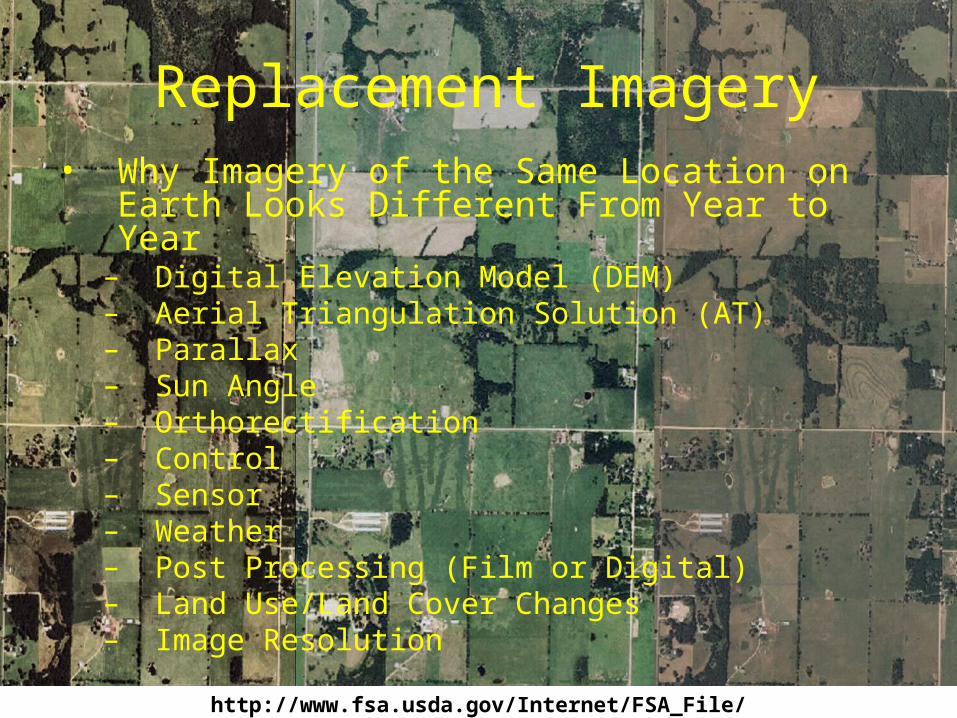
Replacement Imagery• Why Imagery of the Same Location on Earth
Looks Different From Year to Year– Digital Elevation Model (DEM)– Aerial Triangulation Solution (AT)– Parallax– Sun Angle– Orthorectification– Control– Sensor– Weather– Post Processing (Film or Digital)– Land Use/Land Cover Changes– Image Resolution
http://www.fsa.usda.gov/Internet/FSA_File/replacement_image_2006_updatep.pdf

Image Resolution
• Resolution– What is it?– How does it affect what is viewed?– Increased file sizes with higher resolution
• 2m to 1m = file size x 4 (approx.)• 1m to 1ft = file size x 9 (approx.)• Why? Hint…think of a square
– “Things get fuzzy when I zoom in too far”
If I had a 1 meter resolution image and a 6 inch resolution image of the
same area, all other things being equal, about how much larger would
the file size of the 6 inch be?
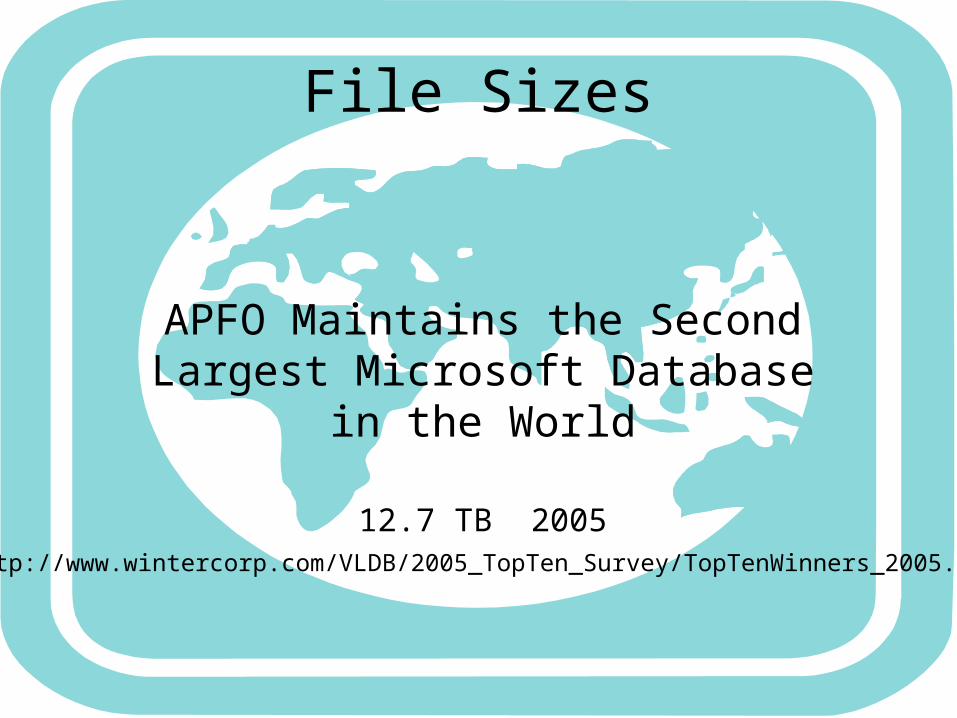
File Sizes
APFO Maintains the Second Largest Microsoft Database in the World
12.7 TB 2005
http://www.wintercorp.com/VLDB/2005_TopTen_Survey/TopTenWinners_2005.asp

File Sizes
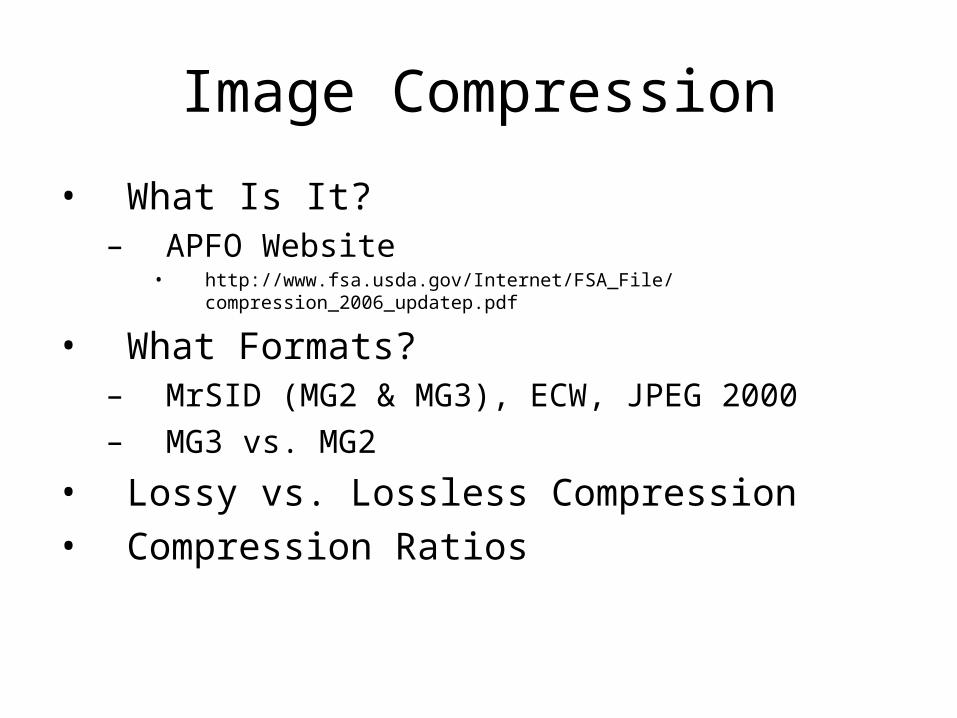
Image Compression
• What Is It?– APFO Website
• http://www.fsa.usda.gov/Internet/FSA_File/compression_2006_updatep.pdf
• What Formats?– MrSID (MG2 & MG3), ECW, JPEG 2000 – MG3 vs. MG2
• Lossy vs. Lossless Compression• Compression Ratios

Color Calibration
• Basics– Hardware/Software system that calibrates monitors
so that an image will appear the same on all monitors (monitors, printers, scanners, etc.)
• Lighting conditions, individual color perception, and other factors can still affect a calibrated system
• APFO uses Monaco Optix 1.0• Why we sent hard copy color samples rather than digital
samples to States and vendors• http://www.cambridgeincolour.com/home.htm

Natural Color vs. CIR• Natural Color
– 3 band RGB
• CIR– 3 band IRRG
• Green light shown as blue• Red light shown as green• NIR shown as red
• http://spatialnews.geocomm.com/features/topoimagery01/
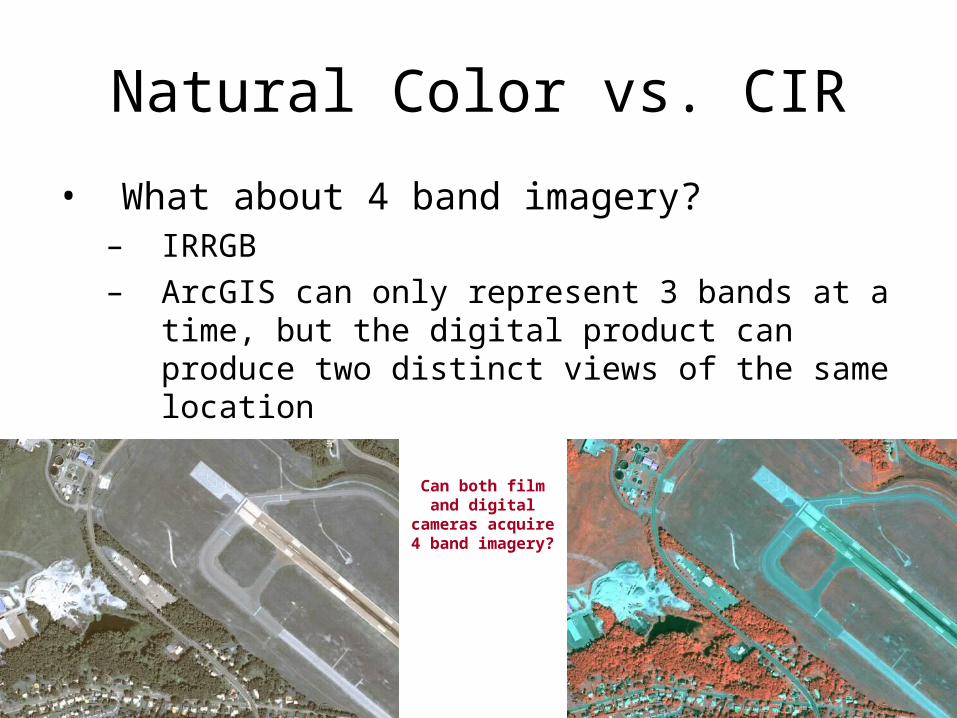
Natural Color vs. CIR
• What about 4 band imagery?– IRRGB– ArcGIS can only represent 3 bands at a time, but
the digital product can produce two distinct views of the same location
Can both film and digital cameras acquire 4 band
imagery?

Questions?