nasa contractor report 172427 acoustic tests of … · nasa contractor report 172427 acoustic tests...
TRANSCRIPT

a
4'
NASA Contractor Report 172427
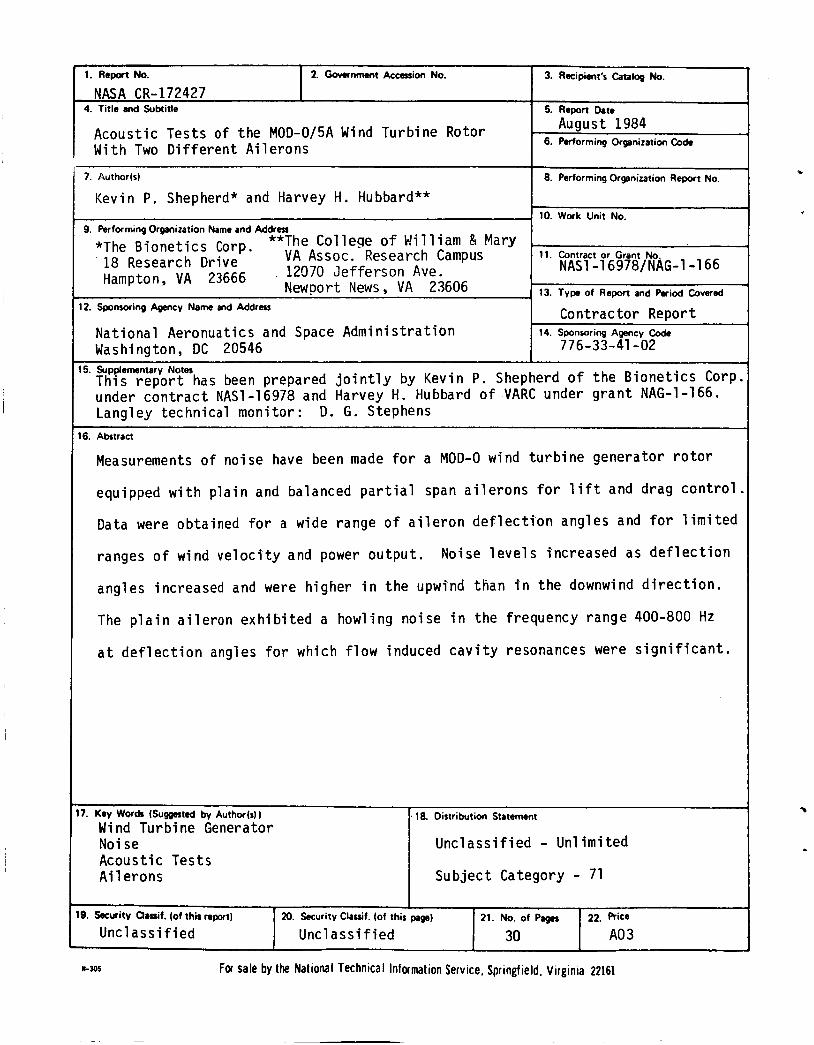
ACOUSTIC TESTS OF THE MOD-O/5A WIND TURBINE ROTOR WITH TWO DIFFERENT AILERONS
Kev in P. Shepherd and Harvey H. Hubbard
THE BIONETICS CORPORATION Hampton, V i r g i n i a
and
THE COLLEGE OF WILLIAM AND MARY V i r g i n i a Assoc ia ted Research Campus Newport News, V i r g i n i a
C o n t r a c t NAS1-16978 Grant NAG1-166 August 1984
National Aeronautics and Space Administration
Langley Research Center Hampton, Virginia 23665
https://ntrs.nasa.gov/search.jsp?R=19840024050 2018-07-08T22:09:09+00:00Z

INTRODUCTION
D
Y
P a r t i a l span a i l e r o n s have been proposed f o r a l a r g e h o r i z o n t a l a x i s
wind t u r b i n e (MOD-5A) as an a l t e r n a t i v e t o f u l l or p a r t i a l span b lade p i t c h
t o c o n t r o l l i f t and drag a t above r a t e d output power. Two conf igura-
t i o n s o f a i l e r o n s be ing considered f o r a p p l i c a t i o n t o t h e proposed MOD-SA
wind t u r b i n e generator were ava i l ab le a t reduced sca le f o r t e s t i n g on the
MOD-0 machine a t t he NASA Plumbrook t e s t s i t e . This paper presents some
bas ic parametr ic acous t ic data f o r these two a i l e r o n con f igu ra t i ons and
shows appropr ia te comparisons.
This e f f o r t i s p a r t o f t he Department o f Energy wind energy program
which i s managed by the NASA Lewis Research Center. The r o t o r blades
which were tes ted on the MOD-0 machine c l o s e l y model those proposed f o r
t h e l a r g e r MOD-SA machine and were designed and fu rn ished by the General
E l e c t r i c Company.
APPARATUS AND METHODS
Descr ip t ion o f S i t e
The wind t u r b i n e s i t e a t which no ise measurements were made i s a t the
NASA Plumbrook f a c i l i t y l oca ted near Sandusky, Ohio (F igure 1). The t e r r a i n
i n the measurement area i s e s s e n t i a l l y f l a t , and devoid o f t r e e s and bushes.
The ground sur face was covered with approximately s i x inches o f snow f o r
t h e f i r s t a i l e r o n t e s t and was grass covered f o r t h e second t e s t . I n bo th
ins tances background no ise l e v e l s were very low except f o r t he occasional
passage o f automobiles and a i r c r a f t .
Desc r ip t i on o f Wind Turbine
The MOD-0 wind t u r b i n e has a two bladed 39 m (128 f t ) diameter r o t o r
mounted on a 36.6 (120 f t ) h igh tower w i t h a twelve s ided cross sect ion.
-1-

The d is tance across the tower, between f l a t s , i s 2.1 m ( 7 f t ) a t t h e base
and tapers t o 1.5 m (5 f t ) a t t h e top.
o f t he suppor t ing tower, operates a t 40 rpm and i s nomina l l y r a t e d a t 200 kW.
I n an attempt t o s imu la te t h e proposed MOD-5A (upwind design) angles of
a t tack , the MOD-0 machine was operated a t 20 rpm and power was l i m i t e d t o
35 kW which i s achieved a t a wind speed o f 4.5 m/s (10 mph).
The r o t o r of t h e MOD-0 i s downwind
Two d i f f e r e n t p a r t i a l span a i l e r o n c o n f i g u r a t i o n s (F igu re 2 ) were
tes ted .
a i l e r o n a lso p i v o t s a t 38% o f t h e chord, but extends t o about 50% o f t h e
chord on the h i g h pressure s ide o f t he blade.
were f i t t e d t o t h e ou te r 6.6 m (21.6 f t ) o f each blade. Blades tapered i n
chord from about 1.22 m ( 6 f t ) a t t he inboard a i l e r o n s t a t i o n (NACA 64624
a i r f o i l ) t o about 0.65 m (2.1 f t ) a t t h e t i p a i l e r o n s t a t i o n (NACA 64615)
and l i k e w i s e t h e t w i s t v a r i e d from 3 O t o lo. The r o t o r blades have a
t o t a l area o f about 26.8 m' (288 f t ' ) , and have roughness s t r i p s extending
from t h e nose o f t h e a i r f o i l t o about 5% chord on bo th surfaces. Data
were taken a t a r o t a t i o n a l speed o f 20 rpm f o r b o t h a i l e r o n c o n f i g u r a t i o n s
and a l s o a t 13.8 rpm for t h e p l a i n a i l e r o n .
The p l a i n a i l e r o n p i v o t s a t 38% o f t h e b lade chord. The balanced
I n b o t h cases t h e a i l e r o n s
Wind Turbine Operat ing Condi t ions
Data f o r t h e p l a i n a i l e r o n were recorded on 17 and 19 January 1984
The temperature range was -12 t o -5OC and between 0900 and 1600 hours.
t h e mean wind v e l o c i t y , V , ranged from about 3 t o 6 m/s (7 t o 13 mph).
Data fo r the balanced a i l e r o n were recorded 11-13 June 1984, t h e tempera-
t u r e range was 2 1 t 0 2 9 ~ C and the mean wind v e l o c i t y ranged from 2 t o 5 m/s
( 5 t o 12 mph).
Wind v e l o c i t y and d i r e c t i o n were monitored and cont inuously recorded
from meteoro log ica l instruments l o c a t e d a t t h e h e i g h t o f t he r o t o r hub and
60 m upwind o f t h e machine. Example t ime h i s t o r i e s o f wind v e l o c i t y and
-2-

c
t
d i r e c t i o n and elect.rica1 power nut.put a r e shown i n F i q u r e 3. The var ia -
t i o n s i n d i c a t e d i n F iqure 3 are representa t ive o f those e x i s t i n g a t t h e
t imes o f t h e t e s t s fo r which data a r e repor ted here in.
Noise Measurements
A l l no ise measurements were made w i t h commercial ly a v a i l a b l e b a t t e r y
powered inst rumentat ion. One-half inch diameter condenser microphones
w i t h a usable frequency range o f 3-20,000 Hz were used w i t h an FM four
channel recorder which prov ides a dynamic range o f about 40 dB i n t h e f r e -
quency range of 0 Hz t o 15,000 Hz.
s i g n a l s were C-weighted i n an attempt t o more e f f e c t i v e l y use the a v a i l a b l e
dynamic ranqe.
For some record inqs t h e microphone
The measurement l o c a t i o n s f o r these t e s t s a re shown i n F igure 4.
Data were obta ined a t a distance, r , o f 57 m (191 f t ) and a t var ious a z i -
muth anqles: O o (on-axis upwind), 90° (crosswind r i g h t ) , 180° (on-axis
downwind) and 27U0(cross i~ ind l e f t ) . Spec t ra l data were obta ined w i t h t h e
a i d of convent ional one- th i rd octave band and narrow band analyzers.
To minimize t h e de t r imenta l e f f e c t s o f wind noise, polyurethane foam I
microphone wind screens were used and microphones were p laced a t t h e
qround surface, where wind v e l o c i t i e s were r e l a t i v e l y low.
While acous t ic s i g n a l s were being recorded on two tape recorder
channels, simultaneous record ings o f t ime code and r o t o r b lade p o s i t i o n
were made on t h e other two tape recorded channels. These l a t t e r data
were used as an a i d i n acous t ic data analyses.
Acoust ic data a re presented f i r s t f o r t h e p l a i n a i l e r o n and then
f o r the balanced a i l e r o n . E f fec ts t h a t are examined i n c l u d e power out -
put, d i r e c t i v i t y and a i l e r o n d e f l e c t i o n angle.

P l a i n A i l e r o n
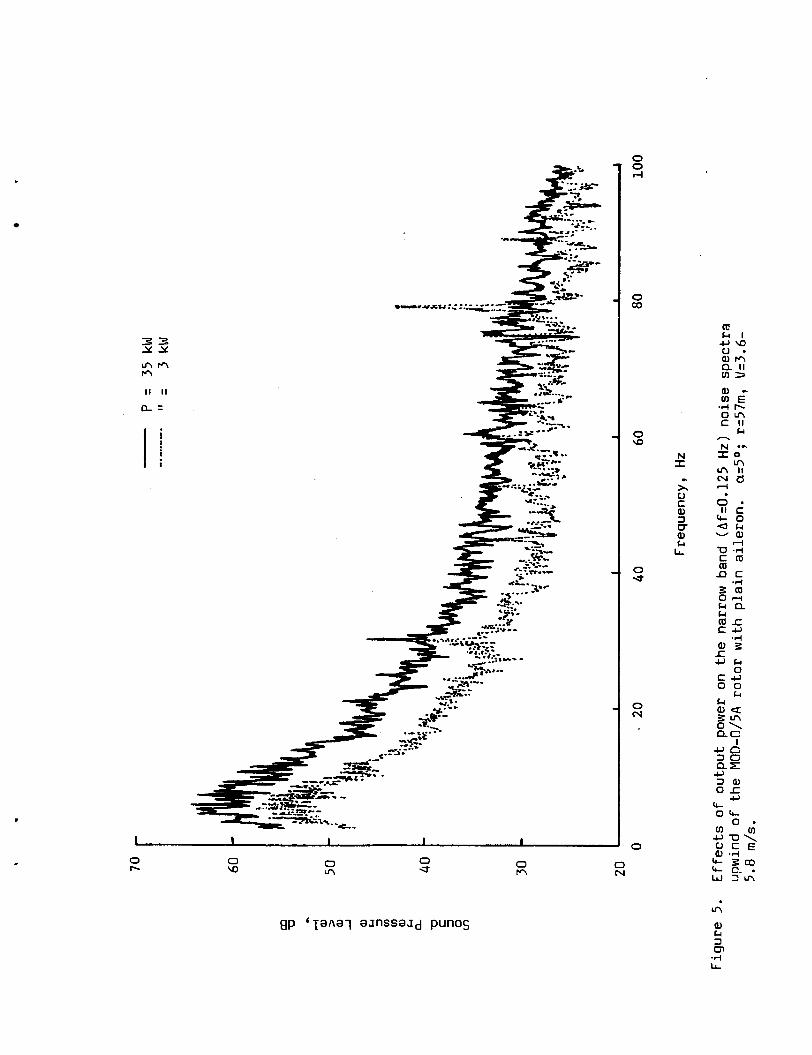
E f f e c t s o f Power Output - The e f f e c t s of output power, P, on qenerated
no ise a r e shown i n F igures 5 and 6.
t h e upwind measurina s t a t i o n and an a i l e r o n d e f l e c t i o n angle o f 5O.
s o l i d and dot ted curves correspond t o output power c o n d i t i o n s o f 35 KW and
3 KW respec t ive ly . F igure 5 i n d i c a t e s t h a t a t low frequencies t h e h igher
no ise l e v e l s are associated w i t h t h e h igher output power cond i t ion . The
h igher f requencies (F igure 6 ) are associated w i t h t h e b lade boundary l a y e r s
and t r a i l i n g edge f lows and are apparent ly n o t s t r o n g l y a f f e c t e d by an in-
crease i n output power. The spect ra a re l a r g e l y random i n nature w i t h a
few i d e n t i f i a b l e d i s c r e t e frequency components. Those a t 30, 60 and 90 Hz
are associated w i t h t h e e l e c t r i c a l generator and t h e c l o s e l y spaced harmonics
below 30 Hz are apparent ly due t o hlade/tower wake i n t e r a c t i o n s .
Narrowband spect ra a r e presented f o r
The
E f f e c t s o f Tower Wake - It i s known from measurements made on o ther
downwind machines t h a t t h e wake from t h e tower a f f e c t s t h e generated noise.
Ry us ing t h e blade p o s i t i o n i n d i c a t o r as a t r i g g e r s i g n a l i t was p o s s i b l e
t o analyze acoust ic date f o r those t imes when t h e r o t o r blades were approxi-
mately h o r i z o n t a l , thus removing t h e e f f e c t o f t h e tower wake. I t was con-
c luded from comparisons o f these data w i t h those presented i n F igures 5 and
6 t h a t t h e tower wake was responsib le f o r t h e harmonics v i s i b l e below about
30 Hz. The remainder o f t h e spectrum was apparent ly unaf fected.
D i r e c t i v i t y E f fec ts - Comparisons o f t h e measured spect ra a t th ree
d i f f e r e n t l o c a t i o n s are shown i n F igures 7 and 8, i n t h e form o f narrow
band and one- th i rd octave spect ra r e s p e c t i v e l y . The main d i f f e r e n c e s are
noted i n t h e frequency range 400 t o 1600 Hz. Downwind and crosswind l e v e l s
are g e n e r a l l y h igher than upwind l e v e l s .
E f fec ts o f A i l e r o n Angle - Spectra corresponding t o d i f f e r e n t a i l e r o n
angles, a, are shown i n F igures 9 , 10 and 11. F i g u r e 9 i l l u s t r a t e s the
-4-

.
change i n t h e upwind no ise spectrum as t h e a i l e r o n angle changes from
Oo t o 15O. Note t h a t broad peaks develop i n t h e frequency range 400-800 Hz
and t h e peak no ise l e v e l s increase as a i l e r o n angle increases up t o a maxi-
mum of 1 2 O .
l e v e l s decrease.
As t h e a i l e r o n angle i s f u r t h e r increased t h e peak no ise
These peaks have been analyzed i n d e t a i l and a r e determined t o be o f
aerodynamic o r i g i n .
spect ra a re i l l u s t r a t e d i n the narrow band data o f F igures 10 and 11.
For t h e c o n d i t i o n s where resonant peaks e x i s t i n t h e spect ra a howl ing
The na ture o f these peaks and o ther d e t a i l s o f t h e
noise i s observed which dominates t h e o ther no ises from t h i s machine. As
a i l e r o n angle increases there i s a r e d u c t i o n i n t h e frequency o f t h e howl ing
(see F igure 9). This behavior sugqests t h a t t h e source mechanism may be an
edge tone phenomenon i n v o l v i n g some combinations o f upstream and downstream
edges o f the blades, a i le rons , and/or c a v i t i e s associated with the counter-
weiqht mechanisms.
The noise peaks probably r e s u l t from resonat ing c a v i t i e s i n t h e blade,
d r i v e n by edge tones.
n o t necessar i l y be a c t i v a t e d a t other v e l o c i t i e s .
n o t e x i s t a t a lower r o t a t i o n a l speed nor was i t ev ident i n wind t u n n e l
t e s t s o f t h e non- ro ta t ing b lade a t lower s e c t i o n speeds.
Such a mechanism i s v e l o c i t y s e n s i t i v e and would
Note t h a t howl inq d i d
The d i r e c t i o n a l p r o p e r t i e s o f t h e howl ing noise are i n d i c a t e d i n
F i g u r e 1 1 which g ives comparable spectra a t two a i l e r o n angles for upwind,
downwind, and crosswind loca t ions . Noise l e v e l increases are seen t o be
t h e smal lest i n t h e downwind d i r e c t i o n . This r e s u l t i s probably due t o
t h e f a c t ' t h a t t h e d is turbance c r e a t i n g t h e increased noise i s on t h e
upwind s i d e o f t h e b lade and i s thus sh ie lded i n t h e downwind d i r e c t i o n .
The howl ing noise encountered on t h i s a i l e r o n i s be l ieved t o be con-
f i g u r a t i o n s e n s i t i v e and thus rniqht n o t occur f o r o t h e r a i l e r o n designs.
-5-

The edqe tone noise components might however be present on any conf igura-
t i o n hav ing an open spanwise s l o t due t o a i l e r o n deployment.
E f f e c t s o f Rota t iona l Speed - For a l i m i t e d number o f t e s t runs t h e
r o t a t i o n a l speed o f t h e machine was reduced from 20 t o 13.8 rpm.
data a re shown i n F igure 12.
s u l t s i n a general reduc t ion i n t h e noise l e v e l s o f about 8 dB f o r the
same power output.
broadband noise due t o t h e reduced t i p speed.
can be seen i n t h e frequency range 400-500 Hz.
t h e low speed spectrum a t f requencies between 800 and 1600 Hz are noises
o f mechanical o r i g i n and may n o t be associated w i t h t h e wind tu rb ine .
Example
I t can be seen t h a t a r e d u c t i o n i n rpm re-
This r e d u c t i o n i s cons is ten t w i t h t h a t p r e d i c t e d f o r
A t 13.8 rpm no resonances
Note t h a t t h e peaks i n
Balanced A i l e r o n
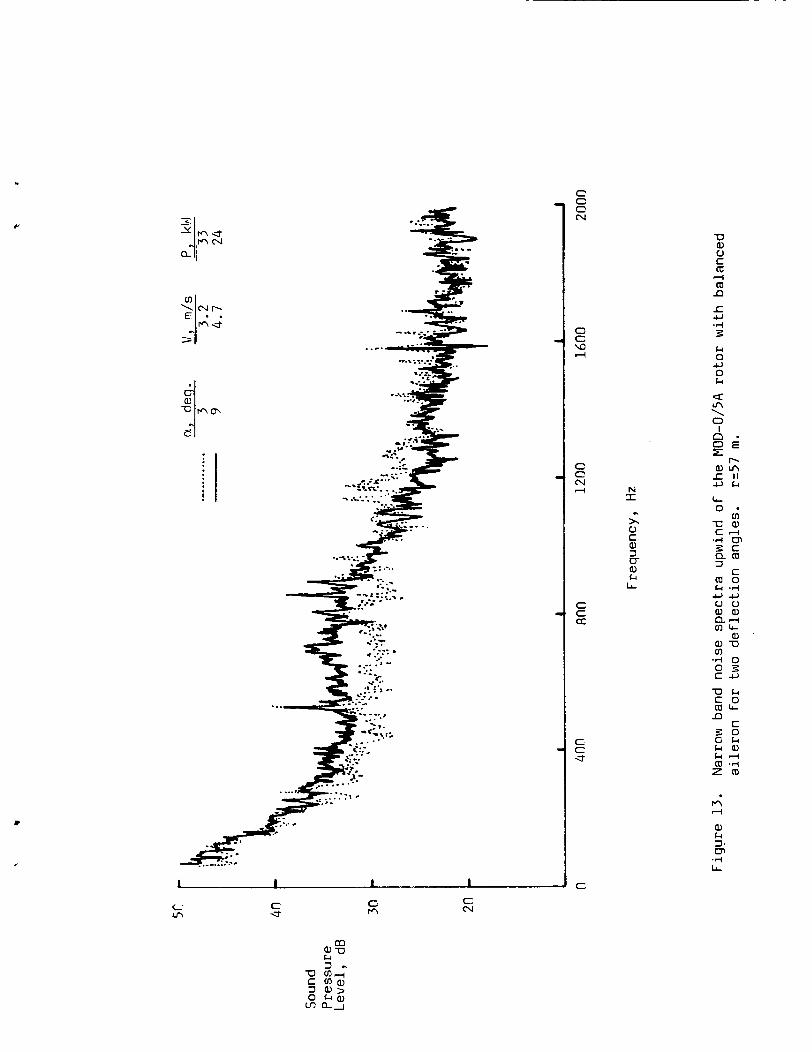
E f f e c t s o f A i l e r o n Angle - Measured spect ra f o r a range o f a i l e r o n
d e f l e c t i o n angles and power values are shown i n F igures 13 and 14.
On-axis data are shown i n b o t h narrow band and one- th i rd octave band
form. The narrow band spect ra o f F igure 13 are inc luded t o show t h e
character o f t h e r a d i a t e d noise.
g e n e r a l l y random i n na ture wi th o n l y a few r e l a t i v e l y weak d i s c r e t e f re -
quencies present.
o n e - t h i r d octave band form.
Note t h a t t h e s p e c t r a l components a re
The remaining data are presented f o r convenience i n
F i g u r e 14 conta ins spect ra f o r t e s t s i n which the rpm was h e l d
constant and the a i l e r o n d e f l e c t i o n angle was s y s t e m a t i c a l l y var ied.
I t should be noted t h a t under some c o n d i t i o n s t h e wind t u r b i n e was n o t
generat ing power ( d e f l e c t i o n angles o f 6 O and 8O i n F igure 14 b) .
a u x i l i a r y power was supp l ied i n order t o ma in ta in t h e r o t o r speed.
t h e upwind d i r e c t i o n there i s a t r e n d toward h igher no ise l e v e l s a t h igher
d e f l e c t i o n angles, p a r t i c u l a r l y i n t h e frequency range 200-800 Hz. I n
t h e downwind d i r e c t i o n there i s very l i t t l e e f f e c t o f d e f l e c t i o n angle
Thus
In
-6-
J
except a t f requencies below about 125 Hz. I n o ther s i m i l a r t e s t s a t
h igher d e f l e c t i o n angles s i m i l a r r e s u l t s were obtained.
E f f e c t s o f Power - Measurements were made a t f i x e d a i l e r o n d e f l e c t i o n
angles f o r ranges o f wind speed and output power.
p l a i n a i l e r o n i t was concluded t h a t t h e noise l e v e l s o f t h e low frequency
components increased as power increased. The l e v e l s a t h i g h f requencies
a r e r e l a t i v e l y i n s e n s i t i v e t o power changes.
As i n t h e case o f t h e
D i r e c t i v i t y - F igure 15 presents one- th i rd octave band spect ra f o r
measurements made i n t h e upwind, downwind and crosswind d i r e c t i o n s . A t
f requencies below about 500 Hz the noise l e v e l s i n t h e crosswind d i r e c -
t i o n are lower than those on axis, whereas a t h igher f requencies no con-
s i s t e n t d i f f e r e n c e s are d iscern ib le .
i s due t o b lade load ing f l u c t u a t i o n s r e s u l t i n g from i n f l o w turbulence.
This no ise component i s expected t o e x h i b i t a d i p o l e r a d i a t i o n p a t t e r n
with i t s maximum on the a x i s o f r o t a t i o n .
w i t h t h e above observat ion.
The dominant no ise a t low frequencies
Such a p a t t e r n i s cons is ten t
COMPARISONS OF AILERON DATA
D i r e c t comparisons o f t h e data obta ined f o r t h e p l a i n and balanced
a i l e r o n s are g iven i n F igures 16 and 17. F igure 16 presents measurements
made i n b o t h t h e upwind and downwind d i r e c t i o n s , f o r comparable opera t ing
cond i t ions .
h igher no ise l e v e l s than t h e p l a i n a i l e r o n , p a r t i c u l a r l y a t f reqencies
below about 250 Hz.
g u r a t i o n s are nominal ly t h e same a t W O O except f o r smal l d i f f e r e n c e s i n
t h e way t h e a i l e r o n s f a i r i n t o the blade.
t o be responsib le f o r t h e h igher frequency (above 400 Hz) sound l e v e l s
be ing grea ter f o r t h e balanced a i l e r o n i n the upwind d i r e c t i o n .
downwind ( low pressure) s i d e o f the b lade i s i d e n t i c a l f o r b o t h a i l e r o n s
There i s a c l e a r t rend f o r t h e balanced a i l e r o n t o produce
The above r e s u l t i s s u r p r i s i n g because b o t h c o n f i -
These d i f f e r e n c e s are presumed
The
-7-

and t h e h i g h frequency sound l e v e l s show good agreement f o r t h e two con-
f i g u r a t i o n s .
400 Hz i n t h e upwind and downwind d i r e c t i o n s are considerable.
d i f f e r e n c e does n o t e x i s t i n t h e crosswind d i r e c t i o n (F igures 8 and 15).
I t i s expected t h a t t h e dominant no ise source i n t h i s frequency range
i s due t o i n f l o w turbulence, e x h i b i t i n g a d i p o l e r a d i a t i o n p a t t e r n ,
t h e h ighes t noise l e v e l s be ing i n t h e d i r e c t i o n perpendicu lar t o t h e
r o t o r plane.
n o t f o r t h e p l a i n a i l e r o n (F igure 8) .
a i l e r o n t e s t , no ise due t o i n f l o w turbulence was a t a lower l e v e l .
Although atmospheric turbulence was n o t measured, t h e two t e s t s were
conducted under d i f f e r e n t weather cond i t ions , and thus i t can be in-
f e r r e d t h a t the turbulence l e v e l s were h igher f o r t h e balanced a i l e r o n
t e s t .
The d i f f e r e n c e s i n t h e noise l e v e l s a t f requencies below
Such a
This was observed f o r t h e balanced a i l e r o n (F igure 151, b u t
This i m p l i e s t h a t f o r t h e p l a i n
Comparisons o f measured and p r e d i c t e d spect ra f o r b o t h t h e MOD-OA
(40 rpm) and the MOD-O/5A (20 rpm) r o t o r s a r e presented i n F i g u r e 17.
F igure 17(a) shows t h e measured MOD-OA data from Reference 1 compared
t o p r e d i c t i o n s by t h e method o f Reference 2, which incorpora tes empi-
r i c a l c o e f f i c i e n t s based on d e t a i l e d data from one l a r g e machine (MOD-2).
This p r e d i c t i o n model inc ludes c o n t r i b u t i o n s from t h e i n f l o w turbulence,
t h e t u r b u l e n t boundary l a y e r s i n t e r a c t i n g w i t h t h e t r a i l i n g edges and
the wakes due t o t r a i l i n g edge bluntness.
general agreement regard ing bo th t h e s lope as a f u n c t i o n o f frequency
and t h e leve ls . S i m i l a r comparisons f o r t h e slower t u r n i n g MOD-O/5A
r o t o r i n Figure 17(b) show t h e p r e d i c t e d l e v e l s t o be lower than t h e
measured values and furthermore t h e slopes o f t h e measured and p r e d i c t e d
curves do n o t agree. These data suggest t h a t t h e e m p i r i c a l b a s i s f o r
p r e d i c t i n g blade noise may no t be a p p l i c a b l e t o b lades wi th a i l e r o n s , or
Pred ic ted values are i n
. e
L
-8-

t o blades opera t ing a t t i p speeds markedly below approximately 80 m/sec
or both.
CONCLUSIONS
Measurements of no ise from a MOD-0 wind t u r b i n e equipped w i t h two
c o n f i g u r a t i o n s of p a r t i a l span a i lerons, y i e l d e d t h e f o l l o w i n g conclusions:
1. Low frequency (below 100 Hz) no ise l e v e l s increase w i t h in-
creas ing power.
2 . The i n t e r a c t i o n s between t h e wind t u r b i n e b lade and t h e tower
wake produces d i s c r e t e low frequency (below 30 Hz) no ise com-
ponents, b u t does n o t a f f e c t no ise l e v e l s a t o ther frequencies.
The d e f l e c t i o n o f t h e p l a i n a i l e r o n r e s u l t s i n g r e a t l y enhanced
no ise l e v e l s a t 400-800 Hz, reaching a maximum a t 1 2 O a i l e r o n
d e f l e c t i o n . This increased no ise i s apparent ly due t o f l o w
induced resonances o f c a v i t i e s i n t h e blade.
3.
4 . The d e f l e c t i o n o f t h e balanced a i l e r o n r e s u l t e d i n smal ler
increases i n noise l e v e l r e l a t i v e t o those f o r t h e p l a i n
a i l e r o n .
Enhanced no ise l e v e l s due t o a i l e r o n deployment a r e g r e a t e r
i n t h e upwind than i n the downwind d i r e c t i o n .
A t f requencies below about 400 Hz t h e no ise l e v e l s assoc iated
w i t h t h e balanced a i l e r o n are s i g n i f i c a n t l y h igher than those
f o r t h e p l a i n a i le ron .
t h e s t r u c t u r e of t h e atmospheric turbulence f o r t h e two t e s t s
r a t h e r than i n t r i n s i c p r o p e r t i e s o f t h e a i le rons .
5.
6 .
This i s b e l i e v e d due t o d i f f e r e n c e s i n
REFERENCES
- 1. Shepherd, Kevin P. and Hubbard, Harvey H.: Sound Measurements and
Observations o f the MOD-OA Wind Turbine Generator NASA CR 165856,
February 1982.
-9-

- 2. Grosveld, F. W . , Shepherd, K. P. and Hubbard, H. H.: Measurement and
Prediction of Broadband Noise from Large Horizontal Axis Wind Tur-
bine Generators.
Workshop, Cleveland, OH, May 8-10, 1984. (Proposed NASA CP).
Proceedings o f DOE/NASA Wind Turbine Technology
'1
f
-10-

Fiatire 1. General Location o f Test S i t e with Inset Phntoqraphs Showing ElOD-0 ttrind Turbine Generator and rlf.lD-O/',A Model Rotor w i t h Aileron

n
a
C m a ln
(c 0
F \I:
c,
.c 0.
a
I m C 0 .rl c, 0 0) r4 (c P) n 0 C M 01 C
d: 0 a
C m c1. fn
4 a
C 0 k P)
C 0
C .d
n m
W
0 3 I-
C, - m Io C 0 cc P)
0, D m 4 m cc 0 c, 0 nz a f C,
cc 0 Io P) r 0 4 a: Y ln
U P ) a l l n m
e

Ln 0 N
c,..
.Ln
.N 0 Ln
N N
rn V a, (0
0 c
4 0 d
0
0 0 \o 00 M d
0
M
Q, k 3 U\
G

I
\
0 0
-1
E \
U C
U cc a J
U C
I ! I I I
I
I i I I
I !
i i
j
t
a k a 3 ([I c, ([I
lz 0 .4 f 3 c, ([I
v) C 0
.rl U ([I 0 0 J
n
m C *4 3 0 E m f 0 U a Y Ln
33 Y Y
Lnm m It II
a =
I j !
0 b 0
M 0 N
0 0 l-l
0
0 \o
0 4
0 N
0

33 Y Y
LnM M
II II
0 0 0 N
c, 0 v) d
0 C w d
C 0 a2
c C
G
N I L
x 0 C al 3 U a2 bl
L L
rJY \ E a3 Ln
c u .
d a .rl C d cd P C
L
G
a, 4 ? u .rl i%
0

o\
E U U f ; 4 >
c, le a -J
I : I
: I
: I
i I
t
0 0 0 U M N
0 0 v) Ln
0 0 0 N
0 0 \D 1
0 0 N .4
0 0 a3
0 0 U
0
0 d

o re al -I
0 0 0
1
W > M
E ; 0
r(
m
nu CD
al ual C k mr n o

N I > u Z W 3 a W U L
Q! W I- Z W 0 cl Z
m W > I- o 0
CE I I- I
W Z 0
a
a
n H
L 0
al 0 C a k
m k 0 L
W C
k a 0 k 4
c

0 \O 0
L n 0 J 0
M 0 N
0 4
0 0 0 N
0 0 v) 4
0 0 N 4
0 0 m
0 0 J
0
a c k O c, .r( 0 & Q O n u 0 4
IC a l a 0-0
.PI 0 0 ‘ 3 n N k I O
IC Ln * c N O II k
I C a l 4 4
gp ‘yartal a m s s a q punos

3 t
.rl E 3 a
- 0
W
1 I I I I
0 0 N 4
0 0 0 L n e M
0 W
8p ‘TaAal a m s s a q punos
0 0 0 N
0 0 v) 4
0 0 N 4
0 0 Q)
0 0 e
0
N I
A 0 C Q) 3 U Q) k
L L

U C
C E 0 U
n v
r
0 U
0 m 0
N 0 4
0 0 0 hl
0 0 a 4
0 0 N 4
0 0 a0
0 0 e
0
N I
x 0 C Q) 3 u 0) k LL
c.
U C 0 C’ v
4 4
0) k 3 CT
.I4 LL

..
Y
zjo M N 0
0 a 0 L n
0 0 0 N
0 0 u) 4
0 0 N 4 N
I
x 0 C al 3 U al Ll
0
0 4
I
1 1
al Ll 3 m
gp ‘Tanal amssaJd punos

05
O M N 4
0 UY
0 ln
0 e 0 M
0 N
0 0 0 N
L
Y
0 0 UY 4
0 0 hl 4 N
I
x C) C 0) 3 0 P) k
L L
0 0 co
0
n k N I l n c - 0
N k
E C N k U Q ar II
c hl 4
Y
8
1 I I I
c C C N
0 C UY 4
C C hl 4 N
I m
x u C al 3 0- al cc L
c C -;r
-0 al 0 C (c
n
5 .A 3 k 0 cl O k
e \ 0 I 0 . O E = h
C
ucc C O m u - m - I E O G k k a l k 4 m .r(
z m
C
c' m c 3
G M
t N

o., deq. \ I , m / s P, kW 0 0 3 . R 3 1
-I W > y 5 0 W & 3 # tn W
E 4 0 n Z 3 0 u)
3 0.'
A
- - - - - - - -
- ( a > Upwind
' ' I " " ' ' i l l " ' I '
-
- .. , LV I
W iY 3 # # w
4 0 a Z 3 0 Ln
ONE-THIRD OCTAVE BAND CENTER FREQUENCY ,Hz
a, deg. V , m/s P , kW 0 0 4 .3 12
I I? 3 4.9 18 0 6 3.8 A 8 3.8
r
U- t
i c (b ) Downwind 1
30 k i t I 1 1 I 1 1 ' I ' I I 31 63 125 250 580 1080 2000 4000
-6 -15
ONE-THIRD OCTAVE BRND CENTER FREQUENCY ,HZ
Figure 14. On-axis noise measurements for the MOD-O/5A r o t o r w i th balanced a i l e r o n over a range o f a i l e r o n d e f l e c t i o n angles. r=57 m.

Q ) N J J x, 0 It
k - E a
c u m f C 0 0
u c c o (ck ncu

68 r m t
t 0 Balanced A i l e r o n 0 P l a i n A i l e r o n
2 0 1 ( a > Upwind - b
31 63 125 250 500 1000 2000 4880
ONE-THIRD OCTRVE BRND CENTER FREQUENCY ,Ht
( b ) Downwind b
31 63 125 250 580 1000 2000 4000
ONE-THIRD OCTRVE BRND CENTER FREQUENCY .Hr
F i g u r e 16. Comparisons of on-ax is n o i s e measurements for t h e MOD-O/5A r o t o r w i t h p l a i n and balanced a i l e r o n s . a=O0, V=4-4.5 m/s, P=9-15 kW, r=57 m.
~~ ~~ ~~

0 measured - MOD-OA 0 11
I 1 - Balanced A i l e r o n - P l a i n A i l e r o n - 0 pred ic ted - (Ref. 2 )
t 1 l(a,) :OD-OA Rotor
30 t l l l l l l t l l l I t l l l
31 63 125 250 500 1000 2000 4000
ONE-THIRD OCTRVE BRND CENTER FREQUENCY Hz
\ MOD-0/5A Rotor
31 63 125 250 500 1800 2000 4800
ONE-THIRD OCTFlVE BAND CENTER FREQUENCY HZ
F igu re 17 . Comparisons of measured and p red ic ted one- th i rd octave band spec t ra f o r t he MOD-OA and MOD-O/5A r o t o r s
1. Report No. 2. Government Accession No. 3. Recipient's Gtaicg No.
17. Key WWdr (Suggested by Author(s)) Wind Turbine Generator Noi se Acoust ic Tests A i 1 erons
NASA CR-172427 I I 4. Title and Subtitle I 5. Report Date
' 18. Distribution Statement
Unc lass i f i ed - Un l im i ted
Sub jec t Category - 71
Acoust ic Tests o f the MOD-O/5A Wind Turbine Rotor Wi th Two D i f f e r e n t A i le rons
19. Sacurity aaSSif. (of this report)
Uncl a s s i f i e d
7. Author(r1
20. Security Clauif. (of this pap) 21. No. of Pages 22. Price
Uncl a s s i f i e d 30 A0 3
I 8. Performing Organization Report No.
Kevin P. Shepherd* and Harvey H. Hubbard** , 10. Work Unit No.
9. Performing Organization Name and Address **The Col lege of M i l l i a m & Mary
11. Contract or Grant No. NASl -1 6978/NAG-1-166
*The Bionetics VA Assoc. Research Campus 18 Research Drive , 12970 Je f fe rson Ave.
, 13. Type of Report and Pwiod Covered 23666 Newport News, VA 23606
12. Sponsoring Agency Name and Address Contractor Report
Nat ional Aeronuatics and Space Admin i s t ra t i on 14. Sponsoring Agency && Was h i ng ton, DC 20546 776-33-41 -02
15. Supplemntary Notes This r e p o r t has been prepared j o i n t l y by Kevin P. Shepherd o f the B ione t i cs Corp. under c o n t r a c t NAS1-16978 and Harvey H. Hubbard o f VARC under g ran t NAG-1-166. Langley technica l mon i to r : D. G. Stephens
~~
16. Abstract
Measurements o f no ise have been made f o r a MOD-0 wind t u r b i n e generator r o t o r
equipped w i t h p l a i n and balanced p a r t i a l span a i l e r o n s f o r l i f t and drag c o n t r o l .
Data were obtained f o r a wide range o f a i l e r o n d e f l e c t i o n angles and f o r l i m i t e d
ranges o f wind v e l o c i t y and power ou tpu t .
angles increased and were h igher i n the upwind than i n the downwind d i r e c t i o n .
The p l a i n a i l e r o n e x h i b i t e d a howl ing noise i n the frequency range 400-800 Hz
a t d e f l e c t i o n angles f o r which f l o w induced c a v i t y resonances were s i g n i f i c a n t .
Noise l e v e l s increased as d e f l e c t i o n