national academy of social insurance (nasi) - …...the national academy of social insurance (the...
TRANSCRIPT

Benefits, Costs, and Coverage
October 2018
Washington, DC
Workers’ Compensation:

The National Academy of Social Insurance (the Academy) is a non-profit, non-partisan organization made up of the nation’s leadingexperts on social insurance. Social insurance encompasses broad-basedsystems that help workers pool risks to avoid loss of income due toretirement, death, disability, or unemployment, and to ensure access tohealth care. The mission of the Academy is to advance solutions tochallenges facing the nation by increasing public understanding of howsocial insurance contributes to economic security. The Academy convenes steering committees and study panels that are charged withconducting research, issuing findings, and, in some cases, making recommendations based on their analyses. Members of these groups areselected for their recognized expertise in a particular area of social insurance, and with due consideration for the balance of disciplines andperspectives appropriate to the project.
This research report presents data on trends in workers’ compensationbenefits, costs, and coverage as of 2016. The report was prepared withthe guidance of the Study Panel on Workers’ Compensation Data and,in accordance with procedures of the Academy, has been reviewed forcompleteness, accuracy, clarity, and objectivity by a committee selectedby the Board of Directors. The purpose of the report is to present thedata and describe trends over time, but not to make policy recommendations.
The Social Security Administration provides partial funding to supportthe collection, processing, and validation of data for this report. Thedata are also used in tables for its Annual Statistical Supplement to theSocial Security Bulletin. The Centers for Medicare & Medicaid Servicesprovide funding to produce selected tables for this report that are alsoused in its own estimates. The project also receives financial supportfrom the Office of Workers’ Compensation Programs in the U.S.Department of Labor and in-kind support from the National Councilon Compensation Insurance and the National Association of InsuranceCommissioners.
© 2018 National Academy of Social InsuranceISBN: 1-884902-63-4
Board of Directors
William M. Rodgers III, Chair
Renée M. Landers, Vice Chair
Jason J. Fichtner, Treasurer
Martha E. Ford, Secretary
G. Lawrence Atkins
Robert A. Berenson
Ngina S. Chiteji
Harry J. Conaway
Cecilia A. Conrad
Indivar Dutta-Gupta
Howard Fluhr
Alexander W. Hertel-Fernandez
Douglas J. Holtz-Eakin
Kilolo Kijakazi
Shaun C. O’Brien
Earl R. Pomeroy
Maya D. Rockeymoore
Rebecca M. Vallas
Founding Chair
Robert M. Ball
Chief Executive Officer
William J. Arnone
1200 New Hampshire Ave., NW
Suite 830
Washington, DC 20036
Telephone (202) 452-8097
Facsimile (202) 452-8111
Web: www.nasi.org Twitter: @socialinsurance

Workers’ Compensation:
Benefits, Costs, and Coverage(2016 data)
by
Christopher F. McLaren, Marjorie L. Baldwin, and Leslie I. Boden
with advice from the
Study Panel on Workers’ Compensation Data
Washington, DC
October 2018


Workers’ Compensation: Benefits, Costs, and Coverage • i
Workers’ compensation provides funding for medicalcare, rehabilitation, and cash benefits for workerswho are injured on the job or who contract work-related illnesses. The program also pays benefits tofamilies of workers who die of work-related injuriesor illnesses. Unlike most other U.S. social insuranceprograms, workers’ compensation programs are regulated by the states, with no federal financing.The programs were established by state statute orwithin state constitutions beginning in 1911, beforemost federal social insurance programs were enacted.The federal government provides workers’ compen-sation insurance for federal employees and forworkers in some high-risk industries, but no federallaws set standards for workers’ compensation programs or require comprehensive reporting ofworkers’ compensation data.
The lack of federal standards or reporting require-ments for state workers’ compensation programsmakes it difficult to provide national estimates basedon uniform definitions of amounts of benefits paid,costs to employers, and numbers of workers covered.In order to produce national summary statistics onthe program, it is necessary to compile data fromvarious sources.
Until 1995, the U.S. Social Security Administration(SSA) produced the only comprehensive nationaldata on workers’ compensation benefits, costs, andcoverage, with annual estimates dating back to 1946.SSA discontinued the series in 1995 and theNational Academy of Social Insurance (theAcademy) assumed the task of reporting nationaldata on workers’ compensation in 1997. TheAcademy published its first report that year and hasproduced the report annually ever since.
This is the Academy’s 21st annual report on workers’compensation benefits, costs, and coverage. Thisreport presents new data on state and federal work-ers’ compensation programs for 2016 and updatedestimates for 2012-2015. The revised estimates inthis report replace estimates in the Academy’s priorreports.
The Academy and its expert advisors are continuallyseeking ways to improve the report and to adapt estimation methods to track new developments inworkers’ compensation programs. Detailed
descriptions of the methods used to produce the estimates in this report are available online atwww.nasi.org/research/workers-compensation.
Despite the Academy’s continued efforts to improvethe quality of its estimates, there are limitations tothe data which we acknowledge in the report. It isimportant to note, for example, that our estimates ofworkers’ compensation costs borne by employersmay not capture the full economic and human costsof work-related injuries, illnesses, and fatalities.These costs – borne by workers, families, and communities – are significant but are beyond thescope of this report. Additionally, the report does notevaluate whether workers’ compensation programsare meeting key objectives, such as: preventing work-related injuries and illnesses; compensating injuredworkers adequately and equitably; rehabilitatinginjured workers and returning them to work at anaffordable cost.
The audience for the Academy’s annual report onworkers’ compensation includes actuaries, insurers,journalists, business and labor leaders, employee ben-efit specialists, federal and state policymakers, andresearchers working in universities, government, andprivate consulting firms. The data from some tablesare published by the National Safety Council (NSC)(in Injury Facts), by the Employee Benefit ResearchInstitute (in Employee Benefit News, Fundamentals ofEmployee Benefit Programs) and by the SSA (in theAnnual Statistical Supplement to the Social SecurityBulletin).
The Academy’s estimates inform state and federalpolicymakers in numerous ways. The federal Centersfor Medicare & Medicaid Services (CMS), for exam-ple, uses the data in estimates and projections ofhealth care spending in the United States. TheNational Institute for Occupational Safety andHealth (NIOSH) uses the data to track the costs ofworkplace injuries in the United States. TheInternational Association of Industrial AccidentBoards and Commissions (IAIABC), the organiza-tion of state and provincial agencies that administerworkers’ compensation in the United States andCanada, uses the information to track and comparethe performance of workers’ compensation programsin the United States with similar systems in Canada.
Preface

AcknowledgementsThe Academy expresses its deep appreciation to staffmembers in the 50 states and District of Columbiaworkers’ compensation offices who provide data ontheir jurisdictions each year. While there are toomany individuals to name here, we are grateful forthe time they spend responding to our survey andanswering clarification questions as needed. Withoutsupport from these individuals, constructing thisannual data series would be impossible. TheAcademy also acknowledges support from the U.S.Social Security Administration (SSA), Centers forMedicare & Medicaid Services (CMS), and theOffice of Workers’ Compensation Programs of theU.S. Department of Labor (DOL).
The authors gratefully acknowledge the time andexpertise contributed by members of the Academy’sStudy Panel on Workers’ Compensation Data. All
members of the Panel are listed on page iii, but weespecially acknowledge the contributions of: TerryBogyo, John F. Burton Jr., Jeff Eddinger, DougHolmes, Mike Manley, Nicole Nestoriak, and FrankNeuhauser. We also thank Elliot Schreur (Academy),Griffin Murphy, the Academy’s workers’ compensa-tion summer intern, and Amy Zhou, for theirresearch assistance. Finally, we appreciate commentsfrom Michael Duff (University of Wyoming),Michael Dworsky (RAND Corporation), and ScottSyzmendera who reviewed a final draft for theBoard.
Marjorie Baldwin Chair, Study Panel on Workers’ Compensation Data
ii NATIONAL ACADEMY OF SOCIAL INSURANCE

Workers’ Compensation: Benefits, Costs, and Coverage • iii
Marjorie Baldwin, ChairProfessor, W. P. Carey School of Business, Department of Economics,Arizona State University
Christine BakerPrincipal and Consultant,Strategic Access Partners
Leslie BodenProfessor, School of PublicHealth, Boston University
Terry BogyoIndependent Workers’Compensation Researcher,Canada
Aaron BrandenburgAssistant Director, DataCoordination and StatisticalAnalysis, National Association ofInsurance Commissioners
John F. Burton, Jr.Professor Emeritus, School ofManagement & Labor Relations,Rutgers University, and School ofIndustrial and Labor Relations,Cornell University
Aaron CatlinDeputy Director, NationalHealth Statistics Group, Officeof the Actuary, Centers forMedicare & Medicaid Services
Charles DavoliLouisiana Workers’ AdvocateLabor Representative of theGovernor’s Workers’Compensation Advisory Council
Jeff EddingerSenior Divisional ExecutiveRegulatory Services, NationalCouncil on CompensationInsurance
Douglas J. HolmesPresident, UWC StrategicServices on Unemploymentand Workers’ Compensation
Jennifer Wolf HorejshExecutive Director, InternationalAssociation of IndustrialAccident Boards andCommissions
Kate KimpanVice President, Workers’Compensation Programs, Dade Moeller & Associates
Mike ManleyIndependent Workers’Compensation Researcher,Panama
Nicole NestoriakResearch Economist, Bureau of Labor Statistics, U.S.Department of Labor
Frank NeuhauserExecutive Director, Center forthe Study of Social Insurance,University of California, Berkeley
Seth A. SeaburyAssociate Professor ofOphthalmology; Director, Keck-SchaefferInitiative for Population Health,University of Southern California
Hilery SimpsonAssistant Commissioner, Office of Safety, Health, andWorking Conditions, U.S. Bureau of Labor Statistics
Emily A. SpielerProfessor of Law, NortheasternUniversity School of Law
Robert Steggert Retired, Marriott International, Inc.
Gary SteinbergRetired, Deputy Director, Officeof Workers’ CompensationPrograms, U.S. Department ofLabor
Alex SwedlowPresident, California Workers’Compensation Institute
Ramona TanabeExecutive Vice President,Workers Compensation Research Institute
Benjamin WashingtonEconomist, National HealthStatistics Group, Office of theActuary, Centers for Medicare& Medicaid Services
Study Panel on Workers’ Compensation Data

iv NATIONAL ACADEMY OF SOCIAL INSURANCE

Workers’ Compensation: Benefits, Costs, and Coverage • v
Table of ContentsPreface . . . . . . . . . . . . . . . . . . . . . . . . . . . . . . . . . . . . . . . . . . . . . . . . . . . . . . . . . . . . . . . . . . . . . . . . . . . . . . . . i
Study Panel on Workers’ Compensation Data. . . . . . . . . . . . . . . . . . . . . . . . . . . . . . . . . . . . . . . . . . . . . . . iii
Highlights . . . . . . . . . . . . . . . . . . . . . . . . . . . . . . . . . . . . . . . . . . . . . . . . . . . . . . . . . . . . . . . . . . . . . . . . . . . . . 1
National Trends (Table 1) . . . . . . . . . . . . . . . . . . . . . . . . . . . . . . . . . . . . . . . . . . . . . . . . . . . . . . . . . . . . 1
State Trends . . . . . . . . . . . . . . . . . . . . . . . . . . . . . . . . . . . . . . . . . . . . . . . . . . . . . . . . . . . . . . . . . . . . . . 1
Background on Workers’ Compensation. . . . . . . . . . . . . . . . . . . . . . . . . . . . . . . . . . . . . . . . . . . . . . . . . . . . 2
History of Workers’ Compensation. . . . . . . . . . . . . . . . . . . . . . . . . . . . . . . . . . . . . . . . . . . . . . . . . . . . 2
Workers’ Compensation Benefits . . . . . . . . . . . . . . . . . . . . . . . . . . . . . . . . . . . . . . . . . . . . . . . . . . . . . 6
Sources of Workers’ Compensation Insurance. . . . . . . . . . . . . . . . . . . . . . . . . . . . . . . . . . . . . . . . . . 7
Estimates for 2016 . . . . . . . . . . . . . . . . . . . . . . . . . . . . . . . . . . . . . . . . . . . . . . . . . . . . . . . . . . . . . . . . . . . . . . 9
Covered Employment and Wages . . . . . . . . . . . . . . . . . . . . . . . . . . . . . . . . . . . . . . . . . . . . . . . . . . . . . . . . . 9
Methods for Estimating Covered Employment and Wages . . . . . . . . . . . . . . . . . . . . . . . . . . . . . . . 9
National Estimates of Covered Employment and Wages . . . . . . . . . . . . . . . . . . . . . . . . . . . . . . . . 10
State Estimates of Covered Employment and Wages . . . . . . . . . . . . . . . . . . . . . . . . . . . . . . . . . . . 16
Workers’ Compensation Benefits Paid . . . . . . . . . . . . . . . . . . . . . . . . . . . . . . . . . . . . . . . . . . . . . . . . . . . . 16
Data Sources and Methods for Estimating Benefits Paid . . . . . . . . . . . . . . . . . . . . . . . . . . . . . . . . 16
National Estimates of Benefits Paid . . . . . . . . . . . . . . . . . . . . . . . . . . . . . . . . . . . . . . . . . . . . . . . . . . 17
State Estimates of Benefits Paid in 2016 . . . . . . . . . . . . . . . . . . . . . . . . . . . . . . . . . . . . . . . . . . . . . . 20
State Trends in Benefits Paid. . . . . . . . . . . . . . . . . . . . . . . . . . . . . . . . . . . . . . . . . . . . . . . . . . . . . . . . 27
Benefits Per $100 of Covered Payroll . . . . . . . . . . . . . . . . . . . . . . . . . . . . . . . . . . . . . . . . . . . . . . . . . 27
Cash Benefits by Type of Claim . . . . . . . . . . . . . . . . . . . . . . . . . . . . . . . . . . . . . . . . . . . . . . . . . . . . . 36
Employer Costs for Workers’ Compensation . . . . . . . . . . . . . . . . . . . . . . . . . . . . . . . . . . . . . . . . . . . . . . . 36
Data Sources for Estimating Employer Costs . . . . . . . . . . . . . . . . . . . . . . . . . . . . . . . . . . . . . . . . . . 36
National Estimates of Employer Costs. . . . . . . . . . . . . . . . . . . . . . . . . . . . . . . . . . . . . . . . . . . . . . . . 38
State Estimates of Employer Costs . . . . . . . . . . . . . . . . . . . . . . . . . . . . . . . . . . . . . . . . . . . . . . . . . . 40
Benefits Paid Relative to Employer Costs . . . . . . . . . . . . . . . . . . . . . . . . . . . . . . . . . . . . . . . . . . . . . 41
Estimates of Employer Costs from Other Sources . . . . . . . . . . . . . . . . . . . . . . . . . . . . . . . . . . . . . . 45
Direct and Indirect Costs to Workers . . . . . . . . . . . . . . . . . . . . . . . . . . . . . . . . . . . . . . . . . . . . . . . . . 46
Incidence of Workplace Injuries and Workers’ Compensation Claims. . . . . . . . . . . . . . . . . . . . . . . . . . . 48
Incidence of Work-Related Injuries. . . . . . . . . . . . . . . . . . . . . . . . . . . . . . . . . . . . . . . . . . . . . . . . . . . 48
Incidence of Workers’ Compensation Claims . . . . . . . . . . . . . . . . . . . . . . . . . . . . . . . . . . . . . . . . . . 51
Addendum . . . . . . . . . . . . . . . . . . . . . . . . . . . . . . . . . . . . . . . . . . . . . . . . . . . . . . . . . . . . . . . . . . . . . . . . . . . 53
Other Disability Benefit Programs . . . . . . . . . . . . . . . . . . . . . . . . . . . . . . . . . . . . . . . . . . . . . . . . . . . 53
Benefits Incurred vs. Benefits Paid . . . . . . . . . . . . . . . . . . . . . . . . . . . . . . . . . . . . . . . . . . . . . . . . . . . 56
Glossary . . . . . . . . . . . . . . . . . . . . . . . . . . . . . . . . . . . . . . . . . . . . . . . . . . . . . . . . . . . . . . . . . . . . . . . . . . . . . 58
Appendix A: Coverage Estimates. . . . . . . . . . . . . . . . . . . . . . . . . . . . . . . . . . . . . . . . . . . . . . . . . . . . . . . . . 63
Appendix B: Federal Programs. . . . . . . . . . . . . . . . . . . . . . . . . . . . . . . . . . . . . . . . . . . . . . . . . . . . . . . . . . . 69
Federal Programs Included in the Academy’s Estimates. . . . . . . . . . . . . . . . . . . . . . . . . . . . . . . . . 69
Federal Employees . . . . . . . . . . . . . . . . . . . . . . . . . . . . . . . . . . . . . . . . . . . . . . . . . . . . . . . . . . . 69
Longshore and Harbor Workers . . . . . . . . . . . . . . . . . . . . . . . . . . . . . . . . . . . . . . . . . . . . . . . . 69
Coal Miners with Black Lung Disease. . . . . . . . . . . . . . . . . . . . . . . . . . . . . . . . . . . . . . . . . . . . 70

Federal Programs Not Included in the Academy’s Estimates . . . . . . . . . . . . . . . . . . . . . . . . . . . . . 71
Energy Employees . . . . . . . . . . . . . . . . . . . . . . . . . . . . . . . . . . . . . . . . . . . . . . . . . . . . . . . . . . . 71
Workers Exposed to Radiation . . . . . . . . . . . . . . . . . . . . . . . . . . . . . . . . . . . . . . . . . . . . . . . . . 72
Veterans of Military Service . . . . . . . . . . . . . . . . . . . . . . . . . . . . . . . . . . . . . . . . . . . . . . . . . . . . 73
Railroad Employees and Merchant Mariners . . . . . . . . . . . . . . . . . . . . . . . . . . . . . . . . . . . . . 74
Appendix C: Workers’ Compensation under State Laws. . . . . . . . . . . . . . . . . . . . . . . . . . . . . . . . . . . . . . 75
References. . . . . . . . . . . . . . . . . . . . . . . . . . . . . . . . . . . . . . . . . . . . . . . . . . . . . . . . . . . . . . . . . . . . . . . . . . . . 83
TablesTable 1: Overview of Workers’ Compensation Benefits, Costs, and Coverage, 2012-2016 . . . . . . . .2
Table 2: Workers’ Compensation Covered Jobs and Covered Payroll, 1996-2016 . . . . . . . . . . . . . .11
Table 3: Workers’ Compensation Covered Jobs by State, 2012-2016 . . . . . . . . . . . . . . . . . . . . . . . . .12
Table 4: Workers’ Compensation Covered Payroll by State, 2012-2016 . . . . . . . . . . . . . . . . . . . . . . .14
Table 5 Workers’ Compensation Benefits Paid by Type of Insurer, 1996-2016 . . . . . . . . . . . . . . . . .18
Table 6: Workers’ Compensation Employer-Paid Benefits UnderDeductible Provisions, 1996-2016 . . . . . . . . . . . . . . . . . . . . . . . . . . . . . . . . . . . . . . . . . . . . . . .19
Table 7: Percentage Distribution of Workers’ Compensation Benefit Payments by Type of Coverage: With and Without Deductibles, 1996-2016 . . . . . . . . . . . . . . . . . . . . .21
Table 8: Workers’ Compensation Benefits Paid by Type of Insurer and State, 2016 . . . . . . . . . . . . .22
Table 9: Workers’ Compensation Total Benefits Paid and Five-Year Percent Change by State, 2012-2016 . . . . . . . . . . . . . . . . . . . . . . . . . . . . . . . . . . . . . . . . . . . . . . . . . . .24
Table 10: Workers’ Compensation Medical Benefits Paid and Five-Year Percent Change by State, 2012-2016 . . . . . . . . . . . . . . . . . . . . . . . . . . . . . . . . . . . . . . . . . . . . . . . . . . .28
Table 11: Workers’ Compensation Cash Benefits Paid and Five-Year Percent Changeby State, 2012-2016 . . . . . . . . . . . . . . . . . . . . . . . . . . . . . . . . . . . . . . . . . . . . . . . . . . . . . . . . . .30
Table 12: Workers’ Compensation Total Benefits Paid Per $100 of Covered Payrollby State, 2012-2016 . . . . . . . . . . . . . . . . . . . . . . . . . . . . . . . . . . . . . . . . . . . . . . . . . . . . . . . . . .32
Table 13: Workers’ Compensation Employer Costs by Type of Insurer, 1996-2016 . . . . . . . . . . . . . . .39
Table 14: Employer Costs for Workers’ Compensation Per $100 of Covered Payroll by State, 2012-2016 . . . . . . . . . . . . . . . . . . . . . . . . . . . . . . . . . . . . . . . . . . . . . . . . . . . . . . . . . .42
Table 15: Workers’ Compensation Benefit/Cost Ratios, 1996-2016 . . . . . . . . . . . . . . . . . . . . . . . . . . . .44
Table 16: Fatal Occupational Injuries and Fatal Injury Rates: All and Wage & Salary Workers, 1996-2016 . . . . . . . . . . . . . . . . . . . . . . . . . . . . . . . . . . . . . . . . . . . . . . . . . . . . . . . . . .47
Table 17: Non-Fatal Occupational Injuries and Illnesses Among Private Industry Employers, 1996-2016 . . . . . . . . . . . . . . . . . . . . . . . . . . . . . . . . . . . . . . . . . . . . . . . . .49
Table 18: Number of Workers’ Compensation Claims Per 100,000 Insured Workers: Private Carriers in 38 Jurisdictions, 1996-2014 . . . . . . . . . . . . . . . . . . . . . . . . . . . . . . . . . . . .51
Table 19: Dual Eligible Individuals: Social Security Disability Insurance (SSDI) Beneficiaries with Workers’ Compensation (WC) or Public Disability Benefits (PDB), 2016 . . . . . . . . . . .55
Table A.1: Documenting Workers’ Compensation Coverage Estimates, 2016 Annual Averages . . . . . . . . . . . . . . . . . . . . . . . . . . . . . . . . . . . . . . . . . . . . . . . . . . . . . . . .66
Table A.2: Workers’ Compensation Coverage as a Percent of the Employed Workforce, 2006-2016 National Averages . . . . . . . . . . . . . . . . . . . . . . . . . . . . . . . . . . . . . . . . . . . . . . . . . .68
vi NATIONAL ACADEMY OF SOCIAL INSURANCE

Workers’ Compensation: Benefits, Costs, and Coverage • vii
Table B.1: Federal Employees’ Compensation Act, Benefits and Costs, 2012-2016 . . . . . . . . . . . . . . .69
Table B.2: Longshore and Harbor Workers’ Compensation Act (LHWCA), Benefits, Costs, and Death Claims, 2012-2016 . . . . . . . . . . . . . . . . . . . . . . . . . . . . . . . . . . . . . . . . . . . . . . . . . .71
Table B.3: Black Lung Benefits Act, Benefits and Costs, 2012-2016 . . . . . . . . . . . . . . . . . . . . . . . . . . . .72
Table B.4: Benefits and Costs of the Energy Employees Occupational Illness Compensation Program Act: Parts B and E, 2012-2016 . . . . . . . . . . . . . . . . . . . . . . . . . . . . .73
Table B.5: Radiation Exposure Compensation Act, Benefits Paid as of June, 2018 . . . . . . . . . . . . . . .74
Table B.6: Federal Veterans’ Compensation Program: Fiscal Year 2016 . . . . . . . . . . . . . . . . . . . . . . . .74
Table C: Workers’ Compensation State Laws as of January 2018 . . . . . . . . . . . . . . . . . . . . . . . . . . . .76
FiguresFigure 1: Workers’ Compensation Benefits and Costs Per $100 of Covered Payroll, 1980–2016 . . . . .3
Figure 2: Workers’ Compensation Medical and Cash Benefits Per $100 of Covered Payroll, 1980–2016 . . . . . . . . . . . . . . . . . . . . . . . . . . . . . . . . . . . . . . . . . . . . . . . . . . . . . . . . . . . . . . . . . . .4
Figure 3: Percentage Share of Medical and Cash Benefits, 1980–2016 . . . . . . . . . . . . . . . . . . . . . . . .35
Figure 4a: Types of Disabilities in Workers’ Compensation Cases with Cash Benefits, 1996-2014, Percentage of Cases . . . . . . . . . . . . . . . . . . . . . . . . . . . . . . . . . . . . . . . . . . . . . . . .37
Figure 4b: Types of Disabilities in Workers’ Compensation Cases with Cash Benefits, 1996-2014, Percentage of Benefits . . . . . . . . . . . . . . . . . . . . . . . . . . . . . . . . . . . . . . . . . . . . . .37
Figure 5: Private Industry Occupational Injuries and Illnesses: Incidence Rates, 1980-2016 . . . . . . .50
Figure 6: Proportion of Worker SSDI Beneficiaries with Connection to Workers’ Compensation or Public Disability Benefits, 2006-2016 . . . . . . . . . . . . . . . . . . . . . . . . . . . . .56
Additional Appendices On-lineAdditional appendices are published in Sources, Methods, and State Summaries: A Companion toWorkers’ Compensation: Benefits, Costs, and Coverage available on the Academy’s website atwww.nasi.org. These appendices provide more information on:
� Data sources for each state
� Methods used to estimate workers’ compensation benefits and costs by type of coverage,
including:
• Deductibles
• Self-insured benefit payments and administrative costs
• Medical benefits
� Updated version of Table 9.B1 of the Annual Statistical Supplement to the Social
Security Bulletin
� 2012 to 2016 trends in benefits paid by second injury funds, special funds, and guaranty funds
� State summary tables that report key metrics from 2012 to 2016

viii NATIONAL ACADEMY OF SOCIAL INSURANCE
Highlights For more than two decades, the National Academyof Social Insurance has produced an annual reporton workers’ compensation benefits, costs, and cover-age. The report provides summary statistics on stateand federal workers’ compensation programs, withthe aim to facilitate policymaking that improves thesystem for both injured workers and employers.This report provides new data for 2016, with com-parison data for the five-year period 2012-2016.
National Trends (Table 1)� Covered employment and wages continued
to rise at a steady pace
• More than 138 million U.S. jobs were covered by workers’ compensation in 2016,representing a 7.9 percent increase across thefive years reported in the study (2012-2016).
• Covered payroll was estimated to be $7.4trillion, a 17.3 percent increase across thefive-year period.
� Benefits paid to injured workers and theirhealth care providers declined by a small percentage
• In 2016, workers’ compensation total benefits paid were $61.9 billion, a decreaseof 1.1 percent from 2012.
— Medical benefits decreased 0.5 percentover the five-year period.
— Cash benefits decreased 1.8 percent.
• Adjusting for the increase in coverage, totalbenefits were $0.83 per $100 of coveredpayroll in 2016, a decrease of $0.16 since2012. (Figures 1 & 2)
— Medical benefits declined by $0.07 from2012.
— Cash benefits declined by $0.09.
� Employer costs increased in total, butdecreased as a percentage of covered payroll
• In 2016, employers’ costs for workers’ compensation were $96.5 billion, a 14.0percent increase from 2012.
• Adjusting for the increase in coverage,employers’ costs were $1.30 per $100 of covered payroll in 2016, down $0.04 from2012. (Figure 1)
State Trends � Workers’ compensation covered employment
and wages increased in almost every statebetween 2012 and 2016
• Covered jobs increased in all jurisdictionsexcept West Virginia, Wyoming, and thefederal system. The largest percentageincrease occurred in Utah (14.6%). (Table 3)
• Covered payroll increased in all jurisdictionsexcept Wyoming. The largest percentageincrease occurred in Washington state(26.8%). (Table 4)
� Workers’ compensation benefits per $100 ofcovered payroll decreased in most states
• Benefits per $100 of covered payrolldecreased in all jurisdictions except Hawaii,Missouri, North Dakota, and Wyoming.(Table 12)
• The largest decrease occurred in Oklahoma,where benefits declined by $0.48 per $100of covered payroll between 2012 and 2016.
� Employers’ costs per $100 of covered payrolldecreased in most states
• Costs per $100 of covered payroll decreasedin 39 jurisdictions, with the largest decreasein Oklahoma (down $0.79 per $100 of covered payroll). (Table 14)
• Costs per $100 of covered payroll increasedin 12 states and the federal system. Amongthe states, the largest increases were inDelaware and Hawaii (both up $0.22 per$100 of covered payroll).
Workers’ Compensation: Benefits, Costs, and Coverage • 1

Background on Workers’ Compensation This section of the report, covering backgroundmaterial that is repeated annually, describes the his-tory of workers’ compensation insurance in theUnited States; the current structure of state workers’compensation programs; types of benefits paid; andhow workers’ compensation is financed. Reportingof detailed program data for 2016 begins on page 16and a glossary of terms used in this report is foundon page 57.1
History of Workers’ CompensationWorkers’ compensation was the first social insuranceprogram adopted in most developed countries. Thefirst modern workers’ compensation laws, based onthe principle of employer liability for workplaceinjuries, were adopted in Germany in 1884 underChancellor Otto von Bismarck (Clayton, 2004). In1897, England passed a similar law, holding employ-ers liable so long as the worker could prove that theyhad been injured on the job.
The first workers’ compensation law in the UnitedStates was enacted in 1908 to cover certain federal
2 NATIONAL ACADEMY OF SOCIAL INSURANCE
Table 1Overview of Workers' Compensation Benefits, Costs, and Coverage, 2012-2016
Percent Change
Aggregate Benefits, Coverage, and Costs 2016 2012-2014 2014-2016 2012-2016
Covered Jobs (in thousands) 138,251 3.7 4.0 7.9
Covered Payroll (in billions) $7,422 8.0 8.7 17.3
Workers' Compensation Benefits Paid (in billions) 61.9 0.4 -1.5 -1.1
Medical Benefits 31.1 2.2 -2.6 -0.5
Cash Benefits 30.8 -1.5 -0.3 -1.8
Employer Costs for Workers' Compensation (in billions) 96.5 9.8 3.8 14.0
Benefits and Costs per $100 of Dollar Change
Covered Payroll 2016 2012-2014 2014-2016 2012-2016
Workers' Compensation Benefits Paid $0.83 -$0.07 -$0.09 -$0.16
Medical Benefits 0.42 -0.02 -0.05 -0.07
Cash Benefits 0.41 -0.05 -0.04 -0.09
Employer Costs for Workers' Compensation 1.30 0.02 -0.06 -0.04
Notes: Benefits are calendar-year payments to injured workers (cash benefits) and to providers of their medical care (medicalbenefits). Costs for employers who purchase workers' compensation insurance include calendar-year insurance premiums paidplus benefits paid by the employer to meet the annual deductible, if any. Costs for self-insuring employers are calendar-yearbenefits paid plus the administrative costs associated with providing those benefits.
Source: National Academy of Social Insurance estimates.
1 This report tracks benefits, costs, and coverage in the 50 states plus the District of Columbia. For brevity, we refer to the District ofColumbia as a state.

civilian workers. The first state laws that survivedconstitutional challenges were enacted in 1911.2
Most states adopted workers’ compensation laws in arelatively short period between 1910 and 1920. Ofthe contiguous 48 states, the last to pass a workers’compensation law was Mississippi in 1948.
Before workers’ compensation laws were enacted,injured workers’ primary legal remedy for a work-related injury was to file a tort suit claimingnegligence on the part of their employer.3 Employerscould use three common law defenses to avoid liability: assumption of risk (showing the injuryresulted from the risks of employment of which the
Figure 1Workers’ Compensation Benefits and Costs Per $100 of Covered Payroll, 1980-2016
Notes: Benefits are calendar-year payments to injured workers and to providers of their medical care. Costs for employers who purchase workers' compensation insurance include calendar-year insurance premiums paid plus benefits paid by the employer to meet the annual deductible, if any. Costs forself-insuring employers are calendar-year benefits paid plus the administrative costs associated with providing those benefits.
Source: National Academy of Social Insurance estimates.
$0.00
$0.50
$1.00
$1.50
$2.00
$2.50
1980
1981
1982
1983
1984
1985
1986
1987
1988
1989
1990
1991
1992
1993
1994
1995
1996
1997
1998
1999
2000
2001
2002
2003
2004
2005
2006
2007
2008
2009
2010
2011
2012
2013
2014
2015
2016
1.861.76
1.671.58
1.94
1.50
1.64
1.49
1.79
2.04
2.18 2.16 2.172.132.05
1.83
1.621.51
1.421.36 1.35
1.46
1.61
1.74 1.74 1.72
1.581.48
1.351.30
1.251.30 1.34 1.37 1.36
0.96 0.971.04 1.05 1.09
1.171.23
1.291.34
1.461.57
1.65 1.65
1.531.47
1.351.26
1.17 1.13 1.121.06 1.10 1.13 1.16 1.13 1.09
0.99 0.96 0.991.03 1.00 1.01 0.99 0.97
0.92
1.33
0.86
1.30
0.83
Workers’ Compensation: Benefits, Costs, and Coverage • 3
Employer Costs
Benefits
2 In 1910 New York became the first state to adopt a workmen’s compensation [as the program was then known] statute of general ap-plication, which was compulsory for certain especially hazardous jobs and optional for others…“[I]n 1911, in Ives v. South BuffaloRailway Co…the Court of Appeals of New York held the New York act unconstitutional on the grounds of deprivation of propertywithout due process of law,” (Wilborn et al., 2017). In 1911, nine states, including Kansas, New Jersey and Wisconsin, enacted elective laws in order to avoid the Ives type of decision, and Washington adopted a compulsory statute, which was upheld by theWashington Supreme Court (Somers and Somers, 1954). Kansas and Washington had the first enactment date (March 14, 1911),but those laws were not effective until after May 3, 1911, the same date when the Wisconsin law was enacted and took effect(Krohm, 2011).
3 Some injured workers received voluntary compensation from their employers or medical benefits paid through personal accident insurance, but many workers received no compensation at all (Fishback and Kantor, 1996).

worker should have been aware);4 the fellow servantrule (showing the injury was caused by a fellowworker’s negligence); or contributory negligence(showing the worker’s own negligence contributed tothe injury, regardless of any fault of the employer).Given the available defenses, it was not surprisingthat employers often prevailed in court. Employerswere, however, at risk for substantial and unpredictable losses if a worker’s lawsuit was successful. Litigation also created friction betweenemployers and workers so that both sides becameincreasingly dissatisfied with the status quo, settingthe stage for reform.
Initial reforms came in the form of employer liabilityacts, which eliminated some of the employer’s common law defenses. Nonetheless, employees stillhad the burden of proving negligence on the part ofthe employer, which remained a significant obstacleto recovery of damages (Burton and Mitchell,2003).5 Ultimately, both employers and employeesfavored workers’ compensation legislation to ensurethat workers who sustained occupational injuries or contracted occupational diseases received predictableand timely compensation. As a quid pro quo, workers’ compensation became the “exclusive remedy” for occupational injuries and diseases, andan employer’s liability was limited to the statutory
4 NATIONAL ACADEMY OF SOCIAL INSURANCE
4 A more complete definition is provided by Willborn, et al. (2017): “The assumption of risk doctrine…barred recovery for the ordi-nary risks of employment; as well as the extraordinary risks of employment, if the worker knew of them or might reasonably havebeen expected to know of them.”
5 As a result, the employers’ liability approach was abandoned in all jurisdictions and industries except the railroads, where it still exists.
Figure 2Workers’ Compensation Medical and Cash Benefits Per $100 of Covered Payroll, 1980-2016
Source: National Academy of Social Insurance estimates.
0.68 0.680.70 0.71
0.73
0.780.80
0.820.84
0.89
0.94
0.990.96
0.87 0.89
0.81
0.76
0.69
0.650.64
0.59 0.60 0.61 0.61 0.60
0.28 0.29
0.340.36
0.39
0.43
0.470.50
0.57
0.62
0.660.69
0.58
0.54
0.500.48 0.48 0.48 0.47
0.500.52
0.550.53
0.51
0.58
0.520.50 0.50
0.530.51 0.50 0.50 0.48
0.45
0.34
0.66
0.47 0.460.49 0.50 0.49
0.51 0.49 0.49
0.47
0.43
0.43
0.41
0.42
1980
1981
1982
1983
1984
1985
1986
1987
1988
1989
1990
1991
1992
1993
1994
1995
1996
1997
1998
1999
2000
2001
2002
2003
2004
2005
2006
2007
2008
2009
2010
2011
2012
2013
2014
2015
2016
$0.00
$0.20
$0.40
$0.60
$0.80
$1.00
Cash Benefits
Medical Benefits

benefits specified in a state workers’ compensationact.6
The adoption of state workers’ compensation programs has been called a significant event in thenation’s economic, legal, and political history.Passage of the laws required prodigious efforts on thepart of business and labor leaders in each state toreach agreements on the specifics of the laws.Essentially, business and labor reached a grand compromise: Injured workers gave up the right tosue their employers in return for guaranteed benefits.Employers agreed to pay compensation for coveredinjuries on a no-fault basis in return for statutorylimits on coverage.
Today, each of the 50 states, the District ofColumbia, and the U.S. territories has its own workers’ compensation program. Separate U.S. government programs cover federal civilian employ-ees, long shore and harbor workers, and specifichigh-risk workers (e.g., coal miners with black lungdisease, energy employees exposed to certain materi-
als such as beryllium, workers exposed to radiation,and veterans of military service). State workers’ com-pensation programs vary in terms of who is allowedto provide insurance, which injuries or illnesses arecompensable, and the level of benefits provided.However, there is consistency across states in centralfeatures of the programs:
n With the exception of Texas, workers’ compen-sation insurance coverage is mandatory for pri-vate-sector employers in all states, with limitedexemptions for small employers and for workersin specific classifications, such as agricultural ordomestic employees.7 Oklahoma implementeda law in 2014 that allowed employers to opt-out of a traditional workers’ compensation planby adopting an alternative benefit plan. ThisOpt-Out Act was in place in 2015, but theSupreme Court of the State of Oklahoma ruledthat it was unconstitutional in September2016.8
n Workers’ compensation pays 100 percent ofinjury-related medical costs for injured workersand cash benefits for lost work time. Lost-timecompensation may be subject to a waitingperiod (typically three to seven days) that maybe paid retroactively if the disability involveshospitalization or a lengthy duration of workabsence. Wage-replacement rates vary by statebut, on average, replace about two-thirds of aworker’s pre-injury gross wage up to state-specified limits. Lost-time compensation is tax-exempt and typically restricted by minimumsand maximums established by state law.
Workers’ Compensation: Benefits, Costs, and Coverage • 5
Workers’ compensation is the “exclusive remedy” for occupationalinjuries and diseases. An employer’sliability is limited to the statutory benefits specified by the workers’
compensation act in their jurisdiction.
6 Under the exclusive remedy concept, the worker accepts workers’ compensation as payment in full and gives up the right to sue.There are limited exceptions to the exclusive remedy concept in some states, such as when there is an intentional injury of the em-ployee or when an employer violates a safety regulation. A suit is also possible if the employer is uninsured.
7 In addition, many states allow specific classes of employers to voluntarily purchase workers’ compensation coverage or to opt-out ofstatutory coverage, e.g., independent contractors, corporate officers, and local governments. Wyoming statute §27-14-108 exemptsemployers from purchasing workers’ compensation insurance if their employees are not engaged in extra-hazardous employment.However, the Statute’s classification of extra-hazardous employment is so extensive that almost every occupation is covered.
8 Oklahoma passed sweeping workers’ compensation statutory amendments in 2013 when Senate Bill 1062 was signed into law. Thebill, which became effective January 1, 2014, allowed employers to provide insurance for injured workers under alternative benefitsystems while maintaining their immunity from tort litigation by injured employees. Under the Oklahoma Employee Injury BenefitAct (OEIBA also known as the “Opt-Out Act”) a “qualified employer” could opt-out of the state workers’ compensation system if itprovided the State Insurance Commissioner with a written private benefit plan that offered comparable coverage consistent with thestate constitution and showed proof that the employer was financially capable of paying the required compensation.
The Opt-Out Act was reviewed in Vasquez v. Dillard’s by the Oklahoma Workers’ Compensation Commission (OK WCC), whichfound that the Act was unconstitutional. The ruling was appealed to the Oklahoma State Supreme Court, which confirmed theCommission’s finding that the Opt-Out Act was unconstitutional (Vasquez v. Dillard's, Inc. 381 P. 3d 768, 2016). The StateSupreme Court, in its decision, wrote: “The core provision of the Opt Out Act, 85A O.S. Supp.2015 203, creates impermissible,unequal, disparate treatment of a select group of injured workers. Therefore, we hold that the Oklahoma Employee Benefit InjuryAct, 85A O.S. 2014 201-213, is an unconstitutional special law under the Oklahoma Constitution.”

n Workers’ compensation is financed exclusivelyby employers except in three states where work-ers pay part of the cost of workers’ compensa-tion benefits and services through direct payrolldeductions or charges.9 Employers purchaseworkers’ compensation insurance from privateinsurers or from a state workers’ compensationinsurance fund, and many large employers self-insure.10
Workers’ Compensation Benefits There are three basic types of workers’ compensationclaims through which injured workers or their med-ical providers may collect benefits: (1) medical-only;(2) temporary disability; and (3) permanent disabili-ty. The type of claim is determined by the severity ofinjury and whether or not the claim involves aninjury-related work absence.
Medical-only claims. Most workers’ compensationclaims do not involve lost work time in excess of thewaiting period for cash benefits, so only medicalbenefits (and not cash benefits) are paid for theseclaims. “Medical-only” claims are the most commontype of workers’ compensation claim, but they repre-sent only a small share of overall payments.
Temporary disability claims. When a work-relatedinjury or illness temporarily prevents a worker fromreturning to their pre-injury job or to another jobfor the same employer, temporary total disability(TTD) benefits are paid in addition to medical ben-efits. Benefits replace approximately two-thirds ofthe worker’s gross, pre-injury weekly earnings fromthe time-of-injury employer up to state-specifiedlimits. If the worker had concurrent employment at
the time of injury – an additional job (or jobs) withanother employer – earnings from a second or otherjob may or may not be covered by temporary disabil-ity benefits.
Compensation for temporary disability is subject tomaximum and minimum benefit levels that varyfrom state to state. As of January 2017, the maxi-mum weekly TTD benefit ranged from a high of$1,688 in Iowa to a low of $478 in Mississippi. Theminimum weekly benefit ranged from a high of$583 in North Dakota to a low of $20 in Arkansas,Florida, and Wisconsin.11
Most workers who receive TTD benefits fully recover and return to work, at which time benefitsend. In many cases, however, employers makeaccommodations allowing injured workers to returnto transitional work before they are physically able toresume all of their former job duties. In these cases,workers may be assigned to restricted duties or short-er hours at lower wages. When injured workersreturn to work at less than their pre-injury wage,they may be eligible for temporary partial disability(TPD) benefits in some states.
Permanent disability claims. Some injured workersexperience work-related injuries or illnesses thatresult in permanent impairments. These workersmay be eligible for either permanent partial or permanent total disability benefits, after they reachmaximum medical improvement (the point at whichfurther medical intervention is no longer expected toimprove functional capacity or provide further healing).12 Permanent total disability (PTD) benefitsare paid to workers who are considered legallyunable to work at all because of a work-related
6 NATIONAL ACADEMY OF SOCIAL INSURANCE
9 In Washington, workers pay part of workers’ compensation premium costs through payroll deductions (See page 36 and footnote toTable 14). Oregon assesses employers and employees for the Workers Benefit Fund, which pays monthly cost-of-living increases forcertain beneficiaries and provides funding for return to work policies that provide incentives to improve employment for injuredworkers. Between 2014 and 2016, the Oregon Workers Benefit Fund Assessment was 3.3 cents per hour worked – employers paid1.65 cents per hour and workers paid 1.65 cents per hour. New Mexico applies a per capita assessment based on employment on thelast day of the quarter. Since 2004, the quarterly workers’ compensation fee is $4.30 per covered worker, which is split between em-ployers and employees. The employers’ share is $2.30 per covered worker and the employees’ share is $2.00. The majority of the totalfee ($4.00 – $2.00 from employers and $2.00 from employees) is used primarily to fund the operation of the New Mexico Workers’Compensation Administration. The additional $0.30 per covered worker paid by employers is used to fund the Workers’ Compensa-tion Uninsured Employers Fund.
10 Some economists argue that workers pay a substantial portion of program costs indirectly in the form of lower wages (Leigh, et al.2000; Gruber and Krueger, 1991).
11 Colorado, Iowa, Maine, Michigan, Montana, Nevada, Oklahoma, and Rhode Island do not have a specified minimum weekly TTDbenefit. Details on benefit and coverage provisions of state laws are summarized in Appendix C.
12 In most claims where workers ultimately receive permanent disability benefits, there is initially a period in which the workers receivetemporary disability benefits, as described in the preceding paragraphs.
injury or illness.13 Permanent partial disability(PPD) benefits are paid to workers whose injuriesresult in permanent impairments, even though theyare able to work in some capacity.
States differ in their methods for determiningwhether a worker is entitled to permanent partialdisability benefits, the extent of permanent disability,and the amount of benefits to be paid (Barth andNiss, 1999; Burton, 2008). There are three opera-tional approaches to determining eligibility for PPDbenefits: The impairment approach pays benefits ifthe worker has a permanent medical loss. The loss ofearning capacity approach pays benefits if the impair-ment causes a permanent loss of earning capacity.The wage loss approach pays benefits only if theworker has actual wage losses. In the first case, theamount of permanent disability benefits is deter-mined by some measure of physical loss to the body;in the second case by an estimate of reduced earningcapacity. In the third case, if the worker has the abili-ty to work in some capacity and actually works, heor she will not receive PPD benefits if no wage loss isincurred.14 Most states impose limits on either themaximum duration or maximum amount of perma-nent disability benefits.15
Fatalities. Workers’ compensation programs also paydeath benefits when a work-related illness or injuryis fatal. The benefits typically include an amount forfuneral and burial expenses, and cash benefits for theworker’s family or dependents. For workers who diewithout dependents, benefits are designed to coverfuneral and burial expenses.
Sources of Workers’ Compensation Insurance Non-federal employers pay for workers’ compensa-tion by purchasing insurance from a privateinsurance carrier, a state workers’ compensationinsurance plan (called a state fund), or by self-
insuring. Federal workers’ compensation insurancecovers federal civilian employees and some private-sector workers employed either in high-risk jobs orjobs related to national defense (see Federal Programson page 8). Many states also have special workers’compensation funds to cover exceptional circum-stances, such as a second work-related injury.
Private insurance. Workers’ compensation policiesprovided by private insurers operate much like automobile or homeowners’ insurance. Employerspurchase insurance for a premium, which variesaccording to expected risk. There are two types ofpolicies: (1) a policy that requires the insurer to payall workers’ compensation benefits; and (2) a policywith a deductible that requires the employer to reimburse the insurer for benefits paid up to thespecified deductible amount. In return for acceptinga policy with a deductible, the employer pays a lowerpremium. Deductibles may be written into an insurance policy on a per-injury basis, an aggregate-benefit basis, or a combination of both. Most statespermit deductible policies in workers’ compensationinsurance, but state regulations vary regardingspecifics (e.g. the maximum deductible allowed andthe minimum premium volume eligible for adeductible policy).
State funds. State workers’ compensation funds areestablished by an act of a state legislature and may bedesignated as exclusive or competitive. An exclusivestate fund is, by statute, the sole provider of workers’compensation insurance in a state (although somestates with an exclusive state fund allow largeemployers to self-insure). A competitive state fundcompetes with private insurers. For this report, wedefine an insurer as a competitive state fund if: (1)the insurer sells workers’ compensation policies toprivate-sector employers in the voluntary insurancemarket; and (2) the insurer is exempt from federaltaxes.16 In 2016, four states had exclusive state funds
Workers’ Compensation: Benefits, Costs, and Coverage • 7
13 Most states allow permanently and totally disabling conditions to be compensated for life if the condition leads to an inability to work. The requirements for a lifetime PTD benefit vary across jurisdictions, but many have a provision such that if an injuredworker has a permanent disability rating over a specified threshold (for instance, more than 70 percent disabled), then the workerwould qualify.
14 A few states do not pay permanent disability benefits if the injured worker returns to work at a wage that is at least 80 percent oftheir pre-injury wage.
15 Many PPD cases are settled with compromise and release agreements (see glossary for complete definition).
16 All competitive state funds are exempt from federal taxes and six funds are also exempt from paying state premium taxes (Hawaii,Idaho, Louisiana, New Mexico, Texas, and Utah).

and, according to our criteria, 17 states had competi-tive state funds.17,18 In addition, South Carolinahad a nonexclusive state fund that provided workers’compensation insurance for state and local govern-ment employees but did not write policies for privateemployers. West Virginia discontinued its state fundin 2009. However, the state was still paying benefitsin 2016 on some claims involving injuries thatoccurred before 2009.
Self-insurance. Many large employers choose to self-insure for workers’ compensation.19 Where self-insurance is permitted, employers must apply forpermission to self-insure from the regulatory authority, and demonstrate that they have sufficientfinancial resources to cover their expected workers’compensation losses.20 Some states permit groups ofemployers in the same industry or trade associationto self-insure through group self-insurance.
Federal programs. The federal government coversworkers’ compensation benefits for federal civilianemployees under the Federal EmployeesCompensation Act (FECA). Federal programs alsocover some private-sector workers, including coalminers with black lung disease, employees of overseas contractors with the U.S. government,
energy employees exposed to certain hazardous materials, workers engaged in manufacturing atomicbombs, and veterans injured while on active duty inthe armed forces. The federal government also provides oversight for workers covered under theLongshore and Harbor Workers’ Compensation Act(LHWCA), but employers are still required to purchase private insurance or self-insure. (Moredetails about these federal programs are provided inAppendix B.)
Guaranty funds. State guaranty funds ensure benefitpayments to injured workers in cases where a privateinsurance carrier or self-insured employer becomesinsolvent and does not have sufficient assets ear-marked to pay outstanding benefits. The benefitpayments and administrative costs of guaranty fundsfor private insurers are typically funded throughassessments on workers’ compensation insurers,while the costs of guaranty funds for self-insuredemployers are funded through assessments on self-insuring employers.
Second injury funds. Second injury funds reim-burse employers or insurance carriers in cases wherean employee with a pre-existing condition related toa work-related injury experiences another work-related injury or illness. The second injury fund paysany costs associated with the prior condition toreduce the cost burden on the current employer. Thefunds encourage employers to hire injured workerswho want to return to work with residual impair-ments. The current employer is responsible only forworkers’ compensation benefits associated with thesecond injury or illness. Second injury funds arefinanced through assessments on employers, and, ina small number of jurisdictions, with general fundmonies.21
17 In 2016, North Dakota, Ohio, Washington, and Wyoming had exclusive state funds. Competitive state funds operated in California,Colorado, Hawaii, Idaho, Kentucky, Louisiana, Maryland, Missouri, Montana, New Mexico, New York, Oklahoma, Oregon, Penn-sylvania, Rhode Island, Texas, and Utah.
18 Of the 17 competitive state funds, 12 operated as the “insurer of last resort,” by selling policies to high-risk employers or any otheremployers that were unable to self-insure or purchase insurance from a private carrier.
19 Employers are allowed to self-insure in all states except for North Dakota and Wyoming, which both require all employers to obtainworkers’ compensation insurance from their exclusive state funds.
20 Nearly all self-insured firms are required to post some type of financial security (e.g. surety bonds) so that workers’ compensationbenefits are paid even if the employer experiences financial distress.
21 See Sources and Methods 2016 on the Academy’s website for further details on special funds, second injury funds, and guarantyfunds.
8 NATIONAL ACADEMY OF SOCIAL INSURANCE
Employers pay for workers’ compensation by purchasing
insurance from a private insurancecarrier, or a state workers’
compensation insurance plan (called a state fund), or some large
employers may self-insure.
Workers’ Compensation: Benefits, Costs, and Coverage • 9
Estimates for 2016The workers’ compensation system involves numerous stakeholder groups: employers, workers,insurers, attorneys, medical providers and state governments. The estimates presented in this reportreflect the aggregate experience of only two groups:workers who rely on compensation for workplaceinjuries, and employers (including the federal government) who pay the bills. The estimates represent benefits and costs paid in each of the lastfive calendar years.
Estimates of benefits for 2016 include paymentsmade in 2016 for injuries and illnesses that occurredin 2016 and in prior years. If an employer purchasesworkers’ compensation insurance from a privateinsurer or state fund, estimates of costs for 2016include premiums that incorporate projected futureliabilities for injuries and illnesses that occur in 2016.If an employer is self-insured, the cost estimatesinclude only those payments made in 2016, eventhough the employer is liable for future costs.
The Academy’s measures are designed to provide thebest available estimates of workers’ compensationbenefits, costs, and coverage, in a given year and overtime. The estimates are not designed to assess the performance of the insurance industry or insurancemarkets. Other organizations analyze insurancetrends.22 The estimates are also not designed to measure the performance of the workers’ compensa-tion system with respect to: the prevention ofoccupational injuries and illnesses; the adequacy,equity, and affordability of compensation; or theimpact of vocational rehabilitation and job accommodations in returning injured workers towork.
Finally, it is not appropriate to use the estimates tocompare the performance of workers’ compensationsystems in different states. Benefits and costs varyacross states not only because their workers’ compensation systems differ, but also because statesdiffer in the relative risk of their industry/occupational mix. A meaningful comparison of
benefits or costs across states must control for variation in system features (including waiting peri-ods, compensation rates, limits on insurable earningsand medical fees), the mix of industries and occupations covered (the proportions of employersin different insurance classifications in each state),and worker outcomes (such as claim acceptance rate,return-to-work rate), which is beyond the scope ofthis report.
Covered Employmentand Wages Methods for Estimating CoveredEmployment and Wages There is no national system for counting the numberof jobs covered by workers’ compensation, so thenumber of covered jobs and wages must be estimat-ed. The Academy’s methodology (for all states exceptTexas) is designed to count the number of jobswhich are legally required to be covered by workers’compensation under state laws.23
The Academy’s measures are designed to provide the best
available estimates of workers’ compensation benefits, costs, andcoverage at the state and national
levels. The estimates provide data ontrends over time, both nationally
and within states However, it is notappropriate to use the estimates to
compare the performance of workers’ compensation systems
across different states.
22 The National Council on Compensation Insurance and state rating bureaus, for example, assess insurance developments in the statesand advise regulators and insurers on proposed insurance rates.
23 Workers’ compensation covered employment is measured in terms of ‘covered jobs’ as opposed to ‘covered workers.’ Refer to Appen-dix A, Employed Workforce Coverage Estimates.

10 NATIONAL ACADEMY OF SOCIAL INSURANCE
We use the number of jobs and amount of wagescovered by unemployment insurance (UI) in eachstate as the starting point for our estimates.24 Then,we estimate the number of jobs that are not requiredto be covered by workers’ compensation according toeach state’s statute regarding exemptions for smallfirms and/or agricultural employers. We subtract thenumber of exempted jobs from the UI base to deter-mine the number of UI covered jobs that are coveredby workers’ compensation. We then calculate theproportion of UI-covered jobs that are covered byworkers’ compensation in each state, and apply thisproportion to the state’s UI-covered payroll to obtaintotal workers’ compensation covered payroll. InTexas, where coverage is optional for employers, weapply the proportion of jobs in firms that opt-in toworkers’ compensation to the UI base.
The Academy’s methodology may undercount theactual number of jobs (and wages) covered becausesome employers that are not required to carry workers’ compensation do so anyway. For example,self-employed persons are not typically required tocarry unemployment or workers’ compensationinsurance, but, in some states, self-employed personsmay voluntarily elect to be covered. In states withexemptions for small firms, some small firms mayvoluntarily purchase workers’ compensation insurance.
On the other hand, our methodology may overesti-mate the number of jobs (and wages) coveredbecause some employers are not in compliance withtheir state’s workers’ compensation or unemploy-ment insurance laws. Every state has a program todetect and penalize employers who fail to report orcover jobs under state labor statutes, but no definitive national study has documented the extentof noncompliance. (For more details on theAcademy’s methods for estimating coverage refer toAppendix A.)
National Estimates of CoveredEmployment and Wages In 2016, workers’ compensation covered an estimat-ed 138.3 million U.S. jobs, a 1.8 percent increasefrom the previous year (Table 2). Covered payrollwas $7.4 trillion, an increase of 3.1 percent from2015. Covered employment and wages haveincreased steadily since 2011, but the rate of increasedeclined in 2016.
Between 2012 and 2016, covered non-federalemployment increased by an estimated 10.2 millionjobs, or 8.1 percent (Table 3). Covered non-federalwages increased by $1.1 trillion or 17.7 percent(Table 4). Overall, in 2016, workers’ compensationcoverage extended to an estimated 97.4 percent of allnon-federal jobs covered by unemployment insur-ance (Table A.1),25 and 86.5 percent of all jobs inthe U.S. (Table A.2).
In contrast to the trend in the non-federal sector,coverage in the federal workers’ compensation pro-gram declined by 27,000 jobs between 2012 and2016 (Table 3). Federal covered employment fell by2.3 percent between 2012 and 2014, but increasedby 1.3 percent between 2014 and 2016, for an over-all reduction of 1.0 percent over the time period.With respect to covered payroll, there was virtuallyno change in the federal system between 2012 and2014 (0.0%) but covered wages increased by 5.8 percent between 2014 and 2016 (Table 4).
24 Unemployment Insurance (UI) programs, under the U.S. Department of Labor, provide cash benefits to workers who become un-employed (through no fault of their own) and meet specific eligibility requirements.
25 According to unpublished estimates provided by the BLS, 3 percent of civilian (non-federal) workers represented by the BLS Na-tional Compensation Survey (NCS) were employed in establishments reporting zero annual workers’ compensation costs in March2017 (DOL, 2018). Civilian workers are those employed in private industry or state and local governments. Excluded from privateindustry are the self-employed and farm and private household workers. Federal government workers are excluded from the publicsector. The private industry series and the state and local government series provide data for the two sectors separately. The Acad-emy’s estimate of legally required workers’ compensation coverage is 97.5 percent of all UI covered jobs in 2016, which is virtuallyidentical to the workers’ compensation coverage shown by the NCS.
Workers’ compensation covered employment and payroll increased in2016, but the rate of increase wasslower than in the previous year.

Workers’ Compensation: Benefits, Costs, and Coverage • 11
Table 2Workers' Compensation Covered Jobs and Covered Payroll, 1996-2016
Covered Jobs Covered Payroll Year (thousands) Percent Change (billions) Percent Change
1996 114,773 1.7 3,337 6.9
1997 118,145 2.9 3,591 7.6
1998 121,485 2.8 3,885 8.2
1999 124,349 2.4 4,151 6.8
2000 127,141 2.2 4,495 8.3
2001 126,972 -0.1 4,604 2.4
2002 125,603 -1.1 4,615 0.2
2003 124,685 -0.7 4,717 2.2
2004 125,878 1.0 4,953 5.0
2005 128,158 1.8 5,213 5.3
2006 130,339 1.7 5,544 6.3
2007 131,734 1.1 5,857 5.6
2008 130,643 -0.8 5,954 1.7
2009 124,856 -4.4 5,675 -4.7
2010 124,638 -0.2 5,834 2.8
2011 125,876 1.0 6,058 3.8
2012 128,141 1.8 6,326 4.4
2013 130,368 1.7 6,501 2.8
2014 132,902 1.9 6,831 5.1
2015 135,850 2.2 7,198 5.4
2016 138,251 1.8 7,422 3.1
Source: National Academy of Social Insurance estimates. See Appendix A for more details.

12 NATIONAL ACADEMY OF SOCIAL INSURANCE
Table 3
Wor
kers' C
ompe
nsation Cov
ered
Job
s by
State, 2
012-20
16
Num
ber of
Jobs
(in
thou
sand
s)Pe
rcen
t Cha
nge
Ran
king
Stat
e20
1220
1320
1420
1520
1620
12-2
014
2014
-201
620
12-2
016
Alaba
ma
1,69
81,
717
1,73
71,
765
1,78
92.
33.
05.
329
Alask
a31
131
331
531
731
11.
4-1
.30.
049
Arizo
na2,
374
2,43
12,
485
2,55
52,
625
4.7
5.6
10.6
12
Ark
ansa
s1,
098
1,09
81,
109
1,12
91,
143
1.0
3.0
4.1
39
Califo
rnia
14,6
7415
,139
15,5
6716
,051
16,4
716.
15.
812
.26
Col
orad
o2,
200
2,27
12,
353
2,42
82,
485
6.9
5.6
13.0
4
Con
nect
icut
1,61
11,
623
1,63
61,
645
1,64
91.
60.
82.
446
Delaw
are
398
407
417
427
432
4.7
3.5
8.3
16
District o
f Col
umbi
a50
651
953
254
555
65.
14.
59.
813
Flor
ida
6,86
67,
045
7,27
87,
561
7,81
76.
07.
413
.92
Geo
rgia
3,65
93,
737
3,84
93,
968
4,07
65.
25.
911
.49
Haw
aii
569
583
593
605
614
4.3
3.6
8.0
19
Idah
o60
261
863
465
267
55.
36.
512
.17
Illin
ois
5,53
75,
590
5,66
95,
754
5,80
12.
42.
34.
836
Indi
ana
2,76
22,
799
2,84
22,
892
2,93
62.
93.
36.
322
Iow
a1,
443
1,46
41,
483
1,49
71,
506
2.8
1.5
4.4
37
Kan
sas
1,28
51,
303
1,32
21,
332
1,33
52.
91.
03.
940
Ken
tuck
y1,
718
1,73
81,
765
1,79
41,
820
2.7
3.1
5.9
23
Loui
sian
a1,
833
1,85
81,
889
1,89
61,
873
3.1
-0.9
2.2
47
Mai
ne56
556
957
357
858
51.
42.
13.
542
Mar
ylan
d2,
363
2,38
42,
406
2,44
32,
477
1.8
3.0
4.8
33
Mas
sach
uset
ts3,
190
3,24
43,
315
3,38
23,
448
3.9
4.0
8.1
17
Michi
gan
3,78
83,
873
3,94
44,
016
4,09
44.
13.
88.
118
Min
neso
ta2,
597
2,64
32,
682
2,72
72,
765
3.3
3.1
6.5
21
Mississip
pi1,
008
1,01
81,
027
1,04
11,
051
1.9
2.3
4.2
38
(1=l
arge
st p
erce
nt in
crea
se,
2012
-201
6)

Workers’ Compensation: Benefits, Costs, and Coverage • 13
Miss
ouri
2,43
62,
467
2,49
62,
541
2,57
82.
43.
35.
824
Mon
tana
414
421
424
432
438
2.4
3.3
5.8
25
Neb
rask
a89
290
591
893
194
02.
92.
45.
428
Nev
ada
1,11
21,
140
1,18
21,
224
1,26
26.
46.
713
.53
New
Ham
pshi
re60
561
161
962
964
02.
33.
35.
726
New
Jersey
3,72
53,
769
3,79
33,
841
3,90
51.
82.
94.
834
New
Mex
ico
730
738
746
755
756
2.3
1.2
3.5
41
New
Yor
k8,
428
8,54
98,
710
8,87
89,
015
3.3
3.5
7.0
20
Nor
th C
arol
ina
3,74
43,
814
3,89
94,
002
4,09
74.
15.
19.
414
Nor
th D
akot
a39
941
443
242
440
48.
3-6
.51.
348
Ohi
o4,
967
5,03
35,
108
5,18
25,
242
2.8
2.6
5.5
27
Okl
ahom
a1,
406
1,43
51,
461
1,47
21,
454
3.9
-0.5
3.4
43
Ore
gon
1,61
21,
651
1,69
91,
760
1,81
35.
36.
712
.45
Penn
sylv
ania
5,45
85,
482
5,52
95,
576
5,62
11.
31.
73.
044
Rho
de Is
land
441
445
452
459
462
2.6
2.1
4.8
35
Sout
h C
arol
ina
1,71
71,
755
1,80
41,
858
1,90
35.
15.
510
.811
Sout
h D
akot
a38
538
939
540
040
42.
72.
25.
031
Tenn
esse
e2,
507
2,55
02,
607
2,67
72,
742
4.0
5.2
9.4
15
Texa
s8,
477
8,67
88,
903
9,23
89,
472
5.0
6.4
11.7
8
Uta
h1,
177
1,21
61,
253
1,30
11,
348
6.5
7.6
14.6
1
Ver
mon
t29
029
229
529
829
81.
81.
02.
945
Virgi
nia
3,37
53,
400
3,41
63,
490
3,54
21.
23.
74.
932
Was
hing
ton
2,82
22,
889
2,97
23,
049
3,14
15.
35.
711
.310
Wes
t Virgi
nia
674
668
665
661
649
-1.3
-2.4
-3.7
51
Wisco
nsin
2,60
12,
628
2,66
62,
701
2,73
32.
52.
55.
130
Wyo
min
g27
127
227
727
526
42.
3-4
.6-2
.450
Tota
l Non
-Fed
eral
125,
321
127,
597
130,
146
133,
057
135,
458
3.8
4.1
8.1
Fede
ral E
mpl
oyee
s2,
820
2,77
12,
756
2,79
32,
793
-2.3
1.3
-1.0
TO
TAL
128,
141
130,
368
132,
902
135,
850
138,
251
3.7
4.0
7.9
Sour
ce:N
atio
nal A
cade
my
of S
ocia
l Ins
uran
ce estim
ates
. See
App
endi
x A fo
r m
ore de
tails
.

14 NATIONAL ACADEMY OF SOCIAL INSURANCE
Table 4
Wor
kers' C
ompe
nsation Cov
ered
Pay
roll by
State, 2
012-20
16
Cov
ered
Pay
roll
(in m
illio
ns)
Perc
ent C
hang
eRan
king
Stat
e20
1220
1320
1420
1520
1620
12-2
014
2014
-201
620
12-2
016
Alaba
ma
$69,
543
$70,
928
$73,
424
$76,
375
$78,
405
5.6
6.8
12.7
37Alask
a15
,367
15,8
2216
,499
17,0
0816
,316
7.4
-1.1
6.2
49Arizo
na10
6,98
611
0,45
511
5,30
012
1,11
712
6,02
57.
89.
317
.819
Ark
ansa
s41
,475
42,2
9743
,869
45,6
9347
,036
5.8
7.2
13.4
33C
alifo
rnia
831,
610
861,
194
914,
844
986,
111
1,03
3,04
810
.012
.924
.24
Col
orad
o11
0,07
311
4,42
612
2,94
213
0,42
113
4,65
311
.79.
522
.38
Con
nect
icut
99,9
3510
1,06
410
4,44
110
7,65
210
8,46
94.
53.
98.
546
Delaw
are
20,5
5321
,108
22,1
0422
,963
23,1
177.
54.
612
.538
District o
f Col
umbi
a38
,542
39,7
5641
,850
44,2
4545
,668
8.6
9.1
18.5
16Fl
orid
a29
3,32
730
4,27
332
2,82
234
6,21
536
4,25
910
.112
.824
.25
Geo
rgia
167,
072
172,
639
183,
067
194,
315
204,
327
9.6
11.6
22.3
9H
awai
i23
,760
24,7
5325
,911
27,4
5528
,671
9.1
10.7
20.7
11Id
aho
21,4
6322
,475
23,7
6825
,003
26,4
2110
.711
.223
.16
Illin
ois
287,
520
292,
573
305,
179
320,
627
325,
926
6.1
6.8
13.4
34In
dian
a11
3,01
711
5,79
812
0,02
412
6,04
413
0,02
06.
28.
315
.029
Iow
a57
,861
59,8
7362
,775
65,6
9167
,335
8.5
7.3
16.4
24K
ansa
s52
,268
53,6
0755
,958
57,9
0758
,383
7.1
4.3
11.7
41K
entu
cky
68,6
9270
,161
73,2
6277
,074
79,5
316.
78.
615
.827
Loui
sian
a78
,716
81,1
7184
,992
86,3
8884
,735
8.0
-0.3
7.6
48M
aine
21,4
2621
,976
22,7
8323
,734
24,4
896.
37.
514
.331
Mar
ylan
d12
2,14
812
3,58
612
7,74
113
3,95
313
7,95
24.
68.
012
.935
Mas
sach
uset
ts19
3,73
320
0,04
421
1,96
722
5,05
423
2,04
09.
49.
519
.814
Michi
gan
175,
830
181,
351
190,
005
199,
827
207,
375
8.1
9.1
17.9
18M
inne
sota
127,
560
132,
003
137,
888
145,
477
149,
647
8.1
8.5
17.3
21M
ississip
pi35
,511
36,4
9137
,457
38,4
8539
,380
5.5
5.1
10.9
43
(1=l
arge
st p
erce
nt in
crea
se,
2012
-201
6)

Workers’ Compensation: Benefits, Costs, and Coverage • 15
Misso
uri
102,
953
105,
206
109,
409
114,
664
117,
818
6.3
7.7
14.4
30M
onta
na15
,008
15,4
9216
,159
16,9
6917
,472
7.7
8.1
16.4
23N
ebra
ska
34,6
8735
,821
37,4
5039
,527
40,6
138.
08.
417
.122
Nev
ada
48,1
6049
,922
52,4
9155
,562
59,0
639.
012
.522
.67
New
Ham
pshi
re29
,005
29,7
6231
,506
32,8
8934
,090
8.6
8.2
17.5
20N
ew Je
rsey
217,
495
223,
167
229,
085
238,
725
244,
360
5.3
6.7
12.4
39N
ew M
exico
28,8
2829
,316
30,4
6631
,291
31,3
125.
72.
88.
645
New
Yor
k52
7,11
153
8,41
857
2,92
359
8,41
861
1,62
68.
76.
816
.025
Nor
th C
arol
ina
160,
075
165,
770
173,
996
184,
809
192,
257
8.7
10.5
20.1
12N
orth
Dak
ota
18,1
8719
,693
21,8
8421
,396
19,6
1120
.3-1
0.4
7.8
47O
hio
217,
773
222,
973
232,
924
242,
199
247,
780
7.0
6.4
13.8
32O
klah
oma
57,4
6660
,015
62,9
4364
,185
62,7
339.
5-0
.39.
244
Ore
gon
70,7
0773
,690
78,3
9384
,407
89,0
2810
.913
.625
.93
Penn
sylv
ania
262,
207
267,
201
277,
707
289,
036
292,
931
5.9
5.5
11.7
40Rho
de Is
land
20,2
5420
,964
22,0
0422
,940
23,4
748.
66.
715
.926
Sout
h C
arol
ina
66,7
3669
,139
72,8
6077
,269
80,8
279.
210
.921
.110
Sout
h D
akot
a13
,820
14,2
6315
,065
15,8
3816
,401
9.0
8.9
18.7
15Te
nnes
see
108,
865
111,
158
116,
327
123,
676
128,
549
6.9
10.5
18.1
17Te
xas
425,
760
441,
226
470,
775
498,
207
511,
121
10.6
8.6
20.0
13U
tah
47,7
9550
,081
53,0
3956
,871
60,2
2711
.013
.626
.02
Ver
mon
t11
,739
12,1
3312
,533
12,9
8313
,248
6.8
5.7
12.9
36V
irgi
nia
168,
708
171,
116
175,
107
183,
411
188,
024
3.8
7.4
11.4
42W
ashi
ngto
n14
5,24
615
1,87
016
2,25
417
1,47
318
4,15
011
.713
.526
.81
Wes
t Virgi
nia
26,1
1426
,218
26,7
4126
,888
26,3
262.
4-1
.60.
850
Wisco
nsin
108,
688
111,
983
116,
352
122,
023
125,
270
7.1
7.7
15.3
28W
yom
ing
11,9
6412
,143
12,7
8112
,632
11,7
526.
8-8
.1-1
.851
Tota
l Non
-Fed
eral
$6,1
19,3
40$6
,298
,567
$6,6
24,0
45$6
,983
,122
$7,2
03,2
938.
28.
717
.7Fe
dera
l Em
ploy
ees
$206
,823
$202
,017
$206
,877
$214
,726
$218
,918
0.0
5.8
5.8
TO
TAL
$6,3
26,1
63$6
,500
,585
$6,8
30,9
22$7
,197
,848
$7,4
22,2
108.
08.
717
.3
Sour
ce:N
atio
nal A
cade
my
of S
ocia
l Ins
uran
ce estim
ates
.

16 NATIONAL ACADEMY OF SOCIAL INSURANCE
State Estimates of Covered Employment and Wages Between 2012 and 2016, all states except WestVirginia and Wyoming experienced an increase inthe number of jobs covered by workers’ compensa-tion (Table 3). The three states with the largestpercentage gains in covered employment were Utah(14.6%), Florida (13.9%), and Nevada (13.5%).North Dakota, the state with the largest percentagegains in covered employment between 2012 and2014, experienced the largest percentage decline incovered employment between 2014-2016 (-6.5%),so its overall growth in covered employment over the period was a modest 1.3 percent.
All states except Wyoming and West Virginia experienced substantial increases in covered payrollbetween 2012 and 2016 (Table 4). Forty-three jurisdictions experienced increases in covered payrollof 10 percent or more; 13 states experienced increases of more than 20 percent. Three westernstates recorded the largest increases in covered payrollover the period: Washington (26.8%), Utah (26%),and Oregon (25.9%). States with the smallest gainsin covered payroll between 2012 and 2016 wereLouisiana (7.6%), Alaska (6.2%), West Virginia(0.8%), and Wyoming (-1.8%). In each of thesestates, covered payroll declined in recent years (2014-16).
Workers’ CompensationBenefits Paid Data Sources and Methods for Estimating Benefits Paid This section describes the primary data sources thatwe use to estimate workers’ compensation benefitsnationally and for each state. A detailed, state-by-state explanation of how the benefit estimates in thisreport are produced is provided in Sources andMethods: A Companion to Workers’ Compensation:
Benefits, Costs, and Coverage 2016, and is available onthe Academy’s website (www.nasi.org).
The Academy’s estimates of workers’ compensationbenefits paid are based on three main data sources:1) data from a questionnaire on workers’ compensa-tion benefits and costs, distributed annually by theAcademy to state agencies overseeing workers’ compensation programs; 2) data purchased fromA.M. Best, a private company that specializes in collecting insurance data and rating insurance companies; and 3) data from the National Councilon Compensation Insurance (NCCI). The data fromstate agencies, A.M. Best, and NCCI allow us topiece together estimates of workers’ compensationbenefits paid by private insurance carriers, statefunds, and self-insured employers. The U.S.Department of Labor provides data on benefits paidthrough federal programs.
Academy questionnaire. The primary source of dataon benefits paid to injured workers is the response ofstate workers’ compensation agencies to theAcademy’s annual questionnaire. The questionnaireis designed to collect information on amounts ofmedical and cash benefits paid in a calendar year, aswell as benefits paid through special funds, secondinjury funds, and guaranty funds. This year, wereceived responses from at least one agency or organization in 39 out of 51 jurisdictions.
States vary in their ability to provide complete dataon benefits paid. One of the most common report-ing problems relates to benefits paid by self-insuredemployers. If a state does not report self-insured benefits, benefits are imputed using one of twomethods. The first method utilizes historical self-insured benefits paid in the particular state, ifavailable, along with information on the ratio of self-insured benefit payments to total benefits paid instates where the data are available to control fortrends in self-insured benefit payments across time.If historical data are not available for the specificstate we are estimating, we rely on a second methodthat utilizes covered payroll in the state we are estimating and the ratio of self-insured benefits topayroll in states where the data are available.
Among the states that did not directly reply to thesurvey, some published annual reports from whichwe could obtain the workers’ compensation informa-tion normally included in the questionnaire. For
Between 2012 and 2016, most statesexperienced increases in workers’
compensation covered employment,and even greater percentage increases in covered payroll.

Workers’ Compensation: Benefits, Costs, and Coverage • 17
some states, we obtained information on benefitspaid through special funds, second injury funds, orguaranty funds from data on the websites of the stateworkers’ compensation agency.
A.M. Best data. The A.M. Best data supplement thestate survey data in cases where the survey data areincomplete, missing, or determined to be incorrect.The A.M. Best data used for this report provideinformation on benefits paid in each state for 2012through 2016 (A.M. Best, 2018). The data includeinformation for all private carriers in every state andfor 17 of the 23 state funds. The A.M. Best data donot include information about benefits paid by theother six state funds, by self-insured employers, byemployers under deductible policies, or by specialfunds.26
NCCI data. NCCI is the primary source of data onmedical benefits in the 38 states in which it islicensed (NCCI, 2018). In states where NCCI dataare not available, estimates of medical benefits arebased on reports from the states. In cases where statedata is incomplete and NCCI is licensed, NCCI isalso a source for data on reimbursements paidthrough deductible policies; and amounts of coveredpayroll for employers insured by private insurers or acompetitive state fund.
Estimating deductibles. The availability ofdeductible policies varies by state.27 Among thestates that allow deductible policies, some can pro-vide us with complete information on deductiblepayments, while most cannot. For states that provideinformation on deductibles, we rely on the surveydata alone, or together with data from AM Best, toestimate amounts paid for deductibles. For statesthat do not include deductibles in the survey, we relyon NCCI data on manual equivalent premiums,together with data from AM Best to estimatedeductible payments. See Sources and Methods 2016on the Academy’s website for a detailed descriptionof the methods used to estimate deductibles.
Benefits incurred. The Academy’s estimates ofworkers’ compensation benefits in this report reflectamounts paid for work-related injuries and illnessesin a calendar year regardless of when those injuriesoccurred. This measure of benefits is commonly usedin reporting data on social insurance programs, private employee benefits, and other income securityprograms.
A different measure, accident year incurred losses (oraccident year incurred benefits) is the commonreporting measure for private workers’ compensationinsurers and some state funds. Incurred benefitsmeasure the total expected benefits associated withinjuries that occur in a particular year, regardless ofwhether the benefits are paid in that year or futureyears. The two measures, accident year benefits paidand accident year benefits incurred, reveal importantbut different information. For a discussion of the relative merits of each measure, refer to theAddendum, Benefits Paid vs. Benefits Incurred.
National Estimates of Benefits Paid Total benefits paid. Table 5 shows workers’ compensation benefits paid by each type of insurer(private insurer, state fund, self-insured, federal government) from 1996 to 2016. Altogether, work-ers’ compensation insurance paid slightly less than$62 billion in benefits in 2016, a 0.2 percentdecrease from the total paid in 2015. Private carrierswere the largest single payer category, followed byself-insured employers, state funds, and the federalgovernment.
26 A. M. Best does not provide data on the four exclusive state funds (Ohio, North Dakota, Washington, Wyoming), the state fund inSouth Carolina that only provides benefits to government workers, and the state fund in West Virginia that discontinued in 2009,but was still paying benefits on claims in 2016.
27 Deductible policies are not allowed in the four states with exclusive state funds (Ohio, North Dakota, Washington, Wyoming) or inWisconsin. Deductible policies are not allowed in the competitive state funds in five states (California, New York, Oregon, Pennsylvania, Rhode Island).
Workers’ compensation insurancepaid slightly less than $62 billion inbenefits in 2016, a 0.2 percent
decrease from 2015.

18 NATIONAL ACADEMY OF SOCIAL INSURANCE
Table 5Workers' Compensation Benefits Paid by Type of Insurer, 1996-2016
Self-Insured Federal Private Insurers State Funds Employers Government All Insurers
% Change % ChangeTotal from Total from
Total % Total % Total % Total % Benefits Prior Medical Prior %Year (millions) Share (millions) Share (millions) Share (millions) Share (millions) Year (millions) Year Medical
1996 21,024 50.1 8,042 19.2 9,828 23.4 3,066 7.3 41,960 -0.4 16,739 0.0 39.9
1997 21,676 51.6 7,157 17.1 10,357 24.7 2,780 6.6 41,971 0.0 17,397 3.9 41.5
1998 23,579 53.6 7,187 16.3 10,354 23.5 2,868 6.5 43,987 4.8 18,622 7.0 42.3
1999 26,383 57.0 7,083 15.3 9,985 21.6 2,862 6.2 46,313 5.3 20,055 7.7 43.3
2000 26,874 56.3 7,388 15.5 10,481 22.0 2,957 6.2 47,699 3.0 20,933 4.4 43.9
2001 27,905 54.9 8,013 15.8 11,839 23.3 3,069 6.0 50,827 6.6 23,137 10.5 45.5
2002 28,085 53.7 9,139 17.5 11,920 22.8 3,154 6.0 52,297 2.9 24,203 4.6 46.3
2003 28,395 51.9 10,442 19.1 12,717 23.2 3,185 5.8 54,739 4.7 25,733 6.3 47.0
2004 28,632 51.0 11,146 19.9 13,115 23.4 3,256 5.8 56,149 2.6 26,079 1.3 46.4
2005 29,039 50.9 11,060 19.4 13,710 24.0 3,258 5.7 57,067 1.6 26,361 1.1 46.2
2006 27,946 50.9 10,555 19.2 13,125 23.9 3,270 6.0 54,896 -3.8 26,206 -0.6 47.7
2007 29,410 52.2 10,153 18.0 13,482 23.9 3,340 5.9 56,385 2.7 27,105 3.4 48.1
2008 30,725 52.3 10,347 17.6 14,255 24.3 3,424 5.8 58,750 4.2 28,987 6.9 49.3
2009 30,909 52.9 9,997 17.1 13,987 23.9 3,543 6.1 58,435 -0.5 28,157 -2.9 48.2
2010 31,090 53.2 9,809 16.8 13,894 23.8 3,672 6.3 58,465 0.1 28,715 2.0 49.1
2011 33,014 53.7 9,837 16.0 14,805 24.1 3,777 6.1 61,433 5.1 30,805 7.3 50.1
2012 33,912 54.1 9,978 15.9 14,965 23.9 3,776 6.0 62,630 1.9 31,266 1.5 49.9
2013 34,986 55.3 9,558 15.1 14,981 23.7 3,693 5.8 63,218 0.9 31,950 2.2 50.5
2014 34,797 55.4 9,279 14.8 15,108 24.0 3,681 5.9 62,866 -0.6 31,963 0.0 50.8
2015 34,266 55.3 9,065 14.6 14,981 24.2 3,706 6.0 62,018 -1.3 31,211 -2.4 50.3
2016 34,404 55.6 8,945 14.4 14,966 24.2 3,603 5.8 61,918 -0.2 31,122 -0.3 50.3
Notes: Benefits are calendar-year payments to injured workers and to providers of their medical care, including benefits paid by employers through deductible policies. Federal benefits include benefits paid under the Federal Employees’ Compensation Act and employer-financed benefits paid through the Federal BlackLung Disability Trust Fund. In years before 1997, federal benefits also include the part of the black lung program financed by federal funds. In 1997–2016, federal benefits include a portion of employer-financed benefits under the Longshore and Harbor Workers' Compensation Act. See Appendix B for more information about federal programs.
Source: National Academy of Social Insurance estimates based on data received from state agencies, the U.S. Department of Labor, A.M. Best, and the National Council on Compensation Insurance.

Workers’ Compensation: Benefits, Costs, and Coverage • 19
Table 6Workers' Compensation Employer-Paid Benefits Under Deductible Provisions, 1996-2016
Deductibles (millions $) Deductibles as a % ofYear Total Private Insured State Fund Insured Total Benefits
1996 3,716 3,470 246 8.9
1997 3,994 3,760 234 9.5
1998 4,644 4,399 245 10.6
1999 5,684 5,452 232 12.3
2000 6,201 5,931 270 13.0
2001 6,388 6,085 303 12.6
2002 6,922 6,511 411 13.2
2003 8,020 7,547 474 14.7
2004 7,645 7,134 510 13.6
2005 7,798 7,290 508 13.7
2006 7,575 7,052 524 13.8
2007 8,217 7,684 533 14.6
2008 8,603 8,095 508 14.6
2009 8,582 8,118 464 14.7
2010 8,904 8,466 438 15.2
2011 9,248 8,822 426 15.1
2012 9,940 9,494 446 15.9
2013 10,188 9,844 345 16.1
2014 10,328 9,994 334 16.4
2015 10,258 9,905 353 16.5
2016 10,313 9,985 327 16.7
Notes: For states that provide information on deductible payments, we rely on the survey data alone, or together with data fromAM Best, to estimate amounts paid for deductibles. For states that do not include deductibles in the survey, we rely on NCCIdata on manual equivalent premiums together with data from AM Best to estimate deductible payments. (See the Sources andMethods 2016 available at www.nasi.org for more details).
Source: National Academy of Social Insurance estimates.
Benefits by type of insurer. In 2016, private insurers paid $34.4 billion in workers’ compensationbenefits (55.6% of total benefits paid), self-insuredemployers paid $15.0 billion (24.2%), state fundspaid $8.9 billion (14.4%), and the federal government paid $3.6 billion (5.8%) (Table 5).
Over the last two decades, the workers’ compensa-tion insurance market has shifted away fromcoverage by state funds in favor of coverage by private insurers. As shown in Table 5, private insur-ance carriers increased their share of benefits paid byfive percentage points between 1996 and 2016,

20 NATIONAL ACADEMY OF SOCIAL INSURANCE
while the share of benefits paid by state fundsdeclined by five percentage points.28
Over the same period, there has been relatively littlechange in the share of workers’ compensation bene-fits paid by self-insured employers or the federalgovernment, and over the last 10 years, their shareshave stabilized. Self-insured employers accounted for24 percent of total benefits paid, and the federal government for 6 percent, in every year since 2005.
Deductibles. Employers who have workers’ compen-sation policies with deductibles must reimburse theirinsurer for benefits paid up to the deductibleamount. Hence, part of the benefit payments attributed to private insurers and state funds in Table5 are actually paid by employers.
In 2016, employers paid $10.3 billion indeductibles, or 16.7 percent of total benefits paid(Table 6). The vast majority of benefits paid underdeductible provisions are by employers coveredthrough private insurers (96.8% of total deductiblespaid in 2016), as opposed to deductibles paid byemployers covered through a state fund (3.2% oftotal). The share of benefits paid by employers underdeductible provisions increased by 55 percentbetween 1996 and 2006, and by another 21 percentbetween 2006 and 2016.
Employers who have policies with deductibles are, ineffect, self-insured up to the amount of the deduc-tible.29 If we allocate the amount of benefits paidunder deductibles to self-insurance (instead of to pri-vate carriers as in Table 5) we obtain a more accuratepicture of the share of the workers’ compensation
market for which employers are assuming primaryfinancial risk. Table 7 shows the share of workers’compensation benefits directly paid by employersfrom 1996 to 2016. For 2016, the results indicatethat employers paid 40.8 percent of total benefits (asopposed to 24.2% in Table 5), while private insurerspaid 39.4 percent (as opposed to 55.6%). Theremaining 20 percent of benefits were paid by statefunds (14%) and the federal government (6%).
Medical benefits paid. In 2016, workers’ compensa-tion insurers paid $31.1 billion in medical benefits, a0.5 percent decrease from 2012 (Table 8 and Table10). The small five-year change reflects the cumula-tive effect of a 2.2 percent increase in medicalbenefits from 2012-2014, followed by a 2.6 percentdecrease between 2014 and 2016.
Historically, medical benefits have been a smallershare of workers’ compensation benefits than cashbenefits. Since 2008, however, the national experience has been for medical and cash benefits toaccount for almost equal shares of total benefits (asshown in Figure 3). Between 2012 and 2014, medical benefits increased (Table 5) while cash benefits decreased (Table 11), so the share of medicalbenefits increased (from 49.9% to 50.8%). Between2014 and 2016, both medical and cash benefitsdeclined, but medical benefits decreased by a larger percentage, so the share of medical benefits decreased(from 50.8% to 50.3%). Across the five-year period,both medical and cash benefits decreased, but cashbenefits decreased by a greater percentage, so theshare of medical benefits rose from 49.9 to 50.3 percent (Table 5).
State Estimates of Benefits Paid in 2016Benefits by type of insurer. Table 8 shows the sharesof workers’ compensation benefits paid by each typeof insurer in each state in 2016. The shares vary con-siderably across states because: not all states have astate fund and, where state funds exist, their legal status varies; the incentives to self-insure vary acrossstates; and two states do not allow self-insurance.
Over the last two decades, the workers’ compensation insurancemarket has shifted away from
coverage by state funds in favor ofcoverage by private insurers.
28 The decline in relative importance of state funds in recent years largely reflects the decline in coverage of the California State Fund(which accounted for 50 percent of the California’s workers’ compensation insurance market in 2004 but only 10 percent more re-cently) and, to a lesser extent, the dissolution of funds in West Virginia (in 2009) and Arizona (in 2012).
29 Deductible policies may be written in a variety of ways and the maximum amount may represent a specified number of injuries andthe corresponding benefits paid, or a specified amount of aggregate benefits paid.

Workers’ Compensation: Benefits, Costs, and Coverage • 21
Table 7Percentage Distribution of Workers' Compensation Benefit Payments by Type of Coverage: With and Without Deductibles, 1996-2016
Total BenefitsPercent of Total Benefits
Private Insured State Fund Insured
Employer Insurer Employer InsurerYear (millions) Paid Paid after Paid Paid After Self- Total
Total Deductibles Deductibles Total Deductibles Deductibles Insured Federal Employer Paid
(1) (2) (3) (4) (5) (6) (7) (8) (9)=(2)+(5)+(7)
1996 41,960 50.1 8.3 41.8 19.2 0.6 18.6 23.4 7.3 32.3
1997 41,971 51.6 9.0 42.7 17.1 0.6 16.5 24.7 6.6 34.2
1998 43,987 53.6 10.0 43.6 16.3 0.6 15.8 23.5 6.5 34.1
1999 46,313 57.0 11.8 45.2 15.3 0.5 14.8 21.6 6.2 33.8
2000 47,699 56.3 12.4 43.9 15.5 0.6 14.9 22.0 6.2 35.0
2001 50,827 54.9 12.0 42.9 15.8 0.6 15.2 23.3 6.0 35.9
2002 52,297 53.7 12.4 41.3 17.5 0.8 16.7 22.8 6.0 36.0
2003 54,739 51.9 13.8 38.1 19.1 0.9 18.2 23.2 5.8 37.9
2004 56,149 51.0 12.7 38.3 19.9 0.9 18.9 23.4 5.8 37.0
2005 57,067 50.9 12.8 38.1 19.4 0.9 18.5 24.0 5.7 37.7
2006 54,896 50.9 12.8 38.1 19.2 1.0 18.3 23.9 6.0 37.7
2007 56,385 52.2 13.6 38.5 18.0 0.9 17.1 23.9 5.9 38.5
2008 58,750 52.3 13.8 38.5 17.6 0.9 16.7 24.3 5.8 38.9
2009 58,435 52.9 13.9 39.0 17.1 0.8 16.3 23.9 6.1 38.6
2010 58,465 53.2 14.5 38.7 16.8 0.7 16.0 23.8 6.3 39.0
2011 61,433 53.7 14.4 39.4 16.0 0.7 15.3 24.1 6.1 39.2
2012 62,630 54.1 15.2 39.0 15.9 0.7 15.2 23.9 6.0 39.8
2013 63,218 55.3 15.6 39.8 15.1 0.5 14.6 23.7 5.8 39.8
2014 62,866 55.4 15.9 39.5 14.8 0.5 14.2 24.0 5.9 40.5
2015 62,018 55.3 16.0 39.3 14.6 0.6 14.0 24.2 6.0 40.7
2016 61,918 55.6 16.1 39.4 14.4 0.5 13.9 24.2 5.8 40.8
Notes: Shaded columns sum to 100%. Total employer paid benefits include employer-paid deductibles under private carriers and statefunds, as well as benefits paid by self-insured employers.
Source: National Academy of Social Insurance estimates based on Tables 5 and 6.

22 NATIONAL ACADEMY OF SOCIAL INSURANCE
Table 8
Wor
kers' C
ompe
nsation Ben
efits Pa
id by Ty
pe of I
nsur
er and
State, 2
016
Priv
ate In
sure
dSt
ate Fu
nd In
sure
dSe
lf-In
sure
da
Tota
lM
edical
Ran
king
Ben
efits
Perc
ent
Ben
efits
Perc
ent
Ben
efits
Perc
ent
Ben
efits
Pai
dBen
efits
Pai
d Pe
rcen
t(1
=lar
gest p
er-
Stat
e(tho
usan
ds)
Shar
e(tho
usan
ds)
Shar
e(tho
usan
ds)
Shar
e(tho
usan
ds)b
(tho
usan
ds)c
Med
ical
cent
med
ical)
Alaba
ma
$298
,745
49.7
$302
,539
50.3
$601
,283
$420
,297
69.9
3
Alask
a16
7,84
273
.759
,788
26.3
227,
630
149,
781
65.8
10
Arizo
na59
0,18
578
.416
2,26
721
.675
2,45
250
9,41
067
.76
Ark
ansa
s14
0,51
367
.866
,817
32.2
207,
330
133,
313
64.3
12
Califo
rnia
7,59
1,76
362
.595
2,79
17.
83,
594,
891
29.6
12,1
39,4
456,
721,
152
55.4
23
Col
orad
o23
9,73
029
.938
9,03
948
.617
2,37
921
.580
1,14
844
3,03
555
.324
Con
nect
icut
653,
296
72.8
243,
969
27.2
897,
265
396,
591
44.2
45
Delaw
are
173,
119
77.0
51,8
1323
.022
4,93
212
3,03
854
.725
District o
f Col
umbi
a83
,610
69.9
36,0
3430
.111
9,64
542
,474
35.5
47
Flor
ida
2,25
5,45
171
.091
9,63
329
.03,
175,
084
2,14
9,53
267
.76
Geo
rgia
1,01
1,00
173
.536
4,28
926
.51,
375,
290
720,
652
52.4
32
Haw
aii
142,
127
46.4
48,0
4915
.711
5,88
137
.930
6,05
814
0,78
646
.042
Idah
o85
,557
31.9
172,
459
64.4
9,98
33.
726
8,00
017
0,98
463
.816
Illin
ois
1,77
7,42
275
.557
6,69
724
.52,
354,
119
1,05
9,35
445
.044
Indi
ana
501,
144
87.0
75,1
6113
.057
6,30
540
8,02
470
.82
Iow
a51
4,23
477
.414
9,83
622
.666
4,07
035
1,95
753
.030
Kan
sas
320,
210
76.1
100,
531
23.9
420,
741
270,
116
64.2
13
Ken
tuck
y32
8,77
650
.412
2,59
718
.820
1,44
730
.965
2,82
035
3,82
854
.226
Loui
sian
a45
8,54
457
.712
3,21
115
.521
3,28
526
.879
5,04
044
4,42
855
.922
Mai
ne15
9,16
866
.181
,612
33.9
240,
780
115,
334
47.9
38
Mar
ylan
d44
2,71
948
.718
6,55
820
.527
8,90
230
.790
8,18
042
3,21
246
.640
Mas
sach
uset
ts85
1,29
474
.329
3,92
225
.71,
145,
216
383,
981
33.5
49
Michi
gan
623,
342
65.3
331,
969
34.7
955,
311
466,
097
48.8
36
Min
neso
ta77
0,43
774
.925
8,71
225
.11,
029,
149
557,
701
54.2
27
Mississip
pi22
5,60
273
.880
,089
26.2
305,
690
177,
300
58.0
18
Misso
uri
635,
297
62.6
143,
957
14.2
236,
269
23.3
1,01
5,52
357
7,83
256
.921
Mon
tana
82,8
5431
.713
6,12
552
.142
,126
16.1
261,
105
173,
635
66.5
8
Neb
rask
a24
9,85
579
.763
,676
20.3
313,
531
200,
973
64.1
14
Nev
ada
243,
008
68.7
110,
536
31.3
353,
544
188,
793
53.4
29
New
Ham
pshi
re14
6,00
471
.059
,659
29.0
205,
663
136,
766
66.5
8
New
Jersey
1,82
0,78
577
.353
5,75
122
.72,
356,
537
1,19
8,33
750
.934
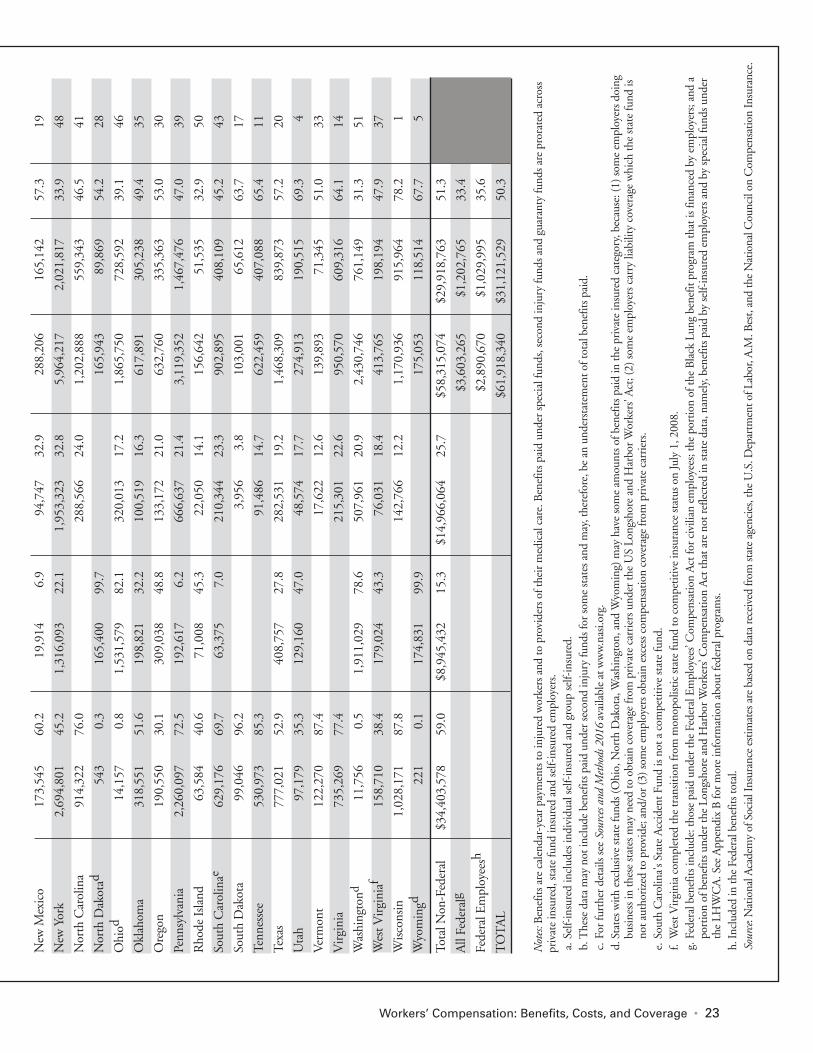
Workers’ Compensation: Benefits, Costs, and Coverage • 23
New
Mex
ico
173,
545
60.2
19,9
146.
994
,747
32.9
288,
206
165,
142
57.3
19
New
Yor
k2,
694,
801
45.2
1,31
6,09
322
.11,
953,
323
32.8
5,96
4,21
72,
021,
817
33.9
48
Nor
th C
arol
ina
914,
322
76.0
288,
566
24.0
1,20
2,88
855
9,34
346
.541
Nor
th D
akot
ad54
30.
316
5,40
099
.716
5,94
389
,869
54.2
28
Ohi
od14
,157
0.8
1,53
1,57
982
.132
0,01
317
.21,
865,
750
728,
592
39.1
46
Okl
ahom
a31
8,55
151
.619
8,82
132
.210
0,51
916
.361
7,89
130
5,23
849
.435
Ore
gon
190,
550
30.1
309,
038
48.8
133,
172
21.0
632,
760
335,
363
53.0
30
Penn
sylv
ania
2,26
0,09
772
.519
2,61
76.
266
6,63
721
.43,
119,
352
1,46
7,47
647
.039
Rho
de Is
land
63,5
8440
.671
,008
45.3
22,0
5014
.115
6,64
251
,535
32.9
50
Sout
h C
arol
inae
629,
176
69.7
63,3
757.
021
0,34
423
.390
2,89
540
8,10
945
.243
Sout
h D
akot
a99
,046
96.2
3,95
63.
810
3,00
165
,612
63.7
17
Tenn
esse
e53
0,97
385
.391
,486
14.7
622,
459
407,
088
65.4
11
Texa
s77
7,02
152
.940
8,75
727
.828
2,53
119
.21,
468,
309
839,
873
57.2
20
Uta
h97
,179
35.3
129,
160
47.0
48,5
7417
.727
4,91
319
0,51
569
.34
Ver
mon
t12
2,27
087
.417
,622
12.6
139,
893
71,3
4551
.033
Virgi
nia
735,
269
77.4
215,
301
22.6
950,
570
609,
316
64.1
14
Was
hing
tond
11,7
560.
51,
911,
029
78.6
507,
961
20.9
2,43
0,74
676
1,14
931
.351
Wes
t Virgi
niaf
158,
710
38.4
179,
024
43.3
76,0
3118
.441
3,76
519
8,19
447
.937
Wisco
nsin
1,02
8,17
187
.814
2,76
612
.21,
170,
936
915,
964
78.2
1
Wyo
min
gd22
10.
117
4,83
199
.917
5,05
311
8,51
467
.75
Tota
l Non
-Fed
eral
$34,
403,
578
59.0
$8,9
45,4
3215
.3$1
4,96
6,06
425
.7$5
8,31
5,07
4$2
9,91
8,76
351
.3
All
Fede
ralg
$3,6
03,2
65$1
,202
,765
33.4
Fede
ral E
mpl
oyee
sh$2
,890
,670
$1,0
29,9
9535
.6
TO
TAL
$61,
918,
340
$31,
121,
529
50.3
Notes:B
enef
its are
calen
dar-ye
ar p
aym
ents to
inju
red
wor
kers and
to p
rovi
ders o
f the
ir m
edical car
e. B
enef
its p
aid
unde
r sp
ecia
l fun
ds, s
econ
d in
jury
fund
s and
gua
rant
y fu
nds a
re p
rora
ted
acro
ss
priv
ate in
sure
d, st
ate fu
nd in
sure
d an
d se
lf-in
sure
d em
ploy
ers.
a. S
elf-in
sure
d in
clud
es in
divi
dual se
lf-in
sure
d an
d gr
oup
self-
insu
red.
b.T
hese
dat
a m
ay n
ot in
clud
e be
nefit
s pai
d un
der se
cond
inju
ry fu
nds f
or so
me stat
es and
may
, the
refo
re, b
e an
und
erstat
emen
t of t
otal b
enef
its p
aid.
c. F
or fu
rthe
r de
tails
see So
urces a
nd M
etho
ds 2
016
avai
labl
e at
ww
w.n
asi.o
rg.
d.St
ates
with
exc
lusive
stat
e fu
nds (
Ohi
o, N
orth
Dak
ota, W
ashi
ngto
n, and
Wyo
min
g) m
ay h
ave so
me am
ount
s of b
enef
its p
aid
in th
e pr
ivat
e in
sure
d ca
tego
ry, b
ecau
se: (
1) so
me em
ploy
ers d
oing
busine
ss in
thes
e stat
es m
ay n
eed
to o
btai
n co
vera
ge fr
om p
riva
te car
rier
s und
er th
e U
S Lo
ngsh
ore an
d H
arbo
r Wor
kers' A
ct; (
2) so
me em
ploy
ers c
arry
liab
ility
cov
erag
e w
hich
the stat
e fu
nd is
not a
utho
rize
d to
pro
vide
; and
/or (3
) som
e em
ploy
ers o
btai
n ex
cess com
pens
atio
n co
vera
ge fr
om p
riva
te car
rier
s. e.
Sout
h C
arol
ina's S
tate
Acc
iden
t Fun
d is
not a
com
petit
ive stat
e fu
nd.
f. W
est V
irgi
nia co
mpl
eted
the tran
sitio
n from
mon
opol
istic st
ate fu
nd to
com
petit
ive in
sura
nce stat
us o
n Ju
ly 1
, 200
8.
g.
Fed
eral b
enef
its in
clud
e: th
ose pa
id u
nder
the Fe
dera
l Em
ploy
ees’
Com
pens
atio
n Act
for civi
lian
empl
oyee
s; th
e po
rtio
n of
the Black
Lun
g be
nefit
pro
gram
that
is fi
nanc
ed b
y em
ploy
ers;
and
apo
rtio
n of
ben
efits
und
er th
e Lo
ngsh
ore an
d H
arbo
r Wor
kers’ C
ompe
nsat
ion
Act
that
are
not
refle
cted
in st
ate da
ta, n
amely, b
enef
its p
aid
by se
lf-in
sure
d em
ploy
ers a
nd b
y sp
ecia
l fun
ds u
nder
the LH
WC
A. S
ee A
ppen
dix
B fo
r m
ore in
form
atio
n ab
out f
eder
al p
rogr
ams.
h.In
clud
ed in
the Fe
dera
l ben
efits
tota
l.So
urce
: Nat
iona
l Aca
dem
y of
Soc
ial I
nsur
ance
estim
ates
are
bas
ed o
n da
ta re
ceiv
ed fr
om st
ate ag
encies
, the
U.S
. Dep
artm
ent o
f Lab
or, A
.M. B
est,
and
the N
atio
nal C
ounc
il on
Com
pens
atio
n In
sura
nce.

24 NATIONAL ACADEMY OF SOCIAL INSURANCE
Table 9
Wor
kers' C
ompe
nsation To
tal B
enefits Pa
id and
Five-Ye
ar Percent
Cha
nge by
State, 2
012-20
16
Perc
ent C
hang
eRan
king
Stat
e20
1220
1320
1420
1520
16
2012
-201
420
14-2
016
2012
-201
6
Alaba
ma
$643
,986
$639
,311
$636
,575
$617
,384
$601
,283
-1.2
-5.5
-6.6
35
Alask
a24
7,86
224
9,62
523
2,20
123
5,47
022
7,63
0-6
.3-2
.0-8
.238
Arizo
na71
8,12
271
6,20
673
4,97
573
7,16
575
2,45
22.
32.
44.
814
Ark
ansa
s20
4,99
022
2,69
721
0,19
919
9,31
420
7,33
02.
5-1
.41.
122
Califo
rnia
11,5
36,2
7512
,116
,266
12,0
92,6
7012
,038
,469
12,1
39,4
454.
80.
45.
210
Col
orad
o84
5,66
381
3,20
778
8,69
683
0,59
080
1,14
8-6
.71.
6-5
.332
Con
nect
icut
970,
079
1,01
6,73
998
8,69
998
1,55
289
7,26
51.
9-9
.2-7
.537
Delaw
are
216,
588
240,
313
249,
385
228,
240
224,
932
15.1
-9.8
3.9
17
District o
f Col
umbi
a11
5,74
613
0,97
811
8,25
912
0,37
211
9,64
52.
21.
23.
420
Flor
ida
3,38
1,79
83,
435,
562
3,37
1,10
03,
188,
167
3,17
5,08
4-0
.3-5
.8-6
.134
Geo
rgia
1,44
4,88
21,
384,
625
1,37
8,16
91,
312,
739
1,37
5,29
0-4
.6-0
.2-4
.831
Haw
aii
248,
433
260,
352
270,
720
298,
237
306,
058
9.0
13.1
23.2
1
Idah
o23
9,81
224
8,64
125
4,26
926
2,83
226
8,00
06.
05.
411
.84
Illin
ois
2,67
7,48
52,
637,
292
2,72
2,53
62,
399,
163
2,35
4,11
91.
7-1
3.5
-12.
144
Indi
ana
620,
875
643,
273
590,
493
566,
269
576,
305
-4.9
-2.4
-7.2
36
Iow
a63
3,09
662
8,78
464
0,61
061
7,25
366
4,07
01.
23.
74.
913
Kan
sas
466,
571
435,
493
433,
433
423,
553
420,
741
-7.1
-2.9
-9.8
41
Ken
tuck
y67
0,07
067
0,66
064
4,48
468
4,49
165
2,82
0-3
.81.
3-2
.625
Loui
sian
a81
3,83
980
9,66
178
3,69
977
3,75
079
5,04
0-3
.71.
4-2
.324
Mai
ne25
0,49
325
3,06
025
2,31
923
1,86
124
0,78
00.
7-4
.6-3
.928
Mar
ylan
d99
3,84
297
7,80
998
0,01
196
4,67
090
8,18
0-1
.4-7
.3-8
.639
Mas
sach
uset
ts1,
022,
585
1,11
8,78
51,
127,
075
1,09
6,68
41,
145,
216
10.2
1.6
12.0
3
Michi
gan
1,18
9,48
31,
246,
512
1,10
8,97
81,
077,
947
955,
311
-6.8
-13.
9-1
9.7
49
Min
neso
ta1,
042,
478
1,06
6,02
61,
086,
696
1,03
3,26
81,
029,
149
4.2
-5.3
-1.3
23
Mississip
pi33
6,20
833
2,79
033
6,68
933
1,68
330
5,69
00.
1-9
.2-9
.140
Misso
uri
829,
350
831,
711
917,
459
982,
760
1,01
5,52
310
.610
.722
.42
Mon
tana
250,
397
248,
044
245,
504
252,
854
261,
105
-2.0
6.4
4.3
15
Tota
l Ben
efits
(tho
usan
ds)
(1=l
arge
st p
erce
nt
incr
ease
, 201
2-20
16)
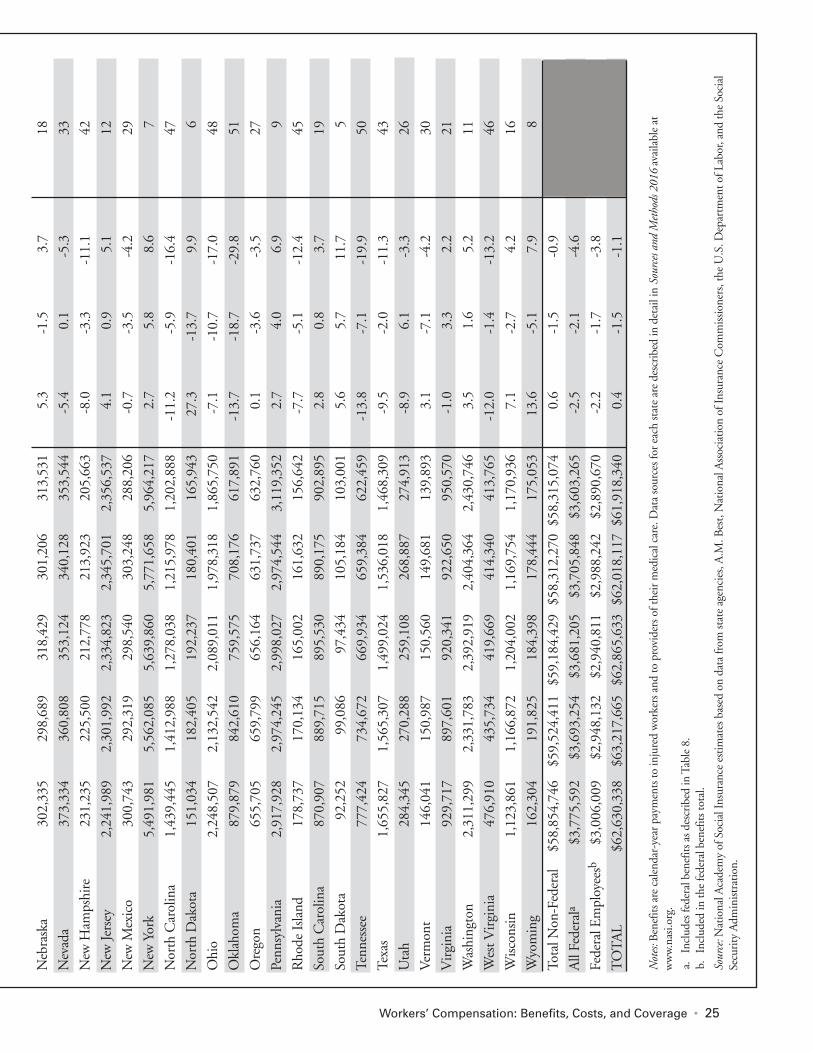
Workers’ Compensation: Benefits, Costs, and Coverage • 25
Neb
rask
a30
2,33
529
8,68
931
8,42
930
1,20
631
3,53
15.
3-1
.53.
718
Nev
ada
373,
334
360,
808
353,
124
340,
128
353,
544
-5.4
0.1
-5.3
33
New
Ham
pshi
re23
1,23
522
5,50
021
2,77
821
3,92
320
5,66
3-8
.0-3
.3-1
1.1
42
New
Jersey
2,24
1,98
92,
301,
992
2,33
4,82
32,
345,
701
2,35
6,53
74.
10.
95.
112
New
Mex
ico
300,
743
292,
319
298,
540
303,
248
288,
206
-0.7
-3.5
-4.2
29
New
Yor
k5,
491,
981
5,56
2,08
55,
639,
860
5,77
1,65
85,
964,
217
2.7
5.8
8.6
7
Nor
th C
arol
ina
1,43
9,44
51,
412,
988
1,27
8,03
81,
215,
978
1,20
2,88
8-1
1.2
-5.9
-16.
447
Nor
th D
akot
a15
1,03
418
2,40
519
2,23
718
0,40
116
5,94
327
.3-1
3.7
9.9
6
Ohi
o2,
248,
507
2,13
2,54
22,
089,
011
1,97
8,31
81,
865,
750
-7.1
-10.
7-1
7.0
48
Okl
ahom
a87
9,87
984
2,61
075
9,57
570
8,17
661
7,89
1-1
3.7
-18.
7-2
9.8
51
Ore
gon
655,
705
659,
799
656,
164
631,
737
632,
760
0.1
-3.6
-3.5
27
Penn
sylv
ania
2,91
7,92
82,
974,
245
2,99
8,02
72,
974,
544
3,11
9,35
22.
74.
06.
99
Rho
de Is
land
178,
737
170,
134
165,
002
161,
632
156,
642
-7.7
-5.1
-12.
445
Sout
h C
arol
ina
870,
907
889,
715
895,
530
890,
175
902,
895
2.8
0.8
3.7
19
Sout
h D
akot
a92
,252
99,0
8697
,434
105,
184
103,
001
5.6
5.7
11.7
5
Tenn
esse
e77
7,42
473
4,67
266
9,93
465
9,38
462
2,45
9-1
3.8
-7.1
-19.
950
Texa
s1,
655,
827
1,56
5,30
71,
499,
024
1,53
6,01
81,
468,
309
-9.5
-2.0
-11.
343
Uta
h28
4,34
527
0,28
825
9,10
826
8,88
727
4,91
3-8
.96.
1-3
.326
Ver
mon
t14
6,04
115
0,98
715
0,56
014
9,68
113
9,89
33.
1-7
.1-4
.230
Virgi
nia
929,
717
897,
601
920,
341
922,
650
950,
570
-1.0
3.3
2.2
21
Was
hing
ton
2,31
1,29
92,
331,
783
2,39
2,91
92,
404,
364
2,43
0,74
63.
51.
65.
211
Wes
t Virgi
nia
476,
910
435,
734
419,
669
414,
340
413,
765
-12.
0-1
.4-1
3.2
46
Wisco
nsin
1,12
3,86
11,
166,
872
1,20
4,00
21,
169,
754
1,17
0,93
67.
1-2
.74.
216
Wyo
min
g16
2,30
419
1,82
518
4,39
817
8,44
417
5,05
313
.6-5
.17.
98
Tota
l Non
-Fed
eral
$58,
854,
746
$59,
524,
411
$59,
184,
429
$58,
312,
270
$58,
315,
074
0.6
-1.5
-0.9
All
Fede
rala
$3,7
75,5
92$3
,693
,254
$3,6
81,2
05$3
,705
,848
$3,6
03,2
65-2
.5-2
.1-4
.6
Fede
ral E
mpl
oyee
sb$3
,006
,009
$2,9
48,1
32$2
,940
,811
$2,9
88,2
42$2
,890
,670
-2.2
-1.7
-3.8
TO
TAL
$62,
630,
338
$63,
217,
665
$62,
865,
633
$62,
018,
117
$61,
918,
340
0.4
-1.5
-1.1
Notes:B
enef
its are
calen
dar-ye
ar p
aym
ents to
inju
red
wor
kers and
to p
rovi
ders o
f the
ir m
edical car
e. D
ata so
urce
s for
eac
h stat
e ar
e de
scribe
d in
det
ail i
n So
urces a
nd M
etho
ds 2
016
avai
labl
e at
ww
w.n
asi.o
rg.
a.In
clud
es fe
dera
l ben
efits
as d
escr
ibed
in T
able 8
.b.
In
clud
ed in
the fe
dera
l ben
efits
tota
l.
Sour
ce: N
atio
nal A
cade
my
of S
ocia
l Ins
uran
ce estim
ates
bas
ed o
n da
ta fr
om st
ate ag
encies
, A.M
. Bes
t, N
atio
nal A
ssoc
iatio
n of
Insu
ranc
e C
omm
ission
ers,
the U
.S. D
epar
tmen
t of L
abor
, and
the So
cial
Secu
rity
Adm
inist
ratio
n.

North Dakota and Wyoming have exclusive statefunds and do not allow self-insurance. In 2016, theirstate funds accounted for more than 99 percent oftotal workers’ compensation benefits paid (Table 8).Ohio and Washington have exclusive state funds butallow employers to self-insure. In 2016, their statefunds accounted for approximately 80 percent oftotal benefits paid. Among the 18 other states whichhave a state fund, the share of benefits accounted forby the fund ranged from less than 10 percent(California, New Mexico, Pennsylvania, SouthCarolina) to greater than 50 percent (Idaho,Montana) in 2016.
Among the states which do not have a state fund,private carriers typically accounted for 70 to 80 per-cent of benefits paid in 2016, while self-insuredemployers accounted for 20 to 30 percent. Alabamais an outlier, with self-insured employers accountingfor 50.3 percent of benefits paid in 2016 – by far thehighest of any state. Hawaii has the second highestshare of benefits paid by self-insured employers,accounting for 37.9 percent of total benefits paid in2016. In the other direction, Indiana, South Dakota,Tennessee, Vermont, and Wisconsin are outliers,with private carriers accounting for more than 85percent of benefits paid in these states and self-insured employers less than 15 percent.30
There are several explanations for the tremendousvariation in take-up rates for self-insurance across
states: 1) Large employers are more likely to self-insure, and some states (e.g., Michigan) have adisproportionate share of large employers relative toother states. 2) Financial incentives to self-insurevary across states because of differences in stateworkers’ compensation statutes.31 3) Self-insuranceand private insurance are substitutes. When workers’compensation premium rates are rising in a state,employers tend to shift to self-insurance. When premium rates are declining, employers tend to shiftto private insurance. 4) Measurement error mayaccount for some of the observed variation in theshare of benefits paid by self-insured employers,because our methods for estimating benefits paidunder self-insurance vary across states, depending onresponses to the Academy’s survey.
Medical benefits paid. Table 8 also shows, for eachstate, the amount of medical benefits paid, and medical benefits as a percentage of total benefits. In2016, the share of medical benefits was highest inWisconsin (78.2%), Indiana (70.8%), and Alabama(69.9%); and lowest in Washington (31.3%), RhodeIsland (32.9%), and Massachusetts (33.5%). Themedian share of medical benefits was 54.2 percent,indicating that in the majority of jurisdictions (34 of51), medical benefits exceeded cash benefits in 2016.
26 NATIONAL ACADEMY OF SOCIAL INSURANCE
Take-up rates for self-insurance vary widely across states. Among the 49 jurisdictions that allow
self-insurance, the share of benefitsattributed to self-insured employersranged from less than 4 percent togreater than 50 percent in 2016.
Medical benefits accounted for 51percent of total non-federal workers’compensation benefits paid in 2016.In 2/3 of states, medical benefits
were a larger share of total benefitspaid than were cash benefits for
injured workers.
30 Private carrier workers’ compensation benefit payments occur in states with exclusive state funds for a few possible reasons. First,some policies sold to employers provide multistate coverage whereas the exclusive state fund may be restricted to providing benefitsonly in the state where it operates. Second, the exclusive state fund might not be permitted to offer employers’ liability coverage, fed-eral LHWCA coverage, or excess coverage for authorized self-insurers.
31 Some states, for example, do not collect assessments for special workers’ compensation funds from self-insured employers, thereby in-creasing the incentive to self-insure. Special funds include second injury funds, and funds that pay for certain types of claims, such asclaims from commercial fishermen, coal workers with pneumoconiosis, and others. For a detailed list of the special funds included inthis report, please refer to the Sources and Methods appendix.

State Trends in Benefits PaidTable 9 shows total workers’ compensation benefitspaid in each state in the years 2012 to 2016. Overthe five-year period, benefits decreased in 29 jurisdic-tions, with the largest percentage decreases inOklahoma (-29.8%), Tennessee (-19.9%), andMichigan (-19.7%). Benefits increased in theremaining 22 jurisdictions, with the largest increasesin Hawaii (23.2%) and Missouri (22.4%). No otherstate experienced an increase in benefits of morethan 15 percent.
The within-state totals of workers’ compensationbenefits paid vary from year to year for a number ofreasons. Benefits change as within-state employmentchanges, although much of the impact occurs with alag. Benefits are also affected by changes to a state’slegal system for processing claims, such as changes instatutory rules, legal decisions, administrativeprocesses, or reporting requirements. Other factorsthat may explain within-state changes in benefitsover time include: changes in the number of work-related injuries and illnesses; fluctuations in wagerates; changes in the mix of occupations/industries;changes in the costs and effectiveness of medical care(including changes to the medical fee schedule);changes to the indemnity benefit schedule); differences in the ways stakeholders interact with thesystem over time (e.g., whether or not employees/employers exercise their right to choose a physician);changes in return to work and vocational rehabilita-tion efforts; and changes to coverage requirements(e.g. special exclusions for small employers or agricultural employers).
Table 10 shows trends in medical benefits in eachstate between 2012 and 2016. The national trendwas a slight (-0.5%) decrease in medical benefits overthe period. Among non-federal payers, medical ben-efits paid increased 2.0 percent between 2012 and2014 but the trend reversed and medical benefitsdeclined 2.7 percent between 2014 and 2016. Acrossthe entire time-period, medical benefits fell in 30jurisdictions and total non-federal medical benefitsdeclined 0.8 percent. The states with the largest percentage increases in medical benefits across thefive years reported in the study include: Hawaii(30.3%), Missouri (21.6%), and Wisconsin(17.1%). The states with the largest percentagedecreases in medical benefits include: Oklahoma (-21.3%), Ohio (-18.4%), West Virginia (-17.5%),and Texas (-17.5%).
Table 11 shows trends in cash benefits in each statebetween 2012 and 2016. Nationally, total cash bene-fits decreased by 1.8 percent over the five yearsreported in the study, so it is not surprising that amajority of states (30) experienced a decrease in cashbenefits paid. Across states, however, the change incash benefits varied widely. States with the largestincreases in cash benefits include: South Dakota(30.3%), North Dakota (26.5%) and Missouri(23.6%). States with the largest decreases include:Oklahoma (-36.4%), Michigan (-36.2%), andTennessee (-32.6%).
Benefits Per $100 of Covered PayrollMuch of the interstate variation in benefit paymentsdescribed above can be attributed to different trendsin employment and wages across states, rather thanto structural differences in state workers’ compensa-tion systems. To control for differential changes inemployment and wages over the time period westudy, we construct a standardized measure of benefits (benefits per $100 of covered payroll).Variations in the standardized measure of benefitscapture interstate differences in: (1) the incidence,nature, and severity of work-related injuries and illnesses; (2) the quantity, prices, and effectiveness ofmedical services provided to injured workers; (3) thedollar value of cash benefits (driven by factors suchas the benefit replacement rate, maximum and minimum weekly benefits, the waiting and retroac-tive periods, and the maximum allowable duration ofbenefits); and (4) public and private investments toreduce durations of work absence, as well as vocational rehabilitation efforts to reduce the functional impairment associated with work-relatedinjuries.
The reader is cautioned that the data on standard-ized benefits (benefits paid per $100 of covered
Workers’ Compensation: Benefits, Costs, and Coverage • 27
Nationally, both medical and cash benefits decreased between 2012and 2016, with a larger percentage decrease in cash benefits. However,the experience of individual states
varied widely.

28 NATIONAL ACADEMY OF SOCIAL INSURANCE
Table 10
Wor
kers' C
ompe
nsation M
edical B
enefits Pa
id and
Five-Ye
ar Percent
Cha
nge by
State, 2
012-20
16
Perc
ent C
hang
eRan
king
Stat
e20
1220
1320
1420
15
2016
2012
-201
420
14-2
016
2012
-201
6
Alaba
ma
$434
,691
$439
,846
$437
,327
$421
,673
$420
,297
0.6
-3.9
-3.3
30
Alask
a16
7,80
217
5,23
716
4,63
116
4,82
914
9,78
1-1
.9-9
.0-1
0.7
43
Arizo
na47
1,80
647
1,98
048
7,28
948
8,74
050
9,41
03.
34.
58.
010
Ark
ansa
s13
4,47
414
6,75
813
7,89
012
7,16
313
3,31
32.
5-3
.3-0
.922
Califo
rnia
6,65
6,52
27,
026,
074
6,98
2,25
46,
765,
550
6,72
1,15
24.
9-3
.71.
021
Col
orad
o48
1,18
247
4,09
945
1,13
446
7,62
244
3,03
5-6
.2-1
.8-7
.939
Con
nect
icut
450,
116
460,
583
466,
666
441,
698
396,
591
3.7
-15.
0-1
1.9
46
Delaw
are
130,
169
142,
986
142,
399
131,
466
123,
038
9.4
-13.
6-5
.534
District o
f Col
umbi
a40
,048
47,9
3840
,799
44,0
5642
,474
1.9
4.1
6.1
15
Flor
ida
2,23
8,75
02,
284,
649
2,27
8,86
32,
183,
895
2,14
9,53
21.
8-5
.7-4
.031
Geo
rgia
731,
110
700,
620
682,
193
643,
242
720,
652
-6.7
5.6
-1.4
26
Haw
aii
108,
069
111,
431
121,
553
133,
610
140,
786
12.5
15.8
30.3
1
Idah
o15
5,63
816
1,36
816
1,46
117
0,05
317
0,98
43.
75.
99.
96
Illin
ois
1,17
5,41
61,
186,
782
1,22
7,86
41,
086,
821
1,05
9,35
44.
5-1
3.7
-9.9
41
Indi
ana
455,
723
471,
519
432,
831
397,
521
408,
024
-5.0
-5.7
-10.
542
Iow
a35
7,06
633
7,65
733
6,32
033
0,84
735
1,95
7-5
.84.
6-1
.427
Kan
sas
272,
944
258,
248
268,
295
258,
791
270,
116
-1.7
0.7
-1.0
23
Ken
tuck
y37
2,55
936
6,85
135
8,33
337
9,89
335
3,82
8-3
.8-1
.3-5
.033
Loui
sian
a42
8,89
343
5,59
742
3,19
742
9,43
144
4,42
8-1
.35.
03.
617
Mai
ne11
6,73
012
1,46
912
0,10
411
1,06
111
5,33
42.
9-4
.0-1
.225
Mar
ylan
d45
1,20
445
6,63
745
7,66
544
6,64
242
3,21
21.
4-7
.5-6
.236
Mas
sach
uset
ts35
7,08
937
5,33
437
9,67
637
4,09
138
3,98
16.
31.
17.
513
Michi
gan
422,
455
531,
556
507,
046
536,
562
466,
097
20.0
-8.1
10.3
5
Min
neso
ta56
6,77
659
1,92
959
9,52
355
8,16
855
7,70
15.
8-7
.0-1
.628
Mississip
pi18
9,95
819
8,34
319
8,98
319
7,35
117
7,30
04.
8-1
0.9
-6.7
37
Misso
uri
475,
218
470,
749
522,
034
551,
328
577,
832
9.9
10.7
21.6
2
Mon
tana
157,
249
158,
748
159,
823
169,
159
173,
635
1.6
8.6
10.4
4
Med
ical B
enef
its (t
hous
ands
)(1
=lar
gest p
erce
nt in
crea
se,
2012
-201
6 )

Workers’ Compensation: Benefits, Costs, and Coverage • 29
Neb
rask
a18
5,93
618
3,99
319
8,38
119
1,26
620
0,97
36.
71.
38.
19
Nev
ada
182,
933
181,
847
175,
503
172,
105
188,
793
-4.1
7.6
3.2
19
New
Ham
pshi
re15
3,54
014
6,80
014
2,34
913
7,98
013
6,76
6-7
.3-3
.9-1
0.9
44
New
Jersey
1,15
1,14
91,
171,
198
1,20
8,56
11,
215,
413
1,19
8,33
75.
0-0
.84.
116
New
Mex
ico
175,
934
173,
345
162,
406
173,
458
165,
142
-7.7
1.7
-6.1
35
New
Yor
k1,
877,
169
1,83
9,02
01,
960,
803
1,95
7,31
52,
021,
817
4.5
3.1
7.7
12
Nor
th C
arol
ina
659,
266
648,
562
593,
009
562,
998
559,
343
-10.
1-5
.7-1
5.2
47
Nor
th D
akot
a90
,894
109,
455
110,
983
99,0
3489
,869
22.1
-19.
0-1
.124
Ohi
o89
3,12
188
9,70
981
7,13
777
5,37
472
8,59
2-8
.5-1
0.8
-18.
450
Okl
ahom
a38
8,02
738
0,01
735
3,20
233
6,38
430
5,23
8-9
.0-1
3.6
-21.
351
Ore
gon
361,
294
348,
374
351,
048
337,
979
335,
363
-2.8
-4.5
-7.2
38
Penn
sylv
ania
1,34
9,85
01,
411,
841
1,43
7,70
11,
392,
057
1,46
7,47
66.
52.
18.
77
Rho
de Is
land
56,4
8154
,103
57,5
8648
,813
51,5
352.
0-1
0.5
-8.8
40
Sout
h C
arol
ina
380,
586
411,
938
407,
466
407,
700
408,
109
7.1
0.2
7.2
14
Sout
h D
akot
a63
,561
67,0
8166
,353
70,4
7365
,612
4.4
-1.1
3.2
18
Tenn
esse
e45
7,90
344
0,80
340
8,66
041
3,43
440
7,08
8-1
0.8
-0.4
-11.
145
Texa
s1,
018,
334
965,
795
903,
912
895,
499
839,
873
-11.
2-7
.1-1
7.5
48
Uta
h20
0,46
318
8,93
118
2,41
218
2,84
319
0,51
5-9
.04.
4-5
.032
Ver
mon
t73
,021
73,9
8478
,442
77,8
3471
,345
7.4
-9.0
-2.3
29
Virgi
nia
561,
549
545,
742
567,
850
572,
965
609,
316
1.1
7.3
8.5
8
Was
hing
ton
742,
658
741,
875
762,
486
733,
882
761,
149
2.7
-0.2
2.5
20
Wes
t Virgi
nia
240,
363
227,
889
205,
638
204,
270
198,
194
-14.
4-3
.6-1
7.5
49
Wisco
nsin
781,
897
899,
879
934,
385
903,
160
915,
964
19.5
-2.0
17.1
3
Wyo
min
g11
0,00
813
2,29
113
0,45
211
9,38
311
8,51
418
.6-9
.27.
711
Tota
l Non
-Fed
eral
Med
ical B
enef
its$3
0,15
5,59
2$3
0,83
9,45
8$3
0,76
2,87
8$2
9,99
2,88
3$2
9,91
8,76
32.
0-2
.7-0
.8
All
Fede
rala
$1,1
10,0
74$1
,110
,860
$1,2
00,5
19$1
,217
,995
$1,2
02,7
658.
10.
28.
4
Fede
ral E
mpl
oyee
sb$9
24,6
22$9
23,5
64$1
,011
,450
$1,0
41,3
53$1
,029
,995
9.4
1.8
11.4
TO
TAL
$31,
265,
666
$31,
950,
317
$31,
963,
396
$31,
210,
877
$31,
121,
529
2.2
-2.6
-0.5
Notes:B
enef
its are
pay
men
ts in
the ca
lend
ar y
ear to
inju
red
wor
kers and
to p
rovi
ders o
f the
ir m
edical car
e. D
ata so
urce
for ea
ch st
ate is
desc
ribe
d in
det
ail i
n So
urces a
nd M
etho
ds 2
016
avai
labl
e at
ww
w.n
asi.o
rg.
a.In
clud
es fe
dera
l (m
edical) b
enef
its as d
escr
ibed
in T
able 8
.
b. In
clud
ed in
the fe
dera
l ben
efits
tota
l.
Sour
ce: N
atio
nal A
cade
my
of S
ocia
l Ins
uran
ce estim
ates
are
bas
ed o
n da
ta fr
om st
ate ag
encies
, A.M
. Bes
t, N
atio
nal A
ssoc
iatio
n of
Insu
ranc
e C
omm
ission
ers (
NAIC
), th
e U
.S. D
epar
tmen
t of L
abor
, and
the So
cial S
ecur
ity A
dmin
istrat
ion.
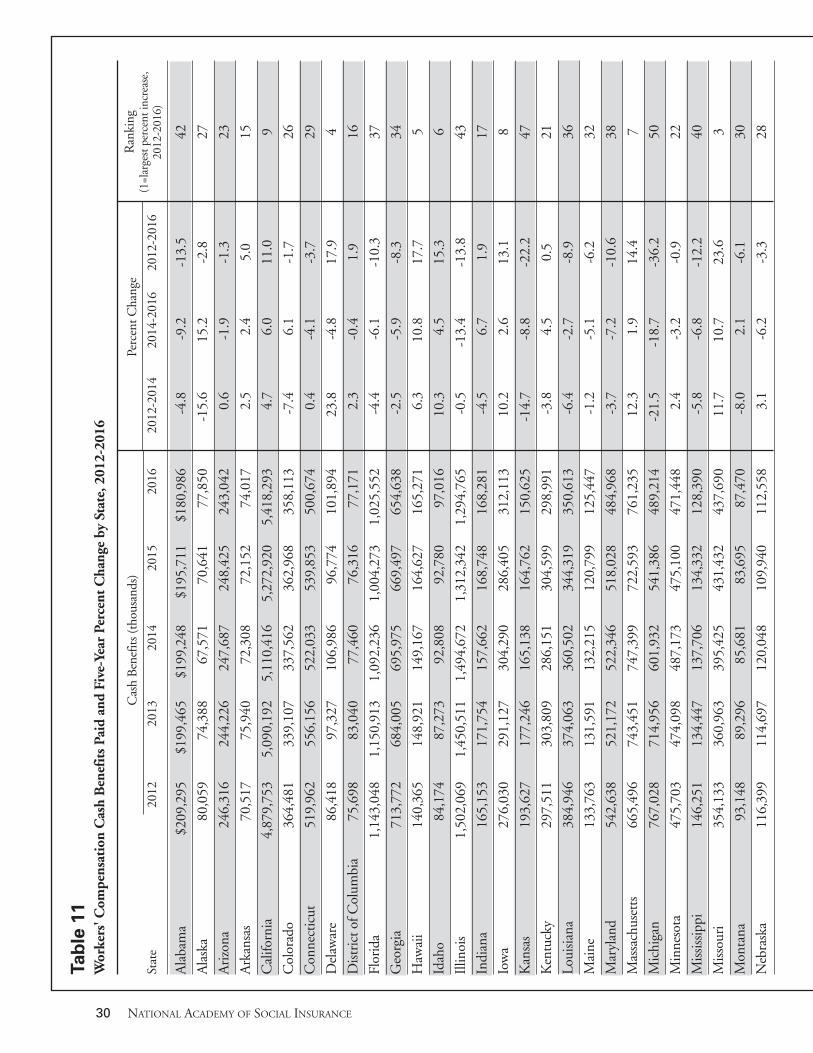
30 NATIONAL ACADEMY OF SOCIAL INSURANCE
Table 11
Wor
kers' C
ompe
nsation Cash Ben
efits Pa
id and
Five-Ye
ar Percent
Cha
nge by
State, 2
012-20
16
Perc
ent C
hang
eRan
king
Stat
e20
1220
1320
1420
1520
1620
12-2
014
2014
-201
620
12-2
016
Alaba
ma
$209
,295
$199
,465
$199
,248
$195
,711
$180
,986
-4.8
-9.2
-13.
542
Alask
a80
,059
74,3
8867
,571
70,6
4177
,850
-15.
615
.2-2
.827
Arizo
na24
6,31
624
4,22
624
7,68
724
8,42
524
3,04
20.
6-1
.9-1
.323
Ark
ansa
s70
,517
75,9
4072
,308
72,1
5274
,017
2.5
2.4
5.0
15
Califo
rnia
4,87
9,75
35,
090,
192
5,11
0,41
65,
272,
920
5,41
8,29
34.
76.
011
.09
Col
orad
o36
4,48
133
9,10
733
7,56
236
2,96
835
8,11
3-7
.46.
1-1
.726
Con
nect
icut
519,
962
556,
156
522,
033
539,
853
500,
674
0.4
-4.1
-3.7
29
Delaw
are
86,4
1897
,327
106,
986
96,7
7410
1,89
423
.8-4
.817
.94
District o
f Col
umbi
a75
,698
83,0
4077
,460
76,3
1677
,171
2.3
-0.4
1.9
16
Flor
ida
1,14
3,04
81,
150,
913
1,09
2,23
61,
004,
273
1,02
5,55
2-4
.4-6
.1-1
0.3
37
Geo
rgia
713,
772
684,
005
695,
975
669,
497
654,
638
-2.5
-5.9
-8.3
34
Haw
aii
140,
365
148,
921
149,
167
164,
627
165,
271
6.3
10.8
17.7
5
Idah
o84
,174
87,2
7392
,808
92,7
8097
,016
10.3
4.5
15.3
6
Illin
ois
1,50
2,06
91,
450,
511
1,49
4,67
21,
312,
342
1,29
4,76
5-0
.5-1
3.4
-13.
843
Indi
ana
165,
153
171,
754
157,
662
168,
748
168,
281
-4.5
6.7
1.9
17
Iow
a27
6,03
029
1,12
730
4,29
028
6,40
531
2,11
310
.22.
613
.18
Kan
sas
193,
627
177,
246
165,
138
164,
762
150,
625
-14.
7-8
.8-2
2.2
47
Ken
tuck
y29
7,51
130
3,80
928
6,15
130
4,59
929
8,99
1-3
.84.
50.
521
Loui
sian
a38
4,94
637
4,06
336
0,50
234
4,31
935
0,61
3-6
.4-2
.7-8
.936
Mai
ne13
3,76
313
1,59
113
2,21
512
0,79
912
5,44
7-1
.2-5
.1-6
.232
Mar
ylan
d54
2,63
852
1,17
252
2,34
651
8,02
848
4,96
8-3
.7-7
.2-1
0.6
38
Mas
sach
uset
ts66
5,49
674
3,45
174
7,39
972
2,59
376
1,23
512
.31.
914
.47
Michi
gan
767,
028
714,
956
601,
932
541,
386
489,
214
-21.
5-1
8.7
-36.
250
Min
neso
ta47
5,70
347
4,09
848
7,17
347
5,10
047
1,44
82.
4-3
.2-0
.922
Mississip
pi14
6,25
113
4,44
713
7,70
613
4,33
212
8,39
0-5
.8-6
.8-1
2.2
40
Misso
uri
354,
133
360,
963
395,
425
431,
432
437,
690
11.7
10.7
23.6
3
Mon
tana
93,1
4889
,296
85,6
8183
,695
87,4
70-8
.02.
1-6
.130
Neb
rask
a11
6,39
911
4,69
712
0,04
810
9,94
011
2,55
83.
1-6
.2-3
.328
Cas
h Ben
efits
(tho
usan
ds)
(1=l
arge
st p
erce
nt in
crea
se,
2012
-201
6)

Workers’ Compensation: Benefits, Costs, and Coverage • 31
Nev
ada
190,
400
178,
961
177,
622
168,
023
164,
752
-6.7
-7.2
-13.
541
New
Ham
pshi
re77
,695
78,6
9970
,430
75,9
4368
,897
-9.4
-2.2
-11.
339
New
Jersey
1,09
0,84
01,
130,
794
1,12
6,26
31,
130,
288
1,15
8,20
03.
22.
86.
213
New
Mex
ico
124,
808
118,
974
136,
134
129,
790
123,
064
9.1
-9.6
-1.4
24
New
Yor
k3,
614,
812
3,72
3,06
53,
679,
057
3,81
4,34
33,
942,
400
1.8
7.2
9.1
10
Nor
th C
arol
ina
780,
179
764,
427
685,
028
652,
980
643,
545
-12.
2-6
.1-1
7.5
46
Nor
th D
akot
a60
,139
72,9
5081
,254
81,3
6876
,074
35.1
-6.4
26.5
2
Ohi
o1,
355,
386
1,24
2,83
31,
271,
874
1,20
2,94
41,
137,
158
-6.2
-10.
6-1
6.1
45
Okl
ahom
a49
1,85
346
2,59
340
6,37
237
1,79
231
2,65
3-1
7.4
-23.
1-3
6.4
51
Ore
gon
294,
412
311,
425
305,
116
293,
758
297,
397
3.6
-2.5
1.0
18
Penn
sylv
ania
1,56
8,07
81,
562,
404
1,56
0,32
61,
582,
488
1,65
1,87
6-0
.55.
95.
314
Rho
de Is
land
122,
256
116,
031
107,
416
112,
819
105,
107
-12.
1-2
.2-1
4.0
44
Sout
h C
arol
ina
490,
320
477,
777
488,
064
482,
475
494,
786
-0.5
1.4
0.9
19
Sout
h D
akot
a28
,690
32,0
0531
,082
34,7
1137
,390
8.3
20.3
30.3
1
Tenn
esse
e31
9,52
129
3,86
926
1,27
424
5,95
021
5,37
1-1
8.2
-17.
6-3
2.6
49
Texa
s63
7,49
359
9,51
359
5,11
364
0,52
062
8,43
6-6
.65.
6-1
.425
Uta
h83
,882
81,3
5776
,696
86,0
4484
,398
-8.6
10.0
0.6
20
Ver
mon
t73
,021
77,0
0372
,118
71,8
4768
,547
-1.2
-5.0
-6.1
31
Virgi
nia
368,
168
351,
860
352,
491
349,
684
341,
255
-4.3
-3.2
-7.3
33
Was
hing
ton
1,56
8,64
11,
589,
908
1,63
0,43
21,
670,
482
1,66
9,59
73.
92.
46.
412
Wes
t Virgi
nia
236,
547
207,
845
214,
031
210,
071
215,
572
-9.5
0.7
-8.9
35
Wisco
nsin
341,
964
266,
993
269,
617
266,
594
254,
972
-21.
2-5
.4-2
5.4
48
Wyo
min
g52
,296
59,5
3453
,946
59,0
6156
,539
3.2
4.8
8.1
11
Tota
l Non
-Fed
eral
Cas
h Ben
efits
$28,
699,
153
$28,
684,
953
$28,
421,
551
$28,
319,
387
$28,
396,
311
-1.0
-0.1
-1.1
All
Fede
rala
$2,6
65,5
18$2
,582
,394
$2,4
80,6
86$2
,487
,853
$2,4
00,5
00-6
.9-3
.2-9
.9
Fede
ral E
mpl
oyee
sb$2
,081
,387
$2,0
24,5
68$1
,929
,360
$1,9
46,8
90$1
,860
,675
-7.3
-3.6
-10.
6
TO
TAL
$31,
364,
671
$31,
267,
347
$30,
902,
237
$30,
807,
240
$30,
796,
811
-1.5
-0.3
-1.8
Notes:B
enef
its are
pay
men
ts in
the ca
lend
ar y
ear to
inju
red
wor
kers and
to p
rovi
ders o
f the
ir m
edical car
e. D
ata so
urce
for ea
ch st
ate is
desc
ribe
d in
det
ail i
n So
urces a
nd M
etho
ds 2
016
avai
labl
e at
ww
w.n
asi.o
rg.
a.In
clud
es fe
dera
l ben
efits
as d
escr
ibed
in T
able 8
.b.
In
clud
ed in
the fe
dera
l ben
efits
tota
l.
Sour
ce:N
atio
nal A
cade
my
of S
ocia
l Ins
uran
ce estim
ates
bas
ed o
n da
ta fr
om st
ate ag
encies
, A.M
. Bes
t, N
atio
nal A
ssoc
iatio
n of
Insu
ranc
e C
omm
ission
ers,
the U
.S. D
epar
tmen
t of L
abor
, and
the So
cial
Secu
rity
Adm
inist
ratio
n.

32 NATIONAL ACADEMY OF SOCIAL INSURANCE
Table 12
Wor
kers' C
ompe
nsation To
tal B
enefits Pa
id Per $10
0 of C
overed
Pay
roll by
State, 2
012-20
16
Dol
lar Am
ount
Cha
nge
Ran
king
Stat
e20
1220
1320
1420
1520
1620
12-2
014
2014
-201
620
12-2
016
Alaba
ma
$0.9
3$0
.90
$0.8
7$0
.81
$0.7
7-$
0.06
-$0.
10-$
0.16
27Alask
a1.
611.
581.
411.
381.
40-0
.20
-0.0
1-0
.21
42Arizo
na0.
670.
650.
640.
610.
60-0
.03
-0.0
4-0
.07
12Ark
ansa
s0.
490.
530.
480.
440.
44-0
.01
-0.0
4-0
.05
9C
alifo
rnia
1.39
1.41
1.32
1.22
1.18
-0.0
7-0
.14
-0.2
139
Col
orad
o0.
770.
710.
640.
640.
59-0
.13
-0.0
5-0
.18
34C
onne
cticut
0.97
1.01
0.95
0.91
0.83
-0.0
2-0
.12
-0.1
425
Delaw
are
1.05
1.14
1.13
0.99
0.97
0.08
-0.1
6-0
.08
14D
istrict o
f Col
umbi
a0.
300.
330.
280.
270.
26-0
.02
-0.0
2-0
.04
5Fl
orid
a1.
151.
131.
040.
920.
87-0
.11
-0.1
7-0
.28
49G
eorg
ia0.
860.
800.
750.
680.
67-0
.11
-0.0
8-0
.19
36H
awai
i1.
051.
051.
041.
091.
07-0
.01
0.03
0.02
3Id
aho
1.12
1.11
1.07
1.05
1.01
-0.0
5-0
.06
-0.1
121
Illin
ois
0.93
0.90
0.89
0.75
0.72
-0.0
4-0
.17
-0.2
141
Indi
ana
0.55
0.56
0.49
0.45
0.44
-0.0
6-0
.05
-0.1
120
Iow
a1.
091.
051.
020.
940.
99-0
.07
-0.0
3-0
.10
19K
ansa
s0.
890.
810.
770.
730.
72-0
.12
-0.0
5-0
.17
30K
entu
cky
0.98
0.96
0.88
0.89
0.82
-0.1
0-0
.06
-0.1
627
Loui
sian
a1.
031.
000.
920.
900.
94-0
.11
0.02
-0.0
915
Mai
ne1.
171.
151.
110.
980.
98-0
.06
-0.1
3-0
.19
36M
aryl
and
0.81
0.79
0.77
0.72
0.66
-0.0
4-0
.11
-0.1
526
Mas
sach
uset
ts0.
530.
560.
530.
490.
490.
00-0
.04
-0.0
46
Michi
gan
0.68
0.69
0.58
0.54
0.46
-0.1
0-0
.12
-0.2
243
Min
neso
ta0.
820.
810.
790.
710.
69-0
.03
-0.1
0-0
.13
24M
ississip
pi0.
950.
910.
900.
860.
78-0
.05
-0.1
2-0
.17
29M
isso
uri
0.81
0.79
0.84
0.86
0.86
0.03
0.02
0.05
2
(1=l
arge
st p
erce
nt in
crea
se,
2012
-201
6)

Workers’ Compensation: Benefits, Costs, and Coverage • 33
Mon
tana
1.67
1.60
1.52
1.49
1.49
-0.1
5-0
.03
-0.1
831
Neb
rask
a0.
870.
830.
850.
760.
77-0
.02
-0.0
8-0
.10
16N
evad
a0.
780.
720.
670.
610.
60-0
.11
-0.0
7-0
.18
34N
ew H
amps
hire
0.80
0.76
0.68
0.65
0.60
-0.1
2-0
.08
-0.2
038
New
Jersey
1.03
1.03
1.02
0.98
0.96
-0.0
1-0
.06
-0.0
712
New
Mex
ico
1.04
1.00
0.98
0.97
0.92
-0.0
6-0
.06
-0.1
222
New
Yor
k1.
041.
030.
980.
960.
98-0
.06
0.00
-0.0
611
Nor
th C
arol
ina
0.90
0.85
0.73
0.66
0.63
-0.1
7-0
.10
-0.2
747
Nor
th D
akot
a0.
830.
930.
880.
840.
850.
05-0
.03
0.02
3O
hio
1.03
0.96
0.90
0.82
0.75
-0.1
3-0
.15
-0.2
850
Okl
ahom
a1.
531.
401.
211.
100.
98-0
.32
-0.2
3-0
.55
51O
rego
n0.
930.
900.
840.
750.
71-0
.09
-0.1
3-0
.22
44Pe
nnsy
lvan
ia1.
111.
111.
081.
031.
06-0
.03
-0.0
2-0
.05
10Rho
de Is
land
0.88
0.81
0.75
0.70
0.67
-0.1
3-0
.08
-0.2
139
Sout
h C
arol
ina
1.30
1.29
1.23
1.15
1.12
-0.0
7-0
.11
-0.1
831
Sout
h D
akot
a0.
670.
690.
650.
660.
63-0
.02
-0.0
2-0
.04
6Te
nnes
see
0.71
0.66
0.58
0.53
0.48
-0.1
3-0
.10
-0.2
345
Texa
s0.
390.
350.
320.
310.
29-0
.07
-0.0
3-0
.10
18U
tah
0.59
0.54
0.49
0.47
0.46
-0.1
0-0
.03
-0.1
323
Ver
mon
t1.
241.
241.
201.
151.
06-0
.04
-0.1
4-0
.18
31V
irgi
nia
0.55
0.52
0.53
0.50
0.51
-0.0
2-0
.02
-0.0
46
Was
hing
ton
1.59
1.54
1.47
1.40
1.32
-0.1
2-0
.15
-0.2
747
Wes
t Virgi
nia
1.83
1.66
1.57
1.54
1.57
-0.2
60.
00-0
.26
46W
isco
nsin
1.03
1.04
1.03
0.96
0.93
0.00
-0.1
0-0
.10
16W
yom
ing
1.36
1.58
1.44
1.41
1.49
0.08
0.05
0.13
1To
tal N
on-F
eder
al$0
.96
$0.9
5$0
.89
$0.8
4$0
.81
-$0.
07-$
0.08
-$0.
15Fe
dera
l Em
ploy
ees
$1.4
5$1
.46
$1.4
2$1
.39
$1.3
2-$
0.03
-$0.
10-$
0.13
TO
TAL
$0.9
9$0
.97
$0.9
2$0
.86
$0.8
3-$
0.07
-$0.
09-$
0.16
Note:
Fede
ral t
otal in
clud
es o
nly
wor
kers cov
ered
und
er F
ederal E
mploy
ees' Com
pens
ation
Act.
Sour
ce:N
atio
nal A
cade
my
of S
ocia
l Ins
uran
ce estim
ates
.

payroll) do not provide meaningful comparisons ofthe performance of state workers’ compensation systems. For example, standardized benefits do notindicate the extent to which cash benefits compen-sate workers for their losses due to injury (i.e. benefitadequacy). Standardized benefits could be high orlow in a given state for a number of reasons completely unrelated to the adequacy of benefitsinjured workers receive.32 For example, if a state hasa disproportionate share of risky occupations (e.g.,mining), all else equal, standardized benefits willtend to be higher. If a state has high prices for medical care relative to the average wage rate, all elseequal, standardized benefits will tend to be higher.
Table 12 shows benefits paid per $100 of coveredpayroll, by state, from 2012 through 2016.Nationwide, total benefits paid were $0.83 per $100of covered payroll in 2016, down $0.16 from 2012.Benefits per $100 of covered payroll decreased by$0.07 between 2012 and 2014, and by $0.09between 2014 and 2016. As shown in Figure 1, standardized benefits have decreased nearly 30 percent from the 20-year high of $1.26 per $100 ofcovered payroll in 1996.
Between 2012 and 2016, benefits per $100 of covered payroll decreased in 47 jurisdictions.Thirteen states experienced a decrease in standardized benefits of between $0.20 to $0.55 overthe five-year period. Benefits per $100 of covered
payroll increased in only four states: Wyoming,Missouri, Hawaii, and North Dakota.
State outliers. Between 2012 and 2016, the statesexperiencing the largest decreases in standardizedbenefits were Oklahoma (-$0.55 per $100 of coveredpayroll), Tennessee (-$0.23), and Michigan (-$0.22).Only one state, Wyoming, experienced a double-digit increase in standardized benefits ($0.13 per$100 of covered payroll).
In addition to the opt-out law that was in effectfrom 2014 through part of 2016, Oklahoma implemented other significant changes to its workers’compensation statutes during the study period. Therevisions included: changes to provider reimburse-ment and medical fee schedules; reductions inpermanent disability ratings for PPD and PTDclaims by the amount of impairment determined tobe pre-existing; reductions in the maximum TTDbenefit amount and duration, and adoption of a newadministrative system governed by a three-memberWorkers’ Compensation Commission.33 Overall inOklahoma, medical benefits declined by 21.3 percent and cash benefits by 36.4 percent over thestudy period. The majority of the decline occurredafter the new legislation was passed – medical andcash benefits were 19.7 and 32.4 percent lower,respectively, in 2016 compared to 2013.
In 2013, Tennessee enacted a Workers’Compensation Reform Act which took effect onJanuary 1, 2014 (Tennessee Bureau of WorkersCompensation, 2017). The legislation established anew administrative process for resolving claims, over-seen by a new Court of Workers’ CompensationClaims and a Workers’ Compensation AppealsBoard. Eligibility for benefits was restricted to casesin which work-related injuries were the primarycause of the workers’ current disability, and PPD
34 NATIONAL ACADEMY OF SOCIAL INSURANCE
Nationwide, workers’ compensationbenefits were $0.83 per $100 of
covered payroll in 2016, down from$1.26 in 1996.
32 To provide meaningful comparisons of benefit adequacy, a study should compare the benefits that injured workers actually receive tothe wages they lose because of their occupational injuries or diseases. Such wage-loss studies have been conducted in several states(e.g., California, New Mexico, Oregon, Washington, Wisconsin), but the data for estimating wage losses are not available for moststates. Please refer to Savych and Hunt (2017), Seabury et al. (2014), Hunt and Dillender (2014), Boden et al. (2005), and Hunt(2004) for a review of studies evaluating benefit adequacy.
33 Oklahoma Senate Bill 1062. In addition to the statutory changes that reduced compensation paid per claim, the number of workers’compensation claims filed in Oklahoma declined dramatically since the legislative changes were implemented in 2014. There were7,705 claims filed in 2016, down 48 percent from 2012 (Oklahoma Workers’ Compensation Commission, 2017). Employer’s firstnotice of injury filings also declined 35 percent over the same time period. The decline is not due to a decline in employment – therate of claims filed per 100 workers also fell from 0.94 to 0.47 from 2012 to 2016. The statutory changes did make some previouslycompensable injuries non-compensable and there is anecdotal evidence that the claimant attorney or claimant population may haveforgone filing claims, including fraudulent claims that have been discouraged or weeded out by the statutory changes (Personal communication with Stormy Moore, Director of Permitting Services, Oklahoma Workers’ Compensation Commission).

benefit rates were reduced, although the maximumduration of benefits was increased from 400 to 450weeks. The legislation also adopted new medicaltreatment guidelines, which narrowed reimbursabletreatment regimens to those explicitly listed in theguidelines. Medical benefits decreased by 11.1 percent and cash benefits by 32.6 percent over thestudy period.
In 2011, Michigan enacted changes to its workers’compensation laws that included: redefining disability and post-injury work capacity, andstrengthening the criteria required to establish disability and/or wage loss.34 In contrast to the expe-rience of Oklahoma and Tennessee, the decrease in
benefits in Michigan between 2012 and 2016 isentirely due to a decline in cash benefits (cash bene-fits decreased by 36.2 percent over the study period,while medical benefits increased by 10.3 percent).
In July 2009, Wyoming instituted workers’ compensation reforms that increased cash benefitspaid to injured workers and their families.35 Thereforms increased the duration of death benefits paidto a spouse from 4.5 to 8 years, and increased theamount of death benefits paid to surviving children.For injured workers, the reforms established a minimum weekly benefit for TTD claims, increasedawards for PPD claims, and tied future benefits forPTD claims to inflation. Following these reforms,
Workers’ Compensation: Benefits, Costs, and Coverage • 35
34 Before the change in law, “disability” was defined as “a limitation of an employee’s wage earning capacity in work suitable to his orher qualifications and training resulting from a personal injury or work-related disease.” After the new law was passed in 2011, “limitation of wage earning capacity” was defined as occurring only “if a personal injury covered under this act results in the employee’s being unable to perform all jobs paying the maximum wages in work suitable to that employee’s qualifications and training, which includes work that may be performed using the employee’s transferable work skills,” Michigan Legislature, 2011-2012 Legislative Session, HB 5002.
35 Wyoming State Legislature, 2009 General Session, HB 54.
Figure 3Percentage Share of Medical and Cash Benefits, 1980-2016
Source: National Academy of Social Insurance estimates. The percentage share of medical and cash benefits sum to 100 percent.
0%
10%
20%
30%
40%
50%
60%
70%
80%
19
80
1981
1982
1983
1984
1985
1986
1987
1988
1989
1990
1991
1992
1993
1994
1995
1996
1997
1998
1999
2000
2001
2002
2003
2004
2005
2006
2007
2008
2009
2010
2011
2012
2013
2014
2015
2016
4241404040
29
495049 4948494848464646 4746
4443
2931 32 33 34 35 36 37
3940 40
42 43
5050 50
Per
cent
age
Sha
re
Cash Benefits
Medical Benefits
36 NATIONAL ACADEMY OF SOCIAL INSURANCE
the Office of Administrative Hearings experienced asignificant decrease in the numbers of workers’ com-pensation claims contested by the state, which likelyalso contributed to the increase in benefits paid per$100 of covered payroll. Medical benefits increasedby 7.7 percent and cash benefits by 8.1 percentbetween 2012 and 2016.
Cash Benefits by Type of Claim The National Council on Compensation Insurance(NCCI) provides data on the relative incidence ofeach type of disability claim (temporary total, permanent partial, permanent total, and fatalities) asa proportion of the total number of cases receivingcash benefits, and total benefits incurred (NCCI2018a). Data are reported for each state’s ‘policy peri-od,’ which may or may not correspond to a calendaryear. Data are available for the 38 states in whichNCCI is licensed. Figures 4a and 4b display the datafor 1996 to 2014, the most recent year available.
Figure 4a shows the percentage of indemnity claims(claims involving cash benefits) attributed to eachtype of disability claim. Figure 4b shows the percentage of total benefits attributed to each type ofindemnity claim.36 The bulk of total benefits forworkers’ compensation go to permanent disabilityclaims, of which permanent partial disability claimsare most common.37 In 2014, temporary total disability (TTD) claims accounted for 61.2 percentof all indemnity claims, but only 33.9 percent ofbenefits incurred (Figures 4a & 4b). PPD claimsaccounted for 38.2 percent of indemnity claims, but56.1 percent of benefits incurred.
Between 1996 and 2014, TTD claims decreased as ashare of all indemnity claims (-11.0 percentagepoints), but increased as a share of benefits incurred(+8.7 percentage points). At the same time, PPDclaims increased as a share of indemnity claims(+11.3 percentage points) but decreased as a share ofbenefits incurred (-5.8 percentage points). Over thistime period, many of the claims leaving the system
were smaller claims, usually temporary total disability claims, thus accounting for the decrease inoverall share of TTD claims. If, at the same time,average TTD benefits were increasing relative toaverage PPD benefits, this could explain the increasein TTD claims as a share of benefits incurred.
Permanent total disability and fatality claims are relatively rare, accounting for less than one percentof claims involving cash benefits (approximately 0.6percent in every year from 2003 to 2014). However,these claims tend to be expensive. In 2014, PTDand fatality claims represented 0.6 percent of totalindemnity claims, but 9.9 percent of benefitsincurred (Figures 4a & 4b).
Employer Costs forWorkers’ Compensation Data Sources for Estimating Employer Costs This section describes the primary sources of datathat we use to estimate employer costs for workers’compensation. The Academy’s estimates of employercosts are equal to the sum of: premiums anddeductibles paid to private insurers and state funds;benefits and administrative costs paid by self-insuredemployers; and assessments paid to special funds(e.g. second-injury funds). A detailed, state-by-stateexplanation of how the cost estimates are produced isprovided in Sources and Methods: A Companion toWorkers’ Compensation Benefits, Costs, and Coverage,2016, available on the Academy’s website(www.nasi.org/research/workers-compensation). The primary sources of cost data are the state sur-veys, A.M. Best, and NCCI.
The Academy’s methods for estimating employercosts vary according to the employer’s source ofworkers’ compensation coverage. For employers purchasing insurance from private carriers or statefunds, the cost of workers’ compensation in any year
36 In 2014, medical-only claims accounted for 75 percent of all workers’ compensation claims, but less than 10 percent of all benefitspaid (NCCI, 2018a). Since 1999, there has been a gradual decline in the share of medical-only claims from 78.3 percent to the current 75.0 percent. On the other hand, the share of benefits paid for medical only claims has increased from 6.2 percent in 1999to 7.5 percent of overall benefits in 2014.
37 Workers’ compensation claims are typically classified into discrete types according to the most severe type of disability benefit received. For example, a permanent partial disability beneficiary has typically received temporary disability benefits until the point ofmaximum medical improvement, but the entire cost of cash benefits for the claim is ascribed to permanent partial disability.

Figure 4aTypes of Disabilities in Workers’ Compensation Cases with Cash Benefits, 1996-2014
Percentage of Cases
Figure 4b
0.84%0.58% 0.60%0.55%0.56%0.57%0.60%0.60% 0.60%0.66%0.58%
0.80% 0.76% 0.79% 0.83% 0.89% 0.96%
0.58% 0.63%
72.2% 71.6%
67.9% 66.3%64.0% 62.8% 62.2%
66.0% 64.8% 64.2% 63.1%60.6%
58.2% 58.4%58.8%60.4%59.5%
27.7%
31.4%
36.7% 36.2% 37.2%35.1%
33.0%
38.7%41.0%
40.0%40.7%
38.2%39.7%
26.9%
33.2% 34.3% 35.2%
61.2%
39.0%
59.8%
41.1%
Percentage of Benefits
Notes: Cases classified as permanent partial include cases that are closed with lump sum settlements. Benefits paid in cases classified as permanent partial, permanent total and fatalites can include any temporary total disability benefits also paid in such cases. The data are from the first report fromthe NCCI Annual Statistical Bulletin.
Source: NCCI 1995-2017, Annual Statistical Bulletin, Exhibits X and XII.
Temporary Total
Permanent Partial
Permanent Total & Fatalities
1996 1997 1998 1999 2000 2001 2002 2003 2004 2005 2006 2007 2008 2009 2010 2011 2012 2013 2014
61.9% 62.4% 62.9%66.2% 66.8% 65.1%
60.9% 62.2%
69.5%
63.9%62.3%60.1%
21.0%
25.2%
20.6%
25.1%28.0%
31.4%
21.3%
10.0%
56.3% 56.1%
26.3% 25.8%
9.5%12.4%
8.4% 8.6% 9.3%10.7% 9.9%
66.8%63.2% 62.4%
58.3%
20.2%20.6%
27.0%26.5% 25.9% 25.5%27.3%
29.3%32.4%
33.9%
10.9%7.9% 8.9% 9.1%
2.9% 3.0%
62.4%
2.9% 2.9% 2.7% 2.1% 2.0% 1.7% 1.8% 2.4% 2.3% 2.3% 2.5% 2.5% 2.4% 2.4% 2.4%2.3% 2.7%
8.2% 8.3% 8.0% 8.2% 7.7% 8.4% 6.9%
Permanent Partial
Temporary Total
Permanent Total
Fatalities
1996 1997 1998 1999 2000 2001 2002 2003 2004 2005 2006 2007 2008 2009 2010 2011 2012 2013 2014
Workers’ Compensation: Benefits, Costs, and Coverage • 37

38 NATIONAL ACADEMY OF SOCIAL INSURANCE
equals the sum of premiums paid in that year plusreimbursements paid to the insurer under deductibleprovisions.
For self-insured employers, workers’ compensationcosts include medical and cash benefits paid duringthe calendar year, plus the administrative costs ofproviding those benefits. Administrative costsinclude the direct costs of managing claims, as wellas expenditures for litigation, cost containment,taxes, licenses, and fees. Self-insured employers generally do not report administrative costs of workers’ compensation separately from the costs ofadministering other employee benefit programs, sothe costs associated with administering workers’compensation must be estimated. The NationalAssociation of Insurance Commissioners reports theratio of administrative costs to total benefits paid, forprivate insurers who report to them (NAIC, 2018).To estimate administrative costs for self-insuredemployers, we assume that the ratio of administrativecosts to total benefits paid is the same for self-insured employers as it is for private insurers.38
For the federal employee workers’ compensation program, employer costs are benefits paid plusadministrative costs, as reported by the Departmentof Labor (DOL, 2018).
The Academy’s estimates of employer costs alsoinclude estimates of assessments for special funds,second injury funds, and guaranty funds. Employerassessments for special funds or second injury fundsare estimated from the assessment rates a stateapplies either to premiums or losses (benefits paid).State assessment rates are provided either by stateagencies or by NCCI. Assessments for insuranceguaranty funds are paid by insurers, so these areincluded in reported premiums.
Because the Academy compiles data on employercosts from a variety of sources, there are some limita-tions. First, there may be some direct workers’compensation costs not captured in the estimates.
We may, for example, miss some unreported expen-ditures, such as those for legal or case managementservices. Second, our estimates are limited to themonetary costs of work-related injuries and illnessespaid by employers. The estimates do not include thecosts borne by employers who pay injured workersfull salary during periods of light duty or other post-injury job accommodation. Some of this voluntarypayment is a loss to the employer because of thereduced productivity of the workers being accommo-dated. Finally, our estimates do not include the costsimposed on workers, families, and society in theform of pain and suffering, and losses of productivi-ty. These costs are beyond the scope of this report.
National Estimates of Employer Costs Table 13 shows employer costs for workers’ compen-sation by type of coverage for 1996 through 2016.In 2016, total employer costs were $96.5 billion, anincrease of 1.1 percent from 2015, and 14.0 percentfrom 2012.
The increase in total employer costs is largelyexplained by trends in labor markets over the studyperiod. When costs are standardized to control forchanges in employment and payrolls, the resultsshow that employer costs actually decreased by $0.04per $100 of covered payroll between 2012 and 2016(Table 14). Among non-federal employers, costs per$100 of covered payroll decreased $0.05 across thestudy time-period, and the downward trend is con-centrated more in recent years. After increasing to$1.34 in 2013, non-federal employer costs per $100of covered payroll declined $0.08 to $1.26 in 2016.
In 2016, costs for employers insured through privatecarriers were 62.0 percent of total costs ($59.9 bil-lion); costs for employers insured through state fundswere 13.5 percent ($13.0 billion); costs for self-insured employers were 18.6 percent ($18.0 billion);and costs to federal government programs were 5.9percent ($5.7 billion) (Table 13). Over the five-year
38 Private insurers face some cost factors, such as commissions, profit allowances, and taxes on premiums that self-insurers do not face.The NAIC estimates of administrative costs are equal to the amount spent on direct defense and cost containment expenses plustaxes, licenses, and fees, divided by direct losses paid (for more detail see Sources and Methods 2016). NAIC’s estimate of adminis-trative costs is based on the experience of private insurers. Other reports have found higher administrative overhead costs as a percentof total premiums compared to those reported by NAIC (e.g. Neuhauser et al., 2010).
In previous reports, the national average of NAIC’s estimates of administrative costs was used to calculate self-insurer costs for eachstate. This report updates the 2012-2016 estimates of administrative costs using NAIC’s state-by-state estimates (for more detail seeSources and Methods 2016).
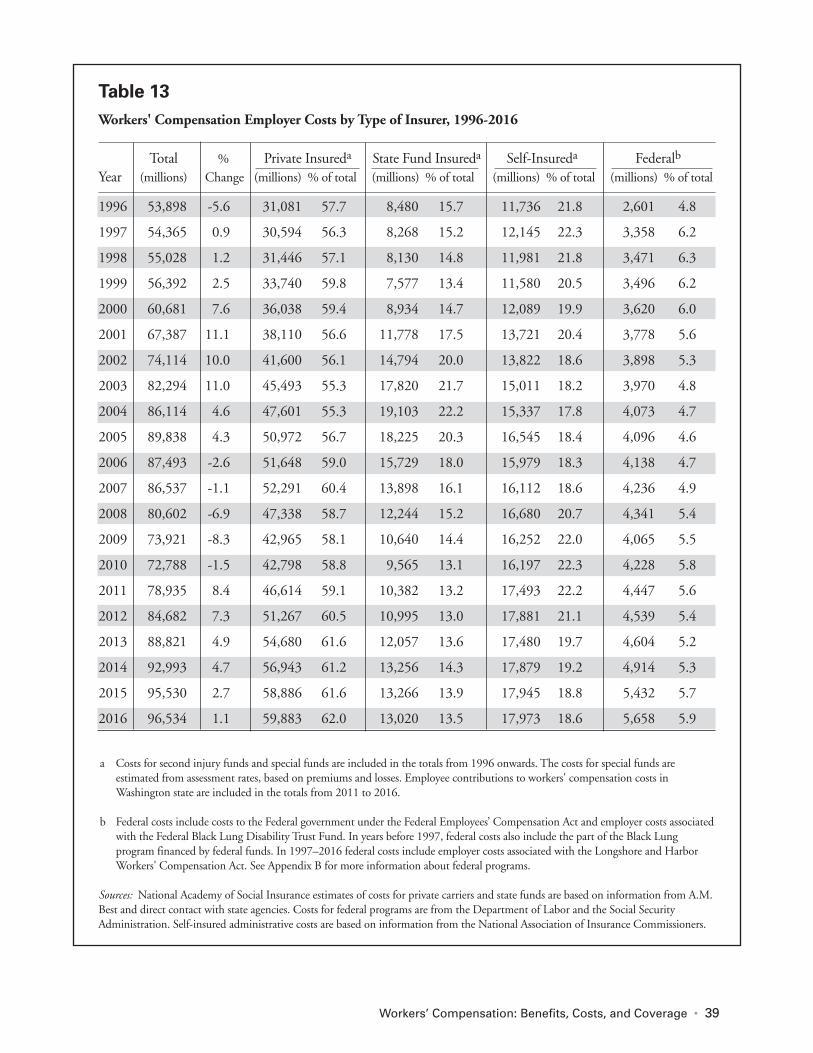
Workers’ Compensation: Benefits, Costs, and Coverage • 39
Table 13Workers' Compensation Employer Costs by Type of Insurer, 1996-2016
Total % Private Insureda State Fund Insureda Self-Insureda Federalb
Year (millions) Change (millions) % of total (millions) % of total (millions) % of total (millions) % of total
1996 53,898 -5.6 31,081 57.7 8,480 15.7 11,736 21.8 2,601 4.8
1997 54,365 0.9 30,594 56.3 8,268 15.2 12,145 22.3 3,358 6.2
1998 55,028 1.2 31,446 57.1 8,130 14.8 11,981 21.8 3,471 6.3
1999 56,392 2.5 33,740 59.8 7,577 13.4 11,580 20.5 3,496 6.2
2000 60,681 7.6 36,038 59.4 8,934 14.7 12,089 19.9 3,620 6.0
2001 67,387 11.1 38,110 56.6 11,778 17.5 13,721 20.4 3,778 5.6
2002 74,114 10.0 41,600 56.1 14,794 20.0 13,822 18.6 3,898 5.3
2003 82,294 11.0 45,493 55.3 17,820 21.7 15,011 18.2 3,970 4.8
2004 86,114 4.6 47,601 55.3 19,103 22.2 15,337 17.8 4,073 4.7
2005 89,838 4.3 50,972 56.7 18,225 20.3 16,545 18.4 4,096 4.6
2006 87,493 -2.6 51,648 59.0 15,729 18.0 15,979 18.3 4,138 4.7
2007 86,537 -1.1 52,291 60.4 13,898 16.1 16,112 18.6 4,236 4.9
2008 80,602 -6.9 47,338 58.7 12,244 15.2 16,680 20.7 4,341 5.4
2009 73,921 -8.3 42,965 58.1 10,640 14.4 16,252 22.0 4,065 5.5
2010 72,788 -1.5 42,798 58.8 9,565 13.1 16,197 22.3 4,228 5.8
2011 78,935 8.4 46,614 59.1 10,382 13.2 17,493 22.2 4,447 5.6
2012 84,682 7.3 51,267 60.5 10,995 13.0 17,881 21.1 4,539 5.4
2013 88,821 4.9 54,680 61.6 12,057 13.6 17,480 19.7 4,604 5.2
2014 92,993 4.7 56,943 61.2 13,256 14.3 17,879 19.2 4,914 5.3
2015 95,530 2.7 58,886 61.6 13,266 13.9 17,945 18.8 5,432 5.7
2016 96,534 1.1 59,883 62.0 13,020 13.5 17,973 18.6 5,658 5.9
a Costs for second injury funds and special funds are included in the totals from 1996 onwards. The costs for special funds are estimated from assessment rates, based on premiums and losses. Employee contributions to workers' compensation costs in Washington state are included in the totals from 2011 to 2016.
b Federal costs include costs to the Federal government under the Federal Employees’ Compensation Act and employer costs associatedwith the Federal Black Lung Disability Trust Fund. In years before 1997, federal costs also include the part of the Black Lung program financed by federal funds. In 1997–2016 federal costs include employer costs associated with the Longshore and HarborWorkers' Compensation Act. See Appendix B for more information about federal programs.
Sources: National Academy of Social Insurance estimates of costs for private carriers and state funds are based on information from A.M.Best and direct contact with state agencies. Costs for federal programs are from the Department of Labor and the Social Security Administration. Self-insured administrative costs are based on information from the National Association of Insurance Commissioners.
40 NATIONAL ACADEMY OF SOCIAL INSURANCE
study period (2012-2016), the share of costs paid byself-insured employers decreased by 2.5 percentagepoints, while the shares accorded to private insured,state funds, and the federal government increasedslightly.
State Estimates of Employer Costs Table 14 reports estimates of employer costs forworkers’ compensation per $100 of covered payrollby state from 2012 to 2016. Costs are aggregatedacross all types of insurers (excluding the federal government). Consistent with the national trend,employer costs per $100 of covered payroll decreasedin 39 jurisdictions.
States that experienced the largest decreases in stan-dardized costs include: Oklahoma (-$0.79), WestVirginia (-$0.43), Alaska (-$0.39), North Dakota ($-0.36), and Montana (-$0.36).
The large decline in standardized costs in Oklahomais likely the result of multiple factors. First, asdescribed earlier, Oklahoma implemented significantchanges to its workers’ compensation laws (see pg.28 for more detail). Second, the “opt-out” provision,which was effective from 2014 through part of 2016,allowed employers to provide insurance for injuredworkers under alternative benefit systems. Withoutaccurate estimates of the number of jobs covered inopt-out plans, our estimates of covered jobs and pay-roll would over-estimate coverage, which would resultin lower standardized costs (and benefits) than theyshould be.39
In West Virginia, the reductions continued a down-ward trend that began when the state changed froman exclusive state fund in 2008 to a private carriersystem after 2009, along with substantial reductions
in the statutory levels of benefits. The effects of thechanges appear to be stabilizing, however. Employercosts declined by $0.29 per $100 of covered payrollbetween 2012 and 2014, compared to only $0.14per $100 between 2014 and 2016.
The large decrease in employer costs in Alaskaoccurred between 2012 and 2014 (-$0.39 per $100of covered payroll. In 2014, the state approved legis-lation tightening its medical fee schedule andreducing time limits for filing or appealing claims formedical services (NCSL, 2014). In North Dakota,there were large decreases in standardized employercosts in 2012-2014 (-$0.13) and 2014-2016 (-$0.23). The decline in standardized costs likelyreflect changes to its workers’ compensation law,enacted in 2013, that affected both medical and cashbenefits.40 In Montana, the cost reductions occurredprimarily in the first half of the study period (-$0.25in 2012-2014 vs. -$0.11 in 2014-2016), after thestate implemented a number of changes to its work-ers’ compensation laws in 2011.41
Employer costs per $100 of covered payroll increasedin only 12 states between 2012 and 2016. Thelargest increases occurred in Hawaii ($0.22 per $100of covered payroll), Delaware ($0.22), and Wyoming($0.18). The increases in Hawaii likely reflectincreases in the fee schedule for medical servicesenacted in 2013 (NCSL, 2013). Indeed, Hawaiiexperienced the highest percent increase in totalmedical benefits paid (30.3%) in the countrybetween 2012 and 2016 (Table 10). The increase instandardized employer costs in Delaware occurredentirely in the 2012-2014 period. In June 2013,Delaware enacted legislative changes to its worker’scompensation law intended to control workers’ compensation costs, after which standardized
39 The Oklahoma Department of Insurance did not track the number of workers covered by opt-out plans between 2014 and 2016.However, there is preliminary evidence that roughly 22,500 employees were covered by alternative plans in 2014 (Grabell andBerkes, 2015). If correct, this would represent 1.5 percent of Oklahoma’s workforce, although some officials believe even that num-ber to be high. If we assume that 1.5 percent of the workforce was covered by opt-out plans, this would result in standardized costsof $1.47 (compared to $1.45) and standardized benefits of $1.00 (compared to $0.98) in 2016. It is possible that the number of em-ployers opting-out of OK’s workers’ compensation system increased in 2015 and 2016, which would lead to a greater difference instandardized costs and benefits.
40 In April 2013, the North Dakota legislature approved changes to the state’s workers’ compensation statute which included: disallow-ing pain as a sole factor to indicate increasing severity of a preexisting injury; increasing restrictions on benefits in cases of out-of-state filing or incarceration; reducing PPD ratings for some amputations; and allowing employers greater latitude in selecting amongcompeting medical opinions (NCSL, 2013).
41 Effective July 1, 2011, Montana established utilization review and treatment guidelines for medical care and instituted a cap onmedical benefits at 260 weeks. Other changes during this period limited eligibility for indemnity benefits (Personal communicationfrom Richard Martin, workers’ compensation attorney.)

Workers’ Compensation: Benefits, Costs, and Coverage • 41
employer costs have stabilized.42 The increase inemployer costs as a share of payroll in Wyomingoccurs mostly in the 2012-2014 period, and likelyreflects changes to the state’s workers’ compensationlaw enacted in 2009 (see pg. 35 for more details).
Although there is considerable inter-state variation inemployer costs for workers’ compensation per $100of covered payroll, readers are cautioned againstusing the estimates in Table 14 to identify states withmore or less favorable climates for employers orworkers. The data on average employer costs by statedo not mean that states with lower costs offer a morecompetitive environment for employers, becausestates differ in their mix of industries. Consider, forexample, two industries: logging, for which theworkers’ compensation rate is $40 per $100 of pay-roll, and banking, for which the rate is $1 per $100of payroll. Suppose State A has 80 percent of itsemployees in logging and 20 percent in banking, soaverage costs for workers’ compensation are $32.20per $100 of payroll. State B has 20 percent of itsemployees in logging and 80 percent in banking, soaverage employer costs for workers’ compensationare $8.20 per $100 of payroll. If Timber-R-Usmoved from State A to State B to take advantage of
the lower average costs of workers’ compensation,they would not save on workers’ compensation costs.Timber-R-Us would continue to pay workers’ com-pensation premiums of $40 per $100 of payroll.
This simple example demonstrates that a meaningfulcomparison of employer costs across states must control for variations in the proportions of employ-ers in different insurance classifications (based onindustries and occupations) in each state. Such comparisons are beyond the scope of this report.
Furthermore, the cost data reported here may notcapture the full impact of recent changes in laws thathave altered the workers’ compensation market within a state. Because the Academy reports costspaid in a particular year, regardless of injury date,cost data for 2016 include a substantial proportionof cash benefits paid for injuries that occurred inprior years, under legal regimes and economic conditions that may have been quite different fromthe current conditions in a state.
Benefits Paid Relative to Employer Costs Table 15 reports ratios of workers’ compensationbenefits paid relative to employer costs, from 1996to 2016. The benefits and costs measures are stan-dardized estimates, that is, per $100 of coveredpayroll, so their ratio represents benefits paid per $1of employer costs.
The reader is cautioned that the ratios represent benefits and costs paid in a given year, but not necessarily for the same claims. The benefits measureincludes payments for all injuries/illnesses thatoccurred in the given year and for some injuries thatoccurred in prior years. The costs measure (premiumspaid to insurers and state funds) includes projectedfuture liabilities for injuries/illnesses that occurred inthe given year. In other words, the costs and benefitspaid in a given year are not tracking the full costs ofa particular set of claims.43
Readers are cautioned that it is notappropriate to use the data on
employer costs per $100 of coveredpayroll to identify states with more favorable workers’ compensation systems for employers or workers,because the Academy’s estimates do not control for differences acrossstates in the relative risk of their
industry/ occupation mix.
42 In 2013, in response to recommendations of the Workers’ Compensation Task Force, Delaware increased medical cost controls andrequirements for utilization review; and expanded return-to-work options and workplace safety programs (NCSL, 2013).
43 For employers covered by private insurers or state funds, costs are largely determined by premiums paid. However, in a given year, pre-miums paid by employers do not necessarily match benefits received by workers. Premiums in a given year pay for all compensable in-juries that occur in the same year and benefits paid (on the same injuries) in future years. On the other hand, the majority of cashbenefits paid in any given year are for injuries that occurred in previous years (and are covered by the premiums paid in those sameprevious years). Premiums are influenced by a number of factors (some are modified to account for previous workers’ compensation li-ability experience) and may incorporate insurers’ past and anticipated investment returns on reserves set aside to cover future liabilities.

42 NATIONAL ACADEMY OF SOCIAL INSURANCE
Table 14
Employ
er C
osts fo
r W
orke
rs' C
ompe
nsationPe
r $1
00 of C
overed
Pay
roll by
State, 2
012-20
16
Dol
lar Am
ount
Cha
nge
Ran
king
Stat
e20
1220
1320
1420
1520
1620
12-2
014
2014
-201
620
12-2
016
Alaba
ma
$1.1
9$1
.17
$1.1
7$1
.14
$1.1
0-$
0.02
-$0.
07-$
0.09
32
Alask
a2.
712.
552.
322.
262.
32-0
.39
0.00
-0.3
949
Arizo
na0.
900.
981.
010.
980.
950.
11-0
.06
0.05
11
Ark
ansa
s0.
780.
860.
800.
790.
760.
02-0
.04
-0.0
217
Califo
rnia
1.86
1.97
2.02
1.98
1.97
0.16
-0.0
50.
116
Col
orad
o0.
950.
981.
031.
051.
020.
08-0
.01
0.07
7
Con
nect
icut
1.22
1.30
1.31
1.30
1.23
0.09
-0.0
80.
0112
Delaw
are
1.25
1.45
1.44
1.43
1.47
0.19
0.03
0.22
1
District o
f Col
umbi
a0.
520.
600.
530.
630.
480.
01-0
.05
-0.0
421
Flor
ida
1.47
1.50
1.51
1.36
1.32
0.04
-0.1
9-0
.15
39
Geo
rgia
1.17
1.16
1.14
1.11
1.10
-0.0
3-0
.04
-0.0
726
Haw
aii
1.45
1.51
1.57
1.64
1.67
0.12
0.10
0.22
1
Idah
o1.
631.
671.
661.
701.
700.
030.
040.
077
Illin
ois
1.32
1.31
1.29
1.21
1.15
-0.0
3-0
.14
-0.1
742
Indi
ana
0.85
0.88
0.85
0.84
0.81
0.00
-0.0
4-0
.04
20
Iow
a1.
601.
631.
601.
561.
540.
00-0
.06
-0.0
625
Kan
sas
1.33
1.35
1.31
1.22
1.14
-0.0
2-0
.17
-0.1
944
Ken
tuck
y1.
161.
151.
101.
081.
02-0
.06
-0.0
8-0
.14
38
Loui
sian
a1.
571.
521.
531.
461.
45-0
.04
-0.0
8-0
.12
35
Mai
ne1.
451.
421.
401.
371.
37-0
.05
-0.0
3-0
.08
30
Mar
ylan
d1.
071.
071.
091.
071.
000.
02-0
.09
-0.0
727
Mas
sach
uset
ts0.
780.
770.
740.
710.
74-0
.04
0.00
-0.0
421
Michi
gan
0.97
1.04
0.97
0.92
0.81
0.00
-0.1
6-0
.16
40
Min
neso
ta1.
071.
071.
071.
061.
060.
00-0
.01
-0.0
113
Mississip
pi1.
371.
411.
511.
421.
290.
14-0
.22
-0.0
831
Misso
uri
1.09
1.12
1.22
1.22
1.21
0.13
-0.0
10.
125
(1=l
arge
st p
erce
nt in
crea
se,
2012
-201
6)

Workers’ Compensation: Benefits, Costs, and Coverage • 43
Mon
tana
2.48
2.24
2.23
2.15
2.12
-0.2
5-0
.11
-0.3
647
Neb
rask
a1.
321.
351.
341.
281.
250.
02-0
.09
-0.0
727
Nev
ada
0.98
1.01
1.02
0.99
0.95
0.04
-0.0
7-0
.03
18
New
Ham
pshi
re1.
291.
311.
251.
161.
10-0
.04
-0.1
5-0
.19
43
New
Jersey
1.39
1.48
1.56
1.52
1.51
0.17
-0.0
50.
124
New
Mex
ico
1.46
1.48
1.55
1.54
1.41
0.09
-0.1
4-0
.05
24
New
Yor
k1.
441.
451.
411.
431.
50-0
.03
0.09
0.06
9
Nor
th C
arol
ina
1.18
1.20
1.15
1.09
1.06
-0.0
3-0
.09
-0.1
233
Nor
th D
akot
a1.
811.
811.
681.
631.
45-0
.13
-0.2
3-0
.36
48
Ohi
o1.
021.
011.
070.
870.
750.
05-0
.32
-0.2
746
Okl
ahom
a2.
242.
151.
891.
681.
45-0
.35
-0.4
4-0
.79
51
Ore
gon
1.14
1.16
1.11
1.01
1.02
-0.0
3-0
.09
-0.1
233
Penn
sylv
ania
1.51
1.52
1.48
1.47
1.44
-0.0
3-0
.04
-0.0
727
Rho
de Is
land
1.11
1.11
1.13
1.14
1.17
0.02
0.04
0.06
10
Sout
h C
arol
ina
1.84
1.83
1.81
1.74
1.72
-0.0
3-0
.09
-0.1
235
Sout
h D
akot
a1.
341.
371.
311.
281.
21-0
.03
-0.1
0-0
.13
37
Tenn
esse
e1.
101.
090.
990.
910.
88-0
.11
-0.1
1-0
.22
45
Texa
s0.
740.
750.
730.
670.
57-0
.01
-0.1
6-0
.17
41
Uta
h0.
920.
920.
920.
880.
880.
00-0
.04
-0.0
421
Ver
mon
t1.
821.
961.
801.
821.
79-0
.02
-0.0
1-0
.03
18
Virgi
nia
0.77
0.75
0.75
0.75
0.76
-0.0
20.
01-0
.01
13
Was
hing
tona
1.71
1.71
1.65
1.67
1.70
-0.0
60.
05-0
.01
13
Wes
t Virgi
nia
1.87
1.72
1.58
1.60
1.44
-0.2
9-0
.14
-0.4
350
Wisco
nsin
1.75
1.72
1.69
1.72
1.74
-0.0
60.
05-0
.01
13
Wyo
min
g1.
852.
032.
012.
042.
030.
160.
020.
183
Tota
l Non
-Fed
eral
$1.3
1$1
.34
$1.3
3$1
.29
$1.2
6$0
.02
-$0.
07-$
0.05
Fede
ral E
mpl
oyee
s$2
.19
$2.2
8$2
.38
$2.5
3$2
.58
$0.1
9$0
.20
$0.3
9
TO
TAL
$1.3
4$1
.37
$1.3
6$1
.33
$1.3
0$0
.02
-$0.
06-$
0.04
*Note: G
ener
ally
stat
es w
ith exc
lusiv
e stat
e fu
nds o
pera
te sp
ecia
l fun
ds (o
r th
eir eq
uiva
lent
s) and
their ex
perien
ce is
includ
ed in
the be
nefit
and
cos
ts ent
ries
for th
ose ex
clus
ive stat
e fu
nds.
a.In
Was
hing
ton
stat
e bo
th em
ploy
ers a
nd em
ploy
ees c
ontrib
ute to
wor
kers' c
ompe
nsat
ion
prem
ium
s. In
201
6, em
ploy
ees c
ontrib
uted
22
perc
ent o
f tot
al p
rem
ium
s (25
per
cent
of s
tate
fund
pre
miu
ms
and
11 p
erce
nt o
f self-in
sure
d em
ploy
er cos
t-of
-livi
ng-a
djus
tmen
t pre
miu
ms).
Sour
ce: N
atio
nal A
cade
my
of S
ocia
l Ins
uran
ce estim
ates
.

44 NATIONAL ACADEMY OF SOCIAL INSURANCE
Table 15Workers’ Compensation Benefit/Cost Ratios, 1996-2016
Medical Benefits Cash Benefits Total Benefits Employer Costs Total Benefitsper $100 per $100 per $100 per $100 per $1
Year Covered Wages Covered Wages Covered Wages Covered Wages Employer Cost
1996 0.50 0.76 1.26 1.62 0.78
1997 0.48 0.69 1.17 1.51 0.77
1998 0.48 0.65 1.13 1.42 0.80
1999 0.48 0.64 1.12 1.36 0.82
2000 0.47 0.59 1.06 1.35 0.79
2001 0.50 0.60 1.10 1.46 0.75
2002 0.52 0.61 1.13 1.61 0.71
2003 0.55 0.61 1.16 1.74 0.67
2004 0.53 0.60 1.13 1.74 0.65
2005 0.51 0.58 1.09 1.72 0.64
2006 0.47 0.52 0.99 1.58 0.63
2007 0.46 0.50 0.96 1.48 0.65
2008 0.49 0.50 0.99 1.35 0.73
2009 0.50 0.53 1.03 1.30 0.79
2010 0.49 0.51 1.00 1.25 0.80
2011 0.51 0.50 1.01 1.30 0.78
2012 0.49 0.50 0.99 1.34 0.74
2013 0.49 0.48 0.97 1.37 0.71
2014 0.47 0.45 0.92 1.36 0.68
2015 0.43 0.43 0.86 1.33 0.65
2016 0.42 0.41 0.83 1.30 0.64
Notes: Benefits are calendar-year payments to injured workers and to providers of their medical care. Employer costs are calendar-year expenditures for workers' compensation insurance premiums, benefits paid under deductibles or self-insurance,and administrative costs.
Source: National Academy of Social Insurance estimates.
In 2016, total workers’ compensation benefits paidwere $0.83 per $100 of covered payroll, $0.42 formedical benefits and $0.41 for cash benefits.Employer costs were $1.30 per $100 of covered payroll. As shown in Figure 1, these figures representthe lowest level of standardized benefits in the last 35 years, and one of the lowest levels of standardizedcosts. The benefit/cost ratio was 0.64 in 2016, that
is, $0.64 of benefits were paid per $1 of employercosts.
Employer costs for workers’ compensation exceedbenefits paid (i.e. the benefit/cost ratio is less thanone) because some part of employer costs go toadministrative expenses and profits for workers’ com-pensation insurers. In addition, employer premiums
Workers’ Compensation: Benefits, Costs, and Coverage • 45
must account for future inflation in medical costs.That is, employers are paying up front for the costsof current claims that will be paid in future years.Finally, the costs of workers’ compensation include arisk premium to compensate for the expected variance in costs from year to year.
The benefit/cost ratio varies from year to year for anumber of reasons, including : 1) the proportion ofcosts due to administrative expenses changes; 2) theunderwriting results of the workers’ compensationindustry, as measured by the overall operating ratio,changes; 3) insurers use a greater (or smaller) portionof their returns on investments, rather than premi-ums, to defray all or part of workers’ compensationcosts; 4) the expected number/severity of workplaceinjuries increases or decreases; or 5) the time lagbetween changes in employer costs (premiums collected) and changes in benefits paid varies.
The benefit/cost ratio in 2016 (0.64) was at its low-est point since 2006. The ratio increased by $0.17per $100 of covered payroll between 2006 and 2010,then declined by $0.16 between 2010 and 2016.These trends are typical of changes in workers’ com-pensation benefits and costs in response to changesin the economy. In periods of recession, employerpremiums decrease more rapidly than benefits(because premiums reflect expected future liabilitiesfor current injuries), so the benefit/cost ratio increas-es. In periods of expansion, the opposite is true.
Estimates of Employer Costs from Other SourcesThe Academy’s estimates compared to Bureau of LaborStatistics (BLS) estimates. The BLS publishes a quar-terly report on Employer Costs for EmployeeCompensation (DOL, 2018a). Estimates are derivedfrom a representative sample of establishments in theprivate sector, state and local governments. Costs arereported for five benefit categories (paid leave, supplemental pay, insurance, retirement and savings,and legally required benefits) per employee hour
worked. Workers’ compensation benefits are includ-ed within the legally required benefits category. Thepurpose of the BLS report is to provide average estimates of employer costs per hour worked, inclu-sive of wages, salaries, and employee benefits.44
The purpose of the Academy’s report is quite differ-ent. The BLS collects data on a broad range ofemployee benefits while the Academy focuses onworkers’ compensation. The Academy seeks to provide summary data on workers’ compensationbenefits paid to workers, and costs borne by employ-ers, at a state and national level. Our estimates of$61.9 billion in benefits paid and $96.5 billion incosts borne by employers in 2016 are the only datathat answer questions about aggregate benefits andcosts of workers’ compensation.
The Academy’s estimates compared to Oregon RateRanking estimates. The Oregon Workers’Compensation Rate Ranking study (OregonDepartment of Consumer and Business Services,2016), also provides estimates of employer costs forworkers’ compensation. The study, conducted on abiennial basis by the state of Oregon, comparesworkers’ compensation premium rates across states,for a standardized set of insurance classifications. Thestandardization is designed to factor out differencesin hazard mix (riskiness of industries) across states toprovide a measure of interstate differences in costsfor comparable risk distributions.45 The standardizedrates are based on the Oregon mix of insurance clas-sifications, hence the rankings could be somewhatdifferent if standardized based on another state.
Results of the Oregon study should not be comparedto the estimates of employer costs reported here.Interstate differences in employer costs that appear in the Academy data are influenced in part by thedifferent risk profiles presented by each state’s econo-my, as well as by variations in self-insurance acrossstates. The Oregon study reports rates for a constantset of risk classifications across states, and does notinclude self-insured employers.46
44 Burton (2015) uses data from the BLS survey to calculate employer costs for workers’ compensation per $100 of covered payroll andcompares it with the Academy’s national estimates. This series, which is now published by the National Institute of OccupationalSafety and Health (NIOSH), is derived from different methods of data collection compared to the Academy.
45 The Oregon estimates are standardized on 50 out of 450 rate classifications.
46 Burton (2013) and Manley (2013) provide more extended discussions of the differences between the measures of employer costsfrom the Academy and the Oregon study.

Direct and Indirect Costs to WorkersIn some states a portion of the costs of workers’compensation are explicitly paid by workers. InWashington, for example, workers contribute direct-ly to the insurance premiums for workers’compensation. In 2016, about 22 percent of thetotal costs of workers’ compensation in Washingtonwere paid directly by workers.47 In some states,workers’ pay a portion of special funds. For example,in Oregon, workers pay into the Workers’ BenefitFund. New Mexico has a quarterly assessment perworker. This report primarily covers the employerpaid portion of workers’ compensation. However,the workers’ compensation costs to employees inWashington are included in our estimates.
The costs to workers also include the portion of lostwages that are not replaced by workers’ compensa-tion benefits because of the formulae used to calculate benefits. Most workers’ compensationstatutes provide that weekly benefits are two-thirdsof pre-injury wages. However, the statutes alsoinclude weekly maximum and minimum benefitamounts, so that in the aggregate, the mean replacement rate is less than the two-thirds nominalreplacement rate. In addition, many states imposelimits on the duration of permanent partial disabilitybenefits (so that benefits may ceases while workersare still experiencing lost earnings from a workplaceinjury or illness). The duration limits further reducethe real replacement rate of cash benefits.48
In addition, there are costs borne by workers in theform of waiting periods. A waiting period is the timea worker must wait after experiencing a work-relatedinjury before he or she can begin collecting cash benefits. All but three states (Hawaii, Rhode Island,Oklahoma) have provisions to pay retroactive bene-fits to cover the waiting period for more serious(longer duration) lost-time injuries. In most statesthe retroactive period is between 7 and 21 days,however in Alaska and New Mexico the retroactiveperiod is 28 days, and in Nebraska it is 42 days (see
Appendix Table C). Waiting periods may result inlost wages or partial wage replacement if either 1) aworker is injured for fewer days than the waitingperiod and thus, does not qualify for cash benefits,or 2) a worker is out of work for more days than thewaiting period, but fewer days than the retroactiveperiod. In these cases, the uncompensated time lossattributable to the waiting period may constitutecosts to the worker. The financial costs of uncompensated waiting periods are not routinelytracked or reported by individual states and are,therefore, extremely difficult to collect and tabulate.
Some injured workers may incur costs because theyhave income that is not covered by workers’ compensation at all. For example, workers holdingmultiple jobs may not be compensated for lost earn-ings from a second or subsequent job. Many statesalso have rules excluding certain types of income(e.g. overtime or shift differentials) from coverage.Other costs to workers may include losses of fringebenefits that occur during periods of injury-relatedwork absence; loss of home production attributableto a work-related injury or illness; and loss ofemployer contributions to health insurance premiums (unless the worker is also on leave underthe Family and Medical Leave Act (FMLA), or theemployer’s insurance plan allows continued partici-pation during periods of injury-related workabsence). Refer to Leigh and Marcin (2012) for estimates of how the costs of work-related injuriesare allocated among insurers, government payers,and injured workers.
Disputed claims are responsible for significant coststo injured workers (and employers). Workers oftenhire attorneys to represent them in claim disputes;attorney fees can siphon off 20 percent or more ofthe indemnity payment to their clients. Insuredemployers are represented by their insurance carrierin legal proceedings, but time off work for managersand other witnesses to participate in hearings is acost borne by the employer.
46 NATIONAL ACADEMY OF SOCIAL INSURANCE
47 Employees contributed 24.7 percent of state fund premiums and paid half of the cost-of-living-adjustment premium for self-insuredemployers in 2016, which accounted for 10.6 percent of self-insured workers’ compensation costs.
48 Seabury et al. (2014) estimated earnings losses for New Mexico workers’ compensation claimants injured from 1994-2000. On average, workers lost 15% of earnings in the 10 years after injury; workers’ compensation replaced 16% of earnings losses for the average worker.

Finally, a large portion of costs borne by workers arefor work-related injuries and illnesses that neverresult in a workers’ compensation claim. In particular, occupational illnesses are frequently
uncompensated (see, e.g., Boden and Ozonoff,2008; Fan et al., 2006; Rosenman et al., 2006;Spieler, 2017).
Workers’ Compensation: Benefits, Costs, and Coverage • 47
Table 16Fatal Occupational Injuries and Fatal Injury Rates, All and Wage & Salary Workers, 1996-2016
Number of Fatal Injuries Fatal Injury Rates
Year All Wage & Salary Workers All Wage & Salary Workers
1996 6,112 4,905 4.8 4.2
1997 6,218 4,959 4.7 4.1
1998 6,026 4,782 4.5 3.9
1999 6,023 4,884 4.5 3.9
2000 5,915 4,731 4.3 3.7
2001a 5,900 4,770 4.3 3.8
2002 5,534 4,481 4.0 3.5
2003 5,575 4,405 4.0 3.4
2004 5,764 4,587 4.1 3.5
2005 5,734 4,592 4.0 3.5
2006 5,840 4,808 4.0 3.6
2007b 5,657 4,613 4.0 3.5
2008 5,214 4,183 3.7 3.2
2009 4,551 3,488 3.5 2.8
2010 4,690 3,651 3.6 3.0
2011 4,693 3,642 3.5 2.9
2012 4,628 3,571 3.4 2.8
2013 4,585 3,635 3.3 2.8
2014 4,821 3,728 3.4 2.8
2015 4,836 3,751 3.4 2.8
2016 5,190 4,098 3.6 3.0
Notes: Wage & Salary workers includes individuals employed in private industry or government, but excludes individuals whoare self-employed.
a 2001 Totals exclude fatalities from the September 11 terrorist attacks.
b Prior to 2007, fatal injury rates represented the number of fatal occupational injuries per 100,000 employed workers. Theserates measure the risk of fatal injury for those employed during a given period of time, regardless of hours worked. Startingin 2007, the BLS adopted a new methodology to calculate fataly injury rates based on the number of hours worked.Hours-based rates measure fatal injury risk based on the average employment and average hours worked during a given period of time. Hours-based fatal injury rates are considered more accurate and should not be directly compared to employment-based rates.
Source: U.S. Department of Labor (2017).

Incidence of WorkplaceInjuries and Workers’Compensation ClaimsIncidence of Work-Related Injuries Fatal Injuries. The BLS collects information onwork-related injuries that result in a worker’s deathfrom the National Census of Fatal OccupationalInjuries (DOL 2017). According to the BLS data,5,190 fatal work-related injuries occurred in 2016,an increase of 7.3 percent from 2015, and the highestnumber of fatalities recorded since 2008 (Table 16).Over the 20-year period from 1996-2016, however,total workplace fatalities declined by 15 percent, andthe fatality rate (controlling for employment)declined by approximately 25 percent.49
In 2016, the total number of fatalities included4,098 (79%) wage and salary workers and 1,092(21%) self-employed workers. Self-employed work-ers, who represented 10 to 12 percent of the U.S.workforce between 1996 and 2016 (Hipple andHammond, 2016), accounted for 18 to 22 percentof fatal workplace injuries (but would not be coveredby workers’ compensation).
The leading cause of work-related fatalities in 2016was transportation incidents, accounting for almosthalf (40.1%) of all fatal injuries. Other leading causes of fatalities were: falls, slips, and trips(16.4%); contact with objects and equipment(14.7%); exposure to harmful substances or environ-ments (10.0%); and injuries by persons or animals(8.7%). Homicides accounted for 417 (8.0%) work-related fatalities in 2016 (DOL, 2017).
Nonfatal injuries and illnesses. The BLS collectsinformation on reported nonfatal work-relatedinjuries or illnesses from a sample survey of employers (Survey of Occupational Injuries andIllnesses) (DOL 2017a). The survey reported 2.86million recordable nonfatal workplace injuries andillnesses in private industry workplaces in 2016, androughly one-third (892,270) involved days awayfrom work (DOL, 2017a). Both metrics declinedfrom 2015 – nonfatal workplace injuries and illnesses declined 1.7 percent and cases involvingdays away from work fell 1.1 percent – despite theincreases in employment.
The incidence rate per 100 FTE workers, whichcontrols for changes in employment levels, alsodeclined from 3.0 per 100 workers in 2015 to 2.9 in2016 (Table 17 and Figure 5). The decline in theincidence of all reported nonfatal occupationalinjuries and illnesses continues a trend that has persisted over the last two decades. Since 1996, theincidence rate has decreased 61 percent from 7.4 per100 FTE workers, to 2.9 per 100 in 2016. Since2002, after the Occupational Safety and HealthAdministration (OSHA) changed recordkeepingrequirements, the incidence rate per 100 FTE workers is down 45 percent.50
Injuries involving lost work time or work restrictions. Figure 5 and Table 17 show trends inthe incidence of reported work-related injuries and illnesses among private industry employers for casesinvolving either days away from work or injury-related job accommodations (job transfer or restrictions on work). These data also come from theBLS employer survey (DOL, 2017a).
The incidence of reported injuries or illnesses involving days away from work has also declined,down from 2.2 per 100 FTE workers in 1996 to 0.9per 100 in 2016, the second year in which the ratehas been below 1.0 per 100 workers across the entiretime-period (Table 17 and Figure 5). While the incidence rate of injuries or illnesses involving daysaway from work has declined steadily since 1996, the
48 NATIONAL ACADEMY OF SOCIAL INSURANCE
Annual work-related fatalities havedeclined 15 percent over the last
two decades, despite a slight uptick in recent years in response to the
expanding economy.
49 Prior to 2007, BLS fatal injury rates represented the number of fatal occupational injuries per 100,000 employed workers. Since2007, the incidence rate accounts for the total number of hours worked by all employees during the calendar year. Incidence rates arereported on a full-time equivalent basis (one FTE worker is defined as 2,000 hours worked per year). Hence, rates before and afterare 2007 are not strictly comparable, and the 25 percent reduction in fatalities is an approximation.
50 The break in the trend lines in 2002 represents a change in OSHA recordkeeping requirements in that year, indicating that the databefore and after 2002 may not be strictly comparable

incidence of cases resulting in job transfers or workrestrictions has fluctuated. The rate of cases with ajob transfer or restriction held consistent at about1.1 per 100 FTE workers until 2004, after whichtime the rate dropped 36 percent to reach 0.7 in2011, where it has remained until 2016.
Some of the changes in the 1990s, when the inci-dence of reported injuries involving work absencewas decreasing while the incidence of transfers/workrestrictions was increasing, may reflect a greater focuson employer accommodations that enable injuredworkers to return to modified work, until they are
Workers’ Compensation: Benefits, Costs, and Coverage • 49
Table 17Non-Fatal Occupational Injuries and Illnesses Among Private Industry Employers, 1996-2016
Number of Cases Incidence Rate (millions) (per 100 full-time workers)
Cases with Cases with Job Cases with Cases with JobAll Any Days Away Transfer or All Any Days Away Transfer or
Year Cases from Work Restriction Cases from Work Restriction
1995 6.6 2.0 0.9 8.1 2.5 1.1
1996 6.2 1.9 1.0 7.4 2.2 1.1
1997 6.1 1.8 1.0 7.1 2.1 1.2
1998 5.9 1.7 1.1 6.7 2.0 1.2
1999 5.7 1.7 1.0 6.3 1.9 1.2
2000 5.7 1.7 1.1 6.1 1.8 1.2
2001 5.2 1.5 1.0 5.7 1.7 1.1
2002* 4.7 1.4 1.1 5.3 1.6 1.2
2003 4.4 1.3 1.0 5.0 1.5 1.1
2004 4.3 1.3 1.0 4.8 1.4 1.1
2005 4.2 1.2 1.0 4.6 1.4 1.0
2006 4.1 1.2 0.9 4.4 1.3 1.0
2007 4.0 1.2 0.9 4.2 1.2 0.9
2008 3.7 1.1 0.8 3.9 1.1 0.9
2009 3.3 1.0 0.7 3.6 1.1 0.8
2010 3.1 0.9 0.7 3.5 1.1 0.8
2011 3.0 0.9 0.6 3.4 1.0 0.7
2012 3.0 0.9 0.7 3.4 1.0 0.7
2013 3.0 0.9 0.7 3.3 1.0 0.7
2014 3.0 0.9 0.7 3.2 1.0 0.7
2015 2.9 0.9 0.7 3.0 0.9 0.7
2016 2.9 0.9 0.7 2.9 0.9 0.7
* Data for 2002 and beyond are not strictly comparable to data from prior years because of changes in OSHA recordkeeping requirements.
Source: U.S. Department of Labor (2017a).

fully recovered and able to return to their pre-injuryjobs. The declining incidence rate of cases with jobtransfer or restriction in recent years is not necessarily indicative of less focus on employeraccommodations, because the overall incidence rateof cases with any days away from work is also declining. In fact, over time, the proportion of caseswith job transfers or restrictions is rising as a share oftotal cases with either any days away from work orwith a job transfer or restriction. This suggests thatinjured workers today have a higher probability ofbenefiting from employer accommodations compared to the past.
In 2016, the most common nonfatal workplaceinjuries and illnesses that resulted in days away from
work in private industry were: sprains, strains, andtears (36.3 per 10,000 FTE workers); soreness orpain, including back pain (16.8); cuts, lacerations,and punctures (9.3); bruises and contusions (8.8);and fractures (8.5) (DOL, 2017a). The three occupational groups with the highest incidence ofinjuries and illnesses involving days away from workin private industry were: transportation and materialmoving occupations (229.3 per 10,000 FTE); installation, maintenance, and repair occupations(175.9); and building and grounds cleaning andmaintenance occupations (169.2). Each of theseoccupational groups had incidence rates that weremore than 180 percent of the incidence rate (91.7per 10,000 FTE) for the private sector as a whole(DOL, 2017a).
50 NATIONAL ACADEMY OF SOCIAL INSURANCE
Figure 5Private Industry Occupational Injuries and Illnesses: Incidence Rates, 1980-2016
Notes: The break in the graph indicates that the data for 2003 and beyond are not strictly comparable to prior year data due to changes in OccupationalSafety & Health Administration recordkeeping requirements. Cases involving days away from work are cases requiring at least one day away from workwith or without days of job transfer or restriction. Job transfer or restriction cases occur when, as a result of a work-related injury or illness, an employeror health care professional keeps, or recommends keeping an employee from doing the routine functions of his or her job or from working the fullworkday that the employee would have been scheduled to work before the injury or illness occurred.
Source: U.S. Department of Labor (2017a).
0
0.5
1
1.5
2
2.5
3
3.5
4
1980
1981
1982
1983
1984
1985
1986
1987
1988
1989
1990
1991
1992
1993
1994
1995
1996
1997
1998
1999
2000
2001
2002
2003
2004
2005
2006
2007
2008
2009
2010
2011
2012
2013
2014
2015
2016
3.63.4
3.23.1
3.3 3.3 3.3 3.33.4 3.4 3.4
3.2
3.02.9
2.8
2.5
2.22.1
2.01.9
1.81.7
1.61.5
1.4 1.41.3
1.21.1 1.1 1.1
1.0 1.0 1.0 .9
.8
1.0
.7 .7 .7 .7.8
.9.91.0
1.11.11.11.21.21.21.2
1.11.11.0
.7.8
.9
.7.6
.5.4
.3.2
.3.3.3.3.3
1.0
.7
1.2.9
.7
Cases with Days Away from Work
Cases with Job Transfer or Restriction
Cases with Days Away from Work 2003 and later
Cases with Job Transfer or Restriction2003 and later

Workers’ Compensation: Benefits, Costs, and Coverage • 51
Incidence of Workers’ Compensation Claims The National Council on Compensation Insurancecollects information on the number of workers’
compensation claims paid by private carriers in 38states (NCCI, 2018a).51 The data, replicated inTable 18 for years 1996-2014 (the most recent year reported), show declining trends in the incidence of
Table 18Number of Workers' Compensation Claims Per 100,000 Insured Workers: Private Carriers in 38 Jurisdictions, 1996-2014
Medical MO as Temporary TTD as Permanent PPD asPolicy Only Percent Total Percent Partial PercentPeriod Total (MO) of Total (TTD) of Total (PPD) of Total
1996 6,837 5,281 77.2% 1,124 16.4% 419 6.1%
1997 6,725 5,230 77.8% 1,070 15.9% 414 6.2%
1998 6,474 5,035 77.8% 977 15.1% 452 7.0%
1999 6,446 5,047 78.3% 927 14.4% 461 7.2%
2000 6,003 4,685 78.0% 870 14.5% 437 7.3%
2001 5,510 4,277 77.6% 799 14.5% 423 7.7%
2002 5,239 4,036 77.0% 770 14.7% 422 8.1%
2003 4,901 3,747 76.5% 725 14.8% 423 8.6%
2004 4,728 3,635 76.9% 702 14.8% 385 8.1%
2005 4,571 3,514 76.9% 667 14.6% 383 8.4%
2006 4,376 3,351 76.6% 638 14.6% 381 8.7%
2007 4,076 3,107 76.2% 587 14.4% 375 9.2%
2008 3,615 2,730 75.5% 515 14.2% 363 10.0%
2009 3,452 2,659 77.0% 521 15.1% 357 10.3%
2010 3,492 2,621 75.1% 509 14.6% 358 10.3%
2011 3,412 2,565 75.2% 504 14.8% 339 9.9%
2012 3,278 2,464 75.2% 487 14.9% 323 9.9%
2013 3,191 2,390 74.9% 484 15.2% 312 9.8%
2014 3,076 2,308 75.0% 470 15.3% 293 9.5%
Percent change, 1996-2014
-55.0 -56.3 -58.2 -30.1
Source: National Council on Compensation Insurance, 1997-2018, Exhibit XII, Annual Statistical Bulletin. The most recent dataavailable is 2014.
51 NCCI measures the frequency of lost time claims for injuries occurring in the accident year per $1 million of earned premium inthat year, adjusted by state for changes in average weekly wages.

claims similar to the declining trends in incidence ofwork-related injuries reported by the BLS.
According to the NCCI data, the number of workers’ compensation claims covered by private-insured employers declined by 55.0 percent between1996 and 2014 (compared to the BLS estimate of a51.9 percent decrease in injuries and illnesses for private industry employers over the same time-period). The NCCI data indicate that the number oftemporary total disability claims from private industry declined by 58.2 percent between 1996 and2014 (compared to the BLS estimate of a 52.1 percent decline in injuries and illnesses involvingdays away from work for private industry employers)(Tables 17 & 18).52
The reader is cautioned that injury rates which havebeen extrapolated from workers’ compensationclaims data may be biased, because key stakeholdershave incentives to under-report or over-report occu-pational injuries and illnesses.53 There are manyreasons to suspect under-reporting on the part ofworkers, employers, and/or medical providers.Workers may not report injuries because: they do notknow an injury is covered by workers’ compensa-tion; they believe filing for benefits is too time-consuming, difficult, or stressful; they believe theinjury is something to be expected as part of theirjob; or they fear employer retaliation (Galizzi et al.,2010; Pransky et al., 1999; Strunin and Boden,2004). Employers may not report injuries because:their recordkeeping is faulty; they want to maintain asuperior safety record to protect their experience rate;or they are unaware that an injury is covered byworkers’ compensation (Azaroff et al., 2002; Lashuay
and Harrison, 2006). Medical providers may fail toreport injuries and illnesses that take time to develop, such as carpal tunnel syndrome, noise-induced hearing loss, and lung diseases like silicosis,because they are unaware of a workplace connection.54
There are also incentives for workers and/or medicalproviders to over-report injuries or illnesses as work-related. The 100 percent coverage of medicalcosts under workers’ compensation creates incentivesfor both groups to identify a work-related causewhen the etiology of an injury or illness is uncertain.Workers have incentives to report an injury as workrelated because there are no deductibles or co-payments for health care. They may also receivemore generous cash benefits from workers’ compensation than from a private disability plan orstate unemployment insurance.
With respect to providers, there is evidence that soft-tissue conditions are more likely to be classifiedas work-related in states with higher workers’ compensation physician reimbursement rates(Fomenko and Gruber, 2016). The trend towardscapitated payment systems in health care also influences medical provider incentives. One studyfound that an increase in capitation payments undergroup health plans led to an increase in the numberof soft-tissue conditions that were labeled work-related and paid by workers’ compensation (Victor etal., 2015).
52 NATIONAL ACADEMY OF SOCIAL INSURANCE
52 While the trends in private sector injury or illness claims from the BLS and NCCI are similar across time, there are a number of rea-sons why they may differ. First, there are discrepancies in the classification of claims. In workers’ compensation, there is generally athree to seven-day waiting period before a claim is recorded (and would be reported in NCCI data) whereas any case in which aworker misses at least one day away from work is classified as a “days away from work” (DAFW) case by OSHA and reflected as suchin BLS published data. Second, the BLS and NCCI cover different jurisdictions – the BLS covers injuries and illnesses across the en-tire U.S. whereas the NCCI only records workers’ compensation claims for private insurers and competitive state funds in 38 juris-dictions. NCCI does not record any workers’ compensation claims that occurred at self-insured firms. Third, there is evidence thatsome employers do not comply with OSHA recordkeeping or Survey of Occupational Injury and Illness reporting instructions, leading to underreporting of workers’ compensation eligible claims in BLS data (Rappin et al., 2016).
53 See Azaroff et al. (2002), Spieler and Burton (2012), and OSHA (2015) for reviews of studies on the reporting of work-related injuries and illnesses.
54 Studies have typically shown much less reporting of these types of conditions as work-related than is suggested by their prevalence inmedical data (Stanbury et al., 1995; Biddle et al., 1998; Morse et al., 1998; Milton et al., 1998; DOL, 2008). According to a GAOreport, some health care providers say they have been pressured to provide less treatment in order to avoid the need to report an in-jury or illness as work-related (GAO, 2009).

Workers’ Compensation: Benefits, Costs, and Coverage • 53
Addendum Other Disability Benefit Programs The primary purpose of this report is to describetrends in workers’ compensation benefits, costs, andcoverage with respect to two key stakeholder groups:the injured workers who receive benefits and theemployers who pay for them. Workers’ compensa-tion cash benefits, however, can be supplemented byother sources of income for injured workers. Thisaddendum describes the major disability supportprograms that interact with workers’ compensation,namely: temporary sick leave, short- and long-termdisability benefits, retirement benefits, SocialSecurity Disability Insurance, and Medicare.
Sick leave. Sick leave is a common form of wagereplacement for short-term absences from work dueto illnesses or injuries unrelated to work. About 64percent of all private-sector employees had access tosome type of paid sick leave in 2016, providedthrough their employer or a private short-term disability plan (DOL, 2017c). Sick leave typicallypays 100 percent of wages for a number of daysdepending on the worker’s job tenure and hoursworked. Sick leave can be used to cover wage lossesfor the waiting period (three to seven days) of aworkers’ compensation disability claim.
Paid sick leave is often utilized to cover workabsences associated with minor work-related injuries.Compared to filing a claim for workers’ compensa-tion temporary disability benefits, sick leave isadministratively easier for workers to access andemployers to administer. For employers, the workers’compensation option has reporting requirements andnegative impacts on premium rates that are not partof paid sick leave. For workers, the decision to reportand pursue a workers’ compensation claim involves alower wage replacement rate, and a minimum three-day wage penalty (unless they also apply forpaid sick leave).55 All these factors provide incentivesfor employers and injured workers to rely on otherprograms (such as health insurance and paid sickleave) for compensation.
Short-term disability benefits. Five states(California, Hawaii, New Jersey, New York, and
Rhode Island) have Temporary Disability Insurance(TDI) programs, also known as State DisabilityInsurance (SDI) or paid medical leave, that provideshort- to medium-term disability insurance foremployees. In these five states, TDI is a statutoryprogram that provides partial wage replacement forworkers taking time off to recover from a non-work-related injury or illness, or from pregnancy(Glynn et al., 2017). Some private employers offershort-term disability insurance to their workers evenin states where such insurance is not required. About40 percent of private industry workers had access toshort-term disability insurance in 2016, and 39 percent were covered (DOL, 2017c). Typically,workers must have a specified amount of pastemployment or earnings to qualify for benefits, andbenefits replace about half of the worker’s prior earnings. In general, workers receiving workers’ compensation benefits are not eligible to simultaneously receive these types of short-term disability benefits.
There are also short-term disability plans that coverperiods of work absence longer than the availablepaid sick leave, but shorter than required to qualifyfor long-term disability benefits. In addition, thereare state and municipal short-term disability benefitprograms for public employees (particularly forpolice and firefighters) that coordinate with workers’compensation programs or, in some cases, are analternative to workers’ compensation.
Long-term disability benefits. Long-term disabilityinsurance covered 32 percent of private-sectoremployees in 2016 (DOL, 2017c). Such coverage ismost common among relatively high-paying management, professional, and related occupations.About 56 percent of workers in management andprofessional-related occupations were covered bylong-term disability plans as of 2016, compared to 31 percent of workers in sales and office occupations, and 11 percent of workers in serviceoccupations (DOL, 2017c). Long-term disabilityinsurance is also sold in individual policies, typicallyto high-earning professionals. Individual policies arenot included in the coverage statistics reported to theDOL.
55 Workers’ compensation typically replaces two-thirds of a worker’s pre-injury wages before tax up to a maximum, but these benefitsare not taxed. A useful wage-replacement comparison is workers’ compensation benefits and post-tax wages.

Long-term disability benefits are usually paid after awaiting period of three to six months or after short-term disability benefits end. Long-term disabilityinsurance is generally designed to replace 60 percentof earnings, although replacement rates of 50 or 66percent are also common. Almost all long-term disability insurance is coordinated with SocialSecurity Disability Insurance (SSDI) and workers’compensation. That is, private long-term disabilitybenefits are reduced dollar for dollar by the amountof Social Security or workers’ compensation benefitsreceived. If Social Security benefits replace 40 percent of a worker’s prior earnings, for example, along-term disability benefit that replaces 60 percentof earnings, would pay the balance to achieve a 60percent wage replacement.
Retirement benefits. Retirement benefits may alsobe available to workers who become disabled becauseof a work-related injury or illness. Most defined-benefit pension plans have some disability provision;benefits may be available at the time of disability ormay continue to accrue until retirement age.Defined-contribution pension plans will often makefunds in an employee’s account available withoutpenalty if the worker becomes disabled, but theseplans do not have the insurance features of defined-benefit pensions or disability insurance.
Federal disability programs. Social SecurityDisability Insurance (SSDI) and Medicare providecash and medical benefits, respectively, to workerswho become disabled and unable to work prior tonormal retirement age. SSDI benefits are available toworkers with disabilities whether or not the disabilityresults from a work-related injury, but the eligibilityrules for SSDI differ from the rules for workers’compensation.
Workers are eligible for workers’ compensation benefits from their first day of employment, whileeligibility for SSDI requires workers to have a historyof contributions to the Social Security system.56
Workers’ compensation cash benefits begin after afew days of work absence, while SSDI benefits beginonly after a five-month waiting period. Workers’compensation provides benefits for both short- andlong-term disabilities and for partial as well as totaldisabilities. SSDI benefits are paid only to workerswho have long-term impairments that preclude gainful employment that is suitable for the workerby virtue of their training and experience.
Medicare pays health care costs for persons whoreceive SSDI benefits, after an additional 24-monthwaiting period (or 29 months after the onset of disability). Medicare covers all medical conditions,whether or not the primary disability is work-related.In 2016, workers’ compensation benefits paid (cashbenefits plus medical payments) totaled $61.9 billion. SSDI paid $142.7 billion in wage replace-ment benefits to disabled persons and theirdependents, and Medicare paid $96.3 billion formedical care for disabled persons under age 65, for atotal of $239.0 billion (SSA, 2017b; CMS, 2018).
Dual beneficiaries. If a worker becomes eligible forboth SSDI and workers’ compensation cash benefits,one or both programs will reduce benefits to avoidmaking excessive payments relative to the worker’spast earnings.57 The Social Security Amendments of1965 require that SSDI benefits be reduced (or “off-set”) such that the combined total of workers’compensation and SSDI benefits does not exceed 80percent of the worker’s prior earnings.58 The offsetprovision affects 35 states; 15 states which had
54 NATIONAL ACADEMY OF SOCIAL INSURANCE
56 To qualify for SSDI, individuals must meet two different earnings tests: 1) a recent work test, based on age at the time of disability;and 2) a duration of work test. Generally, workers must have earned at least 20 work credits in the 10 years immediately before becoming disabled, although younger workers may qualify with fewer credits.
57 The interaction between workers’ compensation and SSDI is complex. Studies have investigated the impact of changes to workers’compensation programs on SSDI outcomes using aggregate data and found mixed results (e.g. Guo and Burton, 2012; McInerneyand Simon, 2012). While the potential impact and magnitude of changes in workers’ compensation on SSDI is unclear, studiesusing individual-level data have found evidence that work-related injuries are a significant source of disability later in life (e.g. Revilleand Schoeni, 2004; O’Leary et al., 2012). Burton and Guo (2016) examine the relationship between SSDI and workers’ compensa-tion programs in detail and provide a number of policy options aimed at improving the interaction between the two programs.
58 The cap remains at 80 percent of the worker’s average earnings before disability except that, in the relatively few cases when SocialSecurity disability benefits for the worker and dependents exceed 80 percent of prior earnings, the benefits are not reduced below theSocial Security amount. This cap also applies to coordination between SSDI and other public disability benefits derived from jobsnot covered by Social Security, such as state or local government jobs where the governmental employer has chosen not to cover itsemployees under Social Security. The portion of workers’ compensation benefits that offset (reduce) SSDI benefits are subject to fed-eral income tax (IRC section 86(d)(3)).

established reverse-offset laws prior to the 1965 legis-lation received exemptions.59 In reverse-offset states,workers’ compensation benefits are reduced (or “off-set”) by SSDI benefits.
According to the Medicare Secondary Payer Act,workers’ compensation is the primary payer for illnesses and injuries covered under workers’ compensation law. Medicare is the secondary payer
for medical costs after the workers’ compensationinsurer’s obligation is met.
As of December 2016, about 8.8 million workerswith disabilities and 1.8 million dependents receivedSSDI benefits (SSA, 2018a) (Table 19). About594,000 (5.6%) of these individuals were dual beneficiaries of workers’ compensation or other public disability benefit (PDB) programs in 2016.60
Of these, about 98,000 persons (0.9% of total
Workers’ Compensation: Benefits, Costs, and Coverage • 55
59 States with reverse offset laws for some or all types of workers’ compensation benefits are Alaska, California, Colorado, Florida,Louisiana, Minnesota, Montana, Nevada, New Jersey, New York, North Dakota, Ohio, Oregon, Washington, and Wisconsin. Cali-fornia’s reverse offset laws only apply to workers’ compensation benefits paid through the Subsequent Injuries Fund and IndustrialDisability Leave. In addition, there are reverse offset rules for other types of public disability benefits in Hawaii, Illinois, New Jersey,and New York (SSA Program Operations Manual System, DI 52105.001). Legislation in 1981 eliminated the states’ option to adoptreverse offset laws.
60 In general, PDBs refer to disability benefits earned in state, local, or federal government employment that are not covered by SocialSecurity.
Table 19Dual Eligible Individuals: Social Security Disability Insurance (SSDI) Beneficiaries with Workers' Compensation (WC) or Public Disability Benefits (PDB), 2016
Total Workers DependentsType of Case Number Percent Number Percent Number Percent
All Disability Insurance Beneficiaries 10,610,070 100.0 8,808,738 100.0 1,801,334 100.0
Total Dual Eligibles 1,212,604 11.7 997,113 11.3 215,491 12.0
Currently Receiving SSDI and WC or PDB 593,606 5.6 490,412 5.6 103,194 5.7
SSDI Reduced by Cap 97,674 0.9 74,167 0.8 23,507 1.3
SSDI Not Reduced by Cap 378,779 3.6 318,604 3.6 60,175 3.3
Reverse Jurisdiction 47,244 0.4 39,132 0.4 8,112 0.5
Pending Decision on WC or PDB 69,909 0.7 58,509 0.7 11,400 0.6
SSDI Previously Offset by WC or PDB 618,998 5.8 506,701 5.8 112,297 6.2
Notes: Social Security disability benefits are offset against workers’ compensation and certain other public disability benefits(PDB) in most states. In general, PDBs refer to disability benefits earned in state, local, or federal government employment thatare not covered by Social Security. There are 15 states with reverse offset laws where SSDI is the first payer for some or all typesof workers' compensation benefits. The states are Alaska, California, Colorado, Florida, Louisiana, Minnesota, Montana,Nevada, New Jersey, New York, North Dakota, Ohio, Oregon, Washington, and Wisconsin. California's reverse offset lawsonly apply to workers' compensation benefits paid through the Subsequent Injuries' Fund and Industrial Disability Leave.SSDI previously offset by WC or PDB consists of the entire universe of beneficiaries who are currently receiving SSDI benefitsthat at one point had their SSDI benefits offset by WC or PDB, but no longer do.
Source: Social Security Administration, Master Beneficiary Record, 100 percent data, and Social Security Administration Workers' Compensation and Public Disability Benefit file, 100 percent data (SSA, 2017a).

beneficiaries; 16.5% of beneficiaries currently receiving SSDI and WC or PDB) were currentlyreceiving reduced SSDI benefits because of the offsetprovision.
Between 2006 and 2016, the total number of dis-abled workers receiving SSDI benefits increased 29.4percent, though there was a 1.6 percent decline from2014 to 2016 (Figure 6). Over the entire time-period, the proportion of workers with disabilitiesreceiving SSDI benefits with a current connection toWC or other PDB programs fell 3 percentage pointsto 5.6 percent of all SSDI recipients in 2016. Thedecline in the proportion of SSDI recipients with acurrent connection to WC or PDB is a result of the increasing number of SSDI recipients and a declinein the absolute number of workers with a currentconnection to WC or PDB, which fell 15.7 percent
over the time-period. The proportion of SSDI recipients with a previous connection to WC orPDB also declined between 2006 and 2016, but thisis due to the increase in total SSDI recipients – theabsolute number of SSDI recipients with a previousconnection to WC or PDB increased 4.2 percentover the time-period.
Benefits Incurred vs. Benefits Paid The Academy’s estimates of workers’ compensationbenefits in this report reflect amounts paid for work-related injuries and illnesses within a calendaryear, regardless of when those injuries occurred. Adifferent metric, accident year incurred losses (oraccident year incurred benefits), measures the totalexpected benefits associated with injuries that occurin a particular year, regardless of whether the benefitsare paid in that year or future years.61
56 NATIONAL ACADEMY OF SOCIAL INSURANCE
Figure 6Proportion of Worker SSDI Beneficiaries with Connection to Workers' Compensation or Public Disabilty Benefits, 2006-2016
0%
5%
10%
15%
20%
25%
30%
2006 2007 2008 2009 2010 2011 2012 2013 2014 2015 2016
6,806,9187,098,723
7,426,6917,788,013
8,203,9518,575,544
8,826,591 8,940,950 8,954,518 8,909,430 8,808,736
0
2,000,000
4,000,000
6,000,000
8,000,000
10,000,000
Per
cen
t C
on
nec
tio
n w
ith
WC
/PD
BS
SD
I Ben
eficiaries
Current Connection with WC/PDB Previous Connection with WC/PDB SSDI Beneficiaries
7.2% 7.0% 6.9% 6.7%6.4%
6.3%6.2% 6.1% 5.9% 5.8% 5.8%
8.6% 8.3% 7.9% 7.6% 7.1% 6.7% 6.3% 6.0% 5.9% 5.7% 5.6%
61 A more detailed discussion of these measures is included in the Glossary and in Thomason et al. (2001).

For the purpose of setting insurance premiums, it isvital to estimate the incurred benefits the premiumsare required to cover. When an employer purchasesworkers’ compensation insurance for a particularperiod, the premiums are designed to cover currentand future liabilities for all injuries that occur duringthe period covered by the policy. NCCI and staterating bureaus use trends in accident year (or policyyear) incurred benefits to help determine their rates.
Benefits incurred are also more appropriate for poli-cy purposes than benefits paid. For example, if astate lowers benefits or tightens compensability rulesfor new injuries as of a given date, benefits would beexpected to decline in the future. Similarly, if a stateraises benefits or expands the range of compensableinjuries, benefits would be expected to increase inthe future. The policy change will show up immedi-ately in estimates of incurred benefits but will beobserved more slowly in measures of paid benefits,because paid benefits also include benefits forinjuries occurring in years prior to (and unaffectedby) the policy change.
Despite the advantages of tracking benefits incurred,there are a number of disadvantages. It takes manyyears before the estimated losses associated withinjuries occurring in a given year are reliable and stable, whereas benefits paid are known and fixed forany given reporting period. Further, using incurredloss data instead of paid losses may have some advantages for setting actuarial reserves and rate making, but it has the disadvantage of not beingreadily available from state agencies, self-insuredemployers, many state funds, or from federal workers’ compensation programs. Nor are incurredlosses from different sources useful to aggregate without an understanding of how the incurred losseswere estimated by each source. Finally, data onincurred benefits do not include benefits paid byemployers under large deductible policies, benefitspaid by employers insured under monopolistic statefunds, or benefits paid in states with a rating bureau.For these reasons, the Academy relies on calendaryear benefits paid to provide the most accurate andconsistent estimates of state-by-state and nationalworkers’ compensation payments.
Workers’ Compensation: Benefits, Costs, and Coverage • 57
58 NATIONAL ACADEMY OF SOCIAL INSURANCE
Accident Year: The year in which an injuryoccurred, or the year of onset or manifestation of anillness.
Accident Year Incurred Benefits: Benefits associatedwith all injuries and illnesses occurring in the acci-dent year, regardless of the years in which thebenefits are paid. (Also known as calendar accidentyear incurred benefits.)
Black Lung Benefits: See Coal Mine Health andSafety Act.
BLS: The Bureau of Labor Statistics (BLS) in theU.S. Department of Labor is a statistical agency thatcollects, processes, analyzes, and disseminates statisti-cal data about the labor market. For moreinformation, visit www.bls.gov.
Calendar Year Paid Benefits: Benefits paid during acalendar year regardless of when the injury or illnessoccurred.
Coal Mine Health and Safety Act: The Coal MineHealth and Safety Act (Public Law 91-173) wasenacted in 1969 and provides black lung benefits tocoal miners disabled as a result of exposure to coaldust and to their survivors.
Combined Ratio After Dividends. A measure ofthe profitability of an insurer. The ratio equals thesum of losses, loss adjustment expenses, underwrit-ing expenses, and dividends to policyholders, dividedby net premiums. The ratio is expressed as a percent.(See: Overall Operating Ratio.)
Compromise and Release (C&R) Agreement: Anagreement to settle a workers’ compensation case.State laws vary as to the nature of these releases, butthere are typically three elements to a C&R agree-ment: a compromise between the worker’s claim andthe employer’s offer concerning the amount of cashand/or medical benefits to be paid; the payment ofthe compromised amount in a fixed amount (commonly called a “lump sum” but which may ormay not be paid to the claimant at once); and therelease of the employer from further liability. Unlessit was “full and final”, the release may allow for
reopening medical or indemnity payments underspecific conditions.
Covered Employment: The Academy’s coveragedata include jobs in firms that are required to becovered by workers’ compensation programs. A moreinclusive measure of covered employment would alsoinclude jobs in firms that voluntarily elect coverage.
Deductibles: Under deductible policies written byprivate carriers or state funds, the insurer is responsible for paying all of the workers’ compensation benefits, but employers are responsiblefor reimbursing the insurer for those benefits up to aspecified deductible amount. Deductibles may bewritten into an insurance policy on a per injurybasis, or an aggregate basis, or a combination of aper injury basis with an aggregate cap.
Defense Base Act: The Defense Base Act (DBA-42U.S.C. §§ 1651-54) is a federal law extending theLongshore and Harbor Workers’ Compensation Act(33 U.S.C. §§ 901-50), passed in 1941 and amended later, to persons: (1) employed by privateemployers at U.S. defense bases overseas; (2)employed under a public work contract with theUnited States performed outside the U.S.; (3)employed under a contract with the United States,for work performed outside the U.S. under theForeign Assistance Act; or (4) employed by anAmerican contractor providing welfare or similar services outside the United States for the benefit ofthe Armed Services.
DI: Disability insurance from the Social Securityprogram. See: SSDI.
Disability: A loss of functional capacity associatedwith a health condition.
Experience Rating: An insurance policy is experi-ence rated if insurance premiums reflect the relativerisk of loss of the insured. There are two levels ofexperience rating in workers’ compensation. Manualrates (or pure premiums) are developed for eachinsurance classification (category of work) in a statebased on previous benefit payments by all firmsoperating in that classification. Firm-level experiencerating compares an employer’s loss experience to the
Glossary
Workers’ Compensation: Benefits, Costs, and Coverage • 59
average losses of other firms in the same insuranceclassification. An experience modification is devel-oped and applied to the premium of firms which arelarge enough for the insured’s experience to be a reli-able indicator of benefit costs in the future.
FECA: The Federal Employees’ Compensation Act(FECA) Public Law (103-3 or 5 U.S.C. §§ 8101-52), enacted in 1916, provides workers’compensation coverage to U.S. federal civilian andpostal workers around the world for work-relatedinjuries and occupational diseases.
FELA: The Federal Employers’ Liability Act (FELA45 U.S.C. § 51 et seq.), enacted in 1908, gives railroad workers engaged in interstate commerce anaction in negligence against their employer in theevent of work-related injuries or occupational diseases.
Foreign Assistance Act: An act to promote the foreign policy, security, and general welfare of theUnited States by assisting peoples of the world intheir efforts toward economic development andinternal and external security, and for other purposes.
Guaranty Fund: A special state-based fund thatassumes all or part of the liability for workers’ compensation benefits provided to a worker whenthe employer or insurance carrier legally responsiblefor those benefits is unable to make payments.Guaranty funds for private insurance carriers (allstates with private carriers have these) and for self-insuring employers (less than half the states havethese) are always separate funds. Both types arefinanced by assessments on insurers or self-insuredemployers, respectively.
Group Self-Insurance: A special form of self-insurance that is available to groups of employers,which is only available in a little over half of thestates. This is similar to a mutual insurance companyand, as such, is closely regulated.
IAIABC: The International Association of IndustrialAccident Boards and Commissions (IAIABC) is theorganization representing workers’ compensationagencies in the United States, Canada, and othernations and territories. For more information, visitwww.iaiabc.org.
Incurred Losses (or Incurred Benefits): Benefitspaid to the valuation date plus liabilities for futurebenefits for injuries that occurred in a specified period, such as an accident year.
Jones Act: The Jones Act is Section 27 of theMerchant Marine Act (P.L. 66-261), passed in 1920,which extends the provision of the FederalEmployers’ Liability Act to qualifying sailors (indi-viduals assigned to a vessel or fleet that operates innavigable waters, meaning waterways capable ofbeing used for interstate or foreign commerce).
LHWCA: The Longshore and Harbor Workers’Compensation Act (LHWCA 33 U.S.C. §§ 901-50), enacted in 1927, requires employers to provideworkers’ compensation protection for longshore, harbor, and other maritime workers. See: DefenseBase Act (DBA).
Loss Adjustment Expenses: Salaries and fees paid toinsurance adjusters, as well as other expensesincurred from adjusting claims.
Losses: A flexible term that can be applied in severalways: paid benefits, incurred benefits, fully devel-oped benefits, and possibly including incurred butnot reported benefits.
Manual Equivalent Premium (MEP): A firm’s payroll multiplied by the approved rate for the firm’sinsurance classification code. The manual equivalentpremium represents an employer’s costs for workers’compensation without adjustment for schedule rating, deductible credits, or experience rating.
NAIC: The National Association of InsuranceCommissioners (NAIC) is the national organizationof chief insurance regulators in each state, theDistrict of Columbia, and five U.S. territories. Itassists state insurance regulators, individually andcollectively, to achieve insurance regulatory goals. Formore information, visit www.naic.org.
NCCI: The National Council on CompensationInsurance, Inc. (NCCI) is a national organizationthat assists private carriers and insurance commissioners in collecting statistical informationfor pricing workers’ compensation coverage in 38states. For more information, visit www.ncci.com.

60 NATIONAL ACADEMY OF SOCIAL INSURANCE
No-fault: A strict liability rule that, in workers’ com-pensation, holds the employer fully liable for medicalcosts and compensation for injury-related workabsences, without proof of negligence or culpability.
Overall Operating Ratio: The combined ratio afterdividends minus net investment gain/loss and otherincome, as a percent of net premium.
OSHA: The OSH Act created the OccupationalSafety and Health Administration (OSHA) withinthe U.S. Department of Labor. OSHA is responsiblefor promulgating standards, inspecting workplacesfor compliance, and prosecuting violations.
OSH Act: The Occupational Safety and Health Act(OSH Act Public Law 91-596) is a federal law enact-ed in 1970 that establishes and enforces workplacesafety and health rules for nearly all private-sectoremployers.
Paid Losses (or Paid Benefits): Benefits paid duringa specified period, such as a calendar year, regardlessof when the injury or disease occurred.
Permanent Partial Disability (PPD): A disabilitythat, although permanent, does not completely limita person’s ability to work. A statutory benefit awardis paid for qualifying injuries.
Permanent Total Disability (PTD): A permanentdisability that is deemed by law to preclude materiallevels of employment.
Residual Market: The mechanism used to provideinsurance for employers who are unable to purchaseinsurance in the voluntary private market. In somejurisdictions, the state fund is the “insurer of lastresort” and serves the function of the residual market. In others, there is a separate pool financedby assessments of private insurers, which is alsoknown as an assigned risk pool.
Schedule Rating: A debit and credit plan that recog-nizes variations in the hazard-causing features of anindividual risk.
Second Injury Fund: A special fund that assumes allor part of the liability for workers’ compensationbenefits provided to a worker because of the com-bined effects of a work-related injury or disease witha preexisting medical condition. The second injury
fund pays costs associated with the prior conditionto encourage employers to hire injured workers whowant to return to work.
Self-insurance: A state-regulated arrangement inwhich the employer assumes responsibility for thepayment of workers’ compensation benefits to thefirm’s employees with workplace injuries or diseases.Most employers do not self-insure but instead purchase workers’ compensation insurance from aprivate carrier or state fund.
SSA: The U.S. Social Security Administration (SSA)administers the Social Security program, which paysretirement, disability, and survivors’ benefits to workers and their families, and the federalSupplemental Security Income program, which provides income support benefits to low-income,aged, and disabled individuals. For more information, visit www.ssa.gov.
SSDI: Social Security Disability Insurance (SSDI)pays benefits to insured workers who sustain severe,long-term work disabilities due to any cause. See:DI.
Temporary Partial Disability (TPD): A temporarydisability that does not completely limit a person’sability to work.
Temporary Total Disability (TTD): A disabilitythat temporarily precludes a person from performingthe pre-injury job or another job at the employerthat the worker could have performed prior to theinjury.
Unemployment Insurance (UI): Federal/state program that provides cash benefits to workers whobecome unemployed through no fault of their ownand who meet certain eligibility criteria set by thestates.
U.S. DOL: The U.S. Department of Labor administers a variety of federal labor laws includingthose that guarantee workers’ rights to safe andhealthy working conditions, a minimum hourlywage and overtime pay, freedom from employmentdiscrimination, unemployment insurance, and otherincome support. For more information, visitwww.dol.gov.

Workers’ Compensation: Benefits, Costs, and Coverage • 61
WC: Workers’ compensation. A form of governmentinsurance, mandated for most employers, that provides statutory benefits for covered work-relatedinjuries and illnesses.
WCRI: The Workers’ Compensation ResearchInstitute (WCRI) is a research organization providing information about public policy issuesinvolving workers’ compensation systems. For moreinformation, visit www.wcrinet.org
Work-Related Injury/Illness: An injury or illnesscaused by activities related to the workplace. Theusual legal test for “work-related” is “arising out ofand in the course of employment.” However, thedefinition of a work-related injury or disease that iscompensable under a state’s workers’ compensationprogram can be quite complex and varies acrossstates.

62 NATIONAL ACADEMY OF SOCIAL INSURANCE

The basis for the NASI estimates of workers’ com-pensation coverage is the number of jobs in eachstate which are covered by unemployment insurance(UI) (DOL, 2017b). Jobs which are not required tobe covered by UI include: some farm and domesticjobs which pay less than a threshold amount; somestate and local jobs (such as elected positions); jobsin some nonprofit organizations (such as religiousorganizations, for whom coverage is optional insome states); jobs held by self-employed persons orunpaid family workers; and railroad jobs (which arecovered under a separate unemployment insuranceprogram.) Railroad jobs are also covered under a separate workers’ compensation program (seeAppendix B).
All U.S. employers who are required to pay unemployment taxes must report quarterly data totheir state employment security agencies regardingtheir jobs and payroll covered by unemploymentinsurance. These employer reports are the basis forstatistical reports prepared by the U.S. Bureau ofLabor Statistics, known as the ES-202 data. Thesedata are a census of the universe of U.S. jobs whichare covered by unemployment insurance (DOL,2016b).
Key assumptions underlying the Academy’s estimatesof workers’ compensation coverage, shown in TableA.1, are:
(1) Jobs which are not reported as covered by UI areassumed not to be covered by workers’ compensation.
(2) Jobs which are reported to be covered by UI areassumed to be covered by workers’ compensationas well, except in the following cases:
(a) Jobs in small firms (which are required to becovered by unemployment insurance in everystate) are assumed to be not covered byworkers’ compensation if the state law
exempts small firms from mandatory workers’ compensation coverage.
(b) Jobs in agricultural industries (which may ormay not be covered by UI) are assumed to benot covered by workers’ compensation if thestate law exempts agricultural employersfrom mandatory workers’ compensation coverage.
(c) Jobs in Texas, where workers’ compensationcoverage is elective for almost all employers,require a different calculation. For Texas, webase our coverage estimates on periodic sur-veys conducted by the Texas Department ofInsurance Workers’ Compensation Researchand Evaluation Group (TDI, 2016).
(3) All federal jobs are covered by workers’ compensation, regardless of the state in whichthey are located.
Small Firm Exemptions. Private firms with fewerthan three employees are exempt from mandatoryworkers’ compensation coverage in eight states:Arkansas, Georgia, Michigan, New Mexico, NorthCarolina, Virginia, West Virginia, and Wisconsin.Firms with fewer than four employees are exempt intwo states: Florida and South Carolina. Firms withfewer than five employees are exempt from mandatorycoverage in five states: Alabama, Mississippi,Missouri, Oklahoma, and Tennessee (IAIABC-WCRI, 2016). The Academy assumes that jobs arenot covered by workers’ compensation if they are ina small firm that meets the specific exemptionrequirements in one of these states.
To estimate the number of jobs affected by the smallfirm exemptions, we use data from the U.S. CensusStatistics of Small Businesses (SUSB). The SUSB isan annual data series that reports national and state-level employment by enterprise size and industry.62
Workers’ Compensation: Benefits, Costs, and Coverage • 63
Appendix A: Coverage Estimates
62 Last year’s report relied on the Census County Business Patterns (CBP) to estimate small firm employment. However, the CBP onlymeasures employment at establishments, which refers to a single physical location where business is conducted. The SUSB publishesdata on the number of establishments and the number of firms, which is a more appropriate measure for our purposes because workers’ compensation coverage exemptions are based on the size of the firm, not the size of a particular establishment. The differ-ences in employment between the SUSB and the CBP are small. Previous estimates were updated using the SUSB for consistency.

These data identify the number of jobs in firms withfewer than five employees.
For the five states with workers’ compensationexemptions for firms with fewer than five employees,we directly apply the fraction of jobs in these smallfirms as reported by the SUSB to the number of UI-covered jobs to calculate the number of jobs affectedby the exemption. In 2015 (the most recent year thedata are available), these proportions were: Alabama,4.4 percent; Mississippi, 4.7 percent; Missouri, 4.9percent; Oklahoma, 5.2 percent; and Tennessee, 3.7percent (Census SUSB, 2016).
For the states that exempt firms with fewer thanthree or four workers, the SUSB proportions of jobsin small firms (fewer than five employees) must beadjusted downward to correspond to the workers’compensation cutoff in each state. We use nationaldata on small firms from the U.S. Census Bureau(2005) to make the adjustments. The data indicatethat, among those jobs reported to be in small firmsby the SUSB (2016), 71.8 percent are in firms withfewer than four employees and 43.9 percent are infirms with fewer than three employees.
For the eight states that exempt firms with fewerthan three workers, the proportions of jobs in smallfirms were reported to be: Arkansas, 4.8 percent;Georgia, 4.6 percent; Michigan, 4.4 percent; NewMexico, 5.1 percent; North Carolina, 4.5 percent;Virginia, 4.5 percent; West Virginia, 4.6 percent;and Wisconsin, 3.9 percent (Census SUSB, 2016).These proportions are adjusted by a factor of 43.9percent to estimate the proportion of jobs in exemptfirms. For example, the proportion of Arkansas jobsin firms with fewer than three employees was esti-mated to be 2.1 percent (4.8% x 43.9%).
For the two states that exempt firms with fewer thanfour workers, the proportions of jobs in small firmswere: Florida, 5.8 percent, and South Carolina, 4.6percent. These proportions were adjusted by a factorof 71.8 percent to estimate the proportion of jobs inexempt firms. For South Carolina, the proportion ofjobs in firms with fewer than four employees wasestimated to be 3.3 percent (4.6% x 71.8%).
The adjusted ratios were applied to the total numberof UI-covered jobs in each state to calculate thenumber of exempt jobs. In total, we estimated that1.09 million jobs were excluded from workers’ com-pensation coverage in 2016 because of small firmexemptions from mandatory coverage.
Agricultural Exemptions. We assume agriculturaljobs are excluded from workers’ compensation cover-age if they are in a state where agricultural jobs areexempt from mandatory coverage. Only 14 jurisdic-tions have no exemption for agricultural jobs: Alaska,Arizona, California, Connecticut, District ofColumbia, Hawaii, Idaho, Massachusetts, NewHampshire, New Jersey, Ohio, Oregon, Washingtonand Wyoming.63 In states with agricultural exemp-tions, we identify the number of agricultural jobsusing the Quarterly Census of Employment andWages (DOL, 2016b). The Quarterly Census pro-vides estimates of total employment by state andindustry using North American IndustryClassification System (NAICS) codes. We estimatedthat 436,597 jobs were excluded from workers’ com-pensation in 2016 because of state agriculturalexemptions.
Texas. In Texas, where workers’ compensation cover-age is elective for almost all employers, theAcademy’s estimate of coverage is based on periodicsurveys conducted by the Texas Department ofInsurance Workers’ Compensation Research andEvaluation Group (TDI, 2016). Their most recentsurvey estimated that 82 percent of private-sectorjobs were covered by workers’ compensation in2016. We applied this ratio to all UI-covered jobs inTexas (other than federal government jobs, whichwere not included in the Texas surveys) to determinethe total number of jobs covered by workers’ compensation. In 2016, we estimated that 2.1 million jobs in Texas were not covered by workers’compensation.
Employed Workforce Coverage Estimates. Theworkers’ compensation coverage estimates describedabove are an estimate of the proportion of UI-covered jobs that are also covered by workers’ compensation. However, there are a number of jobs
64 NATIONAL ACADEMY OF SOCIAL INSURANCE
63 Washington also has an exemption for agricultural workers, but it is limited to some family members of family-owned operations.RCW 51.12.020 – employments excluded include “…Any child under eighteen years of age employed by his or her parents in agricultural activities on the family farm…”

Workers’ Compensation: Benefits, Costs, and Coverage • 65
that are not covered by either UI or workers’ compensation. To develop an estimate of the propor-tion of all jobs in the economy that are covered byworkers’ compensation, not just UI-covered jobs, werely on data from the Current Population Survey(CPS). The CPS reports total employment in thecountry – which was 151.4 million in 2016 (DOL,2017d). However, the CPS is a household surveythat questions individuals about their employment,and provides an estimate of the total number ofemployed workers. The Quarterly Census ofEmployment and Wages (QCEW), on the otherhand, is an employer-based survey that tracks jobs.
Some individuals have multiple jobs, so comparingthe number of workers’ compensation covered jobsto the total number of employed workers in the population may overestimate the overall workers’compensation coverage rate. To improve this esti-mate, we used the Integrated Public Use MicrodataSeries of the CPS (IPUMS-CPS, 2018) to identifythe distribution of employed individuals with one,two, three, four or more jobs. Using that distributionof multiple jobholders, combined with the numberof employed workers and multiple jobholders, we
expanded total employment to develop an estimateof the total number of jobs in the economy.64,65
This measure allowed us to calculate the percentageof total jobs among the employed workforce that arecovered by workers’ compensation using a consistentunit of measure in the numerator and denominator:jobs.
As Table A.2 shows, workers’ compensation covered85.6 percent of the total jobs in the economy in2016. Since 2012, the proportion of total jobs covered by workers’ compensation remained relative-ly stable, with a slight increase of roughly onepercentage point. This slight increase occurredbecause growth in the number of workers’ compensation covered jobs has outpaced growth intotal employment and total jobs in the economy.Between 2012 and 2016, total employment andtotal jobs increased 6.3 and 6.5 percent, respectively,while workers’ compensation covered jobs increased7.9 percent. The number of multiple-job holders asreported by the CPS increased to 7.5 million in2016, up 8.5 percent since 2012 and almost reaching a pre-recession high of 7.7 million in 2007(DOL, 2017d).
64 We start by subtracting the number of multiple jobholders from total employment as reported by the CPS to get the number ofworkers with only one job (DOL, 2017e). Next, we use data from the Integrated Public Use Microdata Series of the CPS (IPUMS-CPS, 2018) to identify the distribution of multiple jobholders based on whether they have two, three, or four or more jobs. Usingthis distribution, we expand the number of multiple jobholders to get the total number of jobs held by multiple jobholders. Usingthis approach, we calculate total jobs as: Total Jobs = (Total Employment – Multiple Jobholders) + Multiple Jobholders*[(2*% TwoJobs) + (3*% Three Jobs) + (4*% Four or More Jobs)].
This approach differs slightly from what was used in last year’s report. Last year’s measure was calculated using total employmentfrom the CPS, expanded by the distribution of multiple jobholders as: Total Jobs = Total Employment*[(% One Job) + (2*% TwoJobs) + (3*% Three Jobs) + (4*% Four or More Jobs)]. The key difference in our updated approach is that we use the total numberof multiple jobholders as reported by the CPS, instead of only relying on the distribution of jobholders as reported in the IPUMS toestimate the number of multiple jobholders. The differences between the two approaches are small. The approach we used this yearminimizes the impact of weighting estimates to achieve population level totals. All of the estimates in Table A.2 have been updatedto reflect the update.
65 The BLS reports that 5.0 percent of the U.S. employed workforce held more than one job in 2016.
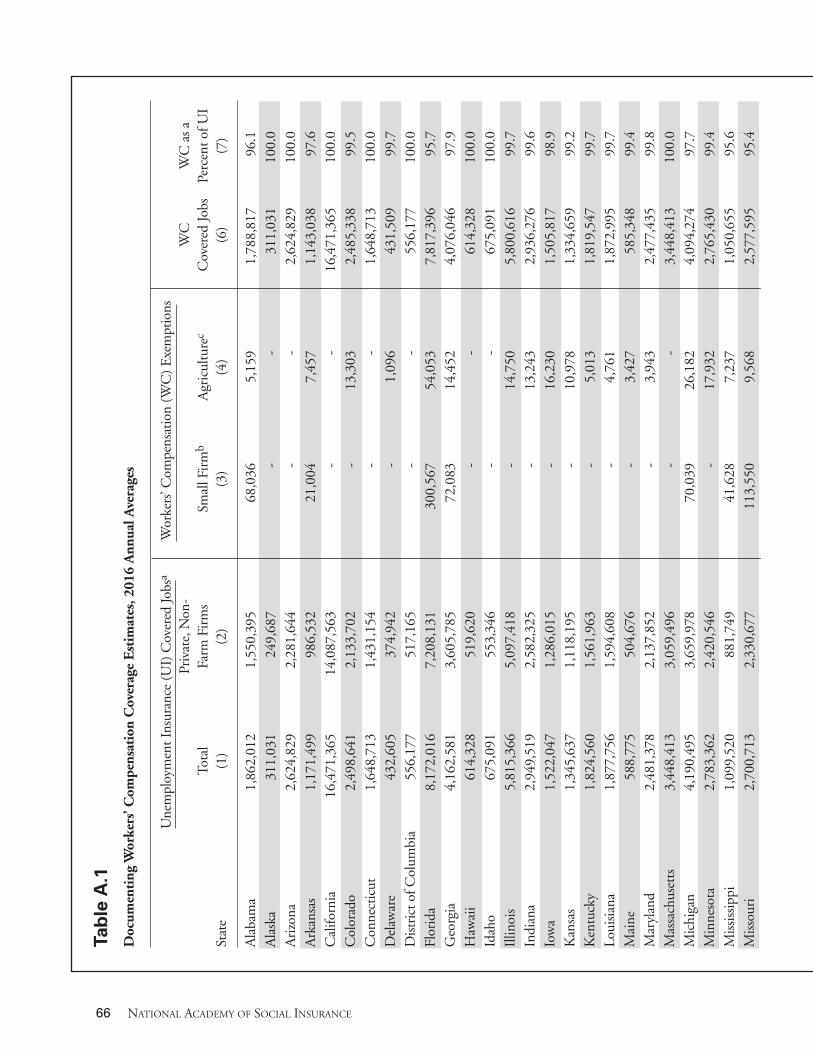
66 NATIONAL ACADEMY OF SOCIAL INSURANCE
Table A.1
Doc
umen
ting
Wor
kers’ C
ompe
nsation Cov
erag
e Estim
ates, 2
016 Ann
ual A
verage
s
Une
mpl
oym
ent I
nsur
ance
(UI) C
over
ed Jo
bsa
Wor
kers’ C
ompe
nsat
ion
(WC
) Exe
mpt
ions
Priv
ate, N
on-
WC
W
C as a
Tota
lFa
rm F
irm
sSm
all F
irm
bAgr
icul
ture
cC
over
ed Jo
bsPe
rcen
t of U
ISt
ate
(1)
(2)
(3)
(4)
(6)
(7)
Alaba
ma
1,86
2,01
2 1,
550,
395
68,0
36
5,15
9 1,
788,
817
96.1
Alask
a31
1,03
1 24
9,68
7 -
-31
1,03
1 10
0.0
Arizo
na2,
624,
829
2,28
1,64
4 -
-2,
624,
829
100.
0 Ark
ansa
s1,
171,
499
986,
532
21,0
04
7,45
7 1,
143,
038
97.6
C
alifo
rnia
16,4
71,3
65
14,0
87,5
63
--
16,4
71,3
65
100.
0 C
olor
ado
2,49
8,64
1 2,
133,
702
-13
,303
2,
485,
338
99.5
C
onne
cticut
1,64
8,71
3 1,
431,
154
--
1,64
8,71
3 10
0.0
Delaw
are
432,
605
374,
942
-1,
096
431,
509
99.7
D
istrict o
f Col
umbi
a55
6,17
7 51
7,16
5 -
-55
6,17
7 10
0.0
Flor
ida
8,17
2,01
6 7,
208,
131
300,
567
54,0
53
7,81
7,39
6 95
.7
Geo
rgia
4,16
2,58
1 3,
605,
785
72,0
83
14,4
52
4,07
6,04
6 97
.9
Haw
aii
614,
328
519,
620
--
614,
328
100.
0 Id
aho
675,
091
553,
346
--
675,
091
100.
0 Illin
ois
5,81
5,36
6 5,
097,
418
-14
,750
5,
800,
616
99.7
In
dian
a2,
949,
519
2,58
2,32
5 -
13,2
43
2,93
6,27
6 99
.6
Iow
a1,
522,
047
1,28
6,01
5 -
16,2
30
1,50
5,81
7 98
.9
Kan
sas
1,34
5,63
7 1,
118,
195
-10
,978
1,
334,
659
99.2
K
entu
cky
1,82
4,56
0 1,
561,
963
-5,
013
1,81
9,54
7 99
.7
Loui
sian
a1,
877,
756
1,59
4,60
8 -
4,76
1 1,
872,
995
99.7
M
aine
588,
775
504,
676
-3,
427
585,
348
99.4
M
aryl
and
2,48
1,37
8 2,
137,
852
-3,
943
2,47
7,43
5 99
.8
Mas
sach
uset
ts3,
448,
413
3,05
9,49
6 -
-3,
448,
413
100.
0 M
ichi
gan
4,19
0,49
5 3,
659,
978
70,0
39
26,1
82
4,09
4,27
4 97
.7
Min
neso
ta2,
783,
362
2,42
0,54
6 -
17,9
32
2,76
5,43
0 99
.4
Mississip
pi1,
099,
520
881,
749
41,6
28
7,23
7 1,
050,
655
95.6
M
isso
uri
2,70
0,71
3 2,
330,
677
113,
550
9,56
8 2,
577,
595
95.4

Workers’ Compensation: Benefits, Costs, and Coverage • 67
Mon
tana
441,
542
367,
051
-3,
943
437,
599
99.1
N
ebra
ska
951,
872
795,
796
-11
,729
94
0,14
3 98
.8
Nev
ada
1,26
4,82
7 1,
129,
187
-2,
781
1,26
2,04
6 99
.8
New
Ham
pshi
re63
9,72
7 56
1,39
0 -
-63
9,72
7 10
0.0
New
Jersey
3,90
4,58
6 3,
373,
848
--
3,90
4,58
6 10
0.0
New
Mex
ico
778,
058
618,
917
13,8
83
8,56
6 75
5,60
9 97
.1
New
Yor
k9,
038,
039
7,76
0,09
9 -
22,5
82
9,01
5,45
7 99
.8
Nor
th C
arol
ina
4,18
7,76
6 3,
545,
166
69,5
96
20,8
03
4,09
7,36
7 97
.8
Nor
th D
akot
a40
7,71
2 34
1,96
2 -
3,72
7 40
3,98
5 99
.1
Ohi
o5,
242,
197
4,59
2,68
8 -
5,24
2,19
7 10
0.0
Okl
ahom
a1,
527,
980
1,24
2,99
3 64
,523
9,
645
1,45
3,81
2 95
.1
Ore
gon
1,81
2,65
0 1,
526,
171
-1,
812,
650
100.
0 Pe
nnsy
lvan
ia5,
641,
039
5,04
2,41
9 -
20,2
55
5,62
0,78
4 99
.6
Rho
de Is
land
462,
721
413,
773
-65
3 46
2,06
8 99
.9
Sout
h C
arol
ina
1,96
3,01
3 1,
645,
894
54,6
14
5,50
8 1,
902,
891
96.9
So
uth
Dak
ota
409,
149
342,
505
-4,
997
404,
152
98.8
Te
nnes
see
2,83
8,56
4 2,
473,
050
90,8
21
5,74
1 2,
742,
002
96.6
Te
xasd
11
,607
,943
9,
914,
156
-46
,331
9,
472,
182
81.6
U
tah
1,35
2,80
3 1,
160,
647
-4,
767
1,34
8,03
6 99
.6
Ver
mon
t30
1,13
2 25
2,28
8 -
2,72
8 29
8,40
4 99
.1
Virgi
nia
3,61
1,64
2 3,
086,
669
61,2
74
8,48
7 3,
541,
881
98.1
W
ashi
ngto
n3,
140,
527
2,59
2,77
6 -
-3,
140,
527
100.
0 W
est V
irgi
nia
660,
877
545,
869
11,1
22
811
648,
944
98.2
W
isco
nsin
2,79
9,14
7 2,
424,
075
41,9
48
23,7
59
2,73
3,44
0 97
.7
Wyo
min
g26
4,31
2 20
2,63
5 -
-26
4,31
2 10
0.0
Tota
l Non
-Fed
eral
139,
078,
254
119,
687,
188
1,09
4,68
8 43
6,59
7 13
5,45
7,53
9 97
.4
Fede
ral E
mpl
oyee
s2,
793,
087
2,79
3,08
7 10
0.0
TO
TAL
141,
871,
341
119,
687,
188
1,09
4,68
8 43
6,59
7 13
8,25
0,62
6 97
.5
a.
UI-co
vere
d em
ploy
men
t rep
orte
d in
the ETA-2
02 d
ata pr
oduc
ed b
y th
e Bur
eau
of L
abor
Sta
tistic
s (U
.S. D
OL,
201
7b).
b. D
ata on
em
ploy
ees a
t sm
all f
irm
s cam
e from
the U
.S. C
ensu
s Bur
eau
(200
5; 2
016)
. c.
Dat
a on
agr
icul
tura
l wor
kers cam
e from
the Q
uarter
ly C
ensu
s of E
mpl
oym
ent a
nd W
ages
(U.S
. DO
L, 2
017b
).d.
In
201
6 th
ere w
ere 2,
089,
430
wor
kers n
ot cov
ered
by
wor
kers' c
ompe
nsat
ion
in T
exas
. Dat
a on
wor
kers n
ot cov
ered
by
wor
kers' c
ompe
nsat
ion
in T
exas
cam
e from
the Te
xas
Dep
artm
ent o
f Ins
uran
ce (T
DI, 2
016)
.
Sour
ce: N
atio
nal A
cade
my
of S
ocia
l Ins
uran
ce estim
ates
.

68 NATIONAL ACADEMY OF SOCIAL INSURANCE
Table A.2Workers' Compensation Coverage as a Percent of the Employed Workforce, 2006-2016 National Averages
Total Total WC WC % WC % CoverageEmploymenta Jobsb Covered Jobsc Coverage of of Total
Year (thousands) (thousands) (thousands) Total Jobs Employment
(1) (2) (3) (4) = (3) / (2) (5) = (3) / (1)
2006 144,427 152,746 130,109 85.2 90.1
2007 146,047 154,435 131,421 85.1 90.0
2008 145,362 153,715 130,742 85.1 89.9
2009 139,877 147,872 125,053 84.6 89.4
2010 139,064 146,655 124,668 85.0 89.6
2011 139,869 147,408 126,088 85.5 90.1
2012 142,469 150,080 128,141 85.4 89.9
2013 143,929 151,711 130,368 85.9 90.6
2014 146,305 154,171 132,875 86.2 90.8
2015 148,834 156,886 135,814 86.6 91.3
2016 151,436 159,800 138,251 86.5 91.3
a. Data on total employment as reported in the Current Population Survey (DOL, 2017d).
b. Total Jobs are estimated by multiplying total employment by the proportional distribution of single- and muliple-job-holders. Data on the proportional distribution of single- and multiple-jobholders is processed from the Integrated Public Use Microdata Series-CPS (IPUMS-CPS, 2018).
c. Workers' compensation covered jobs from Table A.1 and previous editions of this report.
Source: National Academy of Social Insurance estimates.

Workers’ Compensation: Benefits, Costs, and Coverage • 69
Various federal programs compensate certain categories of workers and/or their dependents forwork-related injuries or illnesses. Our aim in thisreport is to include in the national totals of workers’compensation benefits/costs those federally administered programs that are financed by employ-ers, and are not included in the benefits/costsreported by the states. We do not include in ournational totals compensation programs which coverprivate-sector workers but are financed by generalfederal revenues. Details on specific federal programsare provided below.
Federal Programs Included in theAcademy’s Estimates Federal Employees The Federal Employees’ Compensation Act of 1916(FECA) provided the first comprehensive workers’compensation program for federal civilian employees. In 2016, total FECA benefits wereapproximately $2.9 billion (Table B.1). Thirty-sixpercent of benefits were for medical care, a five percentage point increase from 2012. The share ofbenefits for medical care is lower in the FECA program than in most state workers’ compensation
systems because federal cash benefits, particularly forhigher-wage workers, replace a larger share of pre-injury wages than do most state programs.Administrative costs for the FECA program were$161 million in calendar year 2016, or 5.6 percentof total benefits paid (DOL, 2018). The benefits andcosts of the FECA program are included in thenational totals in this report under federal programs.
Longshore and Harbor Workers The Longshore and Harbor Workers’ CompensationAct (LHWCA) requires employers to provide workers’ compensation protection for longshore, harbor, and other maritime workers. The originalprogram was enacted in 1927 in response to a U.S.Supreme Court decision holding that theConstitution prohibits states from extending workers’ compensation coverage to maritimeemployees who are injured while working over navigable waters. The LHWCA excludes coverage ofthe master or crew of a vessel. In 1941, the DefenseBase Act (DBA) extended the LWHCA to requirecoverage for other types of workers who fall outsidethe jurisdiction of state workers’ compensation programs, such as employees working on overseas
Appendix B: Federal Programs
Table B.1Federal Employees’ Compensation Act, Benefits and Costs, 2012-2016 (in thousands)
2012 2013 2014 2015 2016
Total Benefits $3,006,009 $2,948,132 $2,940,811 $2,988,242 $2,890,670
Compensation Benefits 2,081,387 2,024,568 1,929,360 1,946,890 1,860,675
Medical Benefits 924,622 923,564 1,011,450 1,041,353 1,029,995
% Medical 31 31 34 35 36
Direct Administrative Costs 157,922 158,625 173,570 156,233 161,130
Total Costs 3,163,931 3,106,757 3,114,380 3,144,475 3,051,800
Indirect Administrative Costsa 7,566 7,299 8,426 10,444 9,014
a. Includes legal and investigative support from the Office of the Solicitor and the Office of the Inspector General.
Source: U.S. Department of Labor (2018).

70 NATIONAL ACADEMY OF SOCIAL INSURANCE
military bases, and persons working overseas for private contractors of the United States. Otherextensions of the Act have required coverage for special groups of workers, such as workers on offshore drilling rigs.
Private employers cover workers protected by theLWHCA by purchasing private insurance or self-insuring. The Division of Longshore and HarborWorkers’ Compensation also administers a specialfund to pay certain types of claims authorized underthe LHWCA (e.g. for second injuries, or in caseswhere an employer and their workers’ compensationcarrier are insolvent or out of business). The specialfund is underwritten by annual assessments onemployers.
The Academy’s data series on benefits of workers’compensation allocate part of the benefits paidunder the LHWCA to the states where the compa-nies operate, and part to federal programs. Benefitspaid by private carriers under the LWHCA are notidentified separately in the information provided byA.M. Best or the state agencies, so these benefitsappear with the state data. Benefits paid by privateemployers who self-insure under the LHWCA, andbenefits paid from the LHWCA special fund, are notreported by the states or A.M. Best. Consequently,these benefits are included with federal programs inthis report.
Table B.2 shows benefits paid under the LHWCAand its extensions from 2012-2016. Total benefitspaid were approximately $2.1 billion, including$881 million paid by private insurance carriers, $416million paid by self-insured employers, $110 millionpaid from the special fund, and $673 million paidunder the DBA and other extensions. Over the five-year period, benefits under the LWHCA increasedfrom approximately $1.9 billion in 2012 to a high ofmore than $2.2 billion in 2014, then declinedbetween 2014 and 2016. Benefits under the DBAand other extensions of the Act also peaked in 2014($707.5 million), but the number of death claimsfiled declined by nearly 70 percent over the period(from 280 in 2012 to 88 in 2016).
The costs of the LHWCA program include premi-ums and deductibles paid by employers covered byprivate insurers, benefit payments and administrativecosts of self-insured employers, employer assessmentsfor the special fund, and administrative costs to the
federal government that are not covered by the fund.Costs to employers covered by private insurers areincluded with the state estimates in this report.Other costs (excluding the administrative costs toself-insured employers, which we do not estimate)are included in the federal totals.
As shown in Table B.2, employers paid $110 millionto the LWHCA special fund in 2016, which coveredbenefit payments of $109 million. Direct and indirect administrative costs to the federal government totaled approximately $14.6 million.
Coal Miners with Black Lung Disease The Black Lung Benefits Act, enacted in 1969, provides compensation for coal miners with pneumoconiosis (black lung disease) and their survivors. The program has two parts. Part B isfinanced by federal general revenues and was administered by the Social Security Administrationuntil 1997, when administration shifted to the U.S.Department of Labor. Part C is paid through theBlack Lung Disability Trust Fund, which is financedby coal mine operators through a federal excise taxon all coal that is mined and sold in the UnitedStates. In this report, only the Part C benefits thatare financed by employers are included in nationaltotals of workers’ compensation benefits andemployer costs.
Table B.3 shows benefits paid under both parts ofthe black lung program from 2012 through 2016.Total benefits in 2016 were $278.6 million, of which$98.7 million was paid under Part B and $179.9million under Part C. Part C benefits included $36.7million for medical care (20% of Part C benefitspaid). Medical benefits are a relatively small share ofblack lung benefits because many of the recipients ofbenefits are deceased coal miners’ dependents, whosemedical care is not covered by the program.
Table B.3 also shows accounting data for the blacklung trust fund, and federal costs for administeringthe program. In 2016, direct administrative costs forPart C were $33.2 million. Together with benefitpayments of $179.9 million, expenditures under Part C were $213.3 million. Employers paid $436.9million into the trust fund in 2016, but paymentson past debt far exceeded the extra revenues.

Workers’ Compensation: Benefits, Costs, and Coverage • 71
No data are available on the experience of employerswho self-insure under the black lung program. Anysuch benefits and costs are not reflected in Table B.3and are not included in national estimates.
Federal Programs Not Included inthe Academy’s EstimatesEnergy Employees Part B of the Energy Employees Occupational IllnessCompensation Program Act (EEOICPA) providesworkers’ compensation benefits to civilian workers(and/or their survivors), who become ill as a result ofexposure to radiation, beryllium, or silica, in the
production or testing of nuclear weapons and othermaterials. The program pays medical benefits for thetreatment of covered conditions, and lump sum cashpayments of up to $150,000 for eligible workers. Part E of the EEOICPA provides compensation foremployees of Department of Energy contractors, anduranium miners, millers, and ore transporters, whobecome injured on the job. Workers (or their qualifying survivors) are eligible for cash awards ofup to $250,000. Wage loss, medical, and survivorbenefits are also provided under certain conditions.
Table B.4 provides information on benefits and costsof both Parts B and E of the EEOICPA for 2012-
Table B.2Longshore and Harbor Workers’ Compensation Act (LHWCA), Benefits, Costs, and Death Claims,a
2012-2016 (in thousands)
2012 2013 2014 2015 2016
Total LHWCA Benefits $1,363,677 $1,475,916 $1,516,786 $1,435,641 $1,414,142
Insurance Carriers 801,962 927,417 961,542 893,226 881,492
Self-Insurance Employer 430,926 420,016 429,307 421,030 416,151
LHWCA Special Fund 122,133 120,100 117,694 113,307 109,643
DCCA Special Fund 8,656 8,383 8,243 8,078 6,856
DBA benefits 540,283 665,943 707,468 667,644 673,083
Number of DBA Death Claimsb 280 211 146 100 88
Total Annual Assessments 132,000 132,000 123,000 118,000 118,000
LHWCA 124,000 123,000 118,000 110,000 110,000
DCCA 8,000 9,000 5,000 8,000 8,000
Administrative Expenses 13,330 13,302 14,164 14,280 14,588
General Revenue 11,229 11,190 12,029 12,116 12,423
Trust Fund 2,101 2,112 2,135 2,164 2,166
Indirect Administrative Costsc 1,632 1,211 1,534 1,471 1,163
a. Includes benefit costs for cases under the Defense Base Act (DBA) and all other extensions to the LHWCA.
b. Number of civilian overseas deaths.
c. Includes legal and investigative support from the Office of the Solicitor and the Office of the Inspector General. These are not employer costsbut are provided for through general revenue appropriations.
Source: U.S. Department of Labor (2018).

2016. In 2016, total benefits paid under Part B were$802.7 million, of which $301.6 million (38%) werepaid as compensation benefits (DOL, 2018). Part Ebenefits in 2016 were $342.4 million, of which$278.9 million (81%) were compensation. Benefitsunder both Parts B and E are financed by generalfederal revenues and are not included in our nationaltotals.
Workers Exposed to Radiation The Radiation Exposure Compensation Act of 1990provides lump sum compensation payments to individuals who contracted certain cancers and otherserious diseases as a result of exposure to radiationreleased during above-ground nuclear weapons testing or during employment in underground uranium mines. The lump sum payments are specified by law and range from $50,000 to$100,000. Table B.5 shows cumulative payments
Table B.3Black Lung Benefits Act, Benefits and Costs, 2012-2016(in thousands)
2012 2013 2014 2015 2016
Total Benefits $368,661 $337,282 $312,814 $287,841 $278,596
Part C Compensation 176,886 162,410 148,926 141,290 143,212
Part C Medical Benefits 30,982 34,213 36,224 33,900 36,733
Part B Compensation 160,793 140,659 127,664 112,651 98,651
Total Direct Administrative Costs 37,875 35,950 35,408 36,020 38,201
Part C (DOL) 32,486 31,085 30,633 31,198 33,236
Part B (SSA) 5,389 4,865 4,775 4,822 4,964
Trust Fund Advances from U.S. Treasurya 260,750 424,750 518,250 666,250 1,003,750
Bond Paymentsb 436,724 457,542 477,757 498,739 523,262
Interest Payments on Past Advancesc 134,491 261,128 549,181 1,037,392 1,335,288
Coal Tax Revenues Received by the Black Lung Trust Fund 636,536 512,866 573,694 524,230 436,889
Indirect Administrative Costsd 25,767 24,661 25,489 28,972 29,430
a. Advance of funds required when Trust Fund expenses exceed tax revenues received in a given year. Under the Emergency Economic Stabilization Act of 2008 (EESA), total Trust Fund debt (cumulative advances) at the end of 2008 was converted to zero coupon bonds that arerepayable to the U.S. Treasury on an annual basis.
b Repayment of bond principal and interest on principal debt as required by the Trust Fund debt restructuring portion of the EESA.
c The amount shown is the repayment of one-year obligations of the Trust Fund, which include the previous year's advances from the U.S.Treasury and applicable interest due on those advances, as required under the EESA.
d Includes legal and investigative support from the Office of the Solicitor and the Office of the Inspector General, services provided by the Department of the Treasury, and costs for the Office of Administrative Law Judges (OALJ) and the Benefits Review Board (BRB). OALJ andBRB costs are not included for any other program but cannot be separately identified for Coal Mine Workers' Compensation.
Source: U.S. Department of Labor (2018).
72 NATIONAL ACADEMY OF SOCIAL INSURANCE

Workers’ Compensation: Benefits, Costs, and Coverage • 73
under the Radiation Exposure Compensation Actsince its enactment in 1990. From the beginning ofthe program through June 2018, 34,518 claims werepaid for a total of $2.3 billion, or roughly $65,239per claim (DOJ, 2018). The program is financedwith federal general revenues and is not included innational totals in this report.
Veterans of Military Service U.S. military personnel are covered by the federalveterans’ compensation program of the Departmentof Veterans Affairs. The program provides cash benefits to veterans who sustain total or partial disabilities while on active duty. Table B6 shows the
number of recipients, and the value of cash benefitspaid, in fiscal year 2016. As shown in Table B.6, 4.4million veterans were receiving monthly compensation payments for service-connected disabilities in 2016. Of these, 60.4 percent of veterans had a disability rating of 30 percent ormore. Total monthly payments for disabled veteransand their dependents were $5.4 billion in 2016, orabout $64.7 billion for the year (VA, 2017). Hence,annual cash benefits paid under the veterans’ compensation program in 2016 were almost doublethe cash benefits paid under all other workers’ compensation programs (Table 1). Because it is solarge, covers such a high proportion of serious
Table B.4Benefits and Costs of the Energy Employees Occupational Illness Compensation Program Act: Parts B and E 2012-2016 (in thousands)
2012 2013 2014 2015 2016
Total Benefits Part B 864,272 850,126 739,887 688,105 802,734
Medical Benefitsa 316,058 353,258 383,084 392,453 501,090Compensation Benefits 548,213 496,868 356,803 295,653 301,644
Direct Administrative Costsb 49,577 49,555 51,937 52,079 54,318
Total Benefits Part Ec 331,089 351,842 302,672 308,647 342,392
Medical Benefitsd 35,071 45,237 42,504 44,703 63,534Compensation Benefits 296,019 306,604 260,168 263,944 278,859
Direct Administrative Costsb 72,259 68,523 66,752 67,530 68,500
a. Medical payments made for claimants eligible under Part B only and claimants eligible under both Part B and Part E.
b Part B costs for 2002-2008 include funding for the Department of Health and Human Services/National Institute for Occupational Safety and Health's (DHHS/NIOSH) conduct of dose reconstructions and special exposure cohort determinations. For 2002, these costs were $32.7million; 2003, $26.8 million; 2004, $51.7 million; 2005, $50.5 million; 2006, $58.6 million; 2007, $55.0 million; and 2008, $41.5 million.Beginning in 2009, these costs are a direct appropriation to DHHS/NIOSH. Part B costs for 2009-14 include funding for an ombudsman position. For 2009, these costs were $0.1 million; 2010, $0.4 million; 2011, $0.2 million; 2012, $0.3 million; 2013, $0.5 million; 2014, $0.6million; and 2015, $0.6 million. Part E costs for 2005-16 also include funding for an ombudsman position. For 2005 these costs were $0.2 million; 2006, $0.5 million; 2007, $0.7 million; 2008, $0.8 million; 2009, $0.8 million; 2010, $0.5 million; 2011, $0.8 million; 2012, $0.8million; 2013, $0.8 million; 2014, $0.8 million; 2015, $0.7 million; and 2016, $0.7 million.
c The Energy Part E benefit program was established in October 2004.
d Medical payments made for claimants eligible under Part E only.
Source: U.S. Department of Labor (2018).

74 NATIONAL ACADEMY OF SOCIAL INSURANCE
injuries, and provides medical care through anentirely separate health care system, we do notinclude the veterans’ compensation program in thenational totals we estimate for regular workers’ compensation programs.
Railroad Employees and Merchant Mariners Federal laws specify employee benefits for railroadworkers involved in interstate commerce, and formerchant mariners. These programs provide healthinsurance as well as short- and long-term cash benefits for ill or injured workers whether or nottheir conditions are work-related. The benefits arenot exclusively workers’ compensation benefits andare not included in our national totals. Under federallaws, these workers also retain the right to bring tortsuits against their employers if the worker believes awork-related injury or illness was caused by employernegligence (Williams and Barth, 1973).
Table B.5Radiation Exposure Compensation Act,Benefits Paid as of June, 2018(in thousands)
BenefitsClaim Type # Claims Approved
Downwinder 21,575 $1,078,720
Onsite Participant 4,432 322,829
Uranium Miner 6,403 639,575
Uranium Miller 1,751 175,100
Ore Transporter 357 35,700
TOTAL 34,518 $2,251,924
Source: U.S. Department of Justice (2018).
Table B.6Federal Veterans' Compensation Program: Fiscal Year 2016
Monthly ValueClass of Dependent Number (in thousands)
Veteran Recipients - Total 4,356,443 $5,392,500
Veterans Less Than 30 Percent Disabled (no dependency benefit) 1,723,875 420,323
Veterans 30 Percent Disabled or More 2,632,568 4,972,518
Source: U.S. Department of Veterans Affairs (2017).

Workers’ Compensation: Benefits, Costs, and Coverage • 75
Table C identifies the parameters that determineworkers’ compensation benefits under the currentlaws (as of January 2018) in each jurisdiction. Thetable is adapted from the IAIABC (InternationalAssociation of Industrial Accident Boards andCommissions) and WCRI (Workers CompensationResearch Institute) joint publication of Workers’Compensation Laws (IAIABC-WCRI 2016), as wellas the U.S. Chamber of Commerce’s Analysis ofWorkers’ Compensation Laws (COC, 2018). In manyinstances, the parameters were obtained from specificstate workers’ compensation agencies.
The benefit parameters defined in this table includethe following:
� The waiting period before a worker becomes eligible for cash benefits.
� The retroactive period when a worker becomeseligible for compensation for the waitingperiod.
� The minimum and maximum weekly benefitpayments for temporary total disability.
� The maximum duration of temporary total disability benefits.
� The maximum weekly benefit and benefit limitations for permanent partial disability.
� The maximum weekly benefit and benefit limitations for permanent total disability.
� The maximum weekly benefit and benefit limitations for death benefits.
Appendix C: Workers’ Compensation under State Laws

76 NATIONAL ACADEMY OF SOCIAL INSURANCE
Table C
Worke
rs' C
ompe
nsation State La
ws as of J
anua
ry 201
8
Limit to
Statutor
yRetro-
Min
Max
Max
Basis of
Max
Max
Mon
etary
Max
Max
Ben
efit fo
rM
axLimit fo
rW
aiting
active
Weekly
Weekly
Dur
ation
PTD
Weekly
Dur
ation
PTD
Weekly
"Uns
ched
uled
Weekly
Dep
ende
ncy
State
Period
Period
Ben
efit
Ben
efit
(Weeks
)Calcu
lation
Ben
efit
(Weeks
)Ben
efits
Ben
efit
Injuries"
Ben
efita
Ben
efits
Alabama
3 days, TTD
21 days
$232
$843
Duration of
66 2/3% PIWW
$843
NoNone
$220
300 weeks
$843
500 weeks
only
TTD disability
Alaska
3 days, for
28 days
$266
$1,211
Until
80% of
$1,211
noUp to max
% of im
pairment
No$1,211
12 yearsc
income
medically stable
spendable
TTD weekly
x $177k, paid
unscheduled
benefits only
earnings
rate.
in lum
p sumb
PPD
Arizona
7 days
14 days
n/a
$710
dDuration of
66 2/3% AMW
$710
NoNone
$710
None unless
$1,156
None
TTD disability
rearranged
by Industrial
Commission
Arkansas
7 days
14 days
$20
$673
450 weeks
66 2/3% PIWW
$673
NoLim
it on
$505
450 weeks
$673
$214,825;
weekly
benefit in excess
amount but
payable from
not total
Death and
amount
PD Trust Fund
California
3 days
14 days
$183
$1,215
104 weekse
66 2/3 of AWW
$1,215
NoNone
$290
n/a
$1,215
320,000
Spouse plus
Childrenf
Colorado
3 days
14 days
None
$948
Duration of
66 2/3% of AWW
$948
No
None
$298 for
400g
$948
None
TTD
scheduled
disability
injuries; $521
unscheduled
Connecticut
3 days
7 days
$257
$1,287
Duration of
75% (of after-tax
$1,287
NoNone
$1,023
780 weeks however
$1,287
None
TTD disability
incpme)
no unscheduled
PPD since 1993
Delaw
are
3 days
7 days
$229
$687
Duration of
66 2/3% AWW
$687
NoNone
$687
300 weeks
Spouse =
None
TTD disability
$666, W
ithChildren =
$799
District of
3 days
14 days
$367
$1,470
Duration of
66 2/3% PIWW
$1,470
NoFirst $75,000 in
1,470
500 weeks;
1,470, Max
None
Colum
biaTTD disability
benefits paid by
may petition for
100% SAW
Wemployer / insurer.
additional 167
Amounts over
weeks
$75,000 paid from
PTD Trust Fund
Dea
th B
enefits (D
B)
Perm
anen
t Partial D
isab
ility
(PPD)
Perm
anen
t Total D
isab
ility (PTD)
Tempo
rary Total D
isab
ility (TTD)
Waiting
Period

Workers’ Compensation: Benefits, Costs, and Coverage • 77
Florida
7 days
21 days
$20
$917
104 weeks
66 2/3% PIWW
$917
Age 75h
None
$688
2 weeks for each
Spouse =
$150,000
% of im
pairment
$886
ifrom 1-10%;
With
3 weeks from
Children =
11-15%; 4 weeks
$917
from 16-20%; and
6 weeks for each
rating over 21%
Georgia
7 days
21 days
$503
$575
400 weeks
66 2/3% PIWW
$575
NoNone
$575
300 weeks
$575
$220,000 for
unless
surviving
catastrophic
spouse with no
injury
dependents
Hawaii
3 days, TTD
None
$212
$883
Duration of
66 2/3% PIWW
$883
NoNone
$883
312 weeks
Spouse =
312 weeks
only
TTD disability
$634
With Children
= $883
Idaho
5 days
14 days
$113
$678
Duration ofTTD
67% of AWW
$678
NoWeekly rate may
$414
500 weeks
Spouse =
500 weeks
disability. Benefit
change after the
$339
continues in
first 52 weeks of
With Children
recovery period.
TTD and each
= $452
year thereafter
on January 1,
based on the
increase in the
ASWW
Illinois
3 days, TTD
14 days
$220j
$1,464
Duration of
66 2/3% AWW
$1,464
NoNone
$791
k500 weeks
$1,464
$500,000 or
only
TTD disability
25 years
Indiana
7 days
21 days
$50
$780
500 weeksL
66 2/3% AWW
$780
500 weeksL
$390,000
None
$390,000
$780
$325,000
Spouse Only,
$380,000 Spouse
plus Children
Iowa
3 days; no
14 days
None
$1,720
Duration of
80% (of
$1,720
NoNone
$1,583
500 weeks
$1,720
None
waiting period
TTD disability
spendable earnings)
for PPD
Kansas
7 days
21
$25
$630
Duration of
66 2/3% AWW
$630
Up to Monetary
$155,000
$630
415 weeks;
$627
$300,000
consecutive
TTD disabiliy
Limit
functional
days
impairment only
= $75,000, all other
cases = $130,000
Kentucky
7 days
14 days
$170
$848
Duration of
66 2/3% AWW
$848
Until injured
None
$848
425 weeks if
Spouse =
None
TTD disability or
worker qualifies
rating is 50% or
$418
until injured
for normal old age
less; 520 wks if
With
worker qualifies
Social Security
over 50%; limited
Children =
for normal old age
benefit
to qualification for
$637
Social Security
normal old age
benefit
Social Security

78 NATIONAL ACADEMY OF SOCIAL INSURANCE
Table C continued
Worke
rs' C
ompe
nsation State La
ws as of J
anua
ry 201
8
Limit to
Statutor
yRetro-
Min
Max
Max
Basis of
Max
Max
Mon
etary
Max
Max
Ben
efit fo
rM
axLimit fo
rW
aiting
active
Weekly
Weekly
Dur
ation
PTD
Weekly
Dur
ation
PTD
Weekly
"Uns
ched
uled
Weekly
Dep
ende
ncy
State
Period
Period
Ben
efit
Ben
efit
(Weeks
)Calcu
lation
Ben
efit
(Weeks
)Ben
efits
Ben
efit
Injuries"
Ben
efita
Ben
efits
Louisiana
7 days
14 days
$174
$653
Duration of
66 2/3% PIWW
$653
NoNone
$653
520 weeks
$657
None
TTD disability
Maine
7 daysm
14 days
None
$710.42 for DOI
520 weeksn
80% (of after-tax
$710.42 for DOI
NoNone
$710.42 for DOI
None
$710.42 for
500 weeks
1/1/93-12/31/12;
AWW) for DOI prior 1/1/93-12/31/12;
1/1/93-12/31/12;
DOI 1/1/93-
$789.35 for DOI
to 1/1/13; 2/3 gross $789.35 for DOI
$789.35 for DOI
12/31/12;
after 1/1/13
AWW for DOI after,
after 1/1/13
after 1/1/13
$789.35 for
but no more than the
DOI after
maximum benefit.
1/1/13
Maryland
3 days, TTD
After 14
$50 or
$1,094
Duration of TTD
66 2/3% PIWW
$1,094
No$45,000
$821
None
$1,094
144 monthso
only
days
employee's
disability
AWW
Massachu-
5 days
21 days
$258
$1,388
156 weeks
66 2/3% PIWW
$1,388
NoNone
SAWW at
N/A
$1,292
250 weeks
setts
time of injury,
$1,388 until
10/1/18
Michigan
7 days
14 days
$250
$900
Duration of TTD
80% (of spendable
$900
800 weeksp
None
qN/A
$900
$322,000 or 500
disability
earnings)
weeks; time limit
does not apply to
children
Minnesota
3 days
10 days
$130 or
$1,062
r90 days after
66 2/3% PIWW
$1,062
rUntil age 67
None
$1,062
r$515,000
$1,062
r10 years
the worker's
MMI or after end
or 10 years
actual wage,
of retraining, up
after the last
whichever
to a total of 130
child is no
is less
weeks
longer depen-
dent, minimum
payable is
$60,000
Mississippi
5 dayss
14 days
$25
$487
450 weeks
66 2/3% AWW
$487
450 weeks
$219,168
$487
450 weeks
$487
450 weeks
or $219,168
Missouri
3 days
14 days
$105
$923
400 weeks
66 2/3% PIWW
$923
NoNone
$496
400 weeks
$923
None
Montana
4 days or 32
21 days
None
$768
Disability until
66 2/3% PIWW
$768
Until injured
None
$384
400 weeks
$768
500 weeks
hours,
or moret
MMI, restrictions
worker qualifies
whichever
are identified and
for normal old age
less
job analyses are
Social Security
approved, or
benefit
return to work
Dea
th B
enefits (D
B)
Perm
anen
t Partial D
isab
ility
(PPD)
Perm
anen
t Total D
isab
ility (PTD)
Tempo
rary Total D
isab
ility (TTD)
Waiting
Period

Workers’ Compensation: Benefits, Costs, and Coverage • 79
Nebraska
7 days
42 days
None
$831
Until MMI or
66 2/3% PIWW
$831
NoNone
$831
300 weeks
$831
None
return to work
Nevada
5 daysu
6 daysu
None
$874
Duration of
66 2/3% pre-injury
$874
NoPer maximum
$874
Benefits paid for 5
$854
None
TTD disability
AMW
compensation
years or to age 70,
limit and formula
whichever is later
New
3 days
14 days
$308
v$1,538
Duration of
60 % PIWW
$1,538
NoNone
$1,538
350 weeks for a
$1,538
None
Hampshire
or more
TTD disability
whole person award
New Jersey
7 days
7 days
$241
$903
400 weeks
70%
$903
600 weeks
None
$903
600 weeks
$903
Lifetime
with exceptions
New Mexico
7 days
28 days
$36
$797
700 weeks
66 2/3% PIWW
$797
NoNone
$797
$557,872 if dis-
$797
700 weeks
ability rating > 80%;
$398,480 if < 80%
New York
7 days, wage
14 days
$100.00
$871
Duration of
66 2/3% PIWW
$871
NoNone
$871
$453,768
$871
None
replacement
TTD disability
benefits only
North
7 days
21 days
$30
$992
Duration of
66 2/3% PIWW
$992
500 weeksw
None
$992
$20,000
$992
500 weeks
Carolina
TTD disability
North
5 days
5 days
$561
$1,168
104 weeks or
66 2/3% PIWW
$1,168
Until injured worker
None
$327
Based on whole
$1,168
$300,000 or
Dakota
MMI 260 weeks
qualifies for normal
body impairment,
death
old age Social
up to 100% lump
Security benefit
sum payment
Ohio
7 days
14 days
$301
$932; $621 if
Duration of TTD
72% PIWW for
$932
NoNone
$311
200 weeks
$932
None
getting Social
disability
the first 12 weeks;
Security
66 2/3% thereafter
Retirement
Oklahoma
3 days,
None
None
$591
104 weeks, with
70% AWW
$844
15 years or upon
None
$323
350 weeks
Spouse =
None
TTD only
additional 52
reaching Social
$591
weeks if
Security retirement
With
consequential
age, whichever
Children
injury found
is longer
= $844
Oregon
3 days
14 days
Not less than
$1,281
Duration of
66 2/3% PIWW
$1,281
xLifetime plus bene-
None
$1,281
$369,111
Spouse =
None
$50 or 90%
TTD disability
fits to surviving
$643
AWW; which-
spouse and
With Children
ever is less
children
= $1285
Pennsylvania
7 days
14 days
90% AWW
$1,025
Duration of TDD
66 2/3%
$1,025
Disability up to
None
$1,025
500 weeks
$1,025
None
if AW
W is
disability subject
500 weeks
$569.43 or
to conversion
less
to partial benefits
at 104 weeksy
Rhode
3 days
No
None
$1,221, max
Duration of
75% (of spendable
$1,221
NoNone
$1,221
500 weeks
$1,221
None
Island
payment
80% AWW
TTD disability
income)
for waiting
period
days
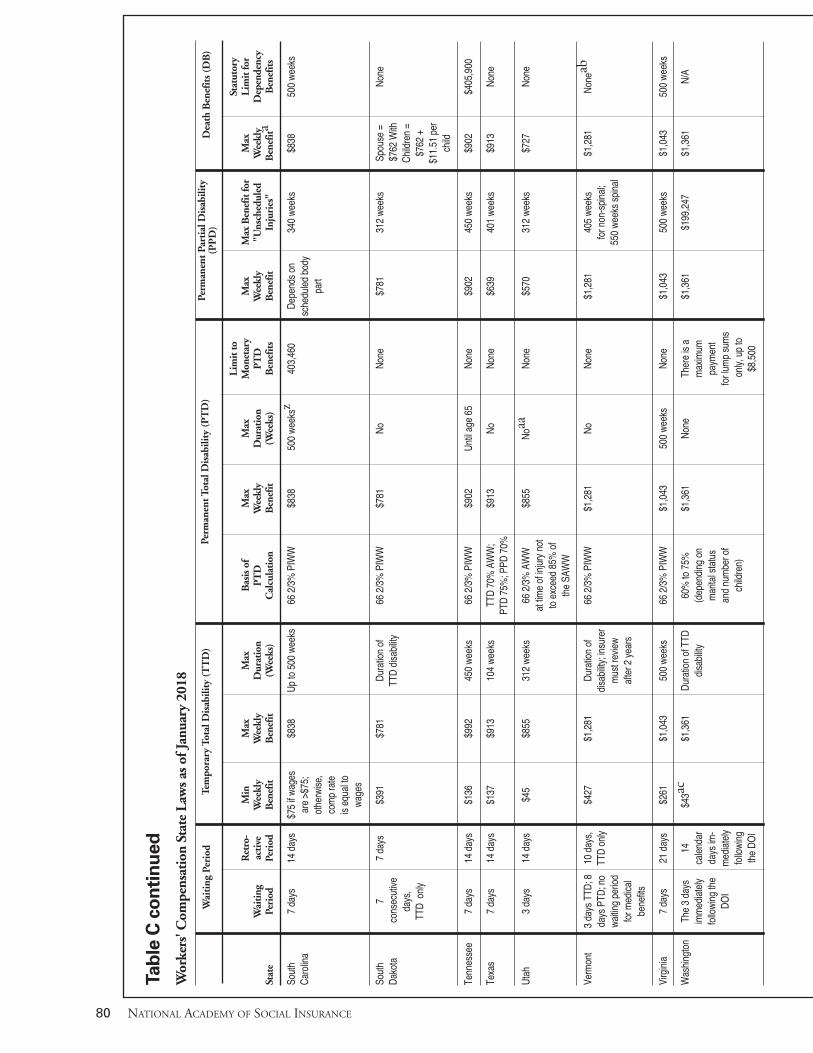
80 NATIONAL ACADEMY OF SOCIAL INSURANCE
Table C continued
Worke
rs' C
ompe
nsation State La
ws as of J
anua
ry 201
8
Limit to
Statutor
yRetro-
Min
Max
Max
Basis of
Max
Max
Mon
etary
Max
Max
Ben
efit fo
rM
axLimit fo
rW
aiting
active
Weekly
Weekly
Dur
ation
PTD
Weekly
Dur
ation
PTD
Weekly
"Uns
ched
uled
Weekly
Dep
ende
ncy
State
Period
Period
Ben
efit
Ben
efit
(Weeks
)Calcu
lation
Ben
efit
(Weeks
)Ben
efits
Ben
efit
Injuries"
Ben
efita
Ben
efits
South
7 days
14 days
$75 if wages
$838
Up to 500 weeks
66 2/3% PIWW
$838
500 weeksz
403,460
Depends on
340 weeks
$838
500 weeks
Carolina
are >$75;
scheduled body
otherwise,
part
comp rate
is equal to
wages
South
77 days
$391
$781
Duration of
66 2/3% PIWW
$781
NoNone
$781
312 weeks
Spouse =
None
Dakota
consecutive
TTD disability
$762 With
days,
Children =
TTD only
$762 +
$11.51 per
child
Tennessee
7 days
14 days
$136
$992
450 weeks
66 2/3% PIWW
$902
Until age 65
None
$902
450 weeks
$902
$405,900
Texas
7 days
14 days
$137
$913
104 weeks
TTD 70% AWW;
$913
NoNone
$639
401 weeks
$913
None
PTD 75%; PPD 70%
Utah
3 days
14 days
$45
$855
312 weeks
66 2/3% AWW
$855
Noaa
None
$570
312 weeks
$727
None
at time of injury not
to exceed 85% of
the SAWW
Vermont
3 days TTD; 8
10 days,
$427
$1,281
Duration of
66 2/3% PIWW
$1,281
NoNone
$1,281
405 weeks
$1,281
None
abdays PTD; no
TTD only
disability; insurer
for non-spinal;
waiting period
must review
550 weeks spinal
for medical
after 2 years
benefits
Virginia
7 days
21 days
$261
$1,043
500 weeks
66 2/3% PIWW
$1,043
500 weeks
None
$1,043
500 weeks
$1,043
500 weeks
Washington
The 3 days
14$43a
c$1,361
Duration of TTD
60% to 75%
$1,361
None
There is a
$1,361
$199,247
$1,361
N/A
immediately
calendar
disability
(depending on
maximum
following the
days im-
marital status
payment
DOI
mediately
and number of
for lump sums
following
children)
only, up to
the DO
I$8,500
Dea
th B
enefits (D
B)
Perm
anen
t Partial D
isab
ility
(PPD)
Perm
anen
t Total D
isab
ility (PTD)
Tempo
rary Total D
isab
ility (TTD)
Waiting
Period

Workers’ Compensation: Benefits, Costs, and Coverage • 81
West Virginia
3 days
7 con-
$193
$787
104 weeks
66 2/3% PIWW
$787
Payable until
None
$551
None
$787
N/A
secutive
age 70, for all
days
PTD awards
granted on or
after 07/1/2003
Wisconsin
3 days
7 non-
20994
Duration of
66 2/3% PIWW
$994
NoNone
$362
1,000 weeks
$994
$298,200 or
consecu-
TTD disability
1,000 weeks
tive days
Wyoming
3 days
9 days
30% of the
SAMW; $872.60
24 months or
66 2/3% PIMW
Wages cannot
Paid for 80
None
Depends on the
None
Cannot
None
statewide
in per week
in extraordinary
or SAM
Wexceed the
months then
date of Injury
exceed
AMW or 2/3 of
terms for
circumstances
SAWW for the
benefit becomes
more than 2x
the actual
01/18
may extend
quarter in which
extended PTD
the SAMW;
monthly
beyond to
PTD is
and extended
$1745.20
earnings at
provide a
determined;
PTD must be
per week
the time of
reasonable
SAMW of
renewed
for 01/18
injury, which-
recooperation
$872.60
annually
ever is
period
in per week
greater, but
terms for 01/18
shall not
exceed the
lesser of the
100% of the
actual
monthly
earnings
aFo
r bo
th "Sp
ouse
Onl
y" and
"Sp
ouse
plu
s Chi
ldre
n" u
nles
s oth
erw
ise n
oted
.b
Unl
ess c
laim
ant i
s in
a re
empl
oym
ent t
rain
ing
prog
ram
, in
whi
ch cas
e PP
I be
nefit
s can
be pa
id at t
he w
eekl
y T
TD
rat
esc
Ben
efit
paya
ble to
wid
ower
cea
ses 1
2 ye
ars a
fter
dea
th d
ate, u
nles
s at t
ime of
dea
th w
idow
/er is
PTD
or re
ache
s age
52
befo
re th
e 12
yea
rs exp
ire. C
hild
ren
elig
ible to
rece
ive D
B u
ntil
18 y
ears o
ld; o
r if
19or
old
er and
is w
holly
dep
ende
nt u
pon
the de
ceas
ed em
ploy
ee and
inca
pabl
e of
self-
supp
ort b
y re
ason
of m
enta
l or ph
ysical d
isabi
lity;
and
per
sons
of a
ny age
whi
le th
ey are
atten
ding
the fir
st fo
ur y
ears o
fvo
catio
nal s
choo
l, trad
e sc
hool
, or co
llege
; and
per
sons
of a
ny age
whi
le th
ey are
atten
ding
hig
h sc
hool
.d
Bas
ed o
n Arizo
na's
AM
W. C
alcu
late
d by
find
ing
Arizo
na's
aver
age da
ily w
age an
d m
ultip
lyin
g it
times
seve
n.e
The
re are
som
e lim
ited
exce
ptio
ns w
here
ben
efits
can
be pa
id fo
r 24
0 w
eeks
. f
Am
ount
may
be hi
gher
bas
ed o
n La
bor C
ode 47
03.5
gO
r at
5 y
ears fo
llow
ing
dete
rmin
atio
n of
PT
D fo
r an
acc
iden
t dat
e on
or af
ter an
em
ploy
ee re
ache
s age
70
hBen
efits
can
ext
end
beyo
nd age
75
if th
e in
divi
dual d
oes n
ot q
ualif
y fo
r So
cial S
ecur
ity b
enef
its d
ue to
the in
jury
resu
lting
in m
any
misse
d qu
arte
rs o
f wor
k, th
us p
reve
ntin
g elig
ibili
ty fo
r So
cial S
ecur
itybe
nefit
s. i
Spou
se also
ent
itled
to tu
ition
ben
efit
at v
ocat
iona
l tec
hnical cen
ter or
com
mun
ity col
lege
j$2
20 if
no
depe
nden
ts, w
ith a m
axim
um o
f $33
0 if
4 or
mor
e de
pend
ants. I
n all c
ases
claim
ant r
eceive
s rat
e ba
sed
on act
ual w
ages
if le
ss th
an st
atut
ory
min
.k
If am
puta
tion
of a m
embe
r or
enu
clea
tion
of an
eye ta
kes p
lace
, wee
kly
PPD
max
imum
is $
1,46
3.80
.L
After
500
wee
ks, a
dditi
onal b
enef
its are
pay
able fr
om se
cond
inju
ry fu
nd in
150
-wee
k in
crem
emnt
s. T
TD
ben
efits
subj
ect t
o ch
ild su
ppor
t with
hold
ing.
mD
oes n
ot app
ly to
fire
fight
ers.
n52
0 w
eeks
und
er §
213.
No
dura
tiona
l lim
it un
der §2
12.

82 NATIONAL ACADEMY OF SOCIAL INSURANCE
Table C continuedWorkers' Compensation State Laws as of January 2018
o 144 months or on the date of what would have been the 70th birthday of the deceased employee, provided that a mini-mum of 5 years of death benefits has been paid
p 800 weeks conclusive payment with factual determination therefaterq If an individual returns to work but is still on medical restrictions resulting in a wage less than PIWW, he/she may be
eligibile for partial benefits equal to 80 percent of the after-tax value of the difference between the new wage and PIWW. r 102% of SAWWs Any day on which a worker earns less than full wage because of an injury is considered a day of disability for the waiting
period, and neither the 5 day period nor the 14-day period have to consist of consecutive calendar days.t Unless the worker waives the retroactive payment and receives sick leave benefit from the employer instead.u Consecutive or cumulative days within a 20 day period, TTD onlyv If AWW is 30 percent or less of SAWW, employee is compensated at rate equal to their AWW, but not to exceed 90 percent
of employee's after-tax earningsw And extended by commission if employee has sustained a total loss of wage-earning capacityx If the worker returns to work, the workers' wages plus PTD may not exceed the workers' wage at injuryy Disability under PA laws means loss of earning power. PA law allows employer/insurer to request "Impairment Rating
Examination" after employee has received 104 weeks of full benefit payments. If IRE shows less than 50% impairmentbased on AMA Guides then benefits are reclassified as partial disability compensation and are subject to a 500-week cap.
z Except for paraplegic, quadrpalegic, or brain damage benefits for lifeaa PTD benefits are awarded for life, but PTD status may be reexamined by submitting employee to reasonable medical
evaluations, rehabilitation & retraining efforts, disclosure of Federal Income Tax returnsab There is no statutory limit but after minimum of 330 weeks spousal benefits end at age 62 when eligible for Social Security,
or with remarriageac $43.19 if DOI prior to 7/08. 100% of the workers' gross monthly wage if DOI after 7/08. With dependents 15% of the
statewide SAMW+$10 for spouse+$10 for each dependent up to 5 dependent
PIWW Pre-injury Weekly wage
PIMW Pre-injury Monthly wage
AWW Average weekly wage
NWW Net weekly wage
SAWW State-wide average weekly wage
SAMW State-wide average monthly wage
AMW Average Monthly wage
Sources: U.S. Chamber of Commerce (2018); Arizona Industrial Commission; Arkansas Workers' Compensation Commission; Colorado Department of Labor and Employment; Connecticut Workers' Compensation Commis-sion; Florida Division of Workers' Compensation; Idaho Industrial Commission; Workers' Compensation Board ofIndiana; Maryland Workers' Compensation Commission; Massachusetts Labor and Workforce Department; Missouri Department of Labor & Industrial Relations; Montana Department of Labor & Industry; Nevada Department of Business & Industry; Oregon Workers' Compensation Division; Pennsylvania Department of Labor& Industry; Rhode Island Department of Labor and Training; South Carolina Workers' Compensation Commission; South Dakota Department of Labor & Regulation; Tennessee Department of Labor & Workforce Development; Vermont Department of Labor; Virginia Workers' Compensation Commission; Washington Department of Labor and Industries; West Virginia Offices of the Insurance Commissioner; Wisconsin Departmentof Workforce Development; Wyoming Department of Workforce Services

A.M. Best. 2018. Private Data Request. Oldwick,NJ: A.M. Best.
Azaroff, Lenore S., Charles Levenstein, and DavidWegman. 2002. “Occupational Injury and IllnessSurveillance: Conceptual Filters ExplainUnderreporting.” American Journal of Public Health92 (9): 1421–1429.
Barth, Peter, and Michael Niss. 1999. PermanentPartial Disability Benefits: Interstate Differences.Cambridge, MA: Workers Compensation ResearchInstitute.
Biddle, Jeff, Karen Roberts, Kenneth D. Rosenman,and Edward M. Welch. 1998. “What Percentage ofWorker with Work-Related Illness Receive Workers’Compensation Benefits?” Journal of Occupationaland Environmental Medicine 40 (4): 325– 331.
Boden, Leslie I., and Al Ozonoff. 2008. “Capture-Recapture Estimates of Nonfatal Workplace Injuriesand Illnesses.” Annals of Epidemiology, 18 (6): 500-506.
Bogyo, Terry. 2018. “Does workers’ compensationcover the full cost of a funeral for a work-relateddeath,” Workers’ Compensation Perspectives. Accessedon June 15, 2018. Retrieved from: http://worker-scompperspectives.blogspot.com/2018/04/does-workers-compensation-cover-full.html
Burton, John F., Jr. 2008. “Workers’ CompensationCash Benefits: Part Two: Cash Benefit Systems andCriteria for Evaluation.” Workers’ CompensationPolicy Review 8 (6): 1331.
———. 2013. “Workers’ Compensation Costs forEmployers, National and State Data.” Workers’Compensation Resources Research Report 6:3-26.
———. 2015. “Workers’ Compensation Costs forEmployers: 1986-2014.” Workers’ CompensationResources Research Report 10: 1-23.
Burton, John F., Jr., and Daniel J.B. Mitchell. 2003.“Employee Benefits and Social Insurance: TheWelfare Side of Employee Relations.” IndustrialRelations to Human Resources and Beyond, Bruce E.
Kaufman, Richard A. Beaumont, and Roy B.Helfgot (Eds). Armonk, NY: M.E. Sharpe.
Burton, John F., Jr. and Xuguang (Steve) Guo. 2016.“Improving the Interaction Between the SSDI andWorkers’ Compensation Programs,” SSDI Solutions:Ideas to Strengthen the Social Security DisabilityInsurance Program, Jim McCrery and Earl Pomeroy(Eds.). West Conshohocken, PA: Infinity Publishing.
Centers for Medicare & Medicaid Services (CMS).2018. Private data request.
Clayton, Ann. 2004. “Workers’ Compensation: ABackground for Social Security Professionals.” SocialSecurity Bulletin 65 (4): 715.
Duff, Michael C. 2018. “Wyoming’s StrangeWorkers’ Compensation Non-Relationship WithWalmart.” Workers’ Compensation Law Prof Blog.Accessed July 6, 2018. Retrieved from: https://work-erscompprof.com/2018/06/18/wyomings-strange-workers-compensation-non-relationship-with-walmart-workers-compensation-law-prof-blog/
Fan, Zihong Joyce, David K Bonauto, Michael P.Foley, and Barbara A. Silverstein. 2006.“Underreporting of Work-Related Injury or Illness toWorkers’ Compensation: Individual and IndustryFactors.” Journal of Occupational and EnvironmentalMedicine, 48 (9): 914-922.
Fishback, Price V., and Shawn Everett Kantor. 1996.“The Adoption of Workers’ Compensation in theUnited States, 1900-1930.” NBER Working PaperSeries 5840.
Fomenko, Olesya, and Jonathan Gruber. 2016. DoHigher Fee Schedules Increase the Number of Workers’Compensation Cases? Cambridge, MA: WorkersCompensation Research Institute WC-16-21.
Galizzi, Monica, Petra Miesmaa, Laura Punnett,Craig Slatin, and PHASE. 2010. “Injured Workers’Underreporting in the Health Care Industry.”Industrial Relations 49: 22–42.
Glynn, Sarah Jane, Alexandra L. Bradley, andBenjamin W. Veghte. 2017. Paid Family and
Workers’ Compensation: Benefits, Costs, and Coverage • 83
References

Medical Leave Programs: State Pathways and DesignOptions. Washington, DC: National Academy ofSocial Insurance.
Grabell, Michael and Howard Berkes. 2015. “InsideCorporate America’s Campaign to Ditch Workers’Comp.” ProPublica.
Gruber, Jonathan, and Alan B. Krueger. 1991. “TheIncidence of Mandated Employer-ProvidedInsurance: Lessons from Workers’ CompensationInsurance.” Tax Policy and the Economy 5: 111-143.
Guo, Xuguang (Steve), and John F. Burton, Jr. 2012.“The Growth in Applications for Social SecurityDisability Insurance: A Spillover Effect fromWorkers’ Compensation.” Social Security Bulletin72(3): 69-88.
Hipple, Stephen F. and Laurel A. Hammond. 2016.“Self-Employment in the United States.” U.S.Bureau of Labor Statistics.
Hunt, H. Allan. 2004. Adequacy of EarningsReplacement in Workers’ Compensation Programs.Washington DC: National Academy of SocialInsurance and W.E. Upjohn Institute forEmployment Research.
Hunt, H. Allan, and Marcus Dillender, 2014.“Benefit Adequacy in State and Provincial Workers’Compensation Programs.” Employment Research21(4): [1]-4.
IAIABC–WCRI. 2016. Workers’ Compensation Laws,January 2016, WC-16-43. (Joint Publication ofIAIABC and Workers Compensation ResearchInstitute). Cambridge, MA.
Integrated Public Use Microdata Series – CurrentPopulation Survey (IPUMS-CPS). 2018. CurrentPopulation Survey Data for Social, Economic andHealth Research.
Krohm, Gregory C. 2011. “Wisconsin’s Role inPioneering Workers’ Compensation.” In Reflectionson the History and Development of Workers’Compensation in the United States, Gregory C.Krohm (Ed), 185-93. Madison, WI: InternationalAssociation of Industrial Accident Boards andCommissions.
Lashuay, Nan, and Robert Harrison. 2006. “Barriersto Occupational Health Services for Low-WageWorkers in California.” Commission on Health andSafety and Workers’ Compensation, CaliforniaDepartment of Industrial Relations.
Leigh, J. Paul, Steven Markowitz, Marianne Fahs,and Philip Landrigan. 2000. Costs of OccupationalInjuries and Illnesses. Ann Arbor, MI: The Universityof Michigan Press.
Leigh, J. Paul, and James P. Marcin. 2012. “Workers’Compensation benefits and Shifting Costs forOccupational Injury and Illness.” Journal ofEnvironmental Medicine 54(4): 445-450.
Manley, Mike. 2013. “Comments on Workers’Compensation Costs for Employers: National andState Data.” Workers’ Compensation Resources ResearchReport, Supplement 6: 3-5.
McInerney, Melissa, and Kosali Simon. 2012. “TheEffect of State Workers’ Compensation ProgramChanges on the Use of Federal Social SecurityDisability Insurance.” Industrial Relations 51(1): 1-177.
Milton, Donald K., Gina M. Solomon, Richard A.Rosiello, and Robert F. Herrick. 1998. “Risk andIncidence of Asthma Attributable to OccupationalExposure among HMO Members.” AmericanJournal of Industrial Medicine 33: 110.
Morse, Timothy F., Charles Dillon, NicholasWarren, Charles Levenstein, and Andrew Warren.1998. “The Economic and Social Consequences ofWork-Related Musculoskeletal Disorders: TheConnecticut Upper Extremity Surveillance Project(CUSP),” International Journal of Occupational &Environmental Health 4: 209-216.
National Conference of State Legislatures (NCSL).2013. 2013 Workers Compensation EnactedLegislation. Washington, DC: NCSL.
National Conference of State Legislatures (NCSL).2014. 2014 Workers Compensation EnactedLegislation. Washington, DC: NCSL.
National Association of Insurance Commissioners(NAIC). 2017. Statistical Compilation of AnnualStatement Information for Property/Casualty Insurance
84 NATIONAL ACADEMY OF SOCIAL INSURANCE

Companies in 2016. Kansas City, MO: NAIC.Similar publication for the years 1998-2016.
National Council on Compensation Insurance, Inc.(NCCI). 2018. Private Data Request. Boca Raton,FL: NCCI.
———. 2018a. Annual Statistical Bulletin, ed. 2018.Boca Raton, FL: NCCI. Similar publication for theyears 1997-2017.
Neuhauser, Frank, Jasjeet Sekhon, Mark Priven,Rena David, Nicola Wells, Christine Baker, and JonStiles. 2010. “Integration of Occupational MedicalCare into Health Insurance: An Answer to FinancingUniversal Coverage?” U.C. Berkeley Institute for theStudy of Societal Issues Working Paper. Berkeley,CA.
Occupational Safety & Health Administration(OSHA). 2015. Adding Inequality to Injury: TheCosts of Failing to Protect Workers on the Job. U.S.Department of Labor, OSHA.
O’Leary, Paul, Leslie I. Boden, Seth A. Seabury, AlOzonoff, and Ethan Scherer. 2012. “WorkplaceInjuries and the Take-Up of Social SecurityDisability Benefits.” Social Security Bulletin 72(3): 1-17.
Oregon Department of Consumer and BusinessServices. 2016. Oregon Workers’ CompensationPremium Rate Ranking: Calendar Year 2016. CentralServices Division, Information and Research Section.
Oklahoma Workers’ Compensation Commission.2018. State of Oklahoma Workers’ CompensationCommission 2017 Annual Report. Oklahoma City,OK.
Pransky, Glenn, Terry Snyder, Allard Dembe, andJay Himmelstein. 1999. “Under Reporting of WorkRelated Disorders in the Workplace: A Case Studyand Review of the Literature.” Ergonomics 42: 171-182.
Rappin, Christina L., Sara E. Wuellner, and DavidK. Bonauto. 2016. “Employer Reasons for Failing toReport Eligible Workers’ Compensation Claims inthe BLS Survey of Occupational Injuries andIllnesses.” American Journal of Industrial Medicine59(5): 343-356.
Reville, Robert T., and Robert F. Schoeni. 2004.“The Fraction of Disability Caused at Work.” SocialSecurity Bulletin 65(4): 31-37.
Rosenman, Kenneth D., Alice Kalush, Mary JoReilly, Joseph C. Reeves, Matthew J. Reeves, andLuo Zhehui. 2006. “How Much Work-RelatedInjury and Illness is Missed by the Current NationalSurveillance System?” Journal of Occupational andEnvironmental Medicine, 48 (4): 357-365.
Savych, Bogdan, and H. Allan Hunt. 2017.Adequacy of Workers’ Compensation Income Benefits inMichigan. Cambridge, MA: Workers’ CompensationResearch Institute WC-17-20.
Seabury, Seth A., Ethan Scherer, Paul O’Leary, AlOzonoff, and Leslie I. Boden. 2014. “Using LinkedFederal and State Data to Study the Adequacy ofWorkers’ Compensation Benefits.” American Journalof Industrial Medicine 57(10): 1165-1173.
Social Security Administration (SSA). 2017. Officeof Research, Evaluation, and Statistics. AnnualStatistical Supplement, 2016. Washington, DC: SSA.
———.2017a. Unpublished Data from the Office ofDisability. Baltimore, MD: SSA.
———. 2017b. The 2016 Annual Report of theBoard of Trustees of the Federal Old Age and SurvivorsInsurance and Disability Insurance Trust Funds.Washington, DC: SSA.
Spieler, Emily A., and John F. Burton, Jr. 2012.“The Lack of Correspondence between WorkRelated Disability and Receipt of Workers’Compensation Benefits.” American Journal ofIndustrial Medicine 55: 487505.
Spieler, Emily A. 2017. “(Re)assessing the GrandBargain: Compensation for Work Injuries in theUnited States, 1900-2017.” Rutgers University LawReview 69: 891-1014.
Stanbury, Martha, Patrick Joyce, and Howard Kipen.1995. “Silicosis and Workers’ Compensation in NewJersey.” Journal of Occupational EnvironmentalMedicine 37: 1342-1347.
Strunin, Lee, and Leslie I. Boden. 2004. “TheWorkers’ Compensation System: Worker Friend or
Workers’ Compensation: Benefits, Costs, and Coverage • 85

Foe?” American Journal of Industrial Medicine45(4):338-345.
Tennessee Bureau of Workers’ Compensation. 2017.Annual Report to the General Assembly of the State ofTennessee on the Impact of the 2013 Workers’Compensation Reform Act. Nashville, TN: TennesseeBureau of Workers’ Compensation.
Texas Department of Insurance (TDI). 2016. Employer Participation in the Texas Workers’Compensation System: 2016 Estimates. Dallas, TX:Texas Department of Insurance Workers’Compensation Research and Evaluation Group.
Thomason, Terry, Timothy P. Schmidle, and John F.Burton, Jr. 2001. Workers’ Compensation: Benefits,Costs, and Safety under Alternative InsuranceArrangements. Kalamazoo, MI: W.E. UpjohnInstitute for Employment Research.
U.S. Census Bureau. 2005. The Number of Firmsand Establishments, Employment, Annual Payroll, andReceipts in 1997 by Industry and Employment Size ofEnterprise. Washington, DC: U.S. Census Bureau.
———. 2016. Statistics of U.S. Businesses (SUSB),2015. Washington, DC: U.S. Census Bureau.
U.S. Chamber of Commerce (COC). 2018. 2018Analysis of Workers’ Compensation Laws. Washington,DC: U.S. COC.
U.S. Department of Justice (DOJ). 2018. RadiationExposure Compensation Act. Washington, DC: U.S.DOJ.
U.S. Department of Labor (DOL). 2008. AnInterim Report to Congress on Occupational Diseases,Assistant Secretary for Policy Evaluation andResearch. Washington, D.C.
———. 2017. Bureau of Labor Statistics. NationalCensus of Fatal Occupational Injuries in 2016.Washington, DC: U.S. DOL.
———. 2017a. Bureau of Labor Statistics. Survey ofOccupational Injuries and Illnesses, 2016.Washington, DC: U.S. DOL.
———. 2017b. Bureau of Labor Statistics.Quarterly Census of Employment and Wages.Washington, DC: U.S. DOL.———. 2017c. Bureau of Labor Statistics. NationalCompensation Survey: Employee Benefits in the UnitedStates, March 2017. Washington, DC: U.S. DOL.
———. 2017d. Bureau of Labor Statistics. CurrentPopulation Survey. Washington, DC: U.S. DOL.
———. 2018. Private Data request from the Officeof Workers’ Compensation Program, U.S. DOL.
———. 2018a. Bureau of Labor Statistics. EmployerCosts for Employee Compensation – March 2018.USDL-18-0944. Washington, DC: U.S. DOL.
U.S. Department of Veterans Affairs (VA): VeteransBenefit Administration. 2017. Annual BenefitsReport, Fiscal Year 2016. Washington, DC: U.S.Department of Veterans Affairs.
U.S. Government Accountability Office (GAO),2009. Enhancing OSHA’s Records Audit Process CouldImprove the Accuracy of Worker Injury and IllnessData. Washington, DC: GAO-10-10.
Victor, Richard A., Olesya Fomenko, and JonathanGruber. 2015. Will the Affordable Care Act ShiftClaims to Workers’ Compensation Payors? Cambridge,MA: Workers Compensation Research InstituteWC-15-26.
Willborn, Steven L., Stewart J. Schwab, John F.Burton, Jr., and Gillian L.L. Lester. 2017.Employment Law: Cases and Materials (SixthEdition). Durham, NC: Carolina Academic Press.
Williams, C. Arthur, and Peter S. Barth. 1973.Compendium on Workmen’s Compensation.Washington, DC: National Commission on StateWorkmen’s Compensation Laws.
86 NATIONAL ACADEMY OF SOCIAL INSURANCE


www.nasi.orgISBN: 1-884902-63-4