what do americans want? - national academy of social insurance · the national academy of social...
TRANSCRIPT

StrengtheningSocial Security:
What Do Americans Want?
Jasmine V. Tucker, Virginia P. Reno, and Thomas N. Bethell

The National Academy of Social InsuranceFounded in 1986, the National Academy of Social Insurance (NASI) is a nonprofit, nonpartisan organization made up of the nation’s leading experts onsocial insurance. Social insurance encompasses broad-based systems thathelp workers and their families pool risks to insure against loss of income dueto retirement, death, disability, or unemployment, and to ensure access tohealth care. NASI’s mission is to advance solutions to challenges facing thenation by increasing public understanding of how social insurance contributesto economic security. For more information, visit: www.nasi.org.
1776 Massachusetts Avenue, NW, Suite 400Washington, DC [email protected]: @socialinsurance
Support from the Ford Foundation’s Building Economic Security over a Lifetimeinitiative contributed to this study. Jasmine V. Tucker, Income SecurityResearch Associate, Virginia P. Reno, Vice President for Income SecurityPolicy, and Thomas N. Bethell, Senior Fellow at the National Academy ofSocial Insurance prepared this report. Elisa Walker, Income Security PolicyAssociate, provided helpful comments and review. Jill Braunstein, NASI’sDirector of Communications, oversaw layout and production of the report. As with all NASI products, the report was reviewed by NASI member experts to ensure that it meets the organization’s criteria for clarity, completeness,accuracy and objectivity. The findings in this report do not represent recom-mendations of the Academy, its staff, or its Board of Directors. MathewGreenwald & Associates partnered with NASI in conducting this study.
Mathew Greenwald & AssociatesMathew Greenwald & Associates is a market research firm headquartered inWashington, D.C. Founded in 1985, the firm has extensive experience in bothquantitative and qualitative analysis of public opinion and consumer prefer-ences in fields ranging from financial services to health, retirement, and agingpolicy. The firm’s principal, Mathew Greenwald, Ph.D., was formerly the direc-tor of social research at the American Council of Life Insurers, and has been amember of the National Academy of Social Insurance since 2002. For moreinformation, visit www.greenwaldresearch.com
4201 Connecticut Avenue, NW, Suite 620Washington, DC 20008(202) [email protected]
©National Academy of Social InsuranceISBN: 1-884902-59-6
Board of Directors
Lisa MensahChair
G. Lawrence AtkinsPresident
Jacob HackerVice President
Jennie Chin Hansen Secretary
Jane L. RossTreasurer
Nancy J. Altman
Christine Baker
Robert Berenson
Judy Feder
Marty Ford
Michael Graetz
Janice Gregory
G. William Hoagland
Renée Landers
Christopher O’Flinn
William M. Rodgers, III
Gerald Shea
Founding ChairRobert M. Ball
Executive Vice PresidentPamela J. Larson
VP for Income Security PolicyVirginia P. Reno
VP for Health PolicyLee Goldberg

StrengtheningSocial Security:
What Do Americans Want?
Jasmine V. Tucker, Virginia P. Reno, and Thomas N. Bethell


Strengthening Social Security: What Do Americans Want? i
Executive Summary 1
Key Findings 1
Social Security Basics 4
What This Study Found 7
Attitudes and Knowledge about Social Security 7
Americans Have Favorable Views of Social Security 7
Americans Don’t Mind Paying for Social Security 8
Americans Agree Benefits Are Critically Important and Could Be Improved 9
Americans Are Willing to Pay More to Strengthen Social Security 10
Trade-Off Analysis: Americans’ Preferred Packages of Policy Changes 11
Individual Policy Options in the Trade-off Analysis 15
Two Preferred Revenue Increases 17
Three Preferred Benefit Increases 18
Americans’ Attitudes on Other Policy Options 21
Revenue Increases 21
Benefit Reductions 22
Benefit Increases 23
Americans’ Confidence in Social Security’s Future 24
Americans’ Views about Social Security Change
When They Are Given Factual Information 26
Conclusions 29
Methodology 31
Appendices 35
A. Additional Tables 36
B. Questionnaire 39
C. Trade-Off Analysis Examples 50
D. Policy Option Definitions 54
E. Detailed Descriptions and Cost Estimates for Policy Options 57
Contents


Strengthening Social Security: What Do Americans Want? 1
Social Security is the foundation upon which mostAmericans build retirement income. The programhas sufficient funds to pay full benefits until 2033.1
Eventually, as more Americans retire, SocialSecurity is projected to face a long-term financingshortfall. If that were to happen, revenue continu-ing to come into the program from payroll taxesand taxation of benefits would cover about 75 percent of scheduled benefits. The projectedfinancing gap can be closed by raising revenues,reducing benefits, or some combination of both.Steps could also be taken to improve the adequacyof benefits. Doing so would increase programcosts, which in turn — in the absence of otherchanges — would increase Social Security’s projected financing gap. The challenge for policy-makers, then, when choosing among options toincrease Social Security’s revenues, improve bene-fit adequacy, or reduce future benefits, is to makesure that choices are in the public interest.
To better understand Americans’ perspectives onSocial Security and their preferences regardingoptions to strengthen the program for the future,the National Academy of Social Insurance collabo-rated with Mathew Greenwald & Associates toconduct a multigenerational study. The studyincluded an online survey of 2,000 Americans ages 21 and older, conducted by Ipsos Loyalty inSeptember 2012, to explore working and retiredAmericans’ attitudes toward Social Security andthe importance of Social Security benefits to bene-ficiaries’ incomes. The study also included an inno-vative application of trade-off analysis to a publicpolicy issue. This enabled researchers to examinehow survey respondents weighed the appeal orlack of appeal of various packages of Social Securitypolicy options. The study also convened two focusgroups to help refine the survey questionnaire andthe trade-off analysis. The methodology section ofthis report describes the focus groups, the survey,and the trade-off analysis.
Executive Summary
Key Findings
Americans value Social Security, want to improve benefits, and are willing to pay for the program.
� Americans don’t mind paying for Social Security because they value it for themselves (80%), fortheir families (78%), and for the security and stability it provides to millions of retired Americans,disabled individuals, and children and widowed spouses of deceased workers (84%).
� 84% believe current Social Security benefits do not provide enough income for retirees, and 75%believe we should consider raising future Social Security benefits in order to provide a moresecure retirement for working Americans.
� 82% agree it is critical to preserve Social Security for future generations even if it means increasingSocial Security taxes paid by working Americans, and 87% want to preserve Social Security forfuture generations even if it means increasing taxes paid by wealthier Americans.
Americans support a package of changes that eliminates Social Security’sfinancing gap while improving benefits. The trade-off analysis conducted for this study shows that, rather than maintain the status quo, 71% ofAmericans would prefer a package of changes that increases Social Security revenues, pays for benefitimprovements, and eliminates more than 100% of the projected financing gap.

2 www.nasi.org
0% 10% 20% 30% 40% 50% 60% 70% 80%
Household Income
Generation
Total 71%
76%
67%
71%
73%
69%
73%
73%$75,000 or more
$35,000-$74,999
Under $35,000
Generation Y
Generation X
Baby Boomer
Silent
The preferred package would:
� Gradually, over 10 years, eliminate the cap on earnings that are taxed for Social Security. Thiswould mean that the 5% of workers who earn more than the cap ($110,100 in 2012; $113,700 in2013) would pay into Social Security throughout the year, as other workers do.
� Gradually, over 20 years, raise the Social Security tax rate that workers and employers each payfrom 6.2% of earnings to 7.2%. A worker earning $50,000 a year would pay about 50 cents a weekmore each year.
� Raise Social Security’s basic minimum benefit so that someone who paid into Social Security for 30years can retire at 62 or later and not be poor.
� Increase Social Security’s cost-of-living adjustment (COLA) to more accurately reflect the level ofinflation experienced by seniors.
This package would entirely eliminate Social Security’s projected financing gap and provide additionalfunding. The package is preferred over the status quo by large majorities of seniors in the so-called SilentGeneration, born before 1946 (76%); Baby Boomers, born from 1946 to 1964 (71%); and youngerAmericans in Generation X, born from 1965 to 1979 (73%) and Generation Y, born in 1980 and after(67%). See Figure 1.
Figure 1. Support for the Preferred Package of Policy Options in Trade-Off Analysis
Source: National Academy of Social Insurance Survey, September 2012

Strengthening Social Security: What Do Americans Want? 3
Certain changes have a strong impact on the appeal of policy packages.
The trade-off analysis shows that the following specific changes strongly increase the appeal of a package ofpolicy options:
� Gradually, over 10 years, eliminate the cap on earnings that are taxed for Social Security.
� Gradually, over 20 years, raise the Social Security tax rate that workers and employers each payfrom 6.2% of earnings to 7.2%.
� Increase the tax rate that workers and employers each pay in two steps, from 6.2% to 7.2% in 2022and to 8.2% in 2052.
� Keep Social Security’s current full retirement age at 67.
� Do not means-test eligibility for Social Security benefits.
In contrast, the trade-off analysis shows that options that strongly decrease a package’s appeal would:
� Not increase revenues for Social Security.
� Raise Social Security’s full retirement age to 70.
� Means-test eligibility for Social Security benefits.
Americans are counting on Social Security — but are not confident about its future.
� Of those currently receiving Social Security, 96% say it is important to their monthly income, and72% say that without Social Security they would have to make significant sacrifices or would not beable to afford the basics such as food, clothing, or housing. Of those not currently receiving SocialSecurity, 87% say it will be important to their income when they begin receiving benefits.
� 57% of Americans say they are not confident about the future of the program.
� 69% of those not currently receiving Social Security benefits lack confidence that they will receiveall their earned benefits when they retire.
Americans’ views about Social Security change when they are given factual information.
� Official projections show that Social Security has sufficient funds to pay all benefits until 2033.2
Just 18% of Americans knew that Social Security would still be able to pay 75% of scheduled benefits after 2033. Most of the rest did not know, or thought Social Security’s finances would bein far worse shape.
� After learning that raising Social Security payroll taxes from 6.2% to 7.6% for both workers andemployers would ensure that the program could pay full benefits for 75 years, those who consid-ered Social Security financing to be a crisis or a significant problem dropped from 57% to 26%,while those who thought it was a manageable problem or not a problem at all increased from 43%to 74%.
� 72% agree that Social Security — at about 6% of the economy — is affordable. Large majorities ofAmericans agree in each generation, in each family income group, and among Republicans,Democrats, and independents.

4 www.nasi.org
Social Security BasicsSocial Security is the foundation of retirement security for almost all Americans. While monthly benefits
are modest — an average of $1,261 as of December 2012 — they are the main source of income for
most seniors.3 A third of elderly beneficiaries rely on Social Security for almost all (90% or more) of their
income; two-thirds count on it for more than half of their income. The program also provides life insur-
ance and disability income protection to workers and their families. Social Security keeps more than 21
million Americans out of poverty — including 1 million children, 6 million adults under age 65, and 14
million seniors.4
Workers pay for Social Security through deductions from their pay. They pay 6.2% of their earnings up
to an annual cap ($110,100 in 2012; $113,700 in 2013)5 and employers pay a matching amount. In
addition, upper-income beneficiaries pay income taxes on part of their benefits, and these taxes go to
Social Security’s trust fund (with part going to Medicare’s Hospital Insurance trust fund) to pay for future
benefits. Social Security funds that are not used to pay immediate benefits are invested in Treasury
securities and earn interest that is another source of income to the Social Security system.
Social Security is highly efficient. Of every dollar of outgo, less than a penny is spent on administration,
while just over 99 cents goes out in payments to the 56 million Americans who receive benefits as
retired or disabled individuals and their families or as the children and widowed spouses of deceased
workers.6
Official projections indicate that the program will have sufficient funds to pay all scheduled benefits for
the next two decades. Reserves are projected to grow to $3.1 trillion by the end of 2020.7 After 2020,
if the projections do not change and Congress does not act in the meantime to strengthen Social
Security’s finances, the reserves would be drawn down to pay benefits. In the unlikely event that
Congress does not act before 2033, the reserves would be depleted, and revenue continuing to come
into the system from workers’ and employers’ payroll tax contributions and from taxes on benefits
would cover only about 75% of scheduled benefits.8
Over Social Security’s 78-year history, policymakers have never failed to ensure that legislated benefits
are paid. Lawmakers have many options to strengthen Social Security funds for the future. The most
recent major changes to Social Security were enacted in 1983. The biggest change affecting Baby
Boomers and younger workers is the gradual increase in the age of eligibility to receive full retirement
benefits, from 65 (for workers born before 1939) to 67 (for workers born in 1960 and later). That
increase in the retirement age means that Americans age 53 and younger today face a permanent ben-
efit reduction of 13-14% from what they would have received if the retirement age were still 65. The
second important change made Social Security benefits subject to income taxes. Legislation enacted
in 1983 (and expanded in 1991) provides for taxing part of Social Security benefits and returning the
tax revenues to the Social Security and Medicare trust funds.

Age When Benefits Are Claimed
$0
$250
$500
$750
$1,000
$1,250
$1,500
706968676665646362
Mon
thly
Pay
men
t A
mou
nt*
Source: Reno, Virginia P. and Elisa A. Walker. 2012. Social Security Benefits, Finances, and Policy Options: A Primer.
Washington, DC: National Academy of Social Insurance.
*Monthly payment reflects 8% delayed retirement credit after FRA
Increase in Full Retirement Age (FRA) from 65 to 67 Lowers Benefits
Payment to a retiree entitled to $1000 a month at FRA when:
� FRA is 65 � FRA is 67
Strengthening Social Security: What Do Americans Want? 5
The combined effect of raising the full retirement
age and taxing benefits is a reduction of net
“take-home” benefit income for future retired
beneficiaries of about 23%, on average. The
retirement age change lowers benefits for all
retirees as shown in the chart above; taxation of
benefits lowers net take-home benefits more for
upper-income beneficiaries. The 1983 legislation
did not provide for balancing these benefit cuts
with any increase in payroll tax contributions from
employees and employers, nor has any subse-
quent action by Congress. This study finds that
the public now wants to make Social Security
benefits more adequate and remedy its finanac-
ing gap by increasing payroll tax contributions.

6 www.nasi.org

Strengthening Social Security: What Do Americans Want? 7
What This Study FoundThis study sought to learn Americans’ preferencesabout options to strengthen the Social Securityprogram for the future. The survey first asked atti-tudinal questions to ascertain Americans’ overallviews of Social Security, their confidence in itsfuture, their willingness to consider increasing orreducing future benefits, and their willingness topay for the program now and in the future. Thesurvey then asked respondents whether they favoror oppose 14 specific policy changes. Each poten-tial policy change included an estimate of itsimpact on Social Security’s long-term financinggap. Options that would improve benefit ade-quacy would increase the financing gap, whileoptions that would raise future revenues or reducefuture benefits would reduce or eliminate the gap.
Several of the 14 Social Security policy changeswere also examined in the trade-off analysis. The
trade-off analysis determined which package ofpolicy options is preferred by survey participantsand the proportion of participants who favor thatpackage over the status quo – that is, over leavingSocial Security unchanged. In this study, findingsfrom the exploratory use of trade-off analysisenrich and reinforce findings from the attitudinalsurvey.
Attitudes and Knowledgeabout Social SecurityAmericans Have Favorable Views ofSocial Security Nearly 3 in 4 Americans (72%) say they have afavorable view of Social Security. This positiveviewpoint is shared across generations (Table 1).While seniors — members of the so-called “SilentGeneration” —are most likely to view Social
Table 1. Overall Views of Social Security, by Generation, Family Income and Party Affiliation
Overall, is your view of Social Security favorable or unfavorable? (percent favorable)
Total 72
Generation (Year of Birth)
Silent (before 1946) 85Baby Boomer (1946-1964) 73Generation X (1965-1979) 70Generation Y (1980 and later) 65
Family Income
Less than $30,000 70$30,000 to $49,999 75$50,000 to $74,999 68$75,000 to $99,999 74$100,000 or more 75
Party Affiliation
Republican 59Democrat 79Independent 74
Source: National Academy of Social Insurance Survey, September 2012

8 www.nasi.org
Table 2. Willingness to Pay for Social Security and Views on Increasing Benefits
Percent PercentQuestions Agree Strongly Agree
I don’t mind paying Social Security taxes because it provides security and stability to millions of retired Americans, disabled individuals, and the children and widowed spouses of deceased workers. 84% 46%
I don’t mind paying Social Security taxes because I know I would have to help support my parents, grandparents, or other family members if they did not receive Social Security. 78 40
I don’t mind paying Social Security taxes because I know that I will be receiving benefits when I retire. 80 48
Social Security benefits now are more important than ever to ensure that retirees have a dependable income. 89 57
Some people believe that Social Security benefits do not provide enough income for retirees. Do you agree or disagree that Social Security benefits are inadequate? 84 39
To provide a more secure retirement for working Americans, we should consider increasing Social Security benefits. 75 39
Source: National Academy of Social Insurance Survey, September 2012
Security favorably (85%), that view is shared bynearly 3 in 4 (73%) Baby Boomers (hereafter iden-tified simply as “Boomers”); 70% of Americans inGeneration X; and nearly two-thirds (65%) ofAmericans in Generation Y.
Favorable views of Social Security are reported bylarge majorities of Americans at all family incomelevels – with 70% of those in the lowest annualincome group (below $30,000) and 75% of thosein the top income group ($100,000 and higher)reporting favorable views. Moreover, in contrastto their disagreements on many other issues,majorities of Republicans (59%), Democrats(79%), and independents (74%) share a favorableview of the Social Security program.
Americans Don’t Mind Paying for Social Security
A more compelling test of Americans’ support forthe Social Security program is whether they arewilling to pay for it. As noted, Social Security isfinanced mainly by workers’ and employers’ payrolltax contributions. Workers have 6.2% of earningsdeducted from their paychecks to finance SocialSecurity, with their contributions matched by theiremployers. (Under a payroll tax holiday enacted byCongress in 2010, the worker’s share was temporar-ily reduced to 4.2% in 2011 and 2012.)10
Large majorities of Americans, both working andretired, say they do not (or did not) mind payingSocial Security taxes because it helps millions ofpeople (84%) and because they (80%) or theirfamilies (78%) benefit from it (Table 2).

Strengthening Social Security: What Do Americans Want? 9
Table 3. Views on Importance of Social Security, Paying Taxes, and Increasing Benefits, by Generation,
Family Income and Party Affiliation(Percent Agreeing)
I don’t/didn’t Social Security mind paying Social … we should
Respondent benefits now are Security taxes because consider increasingCharacteristics more important it provides security Social Security
than ever… and stability to millions… benefits.
Total 89% 84% 75%
Generation
Silent 93 88 72Baby Boomer 93 86 76Generation X 87 85 74Generation Y 84 79 74
Family Income
Less than $30,000 89 83 80$30,000 to $49,999 93 90 78$50,000 to $74,999 89 82 70$75,000 to $99,999 87 82 71$100,000 or more 88 86 67
Party Affiliation
Republican 81 74 62Democrat 94 91 84Independent 91 86 71
Source: National Academy of Social Insurance Survey, September 2012
In a striking show of support, nearly half (46%) of
Americans strongly agree that they don’t mind
paying Social Security taxes because of the
stability and security that Social Security provides to
the millions of people who rely on benefits.
In a striking show of support, nearly half (46%)of Americans strongly agree that they don’t mindpaying Social Security taxes because of the stability and security that Social Security providesto the millions of people who rely on its benefits— retired and disabled Americans and the children and widowed spouses of deceased workers.
Americans Agree Benefits Are CriticallyImportant and Could Be Improved
Other indicators of support for Social Security arerespondents’ agreement that benefits are criticallyimportant in today’s uncertain economy, that ben-efits are not as adequate as they might wish, andthat benefit increases merit consideration (Table 3).

10 www.nasi.org
� 89% of Americans agree that “Social Securitybenefits now are more important than everto ensure that retirees have a dependableincome.” Those in agreement include nearly6 in 10 (57%) who strongly agree with thestatement.
� 84% believe that Social Security benefits areinadequate, and 75% believe we should con-sider increasing benefits in order to provide amore secure retirement for workingAmericans.
Willingness to pay for Social Security and to con-sider increasing benefits is widespread and sharedacross generations. Seniors in the SilentGeneration, Boomers in mid-career and approach-ing retirement, and younger workers inGeneration X and Generation Y show consistentagreement on these issues. Higher- and lower-income Americans also agree. Among Democrats,Republicans, and independents, clear majoritiesagree that Social Security benefits are more impor-tant than ever in today’s volatile economy; theydon’t mind paying Social Security taxes becausethey see the value of the program to millions ofAmericans; and proposals to improve the adequacyof Social Security benefits merit consideration.
Americans Are Willing to Pay More toStrengthen Social Security
As noted, Social Security is financed mainly bypayroll tax contributions deducted from workers’paychecks and matched by their employers. Onlyearnings up to a cap (which was $110,100 in2012 and is $113,700 in 2013) are taxed andcounted toward benefits. About 5% of all workersearn more than the cap; they and their employersstop paying into Social Security when they reachthe cap. In 2012, for example, a worker earning$130,000 annually stopped paying taxes when hisor her earnings reached $110,100 in November,while someone making $1 million stopped payingin February. Proposals to increase revenues forSocial Security include raising or eliminating theearnings cap. That change would affect the 5% ofworkers whose earnings exceed the cap. Anotherway to increase Social Security revenues is toincrease the 6.2% payroll tax rate that workers andemployers each pay. That would affect all workerswho pay into Social Security. The survey exploredAmericans’ views on who should pay more in orderto improve Social Security’s finances (Table 4).
� When asked whether they agreed or dis-agreed that “It is critical to preserve SocialSecurity even if it means increasing SocialSecurity taxes paid by working Americans,”
Table 4. Views on Paying More to Preserve Social Security
Percent Agree Percent DisagreeQuestions Total Strongly Total Strongly
It is critical that we preserve Social Security even if it means increasing the Social Security taxes paid by…
Working Americans 82 41 18 6
Wealthy Americans 87 62 13 5
Source: National Academy of Social Insurance Survey, September 2012
Among Democrats, Republicans, and independents,
clear majorities agree that Social Security benefits are
more important than ever in today’s volatile economy.

Strengthening Social Security: What Do Americans Want? 11
82% of respondents agreed; 41% stronglyagreed.
� When asked whether they agreed or dis-agreed that “It is critical to preserve SocialSecurity even if it means increasing SocialSecurity taxes paid by wealthy Americans,”87% of respondents agreed; 62% stronglyagreed.
In brief, large majorities of Americans believe thatall workers could contribute somewhat more toSocial Security if necessary, and that better-offAmericans could pay more because they havehigher earnings. This holds true across genera-tions, across income groups, and across politicalparties (Table 5).
Trade-Off Analysis: Americans’ Preferred Packages of Policy ChangesAmericans support Social Security, are willing toincrease payroll taxes in order to pay for it, andwant to consider benefit improvements. The trade-off analysis adds a new dimension to these attitudi-nal findings by identifying specific packages ofpolicy changes that respondents prefer. Trade-offanalysis (also known as conjoint analysis) is a tech-nique often used in market research to discern howconsumers value different elements of a package ofpotential product features, and to estimate whichpackage is most favored. In this study, trade-offanalysis is used to learn how members of the
Table 5. Views on Paying More to Preserve Social Security by Generation, Family Income and Party Affiliation
(Percent Agreeing)
It is critical that we preserve Social Security even ifRespondent Characteristics it means increasing Social Security taxes paid by…
Working Americans Wealthy Americans
Total 82% 87%
Generation
Silent 90 87Baby Boomer 84 88Generation X 80 87Generation Y 77 84
Family Income
Less than $30,000 78 88$30,000 to $49,999 85 88$50,000 to $74,999 83 86$75,000 to $99,999 82 85$100,000 or more 82 82
Party Affiliation
Republican 74 71Democrat 88 97Independent 83 86
Source: National Academy of Social Insurance Survey, September 2012
12 www.nasi.org
general public weigh the appeal, or lack of appeal,of various packages of Social Security policychanges. This is a new application of trade-offanalysis to Social Security policy. It allowsresearchers to calculate which package of SocialSecurity changes is most preferred to the statusquo and what proportion of participants prefer thatpackage. More details about the trade-off analysisare in the Methodology section of this report.
The 12 policy options included in the trade-offanalysis, and the impact of each option, are shownin Table 6. Four options to raise revenues — twoby raising the cap on earnings subject to SocialSecurity taxes and two by raising the tax rate —reduce the financing gap. Four options to lowerfuture benefits — two by raising the full retire-ment age, one by means-testing benefits, and one by lowering the annual cost-of-living adjust-ment — also reduce the financing gap. In contrast,the four options that increase the adequacy of benefits in various ways would increase the financing gap.
The trade-off analysis finds that Americans preferpackages that both raise Social Security revenuesand increase benefits. The most favored solution —Package A (Table 7) — is preferred over the statusquo by 71% of respondents. It would eliminate115% of Social Security’s financing gap, meaningthat it would entirely eliminate the gap and have money left over for a margin of safety. Package Awould:
1. Gradually, over 10 years, eliminate the capon earnings that are taxed for Social Security.This would mean that the 5% of workers whoearn more than the cap ($110,100 in 2012;$113,700 in 2013) would pay into SocialSecurity throughout the year, as other workers do.
2. Gradually, over 20 years, raise the SocialSecurity tax rate that workers and employerseach pay from 6.2% of earnings to 7.2%. Aworker earning $50,000 a year would payabout 50 cents a week more each year.
3. Raise Social Security’s basic minimum benefitso that someone who paid into SocialSecurity for 30 years can retire at 62 or laterand not be poor.
4. Increase Social Security’s cost-of-living adjustment (COLA) to more accuratelyreflect the level of inflation experienced byseniors.
A second package — Package B — receivedalmost as much support (70%) in the trade-offanalysis. Package B differed only slightly fromPackage A. Like Package A, it would eliminateSocial Security’s entire financing gap and improvebenefits. The only difference is that Package B,instead of increasing the COLA as in package A,would increase benefits across the board by $60 a month.
Although one might expect younger Americans toresist packages that include tax increases — sincethey will bear the brunt of such increases — thisdoes not appear to be the case. Preferences forPackage A or B, both of which raise taxes, increaseslightly with age, yet nearly three-fourths ofGeneration X and two-thirds of Generation Y stillprefer packages that increase Social Security revenues and improve benefits over the status quo.
Prior to engaging in the trade-off exercise, surveyrespondents were also asked whether they wouldfavor or oppose a composite package of policychanges that would entirely eliminate SocialSecurity’s financing gap. This package containedthe same elements as Package B. Altogether, 84%
Although one might expect younger Americans to
resist packages that include tax increases — since
they will bear the brunt of such increases — this
does not appear to be the case.

Table 6. Individual Policy Changes in Trade-Off Analysis andImpact of Each on Social Security Financing Gap
Percent ChangePolicy Option in Financing Gap
Cap on Earnings Taxed for Social Security• Eliminate the earning cap over 10 years so that 100% of earnings are taxed -71
• Lift the cap over a 5 year period to tax 90% of earnings -30
• No change 0
Social Security Tax Rate• Over 20 years, raise the tax by 1/20th of 1% per year for employees and employers -53
• Raise the current tax for both employees and employers to 7.2% in 2022 and to 8.2% in 2052 -77
• No change 0
Social Security’s Full Retirement Age• Gradually raise the full retirement age to 68 -15
• Gradually raise the full retirement age to 70 -25
• No change 0
Means-Test Social Security• Require people to prove they need benefits to receive them -20
• No change 0
Children’s Benefits for Students• Reinstate student benefits to children whose working parents have died or become disabled, up to 22 years of age +3
• No change 0
Benefits for All Beneficiaries• Increase benefits by $60 a month for all beneficiaries +28
• No change 0
Benefits for Lifetime Low-wage Workers• Raise Social Security’s basic minimum benefit so that someone who paid into Social Security for 30 years can retire at 62 or later and not be poor +7
• No change 0
Social Security’s Cost-of-Living Adjustment (COLA)• Increase the Social Security COLA by basing it on inflation for the elderly +13
• Lower the Social Security COLA -20
• No change 0
Source: National Academy of Social Insurance, based on information in Appendix E
Strengthening Social Security: What Do Americans Want? 13

Table 7. Comparing Package A and Package B
Package Features Package A Package B
Common Features • Eliminate the cap over 10 years so that 100% of earnings are taxed
• Over 20 years, raise the tax rate by 1/20th of 1% per year for employees and employers
• Raise the minimum Social Security benefit
Different Features • Increase the COLA by basing it • Increase benefits by $60 aon inflation for the elderly month for all beneficiaries
Decline in financing gap 115% 100%
Percent Preferring Package to No Change
Total 71 70
Generation
Silent 76 74
Baby Boomer 71 70
Generation X 73 72
Generation Y 67 65
Household Income
Under $35,000 69 67
$35,000 - $74,999 73 72
$75,000 or more 73 72
Source: National Academy of Social Insurance Survey, September 2012
14 www.nasi.org
of respondents favor this package, including 34%who strongly favor it. While this direct question –do you favor or oppose this package? – is differentfrom the methods used in the trade-off analysis,the highly consistent results reinforce the findingthat Americans favor policies that rely on revenueincreases to close Social Security’s financing gapand pay for modest benefit improvements.
As Figure 2 shows, in each generation and familyincome group, at least 8 in 10 respondents favor
rather than oppose Package B. Even in the highestfamily income group, 84% of respondents favor it.This group includes the top 5% of earners whomake more than the taxable earnings cap andwould pay more into Social Security if the capwere gradually eliminated. The gradual increase inthe tax rate would affect workers in all incomegroups. Support is strong across party lines, with78% of Republicans, 89% of Democrats, and 86%of independents in favor of Package B.

Individual Policy Options in the Trade-off AnalysisTrade-off analysis can estimate the appeal of spe-cific policy options within packages. Table 8 showsthe appeal of each of the policy changes examinedin the trade-off analysis. For example, when a policy option has a “strong positive” impact,respondents were much more likely to choose apackage when that option was included.
The trade-off analysis shows that the followingspecific changes strongly increase the appeal of apackage of policy options:
� Gradually, over 10 years, eliminate the capon earnings that are taxed for Social Security.
� Gradually, over 20 years, raise the SocialSecurity tax rate that workers and employerseach pay from 6.2% of earnings to 7.2%.
� Increase the tax rate that workers andemployers each pay in two steps, from 6.2%to 7.2% in 2022 and to 8.2% in 2052.
� Keep Social Security’s current full retirementage at 67.
� Do not means-test eligibility for SocialSecurity benefits.
In contrast, the trade-off analysis showed thatoptions that strongly decrease a package’s appealwould:
� Not increase revenues for Social Security.
� Raise Social Security’s full retirement age to 70.
� Means-test eligibility for Social Security benefits.
Strengthening Social Security: What Do Americans Want? 15
0 20 40 60 80 100
Favor SomewhatFavor Strongly
Independent
Democrat
Republican
Party Affiliation
$100,000 or more
$75,000 to $99,999
$50,000 to $74,999
$30,000 to $49,999
Less than $30,000
Family Income
Generation Y
Generation X
Baby Boomer
Silent
Generation
Total 84%34% 50% 34% 50%
84%42% 42%
87%31% 56%
86%33% 53%
80%34% 46%
81%30% 51%
85%36% 49%
87%34% 53%
88%33% 55%
84%41% 43%
86%32% 54%
89%43% 46%
78%25% 53%
Figure 2. Support for Package B, by Generation, Family Incomeand Party Affiliation
Source: National Academy of Social Insurance Survey, September 2012

Table 8. Individual Policy Changes in Trade-Off Analysis andImpact on the Appeal of a Policy Package
Impact on Appeal of Policy Option a Policy Package
Cap on Earnings Taxed for Social Security• Eliminate the earning cap over 10 years so that 100% of earnings are taxed Strong Positive
• Lift the cap over a 5 year period to tax 90% of earnings Weak Positive
• No change Strong Negative
Social Security Tax Rate• Over 20 years, raise the tax by 1/20th of 1% per year for employees and employers Strong Positive
• Raise the current tax for both employees and employers to 7.2% in 2022 and to 8.2% in 2052 Strong Positive
• No change Strong Negative
Social Security’s Full Retirement Age• Gradually raise the full retirement age to 68 Weak Positive
• Gradually raise the full retirement age to 70 Strong Negative
• No change Strong Positive
Means-Test Social Security• Require people to prove they need benefits to receive them Strong Negative
• No change Strong Positive
Children’s Benefits for Students• Reinstate student benefits to children whose working parents have died or become disabled, up to 22 years of age Weak Negative
• No change Weak Positive
Benefits for All Beneficiaries• Increase benefits by $60 a month for all beneficiaries Weak Negative
• No change Weak Positive
Benefits for Lifetime Low-wage Workers• Raise Social Security’s basic minimum benefit so that someone who paid into Social Security for 30 years can retire at 62 or later and not be poor Weak Positive
• No change Weak Negative
Social Security’s Cost-of-Living Adjustment (COLA)• Increase the Social Security COLA by basing it on inflation for the elderly Weak Positive
• Lower the Social Security COLA Weak Negative
• No change Little Impact
Source: National Academy of Social Insurance Survey, September 2012
16 www.nasi.org

Strengthening Social Security: What Do Americans Want? 17
Table 9. Two Preferred Revenue Options
Raise theEliminate the taxable Social Security tax
Responses earnings cap rate from 6.2% to 7.2%
Favor 68% 69%
Strongly 39 34Somewhat 28 34
Not sure 24 21
Oppose 8 11
Strongly 4 3Somewhat 5 7
Source: National Academy of Social Insurance Survey, September 2012
Columns may not total 100% due to rounding.
The survey also asked respondents about theirviews on policy options one at a time. Whenanswering these questions, respondents couldchoose “not sure” as their answer, and many did.Between one-fifth and one-third chose “not sure”on each question. Lower-income and youngerrespondents were more likely than older or higher-income respondents to choose “not sure.” Ofthose with views, supporters outnumbered thoseopposed by large margins on all revenue-raisingoptions and on most options to increase SocialSecurity benefits. Options that would reduce benefits generally received little support.
Two Preferred Revenue IncreasesEliminating the taxable earnings cap and graduallyincreasing the payroll tax rate from 6.2% to 7.2%over 20 years, two changes which were part of thepreferred policy solution packages, also receivedthe most support among the individual policyoptions (Table 9). Those in favor of eliminatingthe cap outnumber those opposed by about 8 to 1(68% to 8%), while those in favor of gradually raising the tax rate outnumber those opposed byabout 6 to 1 (69% to 11%). Moreover, many ofthose in favor of each revenue increase stronglyfavor it.
“I agree with lifting the [earnings] cap. Do something
about that. If you are making over $110,100 and
you are not putting into Social Security, that is
a problem.”
— Younger male focus group participant referring to lifting the earnings cap.

18 www.nasi.org
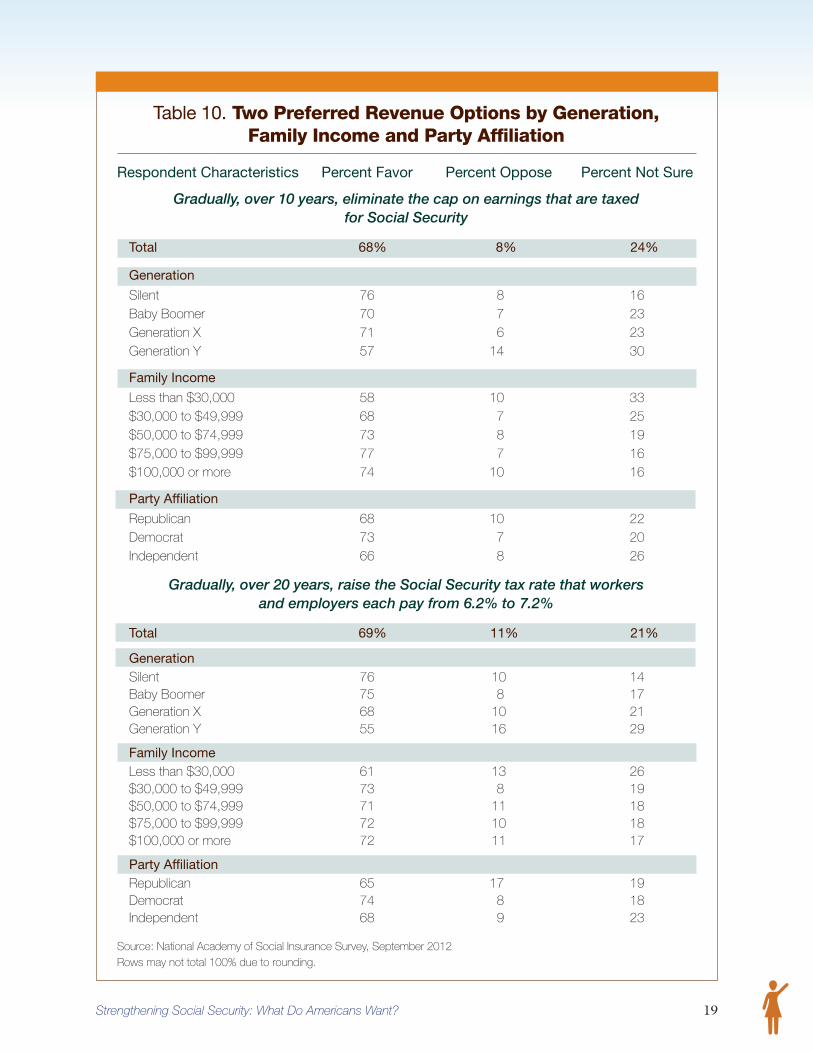
Support for each revenue increase is widespreadacross generations, family income groups, andparty affiliations (Table 10). These findings withregard to specific policy changes confirm earlierfindings about Americans’ general attitudes: thatis, across income groups, generations, and partyaffiliations, Americans believe that all workers canpay somewhat more to preserve Social Securityand that better-off workers can pay more. In thetop income group – with family incomes over$100,000 – those who favor eliminating the capon earnings that are taxed for Social Security, achange that would affect only the top 5% of earn-ers, outnumber those opposed by more than 7 to1 (74% to 10%). Similarly, in the top incomegroup, those in favor of gradually raising the SocialSecurity tax rate that all workers pay outnumberthose opposed by about 7 to 1 (72% to 11%).
Most notably, the trade-off analysis shows thateliminating the taxable earnings cap gradually over10 years has a strong positive impact on the appealof a package. Gradually eliminating the taxableearnings cap ($110,100 in 2012; $113,700 in2013) would mean that the top 5% of earnerswould pay Social Security taxes on all their earn-ings throughout the year, just as everyone elsedoes. In return they would receive somewhathigher benefits when they retire. This changewould close 71% of Social Security’s financing gap.
Similarly, raising the tax rate gradually over 20years from 6.2% to 7.2% also has a strong positiveappeal in the trade-off analysis. For a worker earn-ing $50,000, raising the rate by 1/20 of 1% a yearfor 20 years would mean, each year, paying about
50 cents more a week, matched by the employer.This change would close 53% of Social Security’sfinancing gap.
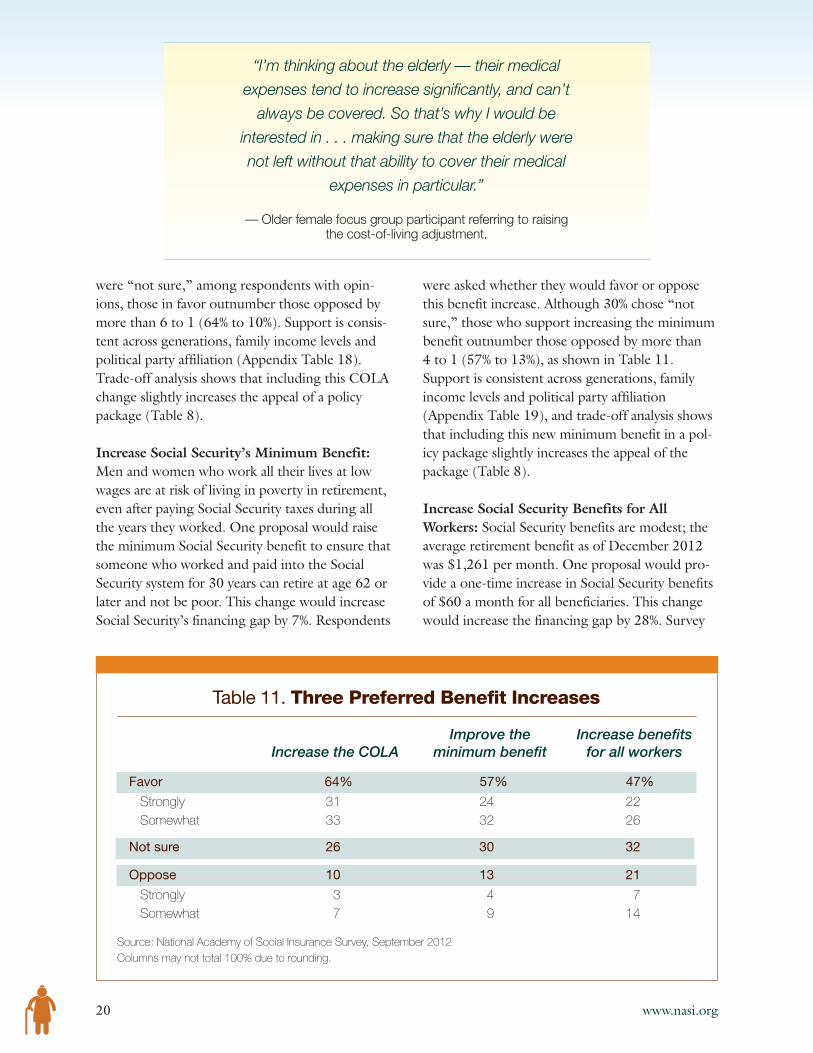
Three Preferred Benefit IncreasesThe three benefit increases that were included inPackage A or Package B, or both, are shown inTable 11. They include: increasing the cost-of-liv-ing adjustment (COLA) to better protect seniorsagainst inflation, which would increase the financ-ing gap by 13%; improving the basic minimumbenefit for workers with long work records at lowpay, which would increase the financing gap by7%; and a one-time across the board benefitincrease of $60 a month for all workers, whichwould increase the financing gap by 28%.
Increase the COLA: The purpose of SocialSecurity’s cost-of-living adjustment (COLA) is toautomatically adjust benefits to keep up with infla-tion. The current COLA may not keep up withthe inflation that seniors face because seniorsspend more on out-of-pocket health care costs,which generally rise faster than average inflation.One proposal would base the COLA on inflationthat seniors actually experience. To illustrate, ifgeneral inflation from one year to the next is 3%,but inflation experienced by seniors is 3.2%, thisCOLA for the elderly would increase a $1,000monthly benefit by $32 instead of by $30. Thischange would more fully protect seniors againstinflation, and would increase Social Security’sfinancing gap by 13%. The survey asked partici-pants whether they favored or opposed thisoption. Although 26% of respondents said they
“I [would choose] 50 cents more per week. That is,like, $25 a year. Apparently that would almost solve
the problem. I think everybody can do that —
especially when you are taking out 50 cents at
a time. It’s not like, ‘Oh, man, I made $650.50,
now I made $650. I needed that!’”
— Younger male focus group participant referring toincreasing the Social Security tax rate.
Strengthening Social Security: What Do Americans Want? 19
Table 10. Two Preferred Revenue Options by Generation, Family Income and Party Affiliation
Respondent Characteristics Percent Favor Percent Oppose Percent Not Sure
Gradually, over 10 years, eliminate the cap on earnings that are taxed for Social Security
Total 68% 8% 24%
Generation
Silent 76 8 16Baby Boomer 70 7 23Generation X 71 6 23Generation Y 57 14 30
Family Income
Less than $30,000 58 10 33$30,000 to $49,999 68 7 25$50,000 to $74,999 73 8 19$75,000 to $99,999 77 7 16$100,000 or more 74 10 16
Party Affiliation
Republican 68 10 22Democrat 73 7 20Independent 66 8 26
Gradually, over 20 years, raise the Social Security tax rate that workers and employers each pay from 6.2% to 7.2%
Total 69% 11% 21%
GenerationSilent 76 10 14Baby Boomer 75 8 17Generation X 68 10 21Generation Y 55 16 29
Family IncomeLess than $30,000 61 13 26$30,000 to $49,999 73 8 19$50,000 to $74,999 71 11 18$75,000 to $99,999 72 10 18$100,000 or more 72 11 17
Party AffiliationRepublican 65 17 19Democrat 74 8 18Independent 68 9 23
Source: National Academy of Social Insurance Survey, September 2012
Rows may not total 100% due to rounding.
20 www.nasi.org
were “not sure,” among respondents with opin-ions, those in favor outnumber those opposed bymore than 6 to 1 (64% to 10%). Support is consis-tent across generations, family income levels andpolitical party affiliation (Appendix Table 18).Trade-off analysis shows that including this COLAchange slightly increases the appeal of a policypackage (Table 8).
Increase Social Security’s Minimum Benefit:Men and women who work all their lives at lowwages are at risk of living in poverty in retirement,even after paying Social Security taxes during allthe years they worked. One proposal would raisethe minimum Social Security benefit to ensure thatsomeone who worked and paid into the SocialSecurity system for 30 years can retire at age 62 orlater and not be poor. This change would increaseSocial Security’s financing gap by 7%. Respondents
were asked whether they would favor or opposethis benefit increase. Although 30% chose “notsure,” those who support increasing the minimumbenefit outnumber those opposed by more than 4 to 1 (57% to 13%), as shown in Table 11.Support is consistent across generations, familyincome levels and political party affiliation(Appendix Table 19), and trade-off analysis showsthat including this new minimum benefit in a pol-icy package slightly increases the appeal of thepackage (Table 8).
Increase Social Security Benefits for AllWorkers: Social Security benefits are modest; theaverage retirement benefit as of December 2012was $1,261 per month. One proposal would pro-vide a one-time increase in Social Security benefitsof $60 a month for all beneficiaries. This changewould increase the financing gap by 28%. Survey
“I’m thinking about the elderly — their medical
expenses tend to increase significantly, and can’t
always be covered. So that’s why I would be
interested in . . . making sure that the elderly were
not left without that ability to cover their medical
expenses in particular.”
— Older female focus group participant referring to raising the cost-of-living adjustment.
Table 11. Three Preferred Benefit Increases
Improve the Increase benefitsIncrease the COLA minimum benefit for all workers
Favor 64% 57% 47%
Strongly 31 24 22Somewhat 33 32 26
Not sure 26 30 32
Oppose 10 13 21
Strongly 3 4 7Somewhat 7 9 14
Source: National Academy of Social Insurance Survey, September 2012
Columns may not total 100% due to rounding.

Strengthening Social Security: What Do Americans Want? 21
respondents were asked whether they would favoror oppose this benefit improvement. Manyrespondents (32%) were “not sure” about thisoption, and support for it is not as strong as forothers in the preferred packages. Yet, among thosewith opinions, supporters outnumber thoseopposed by more than 2 to 1 (47% to 21%). Ofrespondents with opinions, majorities in all groupsby generation, family income, and political partyaffiliation support improving benefits for all work-ers (Appendix Table 20). However, trade-offanalysis shows that this feature has a weak negativeeffect on the appeal of a package (Table 8).
Americans’ Attitudes onOther Policy OptionsPolicy options that were not included in either ofthe two most preferred policy option packagesinclude two revenue increases; four benefit cuts;and three benefit increases. The extent to which
respondents favored or opposed these changeswhen asked about them individually is discussedhere.
Revenue Increases
Two revenue increases that were not part of thepreferred policy solutions include one that wouldraise the taxable earnings cap but not eliminate itcompletely, and another that would raise, in twosteps, the 6.2% tax rate that workers and employ-ers each pay (Table 12).
Gradually Lift the Taxable Earnings Cap toCover 90% of Earnings:When Congress lastadjusted the cap, it intended to have the cap cover90% of all earnings by American workers. Becausethe earnings of the highest-paid workers haveincreased faster than average earnings, the cap nowcovers only about 84% of all earnings. Survey par-ticipants were asked whether they would favor oroppose a proposal that would gradually increase
Table 12. Revenue Increases
Gradually lift the Raisetaxable earnings cap Social Security’s tax
Responses to cover 90% of earnings rate in two steps
Favor 68% 53%
Strongly 41 24
Somewhat 27 30
Not sure 23 26
Oppose 8 20
Strongly 4 6
Somewhat 5 14
Source: National Academy of Social Insurance Survey, September 2012
Columns may not total 100% due to rounding.
“It is important that people who work all their lives,
and are low-income, still have a fighting chance
in their retirement.”
— Younger female focus group participant referring to raising the minimum benefit.

22 www.nasi.org
the taxable earnings cap to $215,000 per year, alevel that would restore the intent of Congress tosubject 90% of all earnings to Social Security taxes.The top-earning 5% would pay more into SocialSecurity and would receive somewhat higher bene-fits in return. In response, 23% chose “not sure.”Of those with opinions, supporters of lifting thecap to $215,000 outnumber those opposed bymore than 8 to 1 (68% to 8%). Most of those infavor of this option favor it strongly. Trade-offanalysis shows that this policy change has a weakpositive impact on the appeal of a package, in largepart because, while it is preferred over not liftingthe cap at all, it does not have as much appeal aseliminating the cap altogether (Table 8).
Raise Social Security’s Tax Rate in Two Steps:This option would increase, in two steps, the pay-roll tax rate that workers and employers each pay— from 6.2% now to 7.2% in 2022 and to 8.2% in2052. Each change would mean an increase of$9.50 per week, matched by the employer, for aworker earning $50,000 per year. While just overone fourth (26%) of respondents chose “not sure”about this option, those who favor it outnumberthose opposed by nearly 3 to 1 (53% to 20%).Trade-off analysis shows that this option has astrong positive impact on the appeal of a package
(Table 8) but is less popular than gradually liftingthe tax rate from 6.2% to 7.2% over 20 years.
Benefit Reductions
Four survey questions asked respondents abouttheir views on ways that Social Security benefitsmight be cut to help balance the system’s futurefinances. Options include means-testing eligibilityfor benefits, reducing the COLA, and raising theage of eligibility for full retirement benefits from67 to 68 or 70. Far fewer Americans favor reduc-ing benefits as a way to balance Social Security’slong-term financing than favor raising revenues(Table 13).
Raise the Full Retirement Age to 68 or 70:Currently, workers can begin collecting SocialSecurity retirement benefits at age 62, the earliesteligibility age, but when they do so their benefitsare reduced. The full retirement age — that is, theage of eligibility for unreduced benefits — is gradually increasing. It was 65 (for workers bornbefore 1939), is currently 66 (for workers bornbetween 1943 and 1954), and will increase to 67(for workers born in 1960 and later). The increasefrom 65 to 67 means that Americans age 53 andyounger today will face a permanent benefit
Table 13. Four Options to Reduce Social Security Benefits
Raise Full Retirement Age: Reduce the Means-Responses to 68 to 70 COLA test eligibility
Favor 37% 28% 30% 31%
Strongly 13 10 11 13Somewhat 24 18 19 18
Not sure 28 24 33 31
Oppose 34 48 37 38
Strongly 15 26 17 23Somewhat 19 22 20 14
Source: National Academy of Social Insurance Survey, September 2012
Columns may not total 100% due to rounding.

Strengthening Social Security: What Do Americans Want? 23
reduction of 13-14% from what they would havereceived if the full benefit age were still 65.
Further increasing the full benefit age to 68 wouldreduce retirement benefits by another 6-7% foryounger workers. This change would reduce SocialSecurity’s financing gap by 15%. Trade-off analysisshows that this change has a weak positive effecton the appeal of a package. More than a fourth ofrespondents (28%) chose “not sure” about thisoption. Of those with opinions, a bare majority arein favor.
Raising the full retirement age to 70 drew moreopposition. This change would reduce monthlybenefits by 21% for future retirees. It wouldreduce Social Security’s 75-year financing gap by25%. Although nearly a fourth (24%) of respon-dents chose “not sure” about this option, thoseopposed to raising the retirement age to 70 out-number those who favor it by nearly 2 to 1 (48%to 28%). Opponents outnumber supporters acrossgenerations, income levels, and political party affil-iations (Appendix Table 21). Trade-off analysisshows that including this change in a package ofpolicy changes has a strong negative impact on theappeal of the package (Table 8).
Reduce the COLA: This policy option wouldbase the cost-of-living adjustment (COLA) on ameasure of inflation that would result in increasingSocial Security benefits less than the currentCOLA does. This change would reduce seniors’protection against inflation, and the seeminglysmall difference would add up over time, so theoldest seniors would experience the biggest benefitcuts. This change would reduce Social Security’sfinancing gap by 20%. More than half (55%) ofrespondents who have an opinion about reducingthe COLA are opposed to it, and many arestrongly opposed. Trade-off analysis shows thatincluding this change in a package has a weak negative impact on the appeal of a package (Table 8).
Means-Test Social Security:Means testing,which would fundamentally change the way SocialSecurity benefits are paid, does not have majoritysupport. Historically workers have earned the right
to receive Social Security benefits for themselvesand their families by paying Social Security taxes.Means testing, in contrast, would require peopleto provide proof of eligibility based on having lim-ited income and assets. Workers who accumulatedsavings or have pensions could find themselvespenalized for their thrift by receiving reduced ben-efits or no benefits at all. More than 3 in 10 (31%)respondents chose “not sure” about means testingSocial Security. Of those who have an opinion,most are opposed, and most of those who opposemeans testing do so strongly. Trade-off analysisshows that including means testing in a policypackage has a strong negative effect on the appealof a package (Table 8).
Benefit IncreasesOther individual policy questions asked survey par-ticipants’ views on various benefit improvementoptions such as reinstating the children’s benefitfor students, counting the time that working par-ents take off to care for children toward futurebenefits, and increasing benefits for beneficiariesover age 85 (Table 14).
Children’s Benefits for Students: Childrenwhose working parents have died or become dis-abled receive Social Security benefits until age 18(or 19 if they are still in high school). The surveyasked respondents whether they would support aproposal to extend the cut-off age to 22 if thechild is attending college or vocational school — achange that would restore a benefit that was avail-able to qualifying children ages 18-21 between1965 and 1981. After Congress phased outextended benefits as a cost-cutting measure,research found that payment of benefits hadhelped make higher education more affordable foryoung people in families that had lost a breadwin-ner’s income.11 Restoring these benefits for chil-dren of disabled or deceased workers wouldincrease Social Security’s 75-year shortfall by 3%.While 22% of respondents chose “not sure” aboutthis policy, among respondents who have opin-ions, those in favor outnumber those opposed bymore than 3 to 1. Yet, trade-off analysis shows thatincluding this policy has a weak negative effect onthe appeal of a package (Table 8).

24 www.nasi.org
Caregiver Credit: Social Security benefits arebased on the amount of money workers earn overtheir careers. Currently, if a working parent leavesthe workforce temporarily to care for children,that uncompensated time counts as zeros in com-puting the earnings to be replaced by SocialSecurity benefits. Providing a caregiver creditwould increase Social Security’s 75-year financingshortfall by 9%. While about a third (34%) of sur-vey respondents chose “not sure” about thisoption, those in favor outnumber those opposedby almost 2 to 1 (42% to 24%).
Benefit Increase for the Oldest Old (85+):Older beneficiaries are most likely to rely on SocialSecurity for most or all of their income.Respondents were asked their opinion of increas-ing benefits for Social Security beneficiaries by $60a month at age 85. This change would increaseSocial Security’s 75-year shortfall by 4%. Although25% of respondents chose “not sure” about thisoption, supporters of a benefit increase at age 85outnumber those opposed by nearly 5 to 1 (62%to 13%).
Americans’ Confidence inSocial Security’s Future The survey findings confirm that despite theirstrong support for Social Security, most Americansdo not feel very confident about the program’sfuture (Table 15).
� 57% of Americans say they are not confidentin the future of Social Security.
� When Americans not yet receiving SocialSecurity benefits are asked whether they areconfident that they will receive all of the ben-efits they have earned and are supposed toreceive, 69% say they are not confident.
Low levels of confidence are consistent across allgenerations of Americans not yet receiving SocialSecurity benefits (Table 16). And substantialmajorities of people not yet receiving benefits —regardless of income level or political party affilia-tion — express doubts that the benefits they aresupposed to receive when they retire will actuallybe paid to them.
Table 14. Benefit Increases
Children’s benefits Caregiver Benefit increase forfor students credit the oldest old (85+)
Favor 59% 42% 62%
Strongly 27 18 30Somewhat 32 24 32
Not sure 22 34 25
Oppose 19 24 13
Strongly 7 8 4Somewhat 11 16 9
Source: National Academy of Social Insurance Survey, September 2012
Columns may not total 100% due to rounding.

Strengthening Social Security: What Do Americans Want? 25
Table 16. Confidence in Social Security’s Future by Generation,Family Income and Party Affiliation
(Percent not confident)
Respondents not yetAll Respondents receiving Social Security
How confident How confident are you that all ofare you in the Social Security benefits you are
Respondent the future of supposed to receive will be availablecharacteristics Social Security? when you begin receiving benefits?
Total 57% 69%
Generation
Silent 41 *Baby Boomer 56 62Generation X 60 74Generation Y 62 74
Family Income
Less than $30,000 59 67$30,000 to $49,9999 56 68$50,000 to 74,999 59 72$75,000 to $99,999 52 66$100,000 or more 54 72
Party Affiliation
Republican 69 78Democrat 44 60Independent 60 72
* Based on fewer than 20 sample cases.
Source: National Academy of Social Insurance Survey, September 2012
Table 15. Confidence in Social Security’s Future
Respondents not yetAll Respondents receiving Social Security
How confident How confident are you that all ofare you in the Social Security benefits you are
the future of supposed to receive will be availableLevel of Confidence Social Security? when you begin receiving benefits?
Confident 43% 31%
Not confident 57 69
Source: National Academy of Social Insurance Survey, September 2012

26 www.nasi.org
Americans’ Views about Social SecurityChange When They Are Given FactualInformation
Official projections by Social Security’s actuariesshow that the program has sufficient funds to pay100% of scheduled benefits until 2033. When sur-vey participants were asked what would happenafter 2033 if nothing is done to strengthen theprogram in the meantime, just 18% knew thatSocial Security would still be able to pay 75% ofscheduled benefits. Most of the rest either saidthey did not know or thought that SocialSecurity’s finances would be in far worse shape.After learning that raising Social Security’s taxesfrom 6.2% to 7.6% of earnings for both workersand employers would ensure that the programcould pay full benefits for 75 years, the share ofsurvey participants who think Social Security
financing is a crisis or significant problem droppedfrom 57% to 26%, while those who think it is amanageable problem or not a problem at allincreased from 43% to 74% (Table 17). The avail-ability of factual information substantially allayedrespondents’ concerns about the future of SocialSecurity.
Social Security is now about 5% of the economy.As Boomers continue to retire, that share will riseto about 6.4% by 2035, and will then drop backand level off at about 6% for the rest of the next75 years.12 When asked, “Do you agree or disagreethat Social Security, as a share of the economy, isaffordable?” fully 72% agree that it is affordable.Providing economic context helps Americansassess whether to be confident that Social Securitycan meet its commitments to current and futurebeneficiaries.
Table 17. Perception of Social Security Funding Shortfall
If you knew that increasingSocial Security taxes from
6.2% to 7.6% for both workersand employers would ensure that
No new Social Security could pay fullinformation benefits for the next 75 years…
Would you say that funding for Social Security is a crisis, a significant problem, a manageable problem, or not a problem at all?
Crisis or significant problem 57% 26%
Crisis 22 7Significant problem 35 19
Manageable problem, or not a problem 43 74
A manageable problem 36 57Not a problem at all 7 17
Source: National Academy of Social Insurance Survey, September 2012

Strengthening Social Security: What Do Americans Want? 27
43%57%
Crisis or a significant problem
26%
74%
Manageable problem or not a problem
Figure 3. Perception of Social Security Shortfall: Effect of New Information
Would you say that funding for Social Security is a crisis, a significant
problem, a manageable problem, or not a problem at all?
If you knew that increasing Social Securitytaxes from 6.2% to 7.6% for both workers
and employers would ensure that SocialSecurity could pay full benefits for the
next 75 years, would you say that funding for Social Security is a crisis, a significant problem, a manageable
problem, or not a problem at all?
Source: National Academy of Social Insurance Survey, September 2012

28 www.nasi.org

Strengthening Social Security: What Do Americans Want? 29
Americans have a strong preference forstrengthening the finances of the SocialSecurity system and are willing to contributemore. Respondents clearly want to close the sys-tem’s financing gap. But rather than doing so inpart by reducing benefits, they prefer a package ofchanges that does not include any benefit cuts.Indeed, they prefer targeted benefit improve-ments, specifically increasing benefits for lifetimelow-wage earners and increasing the cost-of-livingadjustment (COLA) to better reflect the higherinflation that many older people experience,mainly because their out-of-pocket medical costsrise faster than average costs. These preferencesunderscore the importance that Americans attachto the program.
Americans are aware that Social Security differsfrom most public programs in being supported bydedicated taxes, and they are willing to contributemore from their earnings to keep the programstrong for the future. In particular, they prefer afunding strategy that strengthens Social Securityand eliminates the funding gap by gradually eliminating the cap on earnings subject to SocialSecurity taxes, and by modestly raising the tax ratethat workers and employers pay into the system.While Americans prefer to keep Social Security’sfull retirement age where it is, there is some sup-port for increasing it to age 68 because of theimpact this would have on closing the financinggap. But there is strong opposition to raising thefull retirement age to 70. There is also resistanceto means testing and reducing the cost-of-livingadjustment.
Americans’ widespread willingness to pay more forSocial Security shows that they view Social Securityas a vital program that provides a measure of
economic security for their families, themselves,and their communities. At a time when the nationseems deeply divided about the appropriate sizeand role of government, it is striking thatAmericans across political and generational linesnot only support Social Security but also supportspecific options to strengthen the program for thefuture.
Better information could improve publicknowledge about and confidence in SocialSecurity. The survey shows that Americansstrongly support Social Security but lack confi-dence in its future — a paradox that has beenreflected in other surveys conducted over the past30 years. Notably, the survey also shows thatAmericans’ confidence in the future of SocialSecurity markedly improves when they are pro-vided with factual information. For example, afterlearning that the program’s financing gap could beclosed by specified increases in revenues, the shareof survey participants who think Social Securityfinancing is a manageable problem, or not a prob-lem, rises from 43% to 74%, while the share of par-ticipants who think it is a significant problem, or acrisis, drops from 57% to 26%. Similarly, afterlearning that Social Security as a share of the econ-omy will increase as Boomers retire from justunder 5% to about 6.5% in 2035, but will thenlevel off at about 6% for the rest of the next 75years, nearly three in four of those surveyed con-clude that Social Security, as a share of the econ-omy, is affordable. This suggests that systematicallyimproving the quality of information availableabout Social Security, via a major public educationinitiative, could markedly improve the public’sconfidence in the resilience of the system goingforward.
Conclusions

30 www.nasi.org

Strengthening Social Security: What Do Americans Want? 31
To understand Americans’ perspectives on SocialSecurity and their views on possible actions tostrengthen the program for the future, theNational Academy of Social Insurance collabo-rated with Mathew Greenwald & Associates toconduct a multigenerational study. The studyincludes an online survey of 2,000 Americans thatwas fielded by the market research company IpsosLoyalty in September 2012. An innovative applica-tion of trade-off analysis was used to examine howrespondents weighed the appeal or lack of appealof various packages of Social Security policychanges. The study also convened two focusgroups to help refine the survey questionnaire andtest the trade-off analysis tools.
Focus GroupsAs a prelude to the study, Mathew Greenwald &Associates convened two focus groups on SocialSecurity. These focus groups were utilized torefine the survey questionnaire, test the trade-offanalysis tools and add depth to the survey findings.One of the focus groups was comprised ofyounger and lower-income individuals, ages 18-40; participants employed full-time had grossincomes between $15,000 and $40,000. Theother group included older and higher-incomeindividuals, ages 41 and older; participantsemployed full-time had gross incomes between$41,000 and $125,000. The focus groupsexplored participants’ knowledge of how theSocial Security program works, how it has affectedthem and/or their families, and their opinionsabout various options to strengthen it. The focusgroups were convened in Baltimore, Maryland, onMarch 27, 2012. Recruitment for the focusgroups excluded individuals with careers in thefederal government, marketing, public affairs, lob-bying, investments, economics, or public relations.
Nine of the ten participants in the younger groupwere employed; one was unemployed. In the oldergroup, seven were employed full-time, one wasretired and employed part-time, and two wereunemployed because of disabilities. All of the
respondents employed full-time had SocialSecurity taxes deducted from their paychecks.Participants were recruited to include a mix ofeducational levels. No more than two respondentsper group had a graduate or professional schooldegree. Both groups had a mix of Democrats,independents, and Republicans.
SurveyThe online survey of 2,000 Americans ages 21 andolder was conducted from September 17-24,2012. Respondents were randomly selected fromthe Ipsos I-Say Panel of nearly 700,000 U.S. con-sumers. Interviews averaged 25 minutes in length.The first part of the questionnaire exploredrespondents’ knowledge and attitudes about SocialSecurity, their confidence in its future, and theimportance of benefits to their incomes now andin the future. The rest of the questionnaire askedwhether they would favor or oppose each of 14specific changes to Social Security, includingincreasing future taxes, lowering future benefits, orincreasing benefits for certain groups. Each policychange included a brief explanation of its effectand an estimate of how it would reduce or increaseSocial Security’s projected long-term financinggap. The survey questionnaire is in Appendix B.Details about the individual policy changes andestimates of their effects on Social Security’sfinances are in Appendix E. The survey resultswere weighted to match the 2010 U.S. Census.
Trade-off Analysis Trade-off analysis (also known as conjoint analysis)is a technique often used in marketing research todiscern how consumers value the elements of vari-ous packages of product features and to estimatewhich package is most favored. In this study,trade-off analysis is used to learn how members ofthe general public weigh the appeal, or lack ofappeal, of various packages of Social Security pol-icy changes. This study is a new application oftrade-off analysis to assess public opinion aboutSocial Security policy options. The technique is
Methodology

32 www.nasi.org
able to incorporate the impact of policy changeson the Social Security financing gap and to esti-mate the most appealing combination of policychanges of all of the individual changes that wereconsidered.
Study participants completed the trade-off exerciseafter completing the questionnaire shown inAppendix B. Twelve policy changes were selectedfor analysis in the trade-off exercise. Four changescall for increasing future revenues: two by raisingthe cap on earnings subject to Social Security taxesand two by raising the Social Security tax rate forall workers. Four changes call for reducing futurebenefits: two by increasing the age for receivingfull retirement benefits, one by means-testing ben-efits, and one by lowering Social Security’s annualcost-of-living adjustment (COLA). Finally, fourchanges called for increasing benefits. Twoincreases would target specific groups: lifetimelow-wage workers and children of disabled ordeceased workers. Two other increases wouldaffect all beneficiaries: increasing the COLA by
basing it on inflation experienced by the elderly,and an across-the-board benefit increase.Appendix D has descriptions of the 12 changesthat respondents considered as they completed thetrade-off exercise.
The trade-off exercise design program generated100 unique screens organized into 10 blocks of 10each. Each respondent was randomly assigned oneof the 10 blocks and completed all 10 screens inthe block. On each screen, respondents saw threepackages of Social Security changes (including anestimate of how much each package would reduceor increase Social Security’s financing gap) and afourth package with no change to the current sys-tem. On each of their 10 assigned screens, partici-pants chose the package they considered mostappealing — one of the three packages of changesor the current system unchanged, if they preferredthat. Appendix C shows the instructions for com-pleting the screens and three examples of the 100screens that were used.

Strengthening Social Security: What Do Americans Want? 33
1 Reno, Virginia P., Elisa A. Walker, andThomas N. Bethell. 2012. “Social SecurityFinances: Findings of the 2012 TrusteesReport.” Social Security Brief No. 39.Washington, DC: National Academy ofSocial Insurance.
2 Board of Trustees. 2012. Annual Report ofthe Board of Trustees of the Federal Old-Ageand Survivors Insurance and FederalDisability Insurance Trust Funds.Washington, DC: Social SecurityAdministration. Table II.D1.
3 Social Security Administration. 2012.“Beneficiary Data: Number of Social Securityrecipients at the end of Dec 2012.”Baltimore, MD: Social SecurityAdministration, Office of the Chief Actuary.http://www.socialsecurity.gov/cgi-bin/currentpay.cgi
4 NASI calculations based on U.S. CensusBureau, Current Population Survey, AnnualSocial and Economic Supplement (2012)(using CPS Table Creator II),http://www.census.gov/cps/data/cpstablecreator.html.
5 The amount of the cap increases automati-cally each year with increases in the averagewage. In 2013, the cap is $113,700.
6 Social Security Administration. 2012. “TrustFund Data: Calendar Year 2011.” Baltimore,MD: Social Security Administration, Office
of the Chief Actuary. http://www.socialsecurity.gov/OACT/ProgData/allOps.html;and Social Security Administration. 2012.“Beneficiary Data: Number of Social Securityrecipients at the end of Jan 2012.”Baltimore, MD: Social SecurityAdministration, Office of the Chief Actuary.http://www.socialsecurity.gov/cgi-bin/currentpay.cgi
7 Board of Trustees, 2012: Table IV.A3.
8 Board of Trustees, 2012: Figure II.D2.
9 Reno, Virginia P., Thomas N. Bethell, andElisa A. Walker. 2012. “Social SecurityBeneficiaries Face 19% Cut: New RevenueCan Restore Balance.” Social Security BriefNo. 37. Washington, DC: National Academyof Social Insurance.
10 Walker, Elisa A., Thomas N. Bethell, andVirginia P. Reno. 2012. “Implications of thePayroll Tax Holiday for Social Security.”Social Security Fact Sheet No. 4.Washington, DC: National Academy ofSocial Insurance.
11 Hertel-Fernandez, Alexander. 2010. “A NewDeal for Young Adults: Social SecurityBenefits for Post-Secondary SchoolStudents.” Social Security Brief No. 33.Washington, DC: National Academy ofSocial Insurance.
12 Board of Trustees, 2012: Table VI.F4.
Endnotes

34 www.nasi.org

Strengthening Social Security: What Do Americans Want? 35
Appendices:
Appendix A: Additional Tables
Appendix B: Questionnaire
Appendix C: Trade-off Analysis Example
Appendix D: Individual Policy Options Definitions
Appendix E: Detailed Descriptions and Cost Estimates
for Policy Options

Table 18. Increase the COLA to More Fully Protect Seniors against Inflation
Respondent Characteristics Percent Favor Percent Oppose Percent Not Sure
Total 64 10 26
Generation
Silent 78 11 11Baby Boomer 68 9 23Generation X 61 8 30Generation Y 54 12 34
Family Income
Less than $30,000 59 8 33$30,000 to $49,999 64 10 26$50,000 to $74,999 68 9 23$75,000 to $99,999 67 10 22$100,000 or more 66 16 18
Party Affiliation
Republican 57 16 26Democrat 71 8 22Independent 63 9 28
Source: National Academy of Social Insurance Survey, September 2012
APPENDIX A: Additional Tables
36 www.nasi.org

Strengthening Social Security: What Do Americans Want? 37
Table 19. Increase Social Security’s Minimum Benefit
Respondent Characteristics Percent Favor Percent Oppose Percent Not Sure
Total 57 13 30
Generation
Silent 57 17 26Baby Boomer 58 12 30Generation X 57 12 31Generation Y 56 14 30
Family Income
Less than $30,000 54 10 36$30,000 to $49,999 59 11 30$50,000 to $74,999 58 16 27$75,000 to $99,999 62 14 24$100,000 or more 54 20 26
Party Affiliation
Republican 48 22 30Democrat 67 7 25Independent 53 13 34
Source: National Academy of Social Insurance Survey, September 2012
Table 20. Increase Benefits for All Workers
Respondent Characteristics Percent Favor Percent Oppose Percent Not Sure
Total 47 21 32
Generation
Silent 45 23 32Baby Boomer 48 21 32Generation X 49 20 31Generation Y 46 21 32
Family Income
Less than $30,000 47 16 37$30,000 to $49,999 48 19 33$50,000 to $74,999 45 22 33$75,000 to $99,999 52 26 22$100,000 or more 47 30 23
Party Affiliation
Republican 38 30 32Democrat 59 15 27Independent 42 24 35
Source: National Academy of Social Insurance Survey, September 2012

38 www.nasi.org
Table 21. Raise the Full Retirement Age to 70
Respondent Characteristics Percent Favor Percent Oppose Percent Not Sure
Total 28 48 24
Generation
Silent 30 54 16Baby Boomer 19 57 24Generation X 33 44 23Generation Y 33 38 29
Family Income
Less than $30,000 26 45 29$30,000 to $49,999 24 48 28$50,000 to $74,999 24 55 21$75,000 to $99,999 41 44 15$100,000 or more 38 45 17
Party Affiliation
Republican 26 52 22Democrat 33 44 23Independent 26 50 24
Source: National Academy of Social Insurance Survey, September 2012

Strengthening Social Security: What Do Americans Want? 39
Appendix B: Survey Questions
1. To start, we need to ask you a few questions about you. In what year were you born?
[TERMINATE IF YOB > 1991]
2. Are you…?Male............................................................................................................................................1Female ........................................................................................................................................2
3. Are you currently…?Employed for pay full-time ............................................................................................................1Employed for pay part-time ..........................................................................................................2Not employed..............................................................................................................................3
4. Do you consider yourself to be retired?Yes ............................................................................................................................................1No ..............................................................................................................................................2
4b. Are you a registered voter?Yes ............................................................................................................................................1No ..............................................................................................................................................2
D1. Do you consider yourself a Democrat, a Republican, or an independent?Democrat ....................................................................................................................................1Republican ..................................................................................................................................2independent ................................................................................................................................3Other ..........................................................................................................................................4
D2. How would you rate your health?Excellent......................................................................................................................................5Very good....................................................................................................................................4Good ..........................................................................................................................................3Fair..............................................................................................................................................2Poor............................................................................................................................................1
5. How knowledgeable are you about the way the Social Security system works?Very knowledgeable ....................................................................................................................4Somewhat knowledgeable ..........................................................................................................3Not too knowledgeable ................................................................................................................2Not at all knowledgeable ..............................................................................................................1
6. Overall, is your view of Social Security favorable or unfavorable?Very favorable..............................................................................................................................4Somewhat favorable ....................................................................................................................3Somewhat unfavorable ................................................................................................................2Very unfavorable ..........................................................................................................................1
7. In general, do you think we spend too much, not enough, or about the right amount on Social Security?Too much....................................................................................................................................1Not enough ................................................................................................................................2About the right amount ................................................................................................................3Don’t know..................................................................................................................................4

40 www.nasi.org
8. Please tell me if you agree or disagree with the following statements:
[RANDOMIZE]
Strongly Somewhat Somewhat Strongly agree agree disagree disagree
a. I think of Social Security as the foundation which I [IF NOT RETIRED: can/IF RETIRED: could] build on for my retirement security. 4 3 2 1
b. I [IF NOT RETIRED: don’t/IF RETIRED: didn’t] mind paying Social Security taxes because it provides security and stability to millions of retired Americans, disabled individuals, and the children and widowed spouses of deceased workers. 4 3 2 1
c. I [IF NOT RETIRED: don’t/IF RETIRED: didn’t] mindmind paying Social Security taxes because I [IF NOT RETIRED: know/ IF RETIRED: knew] I would have to help support my parents, grandparents or other familymembers if they did not receive Social Security. 4 3 2 1
d. [IF NOT RETIRED] I don’t mind paying Social Security taxes because I know that I will be receiving benefits when I retire. [IF RETIRED] I didn’t mind paying Social Security taxes because I knew that I would be receiving benefits when I retired. 4 3 2 1
e. To provide a more secure retirement for working Americans, we should consider increasing Social Security benefits. 4 3 2 1
f. [IF NOT RETIRED] I don’t know if I’m going to need Social Security money when I retire, but I want to know it is there just in case I do need it. [IF RETIRED] I didn’t know if I would need Social Security money when I retired, but I wanted to know it was there just in case I did need it. 4 3 2 1
g. Social Security benefits now are more important than ever to ensure that retirees have a dependable income. 4 3 2 1
9. Some people believe that Social Security benefits do not provide enough income for retirees. Do you agree or disagree that Social Security benefits are inadequate?Strongly agree ............................................................................................................................4Somewhat agree ........................................................................................................................3Somewhat disagree ....................................................................................................................2Strongly disagree ........................................................................................................................1
[IF Q4 = ‘YES’, SKIP TO Q11; ELSE CONTINUE]
10. At what age do you plan to retire?
[IF Q4 = ‘NO’, SKIP TO Q12; ELSE CONTINUE]
11. At what age did you retire?

Strengthening Social Security: What Do Americans Want? 41
12. Are you or your spouse currently receiving Social Security benefits?Yes, I am ....................................................................................................................................1Yes, my spouse is ......................................................................................................................2Yes, we both are ........................................................................................................................3No ..............................................................................................................................................4
12b. [ASK IF 1or3 IN Q. 12] At what age did you start receiving Social Security benefits?
(Insert drop down box starting at under 50, include each age until 75 or older)
12c. [ASK IF 2or3 IN Q.12] At what age did your spouse start receiving Social Security benefits?
(Insert drop down box starting at under 50, include each age until 75 or older)
[IF Q12 = 'YES' (1or3), SKIP to Q14; ELSE CONTINUE]
13. How important do you think Social Security benefits will be to your monthly income when [IF NOTRETIRED: you retire/ IF RETIRED AND NOT RECEIVING BENEFITS: you begin receiving benefits]?Extremely important ....................................................................................................................4Somewhat important....................................................................................................................3Not very important ......................................................................................................................2Not at all important ......................................................................................................................1
[IF Q12 = 'NO' (2or4), SKIP to Q16; ELSE CONTINUE]
14. How important would you say Social Security benefits are to your monthly income?Extremely important ....................................................................................................................4Somewhat important....................................................................................................................3Not very important ......................................................................................................................2Not at all important ......................................................................................................................1
15. If for some reason you did not receive your Social Security benefits, which of the following statements best describes the effect it would have on your lifestyle?
[RANDOMLY REVERSE LIST ORDER]
It would have no effect ................................................................................................................4My budget would be tighter but I would get by ..............................................................................3I would have to make significant sacrifices ....................................................................................2I would not be able to afford the basics such as food,clothing or housing ......................................................................................................................1
16. How confident are you in the future of the Social Security system?Very confident..............................................................................................................................4Somewhat confident....................................................................................................................3Not very confident ......................................................................................................................2Not at all confident ......................................................................................................................1
[IF Q12 = 'YES' (1or3), SKIP to Q18; ELSE CONTINUE]

42 www.nasi.org
17. How confident are you that all of the Social Security benefits you are supposed to get will be available to you when [IF NOT RETIRED: you retire/ IF RETIRED AND NOT RECEIVING BENEFITS: you begin receiving benefits?Very confident..............................................................................................................................4Somewhat confident....................................................................................................................3Not very confident ......................................................................................................................2Not at all confident ......................................................................................................................1
18. Would you say that funding for Social Security in the future is a crisis, a significant problem, a manageable problem, or is not a problem at all? [RANDOMLY REVERSE LIST ORDER]Crisis ..........................................................................................................................................4Significant problem ......................................................................................................................3Manageable problem ..................................................................................................................2Not a problem ............................................................................................................................1
19. Currently Social Security is funded by taxes on earnings, with workers normally paying 6.2% of their earnings and employers paying a matching amount. (Under the payroll tax holiday enacted by Congress, the worker’s share has been temporarily reduced to 4.2%.)
If you knew that increasing Social Security taxes from 6.2% to 7.6% for both workers and employers would ensure that Social Security could pay full benefits for the next 75 years, would you say that funding for Social Security in the future is a crisis, a significant problem, a manageable problem, or is not a problem at all? [RANDOMLY REVERSE LIST ORDER]Crisis ..........................................................................................................................................4Significant problem ......................................................................................................................3Manageable problem ..................................................................................................................2Not a problem ............................................................................................................................1
20. Please tell me if you agree or disagree with the following statements:
[ROTATE A-B]
Strongly Somewhat Somewhat Strongly agree agree disagree disagree
a. It is critical that we preserve Social Security for future generations, even if it means increasing the Social Security taxes paid by working Americans. 4 3 2 1
b. It is critical that we preserve Social Security for future generations, even if it means increasing the Social Security taxes paid by wealthy Americans. 4 3 2 1
21. Which of the statements below comes closer to your view?
[RANDOMIZE] Some people say we should ensure Social Security benefits are not reduced, even if it means raising taxes on some or all Americans ................................................................1Some people say we shouldn’t raise taxes on any American, even if it means reducing Social Security benefits ..................................................................................................2

Strengthening Social Security: What Do Americans Want? 43
22. Which of the following statements comes closest to what you believe Social Security should provide to retirees?
[RANDOMLY REVERSE LIST ORDER] Less income than is needed for the basic necessities of life ..........................................................1About what is needed for the basic necessities of life ....................................................................2More than is needed for the basic necessities of life, but not enough to maintain
their pre-retirement standard of living ........................................................................................3Enough to maintain their pre-retirement standard of living ..............................................................4
23. Official Social Security Administration projections show that the Social Security system has enough money to pay all benefits until the year 2033. If no changes are made to the program, which one of the following do you think would be most likely to happen after 2033?Social Security would be able to pay 100% of benefits ..................................................................1Social Security would be able to pay 75% of benefits ....................................................................2Social Security would be able to pay 50% of benefits ....................................................................3Social Security would be unable to pay benefits at all ....................................................................4
24. Social Security benefit payments currently account for about 5% of the United States economy. As the baby boomers retire, Social Security’s share of the economy will increase, reaching 6.4% by 2035, when all of the baby boomers will be retired. Then it will drop back to about 6% and will stay at that level. Some people say this means that Social Security is affordable. Do you agree or disagree that Social Security, as a share of the economy, is affordable?Strongly agree ............................................................................................................................4Somewhat agree ........................................................................................................................3Somewhat disagree ....................................................................................................................2Strongly disagree ........................................................................................................................1
Social Security benefits are modest – the average retirement benefit in January 2012 was just$1,230 per month. Some people believe that Social Security benefits are not as high as theyshould be to protect the financial security of retired Americans. Proposals have been suggested toimprove benefits for all or some workers. However, Social Security faces a long-term financinggap. Improvements to benefits would increase the financing gap, so they would have to be paidfor by increasing Social Security’s revenues. We’re interested in getting your reaction to some ofthese proposals.
Benefits for Lifetime Low-Wage Workers
25. Social Security benefits are based on the amount of money a worker earns. Currently, men and women who work all their lives at low wages are at risk of living in poverty in retirement, even after paying Social Security taxes during all the years they worked.
One proposal would raise the minimum Social Security benefit to ensure that someone who worked and paid into the Social Security system for 30 years can retire at age 62 or later and not be poor.
This change would increase Social Security’s financing gap by 7%. Do you favor or oppose this change?Favor strongly ..............................................................................................................................5Favor somewhat ..........................................................................................................................4Not sure ......................................................................................................................................3Oppose somewhat ......................................................................................................................2Oppose strongly ..........................................................................................................................1

44 www.nasi.org
Improved Benefits for All Workers
25b. Social Security benefits are modest. The average retirement benefit in January 2012 was just $1,230per month. One proposal would increase Social Security benefits by $60 per month for all beneficiaries.
This change alone would increase the financing gap by 28%.
Do you favor or oppose this change?Favor strongly ..............................................................................................................................5Favor somewhat ..........................................................................................................................4Not sure ......................................................................................................................................3Oppose somewhat ......................................................................................................................2Oppose strongly ..........................................................................................................................1
Children’s Benefits for Students
25c. Children whose working parents have died or become disabled receive Social Security benefits until the age of 19. One proposal would extend the current cut-off age from 19 to 22 years of age, if the child is attending college or vocational school. This would make higher education more affordable for young people in families who have lost a breadwinner’s income.
This change would increase the financing gap by 3%.
Do you favor or oppose this change?Favor strongly ..............................................................................................................................5Favor somewhat ..........................................................................................................................4Not sure ......................................................................................................................................3Oppose somewhat ......................................................................................................................2Oppose strongly ..........................................................................................................................1
Social Security’s Cost-of-Living Adjustment (COLA)
26. The purpose of Social Security’s annual Cost-of-Living Adjustment (COLA) is to increase benefits to keep up with inflation.
The current COLA may not keep up with the inflation that seniors face because seniors spend more on out-of-pocket health care costs, which generally rise faster than average inflation. One proposal would base the COLA on inflation that seniors actually experience.
Example: If general inflation from one year to the next is 3%, but inflation experienced by seniors is 3.2%, this COLA for the elderly would increase a $1,000 monthly benefit by $32 instead of by $30.
This change would more fully protect seniors against inflation, and would increase Social Security’s financing gap by 13%.
Do you favor or oppose this change? Favor strongly ..............................................................................................................................5Favor somewhat ..........................................................................................................................4Not sure ......................................................................................................................................3Oppose somewhat ......................................................................................................................2Oppose strongly ..........................................................................................................................1

Strengthening Social Security: What Do Americans Want? 45
28. Some other ideas have been suggested for strengthening Social Security benefits. Do you favor or
oppose each of the following proposals?
[RANDOMIZE]
Favor Favor Not Oppose Opposestrongly somewhat sure somewhat strongly
a. Count the time that working parents
take off to care for children towards
the parents’ future Social Security
benefits so they do not receive lower
benefits because of this gap in paid
work. This would increase Social
Security’s financing gap by 9%. 5 4 3 2 1
c. Increase benefits by $60 per month for
recipients over the age of 85 because
they generally depend more heavily on
Social Security. This would increase
Social Security’s financing gap by 4%. 5 4 3 2 1
As stated earlier, Social Security currently faces a projected long-term revenue shortfall. The rev-enues being collected to finance Social Security benefits will cover 100% of benefits until 2033.After that point, if Congress fails to act, the system will only be able to pay 75% of benefits. Severalproposals have been suggested to help close the financing gap, either by increasing revenues thatgo into the Social Security system or cutting Social Security benefits. We are interested in gettingyour reaction to some of these proposals.
Social Security’s Taxable Earnings Cap
29. Currently, people pay Social Security taxes on annual earnings up to a cap ($110,100 in 2012). About
5% of workers earn more than $110,100. Congress originally intended the cap to cover 90% of all
earnings by American workers. Currently, the cap covers only about 84% of all earnings.
One proposal is to gradually increase the taxable earnings cap to $215,000 per year. This would
restore the goal of Congress to subject 90% of all earnings to Social Security taxes. The top 5%
would pay more into Social Security and would receive somewhat higher benefits when they retire.
This change would close 30% of Social Security’s financing gap.
Do you favor or oppose this change?
Favor strongly ..............................................................................................................................5
Favor somewhat ..........................................................................................................................4
Not sure ......................................................................................................................................3
Oppose somewhat ......................................................................................................................2
Oppose strongly ..........................................................................................................................1

46 www.nasi.org
30. Another proposal would completely eliminate the taxable earnings cap, which is currently set at$110,100 per year. Gradually eliminating the cap over 10 years would mean that the top 5% of earn-ers would pay Social Security taxes on all their earnings throughout the year, just like everyone else. Inreturn, they would receive somewhat higher benefits when they retire. This change would close 71%of Social Security’s financing gap.
Do you favor or oppose this change?Favor strongly ..............................................................................................................................5Favor somewhat ..........................................................................................................................4Not sure ......................................................................................................................................3Oppose somewhat ......................................................................................................................2Oppose strongly ..........................................................................................................................1
Social Security Tax Rate
31. Workers currently pay 6.2% of their earnings to Social Security, matched by the employer. One pro-posal would very gradually raise the Social Security tax rate over the next 20 years.
Example: For a worker earning $50,000, gradually raising the tax rate by 1/20th of 1% per year for 20 years would mean, each year, paying about 50 cents more per week, matched by the employer.
This change would close 53% of Social Security’s financing gap.
Do you favor or oppose this change?Favor strongly ..............................................................................................................................5Favor somewhat ..........................................................................................................................4Not sure ......................................................................................................................................3Oppose somewhat ......................................................................................................................2Oppose strongly ..........................................................................................................................1
32. Another proposal would raise the Social Security tax rate for workers and employers in two steps inthe future – from 6.2% to 7.2% in 2022 and to 8.2% in 2052.
Example: For a worker earning $50,000, each change would mean an increase of $9.60 per week, matched by the employer.
This change would close 77% of Social Security’s financing gap.
Do you favor or oppose this change? Favor strongly ..............................................................................................................................5Favor somewhat ..........................................................................................................................4Not sure ......................................................................................................................................3Oppose somewhat ......................................................................................................................2Oppose strongly ..........................................................................................................................1
Social Security’s Cost-of-Living Adjustment (COLA)
33. The purpose of Social Security’s annual Cost-of-Living Adjustment (COLA) is to increase benefits tokeep up with inflation. Some argue for using a new measure of inflation that generally increases bene-fits slower than the current COLA now used to adjust Social Security benefits.
Example: If inflation from one year to the next is 3%, but the new inflation measure went up by only 2.7%, that new measure would increase a $1,000 monthly benefit by $27 instead of by $30.

Strengthening Social Security: What Do Americans Want? 47
This small difference would add up over time so that the oldest seniors would get the biggest benefitcuts. The benefit cut would add up to about 6.5% by the time a retiree reaches age 85.
This change would reduce seniors’ protection against inflation. It would close 20% of Social Security’sfinancing gap.
Do you favor or oppose reducing the COLA?Favor strongly ..............................................................................................................................5Favor somewhat ..........................................................................................................................4Not sure ......................................................................................................................................3Oppose somewhat ......................................................................................................................2Oppose strongly ..........................................................................................................................1
Social Security’s Full Retirement Age
34. Workers can collect Social Security benefits before their full retirement age, starting at age 62, butbenefits are reduced. The full retirement age – that is, the age when an individual can receive full So-cial Security benefits – is increasing. In the past it was 65. It is 66 now, and will gradually increase to67 (for workers born in 1960 and later). Increasing the full retirement age is an across-the-board bene-fit cut at any age a worker takes benefits. The increase from 65 to 67 is a 13% benefit cut.
One proposal is to gradually raise the full retirement age to 68. That would be an additional 7% benefitcut more than the change from 65 to 67. This change would close 15% of Social Security’s financinggap.
Do you favor or oppose this change?Favor strongly ..............................................................................................................................5Favor somewhat ..........................................................................................................................4Not sure ......................................................................................................................................3Oppose somewhat ......................................................................................................................2Oppose strongly ..........................................................................................................................1
35. Another proposal would very gradually raise the full retirement age to age 70. This change would bean additional benefit cut of about 21% on top of the change from 65 to 67. It would close 25% of So-cial Security’s financing gap.
Do you favor or oppose this change? Favor strongly ..............................................................................................................................5Favor somewhat ..........................................................................................................................4Not sure ......................................................................................................................................3Oppose somewhat ......................................................................................................................2Oppose strongly ..........................................................................................................................1
Means-Testing Social Security
36. “Means-testing” would require people to provide proof of eligibility, based on their income and assets,in order to receive any Social Security benefits. Currently, Social Security is not means-tested: work-ers earn the right to receive benefits by paying Social Security taxes. This proposal would fundamen-tally change Social Security.
This change might close 20% of Social Security’s financing gap.
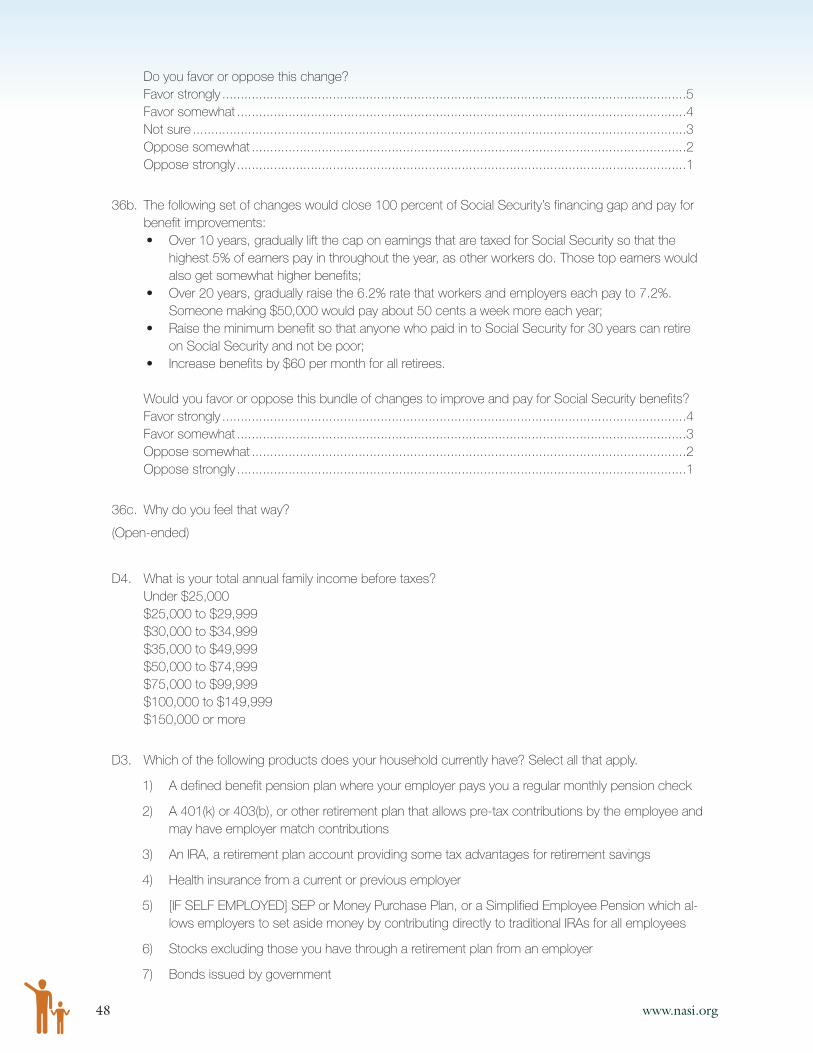
48 www.nasi.org
Do you favor or oppose this change?Favor strongly ..............................................................................................................................5Favor somewhat ..........................................................................................................................4Not sure ......................................................................................................................................3Oppose somewhat ......................................................................................................................2Oppose strongly ..........................................................................................................................1
36b. The following set of changes would close 100 percent of Social Security’s financing gap and pay forbenefit improvements: • Over 10 years, gradually lift the cap on earnings that are taxed for Social Security so that the
highest 5% of earners pay in throughout the year, as other workers do. Those top earners wouldalso get somewhat higher benefits;
• Over 20 years, gradually raise the 6.2% rate that workers and employers each pay to 7.2%.Someone making $50,000 would pay about 50 cents a week more each year;
• Raise the minimum benefit so that anyone who paid in to Social Security for 30 years can retireon Social Security and not be poor;
• Increase benefits by $60 per month for all retirees.
Would you favor or oppose this bundle of changes to improve and pay for Social Security benefits? Favor strongly ..............................................................................................................................4Favor somewhat ..........................................................................................................................3Oppose somewhat ......................................................................................................................2Oppose strongly ..........................................................................................................................1
36c. Why do you feel that way?
(Open-ended)
D4. What is your total annual family income before taxes? Under $25,000$25,000 to $29,999$30,000 to $34,999$35,000 to $49,999$50,000 to $74,999$75,000 to $99,999$100,000 to $149,999$150,000 or more
D3. Which of the following products does your household currently have? Select all that apply.
1) A defined benefit pension plan where your employer pays you a regular monthly pension check
2) A 401(k) or 403(b), or other retirement plan that allows pre-tax contributions by the employee andmay have employer match contributions
3) An IRA, a retirement plan account providing some tax advantages for retirement savings
4) Health insurance from a current or previous employer
5) [IF SELF EMPLOYED] SEP or Money Purchase Plan, or a Simplified Employee Pension which al-lows employers to set aside money by contributing directly to traditional IRAs for all employees
6) Stocks excluding those you have through a retirement plan from an employer
7) Bonds issued by government

Strengthening Social Security: What Do Americans Want? 49
8) Life insurance, or an insurance policy that pays a death benefit when a person dies
9) Long-term care insurance, or an insurance policy that helps pay for receiving day-to-day care butdoes not cover medical bills
10) Annuity for retirement income, or a contract provided by insurance companies for a steadystream of income in retirement
11) Certificate of Deposit (CD) or Savings Account
12) Disability insurance, or an insurance policy that pays a person a percentage of their previous in-come when he/she becomes disabled through illness or injuries NOT job related
13) Mutual funds not including 401(k) or 403(b)

Appendix C: Trade-off Analysis ExampleA trade-off analysis module further explored what changes in the Social Security system are most favoredby Americans. Rather than having each change rated individually in isolation, this module required partici-pants to specify their preference from a variety of different packages of changes. The results indicate whichspecific changes are most favorable and which are least favorable.
After study participants had provided favorability ratings for each of the proposed changes to the currentSocial Security system individually, they were asked to complete the trade-off analysis module. The instruc-tions given were as follows:
You will now see a series of 10 screens. Eachscreen will have 3 bundles of Social Security policychanges, and a 4th bundle that has no changes tothe current system. The last line of each bundleshows how much that set of changes would reduce(or increase) Social Security’s long-term financinggap. For each screen, please select the option thatis most appealing to you.
On each screen there will be a link to a definitionguide that contains further explanations and exam-ples of the options. Please review this guide beforecompleting the first screen, and keep it open forreference going forward. Each screen will alsocontain ‘hover definitions’ that will appear whenyou move your cursor over the different elementson the screen. These provide a quick reference inaddition to the larger definitions guide.
In this exercise, you won’t be able to move back-ward once you have finished a screen. So once youhave completed a screen, just move forward.
Please take time to review the options you seebelow. Each option contains a different set ofSocial Security policy changes. (When you see ablank box in an option, it means there would be no
change from the current Social Security system.)The last line of each option shows how much thatoption would reduce (or increase) Social Security’slong-term financing gap. For example,
� A positive 80% means that bundle of changeswould reduce the financing gap by 80%.
� A positive 120% means the bundle ofchanges would eliminate the financing gap,and have 20% left over (for example, toimprove benefits or provide a margin ofsafety in future financing).
� A negative 10% means that the bundle ofchanges would increase the Social Securityfinancing gap by 10%.
Once you have compared all three options,please choose the one that is most appealing toyou. If “no change” to the current system ispreferable to you than each of the 3 changeoptions (Options1-3), you may choose the “nochange” bundle at the right (Option 4).
50 www.nasi.org

Strengthening Social Security: What Do Americans Want? 51
option1 option2 option3 option4
SOCIAL Over 20 years, raise the Over 20 years, raise the
SECURITY tax by 1/20th of 1% (5 cents tax by 1/20th of 1% (5 cents
TAX RATE per $100 of income) per year per $100 of income) per year
for workers and employers for workers and employers
SOCIAL Lift the earnings cap over Eliminate the Eliminate the cap over 10
SECURITY a 5-year period until it cap over 10 years to tax 100% of earnings.
TAXABLE once again covers 90% of years to tax
EARNINGS CAP all earnings by American 100% of
workers. earnings.
CHILDREN'S Extend the current cut-off age
BENEFITS FOR for Social Security benefits
STUDENTS from 19 to 22 if the child of a
decreased/ disabled worker is
in college or vocational school
BENEFITS FOR
ALL
BENEFICIARIES
BENEFITS FOR
LIFETIME
LOW-WAGE
WORKERS
SOCIAL Lower the COLA to more Increase the COLA by basing
SECURITY’S accurately reflect inflation it on inflation for the elderly
COST-OF-LIVING
ADJUSTMENT
(COLA)
SOCIAL Gradually raise
SECURITY'S FULL the full retirement
RETIREMENT AGE age to 70
MEANS TESTING Require people
SOCIAL SECURITY to prove they
need benefits in
order to receive
them
% REDUCTION IN
FINANCING GAP: 101% 116% 122% 0%
SELECT ONE O O O O
Sample Trade-off Grid 1

52 www.nasi.org
option1 option2 option3 option4
SOCIAL SECURITY Raise the current tax for both Over 20 years,
TAX RATE employers and workers from raise the tax by
6.2% to 7.2% in 2022 and 1/20th of 1% (5
from 7.2% to 8.2% in 2052 cents per $100
of income) per
year for workers
and employers
SOCIAL SECURITY Lift the earnings cap over a 5- Eliminate the cap Eliminate the cap over 10
TAXABLE year period until it once again over 10 years to years to tax 100% of earnings.
EARNINGS CAP covers 90% of all earnings tax 100% of
by American workers. earnings.
CHILDREN'S Extend the current cut-off age
BENEFITS FOR for Social Security benefits
STUDENTS from 19 to 22 if the child of a
decreased/disabled worker is
in college or vocational school
BENEFITS FOR
ALL BENEFICIARIES
BENEFITS FOR Raise minimum
LIFETIME LOW- benefit for 30-
WAGE WORKERS year workers
SOCIAL Lower the COLA to more Increase the Lower the COLA to more
SECURITY’S accurately reflect inflation COLA by accurately reflect inflation
COST-OF-LIVING basing it on
ADJUSTMENT inflation for
(COLA) the elderly
SOCIAL Gradually raise the full
SECURITY'S retirement age to 68
FULL RETIRE-
MENT AGE
MEANS TESTING Require people to prove they
SOCIAL SECURITY need benefits in order to receive
them
% REDUCTION IN 127% 115% 126% 0%
FINANCING GAP:
SELECT ONE O O O O
Sample Trade-off Grid 2

Strengthening Social Security: What Do Americans Want? 53
option1 option2 option3 option4
SOCIAL SECURITY Over 20 years, raise the tax Over 20 years, Raise the current tax for bothTAX RATE by 1/20th of 1% (5 cents per raise the tax by employers and workers
$100 of income) per year for 1/20th of 1% from 6.2% to 7.2% in 2022workers and employers (5 cents per and from 7.2% to 8.2% in 2052
$100 of income) per year for workers and employers
SOCIAL SECURITY Eliminate the capTAXABLE over 10 yearsEARNINGS CAP to tax 100%
of earnings.
CHILDREN'S Extend theBENEFITS FOR current cut-off ageSTUDENTS for Social Security
benefits from 19to 22 if the childof a deceased/
disabled worker is in college or voca-
tional school
BENEFITS FOR Increase benefitsALL by $60 a month BENEFICIARIES for all beneficiaries
BENEFITS FOR LIFETIME LOW-WAGE WORKERS
SOCIAL Lower the COLA to more Lower the COLA to moreSECURITY’S accurately reflect inflation accurately reflect inflationCOST-OF-LIVING ADJUSTMENT (COLA)
SOCIAL Gradually raise the full Gradually raise the fullSECURITY'S retirement age to 70 retirement age to 68FULL RETIRE-MENT AGE
MEANS TESTING Require people to prove theySOCIAL SECURITY need benefits in order to receive
them
% REDUCTION IN FINANCING GAP: 98% 100% 132% 0%
SELECT ONE O O O O
Sample Trade-off Grid 3

54 www.nasi.org
Appendix D: Individual Policy Options Definitions1. Financing gap: Social Security currently faces a projected long-term revenue shortfall. Social Security’strust fund reserves plus the revenues being collected to finance Social Security benefits will cover 100% ofbenefits until 2033. Then, if Congress fails to act, the trust fund reserves will be used up and the revenuecontinuing to come in from payroll taxes will cover only 75% of the benefits that recipients should receive.
There are many ways to close the financing gap, including increasing revenues into the Social Security sys-tem or reducing benefits. For example, workers now pay 6.2% of earnings to Social Security, with employ-ers matching that amount. If, instead, workers and employers each paid 7.6%, there would be no financinggap.
2. Social Security Tax Rate: Currently, workers pay 6.2% of earnings, with employers matching thatamount, up to an earnings cap, which is $110,100 in 2012. Earnings above the cap are not taxed or cred-ited toward benefits.
Option 1: Raise the tax for workers and employers in two steps in the future – from 6.2% to 7.2% in2022 and to 8.2% in 2052.
� For a worker earning $50,000, each change would mean an increase of $9.60 per week,matched by the employer.
� This change alone eliminates 77% of the financing gap.
Option 2: Over 20 years, raise the tax by 1/20th of 1% (5 cents per $100 of income) per year forworkers and employers each.
� For a worker earning $50,000, this would mean an increase each year of 50 cents per week.
� This change alone cuts the financing gap by 53%.
3. Social Security’s Taxable Earnings Cap: Currently, annual earnings above $110,100 are not taxed forSocial Security. [Note: In October 2012 — after the survey was completed — the taxable earnings cap wasincreased to $113,700 for 2013.] About 5% of workers earn more than $110,100. Congress originallyintended for Social Security taxes to cover 90% of all earnings by American workers. Currently, the cap cov-ers only about 84% of all earnings.
Option 1: Lift the earnings cap over a 5-year period until it once again covers 90% of all earnings byAmerican workers (this would raise the earnings cap to about $215,000).
� The top 5% of earners would pay somewhat more into Social Security, and in return theywould get somewhat higher benefits.
� This change alone cuts the financing gap by 30%.
Option 2: Completely eliminate the earnings cap over 10 years.
� The top 5% of earners would pay Social Security taxes on all of their earnings all year, just asother workers do. In return they would get somewhat higher benefits.
� This change alone cuts the financing gap by 71%.

Strengthening Social Security: What Do Americans Want? 55
4. Benefits for Lifetime Low-Wage Workers: Currently, men and women who work all their lives at lowwages are at risk of living in poverty in retirement, even after paying Social Security taxes during all theyears they worked. Increasing Social Security’s minimum benefit would ensure that anyone who workedand paid Social Security taxes for 30 years or more can retire at age 62 or later and not be poor.
Option: Increase Social Security’s minimum benefit so that someone who worked and paid SocialSecurity taxes for 30 years or more can retire at age 62 or later and not be poor.
� Does not affect most workers, whose benefits exceed this minimum adequacy level.
� This change alone increases the financing gap by 7%.
5. Children’s Benefits for Students: Currently, children whose working parents have died or become dis-abled receive Social Security benefits until the age of 19. Extending the benefit cut-off age to 22 if thechild is attending college or vocational school would make higher education more affordable for youngpeople in families who have lost a breadwinner’s income.
Option: Extend the current cut-off age of 19 to 22 years of age if the child of a deceased or dis-abled worker is in college or vocational school.
� This change alone increases the financing gap by 3%.
6. Benefits for All Beneficiaries: Social Security benefits are modest. The average retirement benefit inJanuary 2012 was just $1,230 per month.
Option: Increase Social Security benefits by about $60 per month for all beneficiaries.
� This change alone increases the financing gap by 28%.
7. Social Security’s Cost-of-Living Adjustment (COLA): The purpose of Social Security’s COLA is toincrease benefits to keep up with inflation. The Social Security Administration adjusts the COLA when thecost of living increases.
Option 1: Increase the COLA by basing it specifically on the inflation experienced by older people,who spend more on medical costs, which rise faster than inflation in general.
� If average inflation from one year to the next is 3%, but inflation experienced by seniors is3.2%, this COLA measure for the elderly would increase a $1,000 monthly benefit by $32instead of $30.
� This change alone increases the financing gap by 13%.
Option 2: Lower the COLA to more accurately reflect inflation throughout the economy in gen-eral, without regard to the inflation that older people actually experience.
� If average inflation from one year to the next is 3%, but a new inflation measure went up byonly 2.7%, this COLA measure would increase a $1,000 monthly benefit by $27 instead of$30.
� Benefit cuts add up over time, so the oldest seniors experience the largest cuts.
� This change alone cuts the financing gap by 20%.
8. Social Security’s Full Retirement Age: Currently, Social Security’s full retirement age is 66, and isgradually increasing to 67 (for workers born in 1960 and later). Workers may start collecting Social

56 www.nasi.org
Security benefits before their full retirement age, starting at age 62, but benefits are reduced. Increasingthe full retirement age is an across-the-board benefit cut at any age a worker takes benefits. The increase inthe retirement age from age 65 to 67 is a 13% benefit cut. Further increasing the full retirement age is anadditional benefit cut.
Option 1: Gradually raise the full retirement age to 68.
� Starting in 2023, increase the full retirement age each year until it reaches 68 in 2028.
� Reduces benefits about 7% on top of the change from 65 to 67.
� This change alone cuts the financing gap by 15%.
Option 2: Very gradually raise the retirement age to 70.
� Starting in 2023, increase the full retirement age each year until it reaches 70 in 2069.
� Reduces benefits about 21% on top of the change from 65 to 67.
� This change alone cuts financing gap by about 25%.
9. Means-Testing Social Security: “Means-testing” would require people to provide proof of eligibility,based on their income and assets, in order to receive any Social Security benefits. Currently, Social Securityis not means-tested: workers earn the right to receive benefits by paying Social Security taxes.
Option: Use means-testing to reduce benefits for people who have other assets or income.
� Fundamentally changes Social Security.
� Requires individuals to prove eligibility based on income and assets in order to receive benefits.
� Costly to administer because government must verify eligibility for benefits.
� This change alone cuts the financing gap by about 20%.

Strengthening Social Security: What Do Americans Want? 57
Appendix E: Detailed Descriptions and Cost Estimates for Policy OptionsThis appendix provides documentation of the 14policy options used in the survey and the estimatesof their financial effects. The cost estimates wereprepared by the Office of the Chief Actuary of theSocial Security Administration (SSA) and areamong those published on the SSA website.1
Social Security’s Actuarial BalanceThe actuarial balance of the Social Security pro-gram is a summary measure of the program’sfinancial status over the next 75 years. It is calcu-lated as the program’s starting reserves plus itsprojected income minus its projected outgo overthe next 75 years, expressed as a percentage of taxable payroll over the 75-year period. Taxablepayroll includes all U.S. wages, salaries, and self-employment income that are subject to payrolltaxes, up to the taxable earnings cap of $110,100in 2012 and $113,700 in 2013. The actuarial balance is -2.67% of taxable payroll, according tothe 2012 report of the Social Security Trustees. Itis a negative number because income is projectedto fall short of outgo and thus produce an actuar-ial deficit, or “financing gap,” of 2.67% of taxablepayroll.
Effect of Individual Policy OptionsThe SSA actuaries also estimate the effects of indi-vidual policy options as a percentage of taxable
payroll. These estimates show how any particularpolicy change would affect the program’s actuarialbalance. Any option that raises revenue or lowersoutgo would have a positive effect on the actuarialbalance and, thus, reduce or eliminate the deficit.Any option that increases benefits or reduced rev-enue would have a negative impact on the actuar-ial balance and, thus, increase the deficit. Unlessotherwise noted, the cost estimates shown in thisappendix are drawn from the website of the Officeof the Chief Actuary in 2012 and are based onassumptions in the 2011 Trustees Report.
In Table E, figures in column (B) are the actuarialestimates of the impact of each individual policyoption on the actuarial balance. Positive numbersindicate that the policy would reduce or eliminatethe negative actuarial balance, or deficit. Negativenumbers indicate that that the policy wouldincrease the deficit. Column (C) indicated wherethe specific option was found on the website of theSocial Security actuaries.
Column (A) shows how the figures in column (B)would change the actuarial deficit of 2.67% of pay-roll. For example, the first option, which improvesthe actuarial balance by 1.90% of taxable payroll,would reduce the deficit by 71% (1.90/2.67 =71%). Figures in column (A) are used to describethe financial effects of the options described in thisreport and are also shown on Table 6 of thereport.

58 www.nasi.org
Table E. Policy Options and Estimates of Financial Impact Used in the Study
Percent change Change in Option #in 2.67% balance: on SSA’s
financing gap % of payroll websiteDescription of Policy Options (A) (B) (C)
Cap on Earnings Taxed for Social Security(1) Eliminate the taxable earnings cap, phased in over 10 years -71% 1.90 E2.10
between 2013 and 2022. Provide benefit credit for earnings above the current tax cap at a lower (5%) rate. Phase in both the tax rate and the benefit credit for earnings at a proportional rate over 10 years.
(2) Lift the taxable earnings cap so that 90% of earnings would -30% 0.81 E3.3be covered (phased in 2013-2018). Provide benefit credit for earnings up to the revised tax cap.
Social Security Tax Rate(3) Increase the 6.2% payroll tax that employees and employers -53% 1.41 E1.4
each pay by by 1/20th of 1% per year over 20 years (2017-2036), until it reaches 7.2% in 2036 and later.
(4) Increase the payroll tax rate (for employers and employees -77% 2.06 2
each) to 7.2% in 2022 and to 8.2% in 2052.
Social Security’s Full Retirement Age(5) After the full retirement age (FRA) reaches 67 for those age -15% 0.41 C1.2
62 in 2022, increase the FRA by 2 months every year until the FRA reaches 68 in 2028.
(6) After the full retirement age (FRA) reaches 67 for those age -25% 0.66 C2.43
62 in 2022, increase the FRA by less than 1 month (36/47 of a month) per year, until the FRA reaches 70 in approximately 2050.
Means-Test Social Security(7) Reduce or eliminate Social Security benefits by offsetting the benefit against the individuals’ other (non-Social
Security) income. One such plan would phase out benefits for people with non-Social Security income between$55,000 and $110,000 a year for individuals. -20% 0.53 4
Children’s Benefits for Students(8) Beginning in 2012, continue benefits for children of disabled or deceased workers until age 22 if the child is in
high school, college, or vocational school. +3% -0.07 D1
Benefits for All Beneficiaries(9) Beginning in 2012, increase benefits by a uniform dollar +28% -0.75 B7.5
amount for all beneficiaries and for all newly-eligible beneficiaries after 2012. The dollar amount of the increase equals a uniform 5% of the average retired worker monthly benefit amount in the prior year. The increase would be approximately $60 a month in 2012.

Strengthening Social Security: What Do Americans Want? 59
Table E. Policy Options and Estimates of Financial Impact Used in the Study (continued)
Percent change Change in Option #in 2.67% balance: on SSA’s
financing gap % of payroll websiteDescription of Policy Options (A) (B) (C)
Benefits for Lifetime Low-Wage Workers(10)Beginning in 2012, reconfigure the special minimum benefit +7% -0.19 B5.2
so that the primary insurance amount (PIA)5 for 30 years of coverage (YOC) is equal to 125 percent of the monthly poverty level (about $1,128 in 2010). For those with less than 30 YOC, the PIA for each YOC after 10 is $56.40 (or $1,128/20). Index these initial PIA amounts by wage growth.
Social Security’s COLA(11)Beginning in December 2013, compute the COLA using +13% -0.35 A6
the Consumer Price Index for the Elderly (CPI-E). This would increase the annual COLA by about 0.2 percentage points, on average.
(12)Beginning in December 2012, compute the COLA using the -20% 0.52 A3chained CPI-W. This would reduce the annual COLA by about 0.3 percentage points, on average.
Caregiver Credit(13)Give earnings credits to parents with a child under age 6 9% -0.24 B7.3
for up to 5 years. The earnings credited for childcare equal half of the Social Security average wage index (about $21,490 in 2011). If the parent earned less than the credit, Social Security wage credits would be increased up to the childcare credit level. The credits are available for past years to newly eligible retired-worker and disabled-worker beneficiaries starting in 2012. The 5 years are chosen to yield the largest increase in average indexed monthly earnings.
Benefits for the Oldest Old (85+)(14)Beginning in 2012, increase the monthly benefit amount of 4% -0.10 B6.2
any beneficiary who is (or turns) 85 or older. The dollar amount of the increase equals a uniform 5 percent of the average retired worker monthly benefit amount in the prior year. The increase would be approximately $60 in 2013 (5% of the average retired worker benefit of $1,230 in December 2012).
Combinations of OptionsOptions (1) and (3) -134% 3.58Options (1) and (4) -163% 4.35Options (2) and (3) -87% 2.33Options (2) and (4) -113% 3.03
Source: National Academy of Social Insurance based on information in notes on Appendix E.
60 www.nasi.org
Combinations of Policy OptionsCertain combinations of the individual optionsproduce interaction effects, meaning that if the twooptions were implemented together, their totaleffect would differ from the simple sum of the twochanges individually. For example, when consider-ing a tax rate increase in combination with broad-ening the base, the impact is greater than the sumof the two individual changes due to the interac-tion effect. The estimates used in the study takeaccount of the interaction among Options 1through 4, which affect the tax rate and tax base.These combinations are shown at the bottom ofTable E. For example, Option 1 (phasing out thetaxable earnings cap) and Option 3 (gradually rais-ing the tax rate) combined are estimated to close134% of the financing gap – slightly more than thesum of the two changes individually, which wouldbe 124%.
Notes on Appendix E:1) Unless otherwise noted, the cost estimates and
descriptions of the options are from SSA’swebsite: http://www.ssa.gov/OACT/solvency/provisions/index.html
2) This estimate was produced in 2009 and citedin the NASI report Fixing Social Security:Adequate Benefits, Adequate Financing. SSAhas since revised this proposal to the follow-ing: 7.3% in 2024 and 8.4% in 2054. Therevised proposal (which is option E1.2 onSSA’s website) brings in revenue of 2.30% ofpayroll, or 86% of the financing gap.
3) This option on SSA’s website also includesincreasing the earliest eligibility age (EEA) toage 65. Since the EEA is actuarially neutral,the cost estimate does not change significantlyby eliminating that part of the option.
4) SSA has not produced an estimate for directmeans-testing. The cost estimate listed here isa rough estimate, extrapolated from aHeritage Foundation plan that includedmeans-testing (see Butler et al., Saving theAmerican Dream: The Heritage Plan to Fix theDebt, Cut Spending, and Restore Prosperity,The Heritage Foundation, Washington, DC,2011).
5) PIA, or Primary Insurance Amount, is an indi-vidual’s basic monthly benefit amount beforeadjusting for age of claiming.


1776 Massachusetts Avenue, NW, Suite 400
Washington, DC 20036-1904
Telephone: 202-452-8097
Facsimile: 202-452-8111
Email: [email protected]
Website: www.nasi.org
Twitter: @socialinsurance