national accounts digest - caricomstats.org accounts digest... · the national accounts digest,...
TRANSCRIPT

NATIONAL ACCOUNTS
DIGEST
2009-2015
Volume I
CARIBBEAN COMMUNITY (CARICOM) SECRETARIAT
GEORGETOWN GUYANA
CARICOM


NATIONAL ACCOUNTS DIGEST
2009 – 2015
STATISTICS PROGRAMME CARIBBEAN COMMUNITY (CARICOM) SECRETARIAT
October 2016
ii
Copyright © 2016, Caribbean Community (CARICOM) Secretariat NATIONAL ACCOUNTS DIGEST 2009-2015 Prepared and Compiled by The Regional Statistics Programme Caribbean Community (CARICOM) Secretariat Turkeyen P.O. Box 10827 Georgetown Guyana Telephone: (592) 222-0001 /75 Fax: (592) 222-0098 E-mail: [email protected] Web site: www.caricomstats.org ISBN 978-976-600-390-6 (Internet Ed) ISBN 978-976-600-391-3 (CD-Rom)
iii
PREFACE
This is the twelfth edition of the National Accounts Digest prepared by the Regional Statistics Programme of the Caribbean Community (CARICOM) Secretariat. This Digest presents data for the period 2009-2015 and is an update to the last edition which was produced in 2015 and presented information for the period 2008-2014.
The National Accounts Digest, which is produced in two volumes, aims at providing statistics on the economic conditions and performance of the CARICOM region over a specific period as reflected in the Gross Domestic Product of its Member States and Associate Members. Most of the data presented in this volume were submitted by the National Statistical Offices (NSOs) through the United Nations National Accounts Questionnaire (NAQ) or were extracted from national and/or sub-regional reports or from web sites of the NSOs or Central Banks. More specifically the report presents:
- Industry profile of GDP in current and constant prices by country; - Expenditure components of GDP by country; and - Relations among product, income, saving and net lending aggregates, by country.
This report does not present data on percentage changes or distributions, instead, these indicators are provided in the supplementary volume which is usually produced a few months following the release of the current report. For the most part, the data are reported in Eastern Caribbean dollars (EC$) and also in the national currency of Member States at constant and current prices. The conversion of GDP from national currencies to a common currency through the use of official exchange rates, may, in some cases, be influenced by the effects due to the possibility of wide fluctuations between the national currencies and a common currency such as the EC or US dollar. This conversion sometimes renders the comparison of current prices among countries or current and constant prices of the same country meaningless.
The use of the nominal (official) exchange rate to convert GDP of one country to the currency of another assumes that the price structures of both countries are identical and that the goods being traded are also similar. Another approach would be to use Purchasing Power Parity (PPP) which seeks to eliminate the discrepancy that can arise in the interpretation of GDP when using nominal exchange rates conversion. However, the data requirements of detailed price and expenditure data are usually quite enormous and are often not available. Countries in the Region participated in the 2011 Round of the International Comparison Programme (ICP) which may make it possible to derive PPP rates. There is an increasing demand for data that can monitor, analyse and evaluate the economies of the Region, information that is relevant, timely and readily available not only to policy and decision makers, but to anyone wishing to conduct economic analyses or research as well as information that lay persons can understand and relate to. The System of National Accounts (SNA) 1993, which is used by countries in the Region, provides the framework within which these data can be collected and compiled in order to observe and analyse the interactions taking place between the different sectors of the economy. At its fortieth session in 2009, the United

iv
Nations Statistical Commission approved the 2008 SNA and though the countries of the CARICOM Region have not yet moved to this revised international standard, there has been agreement on a strategy for its implementation across the Region and some countries have taken steps towards its implementation. The issue of data comparability, timeliness and reliability will have to be considered if the information is to be relevant and of an acceptable quality. In this vein, the CARICOM Secretariat welcomes any suggestions from users and producers that will guide us in improving the national accounting framework as reflected in this report.

v
ACKNOWLEDGEMENTS
The CARICOM Secretariat wishes to thank the National Statistics Offices of Antigua and Barbuda, The Bahamas, Barbados, Belize, Dominica, Grenada, Guyana, Jamaica, Montserrat, St Kitts and Nevis, Saint Lucia, St Vincent and the Grenadines, Suriname, Trinidad and Tobago, Anguilla, Bermuda, the British Virgin Islands, the Cayman Islands and the Turks and Caicos Islands for supplying the data for the compilation of this report. Appreciation is also extended to the Central Bank of Barbados and the Eastern Caribbean Central Bank. Special thanks to the staff of the Regional Statistics Programme for producing this report.
SYMBOLS
… means Data not available R means revised data Pv means data for the year are Provisional Pl means data for the year are Preliminary Pj means data for the year are Projected T means data for the year are Tentative
SOURCES OF DATA
Statistics Division, Antigua and Barbuda Department of Statistics, Ministry of Finance and Planning, The Bahamas Barbados Statistical Service Central Bank of Barbados The Statistical Institute of Belize Central Statistical Office, Dominica Central Statistical Office, Grenada Bureau of Statistics, Guyana The Statistical Institute of Jamaica Statistics Department, Montserrat Statistics Department, St. Kitts and Nevis Statistics Department, Saint Lucia Statistics Office, St. Vincent and the Grenadines General Bureau of Statistics, Suriname Central Statistical Office, Trinidad and Tobago Eastern Caribbean Central Bank Statistics Department, Anguilla Department of Statistics, Bermuda Development Planning Unit, British Virgin Islands Economics and Statistics Office, Cayman Islands Statistical Office, Turks and Caicos Islands

vi
EXCHANGE RATES
Eastern Caribbean Dollars (EC$) per Unit National Currency
COUNTRY NATIONAL CURRENCY 2009 2010 2011 2012 2013 2014 2015
THE BAHAMAS Bahamas Dollar - B$ 2.7000 2.7000 2.7000 2.7000 2.7000 2.7000 2.7000
BARBADOS Barbados Dollar - BD$ 1.3500 1.3500 1.3500 1.3500 1.3500 1.3500 1.3500
BELIZE Belize Dollar - BZ$ 1.3500 1.3500 1.3500 1.3500 1.3500 1.3500 1.3500
GUYANA Guyana Dollar - G$ 0.0133 0.0133 0.0133 0.0132 0.0132 0.0130 0.0131
JAMAICA Jamaica Dollar - J$ 0.0305 0.0310 0.0314 0.0303 0.0268 0.0243 0.0230
SURINAME Suriname Dollar - SRD 0.9836 0.9836 0.8253 0.8182 0.8182 0.8182 0.7989
TRINIDAD & TOBAGO
Trinidad & Tobago Dollar - TT$
0.4286 0.4253 0.4219 0.4217 0.4209 0.4229 0.4249
BERMUDA Bermuda Dollar – BM$ 2.7000 2.7000 2.7000 2.7000 2.7000 2.7000 2.7000
CAYMAN ISLANDS
Cayman Islands Dollar – (CI$)
3.2530 3.2530 3.2530 3.2530 3.2530 3.2530 3.2530
UNITED STATES United States Dollar – US$
2.7000 2.7000 2.7000 2.7000 2.7000 2.7000 2.7000

vii
TABLE OF CONTENTS
Page
PREFACE iii
ACKNOWLEDGEMENTS v
SYMBOLS v
SOURCES OF DATA v
EXCHANGE RATES vi
TABLE OF CONTENTS vii
CONCEPTS AND DEFINITIONS xiv
LIST OF TABLES
CARICOM
Table 1.1a Gross Domestic Product in Constant 2006 Prices (EC$ Mn) ................................ 1
Table 1.1b Gross Domestic Product in Constant 2006 Prices (US$ Mn) ................................ 1
Table 1.2a Gross Domestic Product in Current Market Prices (EC$ Mn)............................... 2
Table 1.2b Gross Domestic Product in Current Market Prices (US$ Mn) .............................. 2
Table 1.3a Gross National Income in Current Market Prices (EC$ Mn)................................. 3
Table 1.3b Gross National Income in Current Market Prices (US$ Mn) ................................ 3
Table 1.4a Gross Domestic Product in Current Market Prices: Agriculture (EC$ Mn) .......... 4
Table 1.4b Gross Domestic Product in Current Market Prices: Agriculture (US$ Mn) .......... 4
Table 1.5a Gross Domestic Product in Current Market Prices:
Mining and Quarrying (EC$ Mn) .......................................................................... 5
Table 1.5b Gross Domestic Product in Current Market Prices:
Mining and Quarrying (US$ Mn) .......................................................................... 5
Table 1.6a Gross Domestic Product in Current Market Prices: Manufacturing (EC$ Mn) ..... 6
Table 1.6b Gross Domestic Product in Current Market Prices: Manufacturing (US$ Mn) .... 6
Table 1.7a Gross Domestic Product in Current Market Prices: Utilities (EC$ Mn)................ 7
Table 1.7b Gross Domestic Product in Current Market Prices: Utilities (US$ Mn) ............... 7

viii
Table 1.8a Gross Domestic Product in Current Market Prices: Services (EC$ Mn) ............... 8
Table 1.8b Gross Domestic Product in Current Market Prices: Services (US$ Mn) ............... 8
ANTIGUA AND BARBUDA
Table 2.1 Gross Value Added by Industry in Current Prices (EC$ Mn) ................................. 9
Table 2.2 Gross Value Added by Industry in Constant 2006 Prices (EC$ Mn) .................... 10
Table 2.3 Gross Domestic Product by Expenditures in Current Prices (EC$ Mn) ................ 11
Table 2.4 Relations among Product, Income, Savings, and Net Lending
Aggregates (EC$ Mn) .............................................................................................. 12
The BAHAMAS
Table 3.1 Gross Value Added by Industry in Current Prices (EC$ Mn) ................................. 13
Table 3.2 Gross Value Added by Industry in Constant 2006 Prices (EC$ Mn) .................... 14
Table 3.3 Gross Value Added by Industry in Current Prices (B$ Mn) .................................... 15
Table 3.4 Gross Value Added by Industry in Constant 2006 Prices (B$ Mn) ...................... 16
Table 3.5 Gross Domestic Product by Expenditures in Current Prices (EC$ Mn) ................ 17
Table 3.6 Gross Domestic Product by Expenditures in Constant 2006 Prices (EC$ Mn) ..... 17
Table 3.7 Gross Domestic Product by Expenditures in Current Prices (B$ Mn) ................... 18
Table 3.8 Gross Domestic Product by Expenditures in Constant 2006 Prices (B$ Mn) ........ 18
Table 3.9 Relations among Product, Income, Savings, and Net Lending
Aggregates (EC$ Mn) .............................................................................................. 19
Table 3.10 Relations among Product, Income, Savings, and Net Lending
Aggregates (B$ Mn) ................................................................................................. 20
BARBADOS
Table 4.1 Gross Value Added by Industry in Current Prices (EC$ Mn) ................................. 21
Table 4.2 Gross Value Added by Industry in Constant 1974 Prices (EC$ Mn) .................... 22
Table 4.3 Gross Value Added by Industry in Current Prices (BDS$ Mn) .............................. 23
Table 4.4 Gross Value Added by Industry in Constant 1974 Prices (BDS$ Mn) ................. 24
Table 4.5 Gross Domestic Product by Expenditures in Current Prices (EC$ Mn) ................ 25
Table 4.6 Gross Domestic Product by Expenditures in Current Prices (BDS$ Mn) .............. 25

ix
BELIZE
Table 5.1 Gross Value Added by Industry in Current Prices (EC$ Mn) ................................. 27
Table 5.2 Gross Value Added by Industry in Constant 2000 Prices (EC$ Mn) .................... 28
Table 5.3 Gross Value Added by Industry in Current Prices (BZ$ Mn) ................................. 29
Table 5.4 Gross Value Added by Industry in Constant 2000 Prices (BZ$ Mn) .................... 30
Table 5.5 Gross Domestic Product by Expenditures in Current Prices (EC$ Mn) ................ 31
Table 5.6 Gross Domestic Product by Expenditures in Constant 2000 Prices (EC$ Mn) ..... 31
Table 5.7 Gross Domestic Product by Expenditures in Current Prices (BZ$ Mn) ................ 32
Table 5.8 Gross Domestic Product by Expenditures in Constant 2000 Prices (BZ$ Mn) ..... 32
Table 5.9 Relations among Product, Income, Savings, and Net Lending
Aggregates (EC$ Mn) .............................................................................................. 33
Table 5.10 Relations among Product, Income, Savings, and Net Lending
Aggregates (BZ$ Mn) .............................................................................................. 34
DOMINICA
Table 6.1 Gross Value Added by Industry in Current Prices (EC$ Mn) ................................. 35
Table 6.2 Gross Value Added by Industry in Constant 2006 Prices (EC$ Mn) .................... 36
Table 6.3 Gross Domestic Product by Expenditures in Current Prices (EC$ Mn) ................ 37
Table 6.4 Relations among Product, Income, Savings, and Net Lending
Aggregates (EC$ Mn) .............................................................................................. 38
GRENADA
Table 7.1 Gross Value Added by Industry in Current Prices (EC$ Mn) ................................. 39
Table 7.2 Gross Value Added by Industry in Constant 2006 Prices (EC$ Mn) ..................... 40
Table 7.3 Gross Domestic Product by Expenditures in Current Prices (EC$ Mn) .................. 41
Table 7.4 Relations among Product, Income, Savings, and Net Lending
Aggregates (EC$ Mn) .............................................................................................. 42
GUYANA
Table 8.1 Gross Value Added by Industry in Current Prices (EC$ Mn) ................................. 43
Table 8.2 Gross Value Added by Industry in Constant 2006 Prices (EC$ Mn) .................... 44

x
Table 8.3 Gross Value Added by Industry in Current Prices (G$ Mn) ................................... 45
Table 8.4 Gross Value Added by Industry in Constant 2006 Prices (G$ Mn) ...................... 46
Table 8.5 Gross Domestic Product by Expenditures in Current Prices (EC$ Mn) ................ 47
Table 8.6 Gross Domestic Product by Expenditures in Current Prices (G$ Mn) ................... 47
Table 8.7 Relations among Product, Income, Savings, and Net Lending
Aggregates (EC$ Mn) .............................................................................................. 48
Table 8.8 Relations among Product, Income, Savings, and Net Lending
Aggregates (G$ Mn) ................................................................................................ 49
JAMAICA
Table 9.1 Gross Value Added by Industry in Current Prices (EC$ Mn) ................................. 51
Table 9.2 Gross Value Added by Industry in Constant 2007 Prices (EC$ Mn) .................... 52
Table 9.3 Gross Value Added by Industry in Current Prices (J$ Mn) ..................................... 52
Table 9.4 Gross Value Added by Industry in Constant 2007 Prices (J$ Mn) ....................... 54
Table 9.5 Gross Domestic Product by Expenditures in Current Prices (EC$ Mn) ................ 55
Table 9.6 Gross Domestic Product by Expenditures in Constant 2007 Prices (EC$ Mn) ..... 55
Table 9.7 Gross Domestic Product by Expenditures in Current Prices (J$ Mn) .................... 56
Table 9.8 Gross Domestic Product by Expenditures in Constant 2007 Prices (J$ Mn) ......... 56
Table 9.9 Relations among Product, Income, Savings, and Net Lending
Aggregates (EC$ Mn) .............................................................................................. 57
Table 9.10 Relations among Product, Income, Savings, and Net Lending
Aggregates (J$ Mn) .................................................................................................. 58
MONTSERRAT
Table 10.1 Gross Value Added by Industry in Current Prices (EC$ Mn) ................................ 59
Table 10.2 Gross Value Added by Industry in Constant 2006 Prices (EC$ Mn) ................... 60
Table 10.3 Gross Domestic Product by Expenditures in Current Prices (EC$ Mn) ............... 61
Table 10.4 Relations among Product, Income, Savings, and Net Lending
Aggregates (EC$ Mn) ............................................................................................ 62

xi
ST. KITTS & NEVIS
Table 11.1 Gross Value Added by Industry in Current Prices (EC$ Mn) ................................ 63
Table 11.2 Gross Value Added by Industry in Constant 2006 Prices (EC$ Mn) ................... 64
Table 11.3 Gross Domestic Product by Expenditures in Current Prices (EC$ Mn) ............... 65
Table 11.4 Relations among Product, Income, Savings, and Net Lending
Aggregates (EC$ Mn) ............................................................................................ 66
SAINT LUCIA
Table 12.1 Gross Value Added by Industry in Current Prices (EC$ Mn) ................................ 67
Table 12.2 Gross Value Added by Industry in Constant 2006 Prices (EC$ Mn) ................... 68
Table 12.3 Gross Domestic Product by Expenditures in Current Prices (EC$ Mn) ............... 69
Table 12.4 Relations among Product, Income, Savings, and Net Lending
Aggregates (EC$ Mn) ............................................................................................ 70
ST. VINCENT & THE GRENADINES
Table 13.1 Gross Value Added by Industry in Current Prices (EC$ Mn) ................................ 71
Table 13.2 Gross Value Added by Industry in Constant 2006 Prices (EC$ Mn) ................... 72
Table 13.3 Gross Domestic Product by Expenditures in Current Prices (EC$ Mn) ............... 73
Table 13.4 Gross Domestic Product by Expenditures in Constant 2006 Prices (EC$ Mn) .... 73
Table 13.5 Relations among Product, Income, Savings, and Net Lending
Aggregates (EC$ Mn) ............................................................................................ 74
SURINAME
Table 14.1 Gross Value Added by Industry in Current Prices (EC$ Mn) ................................ 75
Table 14.2 Gross Value Added by Industry in Constant 2007 Prices (EC$ Mn) ................... 76
Table 14.3 Gross Value Added by Industry in Current Prices (SRD Mn) ............................... 77
Table 14.4 Gross Value Added by Industry in Constant 2007 Prices (SRD Mn) .................. 78
TRINIDAD AND TOBAGO
Table 15.1 Gross Value Added by Industry in Current Prices (EC$ Mn) ................................ 79
Table 15.2 Gross Value Added by Industry in Constant 2000 Prices (EC$ Mn) ................... 80

xii
Table 15.3 Gross Value Added by Industry in Current Prices (TT$ Mn) ................................ 81
Table 15.4 Gross Value Added by Industry in Constant 2000 Prices (TT$ Mn) ................... 82
ANGUILLA
Table 16.1 Gross Value Added by Industry in Current Prices (EC$ Mn) ................................ 83
Table 16.2 Gross Value Added by Industry in Constant 2006 Prices (EC$ Mn) ................... 84
Table 16.3 Gross Domestic Product by Expenditures in Current Prices (EC$ Mn) ............... 85
Table 16.4 Relations among Product, Income, Savings, and Net Lending
Aggregates (EC$ Mn) ............................................................................................ 86
BERMUDA
Table 17.1 Gross Value Added by Industry in Current Prices (EC$ Mn) ................................ 87
Table 17.2 Gross Value Added by Industry in Constant 2006 Prices (EC$ Mn) ................... 88
Table 17.3 Gross Value Added by Industry in Current Prices (BM$ Mn) ............................... 89
Table 17.4 Gross Value Added by Industry in Constant 2006 Prices (BM$ Mn) .................. 90
Table 17.5 Gross Domestic Product by Expenditures in Current Prices (EC$ Mn) ............... 91
Table 17.6 Gross Domestic Product by Expenditures in Constant 2006 Prices (EC$ Mn) .... 91
Table 17.7 Gross Domestic Product by Expenditures in Current Prices (BM$ Mn) .............. 92
Table 17.8 Gross Domestic Product by Expenditures in Constant 2006 Prices (BM$ Mn) ... 92
Table 17.9 Relations among Product, Income, Savings, and Net Lending
Aggregates (EC$ Mn) ............................................................................................ 93
Table 17.10 Relations among Product, Income, Savings, and Net Lending
Aggregates (BM$ Mn) ........................................................................................... 94
BRITISH VIRGIN ISLANDS
Table 18.1 Gross Value Added by Industry in Current Prices (EC$ Mn) ................................ 95
Table 18.2 Gross Value Added by Industry in Current Prices (US$ Mn) ................................ 96
Table 18.3 Gross Domestic Product by Expenditures in Current Prices (EC$ Mn) ............... 97
Table 18.4 Gross Domestic Product by Expenditures in Current Prices (US$ Mn) ............... 97
CAYMAN ISLANDS
Table 19.1 Gross Value Added by Industry in Current Prices (EC$ Mn) ................................ 99

xiii
Table 19.2 Gross Value Added by Industry in Constant 2007 Prices (EC$ Mn) ................... 100
Table 19.3 Gross Value Added by Industry in Current Prices (CI$ Mn) .................................101
Table 19.4 Gross Value Added by Industry in Constant 2007 Prices (CI$ Mn) .................... 102
TURKS AND CAICOS ISLANDS
Table 20.1 Gross Value Added by Industry in Current Prices (EC$ Mn) ................................103
Table 20.2 Gross Value Added by Industry in Constant 2000 Prices (EC$ Mn) ................... 104
Table 20.3 Gross Value Added by Industry in Current Prices (US$ Mn) ................................105
Table 20.4 Gross Value Added by Industry in Constant 2000 Prices (US$ Mn) ................... 106
Table 20.5 Gross Domestic Product by Expenditures in Current Prices (EC$ Mn) ............... 107
Table 20.6 Gross Domestic Product by Expenditures in Current Prices (US$ Mn) ............... 107
xiv
CONCEPTS AND DEFINITIONS 1. GROSS DOMESTIC PRODUCT: A key aggregate of the system of National Accounts is the Gross Domestic Product. The Gross Domestic Product (GDP) of an economy is the total value of all goods and services produced by all institutional units resident in the economy within a given time period, usually one year. It includes the allowance made for the consumption of fixed capital. Gross value added is a measure of GDP in which a principal consideration is that duplications must be avoided which is achieved by deducting from the output of each producing unit the value of the inputs of goods and services received from other units, at home or abroad, i.e. GDP can be derived as the sum of the value added of resident institutional units in an economy. This measure of GDP is also identical with the sum of the final expenditures on consumption, on gross capital formation and adjusted for exports less imports of goods and services. GDP is also equal to the sum of the incomes accruing from production which includes compensation of employees, consumption of operating surplus and fixed capital. 2. GROSS NATIONAL INCOME ( GNI): Gross National Income (GNI) is equal to GDP less primary incomes payable to non-resident units plus primary incomes receivable from non-resident units. In the 1993 System of National Accounts (SNA), GNI is synonymous with the Gross National Product (GNP) of the 1958 SNA, however, conceptually GNI is not a concept of value added, but more one of income. GNI is the aggregate value of the gross balances of primary incomes for all industries. The primary income components are taxes (less subsidies) on production and imports, compensation of employees and property income in all cases payable/ receivable to/from the rest of the world. 3. THE GROSS OUTPUT OF INDUSTRIES: Gross output is the value of goods and services produced within an accounting period adjusted for changes in stocks of finished goods and work-in- progress. 0utput consists of goods and services that are produced within an establishment that are disposed of in one of the following ways:
(a) Market output which includes the total value of all goods and services sold on the market,
bartered, used for payments in kind, supplied by one establishment to another belonging to the same market enterprise and the total value of changes in inventories of finished goods and work-in-progress intended for all these uses mentioned herein.
(b) Output for own final use which includes goods and services that are retained for their own final
use by the owners of the establishments within which they are produced, the total value of fixed assets produced by an establishment that are retained within the same enterprise for use in future production and the total value of changes in inventories of finished goods and work in progress intended for one of the uses contained herein.
(c) Other non-market output includes goods and services that are provided free or at prices that are
not economically significant. Common examples are the goods and services produced by government units or by non-profit units serving households (NPISHs) such as education and health services.

xv
4. INTERMEDIATE CONSUMPTION: Intermediate consumption consists of the value of non-durable goods and services consumed as inputs by a process of production. The value of all goods and services that are used as inputs into ancillary activities such as accounting, marketing etc. are included as intermediate consumption. The consumption of fixed assets is excluded from intermediate consumption as well as purchases of valuables (capital account). In addition goods and services that are produced within the same establishment and fed back as inputs into production within the same establishment are not recorded as intermediate consumption. 5. CONSUMPTION OF FIXED CAPITAL: Consumption of fixed capital is defined as the decline during the accounting period in the current value of the stock of fixed assets owned and used by a producer. This decline in the fixed assets can be due to physical deterioration, normal obsolescence, or accidental damage and excludes the damage caused by acts of war and other such exceptional events. Consumption of fixed assets should be considered a cost of production. The inclusion of this item in value added gives rise to the gross concept of GDP with the inclusion allowing for a net measure of value added and GDP. 6. VALUATION OF GDP Outputs and inputs can be valued in the following ways: Basic prices
The basic price is the amount receivable by the producer from the purchaser of a unit of a good or service produced as output minus any tax payable and plus any subsidy receivable on that unit, as a consequence of its production or sale. It excludes any transport charges invoiced separately by the producer.
Producers’ prices
The producers’ price is the amount receivable by the producer from the purchaser for a unit of a good or service produced as output minus any value added (VAT) or similar deductible tax, invoiced to the purchaser. It excludes any transport charges invoiced separately by the producer.
Purchasers’ price
The purchasers’ price is the amount paid by the purchaser, excluding any deductible VAT or similar deductible tax, in order to take delivery of a unit of a good or service at the time and place required by the purchaser. It includes any transport charges paid separately to take delivery at the required time and place.
The above valuation concepts are in-keeping with the recommendations of the 1993 SNA. Output can be measured either at basic or producers’ prices. Intermediate inputs should be valued at purchasers’ prices. GDP at Market Prices is equal to GDP at basic prices plus all taxes less subsidies on products, this includes taxes less subsidies on imports as well as on outputs. 7. TAXES ON PRODUCTION AND IMPORTS Taxes are compulsory unrequited payments in cash or in kind made by institutional units to government units. Taxes on production and imports consist of:

xvi
- taxes on products payable on goods and services when they are produced, sold and otherwise disposed of by their producers; - other taxes on production comprising taxes on ownership/use of land, buildings or other assets used in production or on the labour employed or on the compensations paid to employees.
These taxes are recorded as being payable out of the gross value added. The term indirect tax which was formally used is no longer commonly used in the 1993 SNA. Indirect taxes which correspond to the taxes on production and income are compulsory payments to Government which industries treat as part of the cost of production. They include import and export duties, excise, sales, entertainment and turnover taxes, real estate and land taxes, levies on value added and the employment of labour (but not social security contributions), motor vehicles, driving tests, licenses, airport and passport fees when paid by producers. 8. SUBSIDIES Subsidies are current unrequited payments that government units, including non-resident government units, make to enterprises on the basis of the levels of their production activities or values of the goods and services they produce, sell or import. They are receivable by resident producers or importers and may be designed to influence the levels of production, the prices at which outputs are sold or the remuneration of the institutional units engaged in production. Subsidies are not payable to final consumers. Current transfers that government make to households are treated as social benefits. In effect, subsidies are treated as negative taxes on production. 9. FINANCIAL INTERMEDIATION SERVICES INDIRECTLY MEASURED - IMPUTED SERVICE
CHARGES The imputed service charge, referred to as Financial Intermediation Services Indirectly Measured (FISIM) in the 1993 SNA, is an adjustment that is required to GDP to take into consideration the estimation of the output of some financial intermediaries that do not charge explicitly for all services provided. These services include the borrowing and lending of funds from/to different categories of borrowers and lenders while paying/charging different rates of interest. The net receipt of interest defrays the costs of providing these services (that are not individually charged) and also provides operating surplus for the intermediaries. This total value of FISIM is the net property income received by these intermediaries and should in principle be allocated as intermediates among the users of these services. Due to the difficulty in allocating FISIM, in practice, it is normally recorded as intermediate consumption of a nominal industry and deducted from GDP (Imputed Service Charge). 10. SELECTED EQUATIONS IN THE SYSTEM OF NATIONAL ACCOUNTS
(1) Gross Domestic Product (GDP) at market prices = Output plus Taxes, less Subsidies, on products – Intermediate Consumption
(2) Gross Domestic Product (GDP) at Market Prices = Final Consumption Expenditure plus Changes in Inventories plus Gross fixed capital formation plus Acquisition less Disposal of valuables plus Exports of Goods and Services less Imports of Goods and Services
xvii
(3) Gross National Income = GDP at Market Prices plus Taxes, less Subsidies, on Production and Imports (net receivable abroad) plus compensation of employees ( net, receivable abroad) plus Property Income (net receivable abroad)
(4) Net National Income (NNI or equivalent to NNP) at Market Prices = GNI at Market Prices less consumption of fixed capital
(5) Net National Disposable Income (NNDI) = NNI at Market Prices plus Current Taxes on income, wealth etc. (net receivable from abroad) plus social contributions and benefits and other Current Transfers (net, receivable from abroad)
(6) Net National Disposable Income (NNDI) = Final Consumption Expenditure plus
Adjustment for the change of net equity of households on Pension funds (net receivable from abroad) plus Saving, net.
11. NATIONAL ACCOUNTS AT CONSTANT PRICES: For analytical purposes, the National Accounts at Constant Prices are derived by breaking current values down into a price component and a quantity component. For the purposes of deriving constant price estimates of GDP, a base year is selected which is deemed to be a normal year. Estimates at Constant Prices are usually derived by deflating the current year’s values by price indices or by extrapolating the base year values by appropriate volume indices. Both methods are equivalent to expressing current period quantities at base period prices. 12. COMPILATION PRACTICES The main practices used to compile National Accounts are the Production, Income, Expenditure and the Commodity Flow approaches. The conceptual bases of these approaches are as follows:
The production approach uses establishments as the basic reporting units and groups them into production activities. The sources of data are normally surveys or censuses of establishments, agriculture and similar sources, business accounts of enterprises and administrative records. Total output and intermediates are compiled from which the value added is estimated. Estimates are adjusted for the output of financial intermediation. The production data are also to be reorganised by institutional sectors.
In the expenditure approach elements of expenditure as illustrated in the equations highlighted
earlier are estimated. Imports and exports, usually measured freight on board (f.o.b.), are estimated from the data on foreign trade and balance of payments statistics. Data on government’s final expenditure are obtained from the records of government’s revenue and expenditure. Gross capital formation comprises gross fixed capital formation, changes in inventories and acquisitions less disposals of valuables. The sources of data for gross capital formation are surveys and administrative records.
The income approach derives independent estimates of compensation of employees, operating
surplus, gross fixed income, and taxes less subsidies on production. Sources of data are similar to the expenditure aggregates.

xviii
The commodity flow approach incorporates the three approaches described above and uses as a basis the Supply and Use Tables (SUT). The supply table, which shows the value of different products that are produced by each industry as well as imports, and the use table, shows the use of every product in the economy including exports. The basic principle is that the supply of every product must be equal to the use of that product at the level of the economy. The method therefore entails the compilation of product or commodity flows. Sources of data are derived from those of the other approaches.
13. GOVERNMENT’S FINAL CONSUMPTION EXPENDITURE This is defined as expenditure including imputed expenditure, incurred by general government on both individual consumption of goods and services as well as on collective consumption (e.g. community services such as security). Government’s expenditure is largely financed out of taxation and other government’s revenues. Government’s final consumption expenditure may be classified according to its purpose or function such as Education, Health, General Administration and so forth. 14. PRIVATE FINAL CONSUMPTION EXPENDITURE This component of GDP is defined as the outlays of households on new durable and non-durable goods and services less their net sales of second-hand goods, scraps and waste. Purchases of dwellings are treated as gross fixed capital formation of the real estate industry. The imputed rent of owner-occupied dwellings is a part of the gross output of the real estate industry and is also included in the final consumption expenditure of households. 15. GROSS CAPITAL FORMATION: Gross capital formation consists of gross fixed capital formation, changes in inventories and acquisitions less disposals of valuables. Gross fixed capital formation in turn, consists of acquisitions of fixed assets less disposals plus certain additions to the values of non-produced assets. Fixed assets are produced assets that can be used repeatedly or continuously over a period of time of one year or more. The acquisitions of new assets also include major improvements and renovations to fixed assets that increase significantly their productive capacity. Non-produced assets consist of assets that are needed for production but have not themselves been produced, e.g. land and mineral deposits. Changes in inventories are the market value at the owning establishment of the physical change during an accounting period in stocks of materials, supplies, work-in-progress except on construction projects, finished products, livestock raised for slaughter, merchandise of strategic materials held by resident industries in stock and emergency stocks of important products held by Government services. In practice, the closest feasible approximation may be the difference between the levels of these stocks at the beginning and the end of the period, both valued at approximate average prices ruling over the period. Valuables are assets that are not used for production or consumption and are therefore held primarily as a store of value. 16. EXPORTS AND IMPORTS OF GOODS AND NON-FACTOR SERVICES Exports and imports of goods and services consist of the transactions in goods and services of the residents of a given country with the rest of the world, and covers merchandise, transportation, travel, insurance and other non-factor services, such as various fees, rentals, royalties, gifts in kind, etc. Military equipment

xix
transferred between governments may, however, go unrecorded. Expenditure abroad by residents such as tourists and other persons, seasonal workers, and diplomatic and military personnel stationed abroad are treated as imports. Similarly, expenditures in the domestic territory by non-residents are considered exports. The valuation of exports and imports are free on board (f.o.b.) which is the price at the frontier of the exporter after it has been loaded onto the carrier and also after payment of export taxes less receipt of any rebates. In practice, some countries in the region record imports according to the convention of cost, insurance, freight (c.i.f.) which is the valuation at the frontier of the importing country inclusive of the cost of transportation and insurance.

THIS PAGE WAS INTENTIONALLY LEFT BLANK


Millions of EC dollars
COUNTRIES 2009 2010 2011 2012 2013 2014 2015 Pl
CARIBBEAN COMMUNITY 136,959.7 138,951.3 140,182.6 141,990.1 144,065.7 144,393.2 …
THE BAHAMAS 20,421.4 20,735.6 20,862.7 21,506.6 21,508.8 21,396.1 21,040.1
CSME 116,538.3 118,215.7 119,320.0 120,483.5 122,556.8 122,997.1 …
MDCs 100,423.2 102,349.9 103,367.2 104,347.3 106,166.2 105,991.8 …
BARBADOS 1 9,768.9 9,793.9 9,867.9 9,895.6 9,892.0 9,912.5 …
GUYANA 2 3,980.0 4,153.9 4,379.8 4,545.9 4,830.5 5,016.0 5,088.2
JAMAICA 2 27,199.3 26,803.5 27,185.1 27,045.4 27,101.0 27,243.7 27,498.3
SURINAME 8,000.0 8,413.2 8,905.1 9,145.2 9,413.3 9,447.9 9,191.8
TRINIDAD AND TOBAGO 51,475.1 53,185.5 53,029.3 53,715.1 54,929.4 54,371.6 54,468.4
LDCs 16,115.1 15,865.8 15,952.7 16,136.1 16,390.6 17,005.3 …
BELIZE 3,438.3 3,552.6 3,627.3 3,766.0 3,823.5 3,971.2 …
OECS 12,676.8 12,313.2 12,325.4 12,370.1 12,567.1 13,034.1 13,434.4
ANTIGUA AND BARBUDA 2,983.9 2,773.8 2,724.9 2,829.5 2,823.8 2,953.8 3,075.7
DOMINICA 1,186.4 1,194.4 1,191.6 1,178.9 1,187.9 1,237.7 1,215.9GRENADA 1,887.3 1,877.7 1,892.0 1,870.2 1,914.2 2,054.7 2,182.8MONTSERRAT 149.6 145.4 153.3 158.9 167.0 170.3 171.0
ST. KITTS AND NEVIS 1,767.6 1,727.9 1,769.3 1,758.7 1,868.1 1,979.5 2,053.9
SAINT LUCIA 3,006.8 2,955.7 2,962.8 2,919.9 2,921.7 2,934.5 3,004.0
ST. VINCENT AND THE GRENADINES 1,695.2 1,638.5 1,631.5 1,654.2 1,684.4 1,703.8 1,731.1
ASSOCIATE MEMBERS 25,031.1 24,439.3 24,029.8 23,515.9 23,335.7 23,633.1 …
ANGUILLA 699.4 668.3 695.6 652.1 648.1 681.4 701.5
BERMUDA 14,245.1 13,891.9 13,277.1 12,754.3 12,449.1 12,394.5 …
BRITISH VIRGIN ISLANDS … … … … … … …
CAYMAN ISLANDS 8,293.1 8,067.9 8,162.2 8,262.6 8,367.4 8,599.5 …
TURKS AND CAICOS ISLANDS 1,793.5 1,811.2 1,894.8 1,846.9 1,871.2 1,957.7 2,038.31 Refers to GDP at factor cost.
2 Refers to GDP at basic prices
Millions of US dollars
COUNTRIES 2009 2010 2011 2012 2013 2014 2015 Pl
CARIBBEAN COMMUNITY 50,725.8 51,463.5 51,919.5 52,588.9 53,357.7 53,479.0 …
THE BAHAMAS 7,563.5 7,679.9 7,726.9 7,965.4 7,966.2 7,924.5 7,792.6
CSME 43,162.3 43,783.6 44,192.6 44,623.5 45,391.4 45,554.5 …
MDCs 37,193.8 37,907.4 38,284.2 38,647.2 39,320.8 39,256.2 …
BARBADOS 1 3,618.1 3,627.4 3,654.8 3,665.0 3,663.7 3,671.3 …
GUYANA 2 1,474.1 1,538.5 1,622.1 1,683.7 1,789.1 1,857.8 1,884.5
JAMAICA 2 10,073.8 9,927.2 10,068.6 10,016.8 10,037.4 10,090.3 10,184.6
SURINAME 2,963.0 3,116.0 3,298.2 3,387.1 3,486.4 3,499.2 3,404.4
TRINIDAD AND TOBAGO 19,064.8 19,698.3 19,640.5 19,894.5 20,344.2 20,137.6 20,173.5
LDCs 5,968.5 5,876.2 5,908.4 5,976.3 6,070.6 6,298.3 …
BELIZE 1,273.4 1,315.8 1,343.4 1,394.8 1,416.1 1,470.8 …
OECS 4,695.1 4,560.5 4,565.0 4,581.5 4,654.5 4,827.4 4,975.7
ANTIGUA AND BARBUDA 1,105.2 1,027.3 1,009.2 1,047.9 1,045.8 1,094.0 1,139.1
DOMINICA 439.4 442.4 441.3 436.6 440.0 458.4 450.3
GRENADA 699.0 695.4 700.8 692.7 709.0 761.0 808.4
MONTSERRAT 55.4 53.8 56.8 58.9 61.8 63.1 63.3
ST. KITTS AND NEVIS 654.7 639.9 655.3 651.4 691.9 733.1 760.7
SAINT LUCIA 1,113.6 1,094.7 1,097.3 1,081.4 1,082.1 1,086.8 1,112.6
ST. VINCENT AND THE GRENADINES 627.8 606.8 604.3 612.6 623.9 631.0 641.2
ASSOCIATE MEMBERS 9,270.8 9,051.6 8,899.9 8,709.6 8,642.9 8,753.0 …
ANGUILLA 259.1 247.5 257.6 241.5 240.1 252.4 259.8
BERMUDA 5,276.0 5,145.2 4,917.5 4,723.8 4,610.8 4,590.6 …
BRITISH VIRGIN ISLANDS … … … … … … …
CAYMAN ISLANDS 3,071.5 2,988.1 3,023.0 3,060.2 3,099.0 3,185.0 …
TURKS AND CAICOS ISLANDS 664.3 670.8 701.8 684.0 693.0 725.1 754.91 Refers to GDP at factor cost.
2 Refers to GDP at basic prices
Table 1.1a CARICOM: Gross Domestic Product In Constant 2006 Prices
Table 1.1b CARICOM: Gross Domestic Product In Constant 2006 Prices
1

Millions of EC dollars
COUNTRIES 2009 2010 2011 2012 2013 2014 2015 Pl
CARIBBEAN COMMUNITY 151,382.9 164,547.1 177,794.9 183,592.0 185,930.9 188,902.5 …
THE BAHAMAS 21,115.1 21,355.9 21,302.3 22,677.4 23,009.4 23,267.9 23,904.5
CSME 130,267.7 143,191.3 156,492.6 160,914.6 162,921.5 165,634.6 …
MDCs 112,843.4 125,658.7 138,450.8 142,380.5 143,864.6 145,512.1 …
BARBADOS 12,423.2 12,006.1 11,768.9 11,696.9 11,802.2 11,752.4 …
GUYANA 5,509.8 6,133.0 6,990.2 7,712.5 8,123.5 8,283.2 9,321.8
JAMAICA 32,466.1 35,732.4 38,989.5 39,865.7 38,344.4 37,427.1 38,371.9
SURINAME 10,464.0 11,796.4 11,927.7 13,445.8 13,893.3 14,150.0 13,316.4
TRINIDAD AND TOBAGO 51,980.2 59,990.8 68,774.4 69,659.6 71,701.1 73,899.4 70,238.2
LDCs 17,424.4 17,532.6 18,041.8 18,534.0 19,056.9 20,122.5 …
BELIZE 3,609.8 3,772.2 4,014.9 4,249.4 4,385.6 4,638.2 …
OECS 13,814.6 13,760.4 14,026.9 14,284.6 14,671.3 15,484.3 16,095.9
ANTIGUA AND BARBUDA 3,287.8 3,099.4 3,083.0 3,283.3 3,228.9 3,440.7 3,660.2
DOMINICA 1,320.5 1,333.3 1,352.7 1,312.0 1,372.8 1,426.1 1,396.5
GRENADA 2,082.5 2,081.7 2,102.4 2,159.7 2,274.9 2,461.2 2,657.0
MONTSERRAT 160.4 149.9 172.0 168.8 160.6 159.3 159.9
ST. KITTS AND NEVIS 1,952.7 1,903.5 2,033.7 1,983.1 2,128.0 2,289.0 2,366.5
SAINT LUCIA 3,188.6 3,353.1 3,457.7 3,506.8 3,558.7 3,742.7 3,864.1
ST. VINCENT AND THE GRENADINES 1,822.2 1,839.3 1,825.5 1,871.0 1,947.3 1,965.3 1,991.7
ASSOCIATE MEMBERS 29,854.7 29,409.4 29,229.8 29,253.3 29,726.4 … …
ANGUILLA 762.8 723.4 789.5 756.3 761.4 840.6 863.3
BERMUDA 16,035.1 15,809.4 15,175.0 15,077.7 15,227.2 15,258.5 …
BRITISH VIRGIN ISLANDS 2,365.2 2,413.8 2,473.2 2,455.3 2,472.1 … …
CAYMAN ISLANDS 8,793.1 8,608.5 8,824.3 9,031.6 9,277.4 9,735.7 …
TURKS AND CAICOS ISLANDS 1,898.6 1,854.3 1,967.7 1,932.5 1,988.2 2,151.2 2,329.2
Millions of US dollars
COUNTRIES 2009 2010 2011 2012 2013 2014 2015 Pl
CARIBBEAN COMMUNITY 56,067.7 60,943.4 65,850.0 67,997.0 68,863.3 69,963.9 …
THE BAHAMAS 7,820.4 7,909.6 7,889.8 8,399.0 8,522.0 8,617.7 8,853.5
CSME 48,247.3 53,033.8 57,960.2 59,598.0 60,341.3 61,346.2 …
MDCs 41,793.8 46,540.3 51,278.1 52,733.5 53,283.2 53,893.4 …
BARBADOS 4,601.2 4,446.7 4,358.9 4,332.2 4,371.2 4,352.8 …
GUYANA 2,040.7 2,271.5 2,589.0 2,856.5 3,008.7 3,067.9 3,452.5
JAMAICA 12,024.5 13,234.2 14,440.6 14,765.1 14,201.6 13,861.9 14,211.8
SURINAME 3,875.6 4,369.0 4,417.7 4,979.9 5,145.7 5,240.7 4,932.0
TRINIDAD AND TOBAGO 19,251.9 22,218.8 25,472.0 25,799.9 26,555.9 27,370.1 26,014.1
LDCs 6,453.5 6,493.5 6,682.2 6,864.5 7,058.1 7,452.8 …
BELIZE 1,337.0 1,397.1 1,487.0 1,573.9 1,624.3 1,717.9 …
OECS 5,116.5 5,096.4 5,195.2 5,290.6 5,433.8 5,734.9 5,961.4
ANTIGUA AND BARBUDA 1,217.7 1,147.9 1,141.9 1,216.0 1,195.9 1,274.3 1,355.6
DOMINICA 489.1 493.8 501.0 485.9 508.4 528.2 517.2
GRENADA 771.3 771.0 778.7 799.9 842.6 911.6 984.1
MONTSERRAT 59.4 55.5 63.7 62.5 59.5 59.0 59.2
ST. KITTS AND NEVIS 723.2 705.0 753.2 734.5 788.2 847.8 876.5
SAINT LUCIA 1,180.9 1,241.9 1,280.6 1,298.8 1,318.1 1,386.2 1,431.1
ST. VINCENT AND THE GRENADINES 674.9 681.2 676.1 692.9 721.2 727.9 737.7
ASSOCIATE MEMBERS 11,057.3 10,892.4 10,825.8 10,834.5 11,009.8 … …
ANGUILLA 282.5 267.9 292.4 280.1 282.0 311.3 319.7
BERMUDA 5,938.9 5,855.3 5,620.4 5,584.3 5,639.7 5,651.3 …
BRITISH VIRGIN ISLANDS 876.0 894.0 916.0 909.4 915.6 … …
CAYMAN ISLANDS 3,256.7 3,188.3 3,268.3 3,345.0 3,436.1 3,605.8 …
TURKS AND CAICOS ISLANDS 703.2 686.8 728.8 715.7 736.4 796.8 862.7
Table 1.2a CARICOM: Gross Domestic Product in Current Market Prices
Table 1.2b CARICOM: Gross Domestic Product in Current Market Prices
2

Millions of EC dollars
COUNTRIES 2009 2010 2011 2012 2013 2014 2015
CARIBBEAN COMMUNITY … … … … … … …
THE BAHAMAS 20,736.3 20,795.6 20,644.7 21,955.0 22,120.8 22,092.9 22,568.3
CSME … … … … … … …
MDCs … … … … … … …
BARBADOS … … … … … … …
GUYANA 5,464.3 6,167.7 6,965.0 7,709.2 8,045.8 8,234.8 …
JAMAICA 30,676.3 34,395.8 37,589.4 39,265.5 37,362.7 36,441.5 37,316.4
SURINAME 10,478.6 11,509.0 11,210.4 12,918.8 13,534.0 13,959.7 13,239.6
TRINIDAD AND TOBAGO … … … … … … …
LDCs 17,348.0 17,642.4 18,255.4 18,522.7 19,196.0 20,230.8 …
BELIZE 4,136.1 4,329.2 4,616.7 4,661.9 4,868.9 5,113.1 …
OECS 13,211.9 13,313.2 13,638.7 13,860.9 14,327.1 15,117.7 15,750.6
ANTIGUA AND BARBUDA 3,150.6 3,014.4 2,976.5 3,145.4 3,145.4 3,343.2 3,575.9
DOMINICA 1,283.6 1,307.8 1,324.2 1,286.2 1,320.1 1,379.8 1,349.4
GRENADA 1,912.2 1,974.1 2,016.6 2,067.1 2,195.0 2,371.8 2,565.8
MONTSERRAT 150.6 139.6 162.4 160.9 155.1 157.5 157.2
ST. KITTS AND NEVIS 1,861.1 1,824.9 1,964.8 1,924.5 2,066.9 2,219.7 2,298.4
SAINT LUCIA 3,066.6 3,246.3 3,403.8 3,416.1 3,497.0 3,681.4 3,804.8
ST. VINCENT AND THE GRENADINES 1,787.0 1,806.2 1,790.5 1,860.7 1,947.6 1,964.3 1,999.2
ASSOCIATE MEMBERS … … … … … … …
ANGUILLA 745.3 730.7 788.6 750.4 749.9 841.8 864.3
BERMUDA 15,462.5 15,821.9 15,203.0 15,468.1 15,654.8 15,527.1 …
BRITISH VIRGIN ISLANDS 2,162.7 2,205.9 2,254.5 2,232.4 … … …
CAYMAN ISLANDS … … … … … … …
TURKS AND CAICOS ISLANDS … … … … … … …
Millions of US dollars
COUNTRIES 2009 2010 2011 2012 2013 2014 2015
CARIBBEAN COMMUNITY … … … … … … …
THE BAHAMAS 7,680.1 7,702.1 7,646.2 8,131.5 8,192.9 8,182.5 8,358.6
CSME … … … … … … …
MDCs … … … … … … …
BARBADOS … … … … … … …
GUYANA 2,023.8 2,284.3 2,579.6 2,855.3 2,979.9 3,049.9 …
JAMAICA 11,361.6 12,739.2 13,922.0 14,542.8 13,838.0 13,496.9 13,820.9
SURINAME 3,880.9 4,262.6 4,152.0 4,784.7 5,012.6 5,170.3 4,903.6
TRINIDAD AND TOBAGO … … … … … … …
LDCs 6,425.2 6,534.2 6,761.3 6,860.3 7,109.6 7,492.9 …
BELIZE 1,531.9 1,603.4 1,709.9 1,726.6 1,803.3 1,893.7 …
OECS 4,893.3 4,930.8 5,051.4 5,133.7 5,306.3 5,599.2 5,833.6
ANTIGUA AND BARBUDA 1,166.9 1,116.5 1,102.4 1,165.0 1,165.0 1,238.2 1,324.4
DOMINICA 475.4 484.4 490.4 476.4 488.9 511.0 499.8
GRENADA 708.2 731.1 746.9 765.6 813.0 878.5 950.3
MONTSERRAT 55.8 51.7 60.2 59.6 57.5 58.3 58.2
ST. KITTS AND NEVIS 689.3 675.9 727.7 712.8 765.5 822.1 851.2
SAINT LUCIA 1,135.8 1,202.3 1,260.7 1,265.2 1,295.2 1,363.5 1,409.2
ST. VINCENT AND THE GRENADINES 661.9 668.9 663.2 689.1 721.3 727.5 740.4
ASSOCIATE MEMBERS … … … … … … …
ANGUILLA 276.0 270.6 292.1 277.9 277.7 311.8 320.1
BERMUDA 5,726.8 5,860.0 5,630.7 5,728.9 5,798.1 5,750.8 …
BRITISH VIRGIN ISLANDS 801.0 817.0 835.0 826.8 … … …
CAYMAN ISLANDS … … … … … … …
TURKS AND CAICOS ISLANDS … … … … … … …
Table 1.3a CARICOM: Gross National Income in Current Market Prices
Table 1.3b CARICOM: Gross National Income in Current Market Prices
3

Millions of EC dollars
COUNTRIES 2009 2010 2011 2012 2013 2014 2015 Pl
CARIBBEAN COMMUNITY 5,561.5 5,795.1 6,262.7 6,707.2 6,855.3 6,974.6 …
THE BAHAMAS 402.0 459.0 457.9 475.8 399.6 408.7 386.9
CSME 5,159.5 5,336.0 5,804.8 6,231.4 6,455.6 6,565.8 …
MDCs 4,195.6 4,379.7 4,798.7 5,119.5 5,259.6 5,304.5 …
BARBADOS 169.8 163.4 155.6 168.8 183.5 169.8 …
GUYANA 986.3 976.9 1,140.8 1,264.9 1,343.3 1,344.7 1,382.2
JAMAICA 1,776.6 1,882.8 2,202.5 2,301.5 2,290.9 2,235.8 2,400.2
SURINAME 1,029.2 1,117.1 1,041.2 1,127.9 1,178.4 1,299.6 1,378.9
TRINIDAD AND TOBAGO 233.7 239.5 258.6 256.4 263.5 254.6 255.0
LDCs 963.9 956.4 1,006.1 1,111.9 1,196.1 1,261.3 …
BELIZE 404.7 433.7 459.5 555.0 580.4 619.5 …
OECS 559.2 522.7 546.6 556.8 615.6 641.8 692.7
ANTIGUA AND BARBUDA 49.5 50.7 59.4 61.5 64.4 54.3 61.7
DOMINICA 165.7 152.9 169.1 157.7 187.8 189.7 181.4
GRENADA 96.3 94.0 93.5 104.4 110.0 150.2 202.3
MONTSERRAT 1.7 1.5 1.7 2.1 2.0 2.2 2.0
ST. KITTS AND NEVIS 23.5 26.7 30.1 28.2 27.8 26.2 24.5
SAINT LUCIA 114.6 85.3 76.6 87.6 97.5 89.4 93.9
ST. VINCENT AND THE GRENADINES 107.9 111.8 116.1 115.3 126.2 129.8 126.9
ASSOCIATE MEMBERS 197.0 193.5 201.9 193.4 195.2 … …
ANGUILLA 14.3 13.2 16.7 17.1 15.6 16.7 17.7
BERMUDA 116.1 116.0 118.2 110.8 112.2 99.2 …
BRITISH VIRGIN ISLANDS 24.3 24.3 24.3 25.6 25.6 … …
CAYMAN ISLANDS 29.1 28.7 30.0 31.0 31.5 34.7 …
TURKS AND CAICOS ISLANDS 13.3 11.3 12.7 8.9 10.3 11.1 12.9
Millions of US dollars
COUNTRIES 2009 2010 2011 2012 2013 2014 2015 Pl
CARIBBEAN COMMUNITY 2,059.8 2,146.3 2,319.5 2,484.1 2,539.0 2,583.2 …
THE BAHAMAS 148.9 170.0 169.6 176.2 148.0 151.4 143.3
CSME 1,910.9 1,976.3 2,149.9 2,307.9 2,391.0 2,431.8 …
MDCs 1,553.9 1,622.1 1,777.3 1,896.1 1,948.0 1,964.6 …
BARBADOS 62.9 60.5 57.6 62.5 68.0 62.9 …
GUYANA 365.3 361.8 422.5 468.5 497.5 498.0 511.9
JAMAICA 658.0 697.3 815.7 852.4 848.5 828.1 889.0
SURINAME 381.2 413.7 385.6 417.7 436.5 481.3 510.7
TRINIDAD AND TOBAGO 86.5 88.7 95.8 95.0 97.6 94.3 94.4
LDCs 357.0 354.2 372.6 411.8 443.0 467.1 …
BELIZE 149.9 160.6 170.2 205.6 215.0 229.5 …
OECS 207.1 193.6 202.4 206.2 228.0 237.7 256.6
ANTIGUA AND BARBUDA 18.3 18.8 22.0 22.8 23.8 20.1 22.9
DOMINICA 61.4 56.6 62.6 58.4 69.6 70.3 67.2
GRENADA 35.7 34.8 34.6 38.7 40.7 55.6 74.9
MONTSERRAT 0.6 0.5 0.6 0.8 0.7 0.8 0.7
ST. KITTS AND NEVIS 8.7 9.9 11.2 10.5 10.3 9.7 9.1
SAINT LUCIA 42.5 31.6 28.4 32.4 36.1 33.1 34.8
ST. VINCENT AND THE GRENADINES 39.9 41.4 43.0 42.7 46.7 48.1 47.0
ASSOCIATE MEMBERS 73.0 71.7 74.8 71.6 72.3 … …
ANGUILLA 5.3 4.9 6.2 6.3 5.8 6.2 6.5
BERMUDA 43.0 43.0 43.8 41.0 41.5 36.7 …
BRITISH VIRGIN ISLANDS 9.0 9.0 9.0 9.5 9.5 … …
CAYMAN ISLANDS 10.8 10.6 11.1 11.5 11.7 12.8 …
TURKS AND CAICOS ISLANDS 4.9 4.2 4.7 3.3 3.8 4.1 4.8
Table 1.4a CARICOM: Gross Domestic Product in Current Market Prices: Agriculture
Table 1.4b CARICOM: Gross Domestic Product in Current Market Prices: Agriculture
4

Millions of EC dollars
COUNTRIES 2009 2010 2011 2012 2013 2014 2015 Pl
CARIBBEAN COMMUNITY 19,077.5 16,625.0 20,111.6 20,586.2 20,703.6 20,120.7 …
THE BAHAMAS 203.2 225.1 153.2 182.4 238.7 329.0 283.0
CSME 18,874.3 16,399.9 19,958.4 20,403.8 20,464.8 19,791.8 …
MDCs 18,786.2 16,320.4 19,882.3 20,330.3 20,379.1 19,706.1 …
BARBADOS 23.8 28.2 30.0 28.1 26.6 25.1 …
GUYANA 680.1 853.8 1,169.1 1,443.2 1,282.1 1,102.3 1,681.1
JAMAICA 272.3 394.3 486.8 449.5 416.0 436.2 706.1
SURINAME 746.5 850.8 800.2 941.9 781.7 634.5 403.6
TRINIDAD AND TOBAGO 17,063.6 14,193.3 17,396.1 17,467.7 17,872.8 17,508.1 13,602.2
LDCs 88.0 79.5 76.2 73.5 85.7 85.6 …
BELIZE 16.6 17.4 18.5 20.4 20.2 18.9 …
OECS 71.4 62.0 57.6 53.1 65.5 66.7 64.8
ANTIGUA AND BARBUDA 31.2 25.3 20.4 21.6 30.3 31.7 28.2
DOMINICA 15.3 16.5 19.0 14.8 16.2 15.3 14.2
GRENADA 8.9 6.6 5.0 4.3 5.2 5.6 7.8
MONTSERRAT 0.6 0.3 1.2 0.8 1.1 1.8 2.6
ST. KITTS AND NEVIS 3.1 2.2 2.0 2.0 3.4 3.6 3.4
SAINT LUCIA 7.1 7.0 7.0 7.2 6.9 6.3 6.0
ST. VINCENT AND THE GRENADINES 5.2 4.1 3.1 2.5 2.4 2.4 2.5
ASSOCIATE MEMBERS … … … … … … …
ANGUILLA 7.1 3.1 2.9 2.7 2.4 3.7 3.7
BERMUDA … … … … … … …
BRITISH VIRGIN ISLANDS 0.0 0.0 0.0 0.0 1.0 … …
CAYMAN ISLANDS 72.7 66.0 60.6 65.0 65.9 58.3 …
TURKS AND CAICOS ISLANDS 14.2 8.6 6.1 5.7 6.3 6.8 6.3
Millions of US dollars
COUNTRIES 2009 2010 2011 2012 2013 2014 2015 Pl
CARIBBEAN COMMUNITY 7,065.7 6,157.4 7,448.7 7,624.5 7,668.0 7,452.1 …
THE BAHAMAS 75.3 83.4 56.7 67.6 88.4 121.8 104.8
CSME 6,990.5 6,074.0 7,392.0 7,556.9 7,579.6 7,330.3 …
MDCs 6,957.9 6,044.6 7,363.8 7,529.7 7,547.8 7,298.6 …
BARBADOS 8.8 10.5 11.1 10.4 9.9 9.3 …
GUYANA 251.9 316.2 433.0 534.5 474.8 408.2 622.6
JAMAICA 100.9 146.0 180.3 166.5 154.1 161.5 261.5
SURINAME 276.5 315.1 296.4 348.8 289.5 235.0 149.5
TRINIDAD AND TOBAGO 6,319.9 5,256.8 6,443.0 6,469.5 6,619.5 6,484.5 5,037.9
LDCs 32.6 29.4 28.2 27.2 31.7 31.7 …
BELIZE 6.2 6.5 6.9 7.5 7.5 7.0 …
OECS 26.4 23.0 21.3 19.7 24.3 24.7 24.0
ANTIGUA AND BARBUDA 11.6 9.4 7.6 8.0 11.2 11.7 10.5
DOMINICA 5.7 6.1 7.1 5.5 6.0 5.7 5.2
GRENADA 3.3 2.4 1.8 1.6 1.9 2.1 2.9
MONTSERRAT 0.2 0.1 0.4 0.3 0.4 0.7 1.0
ST. KITTS AND NEVIS 1.1 0.8 0.8 0.7 1.3 1.3 1.3
SAINT LUCIA 2.6 2.6 2.6 2.7 2.6 2.3 2.2
ST. VINCENT AND THE GRENADINES 1.9 1.5 1.1 0.9 0.9 0.9 0.9
ASSOCIATE MEMBERS … … … … … … …
ANGUILLA 2.6 1.1 1.1 1.0 0.9 1.4 1.4
BERMUDA … … … … … … …
BRITISH VIRGIN ISLANDS 0.0 0.0 0.0 0.0 0.4 … …
CAYMAN ISLANDS 26.9 24.5 22.4 24.1 24.4 21.6 …
TURKS AND CAICOS ISLANDS 5.2 3.2 2.2 2.1 2.3 2.5 2.3
Table 1.5a CARICOM: Gross Domestic Product in Current Market Prices: Mining and Quarrying
Table 1.5b CARICOM: Gross Domestic Product in Current Market Prices: Mining and Quarrying
5

Millions of EC dollars
COUNTRIES 2009 2010 2011 2012 2013 2014 2015 Pl
CARIBBEAN COMMUNITY 16,472.4 19,870.2 23,191.1 22,337.2 20,051.7 19,898.2 …
THE BAHAMAS 778.4 800.2 822.3 1,176.4 965.4 994.4 725.1
CSME 15,694.0 19,070.0 22,368.8 21,160.7 19,086.3 18,903.8 …
MDCs 14,770.7 18,070.8 21,284.7 20,114.3 18,094.2 17,938.4 …
BARBADOS 726.0 700.2 647.1 551.1 495.5 421.5 …
GUYANA 369.5 363.7 395.3 429.1 478.4 452.7 479.9
JAMAICA 2,665.6 2,766.0 3,067.8 3,210.2 3,098.7 3,013.7 3,159.4
SURINAME 2,120.5 2,475.2 2,483.0 2,863.0 2,610.3 2,314.0 1,293.7
TRINIDAD AND TOBAGO 8,889.1 11,765.7 14,691.6 13,060.9 11,411.3 11,736.4 10,711.4
LDCs 923.3 999.2 1,084.1 1,046.4 992.1 965.4 …
BELIZE 412.7 460.6 541.1 511.8 434.1 396.7 …
OECS 510.5 538.6 543.0 534.6 558.0 568.7 575.6
ANTIGUA AND BARBUDA 68.4 66.9 69.0 67.3 87.4 93.0 92.9
DOMINICA 30.6 31.5 35.9 40.4 41.6 42.7 38.9
GRENADA 69.0 71.9 71.0 70.1 76.9 84.2 96.9
MONTSERRAT 2.5 2.3 2.3 2.8 2.8 2.8 2.4
ST. KITTS AND NEVIS 150.6 173.8 174.7 166.3 168.7 159.9 155.6
SAINT LUCIA 108.1 103.5 110.9 107.5 94.4 89.2 91.7
ST. VINCENT AND THE GRENADINES 81.3 88.7 79.1 80.2 86.2 97.0 97.1
ASSOCIATE MEMBERS 421.7 391.3 358.4 322.3 317.9 … …
ANGUILLA 24.0 17.7 14.1 14.9 14.5 16.5 17.6
BERMUDA 207.7 202.0 176.1 140.7 132.5 119.8 …
BRITISH VIRGIN ISLANDS 72.9 72.9 72.9 73.5 73.5 … …
CAYMAN ISLANDS 80.9 75.5 75.7 79.4 82.5 86.9 …
TURKS AND CAICOS ISLANDS 36.3 23.2 19.7 13.8 14.8 15.7 16.5
Millions of US dollars
COUNTRIES 2009 2010 2011 2012 2013 2014 2015 Pl
CARIBBEAN COMMUNITY 6,100.9 7,359.3 8,589.3 8,273.0 7,426.5 7,369.7 …
THE BAHAMAS 288.3 296.4 304.5 435.7 357.6 368.3 268.6
CSME 5,812.6 7,063.0 8,284.7 7,837.3 7,069.0 7,001.4 …
MDCs 5,470.6 6,692.9 7,883.2 7,449.7 6,701.6 6,643.8 …
BARBADOS 268.9 259.4 239.7 204.1 183.5 156.1 …
GUYANA 136.9 134.7 146.4 158.9 177.2 167.7 177.7
JAMAICA 987.2 1,024.4 1,136.2 1,188.9 1,147.7 1,116.2 1,170.2
SURINAME 785.4 916.8 919.6 1,060.4 966.8 857.0 479.1
TRINIDAD AND TOBAGO 3,292.3 4,357.7 5,441.3 4,837.4 4,226.4 4,346.8 3,967.2
LDCs 341.9 370.1 401.5 387.6 367.4 357.6 …
BELIZE 152.9 170.6 200.4 189.6 160.8 146.9 …
OECS 189.1 199.5 201.1 198.0 206.6 210.6 213.2
ANTIGUA AND BARBUDA 25.3 24.8 25.6 24.9 32.4 34.4 34.4
DOMINICA 11.3 11.7 13.3 15.0 15.4 15.8 14.4
GRENADA 25.6 26.6 26.3 26.0 28.5 31.2 35.9
MONTSERRAT 0.9 0.9 0.9 1.0 1.0 1.0 0.9
ST. KITTS AND NEVIS 55.8 64.4 64.7 61.6 62.5 59.2 57.6
SAINT LUCIA 40.0 38.3 41.1 39.8 35.0 33.0 34.0
ST. VINCENT AND THE GRENADINES 30.1 32.9 29.3 29.7 31.9 35.9 36.0
ASSOCIATE MEMBERS 156.2 144.9 132.8 119.4 117.7 … …
ANGUILLA 8.9 6.5 5.2 5.5 5.4 6.1 6.5
BERMUDA 76.9 74.8 65.2 52.1 49.1 44.4 …
BRITISH VIRGIN ISLANDS 27.0 27.0 27.0 27.2 27.2 … …
CAYMAN ISLANDS 30.0 28.0 28.1 29.4 30.6 32.2 …
TURKS AND CAICOS ISLANDS 13.4 8.6 7.3 5.1 5.5 5.8 6.1
Table 1.6a CARICOM: Gross Domestic Product in Current Market Prices: Manufacturing
Table 1.6b CARICOM: Gross Domestic Product in Current Market Prices: Manufacturing
6
Millions of EC dollars
COUNTRIES 2009 2010 2011 2012 2013 2014 2015 Pl
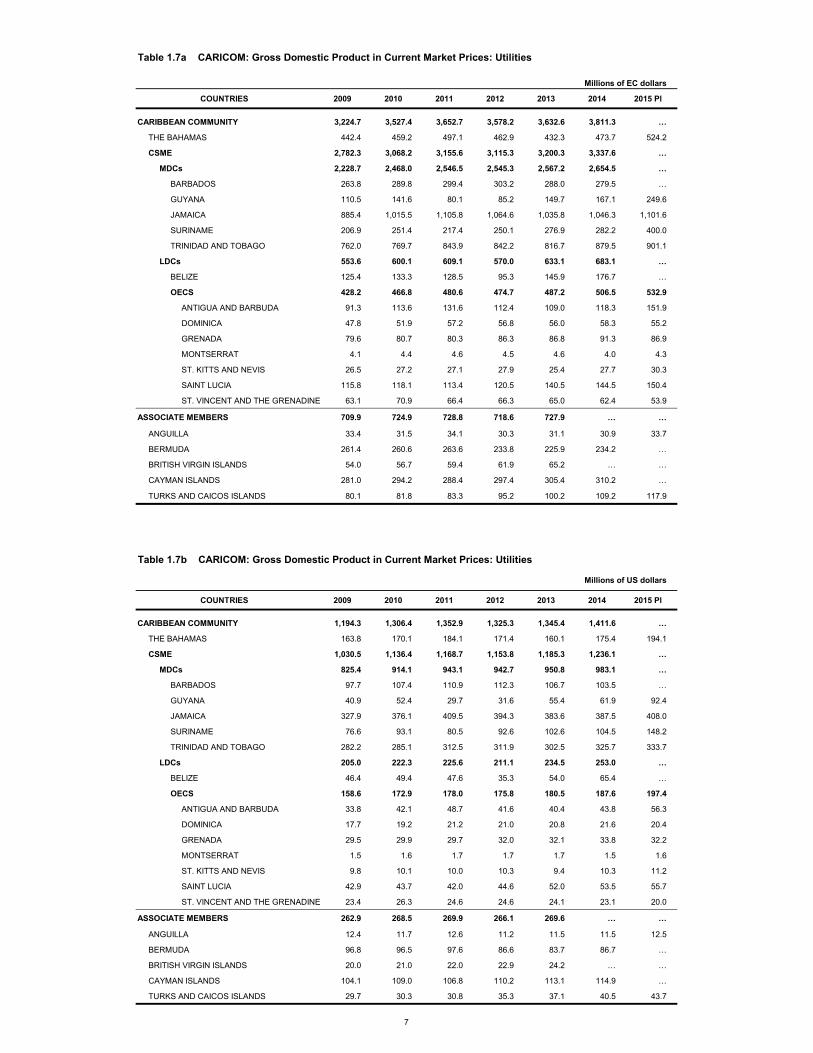
CARIBBEAN COMMUNITY 3,224.7 3,527.4 3,652.7 3,578.2 3,632.6 3,811.3 …
THE BAHAMAS 442.4 459.2 497.1 462.9 432.3 473.7 524.2
CSME 2,782.3 3,068.2 3,155.6 3,115.3 3,200.3 3,337.6 …
MDCs 2,228.7 2,468.0 2,546.5 2,545.3 2,567.2 2,654.5 …
BARBADOS 263.8 289.8 299.4 303.2 288.0 279.5 …
GUYANA 110.5 141.6 80.1 85.2 149.7 167.1 249.6
JAMAICA 885.4 1,015.5 1,105.8 1,064.6 1,035.8 1,046.3 1,101.6
SURINAME 206.9 251.4 217.4 250.1 276.9 282.2 400.0
TRINIDAD AND TOBAGO 762.0 769.7 843.9 842.2 816.7 879.5 901.1
LDCs 553.6 600.1 609.1 570.0 633.1 683.1 …
BELIZE 125.4 133.3 128.5 95.3 145.9 176.7 …
OECS 428.2 466.8 480.6 474.7 487.2 506.5 532.9
ANTIGUA AND BARBUDA 91.3 113.6 131.6 112.4 109.0 118.3 151.9
DOMINICA 47.8 51.9 57.2 56.8 56.0 58.3 55.2
GRENADA 79.6 80.7 80.3 86.3 86.8 91.3 86.9
MONTSERRAT 4.1 4.4 4.6 4.5 4.6 4.0 4.3
ST. KITTS AND NEVIS 26.5 27.2 27.1 27.9 25.4 27.7 30.3
SAINT LUCIA 115.8 118.1 113.4 120.5 140.5 144.5 150.4
ST. VINCENT AND THE GRENADINES 63.1 70.9 66.4 66.3 65.0 62.4 53.9
ASSOCIATE MEMBERS 709.9 724.9 728.8 718.6 727.9 … …
ANGUILLA 33.4 31.5 34.1 30.3 31.1 30.9 33.7
BERMUDA 261.4 260.6 263.6 233.8 225.9 234.2 …
BRITISH VIRGIN ISLANDS 54.0 56.7 59.4 61.9 65.2 … …
CAYMAN ISLANDS 281.0 294.2 288.4 297.4 305.4 310.2 …
TURKS AND CAICOS ISLANDS 80.1 81.8 83.3 95.2 100.2 109.2 117.9
Millions of US dollars
COUNTRIES 2009 2010 2011 2012 2013 2014 2015 Pl
CARIBBEAN COMMUNITY 1,194.3 1,306.4 1,352.9 1,325.3 1,345.4 1,411.6 …
THE BAHAMAS 163.8 170.1 184.1 171.4 160.1 175.4 194.1
CSME 1,030.5 1,136.4 1,168.7 1,153.8 1,185.3 1,236.1 …
MDCs 825.4 914.1 943.1 942.7 950.8 983.1 …
BARBADOS 97.7 107.4 110.9 112.3 106.7 103.5 …
GUYANA 40.9 52.4 29.7 31.6 55.4 61.9 92.4
JAMAICA 327.9 376.1 409.5 394.3 383.6 387.5 408.0
SURINAME 76.6 93.1 80.5 92.6 102.6 104.5 148.2
TRINIDAD AND TOBAGO 282.2 285.1 312.5 311.9 302.5 325.7 333.7
LDCs 205.0 222.3 225.6 211.1 234.5 253.0 …
BELIZE 46.4 49.4 47.6 35.3 54.0 65.4 …
OECS 158.6 172.9 178.0 175.8 180.5 187.6 197.4
ANTIGUA AND BARBUDA 33.8 42.1 48.7 41.6 40.4 43.8 56.3
DOMINICA 17.7 19.2 21.2 21.0 20.8 21.6 20.4
GRENADA 29.5 29.9 29.7 32.0 32.1 33.8 32.2
MONTSERRAT 1.5 1.6 1.7 1.7 1.7 1.5 1.6
ST. KITTS AND NEVIS 9.8 10.1 10.0 10.3 9.4 10.3 11.2
SAINT LUCIA 42.9 43.7 42.0 44.6 52.0 53.5 55.7
ST. VINCENT AND THE GRENADINES 23.4 26.3 24.6 24.6 24.1 23.1 20.0
ASSOCIATE MEMBERS 262.9 268.5 269.9 266.1 269.6 … …
ANGUILLA 12.4 11.7 12.6 11.2 11.5 11.5 12.5
BERMUDA 96.8 96.5 97.6 86.6 83.7 86.7 …
BRITISH VIRGIN ISLANDS 20.0 21.0 22.0 22.9 24.2 … …
CAYMAN ISLANDS 104.1 109.0 106.8 110.2 113.1 114.9 …
TURKS AND CAICOS ISLANDS 29.7 30.3 30.8 35.3 37.1 40.5 43.7
Table 1.7a CARICOM: Gross Domestic Product in Current Market Prices: Utilities
Table 1.7b CARICOM: Gross Domestic Product in Current Market Prices: Utilities
7
Millions of EC dollars
COUNTRIES 2009 2010 2011 2012 2013 2014 2015 Pl
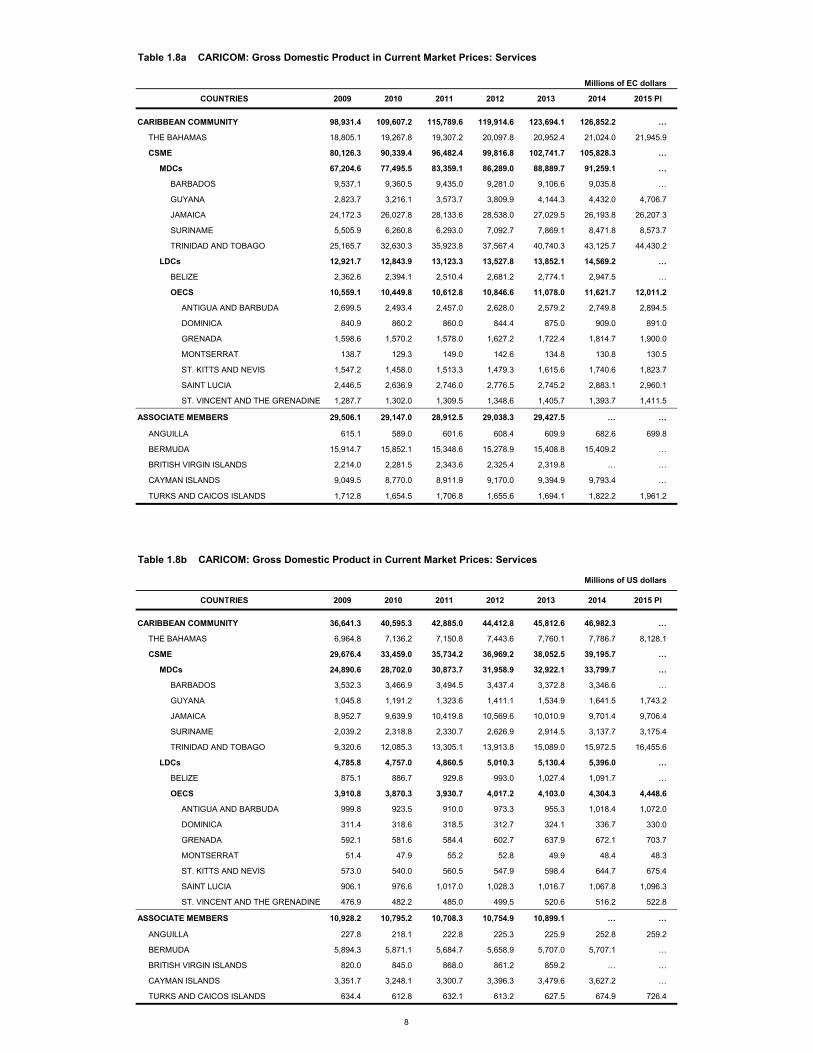
CARIBBEAN COMMUNITY 98,931.4 109,607.2 115,789.6 119,914.6 123,694.1 126,852.2 …
THE BAHAMAS 18,805.1 19,267.8 19,307.2 20,097.8 20,952.4 21,024.0 21,945.9
CSME 80,126.3 90,339.4 96,482.4 99,816.8 102,741.7 105,828.3 …
MDCs 67,204.6 77,495.5 83,359.1 86,289.0 88,889.7 91,259.1 …
BARBADOS 9,537.1 9,360.5 9,435.0 9,281.0 9,106.6 9,035.8 …
GUYANA 2,823.7 3,216.1 3,573.7 3,809.9 4,144.3 4,432.0 4,706.7
JAMAICA 24,172.3 26,027.8 28,133.6 28,538.0 27,029.5 26,193.8 26,207.3
SURINAME 5,505.9 6,260.8 6,293.0 7,092.7 7,869.1 8,471.8 8,573.7
TRINIDAD AND TOBAGO 25,165.7 32,630.3 35,923.8 37,567.4 40,740.3 43,125.7 44,430.2
LDCs 12,921.7 12,843.9 13,123.3 13,527.8 13,852.1 14,569.2 …
BELIZE 2,362.6 2,394.1 2,510.4 2,681.2 2,774.1 2,947.5 …
OECS 10,559.1 10,449.8 10,612.8 10,846.6 11,078.0 11,621.7 12,011.2
ANTIGUA AND BARBUDA 2,699.5 2,493.4 2,457.0 2,628.0 2,579.2 2,749.8 2,894.5
DOMINICA 840.9 860.2 860.0 844.4 875.0 909.0 891.0
GRENADA 1,598.6 1,570.2 1,578.0 1,627.2 1,722.4 1,814.7 1,900.0
MONTSERRAT 138.7 129.3 149.0 142.6 134.8 130.8 130.5
ST. KITTS AND NEVIS 1,547.2 1,458.0 1,513.3 1,479.3 1,615.6 1,740.6 1,823.7
SAINT LUCIA 2,446.5 2,636.9 2,746.0 2,776.5 2,745.2 2,883.1 2,960.1
ST. VINCENT AND THE GRENADINES 1,287.7 1,302.0 1,309.5 1,348.6 1,405.7 1,393.7 1,411.5
ASSOCIATE MEMBERS 29,506.1 29,147.0 28,912.5 29,038.3 29,427.5 … …
ANGUILLA 615.1 589.0 601.6 608.4 609.9 682.6 699.8
BERMUDA 15,914.7 15,852.1 15,348.6 15,278.9 15,408.8 15,409.2 …
BRITISH VIRGIN ISLANDS 2,214.0 2,281.5 2,343.6 2,325.4 2,319.8 … …
CAYMAN ISLANDS 9,049.5 8,770.0 8,911.9 9,170.0 9,394.9 9,793.4 …
TURKS AND CAICOS ISLANDS 1,712.8 1,654.5 1,706.8 1,655.6 1,694.1 1,822.2 1,961.2
Millions of US dollars
COUNTRIES 2009 2010 2011 2012 2013 2014 2015 Pl
CARIBBEAN COMMUNITY 36,641.3 40,595.3 42,885.0 44,412.8 45,812.6 46,982.3 …
THE BAHAMAS 6,964.8 7,136.2 7,150.8 7,443.6 7,760.1 7,786.7 8,128.1
CSME 29,676.4 33,459.0 35,734.2 36,969.2 38,052.5 39,195.7 …
MDCs 24,890.6 28,702.0 30,873.7 31,958.9 32,922.1 33,799.7 …
BARBADOS 3,532.3 3,466.9 3,494.5 3,437.4 3,372.8 3,346.6 …
GUYANA 1,045.8 1,191.2 1,323.6 1,411.1 1,534.9 1,641.5 1,743.2
JAMAICA 8,952.7 9,639.9 10,419.8 10,569.6 10,010.9 9,701.4 9,706.4
SURINAME 2,039.2 2,318.8 2,330.7 2,626.9 2,914.5 3,137.7 3,175.4
TRINIDAD AND TOBAGO 9,320.6 12,085.3 13,305.1 13,913.8 15,089.0 15,972.5 16,455.6
LDCs 4,785.8 4,757.0 4,860.5 5,010.3 5,130.4 5,396.0 …
BELIZE 875.1 886.7 929.8 993.0 1,027.4 1,091.7 …
OECS 3,910.8 3,870.3 3,930.7 4,017.2 4,103.0 4,304.3 4,448.6
ANTIGUA AND BARBUDA 999.8 923.5 910.0 973.3 955.3 1,018.4 1,072.0
DOMINICA 311.4 318.6 318.5 312.7 324.1 336.7 330.0
GRENADA 592.1 581.6 584.4 602.7 637.9 672.1 703.7
MONTSERRAT 51.4 47.9 55.2 52.8 49.9 48.4 48.3
ST. KITTS AND NEVIS 573.0 540.0 560.5 547.9 598.4 644.7 675.4
SAINT LUCIA 906.1 976.6 1,017.0 1,028.3 1,016.7 1,067.8 1,096.3
ST. VINCENT AND THE GRENADINES 476.9 482.2 485.0 499.5 520.6 516.2 522.8
ASSOCIATE MEMBERS 10,928.2 10,795.2 10,708.3 10,754.9 10,899.1 … …
ANGUILLA 227.8 218.1 222.8 225.3 225.9 252.8 259.2
BERMUDA 5,894.3 5,871.1 5,684.7 5,658.9 5,707.0 5,707.1 …
BRITISH VIRGIN ISLANDS 820.0 845.0 868.0 861.2 859.2 … …
CAYMAN ISLANDS 3,351.7 3,248.1 3,300.7 3,396.3 3,479.6 3,627.2 …
TURKS AND CAICOS ISLANDS 634.4 612.8 632.1 613.2 627.5 674.9 726.4
Table 1.8a CARICOM: Gross Domestic Product in Current Market Prices: Services
Table 1.8b CARICOM: Gross Domestic Product in Current Market Prices: Services
8


Table 2.1 Antigua and Barbuda: Value added by industries at current prices
Millions of EC dollars
Industries 2009 2010 2011 2012 2013 2014 2015 Pl
A+B Agriculture, hunting, forestry; fishing 49.5
050.7
059.4
061.5
064.4
054.3
061.7
0
A Agriculture, hunting, forestry 23.10
26.40
29.90
28.70
29.40
30.10
30.30
Agriculture, hunting and related service activities 22.2
025.5
029.0
027.8
028.5
029.2
029.4
0
Forestry, logging and related service activities 0.9
00.9
00.9
00.9
00.9
00.9
00.9
0
B Fishing 26.4 0 24.2 0 29.5 0 32.8 0 35.0 0 24.2 0 31.4 0
C Mining and quarrying 31.2 0 25.3 0 20.4 0 21.6 0 30.3 0 31.7 0 28.2 0
D Manufacturing 68.4 0 66.9 0 69.0 0 67.3 0 87.4 0 93.0 0 92.9 0
E Electricity, gas and water supply 91.30
113.60
131.60
112.40
109.00
118.30
151.90
F Construction 453.3 0 296.5 0 225.4 0 260.4 0 273.5 0 303.3 0 316.9 0
G+H Wholesale, retail trade, repair of motor vehicles, motorcycles and personal and households goods; hotels and restaurants 741.0
0
725.1
0
722.7
0
778.0
0
767.5
0
811.4
0
834.4
0
G Wholesale, retail trade, repair of motor vehicles, motorcycles and personal and household goods 407.3
0
391.0
0
372.2
0
415.7
0
404.7
0
436.9
0
449.8
0
H Hotels and restaurants 333.7 0 334.1 0 350.5 0 362.3 0 362.8 0 374.5 0 384.6 0
I Transport, storage and communications 383.1
0336.0
0321.8
0334.9
0315.6
0316.1
0349.3
0
Land transport; transport via pipelines, water transport; air transport; Supporting and auxiliary transport activities; activities of travel agencies 239.2
0
221.3
0
215.5
0
230.6
0
207.2
0
222.5
0
245.3
0
Post and telecommunications 143.9 0 114.7 0 106.3 0 104.3 0 108.5 0 93.6 0 104.1 0
J+K Financial intermediation; real estate, renting and business activities 565.3
0
605.30
650.00
675.80
622.30
660.70
720.40
J Financial intermediation 272.1 0 279.5 0 292.7 0 290.3 0 222.7 0 223.7 0 228.9 0
K Real estate, renting and business activities 293.2
0325.8
0357.3
0385.5
0399.6
0437.0
0491.5
0
L Public administration and defence; compulsory social security 254.8
0
237.90
237.20
250.30
249.50
289.70
300.80
M+N+O Education; health and social work; other community, social and personal services 287.3
0
277.70
284.90
312.90
335.10
353.20
357.60
M Education 149.5 0 135.7 0 137.0 0 154.0 0 170.4 0 178.6 0 183.3 0
N Health and social work 76.8 0 77.8 0 80.6 0 88.4 0 88.1 0 95.0 0 99.8 0
O Other community, social and personal services 61.0
064.1
067.2
070.5
076.6
079.7
074.5
0
P Private households with employed persons 14.8
015.0
015.2
015.6
015.7
015.3
015.0
0
Plus: Statistical discrepancyVALUE ADDED, GROSS, at basic prices 1 2,864.9 2,661.6 2,645.4 2,805.7 2,805.2 2,992.9 3,174.4Less: Financial intermediation services indirectly measured (FISIM) 74.9
0
88.20
92.00
85.10
65.20
54.10
54.90
Plus: Taxes less Subsidies on products 422.9
0437.9
0437.6
0477.6
0423.7
0447.8
0485.9
0
Plus: Taxes on products 446.9 0 460.9 0 462.6 0 503.6 0 449.7 0 473.8 0 511.9 0
Less: Subsidies on products 24.0 0 23.0 0 25.0 0 26.0 0 26.0 0 26.0 0 26.0 0
Plus: Statistical discrepancy
GROSS DOMESTIC PRODUCT 3,287.8 0 3,099.4 0 3,083.0 0 3,283.3 0 3,228.9 0 3,440.7 0 3,660.2 0
1 Excludes Financial intermediation services indirectly measured (FISIM) but FISIM is included in the industry data.
9

Table 2.2 Antigua and Barbuda: Value added by industries at constant 2006 prices
Millions of EC dollars
Industries 2009 2010 2011 2012 2013 2014 2015 Pl
A+B Agriculture, hunting, forestry; fishing 41.0
041.6
047.3
048.4
051.1
042.9
048.5
0
A Agriculture, hunting, forestry 20.10
22.30
23.60
22.60
21.90
22.50
22.20
Agriculture, hunting and related service activities 19.2
021.4
022.7
021.7
021.0
021.6
021.3
0
Forestry, logging and related service activities 0.9
00.9
00.9
00.9
00.9
00.9
00.9
0
B Fishing 20.9 0 19.4 0 23.7 0 25.8 0 29.2 0 20.4 0 26.3 0
C Mining and quarrying 29.3 0 23.9 0 19.3 0 20.5 0 28.8 0 30.1 0 26.8 0
D Manufacturing 62.3 0 56.8 0 58.4 0 49.5 0 58.2 0 60.5 0 59.8 0
E Electricity, gas and water supply 97.30
98.40
106.30
104.80
102.70
100.80
107.80
F Construction 394.0 0 256.5 0 194.0 0 213.5 0 219.5 0 235.1 0 244.4 0
G+H Wholesale, retail trade, repair of motor vehicles, motorcycles and personal and households goods; hotels and restaurants 728.2
0
696.6
0
683.4
0
712.3
0
704.2
0
738.1
0
756.0
0
G Wholesale, retail trade, repair of motor vehicles, motorcycles and personal and household goods 383.8
0
356.1
0
328.0
0
349.0
0
341.0
0
364.1
0
372.2
0
H Hotels and restaurants 344.4 0 340.5 0 355.4 0 363.3 0 363.2 0 374.0 0 383.9 0
I Transport, storage and communications 296.2
0274.3
0274.8
0272.1
0267.1
0265.9
0273.0
0
Land transport; transport via pipelines, water transport; air transport; Supporting and auxiliary transport activities; activities of travel agencies 176.1
0
164.0
0
158.9
0
167.5
0
158.9
0
165.1
0
162.7
0
Post and telecommunications 120.1 0 110.3 0 115.9 0 104.6 0 108.2 0 100.8 0 110.3 0
J+K Financial intermediation; real estate, renting and business activities 532.1
0
535.30
552.70
563.90
560.50
583.80
623.80
J Financial intermediation 259.2 0 245.6 0 247.3 0 244.1 0 229.0 0 230.7 0 231.1 0
K Real estate, renting and business activities 272.9
0289.7
0305.4
0319.8
0331.5
0353.2
0392.7
0
L Public administration and defence; compulsory social security 214.6
0
200.40
199.80
206.70
210.20
242.80
253.40
M+N+O Education; health and social work; other community, social and personal services 258.7
0
250.40
255.60
276.30
297.50
312.30
314.80
M Education 133.6 0 119.9 0 120.6 0 133.5 0 148.9 0 155.7 0 159.8 0
N Health and social work 70.8 0 71.6 0 73.6 0 78.0 0 78.8 0 85.0 0 88.6 0
O Other community, social and personal services 54.3
059.0
061.4
064.8
069.8
071.6
066.4
0
P Private households with employed persons 13.9
013.7
013.4
013.3
013.2
012.8
012.4
0
Plus: Statistical discrepancyVALUE ADDED, GROSS, at basic prices 1 2,600.1
02,381.9
02,338.1
02,417.9
02,453.2
02,569.4
02,667.4
0
Less: Financial intermediation services indirectly measured (FISIM) 67.5
0
65.90
66.80
63.40
59.70
55.70
53.40
Plus: Taxes less Subsidies on products 383.8
0391.9
0386.8
0411.6
0370.6
0384.4
0408.3
0
Plus: Taxes on products Less: Subsidies on products
Plus: Statistical discrepancy
GROSS DOMESTIC PRODUCT 2,983.9 0 2,773.8 0 2,724.9 0 2,829.5 0 2,823.8 0 2,953.8 0 3,075.7 0
1 Excludes Financial intermediation services indirectly measured (FISIM) but FISIM is included in the industry data.
10

Table 2.3 Antigua and Barbuda: Gross domestic product by expenditures at current prices
Millions of EC dollars
Item Description 2009 2010 2011 2012 2013 2014 2015 Pl
Final consumption expenditure 2,428.9 ## 2,646.2 ## 2,725.7 ## 2,995.3 ## 2,945.1 ## 3,005.3 ## 2,961.9 ##
Household final consumption expenditure 1,781.2
##2,092.2
##2,186.8
##2,425.6
##2,397.4
##2,441.2
##2,376.3
##
NPISHs final consumption expenditureGeneral government final consumption expenditure 647.7
##554.0
##538.9
##569.7
##547.8
##564.1
##585.7
##
Individual consumption expenditureCollective consumption expenditure
Gross capital formation 1,250.0 ## 872.1 ## 637.1 ## 716.6 ## 756.9 ## 844.6 ## 882.5 ##
Gross fixed capital formation 1,250.0 ## 872.1 ## 637.1 ## 716.6 ## 756.9 ## 844.6 ## 882.5 ##
Changes in inventoriesAcquisitions less disposals of valuables
Exports of goods and services 1,516.4 ## 1,414.4 ## 1,451.9 ## 1,466.9 ## 1,473.0 ## 1,595.4 ## 1,625.9 ##
Exports of goods 137.2 ## 123.4 ## 151.6 ## 159.4 ## 171.4 ## 186.2 ## 161.1 ##
Exports of services 1,379.2 ## 1,290.9 ## 1,300.3 ## 1,307.4 ## 1,301.6 ## 1,409.2 ## 1,464.8 ##
Less: Imports of goods and services 1,907.5
##1,833.1
##1,731.7
##1,895.4
##1,946.1
##2,004.6
##1,810.1
##
Imports of goods 1,293.1 ## 1,225.5 ## 1,162.2 ## 1,329.3 ## 1,358.3 ## 1,396.9 ## 1,200.1 ##
Imports of services 614.4 ## 607.6 ## 569.5 ## 566.0 ## 587.8 ## 607.7 ## 610.0 ##
Plus: Statistical discrepancyGROSS DOMESTIC PRODUCT 3,287.8 ## 3,099.4 ## 3,083.0 ## 3,283.3 ## 3,228.9 ## 3,440.7 ## 3,660.2 ##
11

Table 2.4 Antigua and Barbuda: Relations among product, income, savings, and net lending aggregates
Millions of EC dollars
Item Description 2009 2010 2011 2012 2013 2014 2015 Pl
GROSS DOMESTIC PRODUCT 3,287.8 3,099.4 3,083.0 3,283.3 3,228.9 3,440.7 3,660.2Compensation of employees - from and to the rest of the world, net 23.1 20.8 20.6 21.7 21.0 21.4 21.9
Plus: Compensation of employees - from the rest of the world 23.1 20.8 20.6 21.7 21.0 21.4 21.9Less: Compensation of employees - to the rest of the world 0.0 0.0 0.0 0.0 0.0 0.0 0.0
Property income - from and to the rest of the world, net -160.3 -105.8 -127.2 -159.6 -104.4 -118.9 -106.3
Plus: Property income - from the rest of the world 12.3 9.3 7.0 6.7 5.3 5.1 5.6Less: Property income - to the rest of the world 172.6 115.1 134.2 166.3 109.7 124.0 111.9
Plus: Compensation of employees and property income - from and to the rest of the world, net -137.2 -85.0 -106.6 -137.9 -83.5 -97.5 -84.4
Plus: Compensation of employees and property income - from the rest of the world 35.4 30.1 27.6 28.4 26.2 26.5 27.6
Less: Compensation of employees and property income - to the rest of the world 172.6 115.1 134.2 166.3 109.7 124.0 111.9
Plus: Taxes less subsidies on production and imports - from and to the rest of the world, net
Plus: Taxes less subsidies on production and imports - from the rest of the worldLess: Taxes less subsidies on production and imports - to the rest of the world
GROSS NATIONAL INCOME, at market prices 3,150.6 3,014.4 2,976.5 3,145.4 3,145.4 3,343.2 3,575.9Plus: Current transfers - from and to the rest of the world, net 72.0 52.6 69.3 81.9 70.7 76.8 77.3
Plus: Current transfers - from the rest of the world 109.2 104.1 114.7 128.4 127.2 129.9 132.9Less: Current transfers - to the rest of the world 37.3 51.5 45.4 46.5 56.5 53.1 55.6
GROSS NATIONAL DISPOSABLE INCOME 3,222.6 3,067.0 3,045.8 3,227.3 3,216.1 3,420.0 3,653.1Less: Final consumption expenditure / Actual final consumption 2,428.9 2,646.2 2,725.7 2,995.3 2,945.1 3,005.3 2,961.9Plus: Statistical discrepancySAVING, GROSS 793.7 420.9 320.0 232.0 270.9 414.6 691.2Plus: Capital transfers - from and to the rest of the world, net 10.2 54.9 32.9 15.9 36.5 84.6 109.6
Plus: Capital transfers - from the rest of the world 10.2 54.9 32.9 15.9 36.5 84.6 109.6Less: Capital transfers - to the rest of the world 0.0 0.0 0.0 0.0 0.0 0.0 0.0
Less: Gross capital formation 1,250.0 872.1 637.1 716.6 756.9 844.6 882.5
Less: Acquisitions less disposals of non-produced non-financial assets 0.0 0.0 0.0 0.0 0.0 0.0 0.0Plus: Statistical discrepancy
NET LENDING(+)/ NET BORROWING(-) OF THE NATION -446.1 -396.3 -284.2 -468.7 -449.4 -345.3 -81.7
Less: Consumption of fixed capital
NET NATIONAL INCOME, in market pricesNET NATIONAL DISPOSABLE INCOMESAVING, NET
12


Table 3.1 The Bahamas: Value added by industries at current prices (ISIC 4)
Millions of EC dollars
Item Description 2009 2010 2011 2012 2013 2014 Pv 2015 Pl
A Agriculture, forestry and fishing402.0
0459.0
0457.9
0475.8
0399.6
0408.7
0386.9
0
01 Crop and animal production, hunting and related service activities 207.7
0
169.90
174.10
174.40
179.10
176.70
160.90
02 Forestry and logging03 Fishing and aquaculture 194.2 0 289.1 0 283.8 0 301.4 0 220.5 0 232.0 0 226.0 0
B+C+D+E Manufacturing, mining and quarrying and other industrial activities 1,423.9
0
1,484.50
1,472.60
1,821.70
1,636.50
1,797.10
1,532.40
B Mining and quarrying 203.2 0 225.1 0 153.2 0 182.4 0 238.7 0 329.0 0 283.0 0
C Manufacturing 778.4 0 800.2 0 822.3 0 1,176.4 0 965.4 0 994.4 0 725.1 0
D Electricity, gas, steam and air conditioning supply 314.6
0322.0
0330.0
0324.3
0320.9
0345.8
0358.1
0
E Water supply; sewerage, waste management and remediation activities 127.8
0
137.30
167.10
138.60
111.40
127.90
166.10
F Construction 1,369.0 0 1,748.0 0 1,882.3 0 2,144.2 0 2,451.5 0 2,496.3 0 1,501.4 0
G+H+I Wholesale and retail trade, transportation and storage, accommodation and food service activities 5,803.2
0
5,711.8
0
5,471.4
0
5,657.5
0
5,832.1
0
5,629.4
0
6,326.1
0
G Wholesale and retail trade; repair of motor vehicles and motorcycles 2,570.6
0
2,380.60
2,216.90
2,261.40
2,397.20
2,455.40
2,725.10
H Transportation and storage 910.9 0 851.3 0 911.3 0 945.2 0 962.0 0 942.4 0 1,156.6 0
I Accommodation and food service activities 2,321.7
02,479.8
02,343.2
02,451.0
02,472.9
02,231.7
02,444.4
0
J Information and communication935.5
0845.7
0915.8
01,149.0
01,155.2
0987.3
0969.8
0
K Financial and insurance activities2,235.7
02,448.0
02,546.3
02,491.8
02,506.3
02,386.7
02,674.9
0
L Real estate activities 3,387.0 0 3,476.1 0 3,560.2 0 3,563.9 0 3,646.0 0 3,607.1 0 3,852.6 0
M+N Professional, scientific, technical, administrative and support service activities 858.5
0
837.80
841.90
819.20
828.10
819.90
917.00
M Professional, scientific and technical activitiesN Administrative and support service activities
O+P+Q Public administration and defence, education, human health and social work activities
2,949.3
0
2,883.9
0
2,850.8
0
3,021.8
0
3,181.1
0
3,063.7
0
3,449.3
0
O Public administration and defence; compulsory social security 1,205.3
0
1,208.00
1,173.10
1,311.00
1,407.40
1,367.80
1,563.60
P Education 889.2 0 879.8 0 861.7 0 892.9 0 930.6 0 897.7 0 961.0 0
Q Human health and social work activities 854.7
0796.1
0816.0
0817.9
0843.1
0798.3
0924.6
0
R+S+T Other service activities 1,266.9 0 1,316.6 0 1,238.5 0 1,250.5 0 1,352.2 0 2,033.5 0 2,254.8 0
R Arts, entertainment and recreationS Other service activitiesT Private households with employed persons
Plus: Statistical discrepancyEquals: VALUE ADDED, GROSS, at basic prices 1,2 20,630.9
021,211.4
021,237.7
022,395.3
022,988.5
023,229.8
023,865.2
0
Less: Financial intermediation services indirectly measured (FISIM) 1,072.3
0
1,358.20
1,644.90
1,590.10
1,611.90
1,539.20
1,656.00
Plus: Taxes less Subsidies on products 3 1,556.5
01,502.7
01,709.5
01,872.2
01,632.7
01,577.3
01,695.3
0
Plus: Taxes on productsLess: Subsidies on products
Plus: Statistical discrepancy
GROSS DOMESTIC PRODUCT 21,115.1 0 21,355.9 0 21,302.3 0 22,677.4 0 23,009.4 0 23,267.9 0 23,904.5 0
1 At producer's prices.2 Includes Financial intermediation services indirectly measured (FISIM).3 Refers to Taxes less subsidies on imports
13

Table 3.2 The Bahamas: Value added by industries at constant 2006 prices (ISIC 4)
Millions of EC dollars
Item Description 2009 2010 2011 2012 2013 2014 Pv 2015 Pl
A Agriculture, forestry and fishing482.1
0499.8
0460.2
0478.5
0363.6
0354.2
0345.8
0
01 Crop and animal production, hunting and related service activities 196.3
0
134.50
129.90
112.10
111.00
100.80
90.30
02 Forestry and logging03 Fishing and aquaculture 285.8 0 365.3 0 330.2 0 366.4 0 252.6 0 253.4 0 255.5 0
B+C+D+E Manufacturing, mining and quarrying and other industrial activities 1,454.4
0
1,522.70
1,520.50
1,566.70
1,591.70
1,634.70
1,392.00
B Mining and quarrying 271.1 0 294.0 0 243.5 0 207.7 0 227.5 0 302.7 0 217.9 0
C Manufacturing 727.6 0 793.6 0 795.8 0 902.1 0 907.5 0 877.2 0 710.1 0
D Electricity, gas, steam and air conditioning supply 298.6
0279.4
0316.7
0289.1
0291.2
0293.5
0296.8
0
E Water supply; sewerage, waste management and remediation activities 157.2
0
155.70
164.50
167.90
165.60
161.30
167.20
F Construction 1,328.5 0 1,655.1 0 1,810.1 0 2,049.0 0 2,234.0 0 2,241.8 0 1,422.0 0
G+H+I Wholesale and retail trade, transportation and storage, accommodation and food service activities 6,068.7
0
6,063.2
0
5,970.1
0
6,200.3
0
6,091.4
0
5,713.2
0
5,876.7
0
G Wholesale and retail trade; repair of motor vehicles and motorcycles 2,216.0
0
2,053.90
1,913.10
1,917.60
2,008.20
1,993.10
2,219.70
H Transportation and storage 808.7 0 695.1 0 768.7 0 713.6 0 697.7 0 722.2 0 706.8 0
I Accommodation and food service activities 3,044.0
03,314.2
03,288.2
03,569.1
03,385.5
02,997.9
02,950.3
0
J Information and communication776.8
0749.8
0804.1
0918.2
0986.6
0923.7
0952.0
0
K Financial and insurance activities2,126.3
02,319.9
02,410.8
02,294.8
02,274.5
02,151.4
02,357.3
0
L Real estate activities 3,182.5 0 3,244.6 0 3,338.6 0 3,243.7 0 3,323.6 0 3,231.4 0 3,329.7 0
M+N Professional, scientific, technical, administrative and support service activities 663.3
0
601.80
591.50
588.30
585.40
560.10
604.20
M Professional, scientific and technical activitiesN Administrative and support service activities
O+P+Q Public administration and defence, education, human health and social work activities
2,671.7
0
2,699.3
0
2,773.0
0
2,792.1
0
2,801.3
0
2,739.3
0
2,827.1
0
O Public administration and defence; compulsory social security 1,161.3
0
1,181.70
1,201.80
1,209.90
1,189.60
1,157.30
1,200.30
P Education 769.2 0 806.7 0 830.8 0 851.6 0 866.5 0 855.1 0 875.5 0
Q Human health and social work activities 741.2
0710.8
0740.4
0730.6
0745.2
0726.9
0751.4
0
R+S+T Other service activities 1,208.1 0 1,283.5 0 1,251.9 0 1,214.3 0 1,289.9 0 1,854.4 0 1,967.7 0
R Arts, entertainment and recreationS Other service activitiesT Private households with employed persons
Plus: Statistical discrepancyEquals: VALUE ADDED, GROSS, at basic prices 1,2 19,962.5
020,639.6
020,930.8
021,346.0
021,542.2
021,404.0
021,074.6
0
Less: Financial intermediation services indirectly measured (FISIM) 1,018.7
0
1,270.60
1,518.10
1,434.20
1,426.00
1,361.80
1,470.30
Plus: Taxes less Subsidies on products 3 1,477.6
01,366.7
01,450.1
01,594.9
01,392.7
01,353.9
01,435.9
0
Plus: Taxes on productsLess: Subsidies on products
Plus: Statistical discrepancy
GROSS DOMESTIC PRODUCT 20,421.4 0 20,735.6 0 20,862.7 0 21,506.6 0 21,508.8 0 21,396.1 0 21,040.1 0
1 At producer's prices.2 Includes Financial intermediation services indirectly measured (FISIM).3 Refers to Taxes less subsidies on imports
14
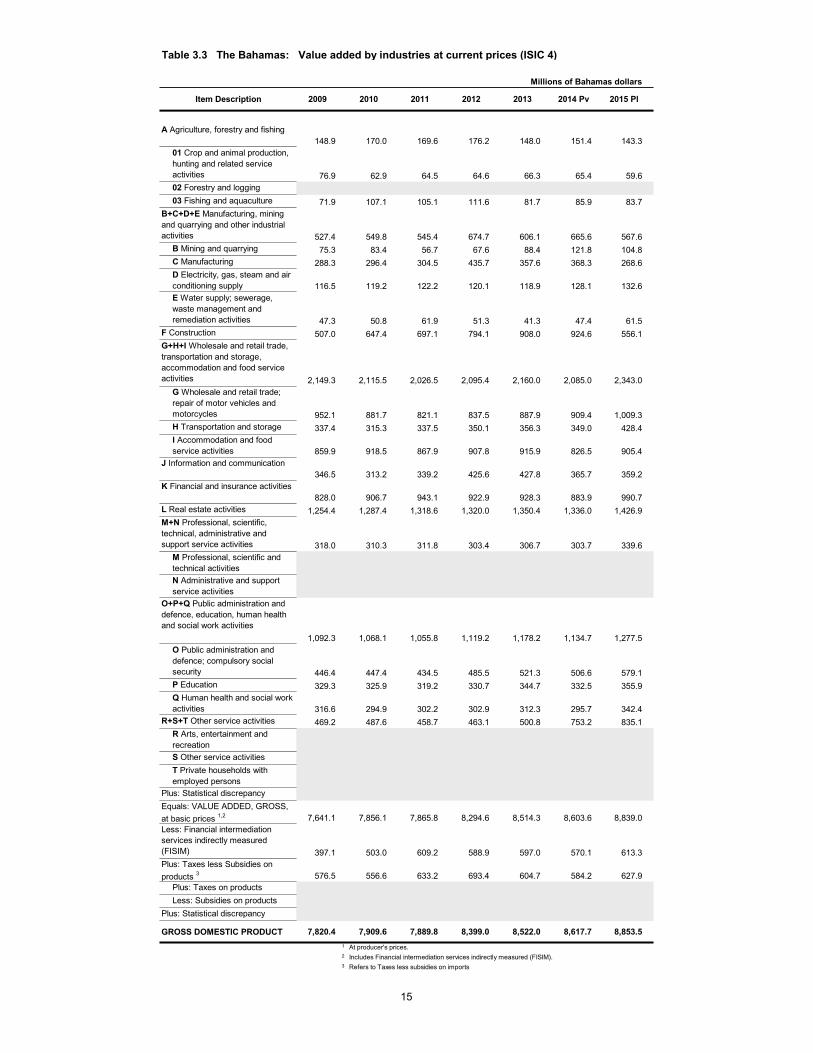
Table 3.3 The Bahamas: Value added by industries at current prices (ISIC 4)
Millions of Bahamas dollars
Item Description 2009 2010 2011 2012 2013 2014 Pv 2015 Pl
A Agriculture, forestry and fishing148.9
0170.0
0169.6
0176.2
0148.0
0151.4
0143.3
0
01 Crop and animal production, hunting and related service activities 76.9
0
62.90
64.50
64.60
66.30
65.40
59.60
02 Forestry and logging03 Fishing and aquaculture 71.9 0 107.1 0 105.1 0 111.6 0 81.7 0 85.9 0 83.7 0
B+C+D+E Manufacturing, mining and quarrying and other industrial activities 527.4
0
549.80
545.40
674.70
606.10
665.60
567.60
B Mining and quarrying 75.3 0 83.4 0 56.7 0 67.6 0 88.4 0 121.8 0 104.8 0
C Manufacturing 288.3 0 296.4 0 304.5 0 435.7 0 357.6 0 368.3 0 268.6 0
D Electricity, gas, steam and air conditioning supply 116.5
0119.2
0122.2
0120.1
0118.9
0128.1
0132.6
0
E Water supply; sewerage, waste management and remediation activities 47.3
0
50.80
61.90
51.30
41.30
47.40
61.50
F Construction 507.0 0 647.4 0 697.1 0 794.1 0 908.0 0 924.6 0 556.1 0
G+H+I Wholesale and retail trade, transportation and storage, accommodation and food service activities 2,149.3
0
2,115.5
0
2,026.5
0
2,095.4
0
2,160.0
0
2,085.0
0
2,343.0
0
G Wholesale and retail trade; repair of motor vehicles and motorcycles 952.1
0
881.70
821.10
837.50
887.90
909.40
1,009.30
H Transportation and storage 337.4 0 315.3 0 337.5 0 350.1 0 356.3 0 349.0 0 428.4 0
I Accommodation and food service activities 859.9
0918.5
0867.9
0907.8
0915.9
0826.5
0905.4
0
J Information and communication346.5
0313.2
0339.2
0425.6
0427.8
0365.7
0359.2
0
K Financial and insurance activities828.0
0906.7
0943.1
0922.9
0928.3
0883.9
0990.7
0
L Real estate activities 1,254.4 0 1,287.4 0 1,318.6 0 1,320.0 0 1,350.4 0 1,336.0 0 1,426.9 0
M+N Professional, scientific, technical, administrative and support service activities 318.0
0
310.30
311.80
303.40
306.70
303.70
339.60
M Professional, scientific and technical activitiesN Administrative and support service activities
O+P+Q Public administration and defence, education, human health and social work activities
1,092.3
0
1,068.1
0
1,055.8
0
1,119.2
0
1,178.2
0
1,134.7
0
1,277.5
0
O Public administration and defence; compulsory social security 446.4
0
447.40
434.50
485.50
521.30
506.60
579.10
P Education 329.3 0 325.9 0 319.2 0 330.7 0 344.7 0 332.5 0 355.9 0
Q Human health and social work activities 316.6
0294.9
0302.2
0302.9
0312.3
0295.7
0342.4
0
R+S+T Other service activities 469.2 0 487.6 0 458.7 0 463.1 0 500.8 0 753.2 0 835.1 0
R Arts, entertainment and recreationS Other service activitiesT Private households with employed persons
Plus: Statistical discrepancyEquals: VALUE ADDED, GROSS, at basic prices 1,2 7,641.1
07,856.1
07,865.8
08,294.6
08,514.3
08,603.6
08,839.0
0
Less: Financial intermediation services indirectly measured (FISIM) 397.1
0
503.00
609.20
588.90
597.00
570.10
613.30
Plus: Taxes less Subsidies on products 3 576.5
0556.6
0633.2
0693.4
0604.7
0584.2
0627.9
0
Plus: Taxes on productsLess: Subsidies on products
Plus: Statistical discrepancy
GROSS DOMESTIC PRODUCT 7,820.4 0 7,909.6 0 7,889.8 0 8,399.0 0 8,522.0 0 8,617.7 0 8,853.5 0
1 At producer's prices.2 Includes Financial intermediation services indirectly measured (FISIM).3 Refers to Taxes less subsidies on imports
15
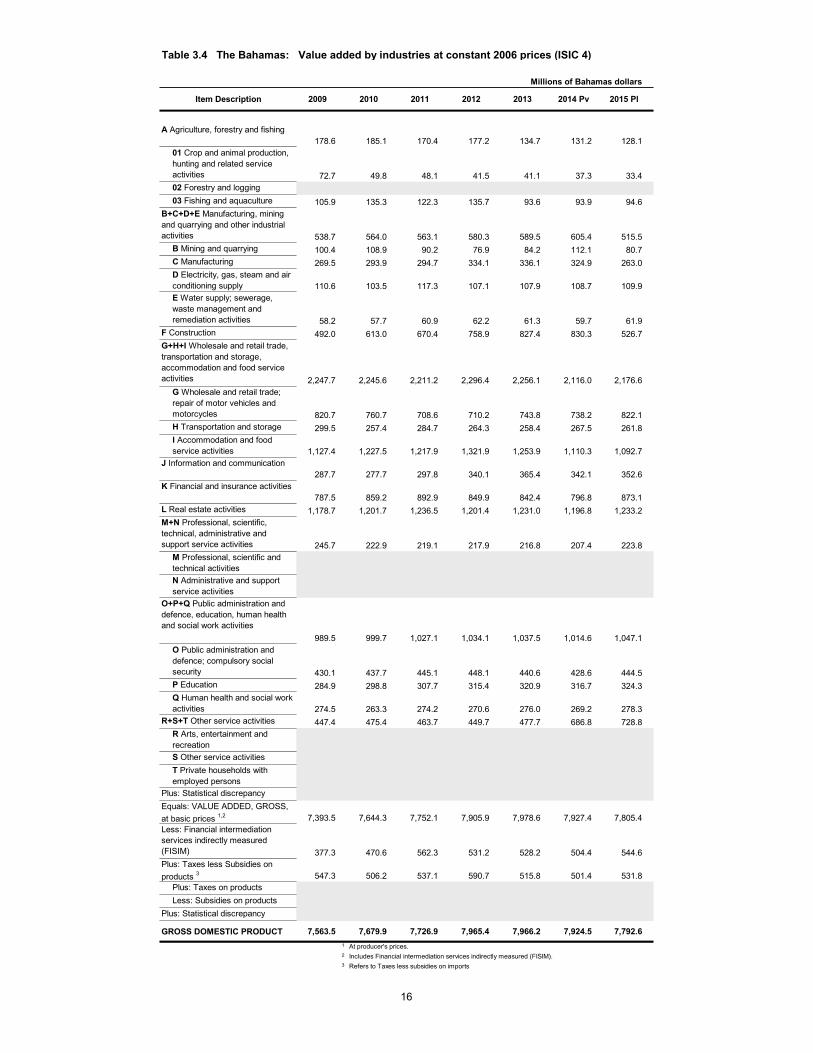
Table 3.4 The Bahamas: Value added by industries at constant 2006 prices (ISIC 4)
Millions of Bahamas dollars
Item Description 2009 2010 2011 2012 2013 2014 Pv 2015 Pl
A Agriculture, forestry and fishing178.6
0185.1
0170.4
0177.2
0134.7
0131.2
0128.1
0
01 Crop and animal production, hunting and related service activities 72.7
0
49.80
48.10
41.50
41.10
37.30
33.40
02 Forestry and logging03 Fishing and aquaculture 105.9 0 135.3 0 122.3 0 135.7 0 93.6 0 93.9 0 94.6 0
B+C+D+E Manufacturing, mining and quarrying and other industrial activities 538.7
0
564.00
563.10
580.30
589.50
605.40
515.50
B Mining and quarrying 100.4 0 108.9 0 90.2 0 76.9 0 84.2 0 112.1 0 80.7 0
C Manufacturing 269.5 0 293.9 0 294.7 0 334.1 0 336.1 0 324.9 0 263.0 0
D Electricity, gas, steam and air conditioning supply 110.6
0103.5
0117.3
0107.1
0107.9
0108.7
0109.9
0
E Water supply; sewerage, waste management and remediation activities 58.2
0
57.70
60.90
62.20
61.30
59.70
61.90
F Construction 492.0 0 613.0 0 670.4 0 758.9 0 827.4 0 830.3 0 526.7 0
G+H+I Wholesale and retail trade, transportation and storage, accommodation and food service activities 2,247.7
0
2,245.6
0
2,211.2
0
2,296.4
0
2,256.1
0
2,116.0
0
2,176.6
0
G Wholesale and retail trade; repair of motor vehicles and motorcycles 820.7
0
760.70
708.60
710.20
743.80
738.20
822.10
H Transportation and storage 299.5 0 257.4 0 284.7 0 264.3 0 258.4 0 267.5 0 261.8 0
I Accommodation and food service activities 1,127.4
01,227.5
01,217.9
01,321.9
01,253.9
01,110.3
01,092.7
0
J Information and communication287.7
0277.7
0297.8
0340.1
0365.4
0342.1
0352.6
0
K Financial and insurance activities787.5
0859.2
0892.9
0849.9
0842.4
0796.8
0873.1
0
L Real estate activities 1,178.7 0 1,201.7 0 1,236.5 0 1,201.4 0 1,231.0 0 1,196.8 0 1,233.2 0
M+N Professional, scientific, technical, administrative and support service activities 245.7
0
222.90
219.10
217.90
216.80
207.40
223.80
M Professional, scientific and technical activitiesN Administrative and support service activities
O+P+Q Public administration and defence, education, human health and social work activities
989.5
0
999.7
0
1,027.1
0
1,034.1
0
1,037.5
0
1,014.6
0
1,047.1
0
O Public administration and defence; compulsory social security 430.1
0
437.70
445.10
448.10
440.60
428.60
444.50
P Education 284.9 0 298.8 0 307.7 0 315.4 0 320.9 0 316.7 0 324.3 0
Q Human health and social work activities 274.5
0263.3
0274.2
0270.6
0276.0
0269.2
0278.3
0
R+S+T Other service activities 447.4 0 475.4 0 463.7 0 449.7 0 477.7 0 686.8 0 728.8 0
R Arts, entertainment and recreationS Other service activitiesT Private households with employed persons
Plus: Statistical discrepancyEquals: VALUE ADDED, GROSS, at basic prices 1,2 7,393.5
07,644.3
07,752.1
07,905.9
07,978.6
07,927.4
07,805.4
0
Less: Financial intermediation services indirectly measured (FISIM) 377.3
0
470.60
562.30
531.20
528.20
504.40
544.60
Plus: Taxes less Subsidies on products 3 547.3
0506.2
0537.1
0590.7
0515.8
0501.4
0531.8
0
Plus: Taxes on productsLess: Subsidies on products
Plus: Statistical discrepancy
GROSS DOMESTIC PRODUCT 7,563.5 0 7,679.9 0 7,726.9 0 7,965.4 0 7,966.2 0 7,924.5 0 7,792.6 0
1 At producer's prices.2 Includes Financial intermediation services indirectly measured (FISIM).3 Refers to Taxes less subsidies on imports
16

Table 3.5 The Bahamas: Gross domestic product by expenditures at current prices
Millions of EC dollarsItem Description 2009 2010 2011 2012 2013 2014 Pv 2015 Pl
Final consumption expenditure 17,364.7 ## 17,784.0 ## 18,352.0 ## 19,510.7 ## 19,517.8 ## 20,378.5 ## 19,449.0 ##
Household final consumption expenditure 14,255.7
##14,678.0
##14,946.4
##16,062.2
##15,864.0
##16,814.4
##15,630.6
##
NPISHs final consumption expenditureGeneral government final consumption expenditure 3,109.1
##3,106.0
##3,405.6
##3,448.5
##3,653.8
##3,564.1
##3,818.4
##
Individual consumption expenditure 1,271.9
##1,247.6
##1,234.4
##1,286.6
##1,338.4
##1,282.0
##1,318.0
##
Collective consumption expenditure 1,837.1
##1,858.4
##2,171.2
##2,161.9
##2,315.4
##2,282.0
##2,500.4
##
Gross capital formation 5,399.5 ## 5,384.8 ## 5,863.8 ## 6,525.8 ## 6,368.3 ## 7,264.4 ## 6,507.3 ##
Gross fixed capital formation 5,152.0 ## 5,131.8 ## 5,508.9 ## 6,311.3 ## 6,187.0 ## 7,017.7 ## 6,262.7 ##
Changes in inventories 247.6 ## 253.0 ## 354.9 ## 214.6 ## 181.3 ## 246.7 ## 244.6 ##
Acquisitions less disposals of valuables
Exports of goods and services 8,416.5 ## 8,702.3 ## 9,296.9 ## 10,079.9 ## 10,067.0 ## 9,887.6 ## 9,230.9 ##
Exports of goods 1,579.2 ## 1,677.8 ## 1,962.7 ## 2,237.5 ## 2,198.2 ## 1,860.8 ## 1,195.5 ##
Exports of services 6,837.4 ## 7,024.5 ## 7,334.2 ## 7,842.4 ## 7,868.8 ## 8,026.8 ## 8,035.4 ##
Less: Imports of goods and services 10,065.7
##10,515.2
##12,210.3
##13,439.0
##12,943.7
##14,262.5
##11,282.7
##
Imports of goods 7,287.2 ## 7,729.5 ## 9,209.4 ## 9,847.0 ## 9,087.9 ## 10,234.4 ## 8,537.5 ##
Imports of services 2,778.5 ## 2,785.8 ## 3,000.9 ## 3,592.1 ## 3,855.8 ## 4,028.2 ## 2,745.2 ##
Plus: Statistical discrepancyGROSS DOMESTIC PRODUCT 21,115.1 ## 21,355.9 ## 21,302.3 ## 22,677.4 ## 23,009.4 ## 23,267.9 ## 23,904.5 ##
Table 3.6 The Bahamas: Gross domestic product by expenditures at constant 2006 prices
Millions of EC dollars
Item Description 2009 2010 2011 2012 2013 2014 Pv 2015 Pl
Final consumption expenditure 15,725.7 ## 15,856.4 ## 15,729.3 ## 16,133.9 ## 15,949.2 ## 16,565.4 ## 15,884.4 ##
Household final consumption expenditure 12,881.1
##13,020.1
##12,687.6
##13,234.1
##13,002.8
##13,624.2
##12,737.1
##
NPISHs final consumption expenditureGeneral government final consumption expenditure 2,844.6
##2,836.3
##3,041.7
##2,899.8
##2,946.4
##2,941.2
##3,147.3
##
Individual consumption expenditure 1,083.8
##1,090.0
##1,080.7
##1,096.0
##1,122.9
##1,132.0
##1,171.4
##
Collective consumption expenditure 1,760.8
##1,746.3
##1,961.0
##1,803.8
##1,823.5
##1,809.2
##1,975.9
##
Gross capital formation 5,219.5 ## 5,251.6 ## 5,641.1 ## 6,167.5 ## 5,990.9 ## 6,755.5 ## 5,950.3 ##
Gross fixed capital formation 4,993.1 ## 5,021.7 ## 5,328.0 ## 5,982.1 ## 5,835.3 ## 6,547.0 ## 5,747.3 ##
Changes in inventories 226.5 ## 229.9 ## 313.0 ## 185.4 ## 155.6 ## 208.5 ## 203.0 ##
Acquisitions less disposals of valuables
Exports of goods and services 8,965.9 ## 9,080.2 ## 9,650.7 ## 10,346.0 ## 10,344.0 ## 10,008.8 ## 9,283.3 ##
Exports of goodsExports of services
Less: Imports of goods and services 9,489.8
##9,452.6
##10,158.3
##11,140.8
##10,775.2
##11,933.6
##10,077.8
##
Imports of goodsImports of services
Plus: Statistical discrepancyGROSS DOMESTIC PRODUCT 20,421.3 ## 20,735.6 ## 20,862.7 ## 21,506.6 ## 21,508.8 ## 21,396.1 ## 21,040.1 ##
17

Table 3.7 The Bahamas: Gross domestic product by expenditures at current prices
Millions of Bahamas dollars
Item Description 2009 2010 2011 2012 2013 2014 Pv 2015 Pl
Final consumption expenditure 6,431.4 ## 6,586.7 ## 6,797.0 ## 7,226.2 ## 7,228.8 ## 7,547.6 ## 7,203.3 ##
Household final consumption expenditure 5,279.9
##5,436.3
##5,535.7
##5,949.0
##5,875.6
##6,227.6
##5,789.1
##
NPISHs final consumption expenditureGeneral government final consumption expenditure 1,151.5
##1,150.4
##1,261.3
##1,277.2
##1,353.3
##1,320.0
##1,414.2
##
Individual consumption expenditure 471.1
##462.1
##457.2
##476.5
##495.7
##474.8
##488.2
##
Collective consumption expenditure 680.4
##688.3
##804.1
##800.7
##857.5
##845.2
##926.1
##
Gross capital formation 1,999.8 ## 1,994.4 ## 2,171.8 ## 2,417.0 ## 2,358.6 ## 2,690.5 ## 2,410.1 ##
Gross fixed capital formation 1,908.1 ## 1,900.7 ## 2,040.4 ## 2,337.5 ## 2,291.5 ## 2,599.1 ## 2,319.5 ##
Changes in inventories 91.7 ## 93.7 ## 131.4 ## 79.5 ## 67.1 ## 91.4 ## 90.6 ##
Acquisitions less disposals of valuables
Exports of goods and services 3,117.2 ## 3,223.1 ## 3,443.3 ## 3,733.3 ## 3,728.5 ## 3,662.1 ## 3,418.9 ##
Exports of goods 584.9 ## 621.4 ## 726.9 ## 828.7 ## 814.2 ## 689.2 ## 442.8 ##
Exports of services 2,532.4 ## 2,601.7 ## 2,716.4 ## 2,904.6 ## 2,914.4 ## 2,972.9 ## 2,976.1 ##
Less: Imports of goods and services 3,728.0
##3,894.5
##4,522.4
##4,977.4
##4,794.0
##5,282.4
##4,178.8
##
Imports of goods 2,699.0 ## 2,862.8 ## 3,410.9 ## 3,647.0 ## 3,365.9 ## 3,790.5 ## 3,162.0 ##
Imports of services 1,029.1 ## 1,031.8 ## 1,111.5 ## 1,330.4 ## 1,428.1 ## 1,491.9 ## 1,016.8 ##
Plus: Statistical discrepancyGROSS DOMESTIC PRODUCT 7,820.4 ## 7,909.6 ## 7,889.8 ## 8,399.0 ## 8,522.0 ## 8,617.7 ## 8,853.5 ##
Table 3.8 The Bahamas: Gross domestic product by expenditures at constant 2006 prices
Millions of Bahamas dollars
Item Description 2009 2010 2011 2012 2013 2014 Pv 2015 Pl
Final consumption expenditure 5,824.3 ## 5,872.7 ## 5,825.7 ## 5,975.5 ## 5,907.1 ## 6,135.3 ## 5,883.1 ##
Household final consumption expenditure 4,770.8
##4,822.3
##4,699.1
##4,901.5
##4,815.9
##5,046.0
##4,717.5
##
NPISHs final consumption expenditureGeneral government final consumption expenditure 1,053.6
##1,050.5
##1,126.6
##1,074.0
##1,091.3
##1,089.3
##1,165.7
##
Individual consumption expenditure 401.4
##403.7
##400.3
##405.9
##415.9
##419.3
##433.8
##
Collective consumption expenditure 652.2
##646.8
##726.3
##668.1
##675.4
##670.1
##731.8
##
Gross capital formation 1,933.2 ## 1,945.0 ## 2,089.3 ## 2,284.3 ## 2,218.8 ## 2,502.1 ## 2,203.8 ##
Gross fixed capital formation 1,849.3 ## 1,859.9 ## 1,973.4 ## 2,215.6 ## 2,161.2 ## 2,424.8 ## 2,128.6 ##
Changes in inventories 83.9 ## 85.2 ## 115.9 ## 68.7 ## 57.6 ## 77.2 ## 75.2 ##
Acquisitions less disposals of valuables
Exports of goods and services 3,320.7 ## 3,363.1 ## 3,574.3 ## 3,831.9 ## 3,831.1 ## 3,707.0 ## 3,438.3 ##
Exports of goodsExports of services
Less: Imports of goods and services 3,514.7
##3,501.0
##3,762.3
##4,126.2
##3,990.8
##4,419.9
##3,732.5
##
Imports of goodsImports of services
Plus: Statistical discrepancyGROSS DOMESTIC PRODUCT 7,563.5 ## 7,679.9 ## 7,726.9 ## 7,965.4 ## 7,966.2 ## 7,924.5 ## 7,792.6 ##
18

Table 3.9 The Bahamas: Relations among product, income, savings, and net lending aggregates
Millions of EC dollars
Item Description 2009 2010 2011 2012 2013 2014 Pv 2015 Pl
GROSS DOMESTIC PRODUCT 21,115.1 21,355.9 21,302.3 22,677.4 23,009.4 23,267.9 23,904.5Compensation of employees - from and to the rest of the world, net -149.6 -121.8 -96.7 -173.9 -167.5
Plus: Compensation of employees - from the rest of the worldLess: Compensation of employees - to the rest of the world
Property income - from and to the rest of the world, net -378.9 -560.3 -507.9 -600.6 -791.9 -1,001.2 -1,168.7
Plus: Property income - from the rest of the world 155.8 104.7 149.6 134.2 129.6 156.9 156.6Less: Property income - to the rest of the world 534.6 664.9 657.6 734.8 921.5 1,158.0 1,325.3
Plus: Compensation of employees and property income - from and to the rest of the world, net -378.9 -560.3 -657.6 -722.4 -888.6 -1,175.0 -1,336.2
Plus: Compensation of employees and property income - from the rest of the world 155.8 104.7
Less: Compensation of employees and property income - to the rest of the world 534.6 664.9
Plus: Taxes less subsidies on production and imports - from and to the rest of the world, net
Plus: Taxes less subsidies on production and imports - from the rest of the worldLess: Taxes less subsidies on production and imports - to the rest of the world
GROSS NATIONAL INCOME, at market prices 20,736.3 20,795.6 20,644.7 21,955.0 22,120.8 22,092.9 22,568.3Plus: Current transfers - from and to the rest of the world, net 98.5 75.4 114.0 73.7 66.7 87.2 111.9
Plus: Current transfers - from the rest of the world 260.9 268.2 334.8 354.5 373.1 393.9 426.2Less: Current transfers - to the rest of the world 162.4 192.8 220.8 280.8 306.5 306.7 314.3
GROSS NATIONAL DISPOSABLE INCOME 20,834.8 20,871.0 20,758.7 22,028.7 22,187.5 22,180.1 22,680.2Less: Final consumption expenditure / Actual final consumption 17,364.7 17,784.0 18,352.0 19,510.7 19,517.8 20,378.4 19,449.0Plus: Statistical discrepancySAVING, GROSS 3,470.0 3,087.0 2,406.7 2,518.0 2,669.7 1,801.6 3,231.2Plus: Capital transfers - from and to the rest of the world, net -19.4 -9.7 -15.0 -19.7 -25.9 -24.0 -37.1
Plus: Capital transfers - from the rest of the world 0.0 0.0Less: Capital transfers - to the rest of the world 19.4 9.7
Less: Gross capital formation 5,399.5 5,384.8 5,863.8 6,525.8 6,368.3 7,264.4 6,507.3
Less: Acquisitions less disposals of non-produced non-financial assetsPlus: Statistical discrepancy
NET LENDING(+)/ NET BORROWING(-) OF THE NATION -3,472.0 -4,027.5 -3,724.5 -5,486.8 -3,313.2
Less: Consumption of fixed capital1,503.0 1,527.5 1,507.5 1,377.4 1,442.0 1,441.1 1,440.3
NET NATIONAL INCOME, in market prices 19,233.3 19,268.1 19,137.2 20,577.6 20,678.9 20,651.7 21,128.0NET NATIONAL DISPOSABLE INCOMESAVING, NET
19

Table 3.10 The Bahamas: Relations among product, income, savings, and net lending aggregates
Millions of Bahamas dollars
Item Description 2009 2010 2011 2012 2013 2014 Pv 2015 Pl
GROSS DOMESTIC PRODUCT 7,820.4 7,909.6 7,889.8 8,399.0 8,522.0 8,617.7 8,853.5Compensation of employees - from and to the rest of the world, net -55.4 -45.1 -35.8 -64.4 -62.1
Plus: Compensation of employees - from the rest of the worldLess: Compensation of employees - to the rest of the world
Property income - from and to the rest of the world, net -140.3 -207.5 -188.1 -222.5 -293.3 -370.8 -432.9
Plus: Property income - from the rest of the world 57.7 38.8 55.4 49.7 48.0 58.1 58.0Less: Property income - to the rest of the world 198.0 246.3 243.5 272.2 341.3 428.9 490.8
Plus: Compensation of employees and property income - from and to the rest of the world, net -140.3 -207.5 -243.5 -267.6 -329.1 -435.2 -494.9
Plus: Compensation of employees and property income - from the rest of the world 57.7 38.8
Less: Compensation of employees and property income - to the rest of the world 198.0 246.3
Plus: Taxes less subsidies on production and imports - from and to the rest of the world, net
Plus: Taxes less subsidies on production and imports - from the rest of the worldLess: Taxes less subsidies on production and imports - to the rest of the world
GROSS NATIONAL INCOME, at market prices 7,680.1 7,702.1 7,646.2 8,131.5 8,192.9 8,182.5 8,358.6Plus: Current transfers - from and to the rest of the world, net 36.5 27.9 42.2 27.3 24.7 32.3 41.5
Plus: Current transfers - from the rest of the world 96.6 99.3 124.0 131.3 138.2 145.9 157.8Less: Current transfers - to the rest of the world 60.2 71.4 81.8 104.0 113.5 113.6 116.4
GROSS NATIONAL DISPOSABLE INCOME 7,716.6 7,730.0 7,688.4 8,158.8 8,217.6 8,214.8 8,400.1Less: Final consumption expenditure / Actual final consumption 6,431.4 6,586.7 6,797.0 7,226.2 7,228.8 7,547.6 7,203.3Plus: Statistical discrepancySAVING, GROSS 1,285.2 1,143.4 891.4 932.6 988.8 667.3 1,196.7Plus: Capital transfers - from and to the rest of the world, net -7.2 -3.6 -5.5 -7.3 -9.6 -8.9 -13.7
Plus: Capital transfers - from the rest of the world 0.0 0.0Less: Capital transfers - to the rest of the world 7.2 3.6
Less: Gross capital formation 1,999.8 1,994.4 2,171.8 2,417.0 2,358.6 2,690.5 2,410.1
Less: Acquisitions less disposals of non-produced non-financial assetsPlus: Statistical discrepancy
NET LENDING(+)/ NET BORROWING(-) OF THE NATION -1,285.9 -1,491.7 -1,379.5 -2,032.1 -1,227.1
Less: Consumption of fixed capital556.7 565.7 558.3 510.2 534.1 533.8 533.4
NET NATIONAL INCOME, in market prices 7,123.5 7,136.4 7,087.9 7,621.3 7,658.8 7,648.8 7,825.2NET NATIONAL DISPOSABLE INCOMESAVING, NET
20


Table 4.1 Barbados: Value added by industries at current prices
Millions of EC dollars
Item Description 2009 2010 2011 2012 2013 2014 Pv 2015
A+B Agriculture, hunting, forestry; fishing 169.8
0163.4
0155.6
0168.8
0183.5
0169.8
0...
0
A Agriculture, hunting, forestryAgriculture, hunting and related service activitiesForestry, logging and related service activities
B FishingC Mining and quarrying 23.8 0 28.2 0 30.0 0 28.1 0 26.6 0 25.1 0 ... 0
D Manufacturing 726.0 0 700.2 0 647.1 0 551.1 0 495.5 0 421.5 0 ... 0
E Electricity, gas and water supply 263.80
289.80
299.40
303.20
288.00
279.50
...0
F Construction 619.0 0 503.8 0 487.5 0 454.5 0 396.2 0 389.1 0 ... 0
G+H Wholesale, retail trade, repair of motor vehicles, motorcycles and personal and households goods; hotels and restaurants 2,530.7
0
2,508.3
0
2,411.1
0
2,343.1
0
2,448.0
0
2,460.4
0
...
0
G Wholesale, retail trade, repair of motor vehicles, motorcycles and personal and household goods 1,005.1
0
1,013.4
0
1,041.5
0
1,028.0
0
975.5
0
1,027.5
0
...
0
H Hotels and restaurants 1,525.6 0 1,495.0 0 1,369.6 0 1,315.0 0 1,472.4 0 1,432.9 0 ... 0
I Transport, storage and communications 1,277.6
01,327.7
01,421.3
01,544.1
01,186.4
01,151.8
0...
0
Land transport; transport via pipelines, water transport; air transport; Supporting and auxiliary transport activities; activities of travel agenciesPost and telecommunications
J+K Financial intermediation; real estate, renting and business activities 3,291.2
0
3,153.60
3,130.50
3,015.00
3,128.20
3,111.30
...0
J Financial intermediationK Real estate, renting and business activities
L Public administration and defence; compulsory social security 1 1,287.2 1,287.5 1,337.3 1,284.8 1,295.1 1,156.0 ...M+N+O Education; health and social work; other community, social and personal services 2 531.4 579.6 647.3 639.5 652.7 767.2 ...
M EducationN Health and social workO Other community, social and personal services
P Private households with employed personsPlus: Statistical discrepancyVALUE ADDED, GROSS, at basic prices 3 10,720.5 10,542.2 10,567.0 10,332.1 10,100.4 9,931.7 ...Less: Financial intermediation services indirectly measured (FISIM) 228.6
0
232.10
231.00
224.40
215.90
208.30
...0
Plus: Taxes less Subsidies on products 2,070.2
01,874.7
01,676.2
01,775.4
01,798.2
01,857.7
0...
0
Plus: Taxes on productsLess: Subsidies on products
Plus: Statistical discrepancy -138.9 0 -178.7 0 -243.3 0 -186.2 0 119.5 0 171.3 0 ... 0
GROSS DOMESTIC PRODUCT 12,423.2 0 12,006.1 0 11,768.9 0 11,696.9 0 11,802.2 0 11,752.4 0 ... 0
1 Refers to Government services2 Refers to Personal and other services including private education and health.3 Includes Financial intermediation services indirectly measured (FISIM).
21

Table 4.2 Barbados: Value added by industries at constant 1974 prices
Millions of EC dollars
Item Description 2009 2010 2011 2012 2013 2014 Pv 2015
A+B Agriculture, hunting, forestry; fishing 50.7
047.6
044.6
045.8
047.1
046.1
0…
0
A Agriculture, hunting, forestryAgriculture, hunting and related service activitiesForestry, logging and related service activities
B FishingC Mining and quarrying 5.3 0 5.8 0 5.0 0 4.6 0 3.9 0 4.7 0 … 0
D Manufacturing 53.3 0 51.0 0 48.3 0 45.0 0 46.0 0 44.6 0 … 0
E Electricity, gas and water supply 43.30
44.20
43.50
43.70
43.40
43.40
…0
F Construction 76.7 0 69.4 0 76.7 0 70.9 0 62.5 0 61.0 0 … 0
G+H Wholesale, retail trade, repair of motor vehicles, motorcycles and personal and households goods; hotels and restaurants 1 362.2 372.2 372.1 368.3 370.3 373.7 …
G Wholesale, retail trade, repair of motor vehicles, motorcycles and personal and household goodsH Hotels and restaurants
I Transport, storage and communications 113.9
0114.0
0114.6
0116.9
0118.0
0118.5
0…
0
Land transport; transport via pipelines, water transport; air transport; Supporting and auxiliary transport activities; activities of travel agenciesPost and telecommunications
J+K Financial intermediation; real estate, renting and business activities 2 222.7 225.0 227.7 234.4 235.5 236.2 …
J Financial intermediationK Real estate, renting and business activities
L Public administration and defence; compulsory social security 3 166.7 168.4 173.4 179.4 181.9 182.7 …M+N+O Education; health and social work; other community, social and personal services
M EducationN Health and social workO Other community, social and personal services
P Private households with employed personsPlus: Statistical discrepancyVALUE ADDED, GROSS, at basic prices 4 1,094.8 1,097.6 1,105.9 1,109.0 1,108.6 1,110.9 …Less: Financial intermediation services indirectly measured (FISIM)Plus: Taxes less Subsidies on products
Plus: Taxes on products Less: Subsidies on products
Plus: Statistical discrepancy
GROSS DOMESTIC PRODUCT 4 1,094.8 1,097.6 1,105.9 1,109.0 1,108.6 1,110.9 1,110.91 Refers to Wholesale and retail trade and Tourism2 Refers to Business and general services3 Refers to Government services4 At factor cost.
22

Table 4.3 Barbados: Value added by industries at current prices
Millions of Barbados dollars
Item Description 2009 2010 2011 2012 2013 2014 Pv 2015
A+B Agriculture, hunting, forestry; fishing 125.8
0121.0
0115.2
0125.0
0135.9
0125.8
0...
0
A Agriculture, hunting, forestryAgriculture, hunting and related service activitiesForestry, logging and related service activities
B FishingC Mining and quarrying 17.6 0 20.9 0 22.2 0 20.8 0 19.7 0 18.6 0 ... 0
D Manufacturing 537.8 0 518.7 0 479.3 0 408.2 0 367.0 0 312.2 0 ... 0
E Electricity, gas and water supply 195.40
214.70
221.80
224.60
213.30
207.00
...0
F Construction 458.5 0 373.2 0 361.1 0 336.7 0 293.5 0 288.2 0 ... 0
G+H Wholesale, retail trade, repair of motor vehicles, motorcycles and personal and households goods; hotels and restaurants 1,874.6
0
1,858.0
0
1,786.0
0
1,735.6
0
1,813.3
0
1,822.5
0
...
0
G Wholesale, retail trade, repair of motor vehicles, motorcycles and personal and household goods 744.5
0
750.6
0
771.5
0
761.5
0
722.6
0
761.1
0
...
0
H Hotels and restaurants 1,130.1 0 1,107.4 0 1,014.5 0 974.1 0 1,090.7 0 1,061.4 0 ... 0
I Transport, storage and communications 946.4
0983.5
01,052.8
01,143.8
0878.8
0853.2
0...
0
Land transport; transport via pipelines, water transport; air transport; Supporting and auxiliary transport activities; activities of travel agenciesPost and telecommunications
J+K Financial intermediation; real estate, renting and business activities 2,437.9
0
2,336.00
2,318.90
2,233.30
2,317.20
2,304.70
...0
J Financial intermediationK Real estate, renting and business activities
L Public administration and defence; compulsory social security 1 953.5 953.7 990.6 951.7 959.3 856.3 ...M+N+O Education; health and social work; other community, social and personal services 2 393.6 429.3 479.5 473.7 483.5 568.3 ...
M EducationN Health and social workO Other community, social and personal services
P Private households with employed personsPlus: Statistical discrepancyVALUE ADDED, GROSS, at basic prices 3 7,941.1 7,809.0 7,827.4 7,653.4 7,481.8 7,356.8 ...Less: Financial intermediation services indirectly measured (FISIM) 169.3
0
171.90
171.10
166.20
159.90
154.30
...0
Plus: Taxes less Subsidies on products 1,533.5
01,388.7
01,241.6
01,315.1
01,332.0
01,376.1
0...
0
Plus: Taxes on productsLess: Subsidies on products
Plus: Statistical discrepancy -102.9 0 -132.4 0 -180.2 0 -137.9 0 88.5 0 126.9 0 ... 0
GROSS DOMESTIC PRODUCT 9,202.4 0 8,893.4 0 8,717.7 0 8,664.4 0 8,742.4 0 8,705.5 0 ... 0
1 Refers to Government services2 Refers to Personal and other services including private education and health.3 Includes Financial intermediation services indirectly measured (FISIM).
23
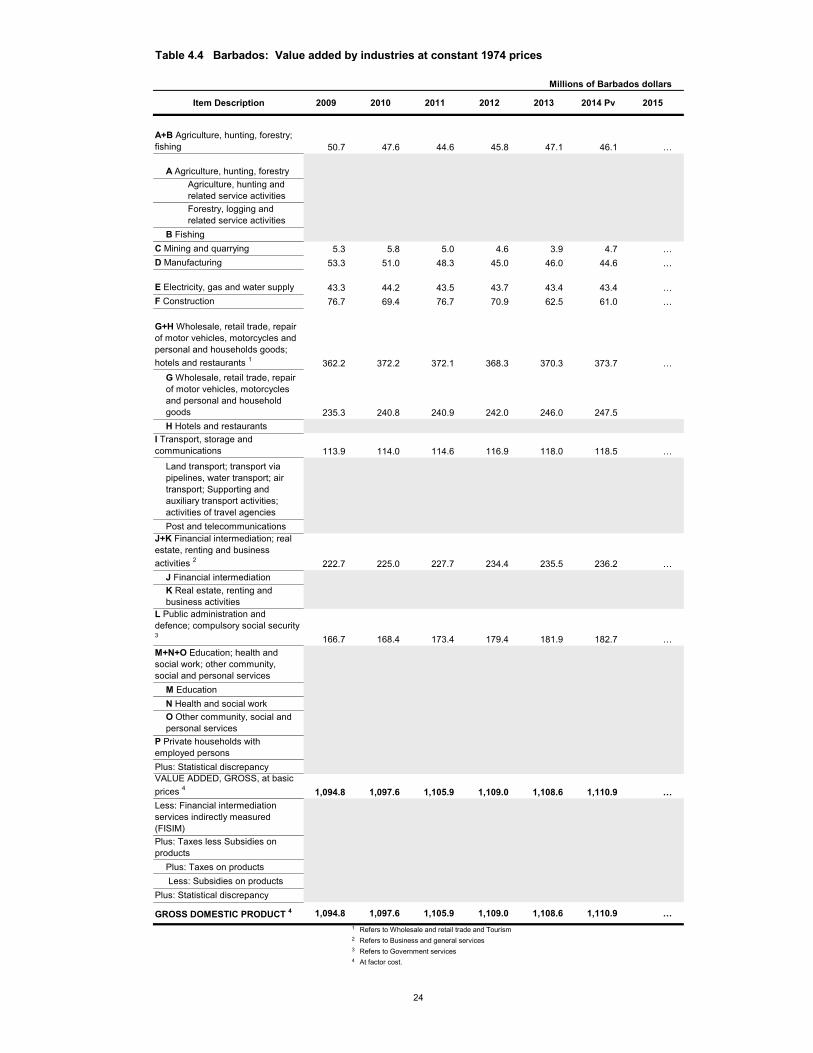
Table 4.4 Barbados: Value added by industries at constant 1974 prices
Millions of Barbados dollars
Item Description 2009 2010 2011 2012 2013 2014 Pv 2015
A+B Agriculture, hunting, forestry; fishing 50.7
047.6
044.6
045.8
047.1
046.1
0…
0
A Agriculture, hunting, forestryAgriculture, hunting and related service activitiesForestry, logging and related service activities
B FishingC Mining and quarrying 5.3 0 5.8 0 5.0 0 4.6 0 3.9 0 4.7 0 … 0
D Manufacturing 53.3 0 51.0 0 48.3 0 45.0 0 46.0 0 44.6 0 … 0
E Electricity, gas and water supply 43.30
44.20
43.50
43.70
43.40
43.40
…0
F Construction 76.7 0 69.4 0 76.7 0 70.9 0 62.5 0 61.0 0 … 0
G+H Wholesale, retail trade, repair of motor vehicles, motorcycles and personal and households goods; hotels and restaurants 1 362.2 372.2 372.1 368.3 370.3 373.7 …
G Wholesale, retail trade, repair of motor vehicles, motorcycles and personal and household goods 235.3 240.8 240.9 242.0 246.0 247.5H Hotels and restaurants
I Transport, storage and communications 113.9 114.0 114.6 116.9 118.0 118.5 …
Land transport; transport via pipelines, water transport; air transport; Supporting and auxiliary transport activities; activities of travel agenciesPost and telecommunications
J+K Financial intermediation; real estate, renting and business activities 2 222.7 225.0 227.7 234.4 235.5 236.2 …
J Financial intermediationK Real estate, renting and business activities
L Public administration and defence; compulsory social security 3 166.7 168.4 173.4 179.4 181.9 182.7 …M+N+O Education; health and social work; other community, social and personal services
M EducationN Health and social workO Other community, social and personal services
P Private households with employed personsPlus: Statistical discrepancyVALUE ADDED, GROSS, at basic prices 4 1,094.8 1,097.6 1,105.9 1,109.0 1,108.6 1,110.9 …Less: Financial intermediation services indirectly measured (FISIM)Plus: Taxes less Subsidies on products
Plus: Taxes on products Less: Subsidies on products
Plus: Statistical discrepancy
GROSS DOMESTIC PRODUCT 4 1,094.8 1,097.6 1,105.9 1,109.0 1,108.6 1,110.9 …1 Refers to Wholesale and retail trade and Tourism2 Refers to Business and general services3 Refers to Government services4 At factor cost.
24

Table 4.5 Barbados: Gross domestic product by expenditures at current prices
Millions of EC dollars
Item Description 2009 2010 2011 2012 2013 2014 P 2015
Final consumption expenditure 10,797.6 ## 10,700.1 ## 11,363.8 ## 11,223.5 ## 11,288.7 ## 11,802.0 ## … ##
Household final consumption expenditure 8,379.6
##8,447.0
##8,984.1
##9,381.6
##9,477.0
##10,091.7
##…
##
NPISHs final consumption expenditureGeneral government final consumption expenditure 2,418.0
##2,253.2
##2,379.6
##1,841.9
##1,811.7
##1,710.3
##…
##
Individual consumption expenditureCollective consumption expenditure
Gross capital formation 1,865.6 ## 1,628.5 ## 1,749.3 ## 1,625.7 ## 1,536.6 ## 1,529.4 ## … ##
Gross fixed capital formation 1,842.2 ## 1,605.4 ## 1,723.5 ## 1,599.3 ## 1,510.9 ## 1,503.8 ## … ##
Changes in inventories 23.4 ## 23.1 ## 25.8 ## 26.3 ## 25.7 ## 25.7 ## … ##
Acquisitions less disposals of valuables
Exports of goods and services 5,143.4 ## 5,547.3 ## 4,587.4 ## 4,596.3 ## 4,298.3 ## 4,328.9 ## … ##
Exports of goods 1,029.0 ## 1,164.1 ## 0.0 ## …Exports of services 4,114.4 ## 4,382.9 ## 0.0 ## …
Less: Imports of goods and services 5,522.2
##6,048.1
##6,174.6
##5,874.3
##5,770.4
##5,736.6
##…
##
Imports of goods 3,689.0 ## 4,069.8 ## 0.0 ## …Imports of services 1,833.2 ## 1,978.3 ## 0.0 ## …
Plus: Statistical discrepancy 138.9 ## 178.7 ## 243.3 ## 186.2 ## -119.5 ## -171.3 ## … ##
GROSS DOMESTIC PRODUCT 12,423.2 ## 12,006.1 ## 11,768.9 ## 11,696.9 1 11,802.2 1 11,752.4 0 … ##1 Discrepancy between components and total.
Table 4.6 Barbados: Gross domestic product by expenditures at current prices
Millions of Barbados dollars
Item Description 2009 2010 2011 2012 2013 2014 P 2015
Final consumption expenditure 7,998.2 ## 7,926.0 ## 8,417.6 ## 8,313.7 ## 8,362.0 ## 8,742.2 ## … ##
Household final consumption expenditure 6,207.1
##6,257.0
##6,654.9
##6,949.3
##7,020.0
##7,475.3
##…
##
NPISHs final consumption expenditureGeneral government final consumption expenditure 1,791.1
##1,669.0
##1,762.7
##1,364.4
##1,342.0
##1,266.9
##…
##
Individual consumption expenditureCollective consumption expenditure
Gross capital formation 1,381.9 ## 1,206.3 ## 1,295.8 ## 1,204.2 ## 1,138.2 ## 1,132.9 ## … ##
Gross fixed capital formation 1,364.6 ## 1,189.2 ## 1,276.7 ## 1,184.7 ## 1,119.2 ## 1,113.9 ## … ##
Changes in inventories 17.3 ## 17.1 ## 19.1 ## 19.5 ## 19.0 ## 19.0 ## … ##
Acquisitions less disposals of valuables
Exports of goods and services 3,809.9 ## 4,109.1 ## 3,398.1 ## 3,404.7 ## 3,183.9 ## 3,206.6 ## … ##
Exports of goods 762.2 ## 862.3 ## …Exports of services 3,047.7 ## 3,246.6 ## …
Less: Imports of goods and services 4,090.5
##4,480.1
##4,573.8
##4,351.3
##4,274.4
##4,249.3
##…
##
Imports of goods 2,732.6 ## 3,014.7 ## …Imports of services 1,357.9 ## 1,465.4 ## …
Plus: Statistical discrepancy 102.9 ## 132.4 ## 180.2 ## 137.9 ## -88.5 ## -126.9 ## … ##
GROSS DOMESTIC PRODUCT 9,202.4 ## 8,893.4 ## 8,717.7 ## 8,664.4 1 8,742.4 1 8,705.5 ## … ##1 Discrepancy between components and total.
25

THIS PAGE WAS INTENTIONALLY LEFT BLANK
26


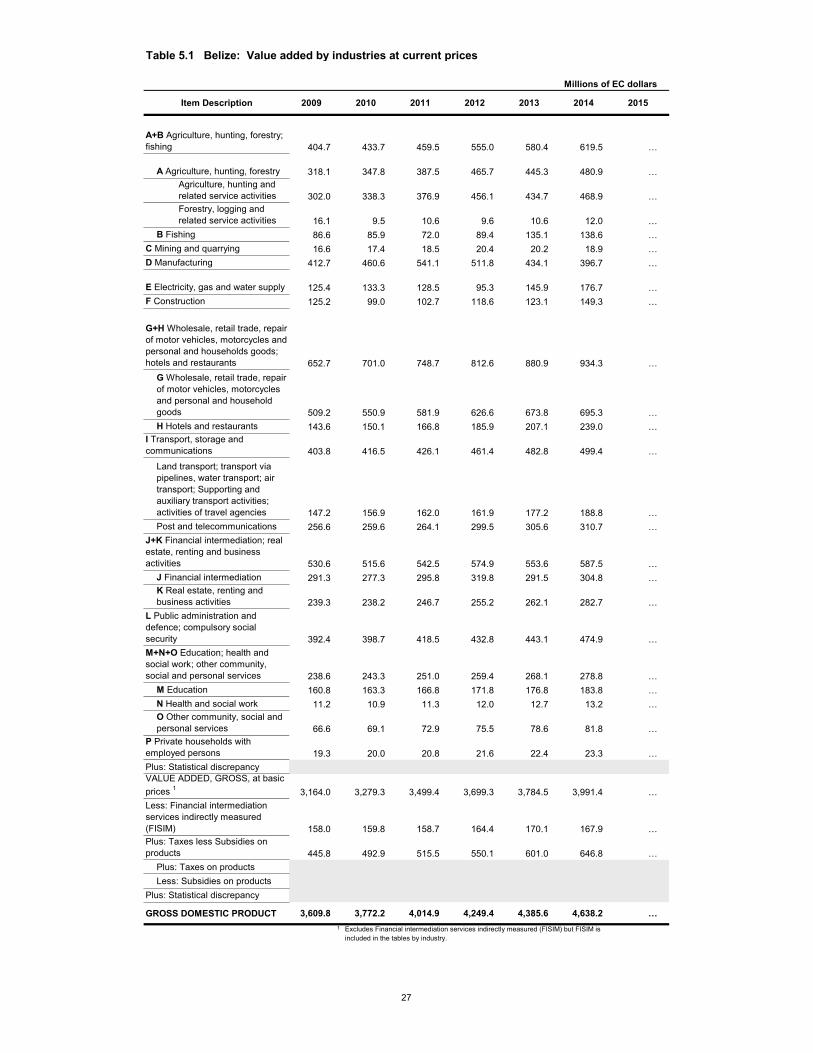
Table 5.1 Belize: Value added by industries at current prices
Millions of EC dollars
Item Description 2009 2010 2011 2012 2013 2014 2015
A+B Agriculture, hunting, forestry; fishing 404.7
0433.7
0459.5
0555.0
0580.4
0619.5
0…
0
A Agriculture, hunting, forestry 318.10
347.80
387.50
465.70
445.30
480.90
…0
Agriculture, hunting and related service activities 302.0
0338.3
0376.9
0456.1
0434.7
0468.9
0…
0
Forestry, logging and related service activities 16.1
09.5
010.6
09.6
010.6
012.0
0…
0
B Fishing 86.6 0 85.9 0 72.0 0 89.4 0 135.1 0 138.6 0 … 0
C Mining and quarrying 16.6 0 17.4 0 18.5 0 20.4 0 20.2 0 18.9 0 … 0
D Manufacturing 412.7 0 460.6 0 541.1 0 511.8 0 434.1 0 396.7 0 … 0
E Electricity, gas and water supply 125.40
133.30
128.50
95.30
145.90
176.70
…0
F Construction 125.2 0 99.0 0 102.7 0 118.6 0 123.1 0 149.3 0 … 0
G+H Wholesale, retail trade, repair of motor vehicles, motorcycles and personal and households goods; hotels and restaurants 652.7
0
701.0
0
748.7
0
812.6
0
880.9
0
934.3
0
…
0
G Wholesale, retail trade, repair of motor vehicles, motorcycles and personal and household goods 509.2
0
550.9
0
581.9
0
626.6
0
673.8
0
695.3
0
…
0
H Hotels and restaurants 143.6 0 150.1 0 166.8 0 185.9 0 207.1 0 239.0 0 … 0
I Transport, storage and communications 403.8
0416.5
0426.1
0461.4
0482.8
0499.4
0…
0
Land transport; transport via pipelines, water transport; air transport; Supporting and auxiliary transport activities; activities of travel agencies 147.2
0
156.9
0
162.0
0
161.9
0
177.2
0
188.8
0
…
0
Post and telecommunications 256.6 0 259.6 0 264.1 0 299.5 0 305.6 0 310.7 0 … 0
J+K Financial intermediation; real estate, renting and business activities 530.6
0
515.60
542.50
574.90
553.60
587.50
…0
J Financial intermediation 291.3 0 277.3 0 295.8 0 319.8 0 291.5 0 304.8 0 … 0
K Real estate, renting and business activities 239.3
0238.2
0246.7
0255.2
0262.1
0282.7
0…
0
L Public administration and defence; compulsory social security 392.4
0
398.70
418.50
432.80
443.10
474.90
…0
M+N+O Education; health and social work; other community, social and personal services 238.6
0
243.30
251.00
259.40
268.10
278.80
…0
M Education 160.8 0 163.3 0 166.8 0 171.8 0 176.8 0 183.8 0 … 0
N Health and social work 11.2 0 10.9 0 11.3 0 12.0 0 12.7 0 13.2 0 … 0
O Other community, social and personal services 66.6
069.1
072.9
075.5
078.6
081.8
0…
0
P Private households with employed persons 19.3
020.0
020.8
021.6
022.4
023.3
0…
0
Plus: Statistical discrepancyVALUE ADDED, GROSS, at basic prices 1 3,164.0 3,279.3 3,499.4 3,699.3 3,784.5 3,991.4 …Less: Financial intermediation services indirectly measured (FISIM) 158.0
0
159.80
158.70
164.40
170.10
167.90
…0
Plus: Taxes less Subsidies on products 445.8
0492.9
0515.5
0550.1
0601.0
0646.8
0…
0
Plus: Taxes on productsLess: Subsidies on products
Plus: Statistical discrepancy
GROSS DOMESTIC PRODUCT 3,609.8 0 3,772.2 0 4,014.9 0 4,249.4 0 4,385.6 0 4,638.2 0 … 0
1 Excludes Financial intermediation services indirectly measured (FISIM) but FISIM is included in the tables by industry.
27

Table 5.2 Belize: Value added by industries at constant 2000 prices
Millions of EC dollars
Item Description 2009 2010 2011 2012 2013 2014 2015
A+B Agriculture, hunting, forestry; fishing 431.6
0461.2
0441.2
0471.3
0497.8
0510.8
0…
0
A Agriculture, hunting, forestry 283.80
321.20
305.90
337.30
332.90
336.70
…0
Agriculture, hunting and related service activities 270.0
0313.4
0297.9
0330.2
0325.8
0329.7
0…
0
Forestry, logging and related service activities 13.8
07.8
07.9
07.1
07.0
07.0
0…
0
B Fishing 147.9 0 140.1 0 135.3 0 134.0 0 164.9 0 174.1 0 … 0
C Mining and quarrying 14.8 0 15.5 0 16.1 0 17.5 0 16.5 0 14.2 0 … 0
D Manufacturing 440.2 0 404.1 0 393.6 0 363.9 0 293.3 0 271.3 0 … 0
E Electricity, gas and water supply 143.30
174.00
168.00
156.30
172.00
178.50
…0
F Construction 95.9 0 72.2 0 70.3 0 81.0 0 84.4 0 101.7 0 … 0
G+H Wholesale, retail trade, repair of motor vehicles, motorcycles and personal and households goods; hotels and restaurants 538.9
0
588.9
0
622.0
0
663.2
0
704.3
0
731.7
0
…
0
G Wholesale, retail trade, repair of motor vehicles, motorcycles and personal and household goods 433.5
0
479.6
0
510.7
0
539.7
0
570.1
0
584.3
0
…
0
H Hotels and restaurants 105.4 0 109.4 0 111.2 0 123.5 0 134.2 0 147.4 0 … 0
I Transport, storage and communications 330.8
0346.5
0351.3
0369.1
0385.7
0384.2
0…
0
Land transport; transport via pipelines, water transport; air transport; Supporting and auxiliary transport activities; activities of travel agencies 96.0
0
103.4
0
101.1
0
105.3
0
112.3
0
120.0
0
…
0
Post and telecommunications 234.8 0 243.1 0 250.2 0 263.9 0 273.4 0 264.2 0 … 0
J+K Financial intermediation; real estate, renting and business activities 568.8
0
582.90
581.50
575.20
555.90
580.30
…0
J Financial intermediation 369.3 0 385.7 0 379.5 0 368.7 0 344.6 0 356.1 0 … 0
K Real estate, renting and business activities 199.5
0197.2
0202.0
0206.5
0211.3
0224.2
0…
0
L Public administration and defence; compulsory social security 298.7
0
300.40
297.70
316.80
308.20
336.50
…0
M+N+O Education; health and social work; other community, social and personal services 161.4
0
163.60
167.40
171.70
174.20
172.70
…0
M Education 97.2 0 98.3 0 100.5 0 103.1 0 103.9 0 102.9 0 … 0
N Health and social work 9.5 0 9.3 0 9.5 0 9.8 0 10.0 0 9.9 0 … 0
O Other community, social and personal services 54.7
056.0
057.4
058.9
060.4
059.8
0…
0
P Private households with employed persons 15.2
015.6
015.9
016.3
016.9
016.7
0…
0
Plus: Statistical discrepancyVALUE ADDED, GROSS, at basic prices 1 2,835.7 2,900.2 2,919.9 3,009.5 3,017.1 3,106.4 …Less: Financial intermediation services indirectly measured (FISIM) 203.8
0
224.90
205.20
192.70
192.20
192.10
…0
Plus: Taxes less Subsidies on products 363.9
0405.8
0455.6
0495.1
0541.0
0589.1
0…
0
Plus: Taxes on products Less: Subsidies on products
Plus: Statistical discrepancy
GROSS DOMESTIC PRODUCT 3,199.6 0 3,306.0 0 3,375.5 0 3,504.6 0 3,558.1 0 3,695.6 0 … 0
1 Excludes Financial intermediation services indirectly measured (FISIM) but FISIM is included in the tables by industry.
28

Table 5.3 Belize: Value added by industries at current prices
Millions of Belize dollars
Item Description 2009 2010 2011 2012 2013 2014 2015
A+B Agriculture, hunting, forestry; fishing 299.8
0321.2
0340.4
0411.1
0429.9
0458.9
0…
0
A Agriculture, hunting, forestry 235.6 0 257.6 0 287.0 0 345.0 0 329.9 0 356.2 0 … 0
Agriculture, hunting and related service activities 223.7
0250.6
0279.2
0337.9
0322.0
0347.3
0…
0
Forestry, logging and related service activities 11.9
07.0
07.9
07.1
07.9
08.9
0…
0
B Fishing 64.2 0 63.6 0 53.4 0 66.2 0 100.1 0 102.7 0 … 0
C Mining and quarrying 12.3 0 12.9 0 13.7 0 15.1 0 15.0 0 14.0 0 … 0
D Manufacturing 305.7 0 341.2 0 400.8 0 379.1 0 321.6 0 293.9 0 … 0
E Electricity, gas and water supply 92.90
98.80
95.20
70.60
108.10
130.90
…0
F Construction 92.8 0 73.3 0 76.1 0 87.8 0 91.2 0 110.6 0 … 0
G+H Wholesale, retail trade, repair of motor vehicles, motorcycles and personal and households goods; hotels and restaurants 483.5
0
519.3
0
554.6
0
601.9
0
652.5
0
692.1
0
…
0
G Wholesale, retail trade, repair of motor vehicles, motorcycles and personal and household goods 377.2
0
408.1
0
431.0
0
464.2
0
499.1
0
515.0
0
…
0
H Hotels and restaurants 106.3 0 111.2 0 123.6 0 137.7 0 153.4 0 177.1 0 … 0
I Transport, storage and communications 299.1
0308.5
0315.6
0341.7
0357.6
0370.0
0…
0
Land transport; transport via pipelines, water transport; air transport; Supporting and auxiliary transport activities; activities of travel agencies 109.0
0
116.2
0
120.0
0
119.9
0
131.3
0
139.8
0
…
0
Post and telecommunications 190.1 0 192.3 0 195.6 0 221.8 0 226.4 0 230.1 0 … 0
J+K Financial intermediation; real estate, renting and business activities 393.0
0
381.90
401.90
425.90
410.10
435.20
…0
J Financial intermediation 215.7 0 205.4 0 219.1 0 236.9 0 215.9 0 225.8 0 … 0
K Real estate, renting and business activities 177.3
0176.5
0182.7
0189.0
0194.1
0209.4
0…
0
L Public administration and defence; compulsory social security 290.7
0
295.30
310.00
320.60
328.30
351.80
…0
M+N+O Education; health and social work; other community, social and personal services 176.7
0
180.30
185.90
192.10
198.60
206.50
…0
M Education 119.1 0 121.0 0 123.6 0 127.3 0 131.0 0 136.2 0 … 0
N Health and social work 8.3 0 8.1 0 8.3 0 8.9 0 9.4 0 9.8 0 … 0
O Other community, social and personal services 49.3
051.2
054.0
056.0
058.2
060.6
0…
0
P Private households with employed persons 14.3
014.8
015.4
016.0
016.6
017.3
0…
0
Plus: Statistical discrepancyVALUE ADDED, GROSS, at basic prices 1 2,343.7 2,429.1 2,592.2 2,740.2 2,803.4 2,956.6 …Less: Financial intermediation services indirectly measured (FISIM) 117.0
0
118.40
117.50
121.80
126.00
124.40
…0
Plus: Taxes less Subsidies on products 330.2
0365.1
0381.8
0407.5
0445.2
0479.1
0…
0
Plus: Taxes on productsLess: Subsidies on products
Plus: Statistical discrepancy
GROSS DOMESTIC PRODUCT 2,673.9 0 2,794.2 0 2,974.0 0 3,147.7 0 3,248.6 0 3,435.7 0 … 0
1 Excludes Financial intermediation services indirectly measured (FISIM) but FISIM is included in the tables by industry.
29

Table 5.4 Belize: Value added by industries at constant 2000 prices
Millions of Belize dollars
Item Description 2009 2010 2011 2012 2013 2014 2015
A+B Agriculture, hunting, forestry; fishing 319.7
0341.7
0326.8
0349.1
0368.7
0378.3
0…
0
A Agriculture, hunting, forestry 210.20
237.90
226.60
249.80
246.60
249.40
…0
Agriculture, hunting and related service activities 200.0 0 232.1 0 220.7 0 244.6 0 241.4 0 244.2 0 … 0
Forestry, logging and related service activities 10.2
05.8
05.9
05.3
05.2
05.2
0…
0
B Fishing 109.5 0 103.7 0 100.2 0 99.3 0 122.2 0 128.9 0 … 0
C Mining and quarrying 11.0 0 11.5 0 11.9 0 13.0 0 12.2 0 10.5 0 … 0
D Manufacturing 326.0 0 299.3 0 291.6 0 269.5 0 217.3 0 201.0 0 … 0
E Electricity, gas and water supply 106.10
128.90
124.40
115.80
127.40
132.20
…0
F Construction 71.1 0 53.5 0 52.1 0 60.0 0 62.5 0 75.4 0 … 0
G+H Wholesale, retail trade, repair of motor vehicles, motorcycles and personal and households goods; hotels and restaurants 399.2
0
436.2
0
460.7
0
491.2
0
521.7
0
542.0
0
…
0
G Wholesale, retail trade, repair of motor vehicles, motorcycles and personal and household goods 321.1
0
355.2
0
378.3
0
399.8
0
422.3
0
432.8
0
…
0
H Hotels and restaurants 78.1 0 81.0 0 82.4 0 91.5 0 99.4 0 109.2 0 … 0
I Transport, storage and communications 245.0
0256.7
0260.2
0273.4
0285.7
0284.6
0…
0
Land transport; transport via pipelines, water transport; air transport; Supporting and auxiliary transport activities; activities of travel agencies 71.1
0
76.6
0
74.9
0
78.0
0
83.2
0
88.9
0
…
0
Post and telecommunications 173.9 0 180.1 0 185.3 0 195.5 0 202.5 0 195.7 0 … 0
J+K Financial intermediation; real estate, renting and business activities 421.3
0
431.80
430.70
426.00
411.70
429.80
…0
J Financial intermediation 273.6 0 285.7 0 281.1 0 273.1 0 255.2 0 263.8 0 … 0
K Real estate, renting and business activities 147.7
0146.1
0149.6
0152.9
0156.5
0166.1
0…
0
L Public administration and defence; compulsory social security 221.2
0
222.50
220.50
234.60
228.30
249.30
…0
M+N+O Education; health and social work; other community, social and personal services 119.5
0
121.20
124.00
127.20
129.10
127.90
…0
M Education 72.0 0 72.8 0 74.4 0 76.4 0 76.9 0 76.2 0 … 0
N Health and social work 7.1 0 6.9 0 7.0 0 7.2 0 7.4 0 7.4 0 … 0
O Other community, social and personal services 40.5
041.5
042.6
043.6
044.7
044.3
0…
0
P Private households with employed persons 11.2
011.5
011.8
012.1
012.5
012.4
0…
0
Plus: Statistical discrepancyVALUE ADDED, GROSS, at basic prices 1 2,100.5 2,148.3 2,162.9 2,229.3 2,234.9 2,301.1 …Less: Financial intermediation services indirectly measured (FISIM) 151.0
0
166.60
152.00
142.80
142.30
142.30
…0
Plus: Taxes less Subsidies on products 269.6
0300.6
0337.5
0366.8
0400.8
0436.4
0…
0
Plus: Taxes on productsLess: Subsidies on products
Plus: Statistical discrepancy
GROSS DOMESTIC PRODUCT 2,370.1 0 2,448.9 0 2,500.4 0 2,596.0 0 2,635.6 0 2,737.5 0 … 0
1 Excludes Financial intermediation services indirectly measured (FISIM) but FISIM is included in the tables by industry.
30

Table 5.5 Belize: Gross domestic product by expenditures at current prices
Millions of EC dollars
Item Description 2009 2010 2011 2012 2013 2014 2015
Final consumption expenditure 3,113.3 ## 3,249.1 ## 3,440.9 ## 3,604.0 ## 3,806.3 ## 3,933.4 ## … ##
Household final consumption expenditure 2,539.2
##2,647.6
##2,821.6
##2,967.4
##3,142.5
##3,238.8
##…
##
NPISHs final consumption expenditureGeneral government final consumption expenditure 574.1
##601.5
##619.3
##636.6
##663.8
##694.7
##…
##
Individual consumption expenditureCollective consumption expenditure
Gross capital formation 688.6 ## 498.8 ## 683.3 ## 680.0 ## 796.2 ## 969.6 ## … ##
Gross fixed capital formation 690.8 ## 576.8 ## 616.3 ## 682.7 ## 782.8 ## 912.9 ## … ##
Changes in inventories -2.2 ## -78.0 ## 67.0 ## -2.6 ## 13.4 ## 56.8 ## … ##
Acquisitions less disposals of valuables
Exports of goods and services 1,863.5 ## 2,195.9 ## 2,412.7 ## 2,653.9 ## 2,668.8 ## 2,786.2 ## … ##
Exports of goodsExports of services
Less: Imports of goods and services 2,029.5
##2,168.0
##2,533.6
##2,673.8
##2,908.5
##3,039.4
##…
##
Imports of goodsImports of services
Plus: Statistical discrepancy -26.1 ## -3.7 ## 11.6 ## -14.7 ## 22.9 ## -11.7 ## … ##
GROSS DOMESTIC PRODUCT 3,609.8 ## 3,772.2 ## 4,014.9 ## 4,249.4 ## 4,385.6 ## 4,638.2 ## … ##
Table 5.6 Belize: Gross domestic product by expenditures at constant 2000 prices
Millions of EC dollars
Item Description 2009 2010 2011 2012 2013 2014 2015
Final consumption expenditure 2,474.1 ## 2,607.1 ## 2,700.7 ## 2,801.4 ## 2,935.7 ## 2,972.4 ## … ##
Household final consumption expenditure 2,032.2
##2,148.2
##2,248.4
##2,329.7
##2,460.6
##2,471.4
##…
##
NPISHs final consumption expenditureGeneral government final consumption expenditure 441.9
##458.9
##452.3
##471.7
##475.0
##501.0
##…
##
Individual consumption expenditureCollective consumption expenditure
Gross capital formation 554.3 ## 352.6 ## 489.6 ## 465.2 ## 561.6 ## 690.4 ## … ##
Gross fixed capital formation 549.2 ## 432.7 ## 430.6 ## 470.9 ## 552.0 ## 634.9 ## … ##
Changes in inventories 5.1 ## -80.1 ## 59.1 ## -5.7 ## 9.6 ## 55.6 ## … ##
Acquisitions less disposals of valuables
Exports of goods and services 1,808.7 ## 2,062.2 ## 2,072.1 ## 2,251.5 ## 2,246.9 ## 2,304.9 ## … ##
Exports of goodsExports of services
Less: Imports of goods and services 1,524.2
##1,681.6
##1,879.4
##1,963.8
##2,153.3
##2,277.7
##…
##
Imports of goodsImports of services
Plus: Statistical discrepancy -113.2 ## -34.4 ## -7.5 ## -49.7 ## -32.8 ## 5.5 ## … ##
GROSS DOMESTIC PRODUCT 3,199.6 ## 3,306.0 ## 3,375.5 ## 3,504.6 ## 3,558.1 ## 3,695.6 ## … ##
31

Table 5.7 Belize: Gross domestic product by expenditures at current prices
Millions of Belize dollars
Item Description 2009 2010 2011 2012 2013 2014 2015
Final consumption expenditure 2,306.2 ## 2,406.8 ## 2,548.8 ## 2,669.7 ## 2,819.5 ## 2,913.6 ## … ##
Household final consumption expenditure 1,880.9
##1,961.2
##2,090.1
##2,198.1
##2,327.8
##2,399.1
##…
##
NPISHs final consumption expenditureGeneral government final consumption expenditure 425.3
##445.6
##458.8
##471.6
##491.7
##514.6
##…
##
Individual consumption expenditureCollective consumption expenditure
Gross capital formation 510.1 ## 369.5 ## 506.1 ## 503.7 ## 589.8 ## 718.3 ## … ##
Gross fixed capital formation 511.7 ## 427.2 ## 456.5 ## 505.7 ## 579.8 ## 676.2 ## … ##
Changes in inventories -1.7 ## -57.8 ## 49.6 ## -1.9 ## 9.9 ## 42.0 ## … ##
Acquisitions less disposals of valuables
Exports of goods and services 1,380.4 ## 1,626.6 ## 1,787.2 ## 1,965.9 ## 1,976.9 ## 2,063.9 ## … ##
Exports of goodsExports of services
Less: Imports of goods and services 1,503.4
##1,605.9
##1,876.7
##1,980.6
##2,154.5
##2,251.4
##…
##
Imports of goodsImports of services
Plus: Statistical discrepancy -19.3 ## -2.7 ## 8.6 ## -10.9 ## 17.0 ## -8.7 ## … ##
GROSS DOMESTIC PRODUCT 2,673.9 ## 2,794.2 ## 2,974.0 ## 3,147.7 ## 3,248.6 ## 3,435.7 ## … ##
Table 5.8 Belize: Gross domestic product by expenditures at constant 2000 prices
Millions of Belize dollars
Item Description 2009 2010 2011 2012 2013 2014 2015
Final consumption expenditure 1,832.6 ## 1,931.2 ## 2,000.6 ## 2,075.1 ## 2,174.6 ## 2,201.8 ## … ##
Household final consumption expenditure 1,505.3
##1,591.3
##1,665.5
##1,725.7
##1,822.7
##1,830.7
##…
##
NPISHs final consumption expenditureGeneral government final consumption expenditure 327.3
##339.9
##335.1
##349.4
##351.9
##371.1
##…
##
Individual consumption expenditureCollective consumption expenditure
Gross capital formation 410.6 ## 261.2 ## 362.7 ## 344.6 ## 416.0 ## 511.4 ## … ##
Gross fixed capital formation 406.8 ## 320.5 ## 318.9 ## 348.8 ## 408.9 ## 470.3 ## … ##
Changes in inventories 3.8 ## -59.3 ## 43.7 ## -4.2 ## 7.1 ## 41.2 ## … ##
Acquisitions less disposals of valuables
Exports of goods and services 1,339.8 ## 1,527.5 ## 1,534.9 ## 1,667.8 ## 1,664.4 ## 1,707.4 ## … ##
Exports of goodsExports of services
Less: Imports of goods and services 1,129.1
##1,245.6
##1,392.2
##1,454.6
##1,595.0
##1,687.2
##…
##
Imports of goodsImports of services
Plus: Statistical discrepancy -83.9 ## -25.5 ## -5.6 ## -36.8 ## -24.3 ## 4.1 ## … ##
GROSS DOMESTIC PRODUCT 2,370.1 ## 2,448.9 ## 2,500.4 ## 2,596.0 ## 2,635.6 ## 2,737.5 ## … ##
32
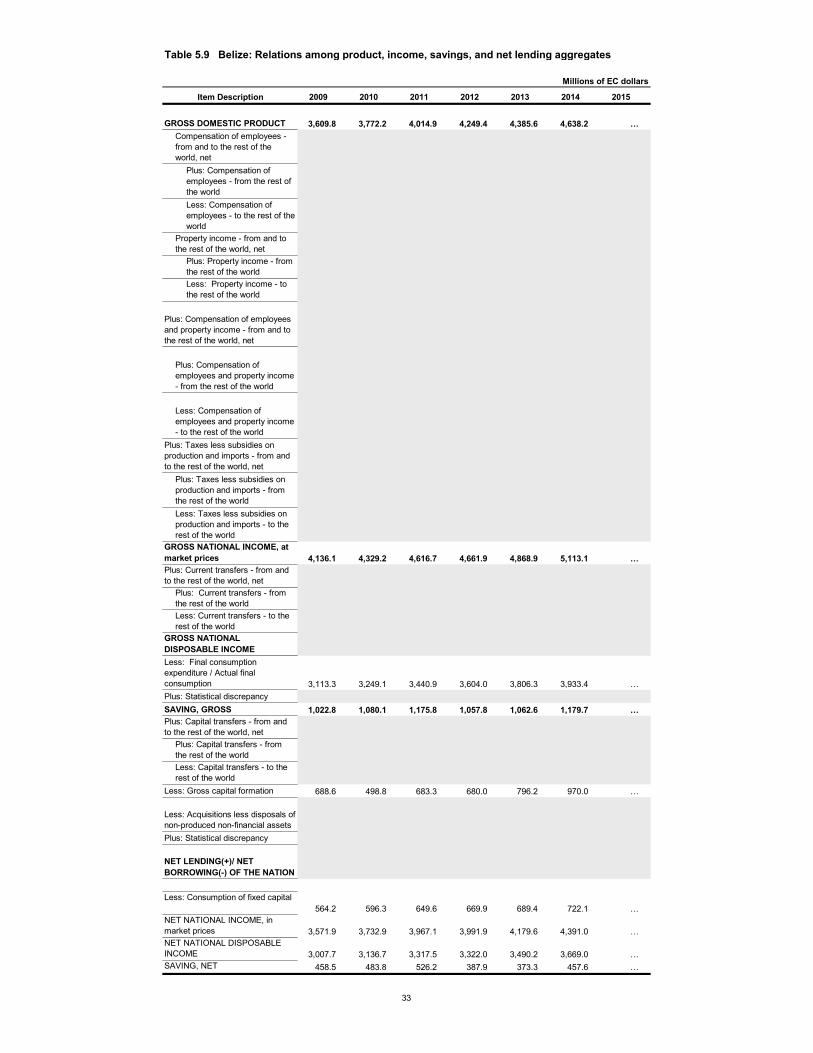
Table 5.9 Belize: Relations among product, income, savings, and net lending aggregates
Millions of EC dollars
Item Description 2009 2010 2011 2012 2013 2014 2015
GROSS DOMESTIC PRODUCT 3,609.8 3,772.2 4,014.9 4,249.4 4,385.6 4,638.2 …Compensation of employees - from and to the rest of the world, net
Plus: Compensation of employees - from the rest of the worldLess: Compensation of employees - to the rest of the world
Property income - from and to the rest of the world, net
Plus: Property income - from the rest of the worldLess: Property income - to the rest of the world
Plus: Compensation of employees and property income - from and to the rest of the world, net
Plus: Compensation of employees and property income - from the rest of the world
Less: Compensation of employees and property income - to the rest of the world
Plus: Taxes less subsidies on production and imports - from and to the rest of the world, net
Plus: Taxes less subsidies on production and imports - from the rest of the worldLess: Taxes less subsidies on production and imports - to the rest of the world
GROSS NATIONAL INCOME, at market prices 4,136.1 4,329.2 4,616.7 4,661.9 4,868.9 5,113.1 …Plus: Current transfers - from and to the rest of the world, net
Plus: Current transfers - from the rest of the worldLess: Current transfers - to the rest of the world
GROSS NATIONAL DISPOSABLE INCOMELess: Final consumption expenditure / Actual final consumption 3,113.3 3,249.1 3,440.9 3,604.0 3,806.3 3,933.4 …Plus: Statistical discrepancySAVING, GROSS 1,022.8 1,080.1 1,175.8 1,057.8 1,062.6 1,179.7 …Plus: Capital transfers - from and to the rest of the world, net
Plus: Capital transfers - from the rest of the worldLess: Capital transfers - to the rest of the world
Less: Gross capital formation 688.6 498.8 683.3 680.0 796.2 970.0 …
Less: Acquisitions less disposals of non-produced non-financial assetsPlus: Statistical discrepancy
NET LENDING(+)/ NET BORROWING(-) OF THE NATION
Less: Consumption of fixed capital564.2 596.3 649.6 669.9 689.4 722.1 …
NET NATIONAL INCOME, in market prices 3,571.9 3,732.9 3,967.1 3,991.9 4,179.6 4,391.0 …NET NATIONAL DISPOSABLE INCOME 3,007.7 3,136.7 3,317.5 3,322.0 3,490.2 3,669.0 …SAVING, NET 458.5 483.8 526.2 387.9 373.3 457.6 …
33

Table 5.10 Belize: Relations among product, income, savings, and net lending aggregates
Millions of Belize dollars
Item Description 2009 2010 2011 2012 2013 2014 2015
GROSS DOMESTIC PRODUCT 2,673.9 2,794.2 2,974.0 3,147.7 3,248.6 3,435.7 ...Compensation of employees - from and to the rest of the world, net
Plus: Compensation of employees - from the rest of the worldLess: Compensation of employees - to the rest of the world
Property income - from and to the rest of the world, net
Plus: Property income - from the rest of the worldLess: Property income - to the rest of the world
Plus: Compensation of employees and property income - from and to the rest of the world, net
Plus: Compensation of employees and property income - from the rest of the world
Less: Compensation of employees and property income - to the rest of the world
Plus: Taxes less subsidies on production and imports - from and to the rest of the world, net
Plus: Taxes less subsidies on production and imports - from the rest of the worldLess: Taxes less subsidies on production and imports - to the rest of the world
GROSS NATIONAL INCOME, at market prices 3,063.8 3,206.8 3,419.8 3,453.2 3,606.6 3,787.5 ...Plus: Current transfers - from and to the rest of the world, net
Plus: Current transfers - from the rest of the worldLess: Current transfers - to the rest of the world
GROSS NATIONAL DISPOSABLE INCOMELess: Final consumption expenditure / Actual final consumption 2,306.2 2,406.8 2,548.8 2669.66 2819.47 2913.6 ...Plus: Statistical discrepancySAVING, GROSS 757.6 800.1 871.0 783.6 787.1 873.8 ...Plus: Capital transfers - from and to the rest of the world, net
Plus: Capital transfers - from the rest of the worldLess: Capital transfers - to the rest of the world
Less: Gross capital formation 510.1 369.5 506.1 503.7 589.8 718.5 ...
Less: Acquisitions less disposals of non-produced non-financial assetsPlus: Statistical discrepancy
NET LENDING(+)/ NET BORROWING(-) OF THE NATION
Less: Consumption of fixed capital417.9 441.7 481.2 496.2 510.6 534.9 ...
NET NATIONAL INCOME, in market prices 2,645.8 2,765.1 2,938.6 2,957.0 3,096.0 3,252.6 ...NET NATIONAL DISPOSABLE INCOME 2,227.9 2,323.5 2,457.4 2,460.8 2,585.3 2,717.8 ...SAVING, NET 339.7 358.4 389.8 287.3 276.5 339.0 ...
34


Table 6.1 Dominica: Value added by industries at current prices
Millions of EC dollars
Item Description 2009 2010 2011 2012 2013 2014 2015 Pl
A+B Agriculture, hunting, forestry; fishing 165.7
0152.9
0169.1
0157.7
0187.8
0189.7
0181.4
0
A Agriculture, hunting, forestry 161.80
149.60
164.90
153.70
184.00
184.00
174.80
Agriculture, hunting and related service activities 158.4
0146.1
0161.4
0150.2
0180.5
0180.5
0171.2
0
Forestry, logging and related service activities 3.4
03.5
03.5
03.5
03.5
03.5
03.6
0
B Fishing 4.0 0 3.3 0 4.2 0 4.1 0 3.9 0 5.8 0 6.6 0
C Mining and quarrying 15.3 0 16.5 0 19.0 0 14.8 0 16.2 0 15.3 0 14.2 0
D Manufacturing 30.6 0 31.5 0 35.9 0 40.4 0 41.6 0 42.7 0 38.9 0
E Electricity, gas and water supply 47.80
51.90
57.20
56.80
56.00
58.30
55.20
F Construction 56.3 0 56.2 0 61.5 0 55.3 0 51.9 0 58.4 0 47.3 0
G+H Wholesale, retail trade, repair of motor vehicles, motorcycles and personal and households goods; hotels and restaurants 174.4
0
184.9
0
191.2
0
181.3
0
189.0
0
196.6
0
182.8
0
G Wholesale, retail trade, repair of motor vehicles, motorcycles and personal and household goods 154.4
0
163.6
0
167.4
0
157.3
0
164.5
0
170.9
0
159.2
0
H Hotels and restaurants 20.0 0 21.3 0 23.9 0 24.0 0 24.6 0 25.7 0 23.6 0
I Transport, storage and communications 185.3
0151.6
0158.3
0161.0
0166.9
0167.5
0161.1
0
Land transport; transport via pipelines, water transport; air transport; Supporting and auxiliary transport activities; activities of travel agencies 112.9
0
94.7
0
98.3
0
98.0
0
100.4
0
100.9
0
93.9
0
Post and telecommunications 72.4 0 56.9 0 59.9 0 63.1 0 66.5 0 66.6 0 67.2 0
J+K Financial intermediation; real estate, renting and business activities 180.4
0
177.10
180.60
183.90
180.40
184.00
179.40
J Financial intermediation 77.2 0 73.2 0 76.2 0 78.7 0 74.8 0 77.1 0 74.2 0
K Real estate, renting and business activities 103.3
0103.8
0104.3
0105.2
0105.5
0107.0
0105.2
0
L Public administration and defence; compulsory social security 83.2
0
85.40
93.20
93.00
102.60
110.50
119.70
M+N+O Education; health and social work; other community, social and personal services 158.2
0
201.90
172.10
166.60
180.50
187.80
196.90
M Education 111.8 0 152.8 0 121.5 0 114.5 0 126.9 0 133.4 0 139.7 0
N Health and social work 35.3 0 37.5 0 38.8 0 40.1 0 42.4 0 43.1 0 45.8 0
O Other community, social and personal services 11.1
011.6
011.9
012.0
011.2
011.3
011.4
0
P Private households with employed persons 3.0
03.1
03.2
03.2
03.7
04.2
03.8
0
Plus: Statistical discrepancyVALUE ADDED, GROSS, at basic prices 1 1,087.9 1,099.2 1,127.2 1,095.8 1,159.6 1,199.0 1,165.5Less: Financial intermediation services indirectly measured (FISIM) 12.5
0
13.70
14.10
18.40
17.10
16.10
1.50
Plus: Taxes less Subsidies on products 232.6
0234.1
0225.5
0216.2
0213.3
0227.1
0231.0
0
Plus: Taxes on products 237.4 0 238.9 0 230.3 0 221.1 0 218.2 0 232.0 0 236.0 0
Less: Subsidies on products 4.7 0 4.8 0 4.8 0 4.9 0 4.9 0 5.0 0 5.0 0
Plus: Statistical discrepancy
GROSS DOMESTIC PRODUCT 1,320.5 0 1,333.3 0 1,352.7 0 1,312.0 0 1,372.8 0 1,426.1 0 1,396.5 0
1 Excludes Financial intermediation services indirectly measured (FISIM) but FISIM is included in the industry data.
35

Table 6.2 Dominica: Value added by industries at constant 2006 prices
Millions of EC dollars
Item Description 2009 2010 2011 2012 2013 2014 2015 Pl
A+B Agriculture, hunting, forestry; fishing 117.7
0107.9
0115.8
0124.9
0130.6
0130.4
0125.1
0
A Agriculture, hunting, forestry 113.20
104.20
111.70
121.30
127.20
125.40
119.30
Agriculture, hunting and related service activities 110.2
0101.2
0108.6
0118.3
0124.1
0122.3
0116.2
0
Forestry, logging and related service activities 3.0
03.0
03.0
03.0
03.1
03.1
03.1
0
B Fishing 4.5 0 3.7 0 4.1 0 3.5 0 3.4 0 5.0 0 5.8 0
C Mining and quarrying 9.7 0 9.2 0 10.1 0 9.8 0 10.4 0 9.9 0 8.6 0
D Manufacturing 35.8 0 35.3 0 33.2 0 35.1 0 36.2 0 36.8 0 33.6 0
E Electricity, gas and water supply 51.00
53.90
54.10
54.80
54.00
55.80
59.00
F Construction 52.6 0 55.0 0 55.7 0 49.7 0 45.7 0 49.9 0 39.8 0
G+H Wholesale, retail trade, repair of motor vehicles, motorcycles and personal and households goods; hotels and restaurants 159.0
0
160.5
0
167.8
0
161.0
0
167.1
0
177.2
0
166.1
0
G Wholesale, retail trade, repair of motor vehicles, motorcycles and personal and household goods 141.1
0
142.6
0
148.9
0
141.5
0
146.9
0
154.5
0
145.0
0
H Hotels and restaurants 17.8 0 17.9 0 18.9 0 19.5 0 20.2 0 22.7 0 21.0 0
I Transport, storage and communications 148.4
0146.7
0147.8
0145.9
0148.8
0146.5
0140.6
0
Land transport; transport via pipelines, water transport; air transport; Supporting and auxiliary transport activities; activities of travel agencies 83.8
0
82.7
0
84.6
0
84.0
0
86.8
0
85.0
0
78.6
0
Post and telecommunications 64.7 0 64.0 0 63.2 0 61.9 0 62.0 0 61.5 0 62.1 0
J+K Financial intermediation; real estate, renting and business activities 176.5
0
178.90
178.60
177.60
180.70
184.50
185.30
J Financial intermediation 74.3 0 76.4 0 75.7 0 74.3 0 76.9 0 80.1 0 82.8 0
K Real estate, renting and business activities 102.2
0102.5
0102.9
0103.3
0103.8
0104.4
0102.5
0
L Public administration and defence; compulsory social security 80.1
0
81.90
86.90
86.70
88.60
100.60
103.90
M+N+O Education; health and social work; other community, social and personal services 155.8
0
165.20
153.00
151.80
153.40
160.50
164.80
M Education 111.4 0 118.6 0 106.0 0 103.7 0 104.7 0 111.1 0 114.6 0
N Health and social work 34.1 0 36.1 0 36.4 0 37.7 0 38.6 0 39.3 0 39.9 0
O Other community, social and personal services 10.4
010.4
010.5
010.5
010.0
010.1
010.3
0
P Private households with employed persons 3.0
03.2
03.4
03.5
04.1
04.6
04.2
0
Plus: Statistical discrepancyVALUE ADDED, GROSS, at basic prices 1 977.4
0984.7
0993.0
0984.6
01,003.4
01,040.6
01,014.7
0
Less: Financial intermediation services indirectly measured (FISIM) 12.2
0
13.00
13.50
16.10
16.20
15.90
16.20
Plus: Taxes less Subsidies on products 209.0 209.7 198.7 194.3 184.5 197.1 201.1
Plus: Taxes on products Less: Subsidies on products
Plus: Statistical discrepancy
GROSS DOMESTIC PRODUCT 1,186.40
1,194.40
1,191.60
1,178.90
1,187.90
1,237.70
1,215.9 0
1 Excludes Financial intermediation services indirectly measured (FISIM) but FISIM is included in the industry data.
36

Table 6.3 Dominica: Gross domestic product by expenditures at current prices
Millions of EC dollars
Item Description 2009 2010 2011 2012 2013 2014 2015 Pl
Final consumption expenditure 1,379.2 ## 1,328.2 ## 1,335.0 ## 1,359.5 ## 1,321.0 ## 1,379.8 ## 1,370.3 ##
Household final consumption expenditure 1,152.1
##1,105.2
##1,100.0
##1,117.4
##1,053.8
##1,092.3
##1,058.6
##
NPISHs final consumption expenditureGeneral government final consumption expenditure 227.0
##223.1
##234.9
##242.0
##267.2
##287.6
##311.7
##
Individual consumption expenditureCollective consumption expenditure
Gross capital formation 255.9 ## 245.1 ## 224.4 ## 199.6 ## 187.4 ## 210.8 ## 170.6 ##
Gross fixed capital formation 255.9 ## 245.1 ## 224.4 ## 199.6 ## 187.4 ## 210.8 ## 170.6 ##
Changes in inventoriesAcquisitions less disposals of valuables
Exports of goods and services 399.5 ## 474.2 ## 508.3 ## 427.6 ## 522.4 ## 586.3 ## 571.8 ##
Exports of goods 99.4 ## 104.8 ## 90.4 ## 99.1 ## 103.6 ## 104.0 ## 87.3 ##
Exports of services 300.1 ## 369.4 ## 417.9 ## 328.5 ## 418.8 ## 482.3 ## 484.5 ##
Less: Imports of goods and services 714.1
##714.2
##715.0
##674.7
##657.9
##750.9
##716.1
##
Imports of goods 535.2 ## 531.7 ## 537.1 ## 495.0 ## 482.3 ## 547.1 ## 517.4 ##
Imports of services 178.9 ## 182.5 ## 177.9 ## 179.7 ## 175.6 ## 203.7 ## 198.7 ##
Plus: Statistical discrepancyGROSS DOMESTIC PRODUCT 1,320.5 ## 1,333.3 ## 1,352.7 ## 1,312.0 ## 1,372.8 ## 1,426.1 ## 1,396.5 ##
37

Table 6.4 Dominica: Relations among product, income, savings, and net lending aggregates
Millions of EC dollars
Item Description 2009 2010 2011 2012 2013 2014 2015 Pl
GROSS DOMESTIC PRODUCT 1,320.5 1,333.3 1,352.7 1,312.0 1,372.8 1,426.1 1,396.5Compensation of employees - from and to the rest of the world, net 2.9 3.1 2.2 2.5 3.2 3.2 3.3
Plus: Compensation of employees - from the rest of the world 2.9 3.1 2.2 2.5 3.2 3.2 3.3Less: Compensation of employees - to the rest of the world 0.0 0.0 0.0 0.0 0.0 0.0 0.0
Property income - from and to the rest of the world, net -39.7 -28.6 -30.7 -28.2 -55.8 -49.5 -50.4
Plus: Property income - from the rest of the world 14.9 13.4 11.1 10.4 10.1 9.5 9.8Less: Property income - to the rest of the world 54.6 41.9 41.8 38.7 65.9 59.1 60.2
Plus: Compensation of employees and property income - from and to the rest of the world, net -36.9 -25.5 -28.5 -25.7 -52.7 -46.3 -47.1
Plus: Compensation of employees and property income - from the rest of the world 17.7 16.5 13.3 12.9 13.2 12.8 13.1
Less: Compensation of employees and property income - to the rest of the world 54.6 41.9 41.8 38.7 65.9 59.1 60.2
Plus: Taxes less subsidies on production and imports - from and to the rest of the world, net
Plus: Taxes less subsidies on production and imports - from the rest of the worldLess: Taxes less subsidies on production and imports - to the rest of the world
GROSS NATIONAL INCOME, at market prices 1,283.6 1,307.8 1,324.2 1,286.2 1,320.1 1,379.8 1,349.4Plus: Current transfers - from and to the rest of the world, net 51.6 53.2 44.5 45.4 54.8 55.8 74.5
Plus: Current transfers - from the rest of the world 69.7 73.4 69.0 73.3 85.5 87.0 105.1Less: Current transfers - to the rest of the world 18.1 20.2 24.5 27.9 30.7 31.2 30.6
GROSS NATIONAL DISPOSABLE INCOME 1,335.2 1,361.1 1,368.7 1,331.6 1,375.0 1,435.6 1,424.0Less: Final consumption expenditure / Actual final consumption 1,379.2 1,328.2 1,335.0 1,359.5 1,321.0 1,379.8 1,370.3Plus: Statistical discrepancySAVING, GROSS -44.0 32.8 33.8 -27.9 54.0 55.8 53.7Plus: Capital transfers - from and to the rest of the world, net 118.8 90.4 51.3 43.7 21.1 85.5 79.8
Plus: Capital transfers - from the rest of the world 119.2 90.8 51.7 44.1 21.5 85.9 80.3Less: Capital transfers - to the rest of the world 0.4 0.4 0.4 0.4 0.5 0.5 0.4
Less: Gross capital formation 255.9 245.1 224.4 199.6 187.4 210.8 170.6
Less: Acquisitions less disposals of non-produced non-financial assets 0.0 0.0 0.0 0.0 0.0 0.0 0.0Plus: Statistical discrepancy
NET LENDING(+)/ NET BORROWING(-) OF THE NATION -181.2 -121.9 -139.3 -183.8 -112.3 -69.6 -37.1
Less: Consumption of fixed capital
NET NATIONAL INCOME, in market pricesNET NATIONAL DISPOSABLE INCOMESAVING, NET
38


Table 7.1 Grenada: Value added by industries at current prices
Millions of EC dollars
Item Description 2009 2010 2011 2012 2013 R 2014 R 2015 Pl
A+B Agriculture, hunting, forestry; fishing 96.3
094.0
093.5
0104.4
0110.0
0150.2
0202.3
0
A Agriculture, hunting, forestry 70.00
67.90
69.40
74.30
79.90
120.70
170.10
Agriculture, hunting and related service activities 66.6
064.4
065.8
070.5
075.9
0116.6
0166.0
0
Forestry, logging and related service activities 3.4
03.6
03.7
03.8
03.9
04.0
04.1
0
B Fishing 26.3 0 26.0 0 24.1 0 30.1 0 30.2 0 29.5 0 32.2 0
C Mining and quarrying 8.9 0 6.6 0 5.0 0 4.3 0 5.2 0 5.6 0 7.8 0
D Manufacturing 69.0 0 71.9 0 71.0 0 70.1 0 76.9 0 84.2 0 96.9 0
E Electricity, gas and water supply 79.60
80.70
80.30
86.30
86.80
91.30
86.90
F Construction 149.1 0 147.0 0 124.3 0 105.4 0 135.9 0 134.3 0 142.5 0
G+H Wholesale, retail trade, repair of motor vehicles, motorcycles and personal and households goods; hotels and restaurants 227.4
0
214.7
0
227.8
0
223.9
0
239.6
0
274.7
0
318.9
0
G Wholesale, retail trade, repair of motor vehicles, motorcycles and personal and household goods 136.3
0
142.6
0
148.1
0
153.0
0
158.5
0
162.7
0
182.5
0
H Hotels and restaurants 91.1 0 72.1 0 79.7 0 70.9 0 81.2 0 112.0 0 136.4 0
I Transport, storage and communications 258.5
0235.7
0233.4
0227.1
0237.2
0243.3
0252.1
0
Land transport; transport via pipelines, water transport; air transport; Supporting and auxiliary transport activities; activities of travel agencies 181.6
0
165.6
0
157.1
0
151.5
0
166.8
0
181.1
0
196.9
0
Post and telecommunications 76.9 0 70.1 0 76.3 0 75.6 0 70.4 0 62.3 0 55.2 0
J+K Financial intermediation; real estate, renting and business activities 382.7
0
374.90
371.50
389.00
382.30
389.20
395.70
J Financial intermediation 138.0 0 130.0 0 117.9 0 134.6 0 124.4 0 122.0 0 129.8 0
K Real estate, renting and business activities 244.8
0244.9
0253.6
0254.5
0257.8
0267.2
0265.9
0
L Public administration and defence; compulsory social security 141.6
0
148.90
153.40
161.80
175.30
178.10
165.40
M+N+O Education; health and social work; other community, social and personal services 421.2
0
430.30
448.90
500.80
532.70
575.80
605.90
M Education 345.5 0 350.0 0 368.9 0 419.3 0 445.6 0 484.1 0 516.6 0
N Health and social work 39.5 0 45.0 0 46.7 0 46.6 0 51.7 0 52.9 0 49.7 0
O Other community, social and personal services 36.2
035.3
033.3
035.0
035.4
038.8
039.6
0
P Private households with employed persons 18.0
018.8
018.6
019.3
019.4
019.4
019.5
0
Plus: Statistical discrepancyVALUE ADDED, GROSS, at basic prices 1 1,825.0
01,797.3
01,803.9
01,863.9
01,979.4
02,124.4
02,270.2
0
Less: Financial intermediation services indirectly measured (FISIM) 27.5
0
26.10
23.80
28.30
22.00
21.60
23.80
Plus: Taxes less Subsidies on products 257.5
0284.5
0298.5
0295.8
0295.6
0336.9
0386.8
0
Plus: Taxes on products 257.5 0 284.5 0 298.5 0 295.8 0 295.6 0 336.9 0 386.8 0
Less: Subsidies on productsPlus: Statistical discrepancy
GROSS DOMESTIC PRODUCT 2,082.5 0 2,081.7 0 2,102.4 0 2,159.7 0 2,274.9 0 2,461.2 0 2,657.0 0
1 Excludes Financial intermediation services indirectly measured (FISIM) but FISIM is included in the industry data.
39

Table 7.2 Grenada: Value added by industries at constant 2006 prices
Millions of EC dollars
Item Description 2009 2010 2011 2012 2013 R 2014 R 2015 Pl
A+B Agriculture, hunting, forestry; fishing 91.7
085.7
084.4
087.9
095.3
0132.0
0176.7
0
A Agriculture, hunting, forestry 68.50
60.20
61.80
63.90
66.10
101.70
147.20
Agriculture, hunting and related service activities 65.6
057.2
058.7
060.7
062.9
098.3
0143.8
0
Forestry, logging and related service activities 2.8
03.0
03.1
03.2
03.3
03.4
03.4
0
B Fishing 23.3 0 25.5 0 22.6 0 24.0 0 29.1 0 30.4 0 29.5 0
C Mining and quarrying 8.3 0 4.6 0 3.4 0 3.0 0 3.8 0 3.9 0 5.4 0
D Manufacturing 58.5 0 60.8 0 60.7 0 60.6 0 59.2 0 60.1 0 62.3 0
E Electricity, gas and water supply 76.20
75.70
76.60
75.40
75.50
75.90
77.60
F Construction 134.5 0 133.3 0 117.5 0 96.8 0 122.9 0 117.1 0 124.5 0
G+H Wholesale, retail trade, repair of motor vehicles, motorcycles and personal and households goods; hotels and restaurants 197.0
0
186.7
0
196.5
0
202.5
0
204.9
0
239.5
0
256.0
0
G Wholesale, retail trade, repair of motor vehicles, motorcycles and personal and household goods 124.8
0
124.3
0
125.4
0
126.4
0
131.0
0
135.9
0
153.3
0
H Hotels and restaurants 72.3 0 62.4 0 71.1 0 76.1 0 73.9 0 103.7 0 102.7 0
I Transport, storage and communications 237.8
0228.5
0221.2
0212.5
0223.0
0242.4
0236.0
0
Land transport; transport via pipelines, water transport; air transport; Supporting and auxiliary transport activities; activities of travel agencies 141.0
0
136.9
0
132.6
0
122.9
0
128.8
0
140.4
0
148.5
0
Post and telecommunications 96.8 0 91.5 0 88.6 0 89.6 0 94.3 0 102.0 0 87.5 0
J+K Financial intermediation; real estate, renting and business activities 362.7
0
354.80
359.80
361.80
359.80
366.30
376.00
J Financial intermediation 134.2 0 124.1 0 124.5 0 126.6 0 121.1 0 119.1 0 124.4 0
K Real estate, renting and business activities 228.6
0230.7
0235.4
0235.2
0238.7
0247.2
0251.6
0
L Public administration and defence; compulsory social security 126.2
0
133.40
139.20
145.80
141.20
141.30
140.50
M+N+O Education; health and social work; other community, social and personal services 370.2
0
368.70
374.50
376.40
387.10
402.10
419.00
M Education 302.3 0 296.2 0 300.7 0 300.9 0 312.7 0 327.0 0 343.6 0
N Health and social work 34.8 0 39.6 0 41.3 0 40.8 0 39.6 0 39.5 0 40.2 0
O Other community, social and personal services 33.1
032.9
032.6
034.8
034.8
035.6
035.2
0
P Private households with employed persons 16.1
016.0
015.4
015.5
015.7
015.8
016.0
0
Plus: Statistical discrepancyVALUE ADDED, GROSS, at basic prices 1 1,654.0
01,621.1
01,623.4
01,614.1
01,665.5
01,773.5
01,865.0
0
Less: Financial intermediation services indirectly measured (FISIM) 25.3
0
27.00
25.70
24.20
22.70
22.80
25.00
Plus: Taxes less Subsidies on products 233.4
0256.6
0268.6
0256.1
0248.7
0281.2
0317.7
0
Plus: Taxes on products Less: Subsidies on products
Plus: Statistical discrepancy
GROSS DOMESTIC PRODUCT 1,887.3 0 1,877.7 0 1,892.0 0 1,870.2 0 1,914.2 0 2,054.7 0 2,182.8 0
1 Excludes Financial intermediation services indirectly measured (FISIM) but FISIM is included in the industry data.
40

Table 7.3 Grenada: Gross domestic product by expenditures at current prices
Millions of EC dollars
Item Description 2009 2010 2011 2012 2013 R 2014 R 2015 Pl
Final consumption expenditure 2,053.3 ## 2,152.2 ## 2,221.9 ## 2,317.5 ## 2,386.8 ## 2,470.3 ## 2,666.0 ##
Household final consumption expenditure 1,728.4
##1,815.8
##1,888.6
##1,964.9
##2,014.2
##2,100.2
##2,322.3
##
NPISHs final consumption expenditureGeneral government final consumption expenditure 324.9
##336.4
##333.4
##352.6
##372.6
##370.1
##343.7
##
Individual consumption expenditureCollective consumption expenditure
Gross capital formation 498.2 ## 458.2 ## 418.6 ## 353.0 ## 455.3 ## 449.7 ## 477.4 ##
Gross fixed capital formation 498.2 ## 458.2 ## 418.6 ## 353.0 ## 455.3 ## 449.7 ## 477.4 ##
Changes in inventoriesAcquisitions less disposals of valuables
Exports of goods and services 505.5 ## 496.2 ## 529.7 ## 557.5 ## 578.5 ## 629.9 ## 640.7 ##
Exports of goods 95.3 ## 84.0 ## 100.3 ## 115.6 ## 122.7 ## 118.8 ## 101.9 ##
Exports of services 410.3 ## 412.1 ## 429.4 ## 441.9 ## 455.8 ## 511.1 ## 538.8 ##
Less: Imports of goods and services 974.7
##1,024.8
##1,067.8
##1,068.4
##1,145.6
##1,088.7
##1,127.1
##
Imports of goods 709.8 ## 771.1 ## 797.3 ## 810.9 ## 875.4 ## 806.8 ## 829.9 ##
Imports of services 264.9 ## 253.8 ## 270.5 ## 257.5 ## 270.2 ## 281.9 ## 297.2 ##
Plus: Statistical discrepancyGROSS DOMESTIC PRODUCT 2,082.5 ## 2,081.7 ## 2,102.4 ## 2,159.7 ## 2,274.9 ## 2,461.2 ## 2,657.0 ##
41
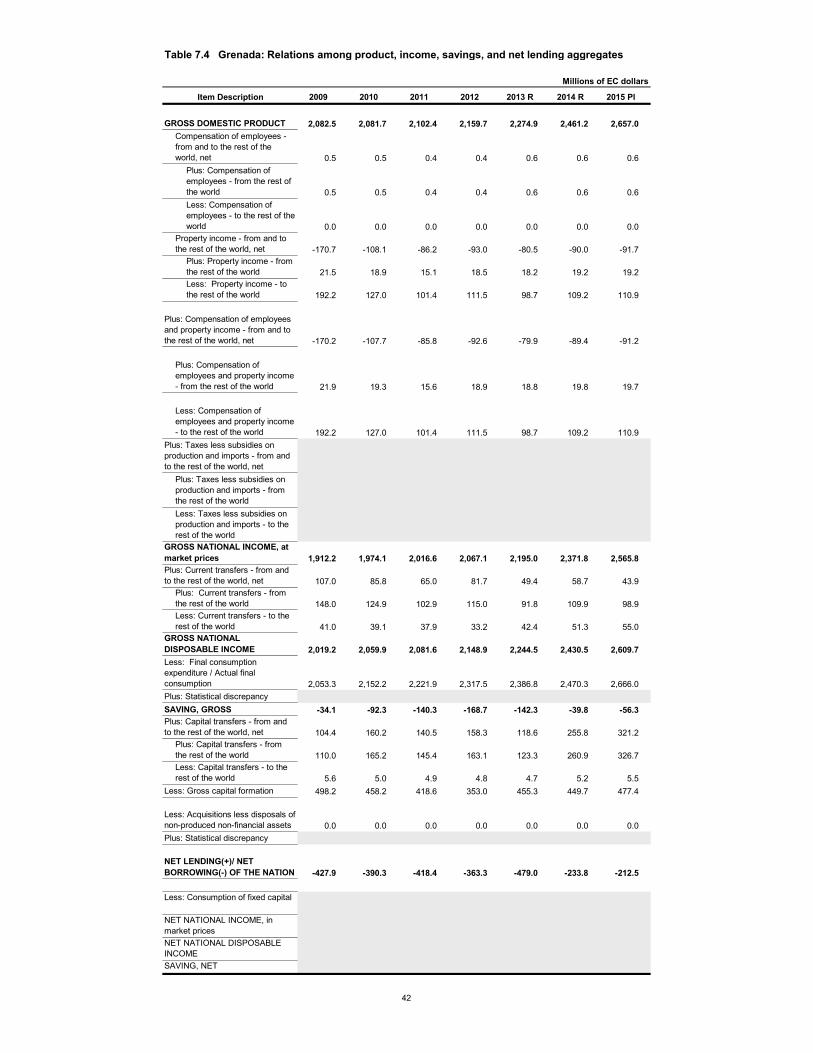
Table 7.4 Grenada: Relations among product, income, savings, and net lending aggregates
Millions of EC dollars
Item Description 2009 2010 2011 2012 2013 R 2014 R 2015 Pl
GROSS DOMESTIC PRODUCT 2,082.5 2,081.7 2,102.4 2,159.7 2,274.9 2,461.2 2,657.0Compensation of employees - from and to the rest of the world, net 0.5 0.5 0.4 0.4 0.6 0.6 0.6
Plus: Compensation of employees - from the rest of the world 0.5 0.5 0.4 0.4 0.6 0.6 0.6Less: Compensation of employees - to the rest of the world 0.0 0.0 0.0 0.0 0.0 0.0 0.0
Property income - from and to the rest of the world, net -170.7 -108.1 -86.2 -93.0 -80.5 -90.0 -91.7
Plus: Property income - from the rest of the world 21.5 18.9 15.1 18.5 18.2 19.2 19.2Less: Property income - to the rest of the world 192.2 127.0 101.4 111.5 98.7 109.2 110.9
Plus: Compensation of employees and property income - from and to the rest of the world, net -170.2 -107.7 -85.8 -92.6 -79.9 -89.4 -91.2
Plus: Compensation of employees and property income - from the rest of the world 21.9 19.3 15.6 18.9 18.8 19.8 19.7
Less: Compensation of employees and property income - to the rest of the world 192.2 127.0 101.4 111.5 98.7 109.2 110.9
Plus: Taxes less subsidies on production and imports - from and to the rest of the world, net
Plus: Taxes less subsidies on production and imports - from the rest of the worldLess: Taxes less subsidies on production and imports - to the rest of the world
GROSS NATIONAL INCOME, at market prices 1,912.2 1,974.1 2,016.6 2,067.1 2,195.0 2,371.8 2,565.8Plus: Current transfers - from and to the rest of the world, net 107.0 85.8 65.0 81.7 49.4 58.7 43.9
Plus: Current transfers - from the rest of the world 148.0 124.9 102.9 115.0 91.8 109.9 98.9Less: Current transfers - to the rest of the world 41.0 39.1 37.9 33.2 42.4 51.3 55.0
GROSS NATIONAL DISPOSABLE INCOME 2,019.2 2,059.9 2,081.6 2,148.9 2,244.5 2,430.5 2,609.7Less: Final consumption expenditure / Actual final consumption 2,053.3 2,152.2 2,221.9 2,317.5 2,386.8 2,470.3 2,666.0Plus: Statistical discrepancySAVING, GROSS -34.1 -92.3 -140.3 -168.7 -142.3 -39.8 -56.3Plus: Capital transfers - from and to the rest of the world, net 104.4 160.2 140.5 158.3 118.6 255.8 321.2
Plus: Capital transfers - from the rest of the world 110.0 165.2 145.4 163.1 123.3 260.9 326.7Less: Capital transfers - to the rest of the world 5.6 5.0 4.9 4.8 4.7 5.2 5.5
Less: Gross capital formation 498.2 458.2 418.6 353.0 455.3 449.7 477.4
Less: Acquisitions less disposals of non-produced non-financial assets 0.0 0.0 0.0 0.0 0.0 0.0 0.0Plus: Statistical discrepancy
NET LENDING(+)/ NET BORROWING(-) OF THE NATION -427.9 -390.3 -418.4 -363.3 -479.0 -233.8 -212.5
Less: Consumption of fixed capital
NET NATIONAL INCOME, in market pricesNET NATIONAL DISPOSABLE INCOMESAVING, NET
42


Table 8.1 Guyana: Value added by industries at current prices
Millions of EC dollars
Item Description 2009 2010 2011 2012 2013 2014 2015 Pj
A+B Agriculture, hunting, forestry; fishing 986.3
0976.9
01,140.8
01,264.9
01,343.3
01,344.7
01,382.2
0
A Agriculture, hunting, forestry 888.40
875.90
1,009.40
1,108.80
1,190.80
1,232.20
1,284.10
Agriculture, hunting and related service activities 719.6
0685.2
0826.8
0925.8
0988.1
0933.1
01,012.1
0
Forestry, logging and related service activities 168.8
0190.7
0182.5
0183.1
0202.7
0299.1
0272.0
0
B Fishing 98.0 0 101.0 0 131.4 0 156.1 0 152.5 0 112.5 0 98.1 0
C Mining and quarrying 680.1 0 853.8 0 1,169.1 0 1,443.2 0 1,282.1 0 1,102.3 0 1,681.1 0
D Manufacturing 369.5 0 363.7 0 395.3 0 429.1 0 478.4 0 452.7 0 479.9 0
E Electricity, gas and water supply 110.50
141.60
80.10
85.20
149.70
167.10
249.60
F Construction 484.7 0 554.6 0 585.1 0 526.3 0 635.4 0 741.5 0 643.8 0
G+H Wholesale, retail trade, repair of motor vehicles, motorcycles and personal and households goods; hotels and restaurants 673.8
0
793.0
0
969.3
0
1,065.2
0
1,019.7
0
1,055.2
0
1,115.6
0
G Wholesale, retail trade, repair of motor vehicles, motorcycles and personal and household goodsH Hotels and restaurants
I Transport, storage and communications 537.7
0623.5
0654.2
0722.7
0812.5
0829.0
01,009.8
0
Land transport; transport via pipelines, water transport; air transport; Supporting and auxiliary transport activities; activities of travel agencies 283.7
0
336.3
0
365.0
0
426.2
0
495.5
0
485.2
0
531.1
0
Post and telecommunications 254.1 0 287.2 0 289.2 0 296.5 0 317.0 0 343.8 0 478.7 0
J+K Financial intermediation; real estate, renting and business activities 253.7
0
281.20
311.40
353.10
418.20
438.00
459.00
J Financial intermediation 196.9 0 221.4 0 250.4 0 285.3 0 343.7 0 360.9 0 375.5 0
K Real estate, renting and business activities 56.8
059.8
061.1
067.8
074.5
077.1
083.5
0
L Public administration and defence; compulsory social security 439.2
0
464.50
522.30
571.80
629.50
694.40
730.00
M+N+O Education; health and social work; other community, social and personal services 434.5
0
499.30
531.40
570.70
628.90
673.80
748.60
M Education 200.3 0 224.2 0 213.2 0 225.7 0 249.3 0 262.5 0 280.5 0
N Health and social work 73.9 0 85.9 0 97.9 0 103.1 0 116.8 0 123.8 0 137.4 0
O Other community, social and personal services 1 160.4 189.2 220.3 241.9 262.8 287.5 330.7
P Private households with employed personsPlus: Statistical discrepancyVALUE ADDED, GROSS, at basic prices 2 4,970.2 5,552.0 6,359.0 7,032.4 7,397.8 7,498.7 8,499.5Less: Financial intermediation services indirectly measured (FISIM) 174.7
0
207.50
240.60
264.00
288.80
274.70
286.00
Plus: Taxes less Subsidies on products 714.4
0788.5
0871.8
0944.0
01,014.6
01,059.2
01,108.3
0
Plus: Taxes on productsLess: Subsidies on products
Plus: Statistical discrepancy
GROSS DOMESTIC PRODUCT 5,509.8 0 6,133.0 0 6,990.2 0 7,712.5 0 8,123.5 0 8,283.2 0 9,321.8 0
1 Refers to Other service activities2 Includes Financial intermediation services indirectly measured (FISIM).
43

Table 8.2 Guyana: Value added by industries at constant 2006 prices
Millions of EC dollars
Item Description 2009 2010 2011 2012 2013 2014 2015 Pj
A+B Agriculture, hunting, forestry; fishing 833.3
0852.8
0875.4
0890.7
0928.5
0980.9
0988.8
0
A Agriculture, hunting, forestry 719.30
729.30
758.50
762.30
802.30
888.30
910.10
Agriculture, hunting and related service activities 596.3
0591.8
0633.7
0650.4
0677.0
0745.5
0790.5
0
Forestry, logging and related service activities 123.0
0137.5
0124.7
0111.9
0125.3
0142.8
0119.6
0
B Fishing 114.0 0 123.5 0 117.0 0 128.4 0 126.2 0 92.5 0 78.7 0
C Mining and quarrying 419.4 0 396.5 0 472.7 0 479.5 0 586.2 0 518.7 0 524.6 0
D Manufacturing 278.1 0 278.9 0 297.9 0 307.5 0 329.3 0 364.5 0 386.7 0
E Electricity, gas and water supply 72.40
73.10
74.60
77.20
83.40
85.50
90.00
F Construction 384.7 0 425.7 0 437.4 0 465.0 0 476.9 0 563.0 0 460.2 0
G+H Wholesale, retail trade, repair of motor vehicles, motorcycles and personal and households goods; hotels and restaurants 535.6
0
593.9
0
620.9
0
661.2
0
657.0
0
637.6
0
672.5
0
G Wholesale, retail trade, repair of motor vehicles, motorcycles and personal and household goodsH Hotels and restaurants
I Transport, storage and communications 574.9
0614.8
0664.5
0707.9
0781.3
0855.5
0919.2
0
Land transport; transport via pipelines, water transport; air transport; Supporting and auxiliary transport activities; activities of travel agenciesPost and telecommunications
J+K Financial intermediation; real estate, renting and business activities 201.3
0
221.80
239.30
255.40
294.60
299.90
318.10
J Financial intermediation 152.3 0 171.9 0 188.5 0 203.6 0 238.5 0 240.5 0 256.9 0
K Real estate, renting and business activities 49.0
050.0
050.8
051.8
056.1
059.4
061.2
0
L Public administration and defence; compulsory social security 344.0
0
344.00
346.00
346.00
359.70
365.10
365.10
M+N+O Education; health and social work; other community, social and personal services 436.6
0
462.10
479.00
488.60
498.70
518.40
536.30
M Education 182.1 0 190.5 0 203.3 0 206.9 0 215.0 0 223.6 0 231.1 0
N Health and social work 77.6 0 84.2 0 87.4 0 92.3 0 93.7 0 97.2 0 100.2 0
O Other community, social and personal services 1 176.8 187.4 188.4 189.3 190.0 197.6 205.0
P Private households with employed personsPlus: Statistical discrepancyVALUE ADDED, GROSS, at basic prices 2 4,080.1 4,263.6 4,507.8 4,679.1 4,995.5 5,189.0 5,261.4Less: Financial intermediation services indirectly measured (FISIM) 100.1 109.7 128.0 133.2 165.1 173.0 173.2Plus: Taxes less Subsidies on products
Plus: Taxes on products Less: Subsidies on products
Plus: Statistical discrepancy
GROSS DOMESTIC PRODUCT 3 3,980.0 4,153.9 4,379.8 4,545.9 4,830.5 5,016.0 5,088.21 Refers to Other service activities2 Includes Financial intermediation services indirectly measured (FISIM).3 Refers to GDP at basic prices
44

Table 8.3 Guyana: Value added by industries at current prices
Millions of Guyana dollars
Item Description 2009 2010 2011 2012 2013 2014 2015 Pj
A+B Agriculture, hunting, forestry; fishing 73,952.6 0 73,281.9 0 85,787.8 0 95,563.0 0 101,553.0 0 103,129.0 0 105,883.0 0
A Agriculture, hunting, forestry 66,608.80
65,708.00
75,904.20
83,769.00
90,025.90
94,501.00
98,367.90
Agriculture, hunting and related service activities 53,955.0
051,400.0
062,179.0
069,940.0
074,699.0
071,564.0
077,528.0
0
Forestry, logging and related service activities 12,653.4
014,308.0
013,725.2
013,829.0
015,326.9
022,937.3
020,839.7
0
B Fishing 7,344.3 0 7,573.3 0 9,883.5 0 11,794.0 0 11,527.7 0 8,627.4 0 7,515.0 0
C Mining and quarrying 50,992.4 0 64,045.8 0 87,920.2 0 109,027.0 0 96,922.1 0 84,534.6 0 128,775.0 0
D Manufacturing 27,706.1 0 27,282.1 0 29,728.2 0 32,419.0 0 36,165.7 0 34,720.5 0 36,763.0 0
E Electricity, gas and water supply 8,287.10
10,619.60
6,020.50
6,437.00
11,316.40
12,815.80
19,119.90
F Construction 36,344.0 0 41,605.2 0 43,996.4 0 39,764.0 0 48,037.3 0 56,867.9 0 49,314.7 0
G+H Wholesale, retail trade, repair of motor vehicles, motorcycles and personal and households goods; hotels and restaurants 50,517.1
0
59,486.6
0
72,893.8
0
80,477.0
0
77,090.2
0
80,924.7
0
85,456.5
0
G Wholesale, retail trade, repair of motor vehicles, motorcycles and personal and household goodsH Hotels and restaurants
I Transport, storage and communications 40,317.5
046,775.5
049,198.0
054,599.0
061,424.0
063,579.0
077,352.0
0
Land transport; transport via pipelines, water transport; air transport; Supporting and auxiliary transport activities; activities of travel agencies 21,268.3
0
25,227.5
0
27,450.7
0
32,199.0
0
37,455.7
0
37,214.2
0
40,680.5
0
Post and telecommunications 19,049.2 0 21,548.0 0 21,747.4 0 22,399.9 0 23,967.8 0 26,364.6 0 36,671.1 0
J+K Financial intermediation; real estate, renting and business activities 19,022.7
0
21,095.00
23,419.00
26,674.00
31,618.00
33,592.00
35,162.00
J Financial intermediation 14,762.6 0 16,608.6 0 18,827.3 0 21,551.0 0 25,985.9 0 27,678.5 0 28,766.5 0
K Real estate, renting and business activities 4,260.1
04,485.8
04,591.6
05,123.0
05,632.0
05,913.6
06,395.0
0
L Public administration and defence; compulsory social security 32,928.8
0
34,843.20
39,274.10
43,201.00
47,592.00
53,255.40
55,918.20
M+N+O Education; health and social work; other community, social and personal services 32,579.9
0
37,455.70
39,964.00
43,117.00
47,543.00
51,679.00
57,344.00
M Education 15,016.5 0 16,819.0 0 16,036.0 0 17,054.0 0 18,847.4 0 20,132.0 0 21,488.3 0
N Health and social work 5,537.3 0 6,446.0 0 7,360.3 0 7,790.0 0 8,828.9 0 9,495.2 0 10,522.1 0
O Other community, social and personal services 1 12,026.0 14,190.7 16,567.0 18,273.0 19,866.4 22,051.7 25,334.0
P Private households with employed personsPlus: Statistical discrepancyVALUE ADDED, GROSS, at basic prices 2 372,648.0 416,491.0 478,202.0 531,279.0 559,261.0 575,098.0 651,088.0Less: Financial intermediation services indirectly measured (FISIM) 13,100.8
0
15,568.00
18,094.00
19,942.00
21,833.00
21,065.00
21,907.20
Plus: Taxes less Subsidies on products 53,564.9
059,149.8
065,563.3
071,319.0
076,701.7
081,229.2
084,897.5
0
Plus: Taxes on productsLess: Subsidies on products
Plus: Statistical discrepancy
GROSS DOMESTIC PRODUCT 413,112.0 0 460,072.0 0 525,671.0 0 582,657.0 0 614,130.0 0 635,262.0 0 714,079.0 0
1 Refers to Other service activities2 Includes Financial intermediation services indirectly measured (FISIM).
45

Table 8.4 Guyana: Value added by industries at constant 2006 prices
Millions of Guyana dollars
Item Description 2009 2010 2011 2012 2013 2014 2015 Pj
A+B Agriculture, hunting, forestry; fishing 62,059.9
063,514.1
065,199.0
066,335.7
069,151.1
073,051.3
073,642.5
0
A Agriculture, hunting, forestry 53,571.9 0 54,314.9 0 56,488.0 0 56,776.0 0 59,750.0 0 66,159.0 0 67,782.2 0
Agriculture, hunting and related service activities 44,411.0
044,077.0
047,199.0
048,439.0
050,419.0
055,526.0
058,871.0
0
Forestry, logging and related service activities 9,161.3
010,237.9
09,289.5
08,337.2
09,330.5
010,633.0
08,910.8
0
B Fishing 8,487.6 0 9,199.2 0 8,710.8 0 9,559.6 0 9,401.4 0 6,892.1 0 5,860.4 0
C Mining and quarrying 31,233.2 0 29,532.4 0 35,202.4 0 35,710.2 0 43,655.8 0 38,630.6 0 39,070.1 0
D Manufacturing 20,713.6 0 20,769.7 0 22,185.4 0 22,902.3 0 24,523.8 0 27,147.9 0 28,799.8 0
E Electricity, gas and water supply 5,390.20
5,445.80
5,559.60
5,752.60
6,208.30
6,370.70
6,701.10
F Construction 28,648.6 0 31,702.9 0 32,578.5 0 34,631.0 0 35,520.5 0 41,930.1 0 34,272.5 0
G+H Wholesale, retail trade, repair of motor vehicles, motorcycles and personal and households goods; hotels and restaurants 39,886.3
0
44,233.2
0
46,240.9
0
49,246.6
0
48,929.9
0
47,485.5
0
50,086.0
0
G Wholesale, retail trade, repair of motor vehicles, motorcycles and personal and household goodsH Hotels and restaurants
I Transport, storage and communications 42,815.7
045,788.0
049,489.0
052,723.0
058,192.0
063,712.0
068,461.0
0
Land transport; transport via pipelines, water transport; air transport; Supporting and auxiliary transport activities; activities of travel agenciesPost and telecommunications
J+K Financial intermediation; real estate, renting and business activities 14,989.5
0
16,522.00
17,823.00
19,022.00
21,939.00
22,336.00
23,689.00
J Financial intermediation 11,339.6 0 12,799.3 0 14,040.9 0 15,164.2 0 17,763.6 0 17,909.7 0 19,129.9 0
K Real estate, renting and business activities 3,649.9
03,722.9
03,782.5
03,858.1
04,175.6
04,426.1
04,558.9
0
L Public administration and defence; compulsory social security 25,618.7
0
25,618.70
25,772.40
25,772.40
26,786.60
27,188.40
27,188.40
M+N+O Education; health and social work; other community, social and personal services 32,515.4
0
34,414.00
35,678.00
36,388.00
37,145.00
38,611.00
39,939.00
M Education 13,564.0 0 14,187.2 0 15,141.1 0 15,412.4 0 16,015.5 0 16,650.0 0 17,209.0 0
N Health and social work 5,782.2 0 6,268.4 0 6,508.1 0 6,875.9 0 6,977.4 0 7,242.6 0 7,460.2 0
O Other community, social and personal services 1 13,169.1 13,959.3 14,029.1 14,099.2 14,152.5 14,718.6 15,270.0
P Private households with employed personsPlus: Statistical discrepancyVALUE ADDED, GROSS, at basic prices 2 303,871.0 317,541.0 335,728.0 348,484.0 372,052.0 386,463.0 391,850.0Less: Financial intermediation services indirectly measured (FISIM) 7,454.0
0
8,168.00
9,535.10
9,917.00
12,294.00
12,887.00
12,897.00
Plus: Taxes less Subsidies on products
Plus: Taxes on productsLess: Subsidies on products
Plus: Statistical discrepancy
GROSS DOMESTIC PRODUCT 3 296,417.0 309,373.0 326,193.0 338,567.0 359,758.0 373,576.0 378,953.01 Refers to Other service activities2 Includes Financial intermediation services indirectly measured (FISIM).3 Refers to GDP at basic prices
46

Table 8.5 Guyana: Gross domestic product by expenditures at current prices
Millions of EC dollars
Item Description 2009 2010 2011 2012 2013 2014 2015
Final consumption expenditure 5,427.6 ## 6,284.2 ## 7,423.2 ## 7,988.4 ## 8,868.7 ## 8,238.2 ## … ##
Household final consumption expenditure 4,536.5
##5,357.3
##6,343.4
##6,970.9
##7,575.1
##6,836.1
##…
##
NPISHs final consumption expenditureGeneral government final consumption expenditure 891.1
##926.9
##1,079.9
##1,017.5
##1,293.6
##1,402.1
##…
##
Individual consumption expenditureCollective consumption expenditure
Gross capital formation 1,467.9 ## 1,557.5 ## 1,669.3 ## 1,922.0 ## 1,535.5 ## 2,376.9 ## … ##
Gross fixed capital formationChanges in inventoriesAcquisitions less disposals of valuables
Exports of goods and services 2,533.2 ## 3,073.6 ## 3,853.0 ## 4,562.8 ## 4,192.1 ## 3,639.4 ## … ##
Exports of goods 2,073.5 ## 2,400.7 ## 3,049.1 ## 3,769.9 ## 3,743.7 ## 3,150.3 ## … ##
Exports of services 459.7 ## 672.9 ## 803.9 ## 792.9 ## 448.4 ## 489.1 ## … ##
Less: Imports of goods and services 3,918.8
##4,782.4
##5,955.3
##6,760.8
##6,472.8
##5,947.7
##…
##
Imports of goods 3,183.5 ## 3,849.6 ## 4,783.6 ## 5,344.1 ## 5,104.2 ## 4,800.8 ## … ##
Imports of services 735.3 ## 932.8 ## 1,171.7 ## 1,416.6 ## 1,368.5 ## 1,146.9 ## … ##
Plus: Statistical discrepancyGROSS DOMESTIC PRODUCT 5,509.9 ## 6,133.0 ## 6,990.2 ## 7,712.5 ## 8,123.5 ## 8,306.8 ## … ##
Table 8.6 Guyana: Gross domestic product by expenditures at current prices
Millions of Guyana dollars
Item Description 2009 2010 2011 2012 2013 2014 2015
Final consumption expenditure 406,944.0 ## 471,415.0 ## 558,234.0 ## 603,505.0 ## 670,464.0 ## 631,809.0 ## … ##
Household final consumption expenditure 340,133.0
##401,883.0
##477,028.0
##526,634.0
##572,668.0
##524,282.0
##…
##
NPISHs final consumption expenditureGeneral government final consumption expenditure 66,810.7
##69,532.7
##81,206.0
##76,871.5
##97,796.1
##107,527.0
##…
##
Individual consumption expenditureCollective consumption expenditure
Gross capital formation 110,056.0 ## 116,839.0 ## 125,535.0 ## 145,204.0 ## 116,081.0 ## 182,290.0 ## … ##
Gross fixed capital formationChanges in inventoriesAcquisitions less disposals of valuables
Exports of goods and services 189,932.0 ## 230,572.0 ## 289,746.0 ## 344,707.0 ## 316,918.0 ## 279,117.0 ## … ##
Exports of goods 155,465.0 ## 180,093.0 ## 229,294.0 ## 284,806.0 ## 283,022.0 ## 241,608.0 ## … ##
Exports of services 34,467.5 ## 50,478.2 ## 60,451.5 ## 59,901.4 ## 33,895.7 ## 37,509.0 ## … ##
Less: Imports of goods and services 293,819.0
##358,754.0
##447,844.0
##510,760.0
##489,334.0
##456,148.0
##…
##
Imports of goods 238,687.0 ## 288,783.0 ## 359,734.0 ## 403,736.0 ## 385,874.0 ## 368,188.0 ## … ##
Imports of services 55,132.4 ## 69,971.4 ## 88,110.5 ## 107,023.0 ## 103,460.0 ## 87,960.0 ## … ##
Plus: Statistical discrepancyGROSS DOMESTIC PRODUCT 413,114.0 ## 460,072.0 ## 525,672.0 ## 582,657.0 ## 614,130.0 ## 637,068.0 ## … ##
47

Table 8.7 Guyana: Relations among product, income, savings, and net lending aggregates
Millions of EC dollars
Item Description 2009 2010 2011 2012 2013 2014 2015
GROSS DOMESTIC PRODUCT 5,509.9 6,133.0 6,990.2 7,712.5 8,123.5 8,306.8 ...Compensation of employees - from and to the rest of the world, net
Plus: Compensation of employees - from the rest of the worldLess: Compensation of employees - to the rest of the world
Property income - from and to the rest of the world, net
Plus: Property income - from the rest of the worldLess: Property income - to the rest of the world
Plus: Compensation of employees and property income - from and to the rest of the world, net
Plus: Compensation of employees and property income - from the rest of the world
Less: Compensation of employees and property income - to the rest of the world
Plus: Taxes less subsidies on production and imports - from and to the rest of the world, net
Plus: Taxes less subsidies on production and imports - from the rest of the worldLess: Taxes less subsidies on production and imports - to the rest of the world
GROSS NATIONAL INCOME, at market prices 5,464.3 6,167.7 6,965.0 7,709.2 8,045.8 8,234.8 ...Plus: Current transfers - from and to the rest of the world, net
Plus: Current transfers - from the rest of the worldLess: Current transfers - to the rest of the world
GROSS NATIONAL DISPOSABLE INCOMELess: Final consumption expenditure / Actual final consumption 5,427.6 6,284.2 7,423.2 7,988.4 8,868.7 8,238.2 ...Plus: Statistical discrepancySAVING, GROSSPlus: Capital transfers - from and to the rest of the world, net
Plus: Capital transfers - from the rest of the worldLess: Capital transfers - to the rest of the world
Less: Gross capital formation 1,467.9 1,557.5 1,669.3 1,922.0 1,535.5 2,376.9 ...
Less: Acquisitions less disposals of non-produced non-financial assetsPlus: Statistical discrepancy
NET LENDING(+)/ NET BORROWING(-) OF THE NATION
Less: Consumption of fixed capital
NET NATIONAL INCOME, in market pricesNET NATIONAL DISPOSABLE INCOMESAVING, NET
48

Table 8.8 Guyana: Relations among product, income, savings, and net lending aggregates
Millions of Guyana dollars
Item Description 2009 2010 2011 2012 2013 2014 2015
GROSS DOMESTIC PRODUCT 413,114.0 460,072.0 525,672.0 582,657.0 614,130.0 637,068.0 ...Compensation of employees - from and to the rest of the world, net
Plus: Compensation of employees - from the rest of the worldLess: Compensation of employees - to the rest of the world
Property income - from and to the rest of the world, net
Plus: Property income - from the rest of the worldLess: Property income - to the rest of the world
Plus: Compensation of employees and property income - from and to the rest of the world, net
Plus: Compensation of employees and property income - from the rest of the world
Less: Compensation of employees and property income - to the rest of the world
Plus: Taxes less subsidies on production and imports - from and to the rest of the world, net
Plus: Taxes less subsidies on production and imports - from the rest of the worldLess: Taxes less subsidies on production and imports - to the rest of the world
GROSS NATIONAL INCOME, at market prices 409,696.0 462,673.0 523,776.0 582,410.0 608,256.0 631,550.0 ...Plus: Current transfers - from and to the rest of the world, net
Plus: Current transfers - from the rest of the worldLess: Current transfers - to the rest of the world
GROSS NATIONAL DISPOSABLE INCOMELess: Final consumption expenditure / Actual final consumption 406,944.0 471,415.0 558,234.0 603,505.0 670,464.0 631,809.0 ...Plus: Statistical discrepancySAVING, GROSSPlus: Capital transfers - from and to the rest of the world, net
Plus: Capital transfers - from the rest of the worldLess: Capital transfers - to the rest of the world
Less: Gross capital formation 110,056.0 116,839.0 125,535.0 145,204.0 116,081.0 182,290.0 ...
Less: Acquisitions less disposals of non-produced non-financial assetsPlus: Statistical discrepancy
NET LENDING(+)/ NET BORROWING(-) OF THE NATION
Less: Consumption of fixed capital
NET NATIONAL INCOME, in market pricesNET NATIONAL DISPOSABLE INCOMESAVING, NET
49

THIS PAGE WAS INTENTIONALLY LEFT BLANK
50


Table 9.1 Jamaica: Value added by industries at current prices
Millions of EC dollars
Item Description 2009 2010 2011 2012 2013 2014 2015
A+B Agriculture, hunting, forestry; fishing 1,776.6
01,882.8
02,202.5
02,301.5
02,290.9
02,235.8
02,400.2
0
A Agriculture, hunting, forestry 1,662.60
1,778.10
2,078.00
2,174.10
2,152.70
2,071.40
2,230.70
Agriculture, hunting and related service activities 1,647.0
01,757.0
02,054.9
02,149.8
02,130.3
02,050.4
02,210.3
0
Forestry, logging and related service activities 15.6
021.1
023.1
024.2
022.4
021.0
020.4
0
B Fishing 114.0 0 104.7 0 124.5 0 127.5 0 138.1 0 164.4 0 169.5 0
C Mining and quarrying 272.3 0 394.3 0 486.8 0 449.5 0 416.0 0 436.2 0 706.1 0
D Manufacturing 2,665.6 0 2,766.0 0 3,067.8 0 3,210.2 0 3,098.7 0 3,013.7 0 3,159.4 0
E Electricity, gas and water supply 885.40
1,015.50
1,105.80
1,064.60
1,035.80
1,046.30
1,101.60
F Construction 2,050.9 0 2,248.3 0 2,449.4 0 2,437.6 0 2,357.5 0 2,348.3 0 2,528.0 0
G+H Wholesale, retail trade, repair of motor vehicles, motorcycles and personal and households goods; hotels and restaurants 6,717.6
0
7,157.4
0
7,762.5
0
7,928.8
0
7,701.2
0
7,812.2
0
7,793.7
0
G Wholesale, retail trade, repair of motor vehicles, motorcycles and personal and household goods 5,349.1
0
5,781.4
0
6,333.8
0
6,465.4
0
6,268.0
0
6,352.4
0
6,307.3
0
H Hotels and restaurants 1,368.6 0 1,375.9 0 1,428.7 0 1,463.4 0 1,433.2 0 1,459.9 0 1,486.4 0
I Transport, storage and communications 3,020.8
03,124.0
03,273.5
03,071.4
02,828.1
02,745.3
02,676.7
0
Land transport; transport via pipelines, water transport; air transport; Supporting and auxiliary transport activities; activities of travel agencies 1,645.7
0
1,707.9
0
1,807.1
0
1,790.4
0
1,711.3
0
1,719.0
0
1,695.0
0
Post and telecommunications 1,375.2 0 1,416.2 0 1,466.5 0 1,281.0 0 1,116.8 0 1,026.3 0 981.7 0
J+K Financial intermediation; real estate, renting and business activities 6,330.5
0
7,059.40
7,622.60
7,729.10
7,202.40
6,884.40
6,938.30
J Financial intermediation 3,202.6 0 3,226.9 0 3,468.8 0 3,472.0 0 3,248.1 0 3,111.7 0 3,245.3 0
K Real estate, renting and business activities 3,127.8
03,832.5
04,153.8
04,257.1
03,954.3
03,772.7
03,693.0
0
L Public administration and defence; compulsory social security 1 2,642.3
0
2,852.20
3,105.10
3,274.90
3,099.40
2,801.90
2,738.60
M+N+O Education; health and social work; other community, social and personal services 2 3,184.0
0
3,351.40
3,660.80
3,834.10
3,591.70
3,347.60
3,290.70
M Education 1,910.2 0 1,977.0 0 2,176.6 0 2,288.9 0 2,103.3 0 1,900.5 0 1,820.6 0
N Health and social work 203.5 0 217.5 0 225.6 0 231.5 0 215.5 0 203.9 0 202.1 0
O Other community, social and personal services 1,070.4
01,156.9
01,258.6
01,313.7
01,272.9
01,243.2
01,268.1
0
P Private households with employed persons 226.2
0235.1
0259.6
0262.0
0249.1
0254.0
0241.3
0
Plus: Statistical discrepancyVALUE ADDED, GROSS, at basic prices 3 29,772.2
032,086.5
034,996.4
035,563.7
033,871.0
032,925.8
033,574.7
0
Less: Financial intermediation services indirectly measured (FISIM) 1,466.7
0
1,395.80
1,438.70
1,455.30
1,350.90
1,231.70
1,313.40
Plus: Taxes less Subsidies on products 4,160.6
05,041.7
05,431.6
05,757.3
05,824.5
05,733.0
06,110.8
0
Plus: Taxes on products 4,160.6 0 5,041.7 0 5,431.6 0 5,757.3 0 5,824.5 0 5,733.0 0 6,110.8 0
Less: Subsidies on products 0.0 0 0.0 0 0.0 0 0.0 0 0.0 0 0.0 0 0.0 0
Plus: Statistical discrepancy
GROSS DOMESTIC PRODUCT 32,466.1 0 35,732.4 0 38,989.5 0 39,865.7 0 38,344.4 0 37,427.1 0 38,371.9 0
1 Includes public health and social work2 Excludes public health and social work3 Includes Financial intermediation services indirectly measured (FISIM).
51

Table 9.2 Jamaica: Value added by industries at constant 2007 prices
Millions of EC dollars
Item Description 2009 2010 2011 2012 2013 2014 2015
A+B Agriculture, hunting, forestry; fishing 1,710.7
01,711.0
01,887.2
01,931.0
01,917.2
01,908.0
01,907.0
0
A Agriculture, hunting, forestry 1,595.10
1,611.90
1,778.20
1,852.20
1,834.20
1,821.70
1,817.00
Agriculture, hunting and related service activities 1,582.5
01,597.3
01,763.6
01,837.5
01,819.5
01,806.9
01,802.2
0
Forestry, logging and related service activities 12.6
014.6
014.6
014.7
014.7
014.8
014.8
0
B Fishing 115.5 0 99.1 0 109.0 0 78.8 0 82.9 0 86.3 0 90.0 0
C Mining and quarrying 611.2 0 585.5 0 697.1 0 636.5 0 653.8 0 659.5 0 665.7 0
D Manufacturing 2,519.8 0 2,410.3 0 2,453.0 0 2,445.3 0 2,433.8 0 2,413.5 0 2,499.3 0
E Electricity, gas and water supply 987.50
945.10
947.60
927.10
909.00
898.50
911.00
F Construction 2,107.0 0 2,079.5 0 2,096.8 0 2,004.6 0 2,042.0 0 2,076.2 0 2,099.8 0
G+H Wholesale, retail trade, repair of motor vehicles, motorcycles and personal and households goods; hotels and restaurants 6,797.2
0
6,642.8
0
6,690.5
0
6,644.4
0
6,656.4
0
6,721.2
0
6,782.3
0
G Wholesale, retail trade, repair of motor vehicles, motorcycles and personal and household goods 5,327.4
0
5,123.7
0
5,141.0
0
5,067.3
0
5,061.1
0
5,078.2
0
5,107.5
0
H Hotels and restaurants 1,469.8 0 1,519.1 0 1,549.6 0 1,577.1 0 1,595.3 0 1,642.9 0 1,674.8 0
I Transport, storage and communications 3,295.1
03,207.0
03,146.5
03,144.3
03,158.0
03,182.9
03,214.5
0
Land transport; transport via pipelines, water transport; air transport; Supporting and auxiliary transport activities; activities of travel agencies 1,706.3
0
1,634.5
0
1,590.7
0
1,546.8
0
1,535.9
0
1,548.7
0
1,558.2
0
Post and telecommunications 1,588.8 0 1,572.4 0 1,555.8 0 1,597.5 0 1,622.2 0 1,634.1 0 1,656.3 0
J+K Financial intermediation; real estate, renting and business activities 6,421.8
0
6,281.20
6,268.90
6,261.10
6,277.80
6,308.20
6,339.90
J Financial intermediation 3,288.8 0 3,178.4 0 3,175.0 0 3,173.2 0 3,176.5 0 3,191.8 0 3,207.2 0
K Real estate, renting and business activities 3,133.0
03,102.8
03,093.9
03,087.9
03,101.2
03,116.5
03,132.8
0
L Public administration and defence; compulsory social security 1 2,500.5
0
2,500.20
2,503.90
2,500.00
2,484.50
2,468.90
2,467.20
M+N+O Education; health and social work; other community, social and personal services 2 2,997.4
0
2,990.40
3,014.50
3,034.90
3,048.00
3,083.00
3,105.50
M Education 1,627.6 0 1,651.6 0 1,680.9 0 1,682.3 0 1,694.5 0 1,705.6 0 1,703.0 0
N Health and social work 209.6 0 207.8 0 204.5 0 207.3 0 202.3 0 199.9 0 201.7 0
O Other community, social and personal services 1,160.2
01,131.0
01,129.1
01,145.4
01,151.2
01,177.5
01,200.7
0
P Private households with employed persons 233.4
0230.8
0231.0
0229.2
0230.3
0231.4
0231.9
0
Plus: Statistical discrepancyVALUE ADDED, GROSS, at basic prices 3 30,181.3
029,583.8
029,937.0
029,758.4
029,810.8
029,951.2
030,224.1
0
Less: Financial intermediation services indirectly measured (FISIM) 1,429.2
0
1,248.30
1,197.20
1,166.00
1,159.50
1,148.90
1,152.60
Plus: Taxes less Subsidies on products 4,116.6
04,050.3
04,206.0
04,148.5
04,254.6
04,332.1
04,393.0
0
Plus: Taxes on products 4,116.6 0 4,050.3 0 4,206.0 0 4,148.5 0 4,254.6 0 4,332.1 0 4,393.0 0
Less: Subsidies on products 0.0 0 0.0 0 0.0 0 0.0 0 0.0 0 0.0 0 0.0 0
Plus: Statistical discrepancy
GROSS DOMESTIC PRODUCT 32,868.7 0 32,385.8 0 32,945.8 0 32,740.9 0 32,905.8 0 33,134.4 0 33,464.6 0
1 Includes public health and social work2 Excludes public health and social work3 Includes Financial intermediation services indirectly measured (FISIM).
52

Table 9.3 Jamaica: Value added by industries at current prices
Millions of Jamaica dollars
Item Description 2009 2010 2011 2012 2013 2014 2015
A+B Agriculture, hunting, forestry; fishing 58,297.1
060,739.8
070,066.1
075,844.0
085,499.9
092,097.8
0104,285.0
0
A Agriculture, hunting, forestry54,555.8
057,363.7
066,106.5
071,643.5
080,344.5
085,324.6
096,919.8
0
Agriculture, hunting and related service activities 54,043.3
056,682.2
065,370.9
070,845.6
079,508.7
084,459.5
096,033.8
0
Forestry, logging and related service activities 512.5
0681.5
0735.6
0797.8
0835.9
0865.1
0886.0
0
B Fishing 3,741.3 0 3,376.1 0 3,959.7 0 4,200.5 0 5,155.3 0 6,773.3 0 7,364.7 0
C Mining and quarrying 8,935.7 0 12,720.5 0 15,486.8 0 14,811.6 0 15,524.7 0 17,967.3 0 30,678.0 0
D Manufacturing 87,466.7 0 89,230.6 0 97,592.2 0 105,787.0 0 115,652.0 0 124,144.0 0 137,271.0 0
E Electricity, gas and water supply29,053.8
032,761.4
035,176.0
035,081.6
038,659.2
043,098.6
047,863.5
0
F Construction 67,295.8 0 72,532.1 0 77,920.8 0 80,329.4 0 87,987.3 0 96,733.3 0 109,836.0 0
G+H Wholesale, retail trade, repair of motor vehicles, motorcycles and personal and households goods; hotels and restaurants
220,430.0
0
230,900.0
0
246,940.0
0
261,283.0
0
287,425.0
0
321,806.0
0
338,622.0
0
G Wholesale, retail trade, repair of motor vehicles, motorcycles and personal and household goods 175,522.0
0
186,511.0
0
201,491.0
0
213,059.0
0
233,935.0
0
261,670.0
0
274,040.0
0
H Hotels and restaurants 44,907.6 0 44,388.6 0 45,449.4 0 48,223.6 0 53,489.4 0 60,135.8 0 64,581.5 0
I Transport, storage and communications 99,124.6
0100,782.0
0104,137.0
0101,214.0
0105,551.0
0113,087.0
0116,299.0
0
Land transport; transport via pipelines, water transport; air transport; Supporting and auxiliary transport activities; activities of travel agencies 54,000.3
0
55,096.1
0
57,485.7
0
59,000.3
0
63,870.2
0
70,810.6
0
73,646.5
0
Post and telecommunications 45,124.3 0 45,686.3 0 46,650.9 0 42,213.5 0 41,680.4 0 42,276.8 0 42,652.8 0
J+K Financial intermediation; real estate, renting and business activities 207,725.0
0
227,739.00
242,489.00
254,705.00
268,811.00
283,586.00
301,456.00
J Financial intermediation 105,090.0 0 104,102.0 0 110,349.0 0 114,417.0 0 121,228.0 0 128,180.0 0 141,003.0 0
K Real estate, renting and business activities 102,635.0
0123,638.0
0132,140.0
0140,289.0
0147,583.0
0155,407.0
0160,454.0
0
L Public administration and defence; compulsory social security 1 86,703.0
0
92,012.10
98,779.10
107,922.00
115,677.00
115,419.00
118,988.00
M+N+O Education; health and social work; other community, social and personal services 2 104,478.0
0
108,116.00
116,458.00
126,350.00
134,051.00
137,897.00
142,976.00
M Education 62,679.6 0 63,779.3 0 69,243.1 0 75,429.3 0 78,501.6 0 78,288.1 0 79,100.0 0
N Health and social work 6,675.9 0 7,015.6 0 7,176.9 0 7,628.7 0 8,043.5 0 8,399.7 0 8,781.3 0
O Other community, social and personal services 35,122.2
037,321.0
040,038.3
043,291.9
047,505.9
051,209.6
055,094.9
0
P Private households with employed persons 7,422.9
07,583.7
08,257.9
08,634.5
09,298.6
010,461.1
010,483.7
0
Plus: Statistical discrepancyVALUE ADDED, GROSS, at basic prices 3 976,932.0
01,035,120.0
01,113,300.0
01,171,960.0
01,264,140.0
01,356,300.0
01,458,760.0
0
Less: Financial intermediation services indirectly measured (FISIM) 48,126.4
0
45,028.50
45,766.20
47,956.60
50,420.20
50,735.80
57,065.10
Plus: Taxes less Subsidies on products 136,525.0
0162,648.0
0172,790.0
0189,725.0
0217,382.0
0236,156.0
0265,501.0
0
Plus: Taxes on products 136,525.0 0 162,648.0 0 172,790.0 0 189,725.0 0 217,382.0 0 236,156.0 0 265,501.0 0
Less: Subsidies on products 0.0 0 0.0 0 0.0 0 0.0 0 0.0 0 0.0 0 0.0 0
Plus: Statistical discrepancy
GROSS DOMESTIC PRODUCT 1,065,330.0 0 1,152,740.0 0 1,240,330.0 0 1,313,730.0 0 1,431,100.0 0 1,541,720.0 0 1,667,190.0 0
1 Includes public health and social work2 Excludes public health and social work3 Includes Financial intermediation services indirectly measured (FISIM).
53
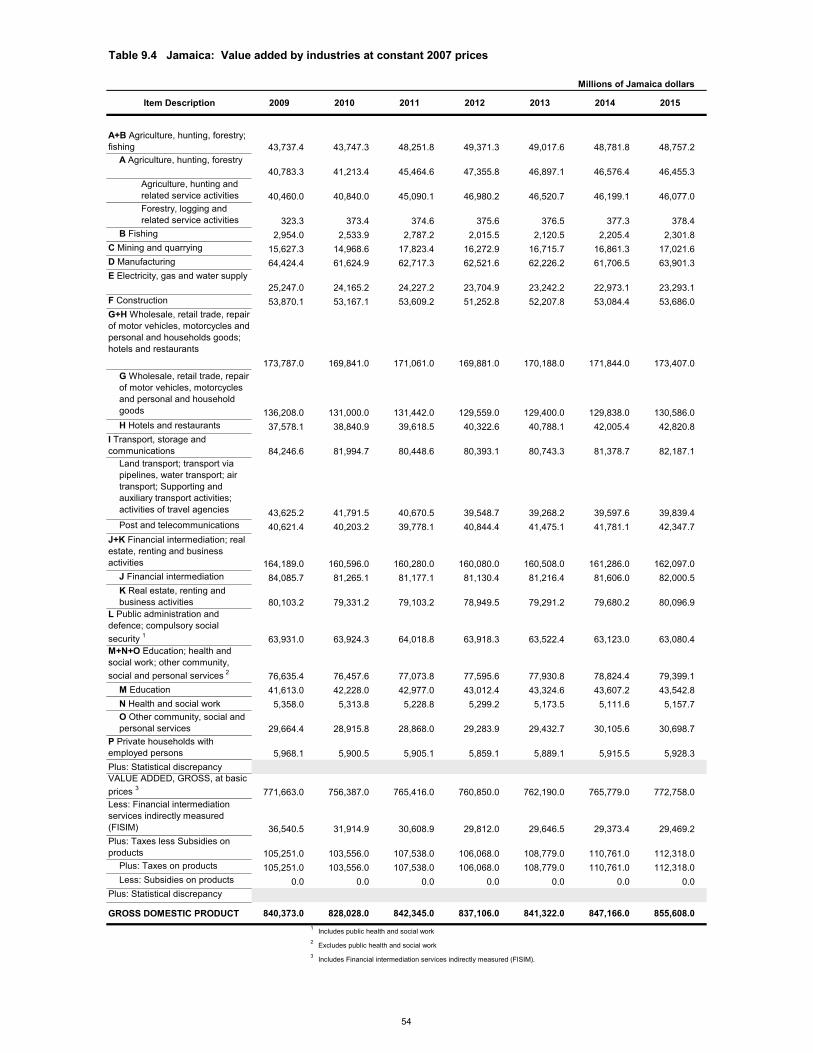
Table 9.4 Jamaica: Value added by industries at constant 2007 prices
Millions of Jamaica dollars
Item Description 2009 2010 2011 2012 2013 2014 2015
A+B Agriculture, hunting, forestry; fishing 43,737.4
043,747.3
048,251.8
049,371.3
049,017.6
048,781.8
048,757.2
0
A Agriculture, hunting, forestry40,783.3
041,213.4
045,464.6
047,355.8
046,897.1
046,576.4
046,455.3
0
Agriculture, hunting and related service activities 40,460.0
040,840.0
045,090.1
046,980.2
046,520.7
046,199.1
046,077.0
0
Forestry, logging and related service activities 323.3
0373.4
0374.6
0375.6
0376.5
0377.3
0378.4
0
B Fishing 2,954.0 0 2,533.9 0 2,787.2 0 2,015.5 0 2,120.5 0 2,205.4 0 2,301.8 0
C Mining and quarrying 15,627.3 0 14,968.6 0 17,823.4 0 16,272.9 0 16,715.7 0 16,861.3 0 17,021.6 0
D Manufacturing 64,424.4 0 61,624.9 0 62,717.3 0 62,521.6 0 62,226.2 0 61,706.5 0 63,901.3 0
E Electricity, gas and water supply25,247.0
024,165.2
024,227.2
023,704.9
023,242.2
022,973.1
023,293.1
0
F Construction 53,870.1 0 53,167.1 0 53,609.2 0 51,252.8 0 52,207.8 0 53,084.4 0 53,686.0 0
G+H Wholesale, retail trade, repair of motor vehicles, motorcycles and personal and households goods; hotels and restaurants
173,787.0
0
169,841.0
0
171,061.0
0
169,881.0
0
170,188.0
0
171,844.0
0
173,407.0
0
G Wholesale, retail trade, repair of motor vehicles, motorcycles and personal and household goods 136,208.0
0
131,000.0
0
131,442.0
0
129,559.0
0
129,400.0
0
129,838.0
0
130,586.0
0
H Hotels and restaurants 37,578.1 0 38,840.9 0 39,618.5 0 40,322.6 0 40,788.1 0 42,005.4 0 42,820.8 0
I Transport, storage and communications 84,246.6
081,994.7
080,448.6
080,393.1
080,743.3
081,378.7
082,187.1
0
Land transport; transport via pipelines, water transport; air transport; Supporting and auxiliary transport activities; activities of travel agencies 43,625.2
0
41,791.5
0
40,670.5
0
39,548.7
0
39,268.2
0
39,597.6
0
39,839.4
0
Post and telecommunications 40,621.4 0 40,203.2 0 39,778.1 0 40,844.4 0 41,475.1 0 41,781.1 0 42,347.7 0
J+K Financial intermediation; real estate, renting and business activities 164,189.0
0
160,596.00
160,280.00
160,080.00
160,508.00
161,286.00
162,097.00
J Financial intermediation 84,085.7 0 81,265.1 0 81,177.1 0 81,130.4 0 81,216.4 0 81,606.0 0 82,000.5 0
K Real estate, renting and business activities 80,103.2
079,331.2
079,103.2
078,949.5
079,291.2
079,680.2
080,096.9
0
L Public administration and defence; compulsory social security 1 63,931.0
0
63,924.30
64,018.80
63,918.30
63,522.40
63,123.00
63,080.40
M+N+O Education; health and social work; other community, social and personal services 2 76,635.4
0
76,457.60
77,073.80
77,595.60
77,930.80
78,824.40
79,399.10
M Education 41,613.0 0 42,228.0 0 42,977.0 0 43,012.4 0 43,324.6 0 43,607.2 0 43,542.8 0
N Health and social work 5,358.0 0 5,313.8 0 5,228.8 0 5,299.2 0 5,173.5 0 5,111.6 0 5,157.7 0
O Other community, social and personal services 29,664.4
028,915.8
028,868.0
029,283.9
029,432.7
030,105.6
030,698.7
0
P Private households with employed persons 5,968.1
05,900.5
05,905.1
05,859.1
05,889.1
05,915.5
05,928.3
0
Plus: Statistical discrepancyVALUE ADDED, GROSS, at basic prices 3 771,663.0
0756,387.0
0765,416.0
0760,850.0
0762,190.0
0765,779.0
0772,758.0
0
Less: Financial intermediation services indirectly measured (FISIM) 36,540.5
0
31,914.90
30,608.90
29,812.00
29,646.50
29,373.40
29,469.20
Plus: Taxes less Subsidies on products 105,251.0
0103,556.0
0107,538.0
0106,068.0
0108,779.0
0110,761.0
0112,318.0
0
Plus: Taxes on products 105,251.0 0 103,556.0 0 107,538.0 0 106,068.0 0 108,779.0 0 110,761.0 0 112,318.0 0
Less: Subsidies on products 0.0 0 0.0 0 0.0 0 0.0 0 0.0 0 0.0 0 0.0 0
Plus: Statistical discrepancy
GROSS DOMESTIC PRODUCT 840,373.0 0 828,028.0 0 842,345.0 0 837,106.0 0 841,322.0 0 847,166.0 0 855,608.0 0
1 Includes public health and social work2 Excludes public health and social work3 Includes Financial intermediation services indirectly measured (FISIM).
54

Table 9.5 Jamaica: Gross domestic product by expenditures at current prices
Millions of EC dollars
Item Description 2009 2010 2011 2012 2013 2014 2015
Final consumption expenditure 31,449.5 ## 35,031.6 ## 39,630.8 ## 40,553.4 ## 38,665.4 ## 37,337.1 ## 36,266.9 ##
Household final consumption expenditure 25,878.7
##29,054.8
##33,244.8
##33,832.2
##32,495.4
##31,682.2
##30,767.2
##
NPISHs final consumption expenditure 201.4
##216.4
##221.9
##230.2
##222.5
##220.5
##218.6
##
General government final consumption expenditure 5,369.4
##5,760.3
##6,164.1
##6,490.9
##5,947.7
##5,434.4
##5,281.0
##
Individual consumption expenditureCollective consumption expenditure
Gross capital formation 6,836.5 ## 7,222.1 ## 8,361.9 ## 7,955.0 ## 8,161.9 ## 8,411.8 ## 7,999.0 ##
Gross fixed capital formation 6,771.5 ## 7,111.1 ## 8,167.8 ## 7,832.0 ## 8,053.0 ## 8,241.8 ## 7,946.6 ##
Changes in inventories 65.1 ## 111.0 ## 194.1 ## 123.1 ## 108.9 ## 170.0 ## 52.4 ##
Acquisitions less disposals of valuables
Exports of goods and services 11,194.1 ## 11,197.2 ## 11,844.1 ## 12,036.6 ## 11,732.3 ## 11,699.1 ## 11,437.0 ##
Exports of goods 3,987.1 ## 3,978.5 ## 4,678.0 ## 4,670.0 ## 4,301.9 ## 3,961.9 ## 3,437.3 ##
Exports of services 7,207.0 ## 7,218.8 ## 7,166.1 ## 7,366.6 ## 7,430.5 ## 7,737.2 ## 7,999.7 ##
Less: Imports of goods and services 17,013.8
##17,718.6
##20,847.4
##20,679.2
##20,215.3
##20,020.8
##17,330.9
##
Imports of goods 11,976.0 ## 12,789.0 ## 15,564.7 ## 15,221.5 ## 14,723.5 ## 14,128.8 ## 11,621.0 ##
Imports of services 5,037.9 ## 4,929.6 ## 5,282.7 ## 5,457.6 ## 5,491.8 ## 5,892.0 ## 5,709.9 ##
Plus: Statistical discrepancyGROSS DOMESTIC PRODUCT 32,466.1 ## 35,732.4 ## 38,989.5 ## 39,865.7 ## 38,344.4 ## 37,427.1 ## 38,371.9 ##
Table 9.6 Jamaica: Gross domestic product by expenditures at constant 2007 prices
Millions of EC dollars
Item Description 2009 2010 2011 2012 2013 2014 2015
Final consumption expenditure 30,397.4 ## 30,091.4 ## 30,983.8 ## 30,735.0 ## 30,420.5 ## 30,187.5 ## 29,952.4 ##
Household final consumption expenditure 25,305.9
##24,996.3
##25,981.4
##25,733.4
##25,553.6
##25,346.3
##25,126.5
##
NPISHs final consumption expenditure 207.8
##202.4
##180.9
##171.5
##171.6
##161.3
##163.9
##
General government final consumption expenditure 4,883.7
##4,892.7
##4,821.5
##4,830.1
##4,695.2
##4,679.9
##4,662.0
##
Individual consumption expenditureCollective consumption expenditure
Gross capital formation 6,903.0 ## 6,767.3 ## 7,374.2 ## 6,951.3 ## 7,316.5 ## 7,602.8 ## 7,056.8 ##
Gross fixed capital formation 6,841.0 ## 6,664.8 ## 7,207.9 ## 6,850.9 ## 7,228.5 ## 7,448.3 ## 7,009.5 ##
Changes in inventories 61.9 ## 102.4 ## 166.2 ## 100.4 ## 88.0 ## 154.5 ## 47.2 ##
Acquisitions less disposals of valuables
Exports of goods and services 11,646.3 ## 10,777.7 ## 10,614.4 ## 10,278.0 ## 10,768.6 ## 10,870.4 ## 11,306.6 ##
Exports of goods 3,793.4 ## 3,357.8 ## 3,622.7 ## 3,061.5 ## 3,094.4 ## 2,997.4 ## 2,931.9 ##
Exports of services 7,852.9 ## 7,419.9 ## 6,991.7 ## 7,216.5 ## 7,674.2 ## 7,872.9 ## 8,374.7 ##
Less: Imports of goods and services 16,065.9
##15,279.9
##15,995.6
##15,184.3
##15,561.4
##15,536.6
##14,856.0
##
Imports of goods 11,170.9 ## 10,648.6 ## 11,390.7 ## 10,787.0 ## 10,945.1 ## 10,598.3 ## 9,673.3 ##
Imports of services 4,895.1 ## 4,631.2 ## 4,604.9 ## 4,397.3 ## 4,616.3 ## 4,938.3 ## 5,182.8 ##
Plus: Statistical discrepancy -12.1 ## 29.3 ## -31.0 ## -39.0 ## -38.4 ## 10.2 ## 4.9 ##
GROSS DOMESTIC PRODUCT 32,868.7 ## 32,385.8 ## 32,945.8 ## 32,740.9 ## 32,905.8 ## 33,134.4 ## 33,464.6 ##
55

Table 9.7 Jamaica: Gross domestic product by expenditures at current prices
Millions of Jamaica dollarsItem Description 2009 2010 2011 2012 2013 2014 2015
Final consumption expenditure 1,031,970.0 ## 1,130,130.0 ## 1,260,730.0 ## 1,336,390.0 ## 1,443,080.0 ## 1,538,010.0 ## 1,575,730.0 ##
Household final consumption expenditure 849,172.0
##937,319.0
##1,057,580.0
##1,114,900.0
##1,212,800.0
##1,305,070.0
##1,336,780.0
##
NPISHs final consumption expenditure 6,607.1
##6,981.5
##7,058.7
##7,586.8
##8,305.6
##9,081.0
##9,498.8
##
General government final consumption expenditure 176,189.0
##185,829.0
##196,091.0
##213,901.0
##221,980.0
##223,858.0
##229,448.0
##
Individual consumption expenditureCollective consumption expenditure
Gross capital formation 224,331.0 ## 232,988.0 ## 266,008.0 ## 262,149.0 ## 304,619.0 ## 346,505.0 ## 347,542.0 ##
Gross fixed capital formation 222,197.0 ## 229,408.0 ## 259,834.0 ## 258,093.0 ## 300,554.0 ## 339,502.0 ## 345,265.0 ##
Changes in inventories 2,134.8 ## 3,579.3 ## 6,174.9 ## 4,055.2 ## 4,064.9 ## 7,003.1 ## 2,277.4 ##
Acquisitions less disposals of valuables
Exports of goods and services 367,317.0 ## 361,227.0 ## 376,784.0 ## 396,652.0 ## 437,876.0 ## 481,916.0 ## 496,915.0 ##
Exports of goods 130,831.0 ## 128,347.0 ## 148,817.0 ## 153,893.0 ## 160,555.0 ## 163,199.0 ## 149,343.0 ##
Exports of services 236,486.0 ## 232,880.0 ## 227,967.0 ## 242,759.0 ## 277,321.0 ## 318,717.0 ## 347,572.0 ##
Less: Imports of goods and services 558,285.0
##571,608.0
##663,195.0
##681,458.0
##754,481.0
##824,708.0
##752,995.0
##
Imports of goods 392,975.0 ## 412,576.0 ## 495,142.0 ## 501,608.0 ## 549,515.0 ## 582,002.0 ## 504,910.0 ##
Imports of services 165,311.0 ## 159,032.0 ## 168,053.0 ## 179,850.0 ## 204,966.0 ## 242,706.0 ## 248,085.0 ##
Plus: Statistical discrepancyGROSS DOMESTIC PRODUCT 1,065,330.0 ## 1,152,740.0 ## 1,240,330.0 ## 1,313,730.0 ## 1,431,100.0 ## 1,541,720.0 ## … ##
Table 9.8 Jamaica: Gross domestic product by expenditures at constant 2007 prices
Millions of Jamaica dollarsItem Description 2009 2010 2011 2012 2013 2014 2015
Final consumption expenditure 777,188.0 ## 769,364.0 ## 792,182.0 ## 785,819.0 ## 777,779.0 ## 771,822.0 ## 765,810.0 ##
Household final consumption expenditure 647,011.0
##639,095.0
##664,281.0
##657,941.0
##653,345.0
##648,044.0
##642,425.0
##
NPISHs final consumption expenditure 5,312.2
##5,173.8
##4,626.1
##4,383.7
##4,388.3
##4,124.3
##4,189.5
##
General government final consumption expenditure 124,865.0
##125,095.0
##123,274.0
##123,494.0
##120,046.0
##119,654.0
##119,196.0
##
Individual consumption expenditureCollective consumption expenditure
Gross capital formation 176,492.0 ## 173,023.0 ## 188,540.0 ## 177,727.0 ## 187,066.0 ## 194,386.0 ## 180,425.0 ##
Gross fixed capital formation 174,909.0 ## 170,404.0 ## 184,289.0 ## 175,160.0 ## 184,816.0 ## 190,436.0 ## 179,217.0 ##
Changes in inventories 1,582.9 ## 2,619.1 ## 4,250.3 ## 2,567.0 ## 2,250.2 ## 3,950.1 ## 1,207.7 ##
Acquisitions less disposals of valuables
Exports of goods and services 297,768.0 ## 275,561.0 ## 271,384.0 ## 262,784.0 ## 275,327.0 ## 277,930.0 ## 289,082.0 ##
Exports of goods 96,988.0 ## 85,850.8 ## 92,623.2 ## 78,275.6 ## 79,115.6 ## 76,637.3 ## 74,960.7 ##
Exports of services 200,780.0 ## 189,710.0 ## 178,761.0 ## 184,508.0 ## 196,212.0 ## 201,292.0 ## 214,121.0 ##
Less: Imports of goods and services 410,767.0
##390,669.0
##408,968.0
##388,226.0
##397,868.0
##397,233.0
##379,833.0
##
Imports of goods 285,612.0 ## 272,260.0 ## 291,233.0 ## 275,798.0 ## 279,841.0 ## 270,973.0 ## 247,322.0 ##
Imports of services 125,155.0 ## 118,409.0 ## 117,735.0 ## 112,429.0 ## 118,027.0 ## 126,260.0 ## 132,512.0 ##
Plus: Statistical discrepancy -308.3 ## 749.5 ## -791.7 ## -997.6 ## -982.3 ## 261.3 ## 124.1 ##
GROSS DOMESTIC PRODUCT 840,373.0 ## 828,028.0 ## 842,345.0 ## 837,106.0 ## 841,322.0 ## 847,166.0 ## 855,608.0 ##
56

Table 9.9 Jamaica: Relations among product, income, savings, and net lending aggregates
Millions of EC dollars
Item Description 2009 2010 2011 2012 2013 2014 2015
GROSS DOMESTIC PRODUCT 32,466.1 35,732.4 38,989.5 39,865.7 38,344.4 37,427.1 38,371.9Compensation of employees - from and to the rest of the world, net 181.3 240.8 98.6 133.5 80.3 95.6 127.3
Plus: Compensation of employees - from the rest of the world 265.8 325.0 217.5 311.2 258.2 263.8 318.6Less: Compensation of employees - to the rest of the world 84.6 84.2 118.9 177.7 177.8 168.2 191.3
Property income - from and to the rest of the world, net -1,971.1 -1,577.5 -1,498.6 -733.7 -1,061.9 -1,081.1 -1,182.9
Plus: Property income - from the rest of the world 363.9 332.3 380.6 586.6 424.1 436.1 378.6Less: Property income - to the rest of the world 2,335.0 1,909.7 1,879.2 1,320.2 1,486.0 1,517.2 1,561.5
Plus: Compensation of employees and property income - from and to the rest of the world, net -1,789.9 -1,336.7 -1,400.0 -600.2 -981.5 -985.6 -1,055.6
Plus: Compensation of employees and property income - from the rest of the world 629.7 657.3 598.1 897.8 682.3 699.9 697.2
Less: Compensation of employees and property income - to the rest of the world 2,419.6 1,993.9 1,998.1 1,497.9 1,663.8 1,685.4 1,752.8
Plus: Taxes less subsidies on production and imports - from and to the rest of the world, net
Plus: Taxes less subsidies on production and imports - from the rest of the worldLess: Taxes less subsidies on production and imports - to the rest of the world
GROSS NATIONAL INCOME, at market prices 30,676.3 34,395.8 37,589.4 39,265.5 37,362.7 36,441.5 37,316.4Plus: Current transfers - from and to the rest of the world, net 4,980.5 5,432.2 5,373.2 5,675.2 5,969.5 6,178.7 6,311.6
Plus: Current transfers - from the rest of the world 5,687.0 6,196.7 6,149.7 6,402.8 6,623.3 6,801.8 6,923.5Less: Current transfers - to the rest of the world 706.5 764.5 776.6 727.6 653.8 623.1 611.9
GROSS NATIONAL DISPOSABLE INCOME 35,656.9 39,827.9 42,962.6 44,940.7 43,332.4 42,620.3 43,628.1Less: Final consumption expenditure / Actual final consumption 31,449.5 35,031.6 39,630.8 40,553.4 38,665.4 37,337.1 36,266.9Plus: Statistical discrepancySAVING, GROSS 4,207.4 4,796.3 3,331.8 4,387.5 4,666.8 5,283.3 7,361.1Plus: Capital transfers - from and to the rest of the world, net 55.7 -59.7 -24.7 -70.6 -35.5 -75.4 -75.4
Plus: Capital transfers - from the rest of the world 172.1 57.7 124.6 61.8 96.8 57.2 57.2Less: Capital transfers - to the rest of the world 116.4 117.4 149.3 132.4 132.4 132.6 132.5
Less: Gross capital formation 6,836.5 7,222.1 8,361.9 7,955.0 8,161.9 8,411.9 7,999.0
Less: Acquisitions less disposals of non-produced non-financial assets 0.0 0.0 0.0 0.0 0.0 0.0 0.0Plus: Statistical discrepancy
NET LENDING(+)/ NET BORROWING(-) OF THE NATION -2,573.5 -2,485.5 -5,054.8 -3,638.1 -3,530.6 -3,204.0 -713.3
Less: Consumption of fixed capital2,617.9 2,845.4 3,040.7 3,107.0 3,006.7 2,923.6 2,941.7
NET NATIONAL INCOME, in market prices 28,058.4 31,550.2 34,548.7 36,158.4 34,356.2 33,517.9 34,374.8NET NATIONAL DISPOSABLE INCOME 33,039.1 36,982.6 39,921.9 41,833.6 40,325.6 39,696.7 40,686.4SAVING, NET 1,589.5 1,950.9 291.2 1,280.4 1,660.1 2,359.7 4,419.5
57

Table 9.10 Jamaica: Relations among product, income, savings, and net lending aggregates
Millions of Jamaica dollars
Item Description 2009 2010 2011 2012 2013 2014 2015
GROSS DOMESTIC PRODUCT 1,065,330.0 1,152,740.0 1,240,330.0 1,313,730.0 1,431,100.0 1,541,720.0 1,667,190.0Compensation of employees - from and to the rest of the world, net 5,947.6 7,768.5 3,136.4 4,399.5 2,997.5 3,937.2 5,531.9
Plus: Compensation of employees - from the rest of the world 8,722.2 10,485.1 6,919.4 10,255.0 9,634.9 10,865.9 13,843.1Less: Compensation of employees - to the rest of the world 2,774.6 2,716.6 3,783.0 5,855.5 6,637.4 6,928.7 8,311.1
Property income - from and to the rest of the world, net -64,679.3 -50,889.8 -47,672.6 -24,177.0 -39,630.7 -44,534.7 -51,394.5
Plus: Property income - from the rest of the world 11,940.5 10,718.6 12,107.1 19,330.2 15,828.7 17,964.0 16,449.8Less: Property income - to the rest of the world 76,619.8 61,608.4 59,779.7 43,507.2 55,459.4 62,498.6 67,844.3
Plus: Compensation of employees and property income - from and to the rest of the world, net -58,731.7 -43,121.3 -44,536.2 -19,777.5 -36,633.2 -40,597.5 -45,862.6
Plus: Compensation of employees and property income - from the rest of the world 20,662.6 21,203.7 19,026.5 29,585.2 25,463.6 28,829.8 30,292.9
Less: Compensation of employees and property income - to the rest of the world 79,394.4 64,325.0 63,562.7 49,362.7 62,096.8 69,427.3 76,155.5
Plus: Taxes less subsidies on production and imports - from and to the rest of the world, net
Plus: Taxes less subsidies on production and imports - from the rest of the worldLess: Taxes less subsidies on production and imports - to the rest of the world
GROSS NATIONAL INCOME, at market prices 1,006,600.0 1,109,620.0 1,195,790.0 1,293,950.0 1,394,460.0 1,501,120.0 1,621,330.0Plus: Current transfers - from and to the rest of the world, net 163,428.0 175,245.0 170,931.0 187,019.0 222,796.0 254,516.0 274,226.0
Plus: Current transfers - from the rest of the world 186,610.0 199,908.0 195,635.0 210,997.0 247,197.0 280,184.0 300,812.0Less: Current transfers - to the rest of the world 23,182.0 24,663.6 24,703.9 23,978.4 24,401.7 25,667.5 26,585.2
GROSS NATIONAL DISPOSABLE INCOME 1,170,030.0 1,284,860.0 1,366,720.0 1,480,970.0 1,617,260.0 1,755,640.0 1,895,560.0Less: Final consumption expenditure / Actual final consumption 1,031,970.0 1,130,130.0 1,260,730.0 1,336,390.0 1,443,080.0 1,538,010.0 1,575,730.0Plus: Statistical discrepancySAVING, GROSS 138,059.0 154,730.0 105,992.0 144,584.0 174,177.0 217,632.0 319,826.0Plus: Capital transfers - from and to the rest of the world, net 1,827.4 -1,925.9 -785.9 -2,325.1 -1,326.1 -3,106.9 -3,274.8
Plus: Capital transfers - from the rest of the world 5,648.3 1,862.3 3,962.3 2,036.4 3,614.1 2,356.2 2,483.6Less: Capital transfers - to the rest of the world 3,820.9 3,788.2 4,748.2 4,361.6 4,940.2 5,463.2 5,758.4
Less: Gross capital formation 224,331.0 232,988.0 266,008.0 262,149.0 304,619.0 346,506.0 347,542.0
Less: Acquisitions less disposals of non-produced non-financial assets 0.0 0.0 0.0 0.0 0.0 0.0 0.0Plus: Statistical discrepancy
NET LENDING(+)/ NET BORROWING(-) OF THE NATION -84,444.6 -80,183.2 -160,802.0 -119,890.0 -131,769.0 -131,980.0 -30,991.2
Less: Consumption of fixed capital85,902.1 91,792.8 96,729.0 102,389.0 112,216.0 120,430.0 127,810.0
NET NATIONAL INCOME, in market prices 920,697.0 1,017,820.0 1,099,060.0 1,191,560.0 1,282,250.0 1,380,690.0 1,493,520.0NET NATIONAL DISPOSABLE INCOME 1,084,130.0 1,193,070.0 1,269,990.0 1,378,580.0 1,505,040.0 1,635,210.0 1,767,750.0SAVING, NET 52,157.3 62,937.4 9,262.9 42,195.2 61,960.1 97,202.0 192,017.0
58


Table 10.1 Montserrat: Value added by industries at current prices
Millions of EC dollars
Item Description 2009 2010 2011 2012 2013 R 2014 R 2015 Pl
A+B Agriculture, hunting, forestry; fishing 1.7
01.5
01.7
02.1
02.0
02.2
02.0
0
A Agriculture, hunting, forestry 1.10
1.10
1.20
1.60
1.40
1.70
1.60
Agriculture, hunting and related service activities 1.1
01.1
01.2
01.5
01.4
01.6
01.5
0
Forestry, logging and related service activities 0.1
00.1
00.1
00.1
00.1
00.1
00.1
0
B Fishing 0.5 0 0.4 0 0.5 0 0.5 0 0.5 0 0.5 0 0.4 0
C Mining and quarrying 0.6 0 0.3 0 1.2 0 0.8 0 1.1 0 1.8 0 2.6 0
D Manufacturing 2.5 0 2.3 0 2.3 0 2.8 0 2.8 0 2.8 0 2.4 0
E Electricity, gas and water supply 4.10
4.40
4.60
4.50
4.60
4.00
4.30
F Construction 12.0 0 11.3 0 11.2 0 12.1 0 13.4 0 14.1 0 8.6 0
G+H Wholesale, retail trade, repair of motor vehicles, motorcycles and personal and households goods; hotels and restaurants 12.4
0
10.4
0
10.7
0
12.6
0
13.0
0
13.4
0
12.8
0
G Wholesale, retail trade, repair of motor vehicles, motorcycles and personal and household goods 10.1
0
8.0
0
8.3
0
9.3
0
9.8
0
9.5
0
9.6
0
H Hotels and restaurants 2.3 0 2.4 0 2.3 0 3.2 0 3.2 0 3.9 0 3.2 0
I Transport, storage and communications 12.6
09.3
010.2
09.0
09.4
09.5
011.2
0
Land transport; transport via pipelines, water transport; air transport; Supporting and auxiliary transport activities; activities of travel agencies 5.8
0
4.2
0
5.0
0
5.0
0
5.4
0
6.0
0
7.0
0
Post and telecommunications 6.8 0 5.0 0 5.2 0 4.0 0 3.9 0 3.5 0 4.2 0
J+K Financial intermediation; real estate, renting and business activities 33.7
0
32.60
45.50
40.40
31.50
29.10
33.60
J Financial intermediation 15.6 0 14.6 0 25.6 0 19.9 0 10.9 0 8.2 0 10.4 0
K Real estate, renting and business activities 18.1
018.0
020.0
020.5
020.5
020.8
023.2
0
L Public administration and defence; compulsory social security 51.6
0
48.40
52.80
48.70
48.70
46.50
45.70
M+N+O Education; health and social work; other community, social and personal services 15.9
0
16.60
17.60
18.70
17.90
17.30
17.70
M Education 5.1 0 5.0 0 5.0 0 5.8 0 5.3 0 5.2 0 5.5 0
N Health and social work 7.7 0 7.9 0 8.0 0 8.2 0 7.9 0 7.6 0 7.7 0
O Other community, social and personal services 3.1
03.8
04.6
04.7
04.7
04.5
04.5
0
P Private households with employed persons 0.6
00.8
01.1
01.1
01.0
00.9
01.0
0
Plus: Statistical discrepancyVALUE ADDED, GROSS, at basic prices 1 146.0
0136.1
0157.2
0151.2
0144.2
0140.7
0141.1
0
Less: Financial intermediation services indirectly measured (FISIM) 1.6
0
1.60
1.70
1.60
1.00
0.80
0.80
Plus: Taxes less Subsidies on products 14.4
013.8
014.8
017.6
016.4
018.6
018.8
0
Plus: Taxes on products 15.4 0 14.7 0 15.8 0 18.6 0 17.4 0 19.6 0 19.8 0
Less: Subsidies on products 1.0 0 1.0 0 1.0 0 1.0 0 1.0 0 1.0 0 1.0 0
Plus: Statistical discrepancy
GROSS DOMESTIC PRODUCT 160.4 0 149.9 0 172.0 0 168.8 0 160.6 0 159.3 0 159.9 0
1 Excludes Financial intermediation services indirectly measured (FISIM) but FISIM is included in the industry data.
59

Table 10.2 Montserrat: Value added by industries at constant 2006 prices
Millions of EC dollars
Item Description 2009 2010 2011 2012 2013 R 2014 R 2015 Pl
A+B Agriculture, hunting, forestry; fishing 1.1
00.9
01.2
01.5
01.5
01.7
01.5
0
A Agriculture, hunting, forestry 0.70
0.60
0.80
1.20
1.10
1.30
1.20
Agriculture, hunting and related service activities 0.7
00.6
00.8
01.1
01.0
01.2
01.1
0
Forestry, logging and related service activities 0.1
00.1
00.1
00.1
00.1
00.1
00.1
0
B Fishing 0.4 0 0.2 0 0.3 0 0.4 0 0.4 0 0.4 0 0.3 0
C Mining and quarrying 1.2 0 0.3 0 1.1 0 0.7 0 1.0 0 1.6 0 2.4 0
D Manufacturing 2.3 0 2.0 0 2.0 0 2.3 0 2.3 0 2.2 0 1.9 0
E Electricity, gas and water supply 3.50
3.70
3.80
3.80
3.80
3.40
3.60
F Construction 9.4 0 8.5 0 8.3 0 8.8 0 9.5 0 10.0 0 6.1 0
G+H Wholesale, retail trade, repair of motor vehicles, motorcycles and personal and households goods; hotels and restaurants 11.8
0
9.8
0
9.5
0
10.5
0
11.0
0
11.2
0
11.2
0
G Wholesale, retail trade, repair of motor vehicles, motorcycles and personal and household goods 9.1
0
7.0
0
7.0
0
7.6
0
7.9
0
7.8
0
7.9
0
H Hotels and restaurants 2.7 0 2.8 0 2.6 0 2.9 0 3.0 0 3.4 0 3.4 0
I Transport, storage and communications 14.4
011.3
012.8
012.5
013.1
013.1
015.5
0
Land transport; transport via pipelines, water transport; air transport; Supporting and auxiliary transport activities; activities of travel agencies 6.8
0
4.3
0
5.8
0
5.4
0
6.1
0
7.1
0
8.9
0
Post and telecommunications 7.5 0 7.0 0 7.1 0 7.1 0 6.9 0 6.0 0 6.6 0
J+K Financial intermediation; real estate, renting and business activities 31.1
0
31.40
31.80
32.50
33.60
33.60
36.30
J Financial intermediation 13.2 0 13.7 0 14.2 0 14.6 0 15.4 0 15.3 0 17.8 0
K Real estate, renting and business activities 17.8
017.7
017.7
017.9
018.2
018.3
018.5
0
L Public administration and defence; compulsory social security 45.4
0
47.60
52.40
52.10
56.40
54.00
52.30
M+N+O Education; health and social work; other community, social and personal services 16.8
0
17.30
17.90
18.60
18.70
20.70
21.10
M Education 5.2 0 5.4 0 5.3 0 6.1 0 5.5 0 5.9 0 6.1 0
N Health and social work 7.9 0 8.2 0 8.8 0 8.7 0 9.4 0 10.8 0 11.0 0
O Other community, social and personal services 3.7
03.7
03.8
03.8
03.8
04.0
04.0
0
P Private households with employed persons 0.7
00.8
00.9
00.8
00.9
00.9
00.8
0
Plus: Statistical discrepancyVALUE ADDED, GROSS, at basic prices 1 136.1
0132.0
0140.1
0142.3
0149.9
0150.4
0150.9
0
Less: Financial intermediation services indirectly measured (FISIM) 1.4
0
1.40
1.60
1.80
1.80
1.80
1.90
Plus: Taxes less Subsidies on products 13.4
013.4
013.2
016.6
017.1
019.9
020.1
0
Plus: Taxes on products Less: Subsidies on products
Plus: Statistical discrepancy
GROSS DOMESTIC PRODUCT 149.6 0 145.4 0 153.3 0 158.9 0 167.0 0 170.3 0 171.0 0
1 Excludes Financial intermediation services indirectly measured (FISIM) but FISIM is included in the industry data.
60

Table 10.3 Montserrat: Gross domestic product by expenditures at current prices
Millions of EC dollars
Item Description 2009 2010 2011 2012 2013 R 2014 R 2015 Pl
Final consumption expenditure 200.5 ## 196.0 ## 224.9 ## 227.5 ## 245.8 ## 211.7 ## 223.1 ##
Household final consumption expenditure 118.5
##123.0
##143.0
##143.3
##161.4
##131.2
##143.9
##
NPISHs final consumption expenditureGeneral government final consumption expenditure 82.0
##72.9
##81.9
##84.3
##84.3
##80.5
##79.1
##
Individual consumption expenditureCollective consumption expenditure
Gross capital formation 37.2 ## 36.1 ## 36.8 ## 38.1 ## 42.0 ## 44.3 ## 27.1 ##
Gross fixed capital formation 37.2 ## 36.1 ## 36.8 ## 38.1 ## 42.0 ## 44.3 ## 27.1 ##
Changes in inventoriesAcquisitions less disposals of valuables
Exports of goods and services 40.6 ## 33.1 ## 39.0 ## 40.9 ## 51.5 ## 45.5 ## 45.0 ##
Exports of goods 8.7 ## 2.6 ## 6.7 ## 5.0 ## 16.2 ## 9.2 ## 8.1 ##
Exports of services 31.9 ## 30.4 ## 32.3 ## 35.9 ## 35.3 ## 36.4 ## 36.9 ##
Less: Imports of goods and services 117.9
##115.2
##128.7
##137.7
##178.6
##142.2
##135.3
##
Imports of goods 70.4 ## 69.7 ## 80.3 ## 88.6 ## 100.7 ## 98.6 ## 92.4 ##
Imports of services 47.5 ## 45.5 ## 48.4 ## 49.1 ## 77.9 ## 43.6 ## 42.9 ##
Plus: Statistical discrepancyGROSS DOMESTIC PRODUCT 160.4 ## 149.9 ## 172.0 ## 168.8 ## 160.6 ## 159.3 ## 159.9 ##
61

Table 10.4 Montserrat: Relations among product, income, savings, and net lending aggregates
Millions of EC dollars
Item Description 2009 2010 2011 2012 2013 R 2014 R 2015 Pl
GROSS DOMESTIC PRODUCT 160.4 149.9 172.0 168.8 160.6 159.3 159.9Compensation of employees - from and to the rest of the world, net -2.1 -1.2 -1.3 -1.1 -1.2 -0.4 -0.4
Plus: Compensation of employees - from the rest of the world 0.0 0.0 0.0 0.0 0.0 0.0 0.0Less: Compensation of employees - to the rest of the world 2.1 1.2 1.3 1.1 1.2 0.4 0.4
Property income - from and to the rest of the world, net -7.7 -9.1 -8.3 -6.9 -4.2 -1.3 -2.2
Plus: Property income - from the rest of the world 2.8 1.4 1.0 1.1 0.9 1.3 0.4Less: Property income - to the rest of the world 10.6 10.5 9.3 8.0 5.1 2.6 2.6
Plus: Compensation of employees and property income - from and to the rest of the world, net -9.8 -10.3 -9.6 -7.9 -5.5 -1.8 -2.6
Plus: Compensation of employees and property income - from the rest of the world 2.8 1.4 1.0 1.1 0.9 1.3 0.4
Less: Compensation of employees and property income - to the rest of the world 12.6 11.6 10.6 9.1 6.3 3.0 3.0
Plus: Taxes less subsidies on production and imports - from and to the rest of the world, net
Plus: Taxes less subsidies on production and imports - from the rest of the worldLess: Taxes less subsidies on production and imports - to the rest of the world
GROSS NATIONAL INCOME, at market prices 150.6 139.6 162.4 160.9 155.1 157.5 157.2Plus: Current transfers - from and to the rest of the world, net 52.8 39.8 72.1 68.0 54.3 66.2 88.4
Plus: Current transfers - from the rest of the world 65.5 51.2 83.1 82.2 74.8 85.2 107.3Less: Current transfers - to the rest of the world 12.7 11.4 11.0 14.2 20.5 19.0 18.9
GROSS NATIONAL DISPOSABLE INCOME 203.4 179.4 234.5 228.9 209.4 223.7 245.6Less: Final consumption expenditure / Actual final consumption 200.5 196.0 224.9 227.5 245.8 211.7 223.1Plus: Statistical discrepancySAVING, GROSS 2.9 -16.5 9.6 1.4 -36.3 12.0 22.6Plus: Capital transfers - from and to the rest of the world, net 50.6 29.6 19.1 51.7 60.2 33.2 35.1
Plus: Capital transfers - from the rest of the world 58.2 36.9 26.7 55.5 63.8 37.0 38.8Less: Capital transfers - to the rest of the world 7.6 7.3 7.6 3.8 3.6 3.7 3.7
Less: Gross capital formation 37.2 36.1 36.8 38.1 42.0 44.3 27.1
Less: Acquisitions less disposals of non-produced non-financial assets 0.0 0.0 0.0 0.0 0.0 0.0 0.0Plus: Statistical discrepancy
NET LENDING(+)/ NET BORROWING(-) OF THE NATION 16.3 -23.0 -8.1 15.0 -18.1 0.9 30.6
Less: Consumption of fixed capital
NET NATIONAL INCOME, in market pricesNET NATIONAL DISPOSABLE INCOMESAVING, NET
62


Table 11.1 Saint Kitts and Nevis: Value added by industries at current prices
Millions of EC dollars
Item Description 2009 2010 2011 2012 2013 2014 2015 Pl
A+B Agriculture, hunting, forestry; fishing 23.5
026.7
030.1
028.2
027.8
026.2
024.5
0
A Agriculture, hunting, forestry 15.90
18.80
20.40
19.10
20.10
18.40
16.50
Agriculture, hunting and related service activities 15.3
018.2
019.9
018.5
019.5
017.8
015.9
0
Forestry, logging and related service activities 0.6
00.6
00.6
00.6
00.6
00.6
00.6
0
B Fishing 7.6 0 7.9 0 9.7 0 9.1 0 7.7 0 7.8 0 8.0 0
C Mining and quarrying 3.1 0 2.2 0 2.0 0 2.0 0 3.4 0 3.6 0 3.4 0
D Manufacturing 150.6 0 173.8 0 174.7 0 166.3 0 168.7 0 159.9 0 155.6 0
E Electricity, gas and water supply 26.50
27.20
27.10
27.90
25.40
27.70
30.30
F Construction 305.3 0 270.7 0 269.1 0 220.1 0 268.5 0 342.3 0 383.7 0
G+H Wholesale, retail trade, repair of motor vehicles, motorcycles and personal and households goods; hotels and restaurants 230.1
0
253.4
0
278.9
0
268.5
0
283.2
0
290.4
0
303.1
0
G Wholesale, retail trade, repair of motor vehicles, motorcycles and personal and household goods 146.1
0
147.4
0
149.3
0
135.0
0
144.4
0
145.9
0
154.7
0
H Hotels and restaurants 84.1 0 106.0 0 129.5 0 133.5 0 138.8 0 144.5 0 148.4 0
I Transport, storage and communications 186.3
0204.2
0225.3
0223.3
0230.7
0252.0
0249.2
0
Land transport; transport via pipelines, water transport; air transport; Supporting and auxiliary transport activities; activities of travel agencies 107.2
0
118.5
0
138.0
0
135.7
0
142.4
0
160.2
0
155.2
0
Post and telecommunications 79.1 0 85.7 0 87.2 0 87.6 0 88.3 0 91.8 0 94.1 0
J+K Financial intermediation; real estate, renting and business activities 491.8
0
393.50
393.60
414.30
462.40
453.10
458.90
J Financial intermediation 207.8 0 114.2 0 114.2 0 134.9 0 173.9 0 153.7 0 150.2 0
K Real estate, renting and business activities 284.0
0279.3
0279.4
0279.4
0288.5
0299.4
0308.7
0
L Public administration and defence; compulsory social security 148.3
0
153.10
163.20
166.50
180.60
198.40
211.50
M+N+O Education; health and social work; other community, social and personal services 179.3
0
177.70
177.80
180.50
184.00
198.90
211.70
M Education 85.7 0 90.5 0 90.1 0 91.2 0 90.7 0 97.2 0 103.2 0
N Health and social work 46.7 0 43.6 0 45.1 0 45.7 0 49.9 0 53.1 0 57.8 0
O Other community, social and personal services 47.0
043.6
042.6
043.6
043.4
048.6
050.7
0
P Private households with employed persons 5.9
05.3
05.6
06.1
06.1
05.5
05.5
0
Plus: Statistical discrepancyVALUE ADDED, GROSS, at basic prices 1 1,726.4
01,672.3
01,730.0
01,683.9
01,812.8
01,934.3
02,021.4
0
Less: Financial intermediation services indirectly measured (FISIM) 24.5
0
15.60
17.40
19.90
28.10
23.80
16.00
Plus: Taxes less Subsidies on products 226.3
0231.2
0303.7
0299.2
0315.3
0354.7
0345.1
0
Plus: Taxes on products 228.3 0 231.2 0 303.7 0 299.2 0 315.3 0 354.7 0 345.1 0
Less: Subsidies on products 2.1 0 0.0 0 0.0 0 0.0 0 0.0 0 0.0 0 0.0 0
Plus: Statistical discrepancy
GROSS DOMESTIC PRODUCT 1,952.7 0 1,903.5 0 2,033.7 0 1,983.1 0 2,128.0 0 2,289.0 0 2,366.5 0
1 Excludes Financial intermediation services indirectly measured (FISIM) but FISIM is included in the industry data.
63

Table 11.2 Saint Kitts and Nevis: Value added by industries at constant 2006 prices
Millions of EC dollars
Item Description 2009 2010 2011 2012 2013 2014 2015 Pl
A+B Agriculture, hunting, forestry; fishing 20.2
020.7
023.6
021.7
021.0
019.9
018.9
0
A Agriculture, hunting, forestry 13.20
13.70
14.50
14.00
14.70
13.40
12.30
Agriculture, hunting and related service activities 12.9
013.4
014.1
013.6
014.3
013.1
012.0
0
Forestry, logging and related service activities 0.3
00.3
00.3
00.3
00.4
00.4
00.4
0
B Fishing 6.9 0 6.9 0 9.2 0 7.7 0 6.3 0 6.5 0 6.6 0
C Mining and quarrying 2.9 0 2.2 0 2.0 0 1.9 0 3.4 0 3.6 0 3.4 0
D Manufacturing 117.4 0 107.3 0 97.5 0 89.3 0 91.0 0 84.1 0 85.6 0
E Electricity, gas and water supply 24.40
24.00
25.00
23.50
23.70
24.10
24.80
F Construction 272.5 0 250.7 0 219.8 0 199.9 0 248.4 0 285.3 0 304.5 0
G+H Wholesale, retail trade, repair of motor vehicles, motorcycles and personal and households goods; hotels and restaurants 202.5
0
222.6
0
243.2
0
233.9
0
244.1
0
251.2
0
266.2
0
G Wholesale, retail trade, repair of motor vehicles, motorcycles and personal and household goods 120.7
0
121.0
0
114.4
0
102.0
0
108.1
0
108.4
0
118.3
0
H Hotels and restaurants 81.9 0 101.6 0 128.7 0 131.9 0 136.0 0 142.8 0 147.9 0
I Transport, storage and communications 188.7
0202.2
0205.5
0200.8
0203.1
0215.9
0230.4
0
Land transport; transport via pipelines, water transport; air transport; Supporting and auxiliary transport activities; activities of travel agencies 97.9
0
103.3
0
105.0
0
100.3
0
103.3
0
113.0
0
127.0
0
Post and telecommunications 90.8 0 99.0 0 100.6 0 100.5 0 99.8 0 102.9 0 103.5 0
J+K Financial intermediation; real estate, renting and business activities 463.4
0
420.00
418.00
449.90
472.00
489.50
508.90
J Financial intermediation 202.0 0 150.5 0 156.2 0 189.1 0 202.0 0 213.5 0 226.1 0
K Real estate, renting and business activities 261.4
0269.5
0261.8
0260.8
0269.9
0276.0
0282.7
0
L Public administration and defence; compulsory social security 132.0
0
136.30
145.20
148.20
160.80
169.80
175.70
M+N+O Education; health and social work; other community, social and personal services 160.9
0
156.10
152.50
153.40
154.40
161.40
170.90
M Education 76.2 0 77.9 0 76.5 0 76.3 0 74.6 0 76.2 0 79.5 0
N Health and social work 41.5 0 38.5 0 39.4 0 39.9 0 43.4 0 44.9 0 47.8 0
O Other community, social and personal services 43.1
039.6
036.6
037.2
036.3
040.3
043.6
0
P Private households with employed persons 5.1
04.8
05.2
05.6
05.6
04.7
04.6
0
Plus: Statistical discrepancyVALUE ADDED, GROSS, at basic prices 1 1,562.8
01,518.0
01,505.1
01,493.4
01,591.3
01,672.7
01,754.4
0
Less: Financial intermediation services indirectly measured (FISIM) 27.3
0
28.80
32.50
34.70
36.20
36.80
39.30
Plus: Taxes less Subsidies on products 204.8
0209.9
0264.2
0265.3
0276.8
0306.7
0299.5
0
Plus: Taxes on products Less: Subsidies on products
Plus: Statistical discrepancy
GROSS DOMESTIC PRODUCT 1,767.6 0 1,727.9 0 1,769.3 0 1,758.7 0 1,868.1 0 1,979.5 0 2,053.9 0
1 Excludes Financial intermediation services indirectly measured (FISIM) but FISIM is included in the industry data.
64
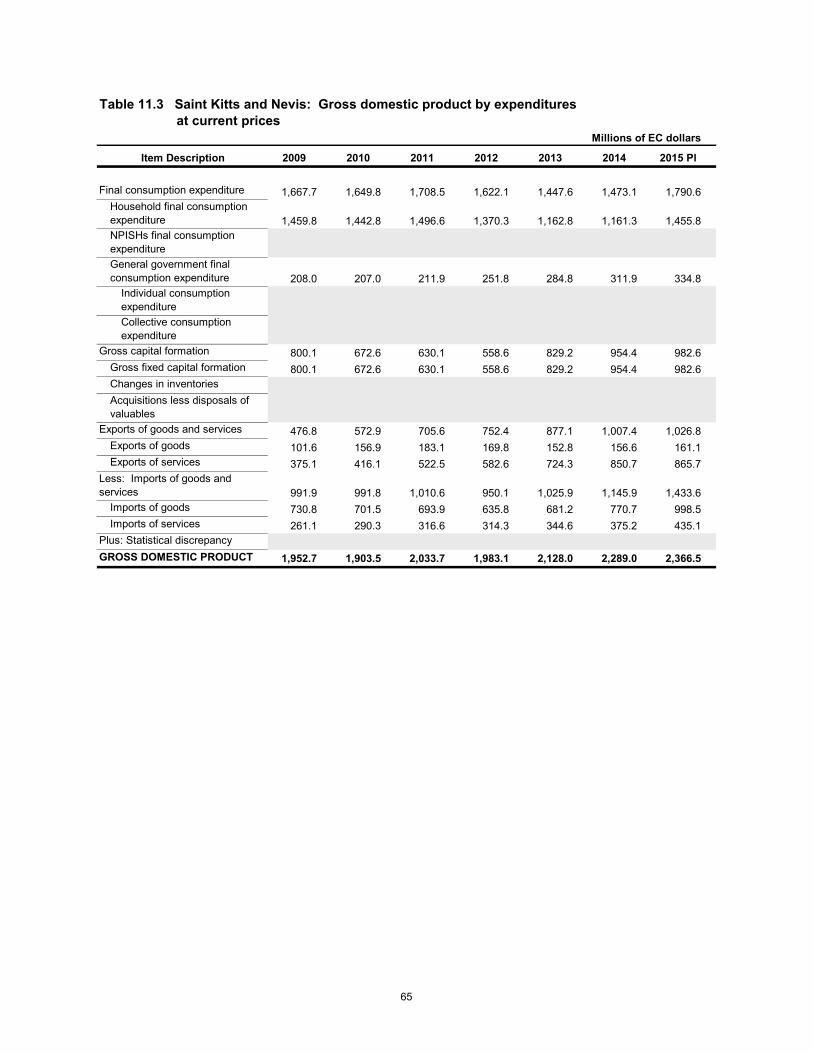
Table 11.3 Saint Kitts and Nevis: Gross domestic product by expendituresat current prices
Millions of EC dollars
Item Description 2009 2010 2011 2012 2013 2014 2015 Pl
Final consumption expenditure 1,667.7 ## 1,649.8 ## 1,708.5 ## 1,622.1 ## 1,447.6 ## 1,473.1 ## 1,790.6 ##
Household final consumption expenditure 1,459.8
##1,442.8
##1,496.6
##1,370.3
##1,162.8
##1,161.3
##1,455.8
##
NPISHs final consumption expenditureGeneral government final consumption expenditure 208.0
##207.0
##211.9
##251.8
##284.8
##311.9
##334.8
##
Individual consumption expenditureCollective consumption expenditure
Gross capital formation 800.1 ## 672.6 ## 630.1 ## 558.6 ## 829.2 ## 954.4 ## 982.6 ##
Gross fixed capital formation 800.1 ## 672.6 ## 630.1 ## 558.6 ## 829.2 ## 954.4 ## 982.6 ##
Changes in inventoriesAcquisitions less disposals of valuables
Exports of goods and services 476.8 ## 572.9 ## 705.6 ## 752.4 ## 877.1 ## 1,007.4 ## 1,026.8 ##
Exports of goods 101.6 ## 156.9 ## 183.1 ## 169.8 ## 152.8 ## 156.6 ## 161.1 ##
Exports of services 375.1 ## 416.1 ## 522.5 ## 582.6 ## 724.3 ## 850.7 ## 865.7 ##
Less: Imports of goods and services 991.9
##991.8
##1,010.6
##950.1
##1,025.9
##1,145.9
##1,433.6
##
Imports of goods 730.8 ## 701.5 ## 693.9 ## 635.8 ## 681.2 ## 770.7 ## 998.5 ##
Imports of services 261.1 ## 290.3 ## 316.6 ## 314.3 ## 344.6 ## 375.2 ## 435.1 ##
Plus: Statistical discrepancyGROSS DOMESTIC PRODUCT 1,952.7 ## 1,903.5 ## 2,033.7 ## 1,983.1 ## 2,128.0 ## 2,289.0 ## 2,366.5 ##
65

Table 11.4 St. Kitts and Nevis: Relations among product, income, savings,and net lending aggregates
Millions of EC dollars
Item Description 2009 2010 2011 2012 2013 2014 2015 Pl
GROSS DOMESTIC PRODUCT 1,952.7 1,903.5 2,033.7 1,983.1 2,128.0 2,289.0 2,366.5Compensation of employees - from and to the rest of the world, net -1.5 -1.1 -0.1 0.1 0.2 0.2 0.1
Plus: Compensation of employees - from the rest of the world 0.6 0.6 1.0 1.0 1.1 1.1 1.1Less: Compensation of employees - to the rest of the world 2.1 1.7 1.1 0.8 0.8 1.0 1.0
Property income - from and to the rest of the world, net -90.1 -77.5 -68.8 -58.7 -61.4 -69.5 -68.2
Plus: Property income - from the rest of the world 27.7 20.3 16.3 13.0 12.7 12.4 13.9Less: Property income - to the rest of the world 117.8 97.9 85.1 71.7 74.1 81.8 82.2
Plus: Compensation of employees and property income - from and to the rest of the world, net -91.5 -78.7 -68.9 -58.5 -61.2 -69.3 -68.1
Plus: Compensation of employees and property income - from the rest of the world 28.3 20.9 17.2 14.0 13.7 13.5 15.1
Less: Compensation of employees and property income - to the rest of the world 119.9 99.6 86.2 72.5 74.9 82.8 83.2
Plus: Taxes less subsidies on production and imports - from and to the rest of the world, net
Plus: Taxes less subsidies on production and imports - from the rest of the worldLess: Taxes less subsidies on production and imports - to the rest of the world
GROSS NATIONAL INCOME, at market prices 1,861.1 1,824.9 1,964.8 1,924.5 2,066.9 2,219.7 2,298.4Plus: Current transfers - from and to the rest of the world, net 121.9 125.6 125.8 122.7 121.7 113.3 105.3
Plus: Current transfers - from the rest of the world 164.1 173.0 183.2 205.6 203.1 205.2 207.3Less: Current transfers - to the rest of the world 42.2 47.4 57.4 82.9 81.4 91.9 102.0
GROSS NATIONAL DISPOSABLE INCOME 1,983.1 1,950.5 2,090.6 2,047.2 2,188.6 2,333.0 2,403.7Less: Final consumption expenditure / Actual final consumption 1,667.7 1,649.8 1,708.5 1,622.1 1,447.6 1,473.1 1,790.6Plus: Statistical discrepancySAVING, GROSS 315.3 300.7 382.1 425.1 741.0 859.8 613.1Plus: Capital transfers - from and to the rest of the world, net 69.6 162.5 232.8 399.7 332.4 328.5 263.5
Plus: Capital transfers - from the rest of the world 70.3 163.2 233.6 400.5 333.3 329.5 264.5Less: Capital transfers - to the rest of the world 0.7 0.7 0.8 0.8 0.8 0.9 1.0
Less: Gross capital formation 800.1 672.6 630.1 558.6 829.2 954.4 982.6
Less: Acquisitions less disposals of non-produced non-financial assets 0.0 0.0 0.0 0.0 0.0 0.0 0.0Plus: Statistical discrepancy
NET LENDING(+)/ NET BORROWING(-) OF THE NATION -415.2 -209.4 -15.2 266.2 244.2 234.0 -106.1
Less: Consumption of fixed capital
NET NATIONAL INCOME, in market pricesNET NATIONAL DISPOSABLE INCOMESAVING, NET
66


Table 12.1 Saint Lucia: Value added by industries at current prices
Millions of EC dollars
Item Description 2009 2010 2011 2012 2013 2014 2015 Pl
A+B Agriculture, hunting, forestry; fishing 114.6
085.3
076.6
087.6
097.5
089.4
093.9
0
A Agriculture, hunting, forestry 94.1 0 64.6 0 55.5 0 66.0 0 75.5 0 67.1 0 72.8 0
Agriculture, hunting and related service activities 91.6
063.3
054.0
064.5
074.0
065.6
071.3
0
Forestry, logging and related service activities 2.5
01.3
01.5
01.5
01.5
01.5
01.5
0
B Fishing 20.5 0 20.7 0 21.2 0 21.6 0 22.1 0 22.3 0 21.2 0
C Mining and quarrying 7.1 0 7.0 0 7.0 0 7.2 0 6.9 0 6.3 0 6.0 0
D Manufacturing 108.1 0 103.5 0 110.9 0 107.5 0 94.4 0 89.2 0 91.7 0
E Electricity, gas and water supply 115.80
118.10
113.40
120.50
140.50
144.50
150.40
F Construction 249.8 0 232.0 0 238.3 0 232.2 0 202.3 0 175.9 0 188.2 0
G+H Wholesale, retail trade, repair of motor vehicles, motorcycles and personal and households goods; hotels and restaurants 553.5
0
677.6
0
707.4
0
724.3
0
728.1
0
804.0
0
828.4
0
G Wholesale, retail trade, repair of motor vehicles, motorcycles and personal and household goods 219.0
0
219.4
0
267.9
0
260.0
0
237.3
0
239.4
0
237.0
0
H Hotels and restaurants 334.5 0 458.2 0 439.5 0 464.3 0 490.8 0 564.6 0 591.5 0
I Transport, storage and communications 485.6
0550.1
0557.2
0547.8
0552.6
0566.0
0575.7
0
Land transport; transport via pipelines, water transport; air transport; Supporting and auxiliary transport activities; activities of travel agencies 294.8
0
354.9
0
375.1
0
369.4
0
387.3
0
405.9
0
400.9
0
Post and telecommunications 190.8 0 195.2 0 182.1 0 178.4 0 165.3 0 160.2 0 174.8 0
J+K Financial intermediation; real estate, renting and business activities 684.9
0
667.30
695.10
708.20
704.50
740.80
763.20
J Financial intermediation 212.0 0 179.3 0 178.4 0 173.8 0 190.3 0 187.3 0 199.3 0
K Real estate, renting and business activities 473.0
0488.0
0516.7
0534.4
0514.2
0553.5
0563.9
0
L Public administration and defence; compulsory social security 173.5
0
187.30
203.70
220.10
219.70
229.70
227.70
M+N+O Education; health and social work; other community, social and personal services 295.6
0
318.80
340.10
339.90
334.10
363.00
372.90
M Education 118.2 0 127.3 0 130.8 0 128.6 0 131.8 0 127.8 0 136.8 0
N Health and social work 52.2 0 54.0 0 57.7 0 60.0 0 64.9 0 63.2 0 64.8 0
O Other community, social and personal services 125.2
0137.5
0151.6
0151.3
0137.4
0172.0
0171.3
0
P Private households with employed persons 3.7
03.8
04.2
04.1
04.0
03.7
03.8
0
Plus: Statistical discrepancyVALUE ADDED, GROSS, at basic prices 1 2,723.8
02,892.1
02,994.8
03,044.7
03,023.8
03,147.6
03,229.8
0
Less: Financial intermediation services indirectly measured (FISIM) 68.3
0
58.80
59.10
54.60
60.70
64.90
72.20
Plus: Taxes less Subsidies on products 464.7
0461.1
0462.9
0462.1
0534.9
0595.1
0634.2
0
Plus: Taxes on products 474.5 0 474.5 0 491.9 0 489.9 0 554.8 0 609.8 0 648.2 0
Less: Subsidies on products 9.8 0 13.4 0 29.0 0 27.8 0 19.9 0 14.7 0 14.0 0
Plus: Statistical discrepancy
GROSS DOMESTIC PRODUCT 3,188.6 0 3,353.1 0 3,457.7 0 3,506.8 0 3,558.7 0 3,742.7 0 3,864.1 0
1 Excludes Financial intermediation services indirectly measured (FISIM) but FISIM is included in the industry data.
67
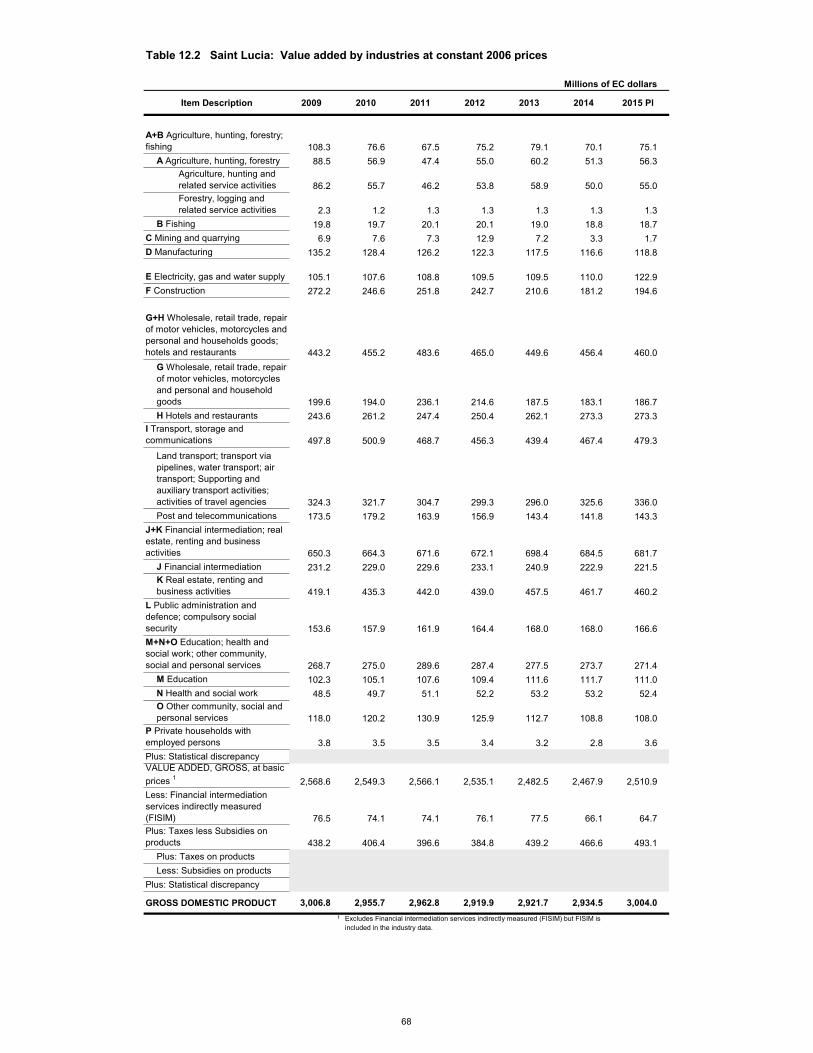
Table 12.2 Saint Lucia: Value added by industries at constant 2006 prices
Millions of EC dollars
Item Description 2009 2010 2011 2012 2013 2014 2015 Pl
A+B Agriculture, hunting, forestry; fishing 108.3
076.6
067.5
075.2
079.1
070.1
075.1
0
A Agriculture, hunting, forestry 88.5 0 56.9 0 47.4 0 55.0 0 60.2 0 51.3 0 56.3 0
Agriculture, hunting and related service activities 86.2
055.7
046.2
053.8
058.9
050.0
055.0
0
Forestry, logging and related service activities 2.3
01.2
01.3
01.3
01.3
01.3
01.3
0
B Fishing 19.8 0 19.7 0 20.1 0 20.1 0 19.0 0 18.8 0 18.7 0
C Mining and quarrying 6.9 0 7.6 0 7.3 0 12.9 0 7.2 0 3.3 0 1.7 0
D Manufacturing 135.2 0 128.4 0 126.2 0 122.3 0 117.5 0 116.6 0 118.8 0
E Electricity, gas and water supply 105.10
107.60
108.80
109.50
109.50
110.00
122.90
F Construction 272.2 0 246.6 0 251.8 0 242.7 0 210.6 0 181.2 0 194.6 0
G+H Wholesale, retail trade, repair of motor vehicles, motorcycles and personal and households goods; hotels and restaurants 443.2
0
455.2
0
483.6
0
465.0
0
449.6
0
456.4
0
460.0
0
G Wholesale, retail trade, repair of motor vehicles, motorcycles and personal and household goods 199.6
0
194.0
0
236.1
0
214.6
0
187.5
0
183.1
0
186.7
0
H Hotels and restaurants 243.6 0 261.2 0 247.4 0 250.4 0 262.1 0 273.3 0 273.3 0
I Transport, storage and communications 497.8
0500.9
0468.7
0456.3
0439.4
0467.4
0479.3
0
Land transport; transport via pipelines, water transport; air transport; Supporting and auxiliary transport activities; activities of travel agencies 324.3
0
321.7
0
304.7
0
299.3
0
296.0
0
325.6
0
336.0
0
Post and telecommunications 173.5 0 179.2 0 163.9 0 156.9 0 143.4 0 141.8 0 143.3 0
J+K Financial intermediation; real estate, renting and business activities 650.3
0
664.30
671.60
672.10
698.40
684.50
681.70
J Financial intermediation 231.2 0 229.0 0 229.6 0 233.1 0 240.9 0 222.9 0 221.5 0
K Real estate, renting and business activities 419.1
0435.3
0442.0
0439.0
0457.5
0461.7
0460.2
0
L Public administration and defence; compulsory social security 153.6
0
157.90
161.90
164.40
168.00
168.00
166.60
M+N+O Education; health and social work; other community, social and personal services 268.7
0
275.00
289.60
287.40
277.50
273.70
271.40
M Education 102.3 0 105.1 0 107.6 0 109.4 0 111.6 0 111.7 0 111.0 0
N Health and social work 48.5 0 49.7 0 51.1 0 52.2 0 53.2 0 53.2 0 52.4 0
O Other community, social and personal services 118.0
0120.2
0130.9
0125.9
0112.7
0108.8
0108.0
0
P Private households with employed persons 3.8
03.5
03.5
03.4
03.2
02.8
03.6
0
Plus: Statistical discrepancyVALUE ADDED, GROSS, at basic prices 1 2,568.6
02,549.3
02,566.1
02,535.1
02,482.5
02,467.9
02,510.9
0
Less: Financial intermediation services indirectly measured (FISIM) 76.5
0
74.10
74.10
76.10
77.50
66.10
64.70
Plus: Taxes less Subsidies on products 438.2 406.4 396.6 384.8 439.2 466.6 493.1
Plus: Taxes on productsLess: Subsidies on products
Plus: Statistical discrepancy
GROSS DOMESTIC PRODUCT 3,006.8 2,955.7 2,962.8 2,919.9 2,921.7 2,934.5 3,004.01 Excludes Financial intermediation services indirectly measured (FISIM) but FISIM is
included in the industry data.
68

Table 12.3 Saint Lucia: Gross domestic product by expenditures at current prices
Millions of EC dollars
Item Description 2009 2010 2011 2012 2013 2014 2015 Pl
Final consumption expenditure 2,548.9 ## 2,894.3 ## 3,134.0 ## 2,968.4 ## 3,088.7 ## 3,332.2 ## 3,173.6 ##
Household final consumption expenditure 2,110.0
##2,418.4
##2,649.3
##2,455.5
##2,576.5
##2,796.8
##2,642.8
##
NPISHs final consumption expenditureGeneral government final consumption expenditure 438.9
##476.0
##484.7
##512.9
##512.2
##535.5
##530.8
##
Individual consumption expenditureCollective consumption expenditure
Gross capital formation 920.5 ## 940.9 ## 980.8 ## 937.5 ## 816.7 ## 710.2 ## 760.1 ##
Gross fixed capital formation 920.5 ## 940.9 ## 980.8 ## 937.5 ## 816.7 ## 710.2 ## 760.1 ##
Changes in inventoriesAcquisitions less disposals of valuables
Exports of goods and services 1,468.7 ## 1,643.9 ## 1,546.7 ## 1,630.2 ## 1,641.0 ## 1,706.7 ## 1,787.5 ##
Exports of goods 516.6 ## 645.0 ## 519.1 ## 573.6 ## 540.7 ## 497.9 ## 557.6 ##
Exports of services 952.1 ## 999.0 ## 1,027.6 ## 1,056.6 ## 1,100.3 ## 1,208.9 ## 1,229.9 ##
Less: Imports of goods and services 1,749.5
##2,126.1
##2,203.8
##2,029.3
##1,987.7
##2,006.5
##1,857.1
##
Imports of goods 1,236.5 ## 1,574.1 ## 1,655.7 ## 1,529.2 ## 1,474.1 ## 1,490.5 ## 1,354.4 ##
Imports of services 513.0 ## 552.0 ## 548.1 ## 500.1 ## 513.6 ## 515.9 ## 502.7 ##
Plus: Statistical discrepancyGROSS DOMESTIC PRODUCT 3,188.6 ## 3,353.1 ## 3,457.7 ## 3,506.8 ## 3,558.7 ## 3,742.7 ## 3,864.1 ##
69

Table 12.4 Saint Lucia: Relations among product, income, savings,and net lending aggregates
Millions of EC dollars
Item Description 2009 2010 2011 2012 2013 2014 2015 Pl
GROSS DOMESTIC PRODUCT 3,188.6 3,353.1 3,457.7 3,506.8 3,558.7 3,742.7 3,864.1Compensation of employees - from and to the rest of the world, net 0.5 1.0 1.0 1.0 0.5 0.5 0.5
Plus: Compensation of employees - from the rest of the world 0.5 1.0 1.0 1.0 0.5 0.5 0.5Less: Compensation of employees - to the rest of the world 0.0 0.0 0.0 0.0 0.0 0.0 0.0
Property income - from and to the rest of the world, net -122.5 -107.8 -54.9 -91.6 -62.3 -61.8 -59.8
Plus: Property income - from the rest of the world 44.0 46.8 42.9 46.4 48.0 47.8 49.2Less: Property income - to the rest of the world 166.5 154.6 97.8 138.1 110.3 109.6 109.0
Plus: Compensation of employees and property income - from and to the rest of the world, net -121.9 -106.8 -53.9 -90.7 -61.8 -61.3 -59.3
Plus: Compensation of employees and property income - from the rest of the world 44.6 47.8 43.9 47.4 48.5 48.3 49.7
Less: Compensation of employees and property income - to the rest of the world 166.5 154.6 97.8 138.1 110.3 109.6 109.0
Plus: Taxes less subsidies on production and imports - from and to the rest of the world, net
Plus: Taxes less subsidies on production and imports - from the rest of the worldLess: Taxes less subsidies on production and imports - to the rest of the world
GROSS NATIONAL INCOME, at market prices 3,066.6 3,246.3 3,403.8 3,416.1 3,497.0 3,681.4 3,804.8Plus: Current transfers - from and to the rest of the world, net 33.6 41.5 55.5 17.1 12.8 28.8 29.7
Plus: Current transfers - from the rest of the world 86.6 110.2 92.3 86.6 89.2 93.7 95.9Less: Current transfers - to the rest of the world 53.0 68.7 36.8 69.5 76.5 64.8 66.2
GROSS NATIONAL DISPOSABLE INCOME 3,100.2 3,287.8 3,459.3 3,433.3 3,509.7 3,710.3 3,834.5Less: Final consumption expenditure / Actual final consumption 2,548.9 2,894.3 3,134.0 2,968.4 3,088.7 3,332.2 3,173.6Plus: Statistical discrepancySAVING, GROSS 551.3 393.5 325.3 464.8 421.0 378.0 660.9Plus: Capital transfers - from and to the rest of the world, net 69.8 118.4 91.7 88.9 55.9 62.3 56.2
Plus: Capital transfers - from the rest of the world 72.8 121.4 94.8 91.9 58.9 65.5 59.4Less: Capital transfers - to the rest of the world 3.0 3.1 3.1 3.0 3.1 3.2 3.3
Less: Gross capital formation 920.5 940.9 980.8 937.5 816.7 710.2 760.1
Less: Acquisitions less disposals of non-produced non-financial assets 0.0 0.0 0.0 0.0 0.0 0.0 0.0Plus: Statistical discrepancy
NET LENDING(+)/ NET BORROWING(-) OF THE NATION -299.5 -429.1 -563.8 -383.8 -339.8 -269.9 -43.1
Less: Consumption of fixed capitalNET NATIONAL INCOME, in market pricesNET NATIONAL DISPOSABLE INCOMESAVING, NET
70


Table 13.1 St. Vincent & the Grenadines: Value added by industries at current prices
Millions of EC dollars
Item Description 2009 2010 2011 2012 2013 2014 2015 Pl
A+B Agriculture, hunting, forestry; fishing 107.9
0111.8
0116.1
0115.3
0126.2
0129.8
0126.9
0
A Agriculture, hunting, forestry 99.40
104.10
108.90
108.40
118.30
121.80
117.70
Agriculture, hunting and related service activities 98.3
0103.1
0107.9
0107.4
0117.3
0120.9
0116.9
0
Forestry, logging and related service activities 1.0
01.0
01.0
00.9
00.9
00.9
00.9
0
B Fishing 8.5 0 7.8 0 7.2 0 6.9 0 7.9 0 8.0 0 9.1 0
C Mining and quarrying 5.2 0 4.1 0 3.1 0 2.5 0 2.4 0 2.4 0 2.5 0
D Manufacturing 81.3 0 88.7 0 79.1 0 80.2 0 86.2 0 97.0 0 97.1 0
E Electricity, gas and water supply 63.10
70.90
66.40
66.30
65.00
62.40
53.90
F Construction 145.6 0 139.4 0 137.2 0 134.6 0 145.1 0 128.2 0 138.0 0
G+H Wholesale, retail trade, repair of motor vehicles, motorcycles and personal and households goods; hotels and restaurants 262.1
0
254.0
0
256.9
0
273.7
0
287.9
0
286.1
0
274.1
0
G Wholesale, retail trade, repair of motor vehicles, motorcycles and personal and household goods 226.5
0
222.3
0
217.9
0
230.9
0
240.7
0
243.2
0
228.8
0
H Hotels and restaurants 35.6 0 31.7 0 39.0 0 42.8 0 47.2 0 42.9 0 45.4 0
I Transport, storage and communications 222.0
0217.4
0216.3
0220.6
0224.8
0221.0
0222.5
0
Land transport; transport via pipelines, water transport; air transport; Supporting and auxiliary transport activities; activities of travel agencies 150.1
0
150.6
0
145.4
0
148.9
0
149.5
0
149.0
0
148.1
0
Post and telecommunications 71.9 0 66.8 0 70.9 0 71.6 0 75.3 0 72.0 0 74.4 0
J+K Financial intermediation; real estate, renting and business activities 342.4
0
350.30
336.90
338.50
343.80
352.70
357.20
J Financial intermediation 111.3 0 114.1 0 94.9 0 97.2 0 98.8 0 101.5 0 103.9 0
K Real estate, renting and business activities 231.1
0236.2
0242.0
0241.3
0245.1
0251.2
0253.3
0
L Public administration and defence; compulsory social security 143.4
0
168.20
178.70
190.90
206.80
218.30
224.70
M+N+O Education; health and social work; other community, social and personal services 167.9
0
168.00
178.80
185.70
192.50
183.30
190.80
M Education 83.7 0 85.8 0 92.2 0 96.7 0 98.5 0 96.2 0 101.7 0
N Health and social work 43.7 0 47.6 0 50.1 0 53.6 0 55.9 0 54.7 0 55.9 0
O Other community, social and personal services 40.5
034.5
036.6
035.4
038.2
032.4
033.2
0
P Private households with employed persons 4.3
04.6
04.7
04.7
04.8
04.2
04.1
0
Plus: Statistical discrepancyVALUE ADDED, GROSS, at basic prices 1 1,525.9
01,556.5
01,555.2
01,592.5
01,668.2
01,667.7
01,674.1
0
Less: Financial intermediation services indirectly measured (FISIM) 19.2
0
21.00
19.10
20.30
17.20
17.60
17.80
Plus: Taxes less Subsidies on products 296.2
0282.8
0270.3
0278.4
0279.0
0297.6
0317.7
0
Plus: Taxes on products 297.4 0 284.4 0 271.4 0 279.4 0 280.1 0 298.7 0 318.8 0
Less: Subsidies on products 1.2 0 1.5 0 1.1 0 1.0 0 1.1 0 1.1 0 1.1 0
Plus: Statistical discrepancy
GROSS DOMESTIC PRODUCT 1,822.2 0 1,839.3 0 1,825.5 0 1,871.0 0 1,947.3 0 1,965.3 0 1,991.7 0
1 Excludes Financial intermediation services indirectly measured (FISIM) but FISIM is included in the industry data.
71
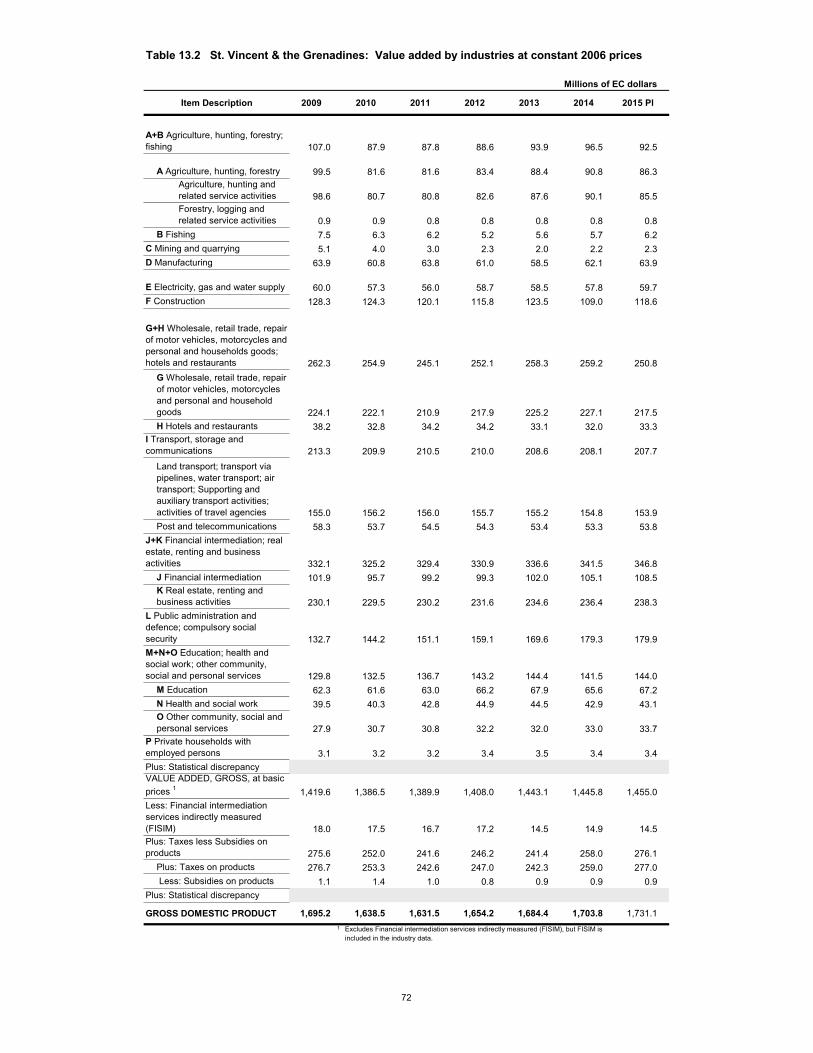
Table 13.2 St. Vincent & the Grenadines: Value added by industries at constant 2006 prices
Millions of EC dollars
Item Description 2009 2010 2011 2012 2013 2014 2015 Pl
A+B Agriculture, hunting, forestry; fishing 107.0
087.9
087.8
088.6
093.9
096.5
092.5
0
A Agriculture, hunting, forestry 99.50
81.60
81.60
83.40
88.40
90.80
86.30
Agriculture, hunting and related service activities 98.6
080.7
080.8
082.6
087.6
090.1
085.5
0
Forestry, logging and related service activities 0.9
00.9
00.8
00.8
00.8
00.8
00.8
0
B Fishing 7.5 0 6.3 0 6.2 0 5.2 0 5.6 0 5.7 0 6.2 0
C Mining and quarrying 5.1 0 4.0 0 3.0 0 2.3 0 2.0 0 2.2 0 2.3 0
D Manufacturing 63.9 0 60.8 0 63.8 0 61.0 0 58.5 0 62.1 0 63.9 0
E Electricity, gas and water supply 60.00
57.30
56.00
58.70
58.50
57.80
59.70
F Construction 128.3 0 124.3 0 120.1 0 115.8 0 123.5 0 109.0 0 118.6 0
G+H Wholesale, retail trade, repair of motor vehicles, motorcycles and personal and households goods; hotels and restaurants 262.3
0
254.9
0
245.1
0
252.1
0
258.3
0
259.2
0
250.8
0
G Wholesale, retail trade, repair of motor vehicles, motorcycles and personal and household goods 224.1
0
222.1
0
210.9
0
217.9
0
225.2
0
227.1
0
217.5
0
H Hotels and restaurants 38.2 0 32.8 0 34.2 0 34.2 0 33.1 0 32.0 0 33.3 0
I Transport, storage and communications 213.3
0209.9
0210.5
0210.0
0208.6
0208.1
0207.7
0
Land transport; transport via pipelines, water transport; air transport; Supporting and auxiliary transport activities; activities of travel agencies 155.0
0
156.2
0
156.0
0
155.7
0
155.2
0
154.8
0
153.9
0
Post and telecommunications 58.3 0 53.7 0 54.5 0 54.3 0 53.4 0 53.3 0 53.8 0
J+K Financial intermediation; real estate, renting and business activities 332.1
0
325.20
329.40
330.90
336.60
341.50
346.80
J Financial intermediation 101.9 0 95.7 0 99.2 0 99.3 0 102.0 0 105.1 0 108.5 0
K Real estate, renting and business activities 230.1
0229.5
0230.2
0231.6
0234.6
0236.4
0238.3
0
L Public administration and defence; compulsory social security 132.7
0
144.20
151.10
159.10
169.60
179.30
179.90
M+N+O Education; health and social work; other community, social and personal services 129.8
0
132.50
136.70
143.20
144.40
141.50
144.00
M Education 62.3 0 61.6 0 63.0 0 66.2 0 67.9 0 65.6 0 67.2 0
N Health and social work 39.5 0 40.3 0 42.8 0 44.9 0 44.5 0 42.9 0 43.1 0
O Other community, social and personal services 27.9
030.7
030.8
032.2
032.0
033.0
033.7
0
P Private households with employed persons 3.1
03.2
03.2
03.4
03.5
03.4
03.4
0
Plus: Statistical discrepancyVALUE ADDED, GROSS, at basic prices 1 1,419.6
01,386.5
01,389.9
01,408.0
01,443.1
01,445.8
01,455.0
0
Less: Financial intermediation services indirectly measured (FISIM) 18.0
0
17.50
16.70
17.20
14.50
14.90
14.50
Plus: Taxes less Subsidies on products 275.6
0252.0
0241.6
0246.2
0241.4
0258.0
0276.1
0
Plus: Taxes on products 276.7 0 253.3 0 242.6 0 247.0 0 242.3 0 259.0 0 277.0 0
Less: Subsidies on products 1.1 0 1.4 0 1.0 0 0.8 0 0.9 0 0.9 0 0.9 0
Plus: Statistical discrepancy
GROSS DOMESTIC PRODUCT 1,695.2 0 1,638.5 0 1,631.5 0 1,654.2 0 1,684.4 0 1,703.8 0 1,731.1 0
1 Excludes Financial intermediation services indirectly measured (FISIM), but FISIM is included in the industry data.
72

Table 13.3 St. Vincent & the Grenadines: Gross domestic product by expenditures at current prices
Millions of EC dollars
Item Description 2009 2010 2011 2012 2013 2014 2015
Final consumption expenditure 1,881.2 ## 1,857.4 ## 1,923.0 ## 1,921.1 ## 1,978.3 ## 2,040.9 ## … ##
Household final consumption expenditure 1,469.0
##1,481.6
##1,508.4
##1,501.1
##1,539.1
##1,611.5
##…
##
NPISHs final consumption expenditure 16.2 20.7 17.5 16.9 18.8 17.7General government final consumption expenditure 395.9
##355.1
##397.0
##403.0
##420.5
##411.7
##…
##
Individual consumption expenditure 174.6 176.3 196.1 198.0 195.7 194.4Collective consumption expenditure 221.3 178.8 201.0 205.0 224.8 217.3
Gross capital formation 488.5 ## 550.2 ## 468.9 ## 515.7 ## 548.1 ## 517.2 ## … ##
Gross fixed capital formation 482.9 ## 533.2 ## 464.3 ## 475.7 ## 523.8 ## 491.2 ## … ##
Changes in inventories 5.6 17.0 4.6 40.0 24.3 26.0Acquisitions less disposals of valuables 0.0 0.0 0.0 0.0 0.0 0.0 …
Exports of goods and services 529.9 ## 503.6 ## 500.9 ## 521.8 ## 507.9 ## 621.8 ## … ##
Exports of goods … ##
Exports of services … ##
Less: Imports of goods and services 1,047.7
##1,050.8
##1,016.9
##1,083.8
##1,137.7
##1,178.0
##…
##
Imports of goods … ##
Imports of services … ##
Plus: Statistical discrepancy -29.7 -21.1 -50.5 -3.9 50.7 -36.6GROSS DOMESTIC PRODUCT 1,822.2 ## 1,839.3 ## 1,825.5 ## 1,871.0 ## 1,947.3 ## 1,965.3 ## … ##
Table 13.4 St. Vincent & the Grenadines: Gross domestic product by expenditures at constant 2006 prices
Millions of EC dollarsItem Description 2009 2010 2011 2012 2013 2014 2015
Final consumption expenditure 1,722.7 1,664.2 1,668.5 1,633.1 1,656.6 1,695.8 … ##
Household final consumption expenditure 1,341.2 1,332.7 1,307.9 1,272.9 1,286.2 1,337.8 …
##
NPISHs final consumption expenditure 11.8 16.9 14.2 14.0 14.3 13.1 …General government final consumption expenditure 369.7 314.5 346.4 346.2 356.1 345.0 …
##
Individual consumption expenditure 169.9 161.1 177.4 176.4 172.1 169.1 …Collective consumption expenditure 199.8 153.4 169.0 169.7 184.0 175.8 …
Gross capital formation 422.1 473.5 392.7 425.3 434.0 445.7 … ##
Gross fixed capital formation 417.4 459.3 389.0 393.6 414.9 425.3 … ##
Changes in inventories 4.7 14.3 3.7 31.7 19.1 20.4 …Acquisitions less disposals of valuables 0.0 0.0 0.0 0.0 0.0 0.0 …
Exports of goods and services 404.0 361.1 338.2 346.5 357.2 403.4 … ##
Exports of goods … ##
Exports of services … ##
Less: Imports of goods and services 933.6 883.4 850.7 829.5 796.1 932.5 …
##
Imports of goods … ##
Imports of services … ##
Plus: Statistical discrepancy 80.0 23.1 82.8 78.7 32.7 91.4 …GROSS DOMESTIC PRODUCT 1,695.2 1,638.5 1,631.5 1,654.2 1,684.4 1,703.8 … ##
73
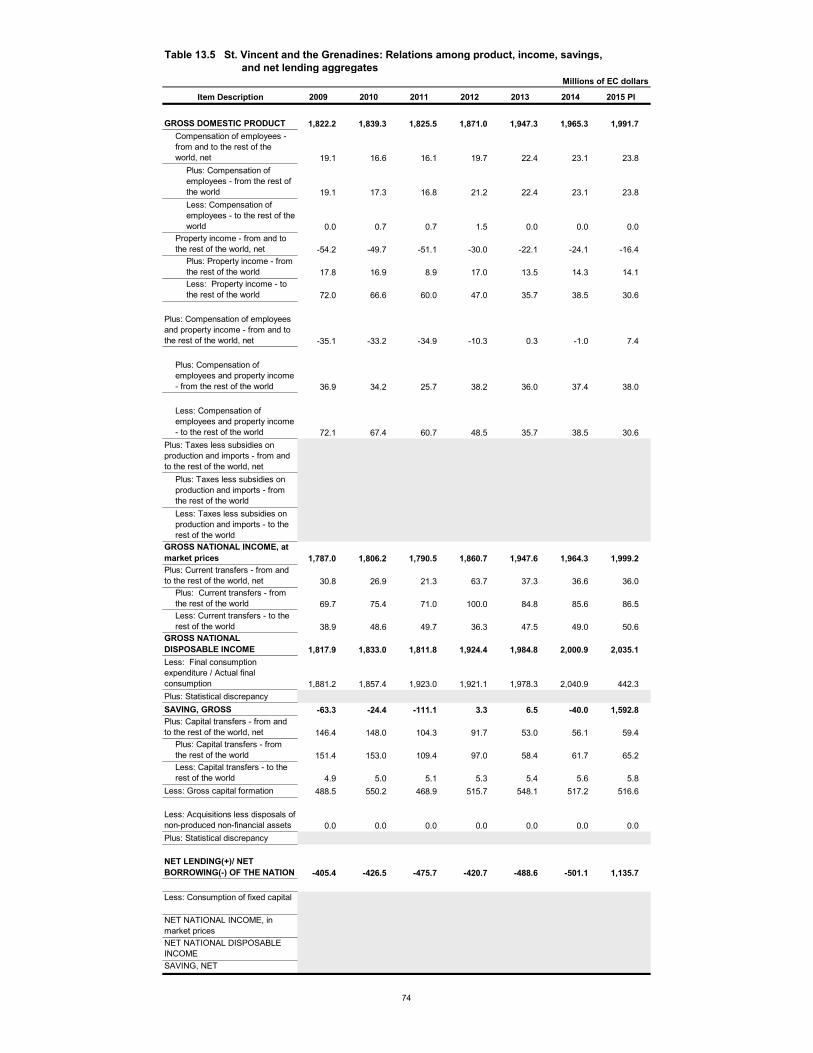
Table 13.5 St. Vincent and the Grenadines: Relations among product, income, savings,and net lending aggregates
Millions of EC dollars
Item Description 2009 2010 2011 2012 2013 2014 2015 Pl
GROSS DOMESTIC PRODUCT 1,822.2 1,839.3 1,825.5 1,871.0 1,947.3 1,965.3 1,991.7Compensation of employees - from and to the rest of the world, net 19.1 16.6 16.1 19.7 22.4 23.1 23.8
Plus: Compensation of employees - from the rest of the world 19.1 17.3 16.8 21.2 22.4 23.1 23.8Less: Compensation of employees - to the rest of the world 0.0 0.7 0.7 1.5 0.0 0.0 0.0
Property income - from and to the rest of the world, net -54.2 -49.7 -51.1 -30.0 -22.1 -24.1 -16.4
Plus: Property income - from the rest of the world 17.8 16.9 8.9 17.0 13.5 14.3 14.1Less: Property income - to the rest of the world 72.0 66.6 60.0 47.0 35.7 38.5 30.6
Plus: Compensation of employees and property income - from and to the rest of the world, net -35.1 -33.2 -34.9 -10.3 0.3 -1.0 7.4
Plus: Compensation of employees and property income - from the rest of the world 36.9 34.2 25.7 38.2 36.0 37.4 38.0
Less: Compensation of employees and property income - to the rest of the world 72.1 67.4 60.7 48.5 35.7 38.5 30.6
Plus: Taxes less subsidies on production and imports - from and to the rest of the world, net
Plus: Taxes less subsidies on production and imports - from the rest of the worldLess: Taxes less subsidies on production and imports - to the rest of the world
GROSS NATIONAL INCOME, at market prices 1,787.0 1,806.2 1,790.5 1,860.7 1,947.6 1,964.3 1,999.2Plus: Current transfers - from and to the rest of the world, net 30.8 26.9 21.3 63.7 37.3 36.6 36.0
Plus: Current transfers - from the rest of the world 69.7 75.4 71.0 100.0 84.8 85.6 86.5Less: Current transfers - to the rest of the world 38.9 48.6 49.7 36.3 47.5 49.0 50.6
GROSS NATIONAL DISPOSABLE INCOME 1,817.9 1,833.0 1,811.8 1,924.4 1,984.8 2,000.9 2,035.1Less: Final consumption expenditure / Actual final consumption 1,881.2 1,857.4 1,923.0 1,921.1 1,978.3 2,040.9 442.3Plus: Statistical discrepancySAVING, GROSS -63.3 -24.4 -111.1 3.3 6.5 -40.0 1,592.8Plus: Capital transfers - from and to the rest of the world, net 146.4 148.0 104.3 91.7 53.0 56.1 59.4
Plus: Capital transfers - from the rest of the world 151.4 153.0 109.4 97.0 58.4 61.7 65.2Less: Capital transfers - to the rest of the world 4.9 5.0 5.1 5.3 5.4 5.6 5.8
Less: Gross capital formation 488.5 550.2 468.9 515.7 548.1 517.2 516.6
Less: Acquisitions less disposals of non-produced non-financial assets 0.0 0.0 0.0 0.0 0.0 0.0 0.0Plus: Statistical discrepancy
NET LENDING(+)/ NET BORROWING(-) OF THE NATION -405.4 -426.5 -475.7 -420.7 -488.6 -501.1 1,135.7
Less: Consumption of fixed capital
NET NATIONAL INCOME, in market pricesNET NATIONAL DISPOSABLE INCOMESAVING, NET
74


Table 14.1 Suriname: Value added by industries at current prices
Millions of EC dollars
Item Description 2009 2010 2011 2012 2013 T 2014 T 2015 T
A+B Agriculture, hunting, forestry; fishing 1,029.2
01,117.1
01,041.2
01,127.9
01,178.4
01,299.6
01,378.9
0
A Agriculture, hunting, forestry 785.50
828.40
732.10
821.60
767.20
792.00
740.70
Agriculture, hunting and related service activitiesForestry, logging and related service activities
B Fishing 243.7 0 288.8 0 309.2 0 306.2 0 411.2 0 507.6 0 638.3 0
C Mining and quarrying 746.5 0 850.8 0 800.2 0 941.9 0 781.7 0 634.5 0 403.6 0
D Manufacturing 2,120.5 0 2,475.2 0 2,483.0 0 2,863.0 0 2,610.3 0 2,314.0 0 1,293.7 0
E Electricity, gas and water supply 206.90
251.40
217.40
250.10
276.90
282.20
400.00
F Construction 514.4 0 570.1 0 687.1 0 686.3 0 813.5 0 1,027.0 0 1,210.0 0
G+H Wholesale, retail trade, repair of motor vehicles, motorcycles and personal and households goods; hotels and restaurants 2,331.7
0
2,602.0
0
2,548.5
0
2,924.6
0
3,037.7
0
3,131.7
0
2,914.1
0
G Wholesale, retail trade, repair of motor vehicles, motorcycles and personal and household goods 2,060.2
0
2,291.4
0
2,211.5
0
2,521.5
0
2,599.7
0
2,654.3
0
2,388.0
0
H Hotels and restaurants 271.4 0 310.6 0 337.1 0 403.0 0 438.0 0 477.5 0 526.1 0
I Transport, storage and communications 611.8
0700.7
0696.5
0924.3
01,031.0
01,427.7
01,493.6
0
Land transport; transport via pipelines, water transport; air transport; Supporting and auxiliary transport activities; activities of travel agenciesPost and telecommunications
J+K Financial intermediation; real estate, renting and business activities 789.1
0
955.00
1,002.50
1,051.30
1,248.30
1,087.00
1,134.50
J Financial intermediation 479.5 0 586.3 0 609.9 0 632.4 0 812.9 0 610.9 0 594.8 0
K Real estate, renting and business activities 309.6
0368.7
0392.6
0418.9
0435.4
0476.1
0539.7
0
L Public administration and defence; compulsory social security 1,130.7
0
1,284.90
1,203.10
1,332.50
1,534.70
1,587.20
1,606.40
M+N+O Education; health and social work; other community, social and personal services 128.2
0
148.10
155.30
173.70
203.90
211.10
215.00
M Education 5.0 0 7.8 0 8.4 0 9.0 0 10.6 0 10.8 0 10.4 0
N Health and social work 61.1 0 70.6 0 67.3 0 75.2 0 91.2 0 94.6 0 97.6 0
O Other community, social and personal services 62.1
069.7
079.6
089.6
0102.1
0105.6
0106.9
0
P Private households with employed personsPlus: Statistical discrepancyVALUE ADDED, GROSS, at basic prices 1 9,608.9 10,955.3 10,834.7 12,275.5 12,716.4 13,002.1 12,049.9Less: Financial intermediation services indirectly measured (FISIM)Plus: Taxes less Subsidies on products 855.0
0841.1
01,092.9
01,170.3
01,176.9
01,147.9
01,266.5
0
Plus: Taxes on products 858.2 0 845.4 0
Less: Subsidies on products 3.2 0 4.3 0
Plus: Statistical discrepancyGROSS DOMESTIC PRODUCT 10,464.0 0 11,796.4 0 11,927.7 0 13,445.8 0 13,893.3 0 14,150.0 0 13,316.4 0
Memorandum Item: FISIM, if distributed to uses 232.4 257.0
1 Excludes Financial intermediation services indirectly measured (FISIM)
75
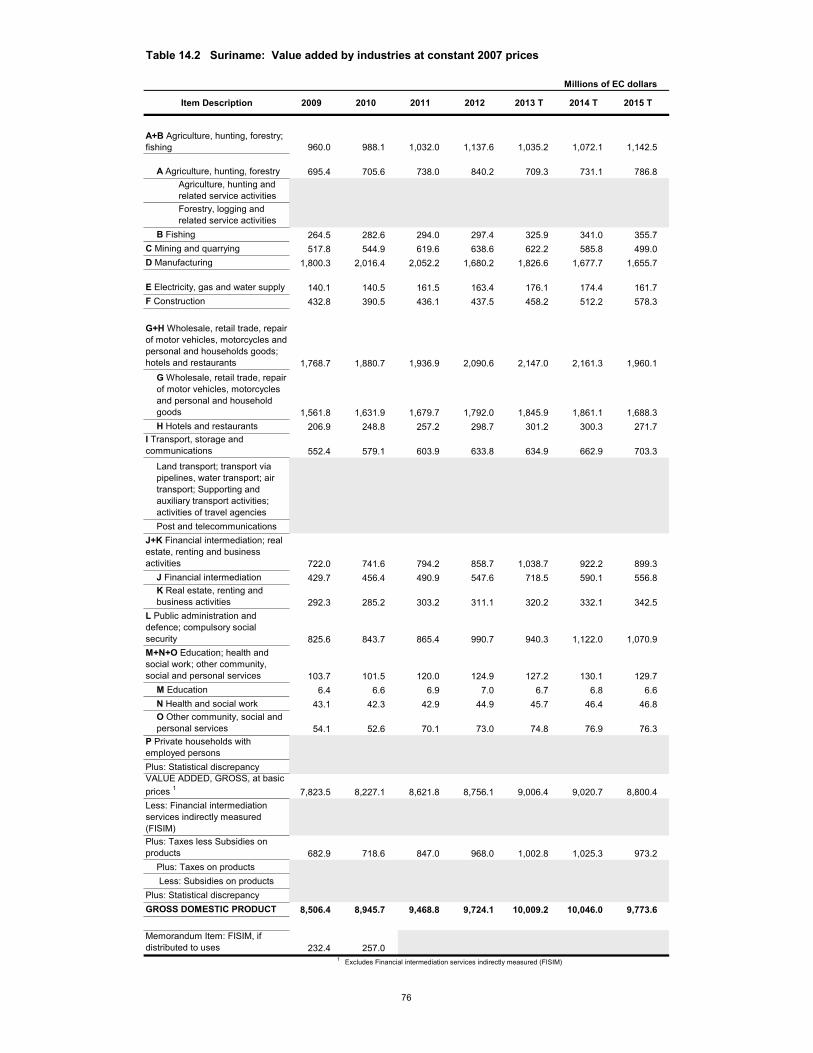
Table 14.2 Suriname: Value added by industries at constant 2007 prices
Millions of EC dollars
Item Description 2009 2010 2011 2012 2013 T 2014 T 2015 T
A+B Agriculture, hunting, forestry; fishing 960.0 0 988.1 0 1,032.0 0 1,137.6 0 1,035.2 0 1,072.1 0 1,142.5 0
A Agriculture, hunting, forestry 695.40
705.60
738.00
840.20
709.30
731.10
786.80
Agriculture, hunting and related service activitiesForestry, logging and related service activities
B Fishing 264.5 0 282.6 0 294.0 0 297.4 0 325.9 0 341.0 0 355.7 0
C Mining and quarrying 517.8 0 544.9 0 619.6 0 638.6 0 622.2 0 585.8 0 499.0 0
D Manufacturing 1,800.3 0 2,016.4 0 2,052.2 0 1,680.2 0 1,826.6 0 1,677.7 0 1,655.7 0
E Electricity, gas and water supply 140.10
140.50
161.50
163.40
176.10
174.40
161.70
F Construction 432.8 0 390.5 0 436.1 0 437.5 0 458.2 0 512.2 0 578.3 0
G+H Wholesale, retail trade, repair of motor vehicles, motorcycles and personal and households goods; hotels and restaurants 1,768.7
0
1,880.7
0
1,936.9
0
2,090.6
0
2,147.0
0
2,161.3
0
1,960.1
0
G Wholesale, retail trade, repair of motor vehicles, motorcycles and personal and household goods 1,561.8
0
1,631.9
0
1,679.7
0
1,792.0
0
1,845.9
0
1,861.1
0
1,688.3
0
H Hotels and restaurants 206.9 0 248.8 0 257.2 0 298.7 0 301.2 0 300.3 0 271.7 0
I Transport, storage and communications 552.4
0579.1
0603.9
0633.8
0634.9
0662.9
0703.3
0
Land transport; transport via pipelines, water transport; air transport; Supporting and auxiliary transport activities; activities of travel agenciesPost and telecommunications
J+K Financial intermediation; real estate, renting and business activities 722.0
0
741.60
794.20
858.70
1,038.70
922.20
899.30
J Financial intermediation 429.7 0 456.4 0 490.9 0 547.6 0 718.5 0 590.1 0 556.8 0
K Real estate, renting and business activities 292.3
0285.2
0303.2
0311.1
0320.2
0332.1
0342.5
0
L Public administration and defence; compulsory social security 825.6
0
843.70
865.40
990.70
940.30
1,122.00
1,070.90
M+N+O Education; health and social work; other community, social and personal services 103.7
0
101.50
120.00
124.90
127.20
130.10
129.70
M Education 6.4 0 6.6 0 6.9 0 7.0 0 6.7 0 6.8 0 6.6 0
N Health and social work 43.1 0 42.3 0 42.9 0 44.9 0 45.7 0 46.4 0 46.8 0
O Other community, social and personal services 54.1
052.6
070.1
073.0
074.8
076.9
076.3
0
P Private households with employed personsPlus: Statistical discrepancyVALUE ADDED, GROSS, at basic prices 1 7,823.5 8,227.1 8,621.8 8,756.1 9,006.4 9,020.7 8,800.4Less: Financial intermediation services indirectly measured (FISIM)Plus: Taxes less Subsidies on products 682.9
0718.6
0847.0
0968.0
01,002.8
01,025.3
0973.2
0
Plus: Taxes on products Less: Subsidies on products
Plus: Statistical discrepancyGROSS DOMESTIC PRODUCT 8,506.4 0 8,945.7 0 9,468.8 0 9,724.1 0 10,009.2 0 10,046.0 0 9,773.6 0
Memorandum Item: FISIM, if distributed to uses 232.4 257.0
1 Excludes Financial intermediation services indirectly measured (FISIM)
76

Table 14.3 Suriname: Value added by industries at current prices
Millions of Suriname dollars
Item Description 2009 2010 2011 2012 2013 T 2014 T 2015 T
A+B Agriculture, hunting, forestry; fishing 1,046.3
01,135.7
01,261.6
01,378.5
01,440.3
01,588.5
01,726.1
0
A Agriculture, hunting, forestry 798.60
842.20
887.00
1,004.20
937.70
968.00
927.20
Agriculture, hunting and related service activitiesForestry, logging and related service activities
B Fishing 247.8 0 293.6 0 374.6 0 374.3 0 502.6 0 620.4 0 799.0 0
C Mining and quarrying 758.9 0 865.0 0 969.6 0 1,151.2 0 955.4 0 775.6 0 505.3 0
D Manufacturing 2,155.9 0 2,516.5 0 3,008.4 0 3,499.2 0 3,190.3 0 2,828.2 0 1,619.4 0
E Electricity, gas and water supply 210.40
255.60
263.40
305.70
338.50
344.90
500.70
F Construction 523.0 0 579.6 0 832.5 0 838.8 0 994.3 0 1,255.3 0 1,514.6 0
G+H Wholesale, retail trade, repair of motor vehicles, motorcycles and personal and households goods; hotels and restaurants 2,370.5
0
2,645.4
0
3,087.8
0
3,574.5
0
3,712.8
0
3,827.7
0
3,647.9
0
G Wholesale, retail trade, repair of motor vehicles, motorcycles and personal and household goods 2,094.6
0
2,329.6
0
2,679.5
0
3,081.9
0
3,177.4
0
3,244.1
0
2,989.3
0
H Hotels and restaurants 276.0 0 315.8 0 408.4 0 492.6 0 535.4 0 583.6 0 658.6 0
I Transport, storage and communications 622.0
0712.4
0843.9
01,129.8
01,260.1
01,745.0
01,869.7
0
Land transport; transport via pipelines, water transport; air transport; Supporting and auxiliary transport activities; activities of travel agenciesPost and telecommunications
J+K Financial intermediation; real estate, renting and business activities 802.3
0
970.90
1,214.70
1,284.90
1,525.70
1,328.60
1,420.20
J Financial intermediation 487.5 0 596.1 0 738.9 0 772.9 0 993.5 0 746.7 0 744.6 0
K Real estate, renting and business activities 314.8
0374.9
0475.7
0512.0
0532.1
0581.9
0675.6
0
L Public administration and defence; compulsory social security 1,149.5
0
1,306.30
1,457.70
1,628.60
1,875.70
1,940.00
2,010.90
M+N+O Education; health and social work; other community, social and personal services 130.4
0
150.50
188.20
212.30
249.20
258.00
269.10
M Education 5.1 0 7.9 0 10.1 0 11.0 0 12.9 0 13.3 0 13.1 0
N Health and social work 62.1 0 71.8 0 81.6 0 91.9 0 111.5 0 115.6 0 122.2 0
O Other community, social and personal services 63.1
070.9
096.4
0109.5
0124.8
0129.1
0133.8
0
P Private households with employed personsPlus: Statistical discrepancyVALUE ADDED, GROSS, at basic prices 1 9,769.0 11,137.9 13,127.6 15,003.4 15,542.3 15,891.5 15,084.0Less: Financial intermediation services indirectly measured (FISIM)Plus: Taxes less Subsidies on products 869.2
0855.1
01,324.2
01,430.3
01,438.4
01,402.9
01,585.3
0
Plus: Taxes on products 872.5 0 859.5 0
Less: Subsidies on products 3.3 0 4.4 0
Plus: Statistical discrepancyGROSS DOMESTIC PRODUCT 10,638.4 0 11,993.0 0 14,451.9 0 16,433.7 0 16,980.7 17,294.4 16,669.3
Memorandum Item: FISIM, if distributed to uses 236.3 261.2
1 Excludes Financial intermediation services indirectly measured (FISIM)
77

Table 14.4 Suriname: Value added by industries at constant 2007 prices
Millions of Suriname dollars
Item Description 2009 2010 2011 2012 2013 T 2014 T 2015 T
A+B Agriculture, hunting, forestry; fishing 976.0
01,004.6
01,049.2
01,156.6
01,052.4
01,090.0
01,161.5
0
A Agriculture, hunting, forestry 707.00
717.30
750.30
854.20
721.10
743.30
799.90
Agriculture, hunting and related service activitiesForestry, logging and related service activities
B Fishing 269.0 0 287.3 0 298.9 0 302.4 0 331.3 0 346.7 0 361.6 0
C Mining and quarrying 526.4 0 554.0 0 629.9 0 649.3 0 632.6 0 595.5 0 507.3 0
D Manufacturing 1,830.3 0 2,050.0 0 2,086.4 0 1,708.2 0 1,857.0 0 1,705.7 0 1,683.3 0
E Electricity, gas and water supply 142.50
142.80
164.20
166.10
179.00
177.30
164.40
F Construction 440.0 0 397.1 0 443.3 0 444.8 0 465.9 0 520.8 0 587.9 0
G+H Wholesale, retail trade, repair of motor vehicles, motorcycles and personal and households goods; hotels and restaurants 1,798.2
0
1,912.1
0
1,969.2
0
2,125.5
0
2,182.8
0
2,197.3
0
1,992.7
0
G Wholesale, retail trade, repair of motor vehicles, motorcycles and personal and household goods 1,587.9
0
1,659.1
0
1,707.7
0
1,821.8
0
1,876.6
0
1,892.1
0
1,716.5
0
H Hotels and restaurants 210.4 0 253.0 0 261.5 0 303.7 0 306.2 0 305.3 0 276.3 0
I Transport, storage and communications 561.6
0588.8
0614.0
0644.4
0645.4
0673.9
0715.0
0
Land transport; transport via pipelines, water transport; air transport; Supporting and auxiliary transport activities; activities of travel agenciesPost and telecommunications
J+K Financial intermediation; real estate, renting and business activities 734.0
0
754.00
807.40
873.10
1,056.00
937.50
914.30
J Financial intermediation 436.9 0 464.1 0 499.1 0 556.7 0 730.4 0 599.9 0 566.1 0
K Real estate, renting and business activities 297.1
0289.9
0308.3
0316.3
0325.6
0337.6
0348.3
0
L Public administration and defence; compulsory social security 839.3
0
857.80
879.80
1,007.20
956.00
1,140.70
1,088.70
M+N+O Education; health and social work; other community, social and personal services 105.4
0
103.20
122.00
127.00
129.30
132.30
131.80
M Education 6.5 0 6.7 0 7.0 0 7.1 0 6.8 0 6.9 0 6.7 0
N Health and social work 43.9 0 43.0 0 43.7 0 45.6 0 46.5 0 47.2 0 47.6 0
O Other community, social and personal services 55.0
053.5
071.3
074.2
076.0
078.2
077.5
0
P Private households with employed personsPlus: Statistical discrepancyVALUE ADDED, GROSS, at basic prices 1 7,953.9 8,364.2 8,765.5 8,902.1 9,156.5 9,171.0 8,947.1Less: Financial intermediation services indirectly measured (FISIM)Plus: Taxes less Subsidies on products 694.3
0730.6
0861.1
0984.1
01,019.5
01,042.4
0989.4
0
Plus: Taxes on productsLess: Subsidies on products
Plus: Statistical discrepancyGROSS DOMESTIC PRODUCT 8,648.2 0 9,094.8 0 9,626.6 0 9,886.2 0 10,176.0 10,213.4 9,936.5
Memorandum Item: FISIM, if distributed to uses 236.3 261.2
1 Excludes Financial intermediation services indirectly measured (FISIM)
78


Table 15.1 Trinidad and Tobago: Value added by industries at current prices
Millions of EC dollars
Item Description 2009 2010 2011 2012 2013 2014 2015
A+B Agriculture, hunting, forestry; fishing 233.7
0239.5
0258.6
0256.4
0263.5
0254.6
0255.0
0
A Agriculture, hunting, forestry 211.8 232.5 232.3 239.0 227.1 219.3Agriculture, hunting and related service activities 175.2 193.2 193.1 199.9 187.8 179.8Forestry, logging and related service activities 36.6 39.2 39.2 39.1 39.3 39.5
B Fishing 27.6 26.2 24.0 24.4 27.5 35.7C Mining and quarrying 17,063.6 1 14,193.3 17,396.1 17,467.7 17,872.8 17,508.1 13,602.2D Manufacturing 8,889.1 11,765.7 14,691.6 13,060.9 11,411.3 11,736.4 10,711.4
E Electricity, gas and water supply 762.0 769.7 843.9 842.2 816.7 879.5 901.1F Construction 4,002.6 3,701.1 3,701.6 3,935.9 4,331.7 4,557.7
G+H Wholesale, retail trade, repair of motor vehicles, motorcycles and personal and households goods; hotels and restaurants 8,881.3 12,492.6 15,217.0 15,915.1 17,416.5 18,154.4 17,940.5
G Wholesale, retail trade, repair of motor vehicles, motorcycles and personal and household goods 12,004.2 14,262.1 14,991.9 16,650.4 17,308.7 17,066.6H Hotels and restaurants 488.4 954.9 923.2 766.1 845.7 873.9
I Transport, storage and communications 3,083.5 3,397.7 3,576.0 3,643.4 3,777.4 3,950.1 4,041.3
Land transport; transport via pipelines, water transport; air transport; Supporting and auxiliary transport activities; activities of travel agencies 2,103.9 2,212.1 2,147.7 2,184.4 2,046.1 2,057.8Post and telecommunications 1,293.7 1,363.9 1,495.7 1,593.0 1,904.0 1,983.5
J+K Financial intermediation; real estate, renting and business activities 6,194.8 6,300.2 6,847.3 7,381.9 8,208.0 8,247.6 8,981.9
J Financial intermediation 3,444.3 3,882.5 3,945.9 4,114.4 4,241.0 4,757.3K Real estate, renting and business activities 2,855.9 2,964.8 3,436.0 4,093.5 4,006.8 4,224.6
L Public administration and defence; compulsory social security 4,786.5 4,433.6 4,419.7 4,500.9 4,861.4 5,816.7 6,182.8M+N+O Education; health and social work; other community, social and personal services 2,219.6 2,302.7 2,162.7 2,424.6 2,541.1 2,625.2 2,726.0
M Education 1,519.1 2 1,604.3 1,359.0 1,577.4 1,627.0 1,650.0 1,667.1N Health and social work 299.0 316.0 357.6 395.2 439.4 475.9O Other community, social and personal services 700.4
3399.3 487.7 489.5 518.9 535.8 583.0
P Private households with employed personsPlus: Statistical discrepancyVALUE ADDED, GROSS, at basic prices 52,114.0 59,897.6 69,114.0 69,194.5 71,104.7 73,504.4 69,899.9Less: Financial intermediation services indirectly measured (FISIM) 2,339.9 2,472.2 2,414.1 2,207.1 2,205.3 2,314.7 2,714.2Plus: Taxes less Subsidies on products 4 2,206.1 2,565.7 2,074.5 2,672.2 2,801.8 2,709.7 3,052.4
Plus: Taxes on productsLess: Subsidies on products
Plus: Statistical discrepancy
GROSS DOMESTIC PRODUCT 51,980.2 0 59,990.8 0 68,774.4 0 69,659.6 0 71,701.1 0 73,899.4 0 70,238.2 0
1 Includes Construction2 Refers to Education and Cultural services3 Refers to Personal services4 Refers to Value Added Tax.
79

Table 15.2 Trinidad and Tobago: Value added by industries at constant 2000 prices
Millions of EC dollars
Item Description 2009 2010 2011 2012 2013 2014 2015
A+B Agriculture, hunting, forestry; fishing 135.9
091.9
097.7
097.6
0100.5
0108.4
0119.1
0
A Agriculture, hunting, forestry 78.1 85.4 86.6 89.7 96.7 105.0Agriculture, hunting and related service activities 65.8 73.0 74.1 77.3 84.3 92.6Forestry, logging and related service activities 12.3 12.4 12.5 12.3 12.4 12.4
B Fishing 13.8 12.3 11.1 10.8 11.7 14.0C Mining and quarrying 11,702.1 1 9,223.0 8,927.9 8,758.8 8,898.6 8,715.3 8,421.8D Manufacturing 9,276.2 9,270.1 8,941.2 8,687.5 8,701.4 8,417.1 8,220.1
E Electricity, gas and water supply 546.7 547.2 582.3 596.9 615.4 620.9 638.9F Construction 2,114.0 1,927.2 1,888.6 2,009.1 2,067.9 2,139.3
G+H Wholesale, retail trade, repair of motor vehicles, motorcycles and personal and households goods; hotels and restaurants 5,271.0 6,374.5 6,898.4 6,837.5 7,004.3 6,915.9 6,644.5
G Wholesale, retail trade, repair of motor vehicles, motorcycles and personal and household goods 6,122.7 6,436.3 6,435.2 6,686.6 6,586.7 6,321.2H Hotels and restaurants 251.8 462.0 402.3 317.6 329.3 323.3
I Transport, storage and communications 3,019.4 2,984.2 3,067.2 3,520.8 3,570.6 3,607.9 3,646.5
Land transport; transport via pipelines, water transport; air transport; Supporting and auxiliary transport activities; activities of travel agencies 1,786.9 1,896.1 2,029.0 2,022.8 1,916.3 1,924.3Post and telecommunications 1,197.3 1,171.1 1,491.8 1,547.8 1,691.6 1,722.2
J+K Financial intermediation; real estate, renting and business activities 4,944.7 5,344.5 5,625.9 5,794.8 6,310.6 6,235.7 6,772.8
J Financial intermediation 3,470.9 3,812.3 3,746.4 4,068.2 4,084.3 4,463.0K Real estate, renting and business activities 1,873.6 1,813.5 2,048.5 2,242.3 2,151.4 2,309.8
L Public administration and defence; compulsory social security 2,136.4 2,161.2 2,147.0 2,169.5 1,978.9 2,164.5 2,343.6M+N+O Education; health and social work; other community, social and personal services 1,268.1 1,287.3 1,334.2 1,334.9 1,354.3 1,363.5 1,373.8
M Education 768.3 2 817.5 798.2 793.4 803.8 787.4 760.7N Health and social work 188.5 199.2 219.4 231.1 248.3 264.6O Other community, social and personal services 499.7
3281.3 336.8 322.0 319.5 327.8 348.4
P Private households with employed personsPlus: Statistical discrepancyVALUE ADDED, GROSS, at basic prices 38,300.4 39,397.9 39,548.7 39,686.9 40,543.8 40,217.2 40,320.3Less: Financial intermediation services indirectly measured (FISIM) 1,325.0 1,225.3 1,195.7 1,009.4 962.1 941.9 1,036.1Plus: Taxes less Subsidies on products 4 1,251.3 1,324.3 1,027.9 1,212.7 1,210.4 1,102.4 1,165.4
Plus: Taxes on products Less: Subsidies on products
Plus: Statistical discrepancy
GROSS DOMESTIC PRODUCT 38,226.7 39,496.9 39,380.9 39,890.3 40,792.0 40,377.8 40,449.61 Includes Construction2 Refers to Education and Cultural services3 Refers to Personal services4 Refers to Value Added Tax.
80

Table 15.3 Trinidad and Tobago: Value added by industries at current prices
Millions of Trinidad and Tobago dollars
Item Description 2009 2010 2011 2012 2013 2014 2015
A+B Agriculture, hunting, forestry; fishing 545.2
0563.0
0613.0
0608.0
0626.0
0602.0
0600.0
0
A Agriculture, hunting, forestry 498.0 551.0 551.0 568.0 537.0 516.0Agriculture, hunting and related service activities 412.0 458.0 458.0 475.0 444.0 423.0Forestry, logging and related service activities 86.0 93.0 93.0 93.0 93.0 93.0
B Fishing 65.0 62.0 57.0 58.0 65.0 84.0C Mining and quarrying 39,813.2 1 33,370.0 41,232.0 41,426.0 42,468.0 41,403.0 32,009.0D Manufacturing 20,740.2 27,662.5 34,821.7 30,975.0 27,114.7 27,754.3 25,206.4
E Electricity, gas and water supply 1,777.9 1,809.7 2,000.1 1,997.3 1,940.7 2,079.8 2,120.4F Construction 9,410.5 8,772.3 8,778.5 9,352.3 10,243.6 10,725.3
G+H Wholesale, retail trade, repair of motor vehicles, motorcycles and personal and households goods; hotels and restaurants 20,722.0 29,371.4 36,067.0 37,743.8 41,383.8 42,931.5 42,218.0
G Wholesale, retail trade, repair of motor vehicles, motorcycles and personal and household goods 28,223.2 33,803.7 35,554.4 39,563.4 40,931.6 40,161.4H Hotels and restaurants 1,148.2 2,263.4 2,189.4 1,820.4 1,999.9 2,056.5
I Transport, storage and communications 7,194.6 7,988.3 8,475.9 8,640.7 8,975.5 9,341.2 9,510.1
Land transport; transport via pipelines, water transport; air transport; Supporting and auxiliary transport activities; activities of travel agencies 4,946.6 5,243.1 5,093.5 5,190.4 4,838.6 4,842.4Post and telecommunications 3,041.7 3,232.8 3,547.2 3,785.1 4,502.6 4,667.7
J+K Financial intermediation; real estate, renting and business activities 14,453.8 14,812.5 16,229.4 17,506.7 19,503.2 19,504.0 21,136.4
J Financial intermediation 8,098.0 9,202.2 9,358.1 9,776.4 10,029.0 11,195.0K Real estate, renting and business activities 6,714.5 7,027.2 8,148.7 9,726.8 9,475.3 9,941.4
L Public administration and defence; compulsory social security 11,167.9 10,423.9 10,475.6 10,674.1 11,551.4 13,755.3 14,549.4M+N+O Education; health and social work; other community, social and personal services 5,178.8 5,414.0 5,126.0 5,750.0 6,038.0 6,208.0 6,415.0
M Education 3,544.5 2 3,772.0 3,221.0 3,741.0 3,866.0 3,902.0 3,923.0N Health and social work 703.0 749.0 848.0 939.0 1,039.0 1,120.0O Other community, social and personal services 1,634.3
3938.8 1,156.0 1,161.0 1,233.0 1,267.0 1,372.0
P Private households with employed personsPlus: Statistical discrepancyVALUE ADDED, GROSS, at basic prices 121,593.6 140,826.0 163,813.0 164,100.0 168,954.0 173,823.0 164,490.0Less: Financial intermediation services indirectly measured (FISIM) 5,459.6 5,812.5 5,721.8 5,234.2 5,240.0 5,473.7 6,387.0Plus: Taxes less Subsidies on products 4 5,147.3 6,032.3 4,917.0 6,337.4 6,657.4 6,408.0 7,183.0
Plus: Taxes on productsLess: Subsidies on products
Plus: Statistical discrepancy
GROSS DOMESTIC PRODUCT 121,281.3 0 141,045.0 0 163,008.0 0 165,203.0 0 170,371.0 0 174,757.0 0 165,286.0 0
1 Includes Construction2 Refers to Education and Cultural services3 Refers to Personal services4 Refers to Value Added Tax.
81

Table 15.4 Trinidad and Tobago: Value added by industries at constant 2000 prices
Millions of Trinidad and Tobago dollars
Item Description 2009 2010 2011 2012 2013 2014 2015
A+B Agriculture, hunting, forestry; fishing 315.8
0213.6
0227.0
0226.9
0233.6
0252.0
0276.7
0
A Agriculture, hunting, forestry 181.6 198.4 201.2 208.4 224.8 244.1Agriculture, hunting and related service activities 153.0 169.6 172.2 179.7 196.0 215.3Forestry, logging and related service activities 28.6 28.8 29.0 28.7 28.8 28.8
B Fishing 32.0 28.6 25.7 25.2 27.2 32.6C Mining and quarrying 27,196.5 1 21,435.0 20,749.0 20,356.0 20,681.0 20,255.0 19,573.0D Manufacturing 21,558.6 21,544.3 20,779.9 20,190.5 20,222.8 19,562.0 19,104.1
E Electricity, gas and water supply 1,270.6 1,271.7 1,353.3 1,387.3 1,430.3 1,443.0 1,484.9F Construction 4,913.1 4,478.8 4,389.3 4,669.4 4,806.1 4,971.9
G+H Wholesale, retail trade, repair of motor vehicles, motorcycles and personal and households goods; hotels and restaurants 12,250.2 14,814.9 16,032.3 15,890.8 16,278.4 16,073.0 15,442.3
G Wholesale, retail trade, repair of motor vehicles, motorcycles and personal and household goods 14,229.7 14,958.5 14,955.8 15,540.2 15,307.9 14,690.9H Hotels and restaurants 585.2 1,073.8 935.0 738.2 765.4 751.4
I Transport, storage and communications 7,017.2 6,935.5 7,128.4 8,182.6 8,298.3 8,385.1 8,474.7
Land transport; transport via pipelines, water transport; air transport; Supporting and auxiliary transport activities; activities of travel agencies 4,153.0 4,406.7 4,715.5 4,701.2 4,453.7 4,472.1Post and telecommunications 2,782.5 2,721.7 3,467.1 3,597.1 3,931.4 4,002.6
J+K Financial intermediation; real estate, renting and business activities 11,491.8 12,421.1 13,074.9 13,467.6 14,666.2 14,492.3 15,740.4
J Financial intermediation 8,066.7 8,860.1 8,706.8 9,454.9 9,492.3 10,372.4K Real estate, renting and business activities 4,354.4 4,214.8 4,760.8 5,211.3 5,000.0 5,368.1
L Public administration and defence; compulsory social security 4,965.1 5,022.8 4,989.9 5,042.1 4,599.1 5,030.4 5,446.7M+N+O Education; health and social work; other community, social and personal services 2,947.1 2,991.7 3,100.7 3,102.3 3,147.6 3,168.9 3,192.7
M Education 1,785.7 2 1,900.0 1,855.0 1,844.0 1,868.0 1,830.0 1,768.0N Health and social work 438.0 463.0 510.0 537.0 577.0 615.0O Other community, social and personal services 1,161.4
3653.7 782.7 748.3 742.6 761.9 809.7
P Private households with employed personsPlus: Statistical discrepancyVALUE ADDED, GROSS, at basic prices 89,012.9 91,563.7 91,914.2 92,235.4 94,226.7 93,467.8 93,707.4Less: Financial intermediation services indirectly measured (FISIM) 3,079.3 2,847.7 2,778.9 2,345.9 2,236.1 2,189.0 2,408.0Plus: Taxes less Subsidies on products 4 2,908.1 3,077.7 2,388.9 2,818.4 2,813.0 2,562.1 2,708.5
Plus: Taxes on productsLess: Subsidies on products
Plus: Statistical discrepancy
GROSS DOMESTIC PRODUCT 88,841.7 0 91,793.7 0 91,524.2 0 92,707.9 0 94,803.6 0 93,840.9 0 94,007.9 0
1 Includes Construction2 Refers to Education and Cultural services3 Refers to Personal services4 Refers to Value Added Tax.
82


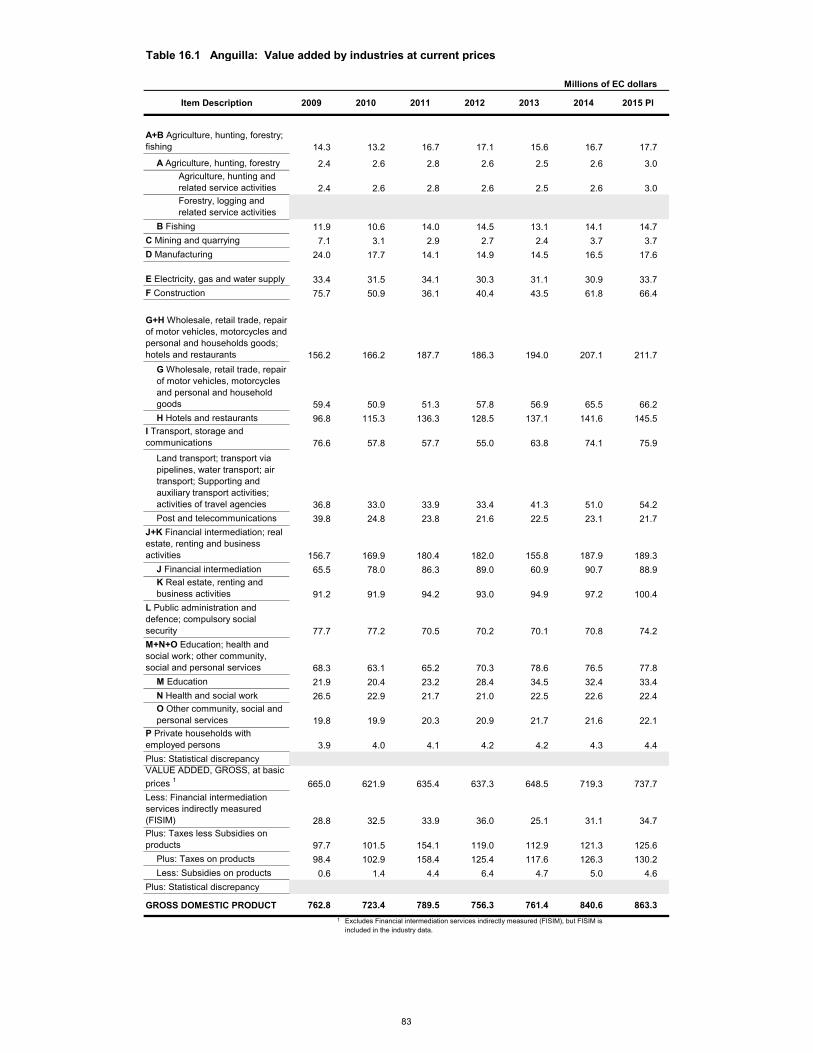
Table 16.1 Anguilla: Value added by industries at current prices
Millions of EC dollars
Item Description 2009 2010 2011 2012 2013 2014 2015 Pl
A+B Agriculture, hunting, forestry; fishing 14.3
013.2
016.7
017.1
015.6
016.7
017.7
0
A Agriculture, hunting, forestry 2.4 0 2.6 0 2.8 0 2.6 0 2.5 0 2.6 0 3.0 0
Agriculture, hunting and related service activities 2.4
02.6
02.8
02.6
02.5
02.6
03.0
0
Forestry, logging and related service activities
B Fishing 11.9 0 10.6 0 14.0 0 14.5 0 13.1 0 14.1 0 14.7 0
C Mining and quarrying 7.1 0 3.1 0 2.9 0 2.7 0 2.4 0 3.7 0 3.7 0
D Manufacturing 24.0 0 17.7 0 14.1 0 14.9 0 14.5 0 16.5 0 17.6 0
E Electricity, gas and water supply 33.40
31.50
34.10
30.30
31.10
30.90
33.70
F Construction 75.7 0 50.9 0 36.1 0 40.4 0 43.5 0 61.8 0 66.4 0
G+H Wholesale, retail trade, repair of motor vehicles, motorcycles and personal and households goods; hotels and restaurants 156.2
0
166.2
0
187.7
0
186.3
0
194.0
0
207.1
0
211.7
0
G Wholesale, retail trade, repair of motor vehicles, motorcycles and personal and household goods 59.4
0
50.9
0
51.3
0
57.8
0
56.9
0
65.5
0
66.2
0
H Hotels and restaurants 96.8 0 115.3 0 136.3 0 128.5 0 137.1 0 141.6 0 145.5 0
I Transport, storage and communications 76.6
057.8
057.7
055.0
063.8
074.1
075.9
0
Land transport; transport via pipelines, water transport; air transport; Supporting and auxiliary transport activities; activities of travel agencies 36.8
0
33.0
0
33.9
0
33.4
0
41.3
0
51.0
0
54.2
0
Post and telecommunications 39.8 0 24.8 0 23.8 0 21.6 0 22.5 0 23.1 0 21.7 0
J+K Financial intermediation; real estate, renting and business activities 156.7
0
169.90
180.40
182.00
155.80
187.90
189.30
J Financial intermediation 65.5 0 78.0 0 86.3 0 89.0 0 60.9 0 90.7 0 88.9 0
K Real estate, renting and business activities 91.2
091.9
094.2
093.0
094.9
097.2
0100.4
0
L Public administration and defence; compulsory social security 77.7
0
77.20
70.50
70.20
70.10
70.80
74.20
M+N+O Education; health and social work; other community, social and personal services 68.3
0
63.10
65.20
70.30
78.60
76.50
77.80
M Education 21.9 0 20.4 0 23.2 0 28.4 0 34.5 0 32.4 0 33.4 0
N Health and social work 26.5 0 22.9 0 21.7 0 21.0 0 22.5 0 22.6 0 22.4 0
O Other community, social and personal services 19.8
019.9
020.3
020.9
021.7
021.6
022.1
0
P Private households with employed persons 3.9
04.0
04.1
04.2
04.2
04.3
04.4
0
Plus: Statistical discrepancyVALUE ADDED, GROSS, at basic prices 1 665.0
0621.9
0635.4
0637.3
0648.5
0719.3
0737.7
0
Less: Financial intermediation services indirectly measured (FISIM) 28.8
0
32.50
33.90
36.00
25.10
31.10
34.70
Plus: Taxes less Subsidies on products 97.7
0101.5
0154.1
0119.0
0112.9
0121.3
0125.6
0
Plus: Taxes on products 98.4 0 102.9 0 158.4 0 125.4 0 117.6 0 126.3 0 130.2 0
Less: Subsidies on products 0.6 0 1.4 0 4.4 0 6.4 0 4.7 0 5.0 0 4.6 0
Plus: Statistical discrepancy
GROSS DOMESTIC PRODUCT 762.8 0 723.4 0 789.5 0 756.3 0 761.4 0 840.6 0 863.3 0
1 Excludes Financial intermediation services indirectly measured (FISIM), but FISIM is included in the industry data.
83

Table 16.2 Anguilla: Value added by industries at constant 2006 prices
Millions of EC dollars
Item Description 2009 2010 2011 2012 2013 2014 2015 Pl
A+B Agriculture, hunting, forestry; fishing 12.9
012.5
015.8
017.1
014.4
014.6
015.5
0
A Agriculture, hunting, forestry 1.7 0 2.1 0 1.9 0 1.6 0 1.7 0 1.7 0 2.0 0
Agriculture, hunting and related service activities 1.7
02.1
01.9
01.6
01.7
01.7
02.0
0
Forestry, logging and related service activities
B Fishing 11.2 0 10.4 0 14.0 0 15.4 0 12.6 0 12.9 0 13.6 0
C Mining and quarrying 5.7 0 2.5 0 2.4 0 2.1 0 2.0 0 2.8 0 2.8 0
D Manufacturing 24.0 0 11.9 0 11.7 0 11.8 0 11.6 0 13.5 0 13.7 0
E Electricity, gas and water supply 30.30
32.30
31.40
28.10
27.00
27.00
24.60
F Construction 63.3 0 48.3 0 34.1 0 37.4 0 40.1 0 55.6 0 59.9 0
G+H Wholesale, retail trade, repair of motor vehicles, motorcycles and personal and households goods; hotels and restaurants 168.5
0
166.3
0
171.9
0
169.2
0
174.8
0
185.5
0
189.5
0
G Wholesale, retail trade, repair of motor vehicles, motorcycles and personal and household goods 54.0
0
45.2
0
42.9
0
46.3
0
44.3
0
51.2
0
52.2
0
H Hotels and restaurants 114.5 0 121.1 0 129.0 0 122.9 0 130.5 0 134.3 0 137.3 0
I Transport, storage and communications 62.0
057.6
055.3
051.7
050.6
053.2
055.6
0
Land transport; transport via pipelines, water transport; air transport; Supporting and auxiliary transport activities; activities of travel agencies 26.5
0
22.3
0
20.9
0
21.0
0
23.1
0
26.9
0
29.1
0
Post and telecommunications 35.5 0 35.3 0 34.4 0 30.7 0 27.5 0 26.3 0 26.6 0
J+K Financial intermediation; real estate, renting and business activities 149.7
0
149.60
149.40
143.90
142.20
138.50
143.10
J Financial intermediation 68.8 0 68.6 0 67.8 0 66.1 0 63.4 0 57.8 0 60.6 0
K Real estate, renting and business activities 80.9
081.1
081.6
077.8
078.8
080.7
082.5
0
L Public administration and defence; compulsory social security 62.7
0
63.50
58.30
58.00
57.90
58.50
60.90
M+N+O Education; health and social work; other community, social and personal services 47.6
0
47.60
48.20
47.60
48.70
49.00
49.30
M Education 13.8 0 14.0 0 15.2 0 16.3 0 17.5 0 17.1 0 16.8 0
N Health and social work 16.4 0 15.4 0 15.3 0 13.4 0 12.9 0 13.3 0 13.6 0
O Other community, social and personal services 17.4
018.2
017.8
017.9
018.3
018.7
018.9
0
P Private households with employed persons 3.0
03.1
03.2
03.2
03.3
03.3
03.4
0
Plus: Statistical discrepancyVALUE ADDED, GROSS, at basic prices 1 609.8
0574.6
0559.9
0549.5
0552.0
0583.1
0599.5
0
Less: Financial intermediation services indirectly measured (FISIM) 19.9
0
20.60
21.80
20.60
20.50
18.40
18.90
Plus: Taxes less Subsidies on products 89.6
093.7
0135.8
0102.6
096.1
098.4
0102.1
0
Plus: Taxes on productsLess: Subsidies on products
Plus: Statistical discrepancy
GROSS DOMESTIC PRODUCT 699.4 0 668.3 0 695.6 0 652.1 0 648.1 0 681.4 0 701.5 0
1 Excludes Financial intermediation services indirectly measured (FISIM), but FISIM is included in the industry data.
84

Table 16.3 Anguilla: Gross domestic product by expenditures at current prices
Millions of EC dollars
Item Description 2009 2010 2011 2012 2013 2014 2015 Pl
Final consumption expenditure 763.3 ## 708.4 ## 776.0 ## 727.5 ## 723.7 ## 794.3 ## 810.7 ##
Household final consumption expenditure 640.8
##579.3
##650.3
##603.2
##602.8
##670.0
##677.6
##
NPISHs final consumption expenditureGeneral government final consumption expenditure 122.5
##129.1
##125.7
##124.3
##120.8
##124.3
##133.1
##
Individual consumption expenditureCollective consumption expenditure
Gross capital formation 226.9 ## 174.6 ## 140.5 ## 155.6 ## 148.2 ## 207.3 ## 222.8 ##
Gross fixed capital formation 226.9 ## 174.6 ## 140.5 ## 155.6 ## 148.2 ## 207.3 ## 222.8 ##
Changes in inventoriesAcquisitions less disposals of valuables
Exports of goods and services 363.0 ## 344.3 ## 370.3 ## 372.3 ## 393.3 ## 390.2 ## 389.9 ##
Exports of goods 62.7 ## 33.8 ## 19.6 ## 20.2 ## 7.0 ## 6.0 ## 4.9 ##
Exports of services 300.3 ## 310.6 ## 350.7 ## 352.1 ## 386.3 ## 384.2 ## 385.0 ##
Less: Imports of goods and services 590.4
##503.9
##497.3
##499.1
##503.8
##551.2
##560.1
##
Imports of goods 401.5 ## 356.1 ## 348.4 ## 349.0 ## 344.7 ## 360.9 ## 362.2 ##
Imports of services 188.9 ## 147.8 ## 148.9 ## 150.1 ## 159.1 ## 190.3 ## 197.8 ##
Plus: Statistical discrepancyGROSS DOMESTIC PRODUCT 762.8 ## 723.4 ## 789.5 ## 756.3 ## 761.4 ## 840.6 ## 863.3 ##
85

Table 16.4 Anguilla: Relations among product, income, savings, and net lending aggregates
Millions of EC dollars
Item Description 2009 2010 2011 2012 2013 2014 2015 Pl
GROSS DOMESTIC PRODUCT 762.8 723.4 789.5 756.3 761.4 840.6 863.3Compensation of employees - from and to the rest of the world, net 8.3 11.0 7.5 0.5 -1.4 -0.6 -0.7
Plus: Compensation of employees - from the rest of the world 11.0 11.1 10.0 2.5 0.0 0.9 1.0Less: Compensation of employees - to the rest of the world 2.7 0.1 2.5 2.0 1.4 1.6 1.6
Property income - from and to the rest of the world, net -25.8 -3.8 -8.4 -6.4 -10.0 1.8 1.7
Plus: Property income - from the rest of the world 6.5 5.2 4.8 3.5 3.4 13.3 13.7Less: Property income - to the rest of the world 32.3 9.0 13.2 9.9 13.4 11.5 12.1
Plus: Compensation of employees and property income - from and to the rest of the world, net -17.5 7.3 -0.9 -5.9 -11.5 1.2 1.0
Plus: Compensation of employees and property income - from the rest of the world 17.5 16.3 14.8 6.0 3.4 14.2 14.7
Less: Compensation of employees and property income - to the rest of the world 34.9 9.0 15.7 11.9 14.9 13.1 13.7
Plus: Taxes less subsidies on production and imports - from and to the rest of the world, net
Plus: Taxes less subsidies on production and imports - from the rest of the worldLess: Taxes less subsidies on production and imports - to the rest of the world
GROSS NATIONAL INCOME, at market prices 745.3 730.7 788.6 750.4 749.9 841.8 864.3Plus: Current transfers - from and to the rest of the world, net -13.2 15.6 27.6 -14.4 -12.9 -16.0 -16.2
Plus: Current transfers - from the rest of the world 21.3 45.6 68.3 31.1 24.9 25.4 25.9Less: Current transfers - to the rest of the world 34.5 30.0 40.7 45.5 37.8 41.4 42.1
GROSS NATIONAL DISPOSABLE INCOME 732.0 746.3 816.2 736.1 737.0 825.8 848.1Less: Final consumption expenditure / Actual final consumption 763.3 708.4 776.0 727.5 723.7 794.3 810.7Plus: Statistical discrepancySAVING, GROSS -31.2 37.9 40.3 8.6 13.4 31.5 37.5Plus: Capital transfers - from and to the rest of the world, net 31.0 43.6 21.2 28.5 32.1 31.1 20.4
Plus: Capital transfers - from the rest of the world 35.1 47.8 25.4 32.8 36.4 35.9 25.3Less: Capital transfers - to the rest of the world 4.0 4.1 4.2 4.3 4.4 4.8 4.9
Less: Gross capital formation 226.9 174.6 140.5 155.6 148.2 207.3 222.8
Less: Acquisitions less disposals of non-produced non-financial assets 0.0 0.0 0.0 0.0 0.0 0.0 0.0Plus: Statistical discrepancyNET LENDING(+)/ NET BORROWING(-) OF THE NATION -227.1 -93.1 -79.1 -118.5 -102.8 -144.8 -165.0
Less: Consumption of fixed capital
NET NATIONAL INCOME, in market pricesNET NATIONAL DISPOSABLE INCOMESAVING, NET
86


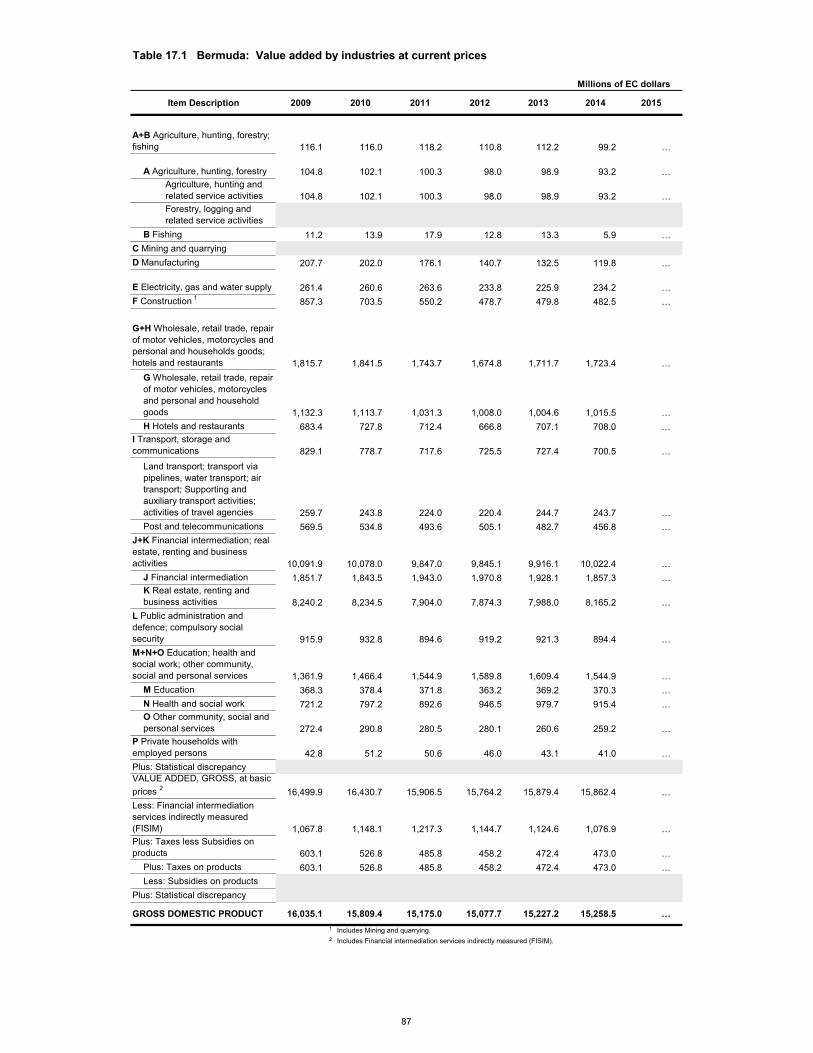
Table 17.1 Bermuda: Value added by industries at current prices
Millions of EC dollars
Item Description 2009 2010 2011 2012 2013 2014 2015
A+B Agriculture, hunting, forestry; fishing 116.1
0116.0
0118.2
0110.8
0112.2
099.2
0…
0
A Agriculture, hunting, forestry 104.80
102.10
100.30
98.00
98.90
93.20
…0
Agriculture, hunting and related service activities 104.8
0102.1
0100.3
098.0
098.9
093.2
0…
0
Forestry, logging and related service activities
B Fishing 11.2 0 13.9 0 17.9 0 12.8 0 13.3 0 5.9 0 … 0
C Mining and quarryingD Manufacturing 207.7 0 202.0 0 176.1 0 140.7 0 132.5 0 119.8 0 … 0
E Electricity, gas and water supply 261.40
260.60
263.60
233.80
225.90
234.20
…0
F Construction 1 857.3 703.5 550.2 478.7 479.8 482.5 …
G+H Wholesale, retail trade, repair of motor vehicles, motorcycles and personal and households goods; hotels and restaurants 1,815.7
0
1,841.5
0
1,743.7
0
1,674.8
0
1,711.7
0
1,723.4
0
…
0
G Wholesale, retail trade, repair of motor vehicles, motorcycles and personal and household goods 1,132.3
0
1,113.7
0
1,031.3
0
1,008.0
0
1,004.6
0
1,015.5
0
…
0
H Hotels and restaurants 683.4 0 727.8 0 712.4 0 666.8 0 707.1 0 708.0 0 … 0
I Transport, storage and communications 829.1
0778.7
0717.6
0725.5
0727.4
0700.5
0…
0
Land transport; transport via pipelines, water transport; air transport; Supporting and auxiliary transport activities; activities of travel agencies 259.7
0
243.8
0
224.0
0
220.4
0
244.7
0
243.7
0
…
0
Post and telecommunications 569.5 0 534.8 0 493.6 0 505.1 0 482.7 0 456.8 0 … 0
J+K Financial intermediation; real estate, renting and business activities 10,091.9
0
10,078.00
9,847.00
9,845.10
9,916.10
10,022.40
…0
J Financial intermediation 1,851.7 0 1,843.5 0 1,943.0 0 1,970.8 0 1,928.1 0 1,857.3 0 … 0
K Real estate, renting and business activities 8,240.2
08,234.5
07,904.0
07,874.3
07,988.0
08,165.2
0…
0
L Public administration and defence; compulsory social security 915.9
0
932.80
894.60
919.20
921.30
894.40
…0
M+N+O Education; health and social work; other community, social and personal services 1,361.9
0
1,466.40
1,544.90
1,589.80
1,609.40
1,544.90
…0
M Education 368.3 0 378.4 0 371.8 0 363.2 0 369.2 0 370.3 0 … 0
N Health and social work 721.2 0 797.2 0 892.6 0 946.5 0 979.7 0 915.4 0 … 0
O Other community, social and personal services 272.4
0290.8
0280.5
0280.1
0260.6
0259.2
0…
0
P Private households with employed persons 42.8
051.2
050.6
046.0
043.1
041.0
0…
0
Plus: Statistical discrepancyVALUE ADDED, GROSS, at basic prices 2 16,499.9 16,430.7 15,906.5 15,764.2 15,879.4 15,862.4 …Less: Financial intermediation services indirectly measured (FISIM) 1,067.8
0
1,148.10
1,217.30
1,144.70
1,124.60
1,076.90
…0
Plus: Taxes less Subsidies on products 603.1
0526.8
0485.8
0458.2
0472.4
0473.0
0…
0
Plus: Taxes on products 603.1 0 526.8 0 485.8 0 458.2 0 472.4 0 473.0 0 … 0
Less: Subsidies on productsPlus: Statistical discrepancy
GROSS DOMESTIC PRODUCT 16,035.1 0 15,809.4 0 15,175.0 0 15,077.7 0 15,227.2 0 15,258.5 0 … 0
1 Includes Mining and quarrying.2 Includes Financial intermediation services indirectly measured (FISIM).
87

Table 17.2 Bermuda: Value added by industries at constant 2006 prices
Millions of EC dollars
Item Description 2009 2010 2011 2012 2013 2014 2015
A+B Agriculture, hunting, forestry; fishing 130.5
0129.3
0124.1
0115.1
0116.4
0107.7
0…
0
A Agriculture, hunting, forestry 118.40
114.50
104.10
99.10
99.70
97.70
…0
Agriculture, hunting and related service activities 118.4
0114.5
0104.1
099.1
099.7
097.7
0…
0
Forestry, logging and related service activities
B Fishing 12.1 0 14.9 0 20.0 0 16.1 0 16.7 0 10.0 0 … 0
C Mining and quarryingD Manufacturing 232.2 0 215.0 0 202.4 0 172.2 0 158.2 0 148.5 0 … 0
E Electricity, gas and water supply 257.20
245.80
265.50
245.80
239.20
232.90
…0
F Construction 1 779.0 614.7 475.8 411.9 386.2 409.1 …
G+H Wholesale, retail trade, repair of motor vehicles, motorcycles and personal and households goods; hotels and restaurants 1,562.4 1,548.7 1,494.3 1,457.8 1,402.3 1,350.7 …
G Wholesale, retail trade, repair of motor vehicles, motorcycles and personal and household goods 958.4 895.6 837.3 809.0 799.2 800.9 …H Hotels and restaurants 604.0 653.1 657.0 648.8 603.1 549.8 …
I Transport, storage and communications 741.7 715.0 663.9 634.4 655.9 654.0 …
Land transport; transport via pipelines, water transport; air transport; Supporting and auxiliary transport activities; activities of travel agencies 256.7 266.6 254.8 233.2 284.7 290.5 …Post and telecommunications 484.9 448.4 409.1 401.1 371.2 363.5 …
J+K Financial intermediation; real estate, renting and business activities 9,040.0 8,971.3 8,797.7 8,372.9 8,233.6 8,251.6 …
J Financial intermediation 1,850.6 1,864.5 1,910.9 1,791.5 1,810.2 1,722.1 …K Real estate, renting and business activities 7,189.5 7,106.8 6,886.8 6,581.4 6,423.4 6,529.5 …
L Public administration and defence; compulsory social security 782.8 787.5 725.0 737.9 731.5 700.8 …M+N+O Education; health and social work; other community, social and personal services 1,193.9 1,189.8 1,164.8 1,167.1 1,132.0 1,056.2 …
M Education 305.1 304.5 267.8 252.2 253.4 245.4 …N Health and social work 654.3 657.9 682.6 702.1 679.2 623.7 …O Other community, social and personal services 234.5 227.4 214.3 212.8 199.4 187.1 …
P Private households with employed persons 47.0 49.5 48.9 44.1 39.8 35.7 …Plus: Statistical discrepancyVALUE ADDED, GROSS, at basic prices 2 14,766.6 14,466.4 13,962.3 13,359.1 13,095.1 12,947.1 …Less: Financial intermediation services indirectly measured (FISIM) 1,139.4
0
1,179.80
1,269.40
1,163.80
1,193.90
1,094.40
…0
Plus: Taxes less Subsidies on products 617.8
0605.3
0584.2
0559.0
0547.9
0541.7
0…
0
Plus: Taxes on products 617.8 0 605.3 0 584.2 0 559.0 0 547.9 0 541.7 0 … 0
Less: Subsidies on productsPlus: Statistical discrepancy
GROSS DOMESTIC PRODUCT 14,245.1 13,891.9 13,277.1 12,754.3 12,449.1 12,394.5 …1 Includes Mining and quarrying.2 Includes Financial intermediation services indirectly measured (FISIM).
88
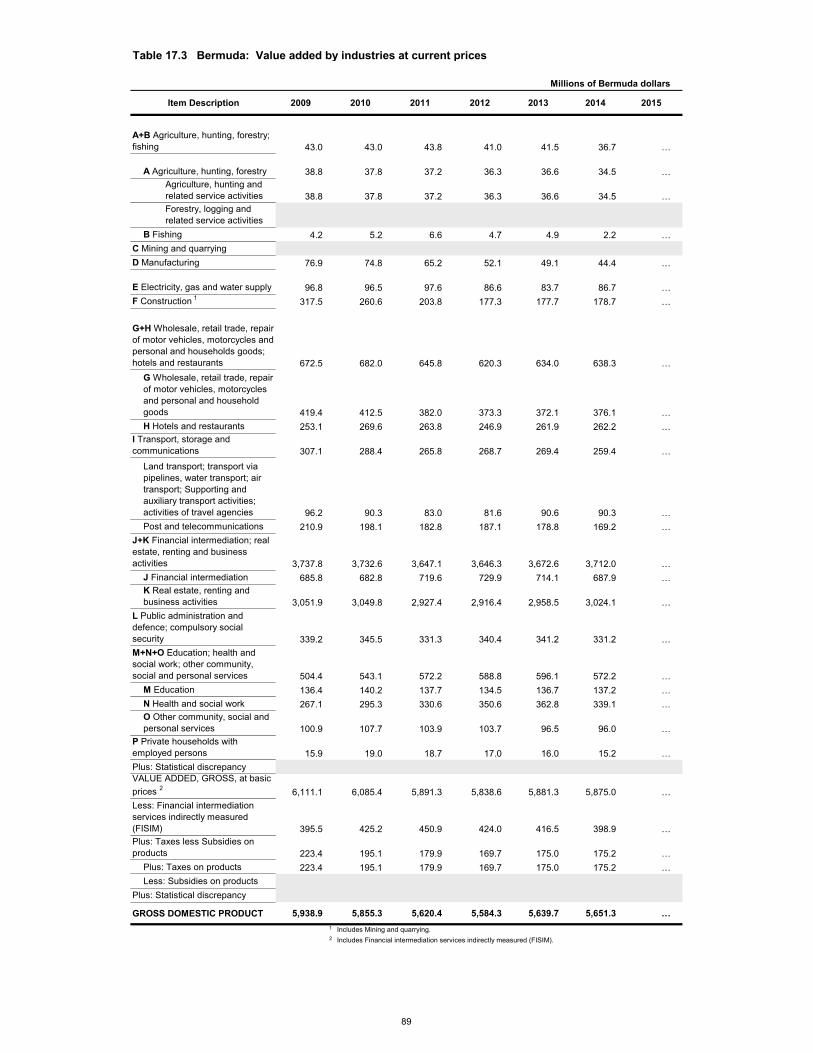
Table 17.3 Bermuda: Value added by industries at current prices
Millions of Bermuda dollars
Item Description 2009 2010 2011 2012 2013 2014 2015
A+B Agriculture, hunting, forestry; fishing 43.0
043.0
043.8
041.0
041.5
036.7
0…
0
A Agriculture, hunting, forestry 38.80
37.80
37.20
36.30
36.60
34.50
…0
Agriculture, hunting and related service activities 38.8
037.8
037.2
036.3
036.6
034.5
0…
0
Forestry, logging and related service activities
B Fishing 4.2 0 5.2 0 6.6 0 4.7 0 4.9 0 2.2 0 … 0
C Mining and quarryingD Manufacturing 76.9 0 74.8 0 65.2 0 52.1 0 49.1 0 44.4 0 … 0
E Electricity, gas and water supply 96.80
96.50
97.60
86.60
83.70
86.70
…0
F Construction 1 317.5 260.6 203.8 177.3 177.7 178.7 …
G+H Wholesale, retail trade, repair of motor vehicles, motorcycles and personal and households goods; hotels and restaurants 672.5 682.0 645.8 620.3 634.0 638.3 …
G Wholesale, retail trade, repair of motor vehicles, motorcycles and personal and household goods 419.4 412.5 382.0 373.3 372.1 376.1 …H Hotels and restaurants 253.1 269.6 263.8 246.9 261.9 262.2 …
I Transport, storage and communications 307.1 288.4 265.8 268.7 269.4 259.4 …
Land transport; transport via pipelines, water transport; air transport; Supporting and auxiliary transport activities; activities of travel agencies 96.2 90.3 83.0 81.6 90.6 90.3 …Post and telecommunications 210.9 198.1 182.8 187.1 178.8 169.2 …
J+K Financial intermediation; real estate, renting and business activities 3,737.8 3,732.6 3,647.1 3,646.3 3,672.6 3,712.0 …
J Financial intermediation 685.8 682.8 719.6 729.9 714.1 687.9 …K Real estate, renting and business activities 3,051.9 3,049.8 2,927.4 2,916.4 2,958.5 3,024.1 …
L Public administration and defence; compulsory social security 339.2 345.5 331.3 340.4 341.2 331.2 …M+N+O Education; health and social work; other community, social and personal services 504.4 543.1 572.2 588.8 596.1 572.2 …
M Education 136.4 140.2 137.7 134.5 136.7 137.2 …N Health and social work 267.1 295.3 330.6 350.6 362.8 339.1 …O Other community, social and personal services 100.9 107.7 103.9 103.7 96.5 96.0 …
P Private households with employed persons 15.9 19.0 18.7 17.0 16.0 15.2 …Plus: Statistical discrepancyVALUE ADDED, GROSS, at basic prices 2 6,111.1 6,085.4 5,891.3 5,838.6 5,881.3 5,875.0 …Less: Financial intermediation services indirectly measured (FISIM) 395.5
0
425.20
450.90
424.00
416.50
398.90
…0
Plus: Taxes less Subsidies on products 223.4
0195.1
0179.9
0169.7
0175.0
0175.2
0…
0
Plus: Taxes on products 223.4 0 195.1 0 179.9 0 169.7 0 175.0 0 175.2 0 … 0
Less: Subsidies on productsPlus: Statistical discrepancy
GROSS DOMESTIC PRODUCT 5,938.9 0 5,855.3 0 5,620.4 0 5,584.3 0 5,639.7 0 5,651.3 0 … 0
1 Includes Mining and quarrying.2 Includes Financial intermediation services indirectly measured (FISIM).
89

Table 17.4 Bermuda: Value added by industries at constant 2006 prices
Millions of Bermuda dollars
Item Description 2009 2010 2011 2012 2013 2014 2015
A+B Agriculture, hunting, forestry; fishing 48.3
047.9
046.0
042.6
043.1
039.9
0…
0
A Agriculture, hunting, forestry 43.90
42.40
38.60
36.70
36.90
36.20
…0
Agriculture, hunting and related service activities 43.9
042.4
038.6
036.7
036.9
036.2
0…
0
Forestry, logging and related service activities
B Fishing 4.5 0 5.5 0 7.4 0 5.9 0 6.2 0 3.7 0 … 0
C Mining and quarryingD Manufacturing 86.0 0 79.6 0 75.0 0 63.8 0 58.6 0 55.0 0 … 0
E Electricity, gas and water supply 95.20
91.00
98.30
91.00
88.60
86.30
…0
F Construction 1 288.5 227.7 176.2 152.6 143.0 151.5 …
G+H Wholesale, retail trade, repair of motor vehicles, motorcycles and personal and households goods; hotels and restaurants 578.7 573.6 553.4 539.9 519.4 500.3 …
G Wholesale, retail trade, repair of motor vehicles, motorcycles and personal and household goods 355.0 331.7 310.1 299.6 296.0 296.6 …H Hotels and restaurants 223.7 241.9 243.3 240.3 223.4 203.6 …
I Transport, storage and communications 274.7 264.8 245.9 235.0 242.9 242.2 …
Land transport; transport via pipelines, water transport; air transport; Supporting and auxiliary transport activities; activities of travel agencies 95.1 98.8 94.4 86.4 105.4 107.6 …Post and telecommunications 179.6 166.1 151.5 148.6 137.5 134.6 …
J+K Financial intermediation; real estate, renting and business activities 3,348.2 3,322.7 3,258.4 3,101.1 3,049.5 3,056.1 …
J Financial intermediation 685.4 690.5 707.7 663.5 670.5 637.8 …K Real estate, renting and business activities 2,662.8 2,632.1 2,550.7 2,437.6 2,379.0 2,418.3 …
L Public administration and defence; compulsory social security 289.9 291.7 268.5 273.3 270.9 259.6 …M+N+O Education; health and social work; other community, social and personal services 442.2 440.7 431.4 432.2 419.2 391.2 …
M Education 113.0 112.8 99.2 93.4 93.9 90.9 …N Health and social work 242.3 243.7 252.8 260.0 251.5 231.0 …O Other community, social and personal services 86.9 84.2 79.4 78.8 73.8 69.3 …
P Private households with employed persons 17.4 18.3 18.1 16.3 14.7 13.2 …Plus: Statistical discrepancyVALUE ADDED, GROSS, at basic prices 2 5,469.1 5,357.9 5,171.2 4,947.8 4,850.0 4,795.2 …Less: Financial intermediation services indirectly measured (FISIM) 422.0
0
437.00
470.10
431.00
442.20
405.30
…0
Plus: Taxes less Subsidies on products 228.8
0224.2
0216.4
0207.0
0202.9
0200.6
0…
0
Plus: Taxes on products 228.8 0 224.2 0 216.4 0 207.0 0 202.9 0 200.6 0 … 0
Less: Subsidies on productsPlus: Statistical discrepancy
GROSS DOMESTIC PRODUCT 5,276.0 0 5,145.2 0 4,917.5 0 4,723.8 0 4,610.8 0 4,590.6 0 … 0
1 Includes Mining and quarrying.2 Includes Financial intermediation services indirectly measured (FISIM).
90
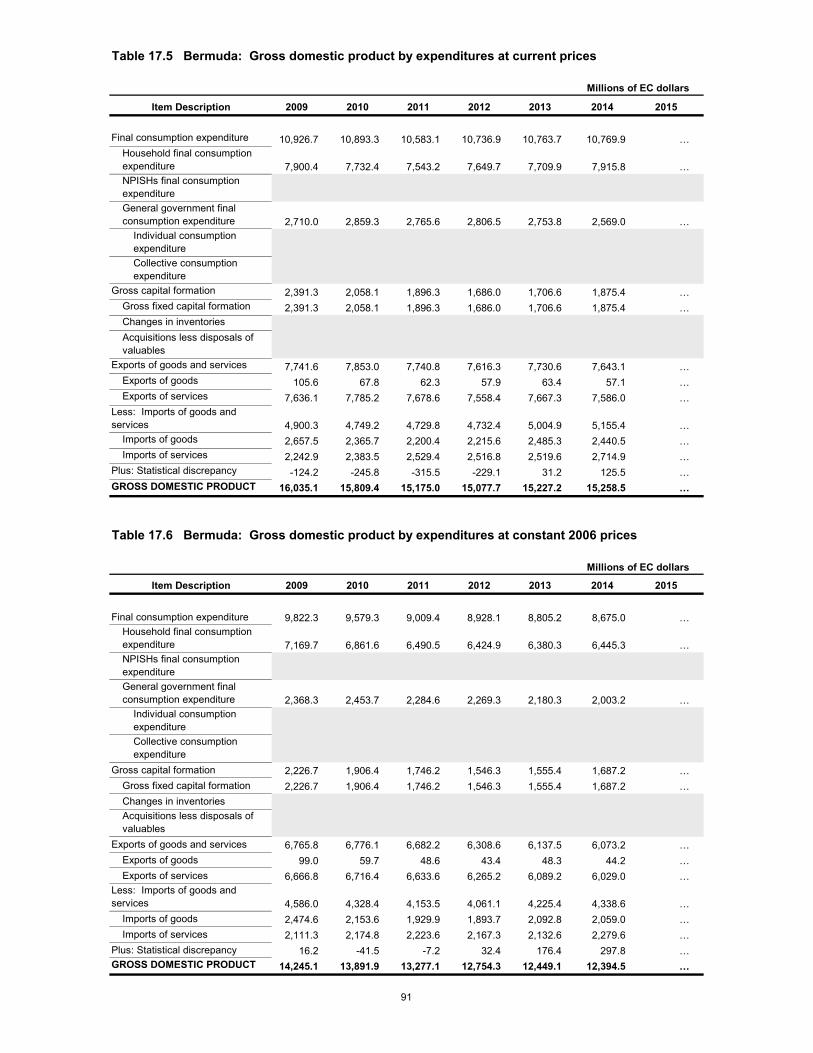
Table 17.5 Bermuda: Gross domestic product by expenditures at current prices
Millions of EC dollars
Item Description 2009 2010 2011 2012 2013 2014 2015
Final consumption expenditure 10,926.7 ## 10,893.3 ## 10,583.1 ## 10,736.9 ## 10,763.7 ## 10,769.9 ## … ##
Household final consumption expenditure 7,900.4
##7,732.4
##7,543.2
##7,649.7
##7,709.9
##7,915.8
##…
##
NPISHs final consumption expenditureGeneral government final consumption expenditure 2,710.0
##2,859.3
##2,765.6
##2,806.5
##2,753.8
##2,569.0
##…
##
Individual consumption expenditureCollective consumption expenditure
Gross capital formation 2,391.3 ## 2,058.1 ## 1,896.3 ## 1,686.0 ## 1,706.6 ## 1,875.4 ## … ##
Gross fixed capital formation 2,391.3 ## 2,058.1 ## 1,896.3 ## 1,686.0 ## 1,706.6 ## 1,875.4 ## … ##
Changes in inventoriesAcquisitions less disposals of valuables
Exports of goods and services 7,741.6 ## 7,853.0 ## 7,740.8 ## 7,616.3 ## 7,730.6 ## 7,643.1 ## … ##
Exports of goods 105.6 ## 67.8 ## 62.3 ## 57.9 ## 63.4 ## 57.1 ## … ##
Exports of services 7,636.1 ## 7,785.2 ## 7,678.6 ## 7,558.4 ## 7,667.3 ## 7,586.0 ## … ##
Less: Imports of goods and services 4,900.3
##4,749.2
##4,729.8
##4,732.4
##5,004.9
##5,155.4
##…
##
Imports of goods 2,657.5 ## 2,365.7 ## 2,200.4 ## 2,215.6 ## 2,485.3 ## 2,440.5 ## … ##
Imports of services 2,242.9 ## 2,383.5 ## 2,529.4 ## 2,516.8 ## 2,519.6 ## 2,714.9 ## … ##
Plus: Statistical discrepancy -124.2 ## -245.8 ## -315.5 ## -229.1 ## 31.2 ## 125.5 ## … ##
GROSS DOMESTIC PRODUCT 16,035.1 ## 15,809.4 ## 15,175.0 ## 15,077.7 ## 15,227.2 ## 15,258.5 ## … ##
Table 17.6 Bermuda: Gross domestic product by expenditures at constant 2006 prices
Millions of EC dollars
Item Description 2009 2010 2011 2012 2013 2014 2015
Final consumption expenditure 9,822.3 ## 9,579.3 ## 9,009.4 ## 8,928.1 ## 8,805.2 ## 8,675.0 ## … ##
Household final consumption expenditure 7,169.7
##6,861.6
##6,490.5
##6,424.9
##6,380.3
##6,445.3
##…
##
NPISHs final consumption expenditureGeneral government final consumption expenditure 2,368.3
##2,453.7
##2,284.6
##2,269.3
##2,180.3
##2,003.2
##…
##
Individual consumption expenditureCollective consumption expenditure
Gross capital formation 2,226.7 ## 1,906.4 ## 1,746.2 ## 1,546.3 ## 1,555.4 ## 1,687.2 ## … ##
Gross fixed capital formation 2,226.7 ## 1,906.4 ## 1,746.2 ## 1,546.3 ## 1,555.4 ## 1,687.2 ## … ##
Changes in inventoriesAcquisitions less disposals of valuables
Exports of goods and services 6,765.8 ## 6,776.1 ## 6,682.2 ## 6,308.6 ## 6,137.5 ## 6,073.2 ## … ##
Exports of goods 99.0 ## 59.7 ## 48.6 ## 43.4 ## 48.3 ## 44.2 ## … ##
Exports of services 6,666.8 ## 6,716.4 ## 6,633.6 ## 6,265.2 ## 6,089.2 ## 6,029.0 ## … ##
Less: Imports of goods and services 4,586.0
##4,328.4
##4,153.5
##4,061.1
##4,225.4
##4,338.6
##…
##
Imports of goods 2,474.6 ## 2,153.6 ## 1,929.9 ## 1,893.7 ## 2,092.8 ## 2,059.0 ## … ##
Imports of services 2,111.3 ## 2,174.8 ## 2,223.6 ## 2,167.3 ## 2,132.6 ## 2,279.6 ## … ##
Plus: Statistical discrepancy 16.2 ## -41.5 ## -7.2 ## 32.4 ## 176.4 ## 297.8 ## … ##
GROSS DOMESTIC PRODUCT 14,245.1 ## 13,891.9 ## 13,277.1 ## 12,754.3 ## 12,449.1 ## 12,394.5 ## … ##
91

Table 17.7 Bermuda: Gross domestic product by expenditures at current prices
Millions of Bermuda dollars
Item Description 2009 2010 2011 2012 2013 2014 2015
Final consumption expenditure 4,046.9 4,034.6 3,919.7 3,976.6 3,986.6 3,988.8 … ##
Household final consumption expenditure 2,926.1 2,863.8 2,793.8 2,833.2 2,855.5 2,931.8 …
##
NPISHs final consumption expenditure 117.1 111.7 101.6 104.0 111.1 105.6 …General government final consumption expenditure 1,003.7 1,059.0 1,024.3 1,039.4 1,019.9 951.5 …
##
Individual consumption expenditureCollective consumption expenditure
Gross capital formation 885.7 762.3 702.3 624.4 632.1 694.6 … ##
Gross fixed capital formation 885.7 762.3 702.3 624.4 632.1 694.6 … ##
Changes in inventoriesAcquisitions less disposals of valuables
Exports of goods and services 2,867.3 2,908.5 2,867.0 2,820.8 2,863.2 2,830.8 … ##
Exports of goods 39.1 25.1 23.1 21.4 23.5 21.1 … ##
Exports of services 2,828.2 2,883.4 2,843.9 2,799.4 2,839.7 2,809.6 … ##
Less: Imports of goods and services 1,814.9 1,759.0 1,751.8 1,752.7 1,853.7 1,909.4 …
##
Imports of goods 984.3 876.2 814.9 820.6 920.5 903.9 … ##
Imports of services 830.7 882.8 936.8 932.1 933.2 1,005.5 … ##
Plus: Statistical discrepancy -46.0 -91.0 -116.8 -84.9 11.6 46.5 … ##
GROSS DOMESTIC PRODUCT 5,938.9 5,855.3 5,620.4 5,584.3 5,639.7 5,651.3 … ##
Table 17.8 Bermuda: Gross domestic product by expenditures at constant 2006 prices
Millions of Bermuda dollars
Item Description 2009 2010 2011 2012 2013 2014 2015
Final consumption expenditure 3,637.9 3,547.9 3,336.8 3,306.7 3,261.2 3,213.0 … ##
Household final consumption expenditure 2,655.5 2,541.3 2,403.9 2,379.6 2,363.1 2,387.1 …
##
NPISHs final consumption expenditure 105.3 97.8 86.8 86.6 90.6 83.9 …General government final consumption expenditure 877.1 908.8 846.1 840.5 807.5 741.9 …
##
Individual consumption expenditureCollective consumption expenditure
Gross capital formation 824.7 706.1 646.8 572.7 576.1 624.9 … ##
Gross fixed capital formation 824.7 706.1 646.8 572.7 576.1 624.9 … ##
Changes in inventoriesAcquisitions less disposals of valuables
Exports of goods and services 2,505.9 2,509.7 2,474.9 2,336.5 2,273.1 2,249.3 … ##
Exports of goods 36.7 22.1 18.0 16.1 17.9 16.4 … ##
Exports of services 2,469.2 2,487.5 2,456.9 2,320.4 2,255.3 2,233.0 … ##
Less: Imports of goods and services 1,698.5 1,603.1 1,538.3 1,504.1 1,565.0 1,606.9 …
##
Imports of goods 916.5 797.6 714.8 701.4 775.1 762.6 … ##
Imports of services 782.0 805.5 823.6 802.7 789.8 844.3 … ##
Plus: Statistical discrepancy 6.0 -15.4 -2.7 12.0 65.3 110.3 … ##
GROSS DOMESTIC PRODUCT 5,276.0 5,145.2 4,917.5 4,723.8 4,610.8 4,590.6 … ##
92

Table 17.9 Bermuda: Relations among product, income, savings, and net lending aggregates
Millions of EC dollars
Item Description 2009 2010 2011 2012 2013 2014 2015
GROSS DOMESTIC PRODUCT 16,035.1 15,809.4 15,175.0 15,077.7 15,227.2 15,258.5 …Compensation of employees - from and to the rest of the world, net -168.3 -163.9 -154.3 -161.0 -156.5 -165.5 …
Plus: Compensation of employees - from the rest of the world 23.1 16.9 19.2 18.9 17.3 16.4 …Less: Compensation of employees - to the rest of the world 191.4 180.8 173.5 180.0 173.8 181.9 …
Property income - from and to the rest of the world, net -404.4 176.4 182.2 551.4 584.1 434.1 …
Plus: Property income - from the rest of the world 840.3 898.3 964.3 1,057.3 2,628.6 1,065.1 …Less: Property income - to the rest of the world 1,244.6 721.9 782.1 505.9 2,044.6 631.0 …
Plus: Compensation of employees and property income - from and to the rest of the world, net -572.6 12.5 28.0 390.4 427.5 268.6 …
Plus: Compensation of employees and property income - from the rest of the world 863.3 915.2 983.5 1,076.3 2,645.9 1,081.5 …
Less: Compensation of employees and property income - to the rest of the world 1,436.0 902.7 955.5 685.9 2,218.4 812.9 …
Plus: Taxes less subsidies on production and imports - from and to the rest of the world, net
Plus: Taxes less subsidies on production and imports - from the rest of the worldLess: Taxes less subsidies on production and imports - to the rest of the world
GROSS NATIONAL INCOME, at market prices 15,462.5 15,821.9 15,203.0 15,468.1 15,654.8 15,527.1 …Plus: Current transfers - from and to the rest of the world, net -345.5 -378.0 -353.5 -374.2 -417.6 -405.8 …
Plus: Current transfers - from the rest of the world 241.8 212.2 238.2 275.1 264.0 330.0 …Less: Current transfers - to the rest of the world 587.3 590.3 591.7 649.3 681.6 735.8 …
GROSS NATIONAL DISPOSABLE INCOME 15,117.0 15,443.8 14,849.5 15,093.9 15,237.2 15,121.3 …Less: Final consumption expenditure / Actual final consumption 10,926.7 10,893.3 10,583.1 10,736.9 10,763.7 10,769.9 …Plus: Statistical discrepancySAVING, GROSS 4,190.3 4,550.6 4,266.4 4,357.0 4,473.5 4,351.4 …Plus: Capital transfers - from and to the rest of the world, net
Plus: Capital transfers - from the rest of the worldLess: Capital transfers - to the rest of the world
Less: Gross capital formation 2,391.3 2,058.1 1,896.3 1,686.0 1,706.6 1,875.4 …
Less: Acquisitions less disposals of non-produced non-financial assetsPlus: Statistical discrepancy
NET LENDING(+)/ NET BORROWING(-) OF THE NATION 1,799.0 2,492.4 2,370.0 2,671.0 2,766.9 2,476.1 …
Less: Consumption of fixed capital
NET NATIONAL INCOME, in market pricesNET NATIONAL DISPOSABLE INCOMESAVING, NET
93

Table 17.10 Bermuda: Relations among product, income, savings, and net lending aggregates
Millions of Bermuda dollars
Item Description 2009 2010 2011 2012 2013 2014 2015
GROSS DOMESTIC PRODUCT 5,938.9 5,855.3 5,620.4 5,584.3 5,639.7 5,651.3 …Compensation of employees - from and to the rest of the world, net -62.3 -60.7 -57.1 -59.6 -58.0 -61.3 …
Plus: Compensation of employees - from the rest of the world 8.5 6.3 7.1 7.0 6.4 6.1 …Less: Compensation of employees - to the rest of the world 70.9 67.0 64.3 66.7 64.4 67.4 …
Property income - from and to the rest of the world, net -149.8 65.3 67.5 204.2 216.3 160.8 …
Plus: Property income - from the rest of the world 311.2 332.7 357.1 391.6 973.6 394.5 …Less: Property income - to the rest of the world 461.0 267.4 289.7 187.4 757.2 233.7 …
Plus: Compensation of employees and property income - from and to the rest of the world, net -212.1 4.6 10.4 144.6 158.3 99.5 …
Plus: Compensation of employees and property income - from the rest of the world 319.8 339.0 364.3 398.6 980.0 400.6 …
Less: Compensation of employees and property income - to the rest of the world 531.8 334.3 353.9 254.0 821.6 301.1 …
Plus: Taxes less subsidies on production and imports - from and to the rest of the world, net
Plus: Taxes less subsidies on production and imports - from the rest of the worldLess: Taxes less subsidies on production and imports - to the rest of the world
GROSS NATIONAL INCOME, at market prices 5,726.8 5,860.0 5,630.7 5,728.9 5,798.1 5,750.8 …Plus: Current transfers - from and to the rest of the world, net -128.0 -140.0 -130.9 -138.6 -154.7 -150.3 …
Plus: Current transfers - from the rest of the world 89.6 78.6 88.2 101.9 97.8 122.2 …Less: Current transfers - to the rest of the world 217.5 218.6 219.2 240.5 252.4 272.5 …
GROSS NATIONAL DISPOSABLE INCOME 5,598.9 5,719.9 5,499.8 5,590.3 5,643.4 5,600.5 …Less: Final consumption expenditure / Actual final consumption 4,046.9 4,034.6 3,919.7 3,976.6 3,986.6 3,988.8 …Plus: Statistical discrepancySAVING, GROSS 1,552.0 1,685.4 1,580.1 1,613.7 1,656.9 1,611.6 …Plus: Capital transfers - from and to the rest of the world, net
Plus: Capital transfers - from the rest of the worldLess: Capital transfers - to the rest of the world
Less: Gross capital formation 885.7 762.3 702.3 624.4 632.1 694.6 …
Less: Acquisitions less disposals of non-produced non-financial assetsPlus: Statistical discrepancy
NET LENDING(+)/ NET BORROWING(-) OF THE NATION 666.3 923.1 877.8 989.3 1,024.8 917.1 …
Less: Consumption of fixed capital
NET NATIONAL INCOME, in market pricesNET NATIONAL DISPOSABLE INCOMESAVING, NET
94


Table 18.1 British Virgin Islands: Value added by industries at current prices
Millions of EC dollars
Item Description 2009 2010 2011 2012 2013 2014 2015
A+B Agriculture, hunting, forestry; fishing 24.3
024.3
024.3
025.6
025.6
0…
0…
0
A Agriculture, hunting, forestry 10.80
10.80
10.80
11.10
11.10
…0
…0
Agriculture, hunting and related service activities 1 10.8 10.8 10.8 11.1 11.1 … …Forestry, logging and related service activities
B Fishing 13.5 0 13.5 0 13.5 0 14.6 0 14.6 0 … 0 … 0
C Mining and quarrying 1.0 … 0 …D Manufacturing 72.9 0 72.9 0 72.9 0 73.5 0 73.5 0 … 0 … 0
E Electricity, gas and water supply 54.00
56.70
59.40
61.90
65.20
…0
…0
F Construction 170.1 0 113.4 0 143.1 0 140.2 0 139.7 0 … 0 … 0
G+H Wholesale, retail trade, repair of motor vehicles, motorcycles and personal and households goods; hotels and restaurants 629.1
0
666.9
0
669.6
0
677.4
0
694.3
0
…
0
…
0
G Wholesale, retail trade, repair of motor vehicles, motorcycles and personal and household goods 310.5
0
332.1
0
334.8
0
336.8
0
340.5
0
…
0
…
0
H Hotels and restaurants 318.6 0 334.8 0 334.8 0 340.6 0 353.8 0 … 0 … 0
I Transport, storage and communications 259.2
0275.4
0275.4
0279.8
0286.7
0…
0…
0
Land transport; transport via pipelines, water transport; air transport; Supporting and auxiliary transport activities; activities of travel agenciesPost and telecommunications
J+K Financial intermediation; real estate, renting and business activities 788.4
0
864.00
885.60
883.00
855.10
…0
…0
J Financial intermediation 102.6 0 129.6 0 140.4 0 139.1 0 115.8 0 … 0 … 0
K Real estate, renting and business activities 685.8
0734.4
0745.2
0743.9
0739.3
0…
0…
0
L Public administration and defence; compulsory social security 183.6
0
180.90
186.30
170.70
170.10
…0
…0
M+N+O Education; health and social work; other community, social and personal services 183.6
0
180.90
183.60
174.20
173.70
…0
…0
M Education 72.9 0 72.9 0 72.9 0 68.1 0 67.8 0 … 0 … 0
N Health and social work 51.3 0 48.6 0 51.3 0 47.1 0 47.0 0 … 0 … 0
O Other community, social and personal services 59.4
059.4
059.4
059.0
058.9
0…
0…
0
P Private households with employed personsPlus: Statistical discrepancyVALUE ADDED, GROSS, at basic prices 2 2,367.9 2,438.1 2,502.9 2,487.5 2,485.1 … …Less: Financial intermediation services indirectly measured (FISIM) 89.1
0
110.70
121.50
120.80
101.00
…0
…0
Plus: Taxes less Subsidies on products 86.4
089.1
089.1
088.7
088.0
0…
0…
0
Plus: Taxes on products 89.1 0 89.1 0 89.1 0 88.7 0 88.0 0 … 0 … 0
Less: Subsidies on productsPlus: Statistical discrepancy
GROSS DOMESTIC PRODUCT 2,365.2 0 2,413.8 0 2,473.2 0 2,455.3 0 2,472.1 0 … 0 … 0
1 Excludes Hunting2 Includes Financial intermediation services indirectly measured (FISIM).
95

Table 18.2 British Virgin Islands: Value added by industries at current prices
Millions of United States dollars
Item Description 2009 2010 2011 2012 2013 2014 2015
A+B Agriculture, hunting, forestry; fishing 9.0
09.0
09.0
09.5
09.5
0…
0…
0
A Agriculture, hunting, forestry 4.00
4.00
4.00
4.10
4.10
…0
…0
Agriculture, hunting and related service activities 1 4.0 4.0 4.0 4.1 4.1 …
0
…0
Forestry, logging and related service activities
B Fishing 5.0 0 5.0 0 5.0 0 5.4 0 5.4 0 … 0 … 0
C Mining and quarrying 0.4 … 0 …D Manufacturing 27.0 0 27.0 0 27.0 0 27.2 0 27.2 0 … 0 … 0
E Electricity, gas and water supply 20.00
21.00
22.00
22.90
24.20
…0
…0
F Construction 63.0 0 42.0 0 53.0 0 51.9 0 51.8 0 … 0 … 0
G+H Wholesale, retail trade, repair of motor vehicles, motorcycles and personal and households goods; hotels and restaurants 233.0
0
247.0
0
248.0
0
250.9
0
257.2
0
…
0
…
0
G Wholesale, retail trade, repair of motor vehicles, motorcycles and personal and household goods 115.0
0
123.0
0
124.0
0
124.7
0
126.1
0
…
0
…
0
H Hotels and restaurants 118.0 0 124.0 0 124.0 0 126.2 0 131.0 0 … 0 … 0
I Transport, storage and communications 96.0
0102.0
0102.0
0103.6
0106.2
0…
0…
0
Land transport; transport via pipelines, water transport; air transport; Supporting and auxiliary transport activities; activities of travel agenciesPost and telecommunications
J+K Financial intermediation; real estate, renting and business activities 292.0
0
320.00
328.00
327.00
316.70
…0
…0
J Financial intermediation 38.0 0 48.0 0 52.0 0 51.5 0 42.9 0 … 0 … 0
K Real estate, renting and business activities 254.0
0272.0
0276.0
0275.5
0273.8
0…
0…
0
L Public administration and defence; compulsory social security 68.0
0
67.00
69.00
63.20
63.00
…0
…0
M+N+O Education; health and social work; other community, social and personal services 68.0
0
67.00
68.00
64.50
64.30
…0
…0
M Education 27.0 0 27.0 0 27.0 0 25.2 0 25.1 0 … 0 … 0
N Health and social work 19.0 0 18.0 0 19.0 0 17.5 0 17.4 0 … 0 … 0
O Other community, social and personal services 22.0
022.0
022.0
021.8
021.8
0…
0…
0
P Private households with employed personsPlus: Statistical discrepancyVALUE ADDED, GROSS, at basic prices 2 877.0 903.0 927.0 921.3 920.4 …
0…
0
Less: Financial intermediation services indirectly measured (FISIM) 33.0
0
41.00
45.00
44.70
37.40
…0
…0
Plus: Taxes less Subsidies on products 32.0
033.0
033.0
032.8
032.6
0…
0…
0
Plus: Taxes on products 33.0 0 33.0 0 33.0 0 32.8 0 32.6 0 … 0 … 0
Less: Subsidies on productsPlus: Statistical discrepancy
GROSS DOMESTIC PRODUCT 876.0 0 894.0 0 916.0 0 909.4 0 915.6 0 … 0 … 0
1 Excludes Hunting2 Includes Financial intermediation services indirectly measured (FISIM).
96

Table 18.3 British Virgin Islands: Gross domestic product by expenditures at current prices
Millions of EC dollars
Item Description 2009 2010 2011 2012 2013 2014 2015
Final consumption expenditure 1,047.6 ## 1,061.1 ## 1,077.3 ## 1,062.2 ## 1,062.6 ## … ## … ##
Household final consumption expenditure 842.4
##853.2
##866.7
##856.1
##857.0
##…
##…
##
NPISHs final consumption expenditureGeneral government final consumption expenditure 205.2
##207.9
##210.6
##206.1
##205.6
##…
##…
##
Individual consumption expenditureCollective consumption expenditure
Gross capital formation 523.8 ## 531.9 ## 542.7 ## 538.4 ## 540.9 ## … ## … ##
Gross fixed capital formation 567.0 ## 577.8 ## 591.3 ## 586.8 ## 590.6 ## … ## … ##
Changes in inventories -43.2 ## -45.9 ## -48.6 ## -48.4 ## -49.7 ## … ## … ##
Acquisitions less disposals of valuables
Exports of goods and services 2,621.7 ## 2,686.5 ## 2,756.7 ## 2,746.0 ## 2,771.7 ## … ## … ##
Exports of goods 54.0 ## 54.0 ## 54.0 ## 52.7 ## 51.9 ## … ## … ##
Exports of services 2,567.7 ## 2,632.5 ## 2,702.7 ## 2,693.4 ## 2,719.8 ## … ## … ##
Less: Imports of goods and services 1,827.9
##1,863.0
##1,906.2
##1,891.4
##1,902.9
##…
##…
##
Imports of goods 785.7 ## 799.2 ## 815.4 ## 806.2 ## 808.8 ## … ## … ##
Imports of services 1,039.5 ## 1,063.8 ## 1,090.8 ## 1,085.2 ## 1,094.0 ## … ## … ##
Plus: Statistical discrepancyGROSS DOMESTIC PRODUCT 2,365.2 ## 2,413.8 ## 2,473.2 ## 2,455.3 ## 2,472.1 ## … ## … ##
Table 18.4 British Virgin Islands: Gross domestic product by expenditures at current prices
Millions of United States dollars
Item Description 2009 2010 2011 2012 2013 2014 2015
Final consumption expenditure 388.0 ## 393.0 ## 399.0 ## 393.4 ## 393.6 ## … ## … ##
Household final consumption expenditure 312.0
##316.0
##321.0
##317.1
##317.4
##…
##…
##
NPISHs final consumption expenditureGeneral government final consumption expenditure 76.0
##77.0
##78.0
##76.3
##76.1
##…
##…
##
Individual consumption expenditureCollective consumption expenditure
Gross capital formation 194.0 ## 197.0 ## 201.0 ## 199.4 ## 200.3 ## … ## … ##
Gross fixed capital formation 210.0 ## 214.0 ## 219.0 ## 217.3 ## 218.7 ## … ## … ##
Changes in inventories -16.0 ## -17.0 ## -18.0 ## -17.9 ## -18.4 ## … ## … ##
Acquisitions less disposals of valuables
Exports of goods and services 971.0 ## 995.0 ## 1,021.0 ## 1,017.0 ## 1,026.6 ## … ## … ##
Exports of goods 20.0 ## 20.0 ## 20.0 ## 19.5 ## 19.2 ## … ## … ##
Exports of services 951.0 ## 975.0 ## 1,001.0 ## 997.6 ## 1,007.4 ## … ## … ##
Less: Imports of goods and services 677.0
##690.0
##706.0
##700.5
##704.8
##…
##…
##
Imports of goods 291.0 ## 296.0 ## 302.0 ## 298.6 ## 299.6 ## … ## … ##
Imports of services 385.0 ## 394.0 ## 404.0 ## 401.9 ## 405.2 ## … ## … ##
Plus: Statistical discrepancyGROSS DOMESTIC PRODUCT 876.0 ## 894.0 ## 916.0 ## 909.4 ## 915.6 ## … ## … ##
97

THIS PAGE WAS INTENTIONALLY LEFT BLANK
98


Table 19.1 Cayman Islands: Value added by industries at current prices (ISIC 4)
Millions of EC dollars
Item Description 2009 2010 2011 2012 2013 2014 2015
A Agriculture, forestry and fishing29.1
028.7
030.0
031.0
031.5
034.7
0…
0
01 Crop and animal production, hunting and related service activities 20.7
0
19.80
21.10
21.20
22.80
24.60
…0
02 Forestry and logging03 Fishing and aquaculture 8.4 0 8.9 0 8.9 0 9.8 0 8.7 0 10.1 0 … 0
B+C+D+E Manufacturing, mining and quarrying and other industrial activities 434.6
0
435.80
424.70
441.90
453.90
455.40
…0
B Mining and quarrying 72.7 0 66.0 0 60.6 0 65.0 0 65.9 0 58.3 0 … 0
C Manufacturing 80.9 0 75.5 0 75.7 0 79.4 0 82.5 0 86.9 0 … 0
D Electricity, gas, steam and air conditioning supply 168.2
0177.5
0179.7
0181.3
0194.3
0193.8
0…
0
E Water supply; sewerage, waste management and remediation activities 112.8
0
116.70
108.70
116.10
111.10
116.40
…0
F Construction 346.7 0 276.9 0 272.8 0 280.0 0 289.9 0 303.5 0 … 0
G+H+I Wholesale and retail trade, transportation and storage, accommodation and food service activities 1,461.0
0
1,429.8
0
1,496.7
0
1,554.7
0
1,634.5
0
1,765.9
0
…
0
G Wholesale and retail trade; repair of motor vehicles and motorcycles 717.7
0
661.30
688.30
710.90
732.30
770.30
…0
H Transportation and storage 320.5 0 321.4 0 327.6 0 336.1 0 353.0 0 383.1 0 … 0
I Accommodation and food service activities 422.8
0447.1
0480.8
0507.7
0549.2
0612.5
0…
0
J Information and communication358.2
0331.5
0330.8
0332.9
0328.8
0330.5
0…
0
K Financial and insurance activities3,566.1
03,435.5
03,471.5
03,536.4
03,587.7
03,679.2
0…
0
L Real estate activities 727.0 0 710.2 0 717.6 0 726.1 0 722.5 0 739.1 0 … 0
M+N Professional, scientific, technical, administrative and support service activities 1,254.8
0
1,273.00
1,301.10
1,361.60
1,406.80
1,493.90
…0
M Professional, scientific and technical activities 1,083.0
01,102.2
01,127.0
01,177.7
01,221.3
01,295.2
0…
0
N Administrative and support service activities 171.8
0170.9
0174.2
0183.9
0185.5
0198.7
0…
0
O+P+Q Public administration and defence, education, human health and social work activities
1,052.0
0
1,027.2
0
1,032.4
0
1,072.9
0
1,099.2
0
1,131.1
0
…
0
O Public administration and defence; compulsory social security 588.3
0
559.40
554.00
576.70
576.90
591.60
…0
P Education 227.0 0 222.0 0 218.4 0 222.4 0 228.5 0 232.2 0 … 0
Q Human health and social work activities 236.7
0245.8
0260.0
0273.7
0293.8
0307.4
0…
0
R+S+T Other service activities 283.7 0 285.8 0 289.1 0 305.4 0 325.6 0 350.2 0 … 0
R Arts, entertainment and recreation 88.4
089.4
090.7
096.9
0100.1
0108.1
0…
0
S Other service activities 124.5 0 126.9 0 128.0 0 133.8 0 145.0 0 149.4 0 … 0
T Private households with employed persons 70.7
069.6
070.4
074.7
080.4
092.7
0…
0
Plus: Statistical discrepancy (otherwise, please specify)Equals: VALUE ADDED, GROSS, at basic prices 1 9,513.2
09,234.4
09,366.6
09,642.9
09,880.2
010,283.4
0…
0
Less: Financial intermediation services indirectly measured (FISIM) 1,286.8
0
1,190.70
1,171.50
1,265.20
1,264.20
1,265.30
…0
Plus: Taxes less Subsidies on products 566.6
0564.8
0629.1
0653.9
0661.3
0717.6
0…
0
Plus: Taxes on products 570.4 0 568.8 0 633.4 0 658.6 0 666.2 0 722.9 0 … 0
Less: Subsidies on products 3.8 0 4.0 0 4.3 0 4.8 0 4.9 0 5.3 0 … 0
Plus: Statistical discrepancy
GROSS DOMESTIC PRODUCT 8,793.1 0 8,608.5 0 8,824.3 0 9,031.6 0 9,277.4 0 9,735.7 0 … 0
1 Includes Financial intermediation services indirectly measured (FISIM).
99

Table 19.2 Cayman Islands: Value added by industries at constant 2007 prices (ISIC 4)
Millions of EC dollars
Item Description 2009 2010 2011 2012 2013 2014 2015
A Agriculture, forestry and fishing28.9
028.5
029.5
029.9
030.4
032.9
0…
0
01 Crop and animal production, hunting and related service activities 20.5
0
19.70
20.70
20.60
21.70
22.80
…0
02 Forestry and logging03 Fishing and aquaculture 8.4 0 8.9 0 8.9 0 9.2 0 8.7 0 10.1 0 … 0
B+C+D+E Manufacturing, mining and quarrying and other industrial activities 458.6
0
437.70
433.10
439.70
442.90
447.70
…0
B Mining and quarrying 66.1 0 59.4 0 58.0 0 62.8 0 62.6 0 58.6 0 … 0
C Manufacturing 79.9 0 71.7 0 70.4 0 73.1 0 75.2 0 77.2 0 … 0
D Electricity, gas, steam and air conditioning supply 194.2
0192.7
0193.4
0191.2
0193.8
0196.8
0…
0
E Water supply; sewerage, waste management and remediation activities 118.4
0
113.80
111.30
112.60
111.30
115.20
…0
F Construction 327.5 0 252.1 0 244.8 0 247.5 0 253.7 0 261.2 0 … 0
G+H+I Wholesale and retail trade, transportation and storage, accommodation and food service activities 1,409.4
0
1,372.3
0
1,412.5
0
1,441.0
0
1,469.1
0
1,518.8
0
…
0
G Wholesale and retail trade; repair of motor vehicles and motorcycles 704.1
0
645.60
657.90
666.70
678.40
694.60
…0
H Transportation and storage 312.2 0 307.7 0 311.2 0 316.7 0 324.0 0 334.6 0 … 0
I Accommodation and food service activities 393.1
0419.0
0443.4
0457.6
0466.7
0489.5
0…
0
J Information and communication387.0
0370.5
0370.2
0376.1
0374.2
0370.1
0…
0
K Financial and insurance activities3,426.4
03,308.8
03,328.3
03,378.1
03,389.1
03,424.2
0…
0
L Real estate activities 711.0 0 698.0 0 694.0 0 697.7 0 702.3 0 711.7 0 … 0
M+N Professional, scientific, technical, administrative and support service activities 1,217.5
0
1,229.30
1,253.40
1,290.80
1,321.30
1,380.00
…0
M Professional, scientific and technical activities 1,050.8
01,065.6
01,087.0
01,115.0
01,144.4
01,194.5
0…
0
N Administrative and support service activities 166.7
0163.6
0166.4
0175.8
0176.9
0185.4
0…
0
O+P+Q Public administration and defence, education, human health and social work activities
1,041.3
0
1,018.0
0
1,020.3
0
1,037.4
0
1,062.6
0
1,079.5
0
…
0
O Public administration and defence; compulsory social security 579.2
0
559.40
559.30
572.10
582.10
584.40
…0
P Education 218.7 0 213.6 0 211.9 0 213.6 0 217.3 0 219.0 0 … 0
Q Human health and social work activities 243.5
0245.0
0249.1
0251.7
0263.2
0276.0
0…
0
R+S+T Other service activities 276.6 0 277.2 0 280.2 0 289.5 0 295.8 0 308.9 0 … 0
R Arts, entertainment and recreation 83.2
082.3
083.0
087.5
088.9
094.5
0…
0
S Other service activities 123.1 0 125.6 0 127.2 0 128.6 0 133.4 0 136.8 0 … 0
T Private households with employed persons 70.3
069.2
070.0
073.4
073.5
077.7
0…
0
Plus: Statistical discrepancy (otherwise, please specify)Equals: VALUE ADDED, GROSS, at basic prices 1 9,284.2
08,992.4
09,066.3
09,227.7
09,341.4
09,535.0
0…
0
Less: Financial intermediation services indirectly measured (FISIM) 1,266.2
0
1,188.40
1,168.70
1,231.00
1,227.40
1,226.70
…0
Plus: Taxes less Subsidies on products 548.6
0530.1
0533.9
0538.5
0529.3
0574.8
0…
0
Plus: Taxes on products 552.3 0 534.0 0 538.0 0 543.0 0 533.8 0 579.7 0 … 0
Less: Subsidies on products 3.7 0 3.9 0 4.1 0 4.5 0 4.5 0 4.9 0 … 0
Plus: Statistical discrepancy
GROSS DOMESTIC PRODUCT 8,566.7 0 8,334.0 0 8,431.5 0 8,535.2 0 8,643.4 0 8,883.1 0 … 0
1 Includes Financial intermediation services indirectly measured (FISIM).
100

Table 19.3 Cayman Islands: Value added by industries at current prices (ISIC 4)
Millions of Cayman Islands dollars
Item Description 2009 2010 2011 2012 2013 2014 2015
A Agriculture, forestry and fishing8.9
08.8
09.2
09.5
09.7
010.7
0…
0
01 Crop and animal production, hunting and related service activities 6.4
0
6.10
6.50
6.50
7.00
7.60
…0
02 Forestry and logging03 Fishing and aquaculture 2.6 0 2.7 0 2.7 0 3.0 0 2.7 0 3.1 0 … 0
B+C+D+E Manufacturing, mining and quarrying and other industrial activities 133.6
0
134.00
130.60
135.80
139.50
140.00
…0
B Mining and quarrying 22.3 0 20.3 0 18.6 0 20.0 0 20.3 0 17.9 0 … 0
C Manufacturing 24.9 0 23.2 0 23.3 0 24.4 0 25.4 0 26.7 0 … 0
D Electricity, gas, steam and air conditioning supply 51.7
054.6
055.2
055.7
059.7
059.6
0…
0
E Water supply; sewerage, waste management and remediation activities 34.7
0
35.90
33.40
35.70
34.10
35.80
…0
F Construction 106.6 0 85.1 0 83.9 0 86.1 0 89.1 0 93.3 0 … 0
G+H+I Wholesale and retail trade, transportation and storage, accommodation and food service activities 449.1
0
439.5
0
460.1
0
477.9
0
502.5
0
542.9
0
…
0
G Wholesale and retail trade; repair of motor vehicles and motorcycles 220.6
0
203.30
211.60
218.50
225.10
236.80
…0
H Transportation and storage 98.5 0 98.8 0 100.7 0 103.3 0 108.5 0 117.8 0 … 0
I Accommodation and food service activities 130.0
0137.4
0147.8
0156.1
0168.8
0188.3
0…
0
J Information and communication110.1
0101.9
0101.7
0102.3
0101.1
0101.6
0…
0
K Financial and insurance activities1,096.3
01,056.1
01,067.2
01,087.1
01,102.9
01,131.0
0…
0
L Real estate activities 223.5 0 218.3 0 220.6 0 223.2 0 222.1 0 227.2 0 … 0
M+N Professional, scientific, technical, administrative and support service activities 385.7
0
391.30
400.00
418.60
432.50
459.20
…0
M Professional, scientific and technical activities 332.9
0338.8
0346.4
0362.0
0375.4
0398.2
0…
0
N Administrative and support service activities 52.8
052.5
053.5
056.5
057.0
061.1
0…
0
O+P+Q Public administration and defence, education, human health and social work activities
323.4
0
315.8
0
317.4
0
329.8
0
337.9
0
347.7
0
…
0
O Public administration and defence; compulsory social security 180.9
0
172.00
170.30
177.30
177.30
181.90
…0
P Education 69.8 0 68.2 0 67.1 0 68.4 0 70.2 0 71.4 0 … 0
Q Human health and social work activities 72.8
075.6
079.9
084.1
090.3
094.5
0…
0
R+S+T Other service activities 87.2 0 87.9 0 88.9 0 93.9 0 100.1 0 107.7 0 … 0
R Arts, entertainment and recreation 27.2
027.5
027.9
029.8
030.8
033.2
0…
0
S Other service activities 38.3 0 39.0 0 39.3 0 41.1 0 44.6 0 45.9 0 … 0
T Private households with employed persons 21.7
021.4
021.6
023.0
024.7
028.5
0…
0
Plus: Statistical discrepancy (otherwise, please specify)Equals: VALUE ADDED, GROSS, at basic prices 1 2,924.4
02,838.7
02,879.4
02,964.3
03,037.3
03,161.2
0…
0
Less: Financial intermediation services indirectly measured (FISIM) 395.6
0
366.00
360.10
388.90
388.60
389.00
…0
Plus: Taxes less Subsidies on products 174.2
0173.6
0193.4
0201.0
0203.3
0220.6
0…
0
Plus: Taxes on products 175.4 0 174.8 0 194.7 0 202.5 0 204.8 0 222.2 0 … 0
Less: Subsidies on products 1.2 0 1.2 0 1.3 0 1.5 0 1.5 0 1.6 0 … 0
Plus: Statistical discrepancy
GROSS DOMESTIC PRODUCT 2,703.1 0 2,646.3 0 2,712.7 0 2,776.4 0 2,852.0 0 2,992.8 0 … 0
1 Includes Financial intermediation services indirectly measured (FISIM).
101

Table 19.4 Cayman Islands: Value added by industries at constant 2007 prices (ISIC 4)
Millions of Cayman Islands dollars
Item Description 2009 2010 2011 2012 2013 2014 2015
A Agriculture, forestry and fishing8.9
08.8
09.1
09.2
09.3
010.1
0…
0
01 Crop and animal production, hunting and related service activities 6.3
0
6.00
6.40
6.30
6.70
7.00
…0
02 Forestry and logging03 Fishing and aquaculture 2.6 0 2.7 0 2.7 0 2.8 0 2.7 0 3.1 0 … 0
B+C+D+E Manufacturing, mining and quarrying and other industrial activities 141.0
0
134.60
133.10
135.20
136.10
137.60
…0
B Mining and quarrying 20.3 0 18.3 0 17.8 0 19.3 0 19.2 0 18.0 0 … 0
C Manufacturing 24.6 0 22.1 0 21.6 0 22.5 0 23.1 0 23.7 0 … 0
D Electricity, gas, steam and air conditioning supply 59.7
059.3
059.5
058.8
059.6
060.5
0…
0
E Water supply; sewerage, waste management and remediation activities 36.4
0
35.00
34.20
34.60
34.20
35.40
…0
F Construction 100.7 0 77.5 0 75.3 0 76.1 0 78.0 0 80.3 0 … 0
G+H+I Wholesale and retail trade, transportation and storage, accommodation and food service activities 433.3
0
421.9
0
434.2
0
443.0
0
451.6
0
466.9
0
…
0
G Wholesale and retail trade; repair of motor vehicles and motorcycles 216.4
0
198.50
202.20
204.90
208.60
213.50
…0
H Transportation and storage 96.0 0 94.6 0 95.7 0 97.4 0 99.6 0 102.9 0 … 0
I Accommodation and food service activities 120.8
0128.8
0136.3
0140.7
0143.5
0150.5
0…
0
J Information and communication119.0
0113.9
0113.8
0115.6
0115.0
0113.8
0…
0
K Financial and insurance activities1,053.3
01,017.2
01,023.1
01,038.5
01,041.8
01,052.6
0…
0
L Real estate activities 218.6 0 214.6 0 213.3 0 214.5 0 215.9 0 218.8 0 … 0
M+N Professional, scientific, technical, administrative and support service activities 374.3
0
377.90
385.30
396.80
406.20
424.20
…0
M Professional, scientific and technical activities 323.0
0327.6
0334.2
0342.8
0351.8
0367.2
0…
0
N Administrative and support service activities 51.3
050.3
051.2
054.0
054.4
057.0
0…
0
O+P+Q Public administration and defence, education, human health and social work activities
320.1
0
312.9
0
313.7
0
318.9
0
326.6
0
331.8
0
…
0
O Public administration and defence; compulsory social security 178.0
0
172.00
171.90
175.90
179.00
179.70
…0
P Education 67.2 0 65.7 0 65.1 0 65.7 0 66.8 0 67.3 0 … 0
Q Human health and social work activities 74.8
075.3
076.6
077.4
080.9
084.9
0…
0
R+S+T Other service activities 85.0 0 85.2 0 86.1 0 89.0 0 90.9 0 95.0 0 … 0
R Arts, entertainment and recreation 25.6
025.3
025.5
026.9
027.3
029.0
0…
0
S Other service activities 37.8 0 38.6 0 39.1 0 39.5 0 41.0 0 42.0 0 … 0
T Private households with employed persons 21.6
021.3
021.5
022.6
022.6
023.9
0…
0
Plus: Statistical discrepancy (otherwise, please specify)Equals: VALUE ADDED, GROSS, at basic prices 1 2,854.1
02,764.3
02,787.1
02,836.7
02,871.6
02,931.2
0…
0
Less: Financial intermediation services indirectly measured (FISIM) 389.2
0
365.30
359.30
378.40
377.30
377.10
…0
Plus: Taxes less Subsidies on products 168.6
0163.0
0164.1
0165.5
0162.7
0176.7
0…
0
Plus: Taxes on products 169.8 0 164.2 0 165.4 0 166.9 0 164.1 0 178.2 0 … 0
Less: Subsidies on products 1.1 0 1.2 0 1.3 0 1.4 0 1.4 0 1.5 0 … 0
Plus: Statistical discrepancy
GROSS DOMESTIC PRODUCT 2,633.5 0 2,562.0 0 2,591.9 0 2,623.8 0 2,657.1 0 2,730.8 0 … 0
1 Includes Financial intermediation services indirectly measured (FISIM).
102


Table 20.1 Turks and Caicos Islands: Value added by industries at current prices
Millions of EC dollars
Item Description 2009 2010 2011 2012 2013 Pl 2014 Pj 2015 Pj
A+B Agriculture, hunting, forestry; fishing 13.3
011.3
012.7
08.9
010.3
011.1
012.9
0
A Agriculture, hunting, forestry 4.00
2.00
2.40
2.00
2.10
2.30
2.40
Agriculture, hunting and related service activitiesForestry, logging and related service activities
B Fishing 9.3 0 9.3 0 10.2 0 6.9 0 8.2 0 8.9 0 10.5 0
C Mining and quarrying 14.2 0 8.6 0 6.1 0 5.7 0 6.3 0 6.8 0 6.3 0
D Manufacturing 36.3 0 23.2 0 19.7 0 13.8 0 14.8 0 15.7 0 16.5 0
E Electricity, gas and water supply 80.10
81.80
83.30
95.20
100.20
109.20
117.90
F Construction 177.0 0 107.7 0 75.7 0 71.8 0 78.9 0 84.5 0 78.3 0
G+H Wholesale, retail trade, repair of motor vehicles, motorcycles and personal and households goods; hotels and restaurants 611.0
0
669.7
0
770.3
0
771.1
0
787.0
0
858.0
0
958.5
0
G Wholesale, retail trade, repair of motor vehicles, motorcycles and personal and household goods 71.2
0
57.9
0
61.2
0
66.1
0
65.1
0
69.1
0
76.9
0
H Hotels and restaurants 539.9 0 611.7 0 709.0 0 705.0 0 721.9 0 788.9 0 881.6 0
I Transport, storage and communications 137.5
0131.4
0150.4
0153.8
0154.1
0162.9
0174.7
0
Land transport; transport via pipelines, water transport; air transport; Supporting and auxiliary transport activities; activities of travel agencies 72.7
0
77.5
0
95.4
0
101.2
0
103.3
0
111.1
0
122.4
0
Post and telecommunications 64.8 0 53.9 0 55.0 0 52.6 0 50.8 0 51.8 0 52.3 0
J+K Financial intermediation; real estate, renting and business activities 447.3
0
412.50
401.70
385.10
376.20
393.80
412.40
J Financial intermediation 260.2 0 225.4 0 208.8 0 202.4 0 191.0 0 196.0 0 202.2 0
K Real estate, renting and business activities 187.1
0187.1
0192.9
0182.7
0185.2
0197.8
0210.3
0
L Public administration and defence; compulsory social security 183.3
0
178.80
152.60
121.90
136.60
152.50
157.10
M+N+O Education; health and social work; other community, social and personal services 153.5
0
151.40
153.10
148.50
158.00
167.00
176.50
M Education 64.5 0 63.2 0 62.2 0 56.9 0 60.1 0 63.8 0 67.6 0
N Health and social work 40.8 0 44.5 0 45.5 0 46.3 0 50.8 0 53.7 0 56.8 0
O Other community, social and personal services 48.2
043.8
045.3
045.3
047.1
049.5
052.0
0
P Private households with employed persons 3.2
03.0
03.0
03.3
03.3
03.5
03.7
0
Plus: Statistical discrepancyVALUE ADDED, GROSS, at basic prices 1 1,645.2
01,593.6
01,680.3
01,626.9
01,676.5
01,808.2
01,951.6
0
Less: Financial intermediation services indirectly measured (FISIM) 211.5
0
185.90
148.10
152.30
149.30
156.90
163.20
Plus: Taxes less Subsidies on products 253.4
0260.7
0287.4
0305.6
0311.7
0343.1
0377.6
0
Plus: Taxes on products 255.9 0 263.1 0 289.8 0 308.0 0 314.3 0 345.8 0 380.3 0
Less: Subsidies on products 2.5 2.4 2.4 2.4 2.6 2.7 2.8Plus: Statistical discrepancy
GROSS DOMESTIC PRODUCT 1,898.6 0 1,854.3 0 1,967.7 0 1,932.5 0 1,988.2 0 2,151.2 0 2,329.2 0
1 Excludes Financial intermediation services indirectly measured (FISIM) but FISIM is included in the tables by industry.
103

Table 20.2 Turks and Caicos Islands: Value added by industries at constant 2000 prices
Millions of EC dollars
Item Description 2009 2010 2011 2012 2013 Pl 2014 Pj 2015 Pj
A+B Agriculture, hunting, forestry; fishing 11.2
09.1
09.7
06.5
06.9
07.2
07.6
0
A Agriculture, hunting, forestry 3.00
1.50
1.70
1.30
1.40
1.40
1.50
Agriculture, hunting and related service activitiesForestry, logging and related service activities
B Fishing 8.2 0 7.6 0 8.0 0 5.2 0 5.5 0 5.8 0 6.2 0
C Mining and quarrying 7.3 0 4.4 0 2.9 0 2.7 0 3.0 0 3.1 0 2.8 0
D Manufacturing 23.4 0 17.6 0 17.8 0 12.1 0 12.9 0 13.2 0 13.5 0
E Electricity, gas and water supply 59.90
57.20
49.40
53.80
56.80
60.00
61.10
F Construction 91.6 0 54.9 0 36.6 0 33.2 0 37.1 0 38.6 0 34.7 0
G+H Wholesale, retail trade, repair of motor vehicles, motorcycles and personal and households goods; hotels and restaurants 499.7
0
548.0
0
623.7
0
605.2
0
603.0
0
638.2
0
668.6
0
G Wholesale, retail trade, repair of motor vehicles, motorcycles and personal and household goods 53.0
0
41.8
0
42.0
0
44.0
0
42.3
0
43.5
0
47.0
0
H Hotels and restaurants 446.7 0 506.2 0 581.7 0 561.2 0 560.7 0 594.6 0 621.6 0
I Transport, storage and communications 104.0
096.5
099.5
096.2
096.9
098.9
0100.3
0
Land transport; transport via pipelines, water transport; air transport; Supporting and auxiliary transport activities; activities of travel agencies 45.4
0
47.1
0
53.3
0
53.2
0
54.8
0
57.3
0
59.5
0
Post and telecommunications 58.6 0 49.4 0 46.2 0 43.0 0 42.0 0 41.6 0 40.8 0
J+K Financial intermediation; real estate, renting and business activities 320.5
0
299.70
298.00
298.60
300.00
303.30
307.50
J Financial intermediation 195.9 0 176.9 0 171.2 0 171.8 0 166.8 0 165.2 0 164.8 0
K Real estate, renting and business activities 124.6
0122.8
0126.7
0126.8
0133.2
0138.1
0142.6
0
L Public administration and defence; compulsory social security 137.2
0
147.50
125.60
100.00
102.50
104.50
106.60
M+N+O Education; health and social work; other community, social and personal services 125.6
0
127.10
127.90
124.00
126.70
130.10
133.50
M Education 50.2 0 53.1 0 52.4 0 48.3 0 48.1 0 49.7 0 51.2 0
N Health and social work 31.2 0 35.1 0 35.8 0 36.1 0 37.6 0 38.7 0 39.7 0
O Other community, social and personal services 44.2
038.9
039.7
039.6
041.0
041.8
042.6
0
P Private households with employed persons 2.3
02.2
02.2
01.8
01.8
01.9
01.9
0
Plus: Statistical discrepancyVALUE ADDED, GROSS, at basic prices 1 1,223.1
01,225.0
01,283.1
01,221.4
01,237.9
01,287.4
01,325.4
0
Less: Financial intermediation services indirectly measured (FISIM) 159.7
0
139.10
110.20
112.70
109.60
111.70
112.90
Plus: Taxes less Subsidies on products 188.4
0200.4
0208.2
0232.1
0234.7
0253.3
0278.8
0
Plus: Taxes on products 190.3 0 202.2 0 210.0 0 234.0 0 236.7 0 255.3 0 280.8 0
Less: Subsidies on products 1.9 1.8 1.8 1.8 2.0 2.0 2.0Plus: Statistical discrepancy
GROSS DOMESTIC PRODUCT 1,411.5 1,425.4 1,491.3 1,453.5 1,472.6 1,540.7 1,604.21 Excludes Financial intermediation services indirectly measured (FISIM) but FISIM is
included in the tables by industry.
104

Table 20.3 Turks and Caicos Islands: Value added by industries at current prices
Millions of United States dollars
Item Description 2009 2010 2011 2012 2013 Pl 2014 Pj 2015 Pj
A+B Agriculture, hunting, forestry; fishing 4.9
04.2
04.7
03.3
03.8
04.1
04.8
0
A Agriculture, hunting, forestry 1.50
0.80
0.90
0.70
0.80
0.80
0.90
Agriculture, hunting and related service activitiesForestry, logging and related service activities
B Fishing 3.4 0 3.4 0 3.8 0 2.6 0 3.0 0 3.3 0 3.9 0
C Mining and quarrying 5.2 0 3.2 0 2.2 0 2.1 0 2.3 0 2.5 0 2.3 0
D Manufacturing 13.4 0 8.6 0 7.3 0 5.1 0 5.5 0 5.8 0 6.1 0
E Electricity, gas and water supply 29.70
30.30
30.80
35.30
37.10
40.50
43.70
F Construction 65.6 0 39.9 0 28.0 0 26.6 0 29.2 0 31.3 0 29.0 0
G+H Wholesale, retail trade, repair of motor vehicles, motorcycles and personal and households goods; hotels and restaurants 226.3
0
248.0
0
285.3
0
285.6
0
291.5
0
317.8
0
355.0
0
G Wholesale, retail trade, repair of motor vehicles, motorcycles and personal and household goods 26.4
0
21.5
0
22.7
0
24.5
0
24.1
0
25.6
0
28.5
0
H Hotels and restaurants 199.9 0 226.6 0 262.6 0 261.1 0 267.4 0 292.2 0 326.5 0
I Transport, storage and communications 50.9
048.7
055.7
057.0
057.1
060.3
064.7
0
Land transport; transport via pipelines, water transport; air transport; Supporting and auxiliary transport activities; activities of travel agencies 26.9
0
28.7
0
35.3
0
37.5
0
38.3
0
41.1
0
45.4
0
Post and telecommunications 24.0 0 20.0 0 20.4 0 19.5 0 18.8 0 19.2 0 19.4 0
J+K Financial intermediation; real estate, renting and business activities 165.7
0
152.80
148.80
142.60
139.30
145.90
152.80
J Financial intermediation 96.4 0 83.5 0 77.3 0 75.0 0 70.7 0 72.6 0 74.9 0
K Real estate, renting and business activities 69.3
069.3
071.4
067.7
068.6
073.3
077.9
0
L Public administration and defence; compulsory social security 67.9
0
66.20
56.50
45.10
50.60
56.50
58.20
M+N+O Education; health and social work; other community, social and personal services 56.8
0
56.10
56.70
55.00
58.50
61.90
65.40
M Education 23.9 0 23.4 0 23.1 0 21.1 0 22.3 0 23.6 0 25.0 0
N Health and social work 15.1 0 16.5 0 16.9 0 17.2 0 18.8 0 19.9 0 21.0 0
O Other community, social and personal services 17.8
016.2
016.8
016.8
017.5
018.3
019.3
0
P Private households with employed persons 1.2
01.1
01.1
01.2
01.2
01.3
01.4
0
Plus: Statistical discrepancyVALUE ADDED, GROSS, at basic prices 1 609.3
0590.2
0622.3
0602.6
0620.9
0669.7
0722.8
0
Less: Financial intermediation services indirectly measured (FISIM) 78.4
0
68.90
54.80
56.40
55.30
58.10
60.40
Plus: Taxes less Subsidies on products 93.9
096.6
0106.5
0113.2
0115.5
0127.1
0139.8
0
Plus: Taxes on products 94.8 0 97.4 0 107.3 0 114.1 0 116.4 0 128.1 0 140.9 0
Less: Subsidies on products 0.9 0 0.9 0 0.9 0 0.9 0 1.0 0 1.0 0 1.0 0
Plus: Statistical discrepancy
GROSS DOMESTIC PRODUCT 703.2 0 686.8 0 728.8 0 715.7 0 736.4 0 796.8 0 862.7 0
1 Excludes Financial intermediation services indirectly measured (FISIM) but FISIM is included in the industry data.
105

Table 20.4 Turks and Caicos Islands: Value added by industries at constant 2000 prices
Millions of United States dollars
Item Description 2009 2010 2011 2012 2013 Pl 2014 Pj 2015 Pj
A+B Agriculture, hunting, forestry; fishing 4.2
03.4
03.6
02.4
02.5
02.7
02.8
0
A Agriculture, hunting, forestry 1.10
0.50
0.60
0.50
0.50
0.50
0.50
Agriculture, hunting and related service activitiesForestry, logging and related service activities
B Fishing 3.0 0 2.8 0 3.0 0 1.9 0 2.0 0 2.1 0 2.3 0
C Mining and quarrying 2.7 0 1.6 0 1.1 0 1.0 0 1.1 0 1.1 0 1.0 0
D Manufacturing 8.7 0 6.5 0 6.6 0 4.5 0 4.8 0 4.9 0 5.0 0
E Electricity, gas and water supply 22.20
21.20
18.30
19.90
21.00
22.20
22.60
F Construction 33.9 0 20.3 0 13.5 0 12.3 0 13.7 0 14.3 0 12.9 0
G+H Wholesale, retail trade, repair of motor vehicles, motorcycles and personal and households goods; hotels and restaurants 185.1
0
203.0
0
231.0
0
224.2
0
223.3
0
236.4
0
247.6
0
G Wholesale, retail trade, repair of motor vehicles, motorcycles and personal and household goods 19.6
0
15.5
0
15.5
0
16.3
0
15.7
0
16.1
0
17.4
0
H Hotels and restaurants 165.5 0 187.5 0 215.5 0 207.9 0 207.7 0 220.2 0 230.2 0
I Transport, storage and communications 38.5
035.7
036.9
035.6
035.9
036.6
037.2
0
Land transport; transport via pipelines, water transport; air transport; Supporting and auxiliary transport activities; activities of travel agencies 16.8
0
17.4
0
19.8
0
19.7
0
20.3
0
21.2
0
22.1
0
Post and telecommunications 21.7 0 18.3 0 17.1 0 15.9 0 15.6 0 15.4 0 15.1 0
J+K Financial intermediation; real estate, renting and business activities 118.7
0
111.00
110.40
110.60
111.10
112.40
113.90
J Financial intermediation 72.6 0 65.5 0 63.4 0 63.6 0 61.8 0 61.2 0 61.0 0
K Real estate, renting and business activities 46.1
045.5
046.9
047.0
049.3
051.2
052.8
0
L Public administration and defence; compulsory social security 50.8
0
54.60
46.50
37.10
37.90
38.70
39.50
M+N+O Education; health and social work; other community, social and personal services 46.5
0
47.10
47.40
45.90
46.90
48.20
49.50
M Education 18.6 0 19.7 0 19.4 0 17.9 0 17.8 0 18.4 0 19.0 0
N Health and social work 11.5 0 13.0 0 13.3 0 13.4 0 13.9 0 14.3 0 14.7 0
O Other community, social and personal services 16.4
014.4
014.7
014.7
015.2
015.5
015.8
0
P Private households with employed persons 0.9
00.8
00.8
00.7
00.7
00.7
00.7
0
Plus: Statistical discrepancyVALUE ADDED, GROSS, at basic prices 1 453.0
0453.7
0475.2
0452.4
0458.5
0476.8
0490.9
0
Less: Financial intermediation services indirectly measured (FISIM) 59.1
0
51.50
40.80
41.80
40.60
41.40
41.80
Plus: Taxes less Subsidies on products 69.8
074.2
077.1
086.0
086.9
093.8
0103.3
0
Plus: Taxes on products 70.5 0 74.9 0 77.8 0 86.7 0 87.7 0 94.6 0 104.0 0
Less: Subsidies on products 0.7 0 0.7 0 0.7 0 0.7 0 0.7 0 0.7 0 0.8 0
Plus: Statistical discrepancy
GROSS DOMESTIC PRODUCT 522.8 0 527.9 0 552.3 0 538.3 0 545.4 0 570.6 0 594.1 0
1 Excludes Financial intermediation services indirectly measured (FISIM) but FISIM is included in the industry data.
106

Table 20.5 Turks and Caicos Islands: Gross domestic product by expenditures at current prices
Millions of EC dollars
Item Description 2009 2010 2011 2012 2013 2014 2015
Final consumption expenditure 1,085.4 ## 904.1 ## 1,214.3 ## 1,287.7 ## … ## … ## … ##
Household final consumption expenditure 694.2
##445.5
##774.7
##898.0
##…
##…
##…
##
NPISHs final consumption expenditureGeneral government final consumption expenditure 391.2
##458.6
##439.6
##389.7
##…
##…
##…
##
Individual consumption expenditureCollective consumption expenditure
Gross capital formation 569.3 ## 379.2 ## 285.2 ## 315.4 ## … ## … ## … ##
Gross fixed capital formation 569.3 ## 379.2 ## 285.2 ## 315.4 ## … ## … ## … ##
Changes in inventoriesAcquisitions less disposals of valuables
Exports of goods and services 1,402.7 ## 1,511.4 ## 1,530.2 ## 1,483.5 ## … ## … ## … ##
Exports of goods 56.0 ## 42.1 ## 39.9 ## 40.0 ## … ## … ## … ##
Exports of services 1,346.6 ## 1,469.3 ## 1,490.3 ## 1,443.5 ## … ## … ## … ##
Less: Imports of goods and services 1,158.8
##940.3
##1,061.9
##1,150.7
##…
##…
##…
##
Imports of goods 1,013.7 ## 815.5 ## 859.0 ## 937.6 ## … ## … ## … ##
Imports of services 145.1 ## 124.9 ## 202.9 ## 213.1 ## … ## … ## … ##
Plus: Statistical discrepancyGROSS DOMESTIC PRODUCT 1,898.6 ## 1,854.3 ## 1,967.7 ## 1,936.0 ## … ## … ## … ##
Table 20.6 Turks and Caicos Islands: Gross domestic product by expenditures at current prices
Millions of United States dollars
Item Description 2009 2010 2011 2012 2013 2014 2015
Final consumption expenditure 402.0 ## 334.8 ## 449.7 ## 476.9 ## … ## … ## … ##
Household final consumption expenditure 257.1
##165.0
##286.9
##332.6
##…
##…
##…
##
NPISHs final consumption expenditureGeneral government final consumption expenditure 144.9
##169.8
##162.8
##144.3
##…
##…
##…
##
Individual consumption expenditureCollective consumption expenditure
Gross capital formation 210.9 ## 140.4 ## 105.6 ## 116.8 ## … ## … ## … ##
Gross fixed capital formation 210.9 ## 140.4 ## 105.6 ## 116.8 ## … ## … ## … ##
Changes in inventoriesAcquisitions less disposals of valuables
Exports of goods and services 519.5 ## 559.8 ## 566.7 ## 549.5 ## … ## … ## … ##
Exports of goods 20.8 ## 15.6 ## 14.8 ## 14.8 ## … ## … ## … ##
Exports of services 498.7 ## 544.2 ## 552.0 ## 534.6 ## … ## … ## … ##
Less: Imports of goods and services 429.2
##348.3
##393.3
##426.2
##…
##…
##…
##
Imports of goods 375.4 ## 302.0 ## 318.1 ## 347.3 ## … ## … ## … ##
Imports of services 53.8 ## 46.2 ## 75.2 ## 78.9 ## … ## … ## … ##
Plus: Statistical discrepancyGROSS DOMESTIC PRODUCT 703.2 ## 686.8 ## 728.8 ## 717.0 ## … ## … ## … ##
107

THIS PAGE WAS INTENTIONALLY LEFT BLANK
108

REGIONAL STATISTICS PROGRAMME
CARIBBEAN COMMUNITY (CARICOM) SECRETARIAT
GEORGETOWN, GUYANA
P O BOX 10827