national accounts digest
TRANSCRIPT

CARICOM
NATIONAL ACCOUNTSNATIONAL ACCOUNTS
DIGESTDIGEST
2000-2003
CARIBBEAN COMMUNITY (CARICOM) SECRETARIAT
GEORGETOWN GUYANA
NATIONAL ACCOUNTS DIGEST
2000 – 2003
STATISTICS SUB-PROGRAMME CARIBBEAN COMMUNITY (CARICOM) SECRETARIAT
August 2007

Copyright © 2007, Caribbean Community (CARICOM) Secretariat NATIONAL ACCOUNTS DIGEST 2000-2003 Prepared and Compiled by The Statistics Sub-Programme Information and Communication Technologies Programme Caribbean Community (CARICOM) Secretariat Turkeyen P.O. Box 10827 Georgetown Guyana Telephone: (592) 222-0001 /75 Fax: (592) 222-0098 E-mail: [email protected] Web site: www.caricomstats.org ISBN 978-976-600-188-9 (CD-ROM)
ii

PREFACE
This is the seventh National Accounts Digest to be prepared by the Statistics Sub-programme of the Caribbean Community (CARICOM) Secretariat. The sixth report was published in 2001 and covered the period 1990 – 1999. It was the intention to produce a report every two years and in the intervals to continue to collect data from Member States and post these on our web site as soon as they became available. However, while it was not possible to publish the Digests as planned, the Sub-programme has attempted to keep its web site active with current data.
The National Accounts Digest aims at providing statistics on the economic conditions and performance of the CARICOM region over a specific period as reflected in the Gross Domestic Product of its Member States. Most of the data presented were submitted by the National Statistical Offices or were extracted from national and/or sub-regional reports. More specifically the report presents:
- Summary tables for CARICOM and Member States presenting data on GDP at
constant and current prices, including annual percentage changes and distributions, GNI and per capita GDP and GNI;
- Industry profile of GDP in current and constant prices by Member State; - Expenditure components of GDP by Member State; - Selected Economic Aggregates for selected countries.
For the most part, the data in the report are presented in Eastern Caribbean dollars (EC$) and in the national currency of Member States at constant and current prices. However, there are few key selected summary statistics, such as, per capita GDP and the summary of GDP for all Member States, which are also presented in United States dollars (US$). Similar to the National Accounts Digest 1990-1999, it was not possible to prepare percentage changes at current prices based on the EC dollar due to uncoordinated changes between prices and exchange rates for some Member States. This conversion renders the comparison of current prices among countries or current and constant prices of the same country meaningless.
The conversion of GDP at current prices, from national currencies to a common currency through the use of official exchange rates, is a less than satisfactory solution due to the possibility of wide fluctuations between the national currencies and a common currency such as the EC or US dollar. The use of the nominal (official) exchange rate to convert GDP of one country to the currency of another assumes that the price structures of both countries are identical and that the goods being traded are also similar. Another approach would be to use Purchasing Power Parity (PPP) which seeks to eliminate the discrepancy that can arise in the interpretation of GDP when using nominal exchange rates conversion. The PPP approach converts the GDP of different countries to a numeraire of another country. This corrects the differences in prices across countries including the exchange rate as a price variable. The conversions of GDP using the PPP method provides more accurate and reliable inter-spatial estimates thereby enabling the aggregation of national estimates to regional and international estimates. However, the data requirements of detailed price and expenditure data are usually quite enormous and are often not available.
iii

In the case of constant prices, the GDP for those Member States with base years other than 2000, were arithmetically converted to this base year. While this method does not result in any changes of the growth rates in national currency, it is however, not the ideal approach and is, at best, an approximation. The ideal situation would be to rebase the GDP using deflators/ extrapolators that are available at the national statistical offices. However, in a situation in which there has traditionally been a lack of harmonisation in the choice of base years throughout the Region, it is necessary to perform this arithmetic rebasing of the constant price data as was done in this report to achieve some semblance of comparability.
The national accounts data presented in this report use the data available from the national statistical offices as an authoritative source of information. In specific cases, countries will flag preliminary or crude estimates usually for the latest available years. In other instances, the identification of excessively high changes in variables, irregular fluctuations, lack of agreement of identical country totals (GDP by expenditure and industry), valuation problems and other similar irregularities are noted in the course of the evaluation and analysis of the data at the CARICOM level. In some cases, however, there are no ready short-term solutions to ascertain whether the outlying values are anomalies or not. Further analysis and use of the data will undoubtedly highlight more questions that need to be addressed.
Although the data series in this report does not extend beyond 2003, users of national accounts data should be aware that GDP by industry and expenditure components are normally available after a two to three year lag. During this time, the survey data of establishments, which are used as the main foundation for compiling the industry estimates, are being collected and processed, i.e. the financial accounts are available in successive years. To offset this lag, it is necessary, perhaps, to establish throughout the Region procedures to compile quarterly GDP estimates to enable the availability of information on the short-term movements in GDP that can guide policy makers.
There is an increasing demand for data that can monitor, analyse and evaluate the economies of the Region, information that is relevant, timely and readily available not only to policy and decision makers, but to anyone wishing to conduct economic analyses or research as well as information that lay persons can understand and relate to. The 1993 System of National Accounts provides the framework within which these data can be collected and compiled in order to observe and analyse the interactions taking place between the different sectors of the economy. Data on the productive activities of the economy are already being produced by all Member States and there is some information on the generation and allocation of income as evidenced by the consolidated accounts of the nations. What is now required is expansion into areas such as the production of Supply and Use Tables, the Institutional Accounts and the full sequence of accounts, as well as satellite accounts such as tourism and health, which are provided for under the SNA93 framework. Movement towards these goals will, of course, have implications for the systems and methodologies in place to compile national account statistics at both the regional and national levels. The issue of data comparability, timeliness and reliability will have to be considered if the information is to be relevant and of an acceptable quality. In this vein, the CARICOM Secretariat welcomes any suggestions from users and producers that will guide us in improving the national accounting framework as reflected in this report.
iv

ACKNOWLEDGEMENTS
The CARICOM Secretariat thanks the National Statistics Offices of Antigua and Barbuda, The Bahamas, Barbados, Belize, Dominica, Grenada, Guyana, Jamaica, Montserrat, St Kitts and Nevis, Saint Lucia, St Vincent and the Grenadines, Suriname and Trinidad and Tobago for supplying the data used to compile this report.
Special thanks to the staff of the Statistics Sub-Programme for producing this report.
v

ACRONYMS AND ABBREVIATIONS General c.i.f cost, insurance and freight FISIM Financial Intermediation Services Indirectly Measured f.o.b free on board GDP Gross Domestic Product GNI Gross National Income NNDI Net National Disposal Income NNI Net National Income SNA System of National Accounts SUT Supply and Use Table VAT Value Added Tax Groupings/Organisations CARICOM Caribbean Community LDCs Lesser Developed Countries MDCs More Developed Countries OECS Organisation of Eastern Caribbean States ECCB Eastern Caribbean Central Bank Currency $BH The Bahamas Dollar $BD Barbados Dollar $BZ Belize Dollar $EC Eastern Caribbean Dollar $G Guyana Dollar $JM Jamaica Dollar SF Suriname Guilder $TT Trinidad and Tobago Dollar $US United States Dollar Country Abbreviations AG Antigua and Barbuda BS The Bahamas BB Barbados BZ Belize DM Dominica GD Grenada GY Guyana JM Jamaica MS Montserrat KN St Kitts and Nevis LC Saint Lucia VC St Vincent and the Grenadines SR Suriname TT Trinidad and Tobago
vi

GENERAL NOTES 1. The term MDC, as stated in Article 4 of the Revised Treaty of Chaguaramas Establishing
the Caribbean Community including the CARICOM Single Market and Economy, refers to More Developed Countries namely Barbados, Guyana, Jamaica, Suriname and Trinidad and Tobago. The other Member States were designated as Less Developed Countries (LDC) according to the Revised Treaty.
2. Gross Domestic Product (GDP) at constant prices for Belize and Trinidad and Tobago is
calculated at base year 2000. For the other Member States, GDP at constant prices is at varying base years ranging from 1974 in the case of Barbados, to 1990 for the OECS countries and Suriname, to 1996 for Jamaica. In an effort to arrive at comparable data, except for Belize and Trinidad and Tobago, the real GDP of all the other Member States have been recalculated from their respective base years to a 2000 base year.
3. Comparability of GDP data is also affected by the type of valuation used by Member
States when compiling their estimates. The OECS countries reported GDP by Industry in Basic Prices whereas The Bahamas, Barbados and Guyana prepared the estimates at Factor Cost. Jamaica’s GDP by Industry is in Producer’s Prices while it was not stated which valuation Trinidad and Tobago used.
4. This report presents data as at July 2005. 5. The term ‘billion’ signifies 1000 million.
SYMBOLS
… means Data not available - means Nil
SOURCES OF DATA Department of Statistics, Ministry of Finance and Planning, The Bahamas Barbados Statistical Service Central Bank of Barbados Central Statistical Office - Belize Bureau of Statistics - Guyana The Statistical Institute of Jamaica General Bureau of Statistics - Suriname Central Statistical Office - Trinidad and Tobago Eastern Caribbean Central Bank
vii
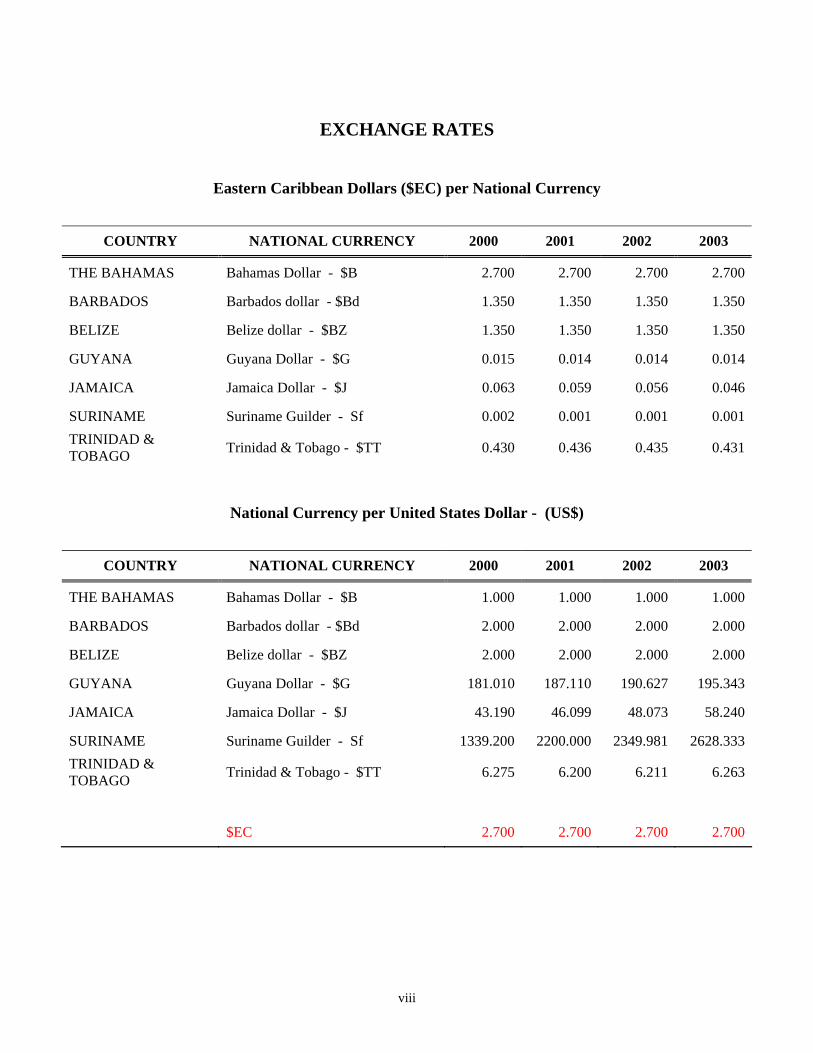
EXCHANGE RATES
Eastern Caribbean Dollars ($EC) per National Currency
COUNTRY NATIONAL CURRENCY 2000 2001 2002 2003
THE BAHAMAS Bahamas Dollar - $B 2.700 2.700 2.700 2.700
BARBADOS Barbados dollar - $Bd 1.350 1.350 1.350 1.350
BELIZE Belize dollar - $BZ 1.350 1.350 1.350 1.350
GUYANA Guyana Dollar - $G 0.015 0.014 0.014 0.014
JAMAICA Jamaica Dollar - $J 0.063 0.059 0.056 0.046
SURINAME Suriname Guilder - Sf 0.002 0.001 0.001 0.001 TRINIDAD & TOBAGO Trinidad & Tobago - $TT 0.430 0.436 0.435 0.431
National Currency per United States Dollar - (US$)
COUNTRY NATIONAL CURRENCY 2000 2001 2002 2003
THE BAHAMAS Bahamas Dollar - $B 1.000 1.000 1.000 1.000
BARBADOS Barbados dollar - $Bd 2.000 2.000 2.000 2.000
BELIZE Belize dollar - $BZ 2.000 2.000 2.000 2.000
GUYANA Guyana Dollar - $G 181.010 187.110 190.627 195.343
JAMAICA Jamaica Dollar - $J 43.190 46.099 48.073 58.240
SURINAME Suriname Guilder - Sf 1339.200 2200.000 2349.981 2628.333 TRINIDAD & TOBAGO Trinidad & Tobago - $TT 6.275 6.200 6.211 6.263
$EC 2.700 2.700 2.700 2.700
viii

TABLE OF CONTENTS
Page
PREFACE iii
ACKNOWLEDGEMENTS v
ACRONYMS AND ABBREVIATIONS vi
GENERAL NOTES vii
SYMBOLS vii
SOURCES OF DATA vii
EXCHANGE RATES viii
TABLE OF CONTENTS ix
CONCEPTS AND DEFINITIONS xxii
SUMMARY TABLES xxviii
NATIONAL ACCOUNTS HIGHLIGHTS 1
LIST OF TABLES
SECTION 1: CARICOM SUMMARY TABLES
1.1: GDP in Constant 2000 Prices ($EC Mn) ...................................................................... 15
1.1A: GDP in Constant 2000 Prices - Percentage Change..................................................... 15
1.1B: GDP in Constant 2000 Prices - Percentage Distribution.............................................. 16
1.2: GDP in Constant 2000 Prices ($US Mn)...................................................................... 16
1.3: GDP in Current Market Prices ($EC Mn) .................................................................... 18
1.4: GDP in Current Market Prices ($US Mn) .................................................................... 18
1.5: Mid -Year Population Estimates ................................................................................... 19
1.6: Per Capita GDP in Constant 2000 Prices ($EC) .......................................................... 20
1.7 Per Capita GDP in Constant 2000 Prices ($US)........................................................... 20
1.8: Per Capita GDP in Current Prices ($EC)...................................................................... 22
1.9: Per Capita GDP in Current Prices ($US)...................................................................... 22
1.10: GNI in Market Prices ($EC Mn).................................................................................... 23
ix

1.11: GNI in Current Market Prices ($US Mn) ...................................................................... 23
1.12: Per Capita GNI in Market Prices ($EC) ....................................................................... 24
1.13: Per Capita GNI in Market Prices ($UD)....................................................................... 24
SECTION 2: GDP IN CURRENT AND CONSTANT PRICES BY COUNTRY AND
INDUSTRY AND GDP BY EXPENDITURE COMPONENTS
ANTIGUA AND BARBUDA
2.1: GVA by Industry in Constant 2000 Basic Prices ($EC Mn) ....................................... 25
2.1A: GVA by Industry in Constant 2000 Basic Prices - Percentage Change....................... 25
2.1B: GVA by Industry in Constant 2000 Basic Prices - Percentage Distribution................ 27
2.2: GVA by Industry in Constant 1990 Basic Prices ($EC Mn) ........................................ 28
2.3 GVA by Industry in Current Basic Prices ($EC Mn)................................................ 28
2.3A: GVA by Industry in Current Basic Prices - Percentage Change .................................. 30
2.3B: GVA by Industry in Current Basic Prices - Percentage Distribution ........................... 31
2.4: Expenditure on GDP in Current Prices ($EC Mn)........................................................ 31
2.4A Expenditure on GDP in Current Prices - Percentage Distribution................................ 32
The BAHAMAS
3.1: GDP by Industry in Constant 2000 Market Prices ($BH Mn).................................... 33
3.1A: GDP by Industry in Constant 2000 Market Prices - Percentage Change................... 33
3.1B: GDP by Industry in Constant 2000 Market Prices - Percentage Distribution........... 35
3.2: GDP by Industry in Constant 1991 Market Prices ($BH Mn).................................... 36
3.3: GDP by Industry in Current Market Prices ($BH Mn)............................................... 36
3.3A: GDP by Industry in Current Market Prices - Percentage Change .............................. 38
3.4: GDP by Industry in Current Market Prices ($EC Mn) ............................................... 39
3.4A: GDP by Industry in Current Market Prices - Percentage Distribution....................... 39
3.5: Expenditure on GDP in Current Prices ($EC Mn)...................................................... 40
3.5A: Expenditure on GDP in Current Prices ($BH Mn) ..................................................... 40
3.5B: Expenditure on GDP in Current Prices - Percentage Distribution.............................. 41
x

BARBADOS
4.1: GDP by Industry in Constant 2000 Basic Prices ($EC Mn)........................................ 43
4.1A: GDP by Industry in Constant 2000 Basic Prices - Percentage Change....................... 43
4.1B: GDP by Industry in Constant 2000 Basic Prices - Percentage Distribution................ 45
4.2: GDP by Industry in Constant 1974 Basic Prices ($BD Mn) ....................................... 46
4.3: GDP by Industry in Current Basic Prices ($BD Mn)................................................... 46
4.3A: GDP by Industry in Current Basic Prices - Percentage Change.................................. 48
4.4: GDP by Industry in Current Basic Prices ($EC Mn) ................................................... 49
4.4A: GDP by Industry in Current Basic Prices - Percentage Distribution........................... 49
4.5: Expenditure on GDP in Current Prices ($EC Mn)....................................................... 50
4.5A Expenditure on GDP in Current Prices - Percentage Distribution............................... 50
4.6: Expenditure on GDP in Current Prices (BD$ Mn) ..................................................... 51
BELIZE
5.1: GDP by Industry in Constant 2000 Basic Prices ($EC Mn) ....................................... 53
5.1A: GDP by Industry in Constant 2000 Basic Prices - Percentage Change...................... 53
5.1B: GDP by Industry in Constant 2000 Basic Prices - Percentage Distribution ............... 55
5.2: GDP by Industry in Constant 1984 Basic Prices ($BZ Mn) ........................................ 56
5.3: GDP by Industry in Current Basic Prices ($BZ Mn).................................................... 56
5.3A: GDP by Industry in Current Basic Prices - Percentage Change .................................. 58
5.4: GDP by Industry in Current Basic Prices ($EC Mn).................................................... 58
5.4A: GDP by Industry in Current Basic Prices - Percentage Distribution ........................... 59
5.5: Expenditure on GDP in Current Prices ($EC Mn) ....................................................... 60
5.5A: Expenditure on GDP in Current Prices - Percentage Distribution............................... 60
5.6: Expenditure on GDP in Current Prices ($BZ Mn) ....................................................... 61
DOMINICA
6.1: GVA by Industry in Constant 2000 Basic Prices ($EC Mn)........................................ 63
6.1A: GVA by Industry in Constant 2000 Basic Prices - Percentage Change ...................... 63
6.1B: GVA by Industry in Constant 2000 Basic Prices - Percentage Distribution ............... 55
xi
6.2: GVA by Industry in Constant 1990 Basic Prices ($EC Mn)......................................... 66
6.3 GVA by Industry in Current Basic Prices ($EC Mn) .................................................... 66
6.3A: GVA by Industry in Current Basic Prices - Percentage Change................................... 68
6.3B: GVA by Industry in Current Basic Prices - Percentage Distribution............................ 69
6.4: Expenditure on GDP in Current Prices ($EC Mn) ....................................................... 69
6.4A: Expenditure on GDP in Current Prices - Percentage Distribution............................... 70
GRENADA 7.1: GVA by Industry in Constant 2000 Basic Prices ($EC Mn)....................................... 71
7.1A: GVA by Industry in Constant 2000 Basic Prices - Percentage Change ..................... 71
7.1B: GVA by Industry in Constant 2000 Basic Prices - Percentage Distribution .............. 73
7.2: GVA by Industry in Constant 1990 Basic Prices ($EC Mn)........................................ 74
7.3 GVA by Industry in Current Basic Prices ($EC Mn) ................................................... 74
7.3A: GVA by Industry in Current Basic Prices - Percentage Change.................................. 76
7.3B: GVA by Industry in Current Basic Prices - Percentage Distribution........................... 77
7.4: Expenditure on GDP in Current Prices ($EC Mn) ........................................................ 77
7.4A: Expenditure on GDP in Current Prices - Percentage Distribution................................ 78
GUYANA 8.1: GDP by Industry at Factor Cost in Constant 2000 Prices ($EC Mn)........................... 79
8.1A: GDP by Industry at Factor Cost in Constant 2000 Prices - Percentage Change.......... 79
8.1B: GDP by Industry at Factor Cost in Constant 2000 Prices - Percentage Distribution... 81
8.2: GDP by Industry at Factor Cost in Constant 1988 Prices ($G Mn) ............................. 82
8.3: GDP by Industry at Factor Cost in Current Prices ($G Mn)......................................... 82
8.3A: GDP by Industry at Factor Cost in Current Prices - Percentage Change ..................... 84
8.4: GDP by Industry at Factor Cost in Current Prices ($EC Mn) ...................................... 85
8.4A: GDP by Industry at Factor Cost in Current Prices - Percentage Distribution.............. 85
8.5: Expenditure on GDP in Current Prices ($EC Mn)........................................................ 86
8.5A: Expenditure on GDP in Current Prices - Percentage Distribution ............................... 86
8.6: Expenditure on GDP in Current Prices ($G Mn) .......................................................... 87
JAMAICA
xii
9.1: GDP by Industry in Constant 2000 Producers' Prices ($EC Mn)................................ 89
9.1A: GDP by Industry in Constant 2000 Producers' Prices - Percentage Change............... 89
9.1B: GDP by Industry in Constant 2000 Producers' Prices - Percentage Distribution........ 91
9.2: GDP by Industry in Constant 1986 Producers' Prices ($J Mn ) .................................. 92
9.3: GDP by Industry in Current Purchasers' Prices ($J Mn).............................................. 92
9.3A: GDP by Industry in Current Purchasers' - Percentage Change.................................... 94
9.4: GDP by Industry in Current Purchasers' Prices ($EC Mn).......................................... 95
9.4A: GDP by Industry Current at Current Purchasers' - Percentage Distribution............... 95
9.5: Expenditure on GDP in Current Purchasers' Prices ($EC Mn) ................................... 96
9.5A: Expenditure on GDP in Current Purchasers’ Prices - Percentage Distribution .......... 96
9.6: Expenditure on GDP in Current Purchasers’ Prices ($J Mn) ...................................... 97
MONTSERRAT
10.1: GVA by Industry in Constant 2000 Basic Prices ($EC Mn) ...................................... 99
10.1A: GVA by Industry in Constant 2000 Basic Prices - Percentage Change..................... 99
10.1B: GVA by Industry in Constant 2000 Basic Prices - Percentage Distribution.............. 101
10.2: GVA by Industry in Constant 1990 Basic Prices ($EC Mn) ....................................... 102
10.3 GVA by Industry in Current Basic Prices ($EC Mn)................................................... 102
10.3A: GVA by Industry in Current Basic Prices - Percentage Change ................................. 104
10.3B: GVA by Industry in Current Basic Prices - Percentage Distribution .......................... 105
10.4: Expenditure on GDP in Current Prices ($EC Mn)....................................................... 105
10.4A: Expenditure on GDP in Current Prices - Percentage Distribution .............................. 106
ST. KITTS & NEVIS 11.1: GVA by Industry in Constant 2000 Basic Prices ($EC Mn) ...................................... 107
11.1A: GVA by Industry in Constant 2000 Basic Prices - Percentage Change..................... 107
11.1B: GVA by Industry in Constant 2000 Basic Prices - Percentage Distribution.............. 109
11.2: GVA by Industry in Constant 1990 Basic Prices ($EC Mn) ....................................... 110
11.3 GVA by Industry in Current Basic Prices ($EC Mn)................................................... 110
11.3A: GVA by Industry in Current Basic Prices - Percentage Change ................................. 112
11.3B: GVA by Industry in Current Basic Prices - Percentage Distribution .......................... 113
11.4: Expenditure on GDP in Current Prices ($EC Mn)....................................................... 113
xiii

11.4A: Expenditure on GDP in Current Prices - Percentage Distribution .............................. 114
SAINT LUCIA
12.1: GVA by Industry in Constant 2000 Basic Prices ($EC Mn) ....................................... 115
12.1A: GVA by Industry in Constant 2000 Basic Prices - Percentage Change...................... 115
12.1B: GVA by Industry in Constant 2000 Basic Prices - Percentage Distribution............... 117
12.2: GVA by Industry in Constant 1990 Basic Prices ($EC Mn) ....................................... 118
12.3 GVA by Industry in Current Basic Prices ($EC Mn)................................................... 118
12.3A: GVA by Industry in Current Basic Prices - Percentage Change ................................. 120
12.3B: GVA by Industry in Current Basic Prices - Percentage Distribution .......................... 121
12.4: Expenditure on GDP in Current Prices ($EC Mn)....................................................... 121
12.4A: Expenditure on GDP in Current Prices - Percentage Distribution .............................. 122
ST. VINCENT & THE GRENADINES
13.1: GVA by Industry in Constant 2000 Basic Prices ($EC Mn) ....................................... 123
13.1A: GVA by Industry in Constant 2000 Basic Prices - Percentage Change...................... 123
13.1B: GVA by Industry in Constant 2000 Basic Prices - Percentage Distribution............... 125
13.2: GVA by Industry in Constant 1990 Basic Prices ($EC Mn) ....................................... 126
13.3 GVA by Industry in Current Basic Prices ($EC Mn).................................................... 126
13.3A: GVA by Industry in Current Basic Prices - Percentage Change ................................. 128
13.3B: GVA by Industry in Current Basic Prices - Percentage Distribution .......................... 129
13.4: Expenditure on GDP in Current Prices ($EC Mn)....................................................... 129
13.4A: Expenditure on GDP in Current Prices - Percentage Distribution .............................. 130
SURINAME 14.1: GDP by Industry in Constant 2000 Basic Prices ($EC Mn)........................................ 131
14.1 A: GDP by Industry in Constant 2000 Basic Prices - Percentage Change....................... 131
14.1 B: GDP by Industry in Constant 2000 Basic Prices - Percentage Distribution ............... 133
14.2: GDP by Industry in Constant 1990 Basic Prices (SF Mn)............................................ 134
14.3: GDP by Industry in Current Basic Prices (SF Mn)....................................................... 134
14.3A: GDP by Industry in Current Basic Prices (SF Mn) - Percentage Change.................... 136
14.4: GDP by Industry in Current Basic Prices ($EC Mn) .................................................... 137
xiv
14.4A: GDP by Industry in Current Basic Prices - Percentage Distribution............................ 137
14.5: Expenditure on GDP in Current Prices ($EC Mn)........................................................ 138
14.5A: Expenditure on GDP in Current Prices - Percentage Distribution ............................... 138
14.6: Expenditure on GDP in Current Prices (SF Mn)........................................................... 139
TRINIDAD AND TOBAGO
15.1: GDP by Industry in Constant 2000 Market Prices ($EC Mn)...................................... 141
15.1A: GDP by Industry in Constant 2000 Market Prices - Percentage Change .................... 141
15.1B: GDP by Industry in Constant 2000 Market Prices - Percentage Distribution ............. 143
15.2: GDP by Industry in Constant 2000 Market Prices ($TT Mn )...................................... 144
15.3: GDP by Industry in Current Market Prices ($TT Mn) .................................................. 144
15.3A: GDP by Economic Activity in Current Market Prices - Percentage Change ............... 146
15.4: GDP by Industry in Current Market Prices ($EC Mn) .................................................. 147
15.4A: GDP by Industry in Current Market Prices - Percentage Distribution.......................... 147
15.5: Expenditure on GDP in Current Market Prices ($EC Mn)............................................ 148
15.5A: Expenditure on GDP Current Market Prices - Percentage Distribution ....................... 148
15.6: Expenditure on GDP Current Market Prices ($TT Mn)................................................ 149
SECTION 3: SELECTED ECONOMIC AGGREGATES
Antigua and Barbuda Gross National Disposable Income, Appropriation and Capital Finance in
Current Prices ................................................................................................................................ 151
Dominica Gross National Disposable Income, Appropriation and Capital Finance in
Current Prices ................................................................................................................................ 152
Grenada Gross National Disposable Income, Appropriation and Capital Finance in
Current Prices ................................................................................................................... 153
Montserrat Gross National Disposable Income, Appropriation and Capital Finance in
Current Prices ................................................................................................................................ 154
St. Kitts & Nevis Gross National Disposable Income, Appropriation and Capital Finance
in Current Prices ............................................................................................................................ 155
Saint Lucia Gross National Disposable Income, Appropriation and Capital Finance in
xv

Current Prices ................................................................................................................................ 156
St. Vincent & the Grenadines Gross National Disposable Income, Appropriation and
Capital Finance in Current Prices ................................................................................................. 157
The Bahamas Gross National Disposable Income, Appropriation and Capital Finance in
Current Prices ................................................................................................................................ 158
Guyana Gross National Disposable Income, Appropriation and Capital Finance in
Current Prices ................................................................................................................................ 160
Jamaica Gross National Disposable Income, Appropriation and Capital Finance in
Current Prices ................................................................................................................................ 162
Trinidad and Tobago Gross National Disposable Income, Appropriation and Capital Finance in
Current Prices ................................................................................................................................ 164
LIST OF GRAPHS
CARICOM
1.1: GDP at Constant 2000 Prices, 2000 ............................................................................. 17
1.2: GDP at Constant 2000 Prices, 2001 ............................................................................. 17
1.3: GDP at Constant 2000 Prices, 2002 .............................................................................. 17
1.4: GDP at Constant 2000 Prices, 2003 .............................................................................. 17
1.5: Mid – Year Population Estimates, 2000 - 2003 ........................................................... 19
1.6: GDP Per Capita in Constant 2000 Prices, 1990........................................................... 21
1.7: GDP Per Capita in Constant 2000 Prices, 1995........................................................... 21
1.8: GDP Per Capita in Constant 2000 Prices, 1999........................................................... 21
1.9: GDP Per Capita in Constant 2000 Prices, 1999........................................................... 21
ANTIGUA AND BARBUDA
2.1: GVA by Industry at Constant 2000 Basic Prices - Percentage Change....................... 26
xvi

2.2: GVA by Industry at Constant 2000 Basic Prices – Percentage Distribution, 2000..... 27
2.3: GVA by Industry at Constant 2000 Basic Prices - Percentage Distribution, 2003 ..... 27
2.4: GVA in Current and Constant 1990 Basic Prices ......................................................... 29
2.5: GVA by Industry in Current Basic Prices - Percentage Change .................................. 30
2.6: Expenditure on GDP in Current Prices - Percentage Distribution, 2000..................... 32
2.7: Expenditure on GDP in Current Prices - Percentage Distribution, 2003..................... 32
The BAHAMAS
3.1: GVA by Industry at Constant 2000 Basic Prices - Percentage Change....................... 34
3.2: GVA by Industry at Constant 2000 Basic Prices – Percentage Distribution, 2000..... 35
3.3: GVA by Industry at Constant 2000 Basic Prices - Percentage Distribution, 2003 ..... 35
3.4 GDP in Current and Constant 1991 Market Prices ....................................................... 37
3.5 GDP by Industry in Current Market Price - Percentage Change ................................. 38
3.6: Expenditure on GDP in Current Prices - Percentage Distribution, 2000..................... 41
3.7: Expenditure on GDP in Current Prices - Percentage Distribution, 2003..................... 41
BARBADOS
4.1: GDP by Industry at Factor Cost in Constant 2000 Prices - Percentage Change ........ 44
4.2: GDP by Industry in Constant 2000 Basic Prices - Percentage Distribution, 2000..... 45
4.3: GDP by Industry in Constant 2000 Basic Prices - Percentage Distribution, 2003..... 45
4.4: GDP in Current and Constant 1974 Basic Prices ........................................................ 47
4.5: GDP by Industry in Current Basic Prices - Percentage Change.................................. 48
4.6: Expenditure on GDP in Current Prices - Percentage Distribution, 2000.................... 51
4.7: Expenditure on GDP in Current Prices - Percentage Distribution, 2003.................... 51
BELIZE
5.1: GDP by Industry in Constant 2000 Basic Prices - Percentage Change ...................... 54
5.2: GDP by Industry in Constant 2000 Basic Prices - Percentage Distribution, 2000..... 55
5.3: GDP by Industry in Constant 2000 Basic Prices - Percentage Distribution, 2003..... 55
5.4: GDP in Current and Constant 1984 Basic Prices ........................................................ 57
5.5: GDP by Industry in Current Basic Prices - Percentage Change.................................. 59
xvii

5.6: Expenditure on GDP in Current Prices - Percentage Distribution, 2000.................... 61
5.7: Expenditure on GDP in Current Prices - Percentage Distribution, 2003.................... 61
DOMINICA
6.1: GVA by Industry in Constant 2000 Basic Prices - Percentage Change...................... 64
6.2: GVA by Industry in Constant 2000 Basic Prices - Percentage Distribution, 2000 .... 65
6.3: GVA by Industry in Constant 2000 Basic Prices - Percentage Distribution, 2003 .... 65
6.4: GVA in Current and Constant 1990 Basic Prices ........................................................ 67
6.5: GVA by Industry in Current Basic Prices - Percentage Change ................................. 68
6.6: Expenditure on GDP in Current Prices - Percentage Distribution, 2000 .................... 70
6.7: Expenditure on GDP in Current Prices - Percentage Distribution, 2003 .................... 70
GRENADA
7.1: GVA by Industry in Constant 2000 Basic Prices - Percentage Change...................... 72
7.2: GVA by Industry in Constant 2000 Basic Prices - Percentage Distribution, 2000 ... 73
7.3: GVA by Industry in Constant 2000 Basic Prices - Percentage Distribution, 2003 .... 73
7.4: GVA in Current and Constant 1990 Basic Prices ....................................................... 75
7.5: GVA by Industry in Current Basic Prices - Percentage Change ................................. 76
7.6: Expenditure on GDP in Current Prices - Percentage Distribution, 2000 .................... 78
7.7: Expenditure on GDP in Current Prices - Percentage Distribution, 2003 .................... 78
GUYANA
8.1: GDP by Industry at Factor Cost in Constant 2000 Prices - Percentage Change......... 80
8.2: GDP by Industry at Factor Cost in Constant 2000 Prices -
Percentage Distribution 2000....................................................................................... 81
8.3: GDP by Industry at Factor Cost in Constant 2000 Prices -
Percentage Distribution, 2003...................................................................................... 81
8.4: GDP at Factor Cost in Current and Constant 1988 Prices ........................................... 83
8.5: GDP by Industry at Factor Cost in Current Prices - Percentage Change .................... 84
8.6: Expenditure on GDP in Current Prices - Percentage Distribution, 2000 .................... 87
8.7: Expenditure on GDP in Current Prices - Percentage Distribution, 2003 .................... 87
xviii

JAMAICA
9.1: GDP by Industry at Factor Cost in Constant 2000 Producers' Prices –
Percentage Change ........................................................................................................ 90
9.2: GDP by Industry at Factor Cost in Constant 2000 Producers Prices -
Percentage Distribution, 2000 ...................................................................................... 91
9.3: GDP by Industry at Factor Cost in Constant 2000 Producers Prices -
Percentage Distribution, 2003 ...................................................................................... 91
9.4: GDP at Factor Cost in Current and Constant 1986 Producers Prices.......................... 93
9.5: GDP by Industry at Factor Cost in Current Purchasers’ Prices - Percentage Change 94
9.6: Expenditure on GDP in Current Purchasers' Prices - Percentage Distribution, 2000. 97
9.7: Expenditure on GDP in Current Purchasers' Prices - Percentage Distribution, 2003. 97
MONTSERRAT
10.1: GVA by Industry in Constant 2000 Basic Prices - Percentage Change...................... 100
10.2: GVA by Industry in Constant 2000 Basic Prices - Percentage Distribution 2000 ... 101
10.3: GVA by Industry in Constant 2000 Basic Prices - Percentage Distribution,2003 ... 101
10.4: GVA in Current and Constant 1990 Basic Prices ........................................................ 103
10.5: GVA by Industry in Current Basic Prices - Percentage Change ................................. 104
10.6: Expenditure on GDP in Current Prices - Percentage Distribution, 2000 .................... 106
10.7: Expenditure on GDP in Current Prices - Percentage Distribution, 2003 .................... 106
ST KITTS AND NEVIS
11.1: GVA by Industry in Constant 2000 Basic Prices - Percentage Change...................... 108
11.2: GVA by Industry in Constant 2000 Basic Prices - Percentage Distribution, 2000 .... 109
11.3: GVA by Industry in Constant 2000 Basic Prices - Percentage Distribution, 2003 .... 109
11.4: GVA in Current and Constant 1990 Basic Prices ........................................................ 111
11.5: GVA by Industry in Current Basic Prices - Percentage Change ................................. 112
11.6: Expenditure on GDP in Current Prices - Percentage Distribution, 2000 .................... 114
11.7: Expenditure on GDP in Current Prices - Percentage Distribution, 2003 .................... 114
xix

SAINT LUCIA
12.1: GVA by Industry in Constant 2000 Basic Prices - Percentage Change....................... 116
12.2: GVA by Industry in Constant 2000 Basic Prices - Percentage Distribution, 2000 ..... 117
12.3: GVA by Industry in Constant 2000 Basic Prices - Percentage Distribution, 2003 ..... 117
12.4: GVA in Current and Constant 1990 Basic Prices ......................................................... 119
12.5: GVA by Industry in Current Basic Prices - Percentage Change .................................. 120
12.6: Expenditure on GDP in Current Prices - Percentage Distribution, 2000 ..................... 122
12.7: Expenditure on GDP in Current Prices - Percentage Distribution, 2003 .................... 122
ST VINCENT AND THE GRENADINES
13.1: GVA by Industry in Constant 2000 Basic Prices - Percentage Change....................... 124
13.2: GVA by Industry in Constant 2000 Basic Prices - Percentage Distribution, 2000 ..... 125
13.3: GVA by Industry in Constant 2000 Basic Prices - Percentage Distribution, 2003 ..... 125
13.4: GVA in Current and Constant 2000 Basic Prices ......................................................... 127
13.5: GVA by Industry in Current Basic Prices - Percentage Change .................................. 128
13.6: Expenditure on GDP in Current Prices - Percentage Distribution, 2000 ..................... 130
13.7: Expenditure on GDP in Current Prices - Percentage Distribution, 2003 ..................... 130
SURINAME
14.1: GDP by Industry in Constant 2000 Basic Prices - Percentage Change........................ 132
14.2: GDP by Industry in Constant 2000 Basic Prices - Percentage Distribution, 2000 .... 133
14.3: GDP by Industry in Constant 2000 Basic Prices - Percentage Distribution, 2003..... 133
14.4: GDP in Current and Constant 1980 Basic Prices ......................................................... 135
14.5: GDP by Industry in Current Basic Prices - Percentage Change................................... 136
TRINIDAD AND TOBAGO
15.1: GDP by Industry in Constant 2000 Market Prices - Percentage Change..................... 142
15.2: GDP by Industry in Constant 2000 Market Prices - Percentage Distribution, 2000 ... 143
15.3: GDP by Industry in Constant 2000 Market Prices - Percentage Distribution, 2003 ... 143
15.4: GDP in Current and Constant 1985 Market Prices ....................................................... 145
xx

15.5: GDP by Industry in Current Market Prices - Percentage Change ................................ 146
15.6: Expenditure on GDP in Current Market Prices - Percentage Distribution, 2000 ........ 149
15.7: Expenditure on GDP in Current Market Prices - Percentage Distribution, 2003 ........ 149
xxi

xxii
CONCEPTS AND DEFINITIONS 1. GROSS DOMESTIC PRODUCT: A key aggregate of the system of National Accounts is the Gross Domestic Product. The Gross Domestic Product (GDP) of an economy is the total value of all goods and services produced by all institutional units resident in the economy within a given time period, usually one year. It includes the allowance made for the consumption of fixed capital. Gross value added is a measure of GDP in which a principal consideration is that duplications must be avoided which is achieved by deducting from the output of each producing unit the value of the inputs of goods and services received from other units, at home or abroad, i.e. GDP can be derived as the sum of the value added of resident institutional units in an economy. This measure of GDP is also identical with the sum of the final expenditures on consumption, on gross capital formation and adjusted for exports less imports of goods and services. GDP is also equal to the sum of the incomes accruing from production which includes compensation of employees, consumption of operating surplus and fixed capital. 2. GROSS NATIONAL INCOME/PRODUCT ( GNI/GNP): Gross National Income (GNI) is equal to GDP less primary incomes payable to non-resident units plus primary incomes receivable from non-resident units. In the 1993 System of National Accounts (SNA), GNI is synonymous with the GNP of the 1958 SNA, however, conceptually GNI is not a concept of value added, but more one of income. GNI (GNP) is the aggregate value of the gross balances of primary incomes for all industries. The primary income components are taxes (less subsidies) on production and imports, compensation of employees and property income in all cases payable/ receivable to/from the rest of the world. 3. THE GROSS OUTPUT OF INDUSTRIES: Gross output is the value of goods and services produced within an accounting period adjusted for changes in stocks of finished goods and work-in- progress. 0utput consists of goods and services that are produced within an establishment that are disposed of in one of the following ways:
(a) Market output which includes the total value of all goods and services sold on the market,
bartered, used for payments in kind, supplied by one establishment to another belonging to the same market enterprise and the total value of changes in inventories of finished goods and work-in-progress intended for all these uses mentioned herein.
(b) Output for own final use which includes goods and services that are retained for their own final
use by the owners of the establishments within which they are produced, the total value of fixed assets produced by an establishment that are retained within the same enterprise for use in future production and the total value of changes in inventories of finished goods and work in progress intended for one of the uses contained herein.
(c) Other non-market output includes goods and services that are provided free or at prices that are
not economically significant. Common examples are the goods and services produced by government units or by non-profit units serving households (NPISHs) such as education and health services.

xxiii
4. INTERMEDIATE CONSUMPTION: Intermediate consumption consists of the value of non-durable goods and services consumed as inputs by a process of production. The value of all goods and services that are used as inputs into ancillary activities such as accounting, marketing etc. are included as intermediate consumption. The consumption of fixed assets is excluded from intermediate consumption as well as purchases of valuables (capital account). In addition goods and services that are produced within the same establishment and fed back as inputs into production within the same establishment are not recorded as intermediate consumption. 5. CONSUMPTION OF FIXED CAPITAL: Consumption of fixed capital is defined as the decline during the accounting period in the current value of the stock of fixed assets owned and used by a producer. This decline in the fixed assets can be due to physical deterioration, normal obsolescence, or accidental damage and excludes the damage caused by acts of war and other such exceptional events. Consumption of fixed assets should be considered a cost of production. The inclusion of this item in value added gives rise to the gross concept of GDP with the inclusion allowing for a net measure of value added and GDP. 6. VALUATION OF GDP Outputs and inputs can be valued in the following ways: Basic prices
The basic price is the amount receivable by the producer from the purchaser of a unit of a good or service produced as output minus any tax payable and plus any subsidy receivable on that unit, as a consequence of its production or sale. It excludes any transport charges invoiced separately by the producer.
Producers’ prices
The producers’ price is the amount receivable by the producer from the purchaser for a unit of a good or service produced as output minus any value added (VAT) or similar deductible tax, invoiced to the purchaser. It excludes any transport charges invoiced separately by the producer.
Purchasers’ price
The purchasers’ price is the amount paid by the purchaser, excluding any deductible VAT or similar deductible tax, in order to take delivery of a unit of a good or service at the time and place required by the purchaser. It includes any transport charges paid separately to take delivery at the required time and place.
The above valuation concepts are in-keeping with the recommendations of the 1993 SNA. Output can be measured either at basic or producers’ prices. Intermediate inputs should be valued at purchasers’ prices. Commonly used valuation concepts in the CARICOM Region are at market prices and factor costs. Valuation of GDP at factor costs excludes all taxes on products and is therefore obtained by deducting taxes (less subsidies) on production from market prices. Essentially, gross value added at factor cost is a measure of income since it represents the amount left over from gross value added for distribution after the payment of all taxes and receipt of all subsidies. This concept of factor cost perhaps approaches that of Basic prices given earlier. GDP at Market Prices is equal to GDP at factor cost plus taxes less subsidies on production and imports. 7. TAXES ON PRODUCTION AND IMPORTS

xxiv
Taxes are compulsory unrequited payments in cash or in kind made by institutional units to government units. Taxes on production and imports consist of:
- taxes on products payable on goods and services when they are produced, sold and otherwise disposed of by their producers; - other taxes on production comprising taxes on ownership/use of land, buildings or other assets used in production or on the labour employed or on the compensations paid to employees.
These taxes are recorded as being payable out of the gross value added. The term indirect tax which was formally used is no longer commonly used in the 1993 SNA. Indirect taxes which correspond to the taxes on production and income are compulsory payments to Government which industries treat as part of the cost of production. They include import and export duties, excise, sales, entertainment and turnover taxes, real estate and land taxes, levies on value added and the employment of labour (but not social security contributions), motor vehicles, driving tests, licenses, airport and passport fees when paid by producers. 8. SUBSIDIES Subsidies are current unrequited payments that government units, including non-resident government units, make to enterprises on the basis of the levels of their production activities or values of the goods and services they produce, sell or import. They are receivable by resident producers or importers and may be designed to influence the levels of production, the prices at which outputs are sold or the remuneration of the institutional units engaged in production. Subsidies are not payable to final consumers. Current transfers that government make to households are treated as social benefits. In effect, subsidies are treated as negative taxes on production. 9. FINANCIAL INTERMEDIATION SERVICES INDIRECTLY MEASURED - IMPUTED SERVICE
CHARGES The imputed service charge, referred to as Financial Intermediation Services Indirectly Measured (FISIM) in the 1993 SNA, is an adjustment that is required to GDP to take into consideration the estimation of the output of some financial intermediaries that do not charge explicitly for all services provided. These services include the borrowing and lending of funds from/to different categories of borrowers and lenders while paying/charging different rates of interest. The net receipt of interest defrays the costs of providing these services (that are not individually charged) and also provides operating surplus for the iterneraries. This total value of FISIM is the net property income received by these intermediaries and should in principle be allocated as intermediates among the users of these services. Due to the difficulty in allocating FISIM, in practice, it is normally recorded as intermediate consumption of a nominal industry and deducted from GDP (Imputed Service Charge). 10. SELECTED EQUATIONS IN THE SYSTEM OF NATIONAL ACCOUNTS (1) Gross Domestic Product (GDP) at market prices
= Output plus Taxes, less Subsidies, on products – Intermediate Consumption
(2) Gross Domestic Product (GDP) at Market Prices = Final Consumption Expenditure plus Changes in Inventories plus Gross fixed capital formation plus Acquisition less Disposal of valuables plus Exports of Goods and Services less Imports of Goods and Services
(3) Gross National Income (GNI which is equivalent to GNP) = GDP at Market Prices plus Taxes, less Subsidies, on Production and Imports (net receivable abroad) plus

xxv
compensation of employees ( net, receivable abroad) plus Property Income (net receivable abroad)
(4) Net National Income (NNI or equivalent to NNP) at Market Prices = GNI at Market Prices less consumption of fixed capital
(5) Net National Disposable Income (NNDI) = NNI at Market Prices plus Current Taxes on income, wealth etc. (net receivable from abroad) plus social contributions and benefits and other Current Transfers (net, receivable from abroad)
(6) Net National Disposable Income (NNDI) = Final Consumption Expenditure plus
Adjustment for the change of net equity of households on Pension funds (net receivable from abroad) plus Saving, net.
11. NATIONAL ACCOUNTS AT CONSTANT PRICES: For analytical purposes, the National Accounts at Constant Prices are derived by breaking current values down into a price component and a quantity component. For the purposes of deriving constant price estimates of GDP, a base year is selected which is deemed to be a normal year. Estimates at Constant Prices are usually derived by deflating the current year’s values by price indices or by extrapolating the base year values by appropriate volume indices. Both methods are equivalent to expressing current period quantities at base period prices. 12. COMPILATION PRACTICES The main practices used to compile National Accounts are the Production, Income, Expenditure and the Commodity Flow approaches. The conceptual bases of these approaches are as follows:
The production approach uses establishments as the basic reporting units and groups them into production activities. The sources of data are normally surveys or censuses of establishments, agriculture and similar sources, business accounts of enterprises and administrative records. Total output and intermediates are compiled from which the value added is estimated. Estimates are adjusted for the output of financial intermediation. The production data are also to be reorganised by institutional sectors.
In the expenditure approach elements of expenditure as illustrated in the equations highlighted
earlier are estimated. Imports and exports, usually measured freight on board (f.o.b.), are estimated from the data on foreign trade and balance of payments statistics. Data on government’s final expenditure are obtained from the records of government’s revenue and expenditure. Gross capital formation comprises gross fixed capital formation, changes in inventories and acquisitions less disposals of valuables. The sources of data for gross capital formation are surveys and administrative records.
The income approach derives independent estimates of compensation of employees, operating
surplus, gross fixed income, and taxes less subsidies on production. Sources of data are similar to the expenditure aggregates.
The commodity flow approach incorporates the three approaches described above and uses as a basis the Supply and Use Tables (SUT). The supply table, which shows the value of different products that are produced by each industry as well as imports, and the use table, shows the use of every product in the economy including exports. The basic principle is that the supply of

xxvi
every product must be equal to the use of that product at the level of the economy. The method therefore entails the compilation of product or commodity flows. Sources of data are derived from those of the other approaches.
13. GOVERNMENT’S FINAL CONSUMPTION EXPENDITURE This is defined as expenditure including imputed expenditure, incurred by general government on both individual consumption of goods and services as well as on collective consumption (e.g. community services such as security). Government’s expenditure is largely financed out of taxation and other government’s revenues. Government’s final consumption expenditure may be classified according to its purpose or function such as Education, Health, General Administration and so forth. 14. PRIVATE FINAL CONSUMPTION EXPENDITURE This component of GDP is defined as the outlays of households on new durable and non-durable goods and services less their net sales of second-hand goods, scraps and waste. Purchases of dwellings are treated as gross fixed capital formation of the real estate industry. The imputed rent of owner-occupied dwellings is a part of the gross output of the real estate industry and is also included in the final consumption expenditure of households. 15. GROSS CAPITAL FORMATION: Gross capital formation consists of gross fixed capital formation, changes in inventories and acquisitions less disposals of valuables. Gross fixed capital formation in turn, consists of acquisitions of fixed assets less disposals plus certain additions to the values of non-produced assets. Fixed assets are produced assets that can be used repeatedly or continuously over a period of time of one year or more. The acquisitions of new assets also include major improvements and renovations to fixed assets that increase significantly their productive capacity. Non-produced assets consist of assets that are needed for production but have not themselves been produced, e.g. land and mineral deposits. Changes in inventories are the market value at the owning establishment of the physical change during an accounting period in stocks of materials, supplies, work-in-progress except on construction projects, finished products, livestock raised for slaughter, merchandise of strategic materials held by resident industries in stock and emergency stocks of important products held by Government services. In practice, the closest feasible approximation may be the difference between the levels of these stocks at the beginning and the end of the period, both valued at approximate average prices ruling over the period. Valuables are assets that are not used for production or consumption and are therefore held primarily as a store of value. 16. EXPORTS AND IMPORTS OF GOODS AND NON-FACTOR SERVICES Exports and imports of goods and services consist of the transactions in goods and services of the residents of a given country with the rest of the world, and covers merchandise, transportation, travel, insurance and other non-factor services, such as various fees, rentals, royalties, gifts in kind, etc. Military equipment transferred between governments may, however, go unrecorded. Expenditure abroad by residents such as tourists and other persons, seasonal workers, and diplomatic and military personnel stationed abroad are treated as imports. Similarly, expenditures in the domestic territory by non-residents are considered exports.

xxvii
The valuation of exports and imports are free on board (f.o.b.) which is the price at the frontier of the exporter after it has been loaded onto the carrier and also after payment of export taxes less receipt of any rebates. In practice, some countries in the region record imports according to the convention of cost, insurance, freight (c.i.f.) which is the valuation at the frontier of the importing country inclusive of the cost of transportation and insurance.

Growth Rate
Average Annual Growth Rate
Percentage Change
Constant Current 2002 2000-2003 2003 / 2000
Antigua and Barbuda Government Services 17.4 18.4 7.6 5.9 18.6Construction 14.1 14.0 6.7 4.7 14.8Hotel and Restaurants 12.1 9.9 10.2 1.2 3.8
The Bahamas Real Estate, Rent and Business 21.8 18.6 6.8 3.3 10.2Wholesale and Retail Trade 13.0 13.3 -0.9 -1.7 -4.9Financial Intermediation 12.1 11.7 -1.3 1.5 4.6
Barbados Wholesale and Retail 19.5 16.9 -0.8 -1.5 -4.5Business and General Services 16.6 26.2 -1.0 -0.8 -2.5Tourism 15.7 11.8 10.1 0.4 1.3
Belize Trade, Hotels and Restaurants 22.6 23.2 5.4 5.9 18.8Agriculture 11.8 10.0 15.4 5.0 15.7Public Administration 10.9 11.9 5.1 4.5 14.2
Dominica Government Services 21.0 22.0 -1.6 2.1 6.5Agriculture 17.7 17.9 -3.7 -3.7 -10.6Wholesale and Retail trade 13.7 12.6 3.6 -0.8 -2.5
Grenada Transport 13.5 14.0 7.9 0.0 0.0Government Services 13.0 16.7 -1.7 0.9 2.7Wholesale and Retail trade 11.6 11.4 7.6 1.5 4.7
Guyana Agriculture, Forestry and Fishing 35.6 30.9 2.3 4.0 12.5Government 12.2 17.6 0.0 -0.3 -1.0Transport and Communication 9.8 9.2 4.0 4.7 14.7
Jamaica Distributive Trade 21.8 18.8 1.0 0.4 1.1Transport, Communication and Storage 13.9 12.0 3.6 5.0 15.7Manufacturing 13.5 12.6 -0.8 -0.3 -0.9
Montserrat Government Services 32.0 33.7 2.0 1.6 4.8Construction 22.5 17.1 -2.9 8.1 20.8Banks and Insurance 11.7 10.2 15.3 3.0 8.5
St.Kitts and Nevis Construction 17.1 15.8 -4.7 -2.1 -6.3Government Services 15.6 19.1 -1.0 1.8 5.5Manufacturing 13.1 9.3 0.6 1.0 2.9
Saint Lucia Hotels and Restaurants 13.9 14.6 16.6 1.2 3.7Government Services 12.7 15.1 2.1 1.4 4.1Wholesale and Retail Trade 11.7 12.2 7.8 -2.2 -6.5
St. Vincent & the Wholesale and Retail Trade 18.9 19.0 5.7 4.0 12.6the Grenadines Government Services 15.8 19.3 2.3 2.8 8.7
Transport 14.6 14.6 5.5 4.2 13.2
Suriname Financial and Business Services 20.3 18.1 3.1 1.2 3.8Trade, Restaurants and Hotels 17.6 16.0 32.6 7.1 22.8Transport, Storage and Communication 13.9 11.1 -1.6 12.4 41.9
Trinidad & Tobago Mining and Quarrying 23.1 21.1 29.1 16.0 56.1Manufacture 20.0 17.3 26.2 14.7 50.8Distribution Services 14.0 16.3 2.1 0.4 1.3
Percentage Contribution to GDP
Most Significant Industries at Constant PricesMember States
Summary of the Three Most Significant Industries of CARICOM Member States at Constant 2000 Prices: 2003
xxviii

COUNTRY Mid-Year Population
% change (2003/ 2002)
Average Annual Growth
Rate (2000-2003)
Exports of Goods
and Services as % of
GDP
Imports of Goods
and Services as % of
GDP
Net Goods
and Services as % of
GDP(Persons) (%) (%) (EC$Mn.) (US$Mn.) (EC$Mn.) (US$Mn.) (EC$) (US$) (EC$) (US$) (%) (%) (%)
Antigua & Barbuda 78,580 5.5 3.0 2,055 761 1,702 631 21,666 8,024 24,943 9,238 62.4 71.3 -9.0 51.4 38.5 -12.9
The Bahamas 316,298 1.4 1.5 14,856 5,502 14,130 5,233 44,672 16,545 45,929 17,011 42.2 54.2 -12.0 31.5 16.0 -15.5
Barbados 272,229 0.9 -0.8 7,281 2,697 5,655 2,094 20,773 7,694 25,666 9,506 50.2 56.4 -6.3 16.9 10.8 a -6.5 a
Belize 271,100 9.4 6.0 2,669 988 2,338 866 8,624 3,194 8,756 3,243 55.7 66.6 -10.9 20.5 0.8 a -18.3 a
Dominica 69,683 0.0 -3.1 707 262 565 209 8,112 3,004 9,366 3,469 48.1 60.2 -12.1 25.1 11.8 -13.2
Grenada 104,814 5.7 0.2 1,181 437 911 337 8,687 3,218 9,951 3,685 42.7 70.9 -28.3 42.8 8.3 -34.5
Guyana 746,300 1.2 1.5 1,985 735 1,688 625 2,262 838 2,566 950 … … -23.5 39.1 18.1 -20.9
Jamaica 2,641,600 2.3 1.6 21,810 8,078 22,265 8,246 8,429 3,122 7,626 2,825 40.7 59.2 -18.5 30.0 16.5 -13.5
Montserrat 4,483 1.2 1.1 105 39 82 30 18,267 6,765 21,528 7,973 37.7 123.2 -85.5 60.9 43.5 -17.4
St. Kitts & Nevis 47,318 0.6 0.6 984 365 780 289 16,486 6,106 18,312 6,782 43.5 59.7 -16.2 47.7 24.1 -23.6
Saint Lucia 160,620 3.6 -0.1 1,913 708 1,551 574 9,654 3,576 11,114 4,116 57.3 67.8 -10.5 21.4 6.1 -15.3
St.Vincent & the Grenadines 106,699 3.6 1.8 1,016 376 804 298 7,534 2,790 9,122 3,378 46.8 64.1 -17.2 33.9 15.7 -18.1
Suriname 482,769 5.9 4.8 2,998 1,110 2,133 790 4,418 1,636 5,937 2,199 49.3 58.8 -9.5 20.3 2000 16.7 1999 -5.7 1999
Trinidad & Tobago 1,282,447 13.4 8.4 29,013 10,745 28,177 10,436 21,972 8,138 20,992 7,775 54.8 39.8 14.9 17.7 26.0 8.3
Notes: a Data in the Consolidated Accounts of the Member State differ from the GDP by Expenditure and Kind of Activity.
(%)
Savings - Investment
as % of GDP
Gross National Saving/
GDP
Investment/GDP
(%) (%)
SELECTED INDICATORS FOR CARICOM MEMBER STATES: 2003
GDP at Current Mkt. Prices
GDP at Constant 2000 Prices
Per Capita Real GDP (2000
Prices)Per Capita GNI
xxix
NATIONAL ACCOUNTS HIGHLIGHTS 1. CARICOM OVERVIEW In 2003, CARICOM’s Total Gross Domestic Product (GDP) in Constant 2000 Prices increased by 5.9 percent over the previous year, moving from EC$78.1 billion or US$28.9 billion to EC$82.8 billion or US$30.7 billion (Tables 1.1 and 1.2). Over 4.0 percent of this growth is attributed to the performance of the economy of Trinidad and Tobago which recorded a growth rate of real GDP of 13.4 percent in 2003 over 20021. In 2000, CARICOM’s Total GDP in Constant 2000 prices stood at EC$74.3 billion or US$27.5 billion. Overall, the Region’s real GDP grew at an average annual rate of 3.7 percent during the period 2000-2003. With respect to the percentage contribution to CARICOM’s Total GDP in Constant 2000 prices, the MDCs accounted for 72.4 percent of the Total GDP in 2003 and approximately 71 percent on average during the period 2000-2003. Trinidad and Tobago continued to be one of the major contributors to CARICOM’s total GDP during the period accounting for 29.7 percent in 2000 and moving to 34.0 percent by 2003, an average of approximately 31 percent over the period. Jamaica was the next highest contributor with 28.6 percent and 26.9 percent in 2000 and 2003 respectively and with an average of 28.0 percent for the period. These two Member States and The Bahamas (17.1 percent) and Barbados (6.8 percent) together accounted for approximately 85 percent of CARICOM’s total GDP in 2003. The LDCs’ share was 10.8 percent average over the same period. In Current Prices, CARICOM’s total GDP stood at EC$77.4 billion or US$28.7 billion in 2000 as compared to EC$88.6 billion or US$32.8 billion in 2003. CARICOM’s Gross National Income (GNI) in Current Prices stood at EC$73.1 billion or US$27.1 billion in 2000 compared to EC$83.1 billion or US$30.8 billion in 2003. Trinidad and Tobago, Jamaica and The Bahamas were also the main contributors to GNI. Per Capita Real GDP of CARICOM grew steadily over the period 2000-2003 at an average annual rate of 3.1 percent. In value terms, the real GDP per capita moved from EC$11,486.6 or US$4,254.3 in 2000 to EC$12,571.2 or US$4,656.0 in 2003. The per capita real GDP of The Bahamas has consistently been the highest in the Region during the period. In 2003, this figure was EC$44,672.4 or US$16,545.3 and was twice as high as Trinidad and Tobago which followed with a real GDP per capita of EC$21,971.5 or US$8,137.6. Antigua and Barbuda with per capita GDP of EC$21,665.8 or US$8,024.4 and Barbados, EC$20,773.4 or US$7,693.8 were the only other Member States with per capita real GDP over EC$20,000 or US$7,400. Montserrat, the country with the smallest population in the Region had per capita real GDP of EC$18,266.6 or US$6,765.4 in 2003, this being the second highest among the LDCs.
1 Please check the General Notes to the tables and the Preface for factors affecting the comparability of the data across Member States.
1
In Current Market Prices, the per capita GDP of CARICOM moved from EC$11,960 or US$4,429.6 in 2000 to EC$13,450.5 or US$4,981.7 in 2003. The Bahamas had the highest per capita GDP in Current Prices during the period; in 2003 this figure stood at EC$46,986.2 or US$17,395.6. This was followed by Barbados (EC$26,744.2 or US$9,905.3), Antigua and Barbuda (EC$26,150.7 or US$9,685.4), Montserrat (EC$23,312.5 or US$8,634.3) and Trinidad and Tobago (EC$22,622.8 or US$8,378.8). Per capita GNI of CARICOM,2also in Current Market Prices, stood at EC$12,621.8 or US$4,674.8 in 2003 as compared to EC$11,294.8 or US$4,183.2 in 2000. The per capita GNI of The Bahamas was the highest in the Region at EC$45,929.3 or US$17,010.9 in 2003. Barbados with the next highest per capita GNI at EC$25,665.9 or US$9,505.9 and Antigua and Barbuda (EC$24,943.4 or US$9,238.3) were the other Member States with high per capita GNI. CARICOM’s Total Final Consumption expenditure was EC$59.2 billion or US$21.9 billion in 2000 moving to EC$67.9 billion or US$25.2 billion in 2003. This represented 78.6 percent of CARICOM’s Total GDP in Current Market Prices in 2000 and 79.4 percent in 2003. Private Final Consumption expenditure stood at EC$46.2 billion or US$17.1 billion in 2003 compared to EC$40.3 billion or US$14.9 billion in 2000 accounting for an average 67.9 percent of the Total Final Consumption expenditure over the period 2000-2003. Government Final Consumption expenditure in the Region grew from EC$18.9 billion or US$7.0 billion in 2000 to EC$21.7 billion or US$8.1 billion in 2003 and was an average 32.1 percent of Total Final Consumption expenditure over the period 2000-2003. Jamaica, Trinidad and Tobago and Barbados had the highest values for Private Final Consumption expenditure in 2003, accounting for 34.7 percent, 33.9 percent and 10.2 percent respectively of CARICOM’s Total Private Consumption expenditure. With respect to Government Final Consumption expenditure, The Bahamas accounted for 46.7 percent of the total of CARICOM’s Government Consumption expenditure in 2003, followed by Trinidad and Tobago with 17.8 percent and Jamaica with 15.1 percent. CARICOM’s Total Gross Capital Formation increased from EC$20.2 billion or US$7.5 billion in 2000 to EC$21.9 billion or US$8.1 billion in 2003, approximately 25 percent of Total GDP in Current Prices. Member States with high Gross Capital Formation included Jamaica, Trinidad and Tobago, The Bahamas, Barbados and Antigua and Barbuda. Based on available data3, the total Gross National Savings of CARICOM Member States stood at EC$15.4 billion or US$5.7 billion in 2003 as compared to EC$14.1 billion or US$5.2 billion in 2000. This amounted to 20.4 percent of CARICOM’s Total GDP in Current Prices in 2003, down marginally from 21.4 percent in 2000. 2. COUNTRY HIGHLIGHTS – INDUSTRY AND EXPENDITURE COMPONENTS 2.1 The Bahamas
2 Excludes data for Suriname. 3 Excludes data for Barbados, Belize and Suriname.
2

The Bahamas exhibited a growth rate of real GDP of 1.4 percent in 2003 over 2002. Real GDP at Constant 1991 Prices stood at BH$4.2 billion4 in 2003 as compared with BH$4.0 billion in 2000. In EC dollars, in Constant 2000 Prices, real GDP of The Bahamas stood at $14.1 billion in 2003. Overall, the average annual real growth in The Bahamas over the period 2000-2003 was 1.5 percent. In 2003, the industries contributing significantly to real GDP for The Bahamas were Real Estate, Rent and Business (21.8 percent), Wholesale and Retail Trade (13.0 percent), Financial Intermediation (12.1 percent) and Transport, Storage and Communication (9.6 percent). Hotels and Restaurants accounted for 8.6 percent of real GDP. Of the industries contributing significantly to GDP, Hotels and Restaurants had the largest growth in 2003 over 2002 at 9.6 percent followed by Real Estate, Rent and Business with 6.8 percent while the growth rate for Transport, Storage and Communication stood at 1.0 percent for the same period. Wholesale and Retail Trade and Financial Intermediation both experienced declining growth at -0.9 percent and -1.3 percent respectively over 2002. Industries with significant growth were Public Administration and Defence with 19.2 percent in 2003 over 2002, and Other Community, Social and Personal Services growing by 10.8 percent in 2003 over 2002. Agriculture and Fishing suffered a decline of 4.8 percent over the same period. In 2003, Public Administration and Defence accounted for 4.6 percent of real GDP while Other Community, Social and Personal Services contributed 6.7 percent. Agriculture and Fishing was 2.3 percent of real GDP in 2003. In Current Prices, the main industries were Real Estate, Rent and Business, Wholesale and Retail Trade and Financial Intermediation contributing 18.6 percent, 13.3 percent and 11.7 percent respectively to GDP in 2003. Hotels and Restaurants accounted for 9.8 percent of GDP in 2003 while Transport, Storage and Communications contributed 9.2 percent. Expenditure components of the GDP for The Bahamas at Current Market Prices reveal that Total Consumption Expenditure, comprising General Government and Private consumption expenditure, was on average 82.2 percent of total GDP with Government consumption expenditure accounting for over 67 percent. The Investment to GDP ratio averaged 34.0 percent while the net Goods and Non-Factor Services ratio was -13.4 percent average over the period. Gross National Savings stood at EC$2377.3 million (US$880.5 million) or 16.0 percent of Total GDP in 2003 compared to EC$2381.6 million (US$882.1 million) or 17.6 percent of GDP in 2000. 2.2 MDCs 2.2.1 Barbados 4 These figures also reflect the value in US dollars for The Bahamas based on the official exchange rate to the US dollar.
3

The rate of growth of real GDP in Barbados was 0.9 percent in 2003 over 2002. Real GDP at Constant 1974 prices moved from BD$972.7 million in 2002 to BD$981.3 million in 2003. This was an improvement in the real GDP growth rates of 2001 and 2002 which were -2.8 percent and -0.4 percent respectively. In Constant 2000 Prices in EC dollars, real GDP was $5.7 billion in 2003. For the period 2000-2003, the average annual growth rate for Barbados was -0.8 percent. Wholesale and Retail Trade was the main contributor to real GDP accounting for 19.5 percent in 2003. This was followed by Business and General Services with 16.6 percent, Tourism with 15.7 percent and Government Services with 14.1 percent. Transport, Storage and Communication contributed 8.3 percent to total real GDP in 2003. These five main industries experienced mixed growth rates with three recording negative growth in 2003. These were Wholesale and Retail Trade which declined by 0.8 percent over 2002, Business and General Services, 1.0 percent, and Government Services, 1.1 percent. On the positive side, Tourism grew by 10.1 percent in 2003 and Transport, Storage and Communications by a marginal 0.1 percent. Construction and Electricity, Gas and Water also experienced moderate growth in 2003 over 2002, with growth rates of 3.0 percent and 2.8 percent respectively. Mining and Quarrying had the largest decline in growth with 8.5 percent over the same period, followed by Agriculture with 5.6 percent. Business and General Services was the most significant contributor to GDP in Current Prices. In 2003, this industry accounted for 26.2 percent of Total GDP while Government Services (17.9 percent), Wholesale and Retail Trade (16.9 percent), and Tourism (11.8 percent) were the other main industries in Current Prices. Total Final Consumption Expenditure to GDP was 88.2 percent over the period 2000-2003. Over 65 percent of this was due to Private Final Consumption. Gross Capital Formation fell from 18.5 percent of GDP in 2000 to 16.9 percent in 2003. The ratio of net Goods and Non-factor Services to GDP was negative throughout the period reducing slightly from 6.6 percent in 2000 to 6.3 percent in 2003. 2.2.2 Guyana Guyana’s real GDP grew at a rate of 1.2 percent in 2003 over 2002. In Constant 1988 Prices, real GDP stood at G$5.6 billion in 2003 as compared to G$5.4 billion in 2000. In Constant 2000 Prices, in EC dollars, real GDP was $1.7 billion in 2003. The average annual rate of growth of real GDP was 1.5 percent over the period 2000-2003. The largest contributor to the Guyanese economy during the period 2000-2003 was the Agriculture, Forestry and Fishing industry accounting for over 33 percent of real GDP. Government Services contributed over 12 percent during the same period though this industry’s share was slowly declining, while Transport and Communication’s contribution stood at 9.8 percent in 2003 increasing from 9.0 percent in 2000. Mining and Quarrying was the next major
4

industry accounting for 9.8 percent of real GDP in 2003, a drop from the 11.7 percent it contributed in 2000. Agriculture, Forestry and Fishing grew at a rate of 2.3 percent in 2003 over 2002 down from the 6.0 percent it recorded in 2002 over 2001. There was no growth in Government Services in 2003 compared to the previous year, while Transport and Communication grew by 4.0 percent over 2002. Mining and Quarrying was the only industry which experienced a decline at a rate of 9.9 percent in 2003 over 2002. In 2003, Construction and Engineering and Rental of Dwellings also exhibited significant growth of real GDP at 4.7 percent and 4.0 percent respectively over the previous year. In Current Prices, Agriculture, Forestry and Fishing was also the largest contributing industry accounting for over 30 percent of GDP or EC$520 million in 2003. Government Services was the next largest contributing 17.6 percent to GDP in 2003, followed by Mining and Quarrying with 13.5 percent and Manufacturing and Processing with 10.0 percent. The expenditure components of Guyana’s GDP indicate that Private Final Consumption expenditure was an average 51.2 percent of GDP over the period 2000-2003. Gross Capital Formation moved from EC$746.8 million in 2000 to EC$775.4 million in 2003; the average Investment to GDP ratio over the period being 37.2 percent, the highest among the larger Member States. While the ratio of Goods and Non-factor Services (net) to GDP was negative throughout the period at an average of 12.4 percent, there was also continuous improvement over the years. In 2003, the ratio of Gross National Savings to GDP was 18.1 percent compared to 23.3 percent in 2000. 2.2.3 Jamaica In 2003, the Jamaican economy grew at a rate of 2.3 percent over the previous year. Real GDP at Constant 1996 Prices stood at J$234.7 billion in 2003 as compared with J$223.8 billion in 2000. In EC dollars, the real GDP of Jamaica in Constant 2000 Prices was $22.3 billion in 2003 and $21.2 billion in 2000, representing an average annual rate of growth of 1.6 percent over the period 2000-2003. For Jamaica, the industries contributing significantly to real GDP were Distributive Trade which accounted for 21.8 percent of Total GDP in 2003, followed by Transport, Communication and Storage with 13.9 percent, Manufacturing with 13.5 percent and Producers of Government Services contributing 10.0 percent. Of these industries, Transport, Communication and Storage had the highest growth rate in 2003 with 3.6 percent over 2002. Manufacturing had its second consecutive year in decline at -0.8 percent. Other industries with significant growth in 2003 were Miscellaneous Services which grew by 5.1 percent over the previous year, Mining and Quarrying, 4.9 percent, Agriculture, Forestry and Fishing and Electricity and Water, both at 4.7 percent and Finance and Insurance Services at 4.6
5
percent. In terms of percentage contributions to GDP, Miscellaneous Services accounted for 8.1 percent, Mining and Quarrying was 5.7 percent, Agriculture, Forestry and Fishing, 6.3 percent, Electricity and Water 4.0 percent and Finance and Insurance Services, 8.4 percent. Together, these industries accounted for over 32 percent of real GDP in 2003. Distributive Trade was also the leading contributor to GDP in Current Prices in Jamaica though its share has been gradually declining. In 2000, this industry’s share stood at 19.7 percent slipping to 18.8 percent by 2003. Manufacturing was the next major industry in Current Prices accounting for 12.6 percent in 2003, followed by Transport, Communication and Storage, 12.0 percent, and Producers of Government Services, 11.6 percent. Gross Capital Formation stood at EC$6.5 billion in 2003 compared to EC$5.7 billion in 2000 representing a ratio of Investment to GDP of 29.4 percent average over the period 2000-2003. Total Final consumption was an average 87.1 percent of GDP over the same period with Private consumption being 71.4 percent. The ratio of net Goods and Non-factor services to GDP was negative throughout the period, at an average -16.6 percent. The data shows that the imports of goods and non-factor services have been growing over the years in review while exports fell in 2001 and by 2003 had not yet returned to the 2000 level. Gross National Savings declined from EC$4.3 billion in 2000 to EC$3.6 billion in 2003, moving from 20.5 percent of Total GDP in 2000 to 16.5 percent in 2003. 2.2.4 Suriname Suriname’s rate of growth of real GDP in 2003 was 5.9 percent over 2002. Real GDP at Constant 1990 Prices grew from SF3.1 billion in 2000 to SF3.5 million in 2003 an increase of 15.2 percent over the period. In Constant 2000 Prices, in EC dollars, real GDP of Suriname stood at $2.1 billion in 2003. Over the period 2000-2003, the average annual rate of growth was 4.8 percent. Finance and Business Services was the principal industry in Suriname during 2000-2003. At Constant Prices, this industry contributed over 20 percent of total real GDP during the period; Trade, Restaurants and Hotels followed with 17.6 percent in 2003, Transport, Storage and Communications, 13.9 percent, and Manufacturing rounding out the top four industries in 2003, with 12.8 percent. These four industries accounted for over 64 percent of Suriname’s real GDP in 2003. Trade, Restaurants and Hotels was the fastest growing main industry in 2003 at a rate of 32.6 percent over 2002. For the other significant contributors to the economy, Finance and Business Services and Manufacturing grew by 3.1 percent and 1.5 percent respectively in 2003 while Transport, Storage and Communications declined by 1.6 percent over 2002. While not among the top four industries, the Construction industry had the second highest growth rate in Suriname in 2003 at 17.0 percent followed by Agriculture with 4.3 percent. Gas, Water and Electricity experienced the largest decline in 2003, contracting by 2.5 percent over 2002.
6

In Current Prices, Finance and Business Services’ share of GDP was 18.1 percent in 2003, while Trade, Restaurants and Hotels was 16.0 percent and Manufacturing stood at 14.2 percent. Other major industries in 2003 at Current Prices were Public Administration (11.4 percent), Transport, Storage and Communications (11.1 percent), Personal, Social and Other Community Services (10.5 percent) and Agriculture (10.1 percent). Based on available data, Government Final Consumption expenditure over the period 2000-2003 was on average 28.1 percent of total GDP at Current Market Prices. The ratio of net Good and Non-factor Services to GDP moved from 6.2 percent in 2000 to -9.5 in 2003 as a result of imports of goods and services growing at a faster rate than the country’s exports of goods and services. 2.2.5 Trinidad and Tobago Trinidad and Tobago exhibited the highest rate of growth of real GDP in the Region in 2003 at 13.4 percent. Real GDP in Constant 2000 Prices grew from TT$51.4 billion (EC$22.1 billion) in 2000 to TT$65.5 billion (EC$28.2 billion) in 2003, an increase of 27.5 percent over the period. Overall, the average annual rate of growth was 8.4 percent during the period 2000-2003. In Constant Prices, Mining and Quarrying was the largest contributor to Trinidad and Tobago’s economy accounting for 23.1 percent of the country’s real GDP in 2003. This was closely followed by the Manufacturing industry whose share of GDP stood at 20.0 percent. The contribution of these two industries to the GDP has been steadily growing over the period moving from 35.8 percent in 2000 to 43.1 percent in 2003, reflecting the continued strong performance of the petroleum industry and Manufacturing. Distribution Services (14.0 percent) and Finance, Insurance, Real Estate and Business Services (13.5 percent) were the other major industries at Constant Prices in 2003. Mining and Quarrying and Manufacturing were also the fastest growing industries in Trinidad and Tobago. In 2003, these industries grew by 29.1 percent and 26.2 percent respectively over 2002. The rate of growth of Distribution Services was 2.1 percent while Finance, Insurance, Real Estate and Business Services grew by 7.3 percent. Construction was another industry with significant growth in 2003. This industry achieved 22.4 percent growth over 2002. Personal Services also exhibited strong growth with 8.2 percent. Agriculture, Fishing and Forestry and General Government were the only two sectors to experience negative growth in two or more years during the period, with the former being the only industry to end the period down from its 2000 position. In 2001, Agriculture, Fishing and Forestry declined by 2.7 percent and again by 17.8 percent in 2003. General Government recorded negative growth in 2000 (-6.1 percent), 2001 (-1.5 percent) and in 2003 (-1.0 percent). In terms of percentage contribution, Construction was 7.5 percent of total real GDP, Personal Services, 1.4 percent, Agriculture, Fishing and Forestry, 0.8 percent, and General Government 6.0 percent.
7

An almost similar situation was obtained in Current Prices as at Constant prices. Mining and Quarrying, Manufacturing and Distribution Services were still the principal contributors to total GDP accounting for 21.1 percent, 17.3 percent and 16.3 percent respectively in 2003. Finance, Insurance, Real Estate and Business Services (13.6 percent) was also one of the top four industries which together accounted for over 68 percent of total GDP. An examination of the expenditure components of GDP revealed that over the period 2000-2003, Total Final Consumption Expenditure accounted for an average 70.5 percent of the total GDP, of which 57.3 percent was attributed to Private Consumption Expenditure. Gross Capital Formation was EC$5.1 billion in 2003 compared to EC$3.8 billion in 2000. The Investment to GDP ratio was 18.3 percent on average over the same period. Trinidad and Tobago was the only Member State with a consistently positive net Goods and Non-factor services to GDP ratio for the years in review. For the first three years of the period, this figure was on a downward trend reaching a low of 5.5 percent in 2002 but improved significantly the following year to 14.9 percent bringing the period average to 11.2 percent. Gross National Savings moved from EC$5.2 billion or 23.7 percent of total GDP at Market Prices in 2000 to EC$7.5 billion or 26.0 percent of GDP in 2003. 2.3 LDCs 2.3.1 Belize The Belize economy grew by 9.4 percent in 2003 over 2002, the second highest growth in the Region. Real GDP at Constant 2000 Prices was BZ$1.7 billion (EC$2.3 billion) in 2003 as compared with BZ$1.5 billion (EC$2.0 billion) in 2000 resulting in an average annual growth rate of 6.0 percent over the period The top four industries contributing significantly to real GDP for Belize were Trade, Hotels and Restaurants which accounted for 22.6 percent of Total GDP in 2003; Agriculture (including Forestry, Logging and Fishing) was next with 19.7 percent, followed by Public Administration, 10.9 percent, and Transport and Communications with 10.4 percent. Together these four industries accounted for over 63 percent of Belize’s real GDP. Of these four industries, Trade, Hotels and Restaurants exhibited growth of 5.4 percent in 2003 over 2002. Agriculture, taken separately, grew at a rate of 15.4 percent in 2003 over 2002. However, Fishing grew by 111.0 percent while Forestry and Logging declined by -5.9 percent rendering for the industry an overall growth rate of 37.7 percent. The growth rates for Public Administration and Transport and Communications were 5.1 percent and 2.5 percent respectively. Real Estate and Business Services also experienced significant growth in 2003 with 8.1 percent, and Mining, growing by 6.9 percent over 2002. Construction was the only industry other than Forestry and Logging, to experience a decline in 2003 compared to the previous year, -13.0 percent. Trade, Hotels and Restaurants was also the leading contributor to Belize’s GDP in Current Prices. This industry’s share of Total GDP was 23.2 percent in 2003. Agriculture, Forestry,
8
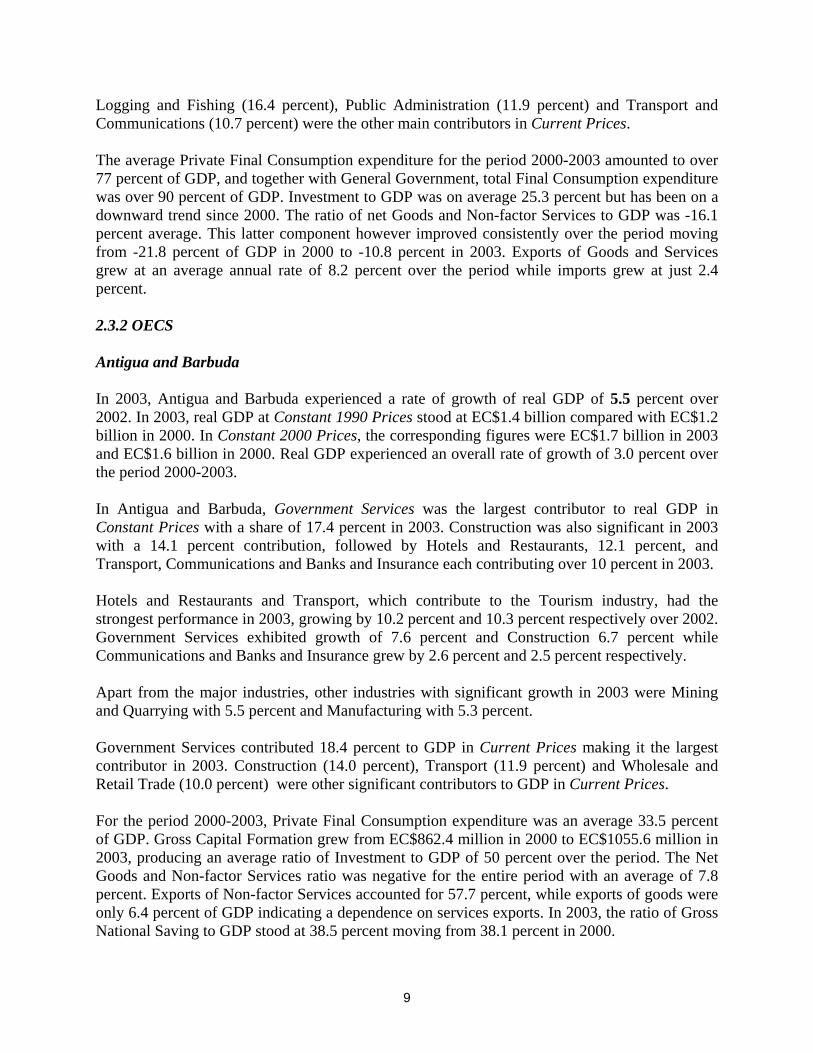
Logging and Fishing (16.4 percent), Public Administration (11.9 percent) and Transport and Communications (10.7 percent) were the other main contributors in Current Prices. The average Private Final Consumption expenditure for the period 2000-2003 amounted to over 77 percent of GDP, and together with General Government, total Final Consumption expenditure was over 90 percent of GDP. Investment to GDP was on average 25.3 percent but has been on a downward trend since 2000. The ratio of net Goods and Non-factor Services to GDP was -16.1 percent average. This latter component however improved consistently over the period moving from -21.8 percent of GDP in 2000 to -10.8 percent in 2003. Exports of Goods and Services grew at an average annual rate of 8.2 percent over the period while imports grew at just 2.4 percent. 2.3.2 OECS Antigua and Barbuda In 2003, Antigua and Barbuda experienced a rate of growth of real GDP of 5.5 percent over 2002. In 2003, real GDP at Constant 1990 Prices stood at EC$1.4 billion compared with EC$1.2 billion in 2000. In Constant 2000 Prices, the corresponding figures were EC$1.7 billion in 2003 and EC$1.6 billion in 2000. Real GDP experienced an overall rate of growth of 3.0 percent over the period 2000-2003. In Antigua and Barbuda, Government Services was the largest contributor to real GDP in Constant Prices with a share of 17.4 percent in 2003. Construction was also significant in 2003 with a 14.1 percent contribution, followed by Hotels and Restaurants, 12.1 percent, and Transport, Communications and Banks and Insurance each contributing over 10 percent in 2003. Hotels and Restaurants and Transport, which contribute to the Tourism industry, had the strongest performance in 2003, growing by 10.2 percent and 10.3 percent respectively over 2002. Government Services exhibited growth of 7.6 percent and Construction 6.7 percent while Communications and Banks and Insurance grew by 2.6 percent and 2.5 percent respectively. Apart from the major industries, other industries with significant growth in 2003 were Mining and Quarrying with 5.5 percent and Manufacturing with 5.3 percent. Government Services contributed 18.4 percent to GDP in Current Prices making it the largest contributor in 2003. Construction (14.0 percent), Transport (11.9 percent) and Wholesale and Retail Trade (10.0 percent) were other significant contributors to GDP in Current Prices. For the period 2000-2003, Private Final Consumption expenditure was an average 33.5 percent of GDP. Gross Capital Formation grew from EC$862.4 million in 2000 to EC$1055.6 million in 2003, producing an average ratio of Investment to GDP of 50 percent over the period. The Net Goods and Non-factor Services ratio was negative for the entire period with an average of 7.8 percent. Exports of Non-factor Services accounted for 57.7 percent, while exports of goods were only 6.4 percent of GDP indicating a dependence on services exports. In 2003, the ratio of Gross National Saving to GDP stood at 38.5 percent moving from 38.1 percent in 2000.
9

Dominica There was negligible negative growth of 0.04 percent in the real GDP of Dominica in 2003. Real GDP at Constant 1990 Prices was EC$415.0 million in 2003 as opposed to EC$415.2 million in 2002. In Constant 2000 Prices, real GDP was EC$565.3 in 2003 and EC$621.6 in 2000, a percentage change of -9.1 percent over the period 2000-2003 or an average annual growth rate of -3.1 percent. The main industries in Dominica in Constant Prices were Government Services, Agriculture, Wholesale and Retail Trade and Banks and Insurance. In 2003, together these industries accounted for over 65 percent of total GDP with Government Services accounting for 21.0 percent of total GDP while Agriculture contributed 17.7 percent, Wholesale and Retail Trade, 13.7 percent, and Banks and Insurance, 13.2 percent. After exhibiting positive growth during the first three years of the period 2000-2003, Government Services declined by 1.6 percent in 2003 over 2002. Agriculture experienced negative growth throughout the same period, ending at -3.7 percent in 2003. Wholesale and Retail Trade and Banks and Insurance suffered negative growth in 2001 and 2002, but both recovered in 2003 growing by 3.6 percent and 2.8 percent respectively. Other industries with positive growth in 2003 were Construction with 11.3 percent, Mining and Quarrying, 11.2 percent, and Hotels and Restaurants with 8.3 percent. Communications experienced declining growth rates during the period 2000-2003, but suffered the steepest decline in 2003 with -19.5 percent. At Current Prices the four main industries were the same as at Constant Prices. Government Services was 22.0 percent of GDP in 2003, followed by Agriculture (17.9 percent), Wholesale and Retail Trade (12.6 percent) and Banks and Insurance (11.5 percent). Despite the decline in the construction industry, investment in construction was an average 15 percent of GDP over the period while total investment to GDP was 24.4 percent average. Private Final Consumption expenditure, at 68.8 percent of GDP, was the second highest among the OECS countries and Net Goods and Non-Factor Services was -14.1 percent of GDP for the same period. The Gross National Savings to GDP ratio moved from 8.5 percent in 2000 to 11.8 percent in 2003. Grenada Following two consecutive years of decline, Grenada’s real GDP grew by 5.7 percent in 2003 over 2002. Real GDP at Constant 1990 Prices stood at EC$706.0 million in 2003 as compared with EC$701.2 million in 2000. In Constant 2000 Prices, real GDP was EC$910.5 million in 2003 against EC$904.3 in 2000. Overall, the economy grew at an average annual rate of 0.2 percent during the period 2000-2003.
10

There were five significant contributors to real GDP in Grenada during the period 2000-2003. These were Transport with 13.5 percent share in 2003, Government Services (13.0 percent), Wholesale and Retail Trade (11.9 percent), Banks and Insurance (11.4 percent) and Communications (11.1 percent). Hotels and Restaurants accounted for 8.7 percent of real GDP in 2003 and while not among the main five industries, its share has been increasing over the period. The rates of growth of the main contributors to GDP in 2003 over 2002 ranged from 7.9 percent in the case of Transport to -1.7 percent for Government Services. Wholesale and Retail Trade grew by 7.6 percent, Communications by 3.0 percent and Banks and Insurance by 1.9 percent. Hotels and Restaurants enjoyed 13.8 percent growth in 2003 over 2002. At 28.5 percent, Construction had the highest growth rate in Grenada in 2003 over 2002. This was followed by Mining and Quarrying with 22.8 percent, though in EC dollars, this was a $1.2 million increase. Two industries other than Government Services experienced negative growth in 2003 compared to 2002. These were the Manufacturing industry which declined by 2.8 percent and Agriculture with 2.4 percent. The main contributors to GDP in Current Prices were Government Services with 16.7 percent in 2003, Transport with 14.0 percent, Banks and Insurance (12.2 percent), Wholesale and Retail Trade (11.4 percent) and Construction (11.0 percent). Hotels and Restaurants contributed 8.6 percent to GDP in Current Prices. On the expenditure side, Private Final Consumption expenditure was 67.6 percent of GDP for the period 2000-2003 and the Investment to GDP ratio was 39 percent on average. The ratio of Goods and Non-factor Services (net) to GDP was negative for the entire period and moved from -17.7 percent in 2000 to -28.3 percent in 2003 primarily due to the decline in the exports of goods. During the first three years of the period, Gross National Savings displayed a downward trend, decreasing from EC$253.1 million or 22.9 percent of GDP in 2000 to a low of EC$47.1 million or 4.3 percent of GDP in 2002, before increasing to EC$97.5 million or 8.3 percent of GDP in 2003. Montserrat Montserrat exhibited growth of real GDP of 1.2 percent in 2003 over 2002. At Constant 1990 Prices, real GDP grew from EC$58.5 million in 2000 to EC$60.4 million in 2003. At Constant 2000 Prices, this was equivalent to EC$79.3 million in 2000 and EC$81.9 million in 2003. The average annual growth rate of real GDP for the period 2000-2003 was 1.1 percent. Two main industries stood out during 2003, Government Services which contributed 32.0 percent to real GDP in Montserrat and Construction with 22.5 percent. Banks and Insurance accounted for 11.7 percent. Government Services achieved a 2.0 percent growth rate in 2003 over 2002, while Construction fell by 2.9 percent. Banks and Insurance which grew by 15.3 percent, Transport (6.8 percent) and
11

Real Estate and Housing (4.5 percent) were the only industries with significant growth in 2003 while Hotels and Restaurants had the sharpest decline at -31.6 percent. The average Total Final Consumption expenditure for the period 2000-2003 was 124.5 percent of total GDP at Market Prices. Government Final Consumption expenditure accounted for 73.1 percent while Private Final Consumption expenditure stood at 51.4 percent on average. The expenditure components of GDP also reflected the growth and significance of Construction to GDP. Construction was the highest Investment component throughout the period 2000-2003 at 36.9 percent of GDP, while the total Investment to GDP ratio was an average 50.3 percent for the same period. There was also heavy dependence on the imports of goods and non-factor services which influenced the net Goods and Non-factor services ratio to GDP. This was evident in the ratio declining from -59.8 percent in 2000 to -85.5 percent in 2003, an average of -74.8 percent over the period. The ratio of Gross National Savings to GDP has been on a general upward trend moving from 27.9 percent in 2000 to 43.5 percent in 2003. St. Kitts and Nevis The rate of growth of real GDP in St. Kitts and Nevis was 0.6 percent in 2003, as was the overall average for the period 2000-2003. Real GDP at Constant 1990 Prices was EC$565.7 million in 2003 and EC$555.0 million in 2000. In Constant 2000 Prices, real GDP of St. Kitts and Nevis stood at EC$780.1 million in 2003. The industries contributing significantly to real GDP in 2003 were Construction (17.1 percent), Government Services (15.6 percent), Manufacturing (13.1 percent), Banks and Insurance (13.0 percent) and Wholesale and Retail Trade (12.4 percent). Of these industries, Wholesale and Retail had the highest rate of growth in 2003 at 4.5 percent. This was followed by Banks and Insurance with 3.3 percent and Manufacturing with 0.6 percent. Construction and Government services recorded negative growth in 2003 at the rate of -4.7 percent and -1.0 percent respectively. Other industries with significant growth in 2003 over 2002 were Hotel and Restaurants (31.3 percent) and Electricity and Water (10.6 percent). Mining and Quarrying moved from EC$4.7 million in 2002 to EC$2.5 million in 2003, a decline of 46.6 percent. Agriculture also experienced a negative growth rate of -12.7 percent in 2003. In Current Prices, Government Services (19.1 percent), Banks and Insurance (16.1 percent), Construction (15.8 percent) and Wholesale and Retail Trade (12.7 percent) were the top four contributors to GDP in St. Kitts and Nevis. For the period 2000-2003, the average Investment to GDP ratio was 50 percent. Total Final Consumption was an average 75.1 percent of GDP with Private Final Consumption expenditure accounting for 55.2 percent of GDP and Government Final Consumption expenditure, 19.9 percent, for the same period. The ratio of Goods and Non-factor Services (net) to GDP was -25.0 percent of GDP on average while the ratio of Gross National Savings to GDP was 22.6 percent.
12

Saint Lucia In 2003, real GDP of Saint Lucia grew by 3.6 percent over the position in 2002. Real GDP at Constant 1990 Prices was EC$1,164.1 million in 2003 compared to EC$1,169.4 in 2000. In Constant 2000 Prices, real GDP was EC$1557.7 million in 2000 as against EC$1,550.7 million in 2003, declining at an average annual rate of 0.1 percent over the period. Hotels and Restaurants was the most significant contributor to real GDP in Saint Lucia in 2003; this industry accounted for 13.9 percent of total GDP. Government Services was the next most significant contributor accounting for 12.7 percent, followed by Wholesale and Retail Trade with 11.7 percent share, Communications with 11.6 percent, Banks and Insurance with 11.4 percent and Transport rounding out the top six contributors with 10.6 percent. Not only was Hotels and Restaurants the largest contributor to Saint Lucia’s real GDP, but at 16.6 percent, this industry also exhibited the highest rate of growth in 2003 over 2002. Government Services grew at a rate of 2.1 percent, Wholesale and Retail Trade, 7.8 percent, Communications, 4.5 percent, Banks and Insurance, 2.4 percent, and Transport, 2.6 percent. Agriculture, which has been on a downward trend since 2001, continued to experience a decline of 13.1 percent in 2003. In 2003, the top five contributors to Saint Lucia’s GDP in Current Prices were Government Services (15.1 percent), Hotels and Restaurants (14.6 percent), Transport (12.5 percent), Wholesale and Retail Trade (12.2 percent) and Banks and Insurance (10.6 percent). Private Final Consumption expenditure was approximately 59.8 percent of GDP for the period 2000-2003. The Investment to GDP ratio was 24.2 percent on average for the same period with Construction accounting for more than 50 percent of this. The ratio of Goods and Non-Factor Services (net) to GDP was negative at an average of 9.5 percent. Exports of non-factor services was 43.8 percent of GDP but this was offset by the imports of goods which were 44.3 percent of total GDP. Gross National Savings displayed a downward trend during the period. In 2000, this figure stood at EC$260.9 million or 14.1 percent of GDP compared to EC$116.3 or 6.1 percent of GDP in 2003. St. Vincent and the Grenadines St. Vincent and the Grenadines experienced 3.6 percent growth in real GDP in 2003 over 2002. At Constant 1990 Prices, real GDP stood at EC$646.7 million in 2003 in comparison to EC$612.9 million in 2000. At Constant 2000 Prices, real GDP was EC$803.9 million in 2003. The real GDP of St. Vincent and the Grenadines grew at an overall rate of 1.8 percent over the period 2000-2003.
13

The four largest contributors to real GDP for St. Vincent and the Grenadines were Wholesale and Retail Trade, which accounted for 18.9 percent of total GDP in 2003, Government Services, which contributed 15.8 percent and Transport and Agriculture which accounted for 14.6 percent and 11.1 percent respectively. All these industries except Agriculture recorded positive growth rates in 2003 over 2002. Agriculture declined by 2.2 percent while Wholesale and Retail Trade experienced the highest growth at 5.7 percent with Transport following with 5.5 percent growth. Government Services grew by 2.3 percent over the same period. Other industries that experienced significant growth were Construction with a growth rate of 9.4 percent in 2003, Electricity and Water grew by 7.5 percent and Mining and Quarrying by 5.0 percent. Other than Agriculture, Hotels and Restaurants was the only other industry to exhibit a decline in 2003, shrinking by 5.8 percent from 2002. In Current Prices, Government Services was the largest contributor to GDP in St. Vincent and the Grenadines with a share of 19.3 percent in 2003. Wholesale and Retail Trade followed closely accounting for 19.0 percent while Transport contributed 14.6 percent and Construction accounted for 12.2 percent. The Investment to GDP ratio in St. Vincent and the Grenadines was on average 30.3 percent for the period 2000-2003, Construction being the main component of Gross Capital Formation. The average Private Final Consumption expenditure was 61.7 percent of GDP for the same period. The ratio of net Goods and Non-Factor Services to GDP has been negative and increasing every year over the period, moving from -8.0 percent in 2000 to -17.2 percent in 2003 or -11.8 percent average. Gross National Savings was 18.5 percent of GDP in Current Prices in 2000 falling to 15.7 percent in 2003.
14


CARICOM
$EC MnCOUNTRIES 2000 2001 2002 2003
CARIBBEAN COMMUNITY 74306.8 75618.0 78142.8 82780.9
THE BAHAMAS 13510.0 13618.8 13928.4 14129.8
CSME 60796.8 61999.2 64214.4 68651.1
MDCs 52586.5 53805.6 55907.9 59918.2
BARBADOS 5792.9 5628.6 5605.6 5655.1
GUYANA 1612.2 1649.0 1667.9 1688.0
JAMAICA 21225.4 21538.4 21772.4 22265.0
SURINAME 1852.3 1964.5 2013.1 2132.8
TRINIDAD AND TOBAGO 22103.7 23025.1 24848.9 28177.3
LDCs 8210.2 8193.6 8306.5 8732.8
BELIZE 1964.3 2046.8 2136.3 2338.0
OECS 6245.9 6146.8 6170.2 6394.9
ANTIGUA AND BARBUDA 1555.9 1579.8 1613.1 1702.5
DOMINICA 621.6 595.7 565.5 565.3
GRENADA 904.3 864.9 861.6 910.5
MONTSERRAT 79.3 77.1 80.9 81.9
ST. KITTS AND NEVIS 765.2 777.9 775.7 780.1
SAINT LUCIA 1557.7 1490.2 1497.3 1550.7
ST. VINCENT AND THE GRENADINES 761.8 761.2 776.2 803.9
COUNTRIES 2000 2001 2002 2003
CARIBBEAN COMMUNITY 3.5 1.8 3.3 5.9
THE BAHAMAS 1.9 0.8 2.3 1.4
CSME 3.8 2.0 3.6 6.9
MDCs 3.6 2.3 3.9 7.2
BARBADOS 3.4 -2.8 -0.4 0.9
GUYANA -1.4 2.3 1.1 1.2
JAMAICA 0.8 1.5 1.1 2.3
SURINAME 4.2 6.1 2.5 5.9
TRINIDAD AND TOBAGO 6.9 4.2 7.9 13.4
LDCs 5.4 -0.2 1.4 5.1
BELIZE 13.0 4.2 4.4 9.4
OECS 3.2 -1.6 0.4 3.6
ANTIGUA AND BARBUDA 3.3 1.5 2.1 5.5
DOMINICA 1.3 -4.2 -5.1 0.0
GRENADA 7.0 -4.4 -0.4 5.7
MONTSERRAT -3.0 -2.8 4.9 1.2
ST. KITTS AND NEVIS 10.4 1.7 -0.3 0.6
SAINT LUCIA -0.4 -4.3 0.5 3.6
ST. VINCENT AND THE GRENADINES 2.0 -0.1 2.0 3.6
Table 1.1: Gross Domestic Product In Constant 2000 Prices
Table 1.1A: Gross Domestic Product In Constant 2000 Prices - Percentage Change
15

CARICOM
COUNTRIES 2000 2001 2002 2003
CARIBBEAN COMMUNITY 100.0 100.0 100.0 100.0
THE BAHAMAS 18.2 18.0 17.8 17.1
CSME 81.8 82.0 82.2 82.9
MDCs 70.8 71.2 71.5 72.4
BARBADOS 7.8 7.4 7.2 6.8
GUYANA 2.2 2.2 2.1 2.0
JAMAICA 28.6 28.5 27.9 26.9
SURINAME 2.5 2.6 2.6 2.6
TRINIDAD AND TOBAGO 29.7 30.4 31.8 34.0
LDCs 11.0 10.8 10.6 10.5
BELIZE 2.6 2.7 2.7 2.8
OECS 8.4 8.1 7.9 7.7
ANTIGUA AND BARBUDA 2.1 2.1 2.1 2.1
DOMINICA 0.8 0.8 0.7 0.7
GRENADA 1.2 1.1 1.1 1.1
MONTSERRAT 0.1 0.1 0.1 0.1
ST. KITTS AND NEVIS 1.0 1.0 1.0 0.9
SAINT LUCIA 2.1 2.0 1.9 1.9
ST. VINCENT AND THE GRENADINES 1.0 1.0 1.0 1.0
$US MnCOUNTRIES 2000 2001 2002 2003
CARIBBEAN COMMUNITY 27521.0 28006.7 28941.8 30659.6
THE BAHAMAS 5003.7 5044.0 5158.7 5233.3
CSME 22517.3 22962.7 23783.1 25426.3
MDCs 19476.5 19928.0 20706.6 22191.9
BARBADOS 2145.5 2084.7 2076.1 2094.5
GUYANA 597.1 610.7 617.7 625.2
JAMAICA 7861.3 7977.2 8063.8 8246.3
SURINAME 686.0 727.6 745.6 789.9
TRINIDAD AND TOBAGO 8186.6 8527.8 9203.3 10436.0
LDCs 3040.8 3034.7 3076.5 3234.4
BELIZE 727.5 758.1 791.2 865.9
OECS 2313.3 2276.6 2285.3 2368.5
ANTIGUA AND BARBUDA 576.3 585.1 597.4 630.6
DOMINICA 230.2 220.6 209.4 209.4
GRENADA 334.9 320.3 319.1 337.2
MONTSERRAT 29.4 28.6 30.0 30.3
ST. KITTS AND NEVIS 283.4 288.1 287.3 288.9
SAINT LUCIA 576.9 551.9 554.5 574.3
ST. VINCENT AND THE GRENADINES 282.2 281.9 287.5 297.7
Table 1.2: Gross Domestic Product In Constant 2000 Prices
Table 1.1B: Gross Domestic Product In Constant 2000 Prices - Percentage Distribution
16

CARICOM
Fig 1.1: GDP at Constant 2000 Prices: 2000
18.22.2
28.6
2.5
29.7
0.8
1.2
0.1
2.1
14.1
1.0
1.02.6
7.8
2.1
BH BB GY JM SR TT BZ AG DM GD MS KN LC
Fig 1.2: GDP at Constant 2000 Prices: 2001
18.0
7.42.2
28.5
2.6
30.4
2.7
1.1
0.1
2.0
8.80.8
2.1
1.0
1.0
BH BB GY JM SR TT BZ AG DM GD MS KN LC
Fig 1.3: GDP at Constant 2000 Prices: 2002
17.8
7.22.1
27.9
2.6
31.8
2.1
0.7
1.1
0.1
1.0
1.9
6.9
1.02.7
BH BB GY JM SR TT BZ AG DM GD MS KN LC
Fig 1.4: GDP at Constant 2000 Prices: 2003
17.8
6.8
2.0
26.9
2.6
34.0
1.1
0.1
1.9
12.6
1.02.8 0.9
2.1
0.7
BH BB GY JM SR TT BZ AG DM GD MS KN LC
17
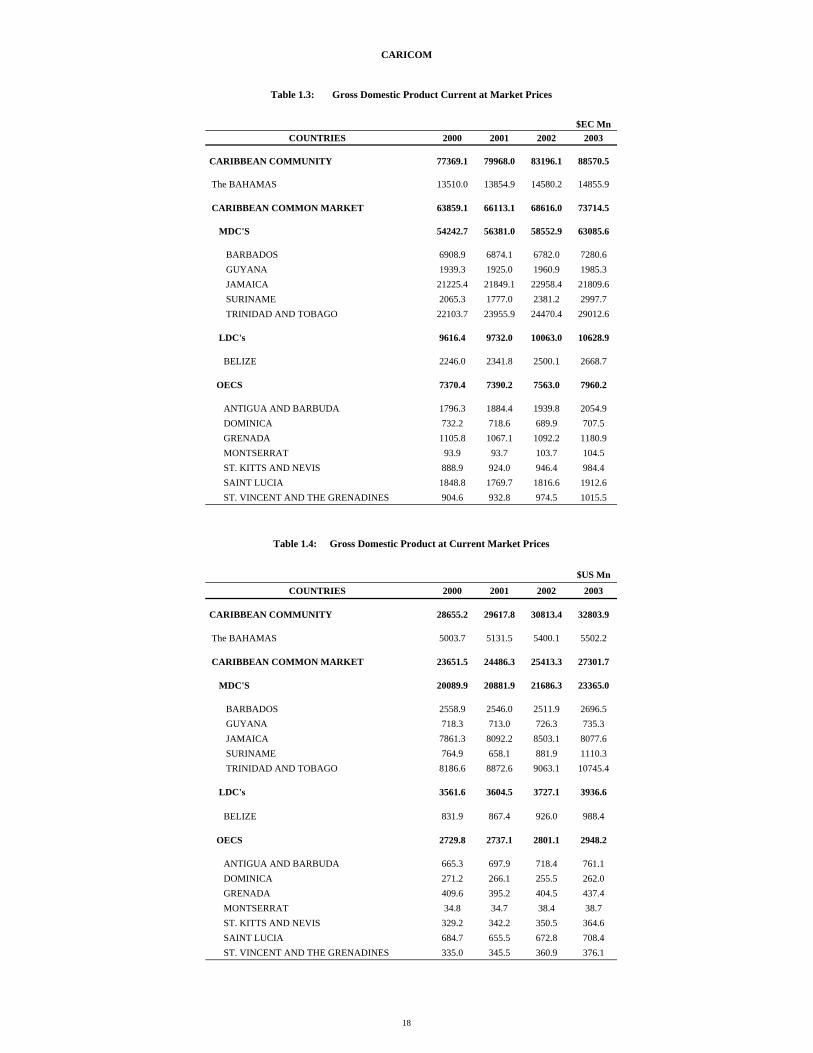
CARICOM
$EC MnCOUNTRIES 2000 2001 2002 2003
CARIBBEAN COMMUNITY 77369.1 79968.0 83196.1 88570.5
The BAHAMAS 13510.0 13854.9 14580.2 14855.9
CARIBBEAN COMMON MARKET 63859.1 66113.1 68616.0 73714.5
MDC'S 54242.7 56381.0 58552.9 63085.6
BARBADOS 6908.9 6874.1 6782.0 7280.6 GUYANA 1939.3 1925.0 1960.9 1985.3 JAMAICA 21225.4 21849.1 22958.4 21809.6 SURINAME 2065.3 1777.0 2381.2 2997.7 TRINIDAD AND TOBAGO 22103.7 23955.9 24470.4 29012.6
LDC's 9616.4 9732.0 10063.0 10628.9 BELIZE 2246.0 2341.8 2500.1 2668.7
OECS 7370.4 7390.2 7563.0 7960.2
ANTIGUA AND BARBUDA 1796.3 1884.4 1939.8 2054.9 DOMINICA 732.2 718.6 689.9 707.5 GRENADA 1105.8 1067.1 1092.2 1180.9 MONTSERRAT 93.9 93.7 103.7 104.5 ST. KITTS AND NEVIS 888.9 924.0 946.4 984.4 SAINT LUCIA 1848.8 1769.7 1816.6 1912.6 ST. VINCENT AND THE GRENADINES 904.6 932.8 974.5 1015.5
$US Mn
COUNTRIES 2000 2001 2002 2003
CARIBBEAN COMMUNITY 28655.2 29617.8 30813.4 32803.9
The BAHAMAS 5003.7 5131.5 5400.1 5502.2
CARIBBEAN COMMON MARKET 23651.5 24486.3 25413.3 27301.7
MDC'S 20089.9 20881.9 21686.3 23365.0
BARBADOS 2558.9 2546.0 2511.9 2696.5 GUYANA 718.3 713.0 726.3 735.3 JAMAICA 7861.3 8092.2 8503.1 8077.6 SURINAME 764.9 658.1 881.9 1110.3 TRINIDAD AND TOBAGO 8186.6 8872.6 9063.1 10745.4
LDC's 3561.6 3604.5 3727.1 3936.6 BELIZE 831.9 867.4 926.0 988.4
OECS 2729.8 2737.1 2801.1 2948.2
ANTIGUA AND BARBUDA 665.3 697.9 718.4 761.1 DOMINICA 271.2 266.1 255.5 262.0 GRENADA 409.6 395.2 404.5 437.4 MONTSERRAT 34.8 34.7 38.4 38.7 ST. KITTS AND NEVIS 329.2 342.2 350.5 364.6 SAINT LUCIA 684.7 655.5 672.8 708.4 ST. VINCENT AND THE GRENADINES 335.0 345.5 360.9 376.1
Table 1.4: Gross Domestic Product at Current Market Prices
Table 1.3: Gross Domestic Product Current at Market Prices
18

CARICOM
COUNTRIES 2000 2001 2002 2003
CARIBBEAN COMMUNITY 6468992 6522578 6562218 6584940
The BAHAMAS 303611 307000 312000 316298
CARIBBEAN COMMON MARKET 6165381 6215578 6250218 6268642
MDC'S 5354214 5390901 5416279 5425345
BARBADOS 250010 269916 270800 272229
GUYANA 772214 774824 774800 746300
JAMAICA 2605787 2609300 2618600 2641600
SURINAME 463837 470064 476374 482769
TRINIDAD AND TOBAGO 1262366 1266797 1275705 1282447
LDC's 811167 824677 833939 843297 BELIZE 249800 257310 265200 271100
OECS 561367 567367 568739 572197
ANTIGUA AND BARBUDA 72310 75741 77148 78580
DOMINICA 71530 71326 69830 69683
GRENADA 101400 102632 103501 104814
MONTSERRAT 3853 4517 4563 4483
ST. KITTS AND NEVIS 44286 46111 46710 47318
SAINT LUCIA 155996 158018 159133 160620
ST. VINCENT AND THE GRENADINES 111992 109022 107854 106699
Table 1.5: Mid - Year Population Estimates
Fig 1.5: Mid-Year Population Estimates: 2000 - 2003
0
1000000
2000000
3000000
4000000
5000000
6000000
7000000
2000 2001 2002 2003
$EC
Mn
LDC'sMDC'SCARIBBEAN COMMOM MARKETCARIBBEAN COMMUNITY
19
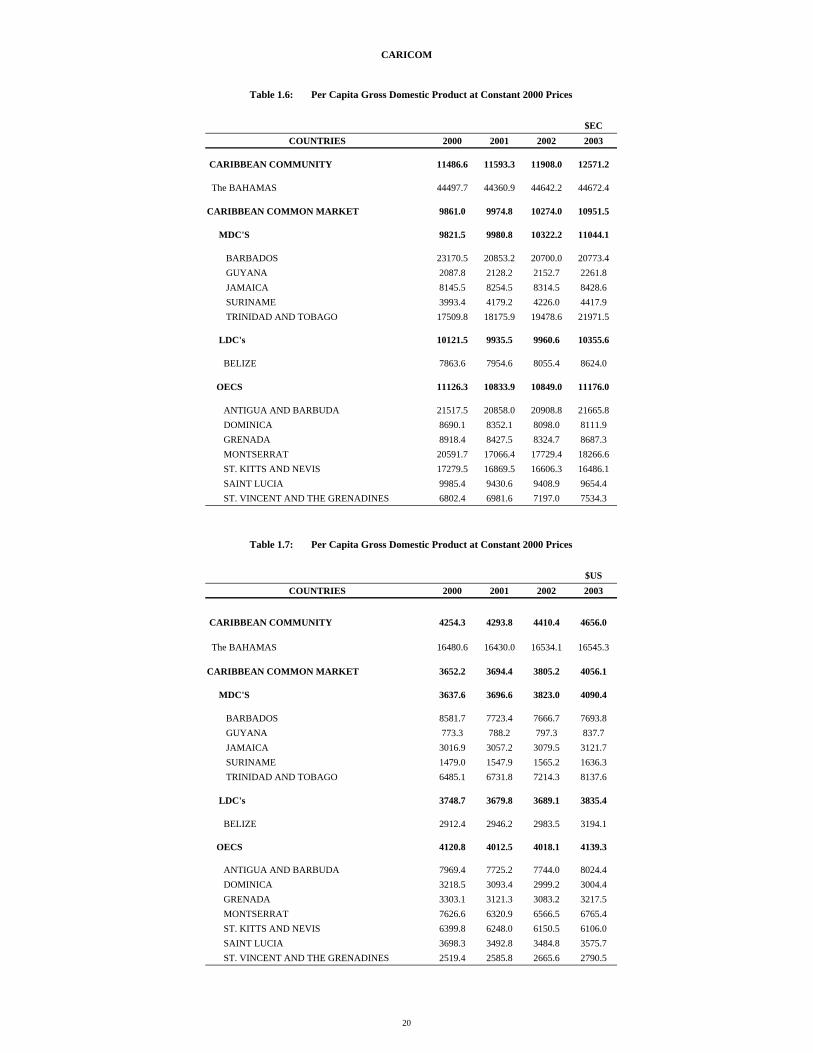
CARICOM
$ECCOUNTRIES 2000 2001 2002 2003
CARIBBEAN COMMUNITY 11486.6 11593.3 11908.0 12571.2
The BAHAMAS 44497.7 44360.9 44642.2 44672.4
CARIBBEAN COMMON MARKET 9861.0 9974.8 10274.0 10951.5
MDC'S 9821.5 9980.8 10322.2 11044.1
BARBADOS 23170.5 20853.2 20700.0 20773.4 GUYANA 2087.8 2128.2 2152.7 2261.8 JAMAICA 8145.5 8254.5 8314.5 8428.6 SURINAME 3993.4 4179.2 4226.0 4417.9 TRINIDAD AND TOBAGO 17509.8 18175.9 19478.6 21971.5
LDC's 10121.5 9935.5 9960.6 10355.6 BELIZE 7863.6 7954.6 8055.4 8624.0
OECS 11126.3 10833.9 10849.0 11176.0
ANTIGUA AND BARBUDA 21517.5 20858.0 20908.8 21665.8 DOMINICA 8690.1 8352.1 8098.0 8111.9 GRENADA 8918.4 8427.5 8324.7 8687.3 MONTSERRAT 20591.7 17066.4 17729.4 18266.6 ST. KITTS AND NEVIS 17279.5 16869.5 16606.3 16486.1 SAINT LUCIA 9985.4 9430.6 9408.9 9654.4 ST. VINCENT AND THE GRENADINES 6802.4 6981.6 7197.0 7534.3
$USCOUNTRIES 2000 2001 2002 2003
CARIBBEAN COMMUNITY 4254.3 4293.8 4410.4 4656.0
The BAHAMAS 16480.6 16430.0 16534.1 16545.3
CARIBBEAN COMMON MARKET 3652.2 3694.4 3805.2 4056.1
MDC'S 3637.6 3696.6 3823.0 4090.4
BARBADOS 8581.7 7723.4 7666.7 7693.8 GUYANA 773.3 788.2 797.3 837.7 JAMAICA 3016.9 3057.2 3079.5 3121.7 SURINAME 1479.0 1547.9 1565.2 1636.3 TRINIDAD AND TOBAGO 6485.1 6731.8 7214.3 8137.6
LDC's 3748.7 3679.8 3689.1 3835.4 BELIZE 2912.4 2946.2 2983.5 3194.1
OECS 4120.8 4012.5 4018.1 4139.3
ANTIGUA AND BARBUDA 7969.4 7725.2 7744.0 8024.4 DOMINICA 3218.5 3093.4 2999.2 3004.4 GRENADA 3303.1 3121.3 3083.2 3217.5 MONTSERRAT 7626.6 6320.9 6566.5 6765.4 ST. KITTS AND NEVIS 6399.8 6248.0 6150.5 6106.0 SAINT LUCIA 3698.3 3492.8 3484.8 3575.7 ST. VINCENT AND THE GRENADINES 2519.4 2585.8 2665.6 2790.5
Table 1.7: Per Capita Gross Domestic Product at Constant 2000 Prices
Table 1.6: Per Capita Gross Domestic Product at Constant 2000 Prices
20

CARICOM
Fig 1.6: GDP Per Capita in Constant 2000 Prices: 2000
0
5000
10000
15000
20000
25000
30000
35000
40000
45000
50000
AG BB BH BZ DM GD GY JM MS KN LC VC SR TT
$EC
Fig 1.7: GDP Per Capita in Constant 2000 Prices: 2001
05000
100001500020000250003000035000400004500050000
AG BB BH BZ DM GD GY JM MS KN LC VC SR TT
$EC
Fig 1.8: GDP Per Capita in Constant 2000 Prices: 2002
0
5000
10000
15000
20000
25000
30000
35000
40000
45000
50000
AG BB BH BZ DM GD GY JM MS KN LC VC SR TT
$EC
Fig 1.9: GDP Per Capita in Constant 2000 Prices: 2003
0.0
5000.0
10000.0
15000.0
20000.0
25000.0
30000.0
35000.0
40000.0
45000.0
50000.0
AG BB BH BZ DM GD GY JM MS KN LC VC SR TT
$EC
21

CARICOM
$EC
COUNTRIES 2000 2001 2002 2003
CARIBBEAN COMMUNITY 11960.0 12260.2 12678.0 13450.5
The BAHAMAS 44497.7 45130.0 46731.3 46968.2
CARIBBEAN COMMON MARKET 10357.7 10636.7 10978.2 11759.3
MDC'S 10130.8 10458.6 10810.5 11627.9
BARBADOS 27634.5 25467.4 25044.3 26744.2
GUYANA 2511.4 2484.5 2530.9 2660.1
JAMAICA 8145.5 8373.5 8767.4 8256.2
SURINAME 4452.7 3780.3 4998.7 6209.4
TRINIDAD AND TOBAGO 17509.8 18910.6 19181.8 22622.8
LDC's 11855.0 11801.0 12066.9 12604.0
BELIZE 8991.2 9101.3 9427.1 9843.9
OECS 13129.4 13025.4 13297.8 13911.7
ANTIGUA AND BARBUDA 24842.1 24879.4 25143.6 26150.7
DOMINICA 10235.6 10074.2 9879.3 10152.4
GRENADA 10905.2 10397.5 10552.7 11266.7
MONTSERRAT 24368.7 20741.6 22715.3 23312.5
ST. KITTS AND NEVIS 20071.1 20038.0 20260.8 20803.7
SAINT LUCIA 11851.7 11199.5 11415.6 11907.4
ST. VINCENT AND THE GRENADINES 8077.1 8555.6 9035.2 9517.4
$USCOUNTRIES 2000 2001 2002 2003
CARIBBEAN COMMUNITY 4429.6 4540.8 4695.6 4981.7
The BAHAMAS 16480.6 16714.8 17307.9 17395.6
CARIBBEAN COMMON MARKET 3836.2 3939.5 4066.0 4355.3
MDC'S 3752.2 3873.5 4003.9 4306.6
BARBADOS 10235.0 9432.4 9275.7 9905.3 GUYANA 930.1 920.2 937.4 985.2 JAMAICA 3016.9 3101.3 3247.2 3057.8 SURINAME 1649.1 1400.1 1851.4 2299.8 TRINIDAD AND TOBAGO 6485.1 7003.9 7104.4 8378.8
LDC's 4390.8 4370.8 4469.2 4668.2
BELIZE 3330.1 3370.8 3491.5 3645.9
OECS 4862.7 4824.2 4925.1 5152.5
ANTIGUA AND BARBUDA 9200.8 9214.6 9312.5 9685.4 DOMINICA 3791.0 3731.2 3659.0 3760.1 GRENADA 4039.0 3850.9 3908.4 4172.9 MONTSERRAT 9025.4 7682.1 8413.1 8634.3 ST. KITTS AND NEVIS 7433.8 7421.5 7504.0 7705.1 SAINT LUCIA 4389.5 4148.0 4228.0 4410.1 ST. VINCENT AND THE GRENADINES 2991.5 3168.7 3346.4 3525.0
Table 1.9: Per Capita Gross Domestic Product at Current Prices
Table 1.8: Per Capita Gross Domestic Product at Current Prices
22

CARICOM
$EC MnCOUNTRIES 2000 2001 2002 2003
CARIBBEAN COMMUNITY 73065.8 75409.0 78782.5 83114.0
The BAHAMAS 13173.0 13473.7 14109.3 14527.3
CARIBBEAN COMMON MARKET 59892.8 61935.3 64673.2 68586.6
MDC'S 51138.7 53020.6 55363.8 58835.9
BARBADOS 6653.2 6599.9 6582.7 6987.0 GUYANA 1798.6 1767.5 1812.4 1915.2 JAMAICA 20346.6 20664.4 21336.8 20146.1 SURINAME 1937.6 1492.0 2456.8 2866.2 TRINIDAD AND TOBAGO 20402.7 22496.8 23175.1 26921.4
LDC's 8754.1 8914.7 9309.4 9750.8 BELIZE 1939.9 1997.6 2277.8 2373.8
OECS 6814.2 6917.2 7031.6 7377.0
ANTIGUA AND BARBUDA 1676.1 1825.6 1846.6 1960.1 DOMINICA 644.7 662.9 640.0 652.6 GRENADA 1016.3 960.4 970.6 1043.0 MONTSERRAT 86.6 91.4 95.3 96.5 ST. KITTS AND NEVIS 807.6 830.8 843.3 866.5 SAINT LUCIA 1730.4 1658.0 1699.2 1785.1 ST. VINCENT AND THE GRENADINES 852.5 888.2 936.6 973.3 Notes: All figures are in Market Prices except for Jamaica which are atPurchasers' Price
$US MnCOUNTRIES 2000 2001 2002 2003
CARIBBEAN COMMUNITY 27061.4 27929.3 29178.7 30783.0
The BAHAMAS 4878.9 4990.3 5225.7 5380.5
CARIBBEAN COMMON MARKET 22182.5 22939.0 23953.0 25402.5
MDC'S 18940.3 19637.3 20505.1 21791.1
BARBADOS 2464.2 2444.4 2438.1 2587.8 GUYANA 666.1 654.6 671.3 709.3 JAMAICA 7535.8 7653.5 7902.5 7461.5 SURINAME 717.6 552.6 909.9 1061.6 TRINIDAD AND TOBAGO 7556.5 8332.1 8583.4 9970.9
LDC's 3242.3 3301.8 3447.9 3611.4 BELIZE 718.5 739.8 843.6 879.2
OECS 2523.8 2561.9 2604.3 2732.2
ANTIGUA AND BARBUDA 620.8 676.1 683.9 725.9 DOMINICA 238.8 245.5 237.0 241.7 GRENADA 376.4 355.7 359.5 386.3 MONTSERRAT 32.1 33.9 35.3 35.7 ST. KITTS AND NEVIS 299.1 307.7 312.3 320.9 SAINT LUCIA 640.9 614.1 629.3 661.1 ST. VINCENT AND THE GRENADINES 315.7 329.0 346.9 360.5
Table 1.10: Gross National Income at Market Prices
Table 1.11: Gross National Income at Market Prices
23
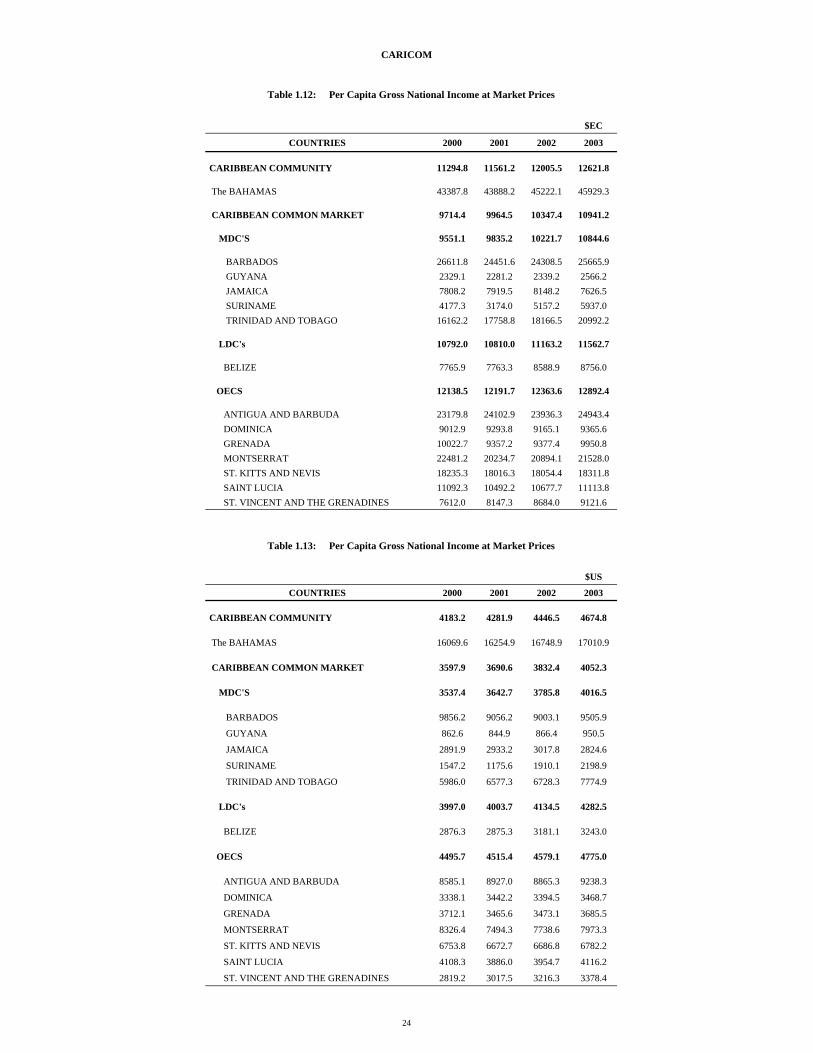
CARICOM
$EC
COUNTRIES 2000 2001 2002 2003
CARIBBEAN COMMUNITY 11294.8 11561.2 12005.5 12621.8
The BAHAMAS 43387.8 43888.2 45222.1 45929.3
CARIBBEAN COMMON MARKET 9714.4 9964.5 10347.4 10941.2
MDC'S 9551.1 9835.2 10221.7 10844.6
BARBADOS 26611.8 24451.6 24308.5 25665.9 GUYANA 2329.1 2281.2 2339.2 2566.2 JAMAICA 7808.2 7919.5 8148.2 7626.5 SURINAME 4177.3 3174.0 5157.2 5937.0 TRINIDAD AND TOBAGO 16162.2 17758.8 18166.5 20992.2
LDC's 10792.0 10810.0 11163.2 11562.7 BELIZE 7765.9 7763.3 8588.9 8756.0
OECS 12138.5 12191.7 12363.6 12892.4
ANTIGUA AND BARBUDA 23179.8 24102.9 23936.3 24943.4 DOMINICA 9012.9 9293.8 9165.1 9365.6 GRENADA 10022.7 9357.2 9377.4 9950.8 MONTSERRAT 22481.2 20234.7 20894.1 21528.0 ST. KITTS AND NEVIS 18235.3 18016.3 18054.4 18311.8 SAINT LUCIA 11092.3 10492.2 10677.7 11113.8 ST. VINCENT AND THE GRENADINES 7612.0 8147.3 8684.0 9121.6
$US
COUNTRIES 2000 2001 2002 2003
CARIBBEAN COMMUNITY 4183.2 4281.9 4446.5 4674.8
The BAHAMAS 16069.6 16254.9 16748.9 17010.9
CARIBBEAN COMMON MARKET 3597.9 3690.6 3832.4 4052.3
MDC'S 3537.4 3642.7 3785.8 4016.5
BARBADOS 9856.2 9056.2 9003.1 9505.9
GUYANA 862.6 844.9 866.4 950.5
JAMAICA 2891.9 2933.2 3017.8 2824.6
SURINAME 1547.2 1175.6 1910.1 2198.9
TRINIDAD AND TOBAGO 5986.0 6577.3 6728.3 7774.9
LDC's 3997.0 4003.7 4134.5 4282.5 BELIZE 2876.3 2875.3 3181.1 3243.0
OECS 4495.7 4515.4 4579.1 4775.0
ANTIGUA AND BARBUDA 8585.1 8927.0 8865.3 9238.3
DOMINICA 3338.1 3442.2 3394.5 3468.7
GRENADA 3712.1 3465.6 3473.1 3685.5
MONTSERRAT 8326.4 7494.3 7738.6 7973.3
ST. KITTS AND NEVIS 6753.8 6672.7 6686.8 6782.2
SAINT LUCIA 4108.3 3886.0 3954.7 4116.2
ST. VINCENT AND THE GRENADINES 2819.2 3017.5 3216.3 3378.4
Table 1.12: Per Capita Gross National Income at Market Prices
Table 1.13: Per Capita Gross National Income at Market Prices
24


ANTIGUA AND BARBUDA
$EC Mn
Industry 2000 2001 2002 2003
TOTAL 1555.9 1579.8 1613.1 1702.5
AGRICULTURE 53.9 53.9 54.4 55.8
MINING & QUARRYING 29.3 29.9 30.5 32.2
MANUFACTURING 38.5 39.5 40.7 42.9
ELECTRICITY & WATER 60.0 61.0 63.6 61.9
CONSTRUCTION 208.4 216.8 224.3 239.4
WHOLESALE & RETAIL TRADE 149.3 146.3 142.3 145.8
HOTELS & RESTAURANTS 198.2 182.7 186.6 205.7
TRANSPORT 178.4 171.8 166.2 183.3
COMMUNICATIONS 167.8 176.3 177.1 181.7
BANKS & INSURANCE 167.0 157.1 175.4 179.8
REAL ESTATE & HOUSING 112.3 116.2 119.7 123.3
GOVERNMENT SERVICES 250.3 259.8 276.0 296.9
OTHER SERVICES 101.6 102.7 106.3 107.9
LESS: FISIM 159.3 134.2 150.1 154.1
Industry 2000 2001 2002 2003
TOTAL 3.3 1.5 2.1 5.5
AGRICULTURE 3.3 -0.1 1.0 2.5
MINING & QUARRYING 4.0 2.0 2.0 5.5
MANUFACTURING 3.0 2.5 3.2 5.3
ELECTRICITY & WATER 10.0 1.7 4.1 -2.7
CONSTRUCTION 6.5 4.0 3.5 6.7
W/SALE & RETAIL TRADE 4.3 -2.0 -2.8 2.4
HOTELS & RESTAURANTS -0.9 -7.8 2.1 10.2
TRANSPORT 4.6 -3.7 -3.3 10.3
COMMUNICATIONS -1.2 5.1 0.4 2.6
BANKS & INSURANCE 1.4 -5.9 11.7 2.5
REAL ESTATE & HOUSING 4.0 3.5 3.0 3.0
GOVERNMENT SERVICES 3.4 3.8 6.2 7.6
OTHER SERVICES 4.0 1.0 3.5 1.6
LESS: FISIM 1.1 -15.8 11.9 2.6
Table 2.1: Gross Value Added By Industry in Constant 2000 Basic Prices
Table 2.1A: Gross Value Added By Industry in Constant 2000 Basic Prices - Percentage Change
25

ANTIGUA AND BARBUDA
Fig 2.1: GVA by Industry in Constant 2000 Basic Prices - Percentage Change
-1.0
0.0
1.0
2.0
3.0
4.0
5.0
6.0
2000 2001 2002 2003
Perc
ent
TOTAL AGRICULTURE
MANUFACTURING SERVICES
26

ANTIGUA AND BARBUDA
Industry 2000 2001 2002 2003
TOTAL 100.0 100.0 100.0 100.0
AGRICULTURE 3.5 3.4 3.4 3.3
MINING & QUARRYING 1.9 1.9 1.9 1.9
MANUFACTURING 2.5 2.5 2.5 2.5
ELECTRICITY & WATER 3.9 3.9 3.9 3.6
CONSTRUCTION 13.4 13.7 13.9 14.1
W/SALE & RETAIL TRADE 9.6 9.3 8.8 8.6
HOTELS & RESTAURANTS 12.7 11.6 11.6 12.1
TRANSPORT 11.5 10.9 10.3 10.8
COMMUNICATIONS 10.8 11.2 11.0 10.7
BANKS & INSURANCE 10.7 9.9 10.9 10.6
REAL ESTATE & HOUSING 7.2 7.4 7.4 7.2
GOVERNMENT SERVICES 16.1 16.4 17.1 17.4
OTHER SERVICES 6.5 6.5 6.6 6.3
LESS: FISIM 10.2 8.5 9.3 9.1
Table 2.1B: Gross Value Added By Industry in Constant 2000 Basic Prices - Percentage Distribution
Fig. 2.2: GVA By Industry in Constant 2000 Basic Prices -Percentage
Distribution, 2000
13.4
12.7
11.5
10.816.1
35.5
CONSTRUCTION HOTELS & RESTAURANTS TRANSPORT COMMUNICATIONS GOVERNMENT SERVICESOTHER SECTORS
Fig. 2.3: GVA By Industry in Constant 2000 Basic Prices -Percentage
Distribution, 2003
14.1
12.1
10.8
10.717.4
35.0
CONSTRUCTION HOTELS & RESTAURANTS TRANSPORT COMMUNICATIONS GOVERNMENT SERVICESOTHER SECTORS
27

ANTIGUA AND BARBUDA
$EC Mn
Industry 2000 2001 2002 2003
TOTAL 1249.8 1269.0 1295.7 1367.6
AGRICULTURE 43.3 43.3 43.7 44.8
MINING & QUARRYING 23.6 24.0 24.5 25.9
MANUFACTURING 30.9 31.7 32.7 34.5
ELECTRICITY & WATER 48.2 49.0 51.1 49.7
CONSTRUCTION 167.4 174.1 180.2 192.3
W/SALE & RETAIL TRADE 120.0 117.6 114.3 117.1
HOTELS & RESTAURANTS 159.2 146.8 149.9 165.3
TRANSPORT 143.3 138.0 133.5 147.3
COMMUNICATIONS 134.8 141.6 142.2 145.9
BANKS & INSURANCE 134.1 126.2 140.9 144.5
REAL ESTATE & HOUSING 90.2 93.3 96.1 99.0
GOVERNMENT SERVICES 201.1 208.7 221.7 238.5
OTHER SERVICES 81.6 82.5 85.4 86.7
LESS: FISIM 128.0 107.8 120.6 123.8
$EC Mn
Industry 2000 2001 2002 2003
TOTAL 1555.9 1620.2 1653.3 1747.2
AGRICULTURE 61.1 61.6 62.6 65.2
MINING & QUARRYING 26.8 27.3 28.3 29.8
MANUFACTURING 35.2 36.7 37.9 40.1
ELECTRICITY & WATER 46.4 62.8 51.4 50.6
CONSTRUCTION 199.2 216.5 228.6 243.9
W/SALE & RETAIL TRADE 169.9 169.0 167.4 175.5
HOTELS & RESTAURANTS 178.6 164.6 157.3 173.4
TRANSPORT 188.7 189.3 193.1 207.8
COMMUNICATIONS 130.5 137.4 137.9 140.6
BANKS & INSURANCE 145.3 143.4 161.4 165.2
REAL ESTATE & HOUSING 108.7 115.3 120.6 126.7
GOVERNMENT SERVICES 271.5 281.8 299.4 322.0
OTHER SERVICES 118.1 119.3 124.8 126.7
LESS: FISIM 124.0 104.5 117.2 120.3
Table 2.3: Gross Valued Added By Industry in Current Basic Prices
Table 2.2: Gross Value Added By Industry in Constant 1990 Basic Prices
28

ANTIGUA AND BARBUDA
Fig 2.4: GVA in Current and Constant 1990 Basic Prices
0.0
200.0
400.0
600.0
800.0
1000.0
1200.0
1400.0
1600.0
1800.0
2000.0
2000 2001 2002 2003
$EC
Mn
CONSTANT 1990 BASIC PRICES CURRENT BASIC PRICES
29
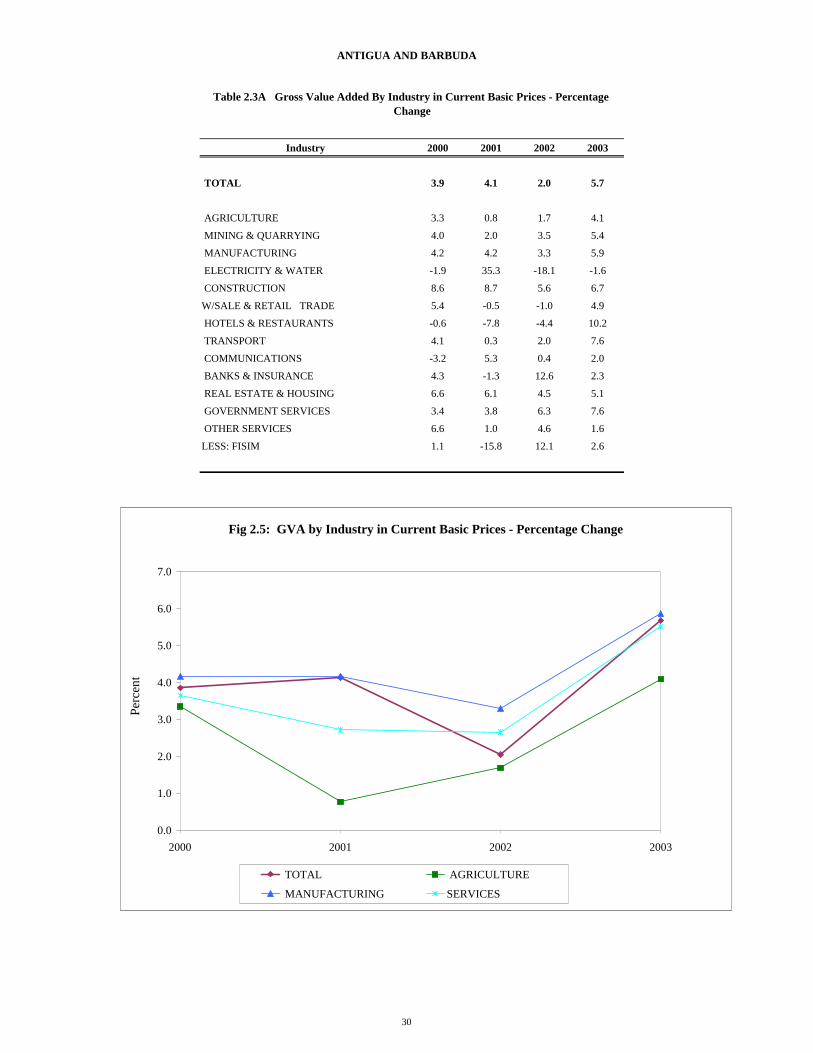
ANTIGUA AND BARBUDA
Industry 2000 2001 2002 2003
TOTAL 3.9 4.1 2.0 5.7
AGRICULTURE 3.3 0.8 1.7 4.1
MINING & QUARRYING 4.0 2.0 3.5 5.4
MANUFACTURING 4.2 4.2 3.3 5.9
ELECTRICITY & WATER -1.9 35.3 -18.1 -1.6
CONSTRUCTION 8.6 8.7 5.6 6.7
W/SALE & RETAIL TRADE 5.4 -0.5 -1.0 4.9
HOTELS & RESTAURANTS -0.6 -7.8 -4.4 10.2
TRANSPORT 4.1 0.3 2.0 7.6
COMMUNICATIONS -3.2 5.3 0.4 2.0
BANKS & INSURANCE 4.3 -1.3 12.6 2.3
REAL ESTATE & HOUSING 6.6 6.1 4.5 5.1
GOVERNMENT SERVICES 3.4 3.8 6.3 7.6
OTHER SERVICES 6.6 1.0 4.6 1.6
LESS: FISIM 1.1 -15.8 12.1 2.6
Table 2.3A Gross Value Added By Industry in Current Basic Prices - Percentage Change
Fig 2.5: GVA by Industry in Current Basic Prices - Percentage Change
0.0
1.0
2.0
3.0
4.0
5.0
6.0
7.0
2000 2001 2002 2003
Perc
ent
TOTAL AGRICULTURE
MANUFACTURING SERVICES
30

ANTIGUA AND BARBUDA
Industry 2000 2001 2002 2003
TOTAL 100.0 100.0 100.0 100.0
AGRICULTURE 3.9 3.8 3.8 3.7
MINING & QUARRYING 1.7 1.7 1.7 1.7
MANUFACTURING 2.3 2.3 2.3 2.3
ELECTRICITY & WATER 3.0 3.9 3.1 2.9
CONSTRUCTION 12.8 13.4 13.8 14.0
W/SALE & RETAIL TRADE 10.9 10.4 10.1 10.0
HOTELS & RESTAURANTS 11.5 10.2 9.5 9.9
TRANSPORT 12.1 11.7 11.7 11.9
COMMUNICATIONS 8.4 8.5 8.3 8.0
BANKS & INSURANCE 9.3 8.8 9.8 9.5
REAL ESTATE & HOUSING 7.0 7.1 7.3 7.2
GOVERNMENT SERVICES 17.5 17.4 18.1 18.4
OTHER SERVICES 7.6 7.4 7.5 7.3
LESS: FISIM 8.0 6.4 7.1 6.9
$EC Mn
EXPENDITURE GROUPS 2000 2001 2002 2003
GROSS DOMESTIC PRODUCT (Current Market Prices) 1796.3 1884.4 1939.8 2054.9
TOTAL CONSUMPTION 1016.6 1087.0 1149.3 1183.3
Private 616.7 651.9 644.8 657.5
General Government 399.9 435.0 504.5 525.7
GROSS CAPITAL FORMATION 862.4 937.2 989.4 1055.6
Gross Fixed Capital Formation 862.4 937.2 989.4 1055.6
Increase in Stocks - - - -
GOODS AND NON-FACTOR SERVICES -82.6 -139.8 -198.9 -183.9
Exports of Goods 134.2 104.3 120.9 129.4
Exports of Non-Factor Services 1124.3 1087.2 1058.0 1152.4
Imports of Goods 924.5 867.2 906.2 964.9
Imports of Non Factor Services 416.7 464.1 471.6 500.9
Table 2.4: Expenditure on Gross Domestic Product in Current Prices
Table 2.3B Gross Value Added By Industry in Current Basic Prices - Percentage Distribution
31

ANTIGUA AND BARBUDA
EXPENDITURE GROUPS 2000 2001 2002 2003
GROSS DOMESTIC PRODUCT (Current Market Prices) 100.0 100.0 100.0 100.0
TOTAL CONSUMPTION 56.6 57.7 59.2 57.6
Private 34.3 34.6 33.2 32.0
General Government 22.3 23.1 26.0 25.6
GROSS CAPITAL FORMATION 48.0 49.7 51.0 51.4
Gross Fixed Capital Formation 48.0 49.7 51.0 51.4
Increase in Stocks - - - -
GOODS AND NON-FACTOR SERVICES -4.6 -7.4 -10.3 -9.0
Exports of Goods 7.5 5.5 6.2 6.3
Exports of Non-Factor Services 62.6 57.7 54.5 56.1
Imports of Goods 51.5 46.0 46.7 47.0
Imports of Non Factor Services 23.2 24.6 24.3 24.4 71.3
Table 2.4A: Expenditure on Gross Domestic Product in Current Prices - Percentage Distribution
Fig 2.6: Expenditure on GDP in Current Prices - Percentage Distribution, 2000
34.3
22.3
48.0
62.6
PRIVATEGOVERNMENT CONSUMPTIONGROSS FIXED CAPITAL FORMATIONEXPORTS OF NON-FACTOR SERVICES
Fig 2.7: Expenditure on GDP in Current Prices - Percentage Distribution, 2003
32.0
25.6
51.4
56.1
PRIVATEGOVERNMENT CONSUMPTIONGROSS FIXED CAPITAL FORMATIONEXPORTS OF NON-FACTOR SERVICES
32


THE BAHAMAS
$EC MnIndustry 2000 2001 2002 2003
TOTAL 13510.0 13618.8 13928.4 14129.8
AGRICULTURE & FISHING 301.2 280.4 338.4 322.0
MINING & MANUFACTURING 737.8 819.7 834.6 850.4
ELECTRICITY & WATER 375.3 417.7 432.6 457.2
CONSTRUCTION 1402.1 1215.4 1291.2 1324.0
WHOLESALE & RETAIL TRADE 1932.9 1884.6 1854.0 1837.9
HOTELS & RESTAURANTS 1160.0 1358.9 1108.9 1215.9
T/PORT, STORAGE & COMM. 1366.8 1294.3 1343.2 1356.2
FINANCIAL INTERMEDIATION 1633.5 1810.1 1730.8 1708.8
REAL ESTATE, RENT & BUSINESS 2789.0 2748.2 2879.3 3074.3
PUBLIC ADMIN. & DEFENCE 462.9 462.0 549.3 654.6
EDUCATION 538.1 522.3 538.0 558.2
HEALTH 316.8 326.1 338.3 333.5
OTHER COM., SOC. & PERS. SERV. 932.8 864.0 849.9 942.1
DUMMY FINANCIAL CORPORATION (FISIM) -765.6 -742.6 -634.7 -797.7
OTHER INDIRECT TAXES1 -1682.9 -1713.3 -1618.4 -1650.9
NET INDIRECT TAXES 1791.2 1817.3 1703.7 1672.5
STATISTICAL DISCREPANCY 217.9 253.6 389.2 270.8
Industry 2000 2001 2002 2003
TOTAL 1.9 0.8 2.3 1.4
AGRICULTURE & FISHING 8.8 -6.9 20.7 -4.8
MINING & MANUFACTURING 8.2 11.1 1.8 1.9
ELECTRICITY & WATER 0.2 11.3 3.6 5.7
CONSTRUCTION 13.3 -13.3 6.2 2.5
WHOLESALE & RETAIL TRADE 4.1 -2.5 -1.6 -0.9
HOTELS & RESTAURANTS -13.8 17.1 -18.4 9.6
T/PORT, STORAGE & COMM. 10.4 -5.3 3.8 1.0
FINANCIAL INTERMEDIATION 10.1 10.8 -4.4 -1.3
REAL ESTATE, RENT & BUSINESS 2.8 -1.5 4.8 6.8
PUBLIC ADMIN. & DEFENCE -22.0 -0.2 18.9 19.2
EDUCATION -1.6 -2.9 3.0 3.7
HEALTH 1.2 3.0 3.7 -1.4
OTHER COM., SOC. & PERS. SERV. -4.4 -7.4 -1.6 10.8
DUMMY FINANCIAL CORPORATION (FISIM) 11.5 -3.0 -14.5 25.7
OTHER INDIRECT TAXES1 6.3 1.8 -5.5 2.0
NET INDIRECT TAXES 8.9 1.5 -6.3 -1.8
STATISTICAL DISCREPANCY -11.8 16.4 53.5 -30.4
Table 3.1: Gross Domestic Product By Industry in Constant 2000 Market Prices
Table 3.1A: Gross Domestic Product By Industry at Factor Cost in Constant 2000 Market Prices - Percentage Change
1 Refers to General Import Duties, Stamp Tax on Imports and Import Permit Taxes.
1 Refers to General Import Duties, Stamp Tax on Imports and Import Permit Taxes.
33

THE BAHAMAS
Fig 3.1: GDP by Industry in Constant 2000 Prices - Percentage Change
-20.0
-15.0
-10.0
-5.0
0.0
5.0
10.0
15.0
20.0
25.0
2000 2001 2002 2003
AGRICULTURE & FISHING MINING & MANUFACTURING
CONSTRUCTION SERVICES
34

THE BAHAMAS
Industry 2000 2001 2002 2003
TOTAL 100.0 100.0 100.0 100.0
AGRICULTURE & FISHING 2.2 2.1 2.4 2.3
MINING & MANUFACTURING 5.5 6.0 6.0 6.0
ELECTRICITY & WATER 2.8 3.1 3.1 3.2
CONSTRUCTION 10.4 8.9 9.3 9.4
WHOLESALE & RETAIL TRADE 14.3 13.8 13.3 13.0
HOTELS & RESTAURANTS 8.6 10.0 8.0 8.6
T/PORT, STORAGE & COMM. 10.1 9.5 9.6 9.6
FINANCIAL INTERMEDIATION 12.1 13.3 12.4 12.1
REAL ESTATE, RENT & BUSINESS 20.6 20.2 20.7 21.8
PUBLIC ADMIN. & DEFENCE 3.4 3.4 3.9 4.6
EDUCATION 4.0 3.8 3.9 4.0
HEALTH 2.3 2.4 2.4 2.4
OTHER COM., SOC. & PERS. SERV. 6.9 6.3 6.1 6.7
DUMMY FINANCIAL CORPORATION (FISIM) -5.7 -5.5 -4.6 -5.6
OTHER INDIRECT TAXES1 -12.5 -12.6 -11.6 -11.7
NET INDIRECT TAXES 13.3 13.3 12.2 11.8
STATISTICAL DISCREPANCY 1.6 1.9 2.8 1.9
Table 3.1B: Gross Domestic Product By Industry in Constant 2000 Market Prices - Percentage Distribution
1 Refers to General Import Duties, Stamp Tax on Imports and Import Permit Taxes.
Fig 3.2: GDP by Industry at Factor Cost in Constant 2000 Prices - Percentage
Distribution, 2000
10.4
14.3
10.1
12.1
20.6
32.5
CONSTRUCTION
WHOLESALE & RETAIL TRADE
T/PORT, STORAGE & COMM.
FINANCIAL INTERMEDIATION
REAL ESTATE, RENT & BUSINESS
OTHER
Fig 3.3: GDP by Industry at Factor Cost in Constant 2000 Prices - Percentage
Distribution, 2003
9.4
13.0
9.6
12.121.8
34.1
CONSTRUCTION
WHOLESALE & RETAIL TRADE
T/PORT, STORAGE & COMM.
FINANCIAL INTERMEDIATION
REAL ESTATE, RENT & BUSINESS
OTHER
35

THE BAHAMAS
$BH MnIndustry 2000 2001 2002 2003
TOTAL 4002.1 4034.4 4126.1 4185.7
AGRICULTURE & FISHING 89.2 83.1 100.2 95.4
MINING & MANUFACTURING 218.6 242.8 247.2 251.9
ELECTRICITY & WATER 111.2 123.7 128.2 135.4
CONSTRUCTION 415.4 360.0 382.5 392.2
WHOLESALE & RETAIL TRADE 572.6 558.3 549.2 544.4
HOTELS & RESTAURANTS 343.6 402.6 328.5 360.2
T/PORT, STORAGE & COMM. 404.9 383.4 397.9 401.7
FINANCIAL INTERMEDIATION 483.9 536.2 512.7 506.2
REAL ESTATE, RENT & BUSINESS 826.2 814.1 852.9 910.7
PUBLIC ADMIN. & DEFENCE 137.1 136.9 162.7 193.9
EDUCATION 159.4 154.7 159.4 165.3
HEALTH 93.8 96.6 100.2 98.8
OTHER COM., SOC. & PERS. SERV. 276.3 255.9 251.8 279.1
DUMMY FINANCIAL CORPORATION (FISIM) -226.8 -220.0 -188.0 -236.3
OTHER INDIRECT TAXES1 -498.5 -507.5 -479.4 -489.0
NET INDIRECT TAXES 530.6 538.4 504.7 495.4
STATISTICAL DISCREPANCY 64.6 75.1 115.3 80.2
$Bh MnIndustry 2000 2001 2002 2003
TOTAL 5003.7 5131.5 5400.1 5502.2
AGRICULTURE & FISHING 119.9 109.8 145.9 151.8
MINING & MANUFACTURING 246.1 276.2 302.7 291.0
ELECTRICITY & WATER 175.1 158.8 172.2 199.6
CONSTRUCTION 425.1 380.8 399.5 393.5
WHOLESALE & RETAIL TRADE 627.2 627.4 673.6 730.7
HOTELS & RESTAURANTS 522.4 558.2 565.4 541.0
T/PORT, STORAGE & COMM. 419.6 458.5 511.6 504.2
FINANCIAL INTERMEDIATION 601.5 677.6 700.0 646.0
REAL ESTATE, RENT & BUSINESS 962.6 958.3 944.1 1024.5
PUBLIC ADMIN. & DEFENCE 282.7 293.1 314.2 328.5
EDUCATION 220.5 229.8 243.6 256.9
HEALTH 149.4 157.5 168.6 177.1
OTHER COM., SOC. & PERS. SERV. 344.8 327.6 325.9 359.1
DUMMY FINANCIAL CORPORATION (FISIM) -282.2 -277.8 -244.0 -246.0
OTHER INDIRECT TAXES1 -522.8 -538.2 -596.6 -557.7
NET INDIRECT TAXES 556.4 570.9 622.9 582.3
STATISTICAL DISCREPANCY 155.4 163.0 150.5 120.0
1 Refers to General Import Duties, Stamp Tax on Imports and Import Permit Taxes.
1 Refers to General Import Duties, Stamp Tax on Imports and Import Permit Taxes.
Table 3.3: Gross Domestic Product By Industry in Current Market Prices
Table 3.2: Gross Domestic Product By Industry in Constant 1991 Market Prices
36

THE BAHAMAS
Fig 3.4: Gross Domestic Product in Current and Constant 1991 Market Prices
0
1000
2000
3000
4000
5000
6000
2000 2001 2002 2003
$BH
Mn
CONSTANT 1991 PRICES CURRENT MARKET PRICES
37

THE BAHAMAS
Industry 2000 2001 2002 2003
TOTAL 6.4 2.6 5.2 1.9
AGRICULTURE & FISHING 14.4 -8.4 32.8 4.1
MINING & MANUFACTURING -2.5 12.2 9.6 -3.9
ELECTRICITY & WATER 11.1 -9.3 8.4 15.9
CONSTRUCTION 12.6 -10.4 4.9 -1.5
WHOLESALE & RETAIL TRADE 6.0 0.0 7.4 8.5
HOTELS & RESTAURANTS 5.0 6.9 1.3 -4.3
T/PORT, STORAGE & COMM. 19.9 9.3 11.6 -1.5
FINANCIAL INTERMEDIATION 15.9 12.7 3.3 -7.7
REAL ESTATE, RENT & BUSINESS 4.9 -0.5 -1.5 8.5
PUBLIC ADMIN. & DEFENCE 2.5 3.7 7.2 4.6
EDUCATION 6.0 4.2 6.0 5.5
HEALTH 6.9 5.4 7.0 5.0
OTHER COM., SOC. & PERS. SERV. 1.1 -5.0 -0.5 10.2
DUMMY FINANCIAL CORPORATION (FISIM) 16.4 -1.5 -12.2 0.9
OTHER INDIRECT TAXES1 9.2 3.0 10.8 -6.5
NET INDIRECT TAXES 11.9 2.6 9.1 -6.5
STATISTICAL DISCREPANCY -20.4 4.9 -7.7 -20.3
1 Refers to General Import Duties, Stamp Tax on Imports and Import Permit Taxes.
Table 3.3A: Gross Domestic Product By Industry in Current Market Prices - Percentage Change
Fig 3.5: Gross Domestic Product by Industry in Current Market Prices - Percentage Change (Based on $BH Mn)
-15.0
-10.0
-5.0
0.0
5.0
10.0
15.0
20.0
25.0
30.0
35.0
2000 2001 2002 2003
Perc
ent
TOTAL AGRICULTURE & FISHING MINING & MANUFACTURING SERVICES
38

THE BAHAMAS
$EC MnIndustry 2000 2001 2002 2003
TOTAL 13510.0 13854.9 14580.2 14855.9
AGRICULTURE & FISHING 323.8 296.5 393.8 409.9
MINING & MANUFACTURING 664.5 745.8 817.3 785.6
ELECTRICITY & WATER 472.7 428.8 465.0 538.9
CONSTRUCTION 1147.9 1028.2 1078.6 1062.5
WHOLESALE & RETAIL TRADE 1693.3 1694.1 1818.8 1972.8
HOTELS & RESTAURANTS 1410.4 1507.1 1526.6 1460.6
T/PORT, STORAGE & COMM. 1133.0 1238.0 1381.4 1361.2
FINANCIAL INTERMEDIATION 1623.9 1829.6 1890.0 1744.2
REAL ESTATE, RENT & BUSINESS 2599.0 2587.3 2549.0 2766.1
PUBLIC ADMIN. & DEFENCE 763.4 791.4 848.3 887.0
EDUCATION 595.3 620.3 657.6 693.7
HEALTH 403.3 425.2 455.2 478.0
OTHER COM., SOC. & PERS. SERV. 930.8 884.6 879.8 969.5
DUMMY FINANCIAL CORPORATION (FISIM) -761.8 -750.2 -658.7 -664.3
OTHER INDIRECT TAXES1 -1411.5 -1453.3 -1610.7 -1505.8
NET INDIRECT TAXES 1502.3 1541.6 1681.8 1572.1
STATISTICAL DISCREPANCY 419.6 440.0 406.3 323.9
Industry 2000 2001 2002 2003
TOTAL 100.0 100.0 100.0 100.0
AGRICULTURE & FISHING 2.4 2.1 2.7 2.8
MINING & MANUFACTURING 4.9 5.4 5.6 5.3
ELECTRICITY & WATER 3.5 3.1 3.2 3.6
CONSTRUCTION 8.5 7.4 7.4 7.2
WHOLESALE & RETAIL TRADE 12.5 12.2 12.5 13.3
HOTELS & RESTAURANTS 10.4 10.9 10.5 9.8
T/PORT, STORAGE & COMM. 8.4 8.9 9.5 9.2
FINANCIAL INTERMEDIATION 12.0 13.2 13.0 11.7
REAL ESTATE, RENT & BUSINESS 19.2 18.7 17.5 18.6
PUBLIC ADMIN. & DEFENCE 5.7 5.7 5.8 6.0
EDUCATION 4.4 4.5 4.5 4.7
HEALTH 3.0 3.1 3.1 3.2
OTHER COM., SOC. & PERS. SERV. 6.9 6.4 6.0 6.5
DUMMY FINANCIAL CORPORATION (FISIM) -5.6 -5.4 -4.5 -4.5
OTHER INDIRECT TAXES1 -10.4 -10.5 -11.0 -10.1
NET INDIRECT TAXES 11.1 11.1 11.5 10.6
STATISTICAL DISCREPANCY 3.1 3.2 2.8 2.2
1 Refers to General Import Duties, Stamp Tax on Imports and Import Permit Taxes.
Table 3.4: Gross Domestic Product By Industry in Current Market Prices
Table 3.4A: Gross Domestic Product By Industry in Current Market Prices- Percentage Distribution
1 Refers to General Import Duties, Stamp Tax on Imports and Import Permit Taxes.
39

THE BAHAMAS
$EC MnEXPENDITURE GROUPS 2000 2001 2002 2003
GROSS DOMESTIC PRODUCT (Current Market Prices) 13510.0 13854.9 14580.2 14855.9
TOTAL CONSUMPTION 10908.4 11748.9 11771.3 12281.8
Private 1837.0 1972.1 2080.0 2119.5
General Government 9071.3 9776.8 9691.3 10162.3
GROSS CAPITAL FORMATION 5211.0 4805.8 4543.3 4677.6
Gross Fixed Capital Formation 4669.2 4330.0 4174.6 4293.2
Increase in Stocks 541.8 475.8 368.7 384.4
GOODS AND NON-FACTOR SERVICES -2189.8 -2259.8 -1328.2 -1779.6
Exports of Goods and Services 6375.0 5841.4 6401.0 6269.8
Imports of Goods and Services 8564.8 8101.2 7729.2 8049.4
Statistical discrepancy -419.6 -440.0 -406.3 -323.9
EXPENDITURE GROUPS 2000 2001 2002 2003
GROSS DOMESTIC PRODUCT (Current Market Prices) 100.0 100.0 100.0 100.0
TOTAL CONSUMPTION 80.7 84.8 80.7 82.7
Private 13.6 14.2 14.3 14.3
General Government 67.1 70.6 66.5 68.4
GROSS CAPITAL FORMATION 38.6 34.7 31.2 31.5
Gross Fixed Capital Formation 34.6 31.3 28.6 28.9
Increase in Stocks 4.0 3.4 2.5 2.6
GOODS AND NON-FACTOR SERVICES -16.2 -16.3 -9.1 -12.0
Exports of Goods and Services 47.2 42.2 43.9 42.2
Imports of Goods and Services 63.4 58.5 53.0 54.2
Statistical discrepancy -3.1 -3.2 -2.8 -2.2
Table 3.5: Expenditure on Gross Domestic Product in Current Prices
Table 3.5A: Expenditure on Gross Domestic Product in Current Prices - Percentage Distribution
40

THE BAHAMAS
$BH MnEXPENDITURE GROUPS 2000 2001 2002 2003
GROSS DOMESTIC PRODUCT (Current Market Prices) 5003.7 5131.5 5400.1 5502.2
TOTAL CONSUMPTION 4040.1 4351.4 4359.7 4548.8
Private 680.4 730.4 770.4 785.0
General Government 3359.8 3621.0 3589.4 3763.8
GROSS CAPITAL FORMATION 1930.0 1779.9 1682.7 1732.4
Gross Fixed Capital Formation 1729.3 1603.7 1546.1 1590.1
Increase in Stocks 200.7 176.2 136.6 142.4
GOODS AND NON-FACTOR SERVICES -811.0 -836.9 -491.9 -659.1
Exports of Goods and Services 2361.1 2163.5 2370.7 2322.1
Imports of Goods and Services 3172.1 3000.4 2862.7 2981.3
Statistical discrepancy -155.4 -163.0 -150.5 -120.0
Table 3.6: Expenditure on Gross Domestic Product in Current Prices
Fig 3.6: Expenditure on GDP in Current Prices - Percentage Distribution, 2000
13.6
67.1
38.6
-16.2
PRIVATEGOVERNMENTGROSS CAPITAL FORMATIONGOODS AND NON-FACTOR SERVICES
Fig 3.7: Expenditure on GDP in Current Prices - Percentage Distribution, 2003
14.3
68.4
31.5
-12.0
PRIVATEGOVERNMENTGROSS CAPITAL FORMATIONGOODS AND NON-FACTOR SERVICES
41


BARBADOS
$EC Mn
Industry 2000 2001 2002 2003
TOTAL 5792.9 5628.6 5605.6 5655.1
AGRICULTURE 352.7 319.3 306.0 288.7
MINING & QUARRYING 50.1 43.8 40.9 37.5
MANUFACTURING 508.9 467.4 468.5 465.1
ELECTRICITY, GAS & WATER 217.3 225.3 229.4 235.7
CONSTRUCTION 428.2 409.2 421.8 434.5
WHOLESALE & RETAIL TRADE 1153.7 1109.9 1111.1 1101.9
TOURISM 877.7 826.4 807.4 889.2
TRANSPORT, STORAGE & COMM. 468.5 478.9 470.3 470.8
BUSINESS & GENERAL SERVICES 961.2 966.4 946.3 937.0
GOVERNMENT SERVICES 774.5 782.0 803.9 794.7
Industry 2000 2001 2002 2003
TOTAL 3.4 -2.8 -0.4 0.9
AGRICULTURE 3.7 -9.5 -4.2 -5.6
MINING & QUARRYING -8.4 -12.6 -6.6 -8.5
MANUFACTURING -0.5 -8.2 0.2 -0.7
ELECTRICITY, GAS & WATER 0.0 3.7 1.8 2.8
CONSTRUCTION 2.6 -4.4 3.1 3.0
WHOLESALE & RETAIL TRADE 4.4 -3.8 0.1 -0.8
TOURISM 7.7 -5.8 -2.3 10.1
TRANSPORT, STORAGE & COMM. 2.1 2.2 -1.8 0.1
BUSINESS & GENERAL SERVICES 3.2 0.5 -2.1 -1.0
GOVERNMENT SERVICES 2.8 1.0 2.8 -1.1
Table 4.1: Gross Domestic Product By Industry in Constant 2000 Basic Prices
Table 4.1A:Gross Domestic Product By Industry in Constant 2000 Basic Prices - Percentage Change
43
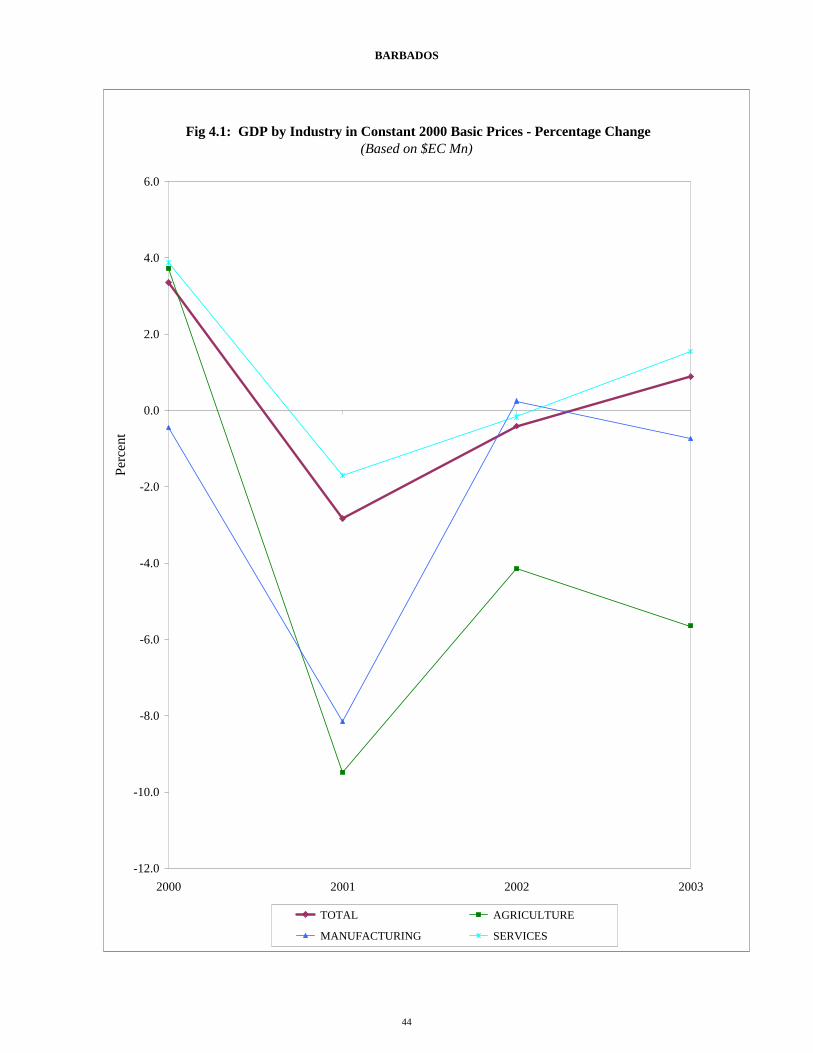
BARBADOS
Fig 4.1: GDP by Industry in Constant 2000 Basic Prices - Percentage Change (Based on $EC Mn)
-12.0
-10.0
-8.0
-6.0
-4.0
-2.0
0.0
2.0
4.0
6.0
2000 2001 2002 2003
Perc
ent
TOTAL AGRICULTURE
MANUFACTURING SERVICES
44

BARBADOS
Industry 2000 2001 2002 2003
TOTAL 100.0 100.0 100.0 100.0
AGRICULTURE 6.1 5.7 5.5 5.1
MINING & QUARRYING 0.9 0.8 0.7 0.7
MANUFACTURING 8.8 8.3 8.4 8.2
ELECTRICITY, GAS & WATER 3.8 4.0 4.1 4.2
CONSTRUCTION 7.4 7.3 7.5 7.7
WHOLESALE & RETAIL TRADE 19.9 19.7 19.8 19.5
TOURISM 15.2 14.7 14.4 15.7
TRANSPORT, STORAGE & COMM. 8.1 8.5 8.4 8.3
BUSINESS & GENERAL SERVICES 16.6 17.2 16.9 16.6
GOVERNMENT SERVICES 13.4 13.9 14.3 14.1
Table 4.1B: Gross Domestic Product By Industry in Constant 2000 Basic Prices - Percentage Distribution
Fig 4.2: GDP by Industry in Constant 2000 Basic Prices - Percentage Distribution, 2000
8.8
19.9
15.2 16.6
13.4
26.1
MANUFACTURING WHOLESALE & RETAIL TRADE TOURISM BUSINESS & GENERAL SERVICES GOVERNMENT SERVICESOTHER
Fig 4.3: GDP by Industry in Constant 2000 Basic Prices - Percentage
Distribution, 2003
19.5
15.7
8.3 16.6
14.1
25.8
WHOLESALE & RETAIL TRADE TOURISM TRANSPORT, STORAGE & COMM. BUSINESS & GENERAL SERVICES GOVERNMENT SERVICESOTHER
45

BARBADOS
$BD MnIndustry 2000 2001 2002 2003
TOTAL 1005.2 976.7 972.7 981.3
AGRICULTURE 61.2 55.4 53.1 50.1
MINING & QUARRYING 8.7 7.6 7.1 6.5
MANUFACTURING 88.3 81.1 81.3 80.7
ELECTRICITY, GAS & WATER 37.7 39.1 39.8 40.9
CONSTRUCTION 74.3 71.0 73.2 75.4
WHOLESALE & RETAIL TRADE 200.2 192.6 192.8 191.2
TOURISM 152.3 143.4 140.1 154.3
TRANSPORT, STORAGE & COMM. 81.3 83.1 81.6 81.7
BUSINESS & GENERAL SERVICES 166.8 167.7 164.2 162.6
GOVERNMENT SERVICES 134.4 135.7 139.5 137.9
$BD MnIndustry 2000 2001 2002 2003
TOTAL 4291.0 4264.5 4310.3 4357.7
AGRICULTURE: 190.0 201.9 170.4 193.5
MINING AND QUARRYING 31.4 27.6 29.5 31.0
MANUFACTURING 268.8 256.4 263.1 292.7
ELECTRICITY, GAS AND WATER 140.7 137.2 142.6 146.5
CONSTRUCTION 249.1 222.0 226.4 232.5
WHOLESALE AND RETAIL TRADE 757.1 697.9 748.5 738.6
TOURISM 488.0 471.1 444.4 512.4
TRANSPORT, STORAGE & COMM. 442.8 467.2 476.3 289.2
BUSINESS & GENERAL SERVICES 973.5 1009.0 1005.8 1140.9
GOVERNMENT SERVICES 749.6 774.2 803.3 780.5
Table 4.3: Gross Domestic Product By Industry in Current Basic Prices
Table 4.2: Gross Domestic Product By Industry in Constant 1974 Basic Prices
46
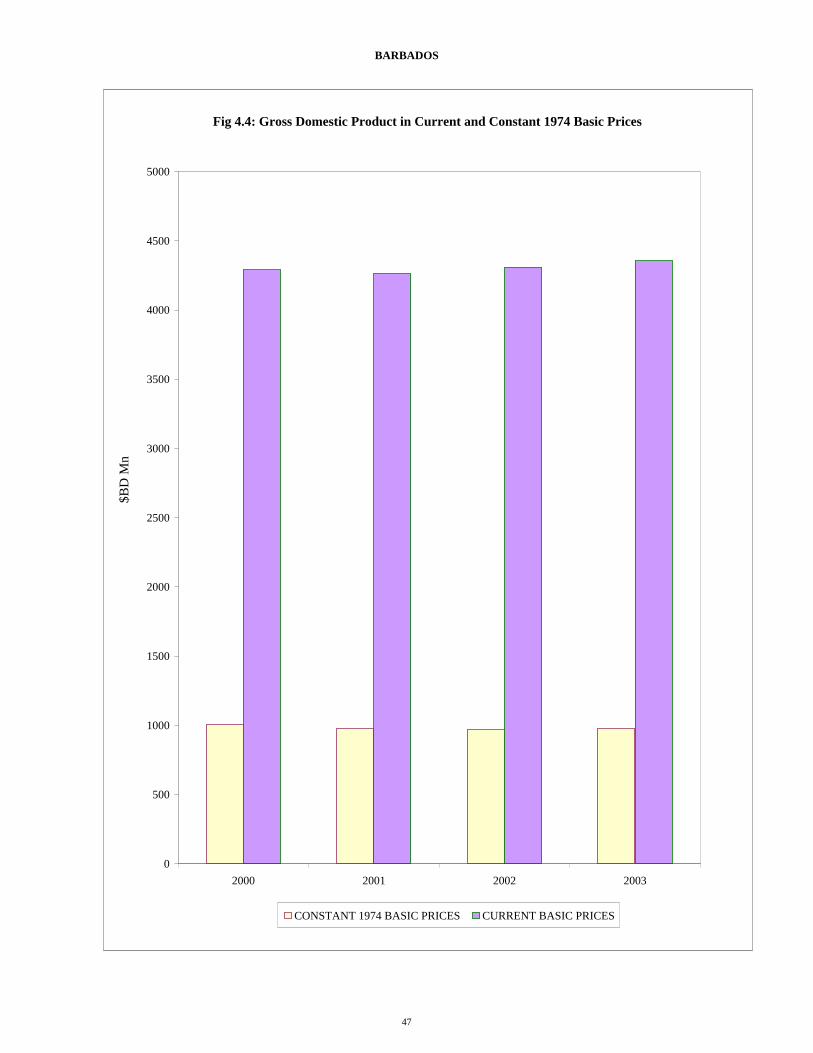
BARBADOS
Fig 4.4: Gross Domestic Product in Current and Constant 1974 Basic Prices
0
500
1000
1500
2000
2500
3000
3500
4000
4500
5000
2000 2001 2002 2003
$BD
Mn
CONSTANT 1974 BASIC PRICES CURRENT BASIC PRICES
47

BARBADOS
Industry 2000 2001 2002 2003
TOTAL 3.7 -0.6 1.1 1.1
AGRICULTURE -6.1 6.3 -15.6 13.6
MINING AND QUARRYING 12.9 -12.1 6.9 5.2
MANUFACTURING 3.1 -4.6 2.6 11.3
ELECTRICITY, GAS AND WATER 9.8 -2.5 3.9 2.7
CONSTRUCTION 3.0 -10.9 2.0 2.7
WHOLESALE AND RETAIL TRADE 1.2 -7.8 7.3 -1.3
TOURISM 6.8 -3.5 -5.7 15.3
TRANSPORT, STORAGE & COMM. 3.2 5.5 1.9 -39.3
BUSINESS & GENERAL SERVICES 4.7 3.6 -0.3 13.4
GOVERNMENT SERVICES 5.1 3.3 3.8 -2.8
Table 4.3A: Gross Domestic Product By Industry in Current Basic Prices - Percentage Change
Fig 4.5: Gross Domestic Product by Industry in Current Basic Prices - Percentage Change (Based on $BD Mn)
-20.0
-15.0
-10.0
-5.0
0.0
5.0
10.0
15.0
20.0
2000 2001 2002 2003
Perc
ent
TOTAL AGRICULTUREMANUFACTURING SERVICES
48

BARBADOS
$EC Mn Industry 2000 2001 2002 2003
TOTAL 5792.9 5757.1 5818.9 5882.9
AGRICULTURE 256.5 272.6 230.0 261.2
MINING AND QUARRYING 42.4 37.3 39.8 41.9
MANUFACTURING 362.9 346.1 355.2 395.2
ELECTRICITY, GAS AND WATER 189.9 185.2 192.5 197.7
CONSTRUCTION 336.3 299.7 305.6 313.8
WHOLESALE AND RETAIL TRADE 1022.1 942.2 1010.5 997.1
TOURISM 658.8 636.0 599.9 691.7
TRANSPORT, STORAGE & COMM. 597.8 630.7 643.0 390.4
BUSINESS & GENERAL SERVICES 1314.2 1362.2 1357.8 1540.2
GOVERNMENT SERVICES 1012.0 1045.2 1084.5 1053.7
Industry 2000 2001 2002 2003
TOTAL 100.0 100.0 100.0 100.0
AGRICULTURE 4.4 4.7 4.0 4.4
MINING & QUARRYING 0.7 0.6 0.7 0.7
MANUFACTURING 6.3 6.0 6.1 6.7
ELECTRICITY, GAS & WATER 3.3 3.2 3.3 3.4
CONSTRUCTION 5.8 5.2 5.3 5.3
WHOLESALE & RETAIL TRADE 17.6 16.4 17.4 16.9
TOURISM 11.4 11.0 10.3 11.8
TRANSPORT, STORAGE & COMM. 10.3 11.0 11.1 6.6
BUSINESS & GENERAL SERVICES 22.7 23.7 23.3 26.2
GOVERNMENT SERVICES 17.5 18.2 18.6 17.9
Table 4.4A: Gross Domestic Product By Industry in Current Basic Prices - Percentage Distribution
Table 4.4: Gross Domestic Product By Industry in Current Basic Prices
49

BARBADOS
$EC Mn EXPENDITURE GROUPS 2000 2001 2002 2003
GROSS DOMESTIC PRODUCT (Current Market Prices) 6908.9 6874.1 6782.0 7280.6
TOTAL CONSUMPTION 6084.6 5957.1 6005.1 6509.2
Private 4620.8 4414.6 4360.0 4734.0
General Government 1463.8 1542.5 1645.1 1775.1
GROSS CAPITAL FORMATION 1278.3 1112.1 1127.8 1228.5
Public Building Activity 151.6 160.0 227.7 158.1
Private Building Activity 630.5 537.0 482.9 571.7
Finished Capital Goods 486.3 435.4 417.7 499.2
Stock of Finished Goods 10.0 -20.3 -0.5 -0.5
GOODS AND NON-FACTOR SERVICES -454.0 -195.2 -350.9 -457.1
Exports of Goods and Services 3486.9 3497.4 3347.5 3651.3
LESS: Imports of Goods and Services 3940.9 3692.7 3698.3 4108.5
EXPENDITURE GROUPS 2000 2001 2002 2003
GROSS DOMESTIC PRODUCT (Current Market Prices) 100.0 100.0 100.0 100.0
TOTAL CONSUMPTION 88.1 86.7 88.5 89.4
Private 66.9 64.2 64.3 65.0
General Government 21.2 22.4 24.3 24.4
GROSS CAPITAL FORMATION 18.5 16.2 16.6 16.9
Public Building Activity 2.2 2.3 3.4 2.2
Private Building Activity 9.1 7.8 7.1 7.9
Finished Capital Goods 7.0 6.3 6.2 6.9
Stock of Finished Goods 0.1 -0.3 0.0 0.0
GOODS AND NON-FACTOR SERVICES -6.6 -2.8 -5.2 -6.3
Exports of Goods and Services 50.5 50.9 49.4 50.2
LESS: Imports of Goods and Services 57.0 53.7 54.5 56.4
Table 4.5A: Expenditure on Gross Domestic Product in Current Prices - Percentage Distribution
Table 4.5: Expenditure on Gross Domestic Product in Current Prices
50

BARBADOS
$BD MnEXPENDITURE GROUPS 2000 2001 2002 2003
GROSS DOMESTIC PRODUCT (Current Market Prices) 5117.7 5091.9 5023.7 5393.0
TOTAL CONSUMPTION 4507.1 4412.7 4448.2 4821.6
Private 3422.8 3270.1 3229.6 3506.7
General Government 1084.3 1142.6 1218.6 1314.9
GROSS CAPITAL FORMATION 946.9 823.8 835.4 910.0
Public Building Activity 112.3 118.5 168.7 117.1
Private Building Activity 467.0 397.8 357.7 423.5
Finished Capital Goods 360.2 322.5 309.4 369.8
Stock of Finished Goods 7.4 -15.0 -0.4 -0.4
GOODS AND NON-FACTOR SERVICES -336.3 -144.6 -259.9 -338.6
Exports of Goods and Services 2582.9 2590.7 2479.6 2704.7
LESS: Imports of Goods and Services 2919.2 2735.3 2739.5 3043.3
Table 4.6: Expenditure on Gross Domestic Product in Current Prices
Fig 4.6: Expenditure on GDP in Current Prices - Percentage Distribution, 2000
66.921.2
18.5
-6.6
PRIVATE
GOVERNMENT
GROSS CAPITAL FORMATION
GOODS AND NON-FACTOR SERVICES
Fig 4.7: Expenditure on GDP in Current Prices - Percentage
Distribution, 2003
65.024.4
16.9
-6.3
PRIVATE
GOVERNMENT
GROSS CAPITAL FORMATION
GOODS AND NON-FACTOR SERVICES
51


BELIZE
EC$Mn
Industry 2000 2001 2002 2003
TOTAL 1964.3 2046.8 2136.3 2338.0
AGRICULTURE 239.3 233.3 239.9 276.9
FORESTRY & LOGGING 10.7 12.4 14.6 13.8
FISHING 84.0 87.2 81.4 171.7
MINING 12.2 12.6 11.9 12.7
MANUFACTURING 215.0 213.4 216.7 223.4
ELECTRICITY & WATER 76.5 76.7 78.6 80.2
CONSTRUCTION 111.8 109.9 115.6 100.6
TRADE, HOTELS & RESTAURANTS 444.5 483.0 501.0 528.1
TRANSPORT & COMMUNICATIONS 190.5 212.8 236.7 242.6
FINANCE & INSURANCE 145.4 151.3 176.4 194.3
REAL ESTATE & BUS. SERVICES 132.6 149.7 164.2 177.4
PUBLIC ADMINISTRATION 222.8 235.7 242.0 254.4
COMMUNITY & OTHER SERVICES 136.0 138.0 140.3 143.6LESS: FINANCIAL SERVICES INDIRECTLY MEASURED 56.8 69.4 82.9 81.7
Industry 2000 2001 2002 2003
TOTAL 13.0 4.2 4.4 9.4
AGRICULTURE 9.6 -2.5 2.9 15.4
FORESTRY & LOGGING -27.3 16.6 17.7 -5.9
FISHING 24.5 3.8 -6.7 111.0
MINING 23.7 3.4 -5.7 6.9
MANUFACTURING 24.2 -0.7 1.5 3.1
ELECTRICITY & WATER 9.8 0.3 2.4 2.1
CONSTRUCTION 39.0 -1.7 5.2 -13.0
TRADE, HOTELS & RESTAURANTS 11.8 8.7 3.7 5.4
TRANSPORT & COMMUNICATIONS 12.6 11.7 11.2 2.5
FINANCE & INSURANCE 35.1 4.1 16.6 10.1
REAL ESTATE & BUS. SERVICES -2.9 12.9 9.6 8.1
PUBLIC ADMINISTRATION 6.4 5.8 2.7 5.1
COMMUNITY & OTHER SERVICES 1.6 1.5 1.7 2.4LESS: FINANCIAL SERVICES INDIRECTLY MEASURED 16.2 22.1 19.5 -1.5
Table 5.1A: Gross Domestic Product By Industry in Constant 2000 Basic Prices- Percentage Change
Table 5.1A: Gross Domestic Product By Industry in Constant 2000 Basic Prices
53

BELIZE
Fig 5.1: GDP by Industry in Constant 2000 Basic Prices - Percentage Change
-5.0
0.0
5.0
10.0
15.0
20.0
25.0
30.0
2000 2001 2002 2003
Perc
ent
TOTAL AGRICULTURE
MANUFACTURING SERVICES
54

BELIZE
Industry 2000 2001 2002 2003
TOTAL 100.0 100.0 100.0 100.0
AGRICULTURE 12.2 11.4 11.2 11.8
FORESTRY & LOGGING 0.5 0.6 0.7 0.6
FISHING 4.3 4.3 3.8 7.3
MINING 0.6 0.6 0.6 0.5
MANUFACTURING 10.9 10.4 10.1 9.6
ELECTRICITY & WATER 3.9 3.7 3.7 3.4
CONSTRUCTION 5.7 5.4 5.4 4.3
TRADE, HOTELS & RESTAURANTS 22.6 23.6 23.5 22.6
TRANSPORT & COMMUNICATIONS 9.7 10.4 11.1 10.4
FINANCE & INSURANCE 7.4 7.4 8.3 8.3
REAL ESTATE & BUS. SERVICES 6.7 7.3 7.7 7.6
PUBLIC ADMINISTRATION 11.3 11.5 11.3 10.9
COMMUNITY & OTHER SERVICES 6.9 6.7 6.6 6.1LESS: FINANCIAL SERVICES INDIRECTLY MEASURED 2.9 3.4 3.9 3.5
Table 5.1B: Gross Domestic Product By Industry in Constant 2000 Basic Prices - Percentage Distribution
Fig 5.2: GDP By Industry in Constant 2000 Basic Prices - Percentage Distribution, 2000
12.2
10.9
22.6
9.7
11.3
33.3
AGRICULTURE MANUFACTURING TRADE, HOTELS & RESTAURANTS TRANSPORT & COMMUNICATIONS PUBLIC ADMINISTRATIONOTHER
Fig 5.3: GDP By Industry in Constant 2000 Basic Prices - Percentage Distribution, 2003
11.8
9.6
22.6
10.4
10.9
34.7
AGRICULTURE MANUFACTURING TRADE, HOTELS & RESTAURANTS TRANSPORT & COMMUNICATIONS PUBLIC ADMINISTRATIONOTHER
55

BELIZE
$BZ MnIndustry 2000 2001 2002 2003
TOTAL 1455.0 1516.2 1582.4 1731.8
AGRICULTURE 177.3 172.8 177.7 205.1
FORESTRY & LOGGING 7.9 9.2 10.8 10.2
FISHING 62.2 64.6 60.3 127.2
MINING 9.0 9.3 8.8 9.4
MANUFACTURING 159.2 158.1 160.5 165.5
ELECTRICITY & WATER 56.7 56.9 58.2 59.4
CONSTRUCTION 82.8 81.4 85.6 74.5
TRADE, HOTELS & RESTAURANTS 329.3 357.8 371.1 391.2
TRANSPORT & COMMUNICATIONS 141.1 157.6 175.3 179.7
FINANCE & INSURANCE 107.7 112.1 130.7 143.9
REAL ESTATE & BUS. SERVICES 98.2 110.9 121.6 131.4
PUBLIC ADMINISTRATION 165.0 174.6 179.3 188.4
COMMUNITY & OTHER SERVICES 100.7 102.2 103.9 106.4LESS: FINANCIAL SERVICES INDIRECTLY MEASURED 42.1 51.4 61.4 60.5
$BZ MnIndustry 2000 2001 2002 2003
TOTAL 1455.0 1497.9 1588.2 1704.2
AGRICULTURE 177.3 157.9 161.0 170.5
FORESTRY & LOGGING 7.9 9.3 10.9 10.8
FISHING 62.2 59.7 63.4 98.1
MINING 9.0 9.4 9.0 9.8
MANUFACTURING 159.2 155.6 156.5 161.3
ELECTRICITY & WATER 56.7 60.8 61.9 60.7
CONSTRUCTION 82.8 82.1 87.6 77.7
TRADE, HOTELS & RESTAURANTS 329.3 354.5 369.7 396.1
TRANSPORT & COMMUNICATIONS 141.0 158.8 186.9 183.1
FINANCE & INSURANCE 107.7 106.7 118.0 128.6
REAL ESTATE & BUS. SERVICES 98.2 112.1 124.9 137.9
PUBLIC ADMINISTRATION 165.0 175.2 186.1 202.8
COMMUNITY & OTHER SERVICES 100.7 105.4 108.4 120.0LESS: FINANCIAL SERVICES INDIRECTLY MEASURED 42.1 49.6 56.2 53.3
Table 5.3: Gross Domestic Product By Industry in Current Basic Prices
Table 5.2: Gross Domestic Product By Industry in Constant 2000 Basic Prices
56

BELIZE
Fig 5.4: GDP in Current and Constant 2000 Basic Prices
1300
1350
1400
1450
1500
1550
1600
1650
1700
1750
1800
2000 2001 2002 2003
$BZ
Mn
CONSTANT 2000 BASIC PRICES CURRENT BASIC PRICES
57
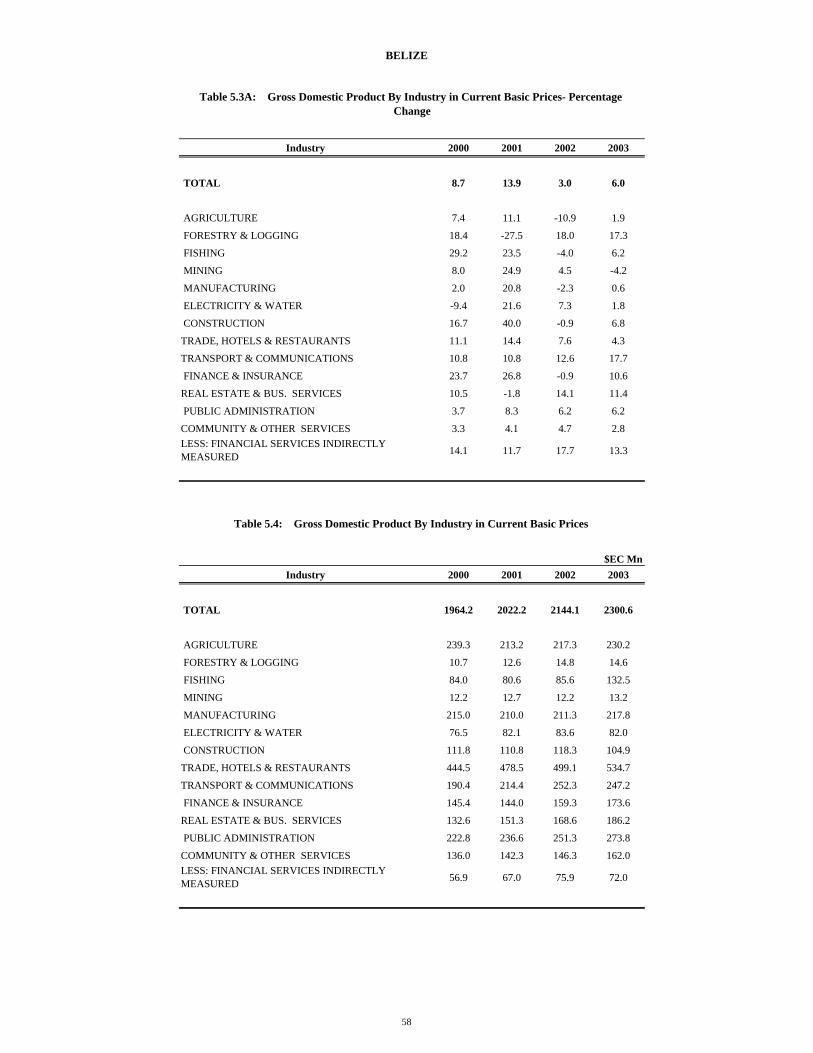
BELIZE
Industry 2000 2001 2002 2003
TOTAL 8.7 13.9 3.0 6.0
AGRICULTURE 7.4 11.1 -10.9 1.9
FORESTRY & LOGGING 18.4 -27.5 18.0 17.3
FISHING 29.2 23.5 -4.0 6.2
MINING 8.0 24.9 4.5 -4.2
MANUFACTURING 2.0 20.8 -2.3 0.6
ELECTRICITY & WATER -9.4 21.6 7.3 1.8
CONSTRUCTION 16.7 40.0 -0.9 6.8
TRADE, HOTELS & RESTAURANTS 11.1 14.4 7.6 4.3
TRANSPORT & COMMUNICATIONS 10.8 10.8 12.6 17.7
FINANCE & INSURANCE 23.7 26.8 -0.9 10.6
REAL ESTATE & BUS. SERVICES 10.5 -1.8 14.1 11.4
PUBLIC ADMINISTRATION 3.7 8.3 6.2 6.2
COMMUNITY & OTHER SERVICES 3.3 4.1 4.7 2.8LESS: FINANCIAL SERVICES INDIRECTLY MEASURED 14.1 11.7 17.7 13.3
$EC MnIndustry 2000 2001 2002 2003
TOTAL 1964.2 2022.2 2144.1 2300.6
AGRICULTURE 239.3 213.2 217.3 230.2
FORESTRY & LOGGING 10.7 12.6 14.8 14.6
FISHING 84.0 80.6 85.6 132.5
MINING 12.2 12.7 12.2 13.2
MANUFACTURING 215.0 210.0 211.3 217.8
ELECTRICITY & WATER 76.5 82.1 83.6 82.0
CONSTRUCTION 111.8 110.8 118.3 104.9
TRADE, HOTELS & RESTAURANTS 444.5 478.5 499.1 534.7
TRANSPORT & COMMUNICATIONS 190.4 214.4 252.3 247.2
FINANCE & INSURANCE 145.4 144.0 159.3 173.6
REAL ESTATE & BUS. SERVICES 132.6 151.3 168.6 186.2
PUBLIC ADMINISTRATION 222.8 236.6 251.3 273.8
COMMUNITY & OTHER SERVICES 136.0 142.3 146.3 162.0LESS: FINANCIAL SERVICES INDIRECTLY MEASURED 56.9 67.0 75.9 72.0
Table 5.3A: Gross Domestic Product By Industry in Current Basic Prices- Percentage Change
Table 5.4: Gross Domestic Product By Industry in Current Basic Prices
58

BELIZE
Industry 2000 2001 2002 2003
TOTAL 100.0 100.0 100.0 100.0
AGRICULTURE 12.2 10.5 10.1 10.0
FORESTRY & LOGGING 0.5 0.6 0.7 0.6
FISHING 4.3 4.0 4.0 5.8
MINING 0.6 0.6 0.6 0.6
MANUFACTURING 10.9 10.4 9.9 9.5
ELECTRICITY & WATER 3.9 4.1 3.9 3.6
CONSTRUCTION 5.7 5.5 5.5 4.6
TRADE, HOTELS & RESTAURANTS 22.6 23.7 23.3 23.2
TRANSPORT & COMMUNICATIONS 9.7 10.6 11.8 10.7
FINANCE & INSURANCE 7.4 7.1 7.4 7.5
REAL ESTATE & BUS. SERVICES 6.7 7.5 7.9 8.1
PUBLIC ADMINISTRATION 11.3 11.7 11.7 11.9
COMMUNITY & OTHER SERVICES 6.9 7.0 6.8 7.0LESS: FINANCIAL SERVICES INDIRECTLY MEASURED 2.9 3.3 3.5 3.1
Table 5.4A: Gross Domestic Product By Industry in Current Basic Prices- Percentage Distribution
Fig 5.5: GDP by Industry in Current Basic Prices - Percentage Change (based on $BZ Mn )
-15.0
-10.0
-5.0
0.0
5.0
10.0
15.0
20.0
25.0
2000 2001 2002 2003
Perc
ent
TOTAL AGRICULTURE MANUFACTURING SERVICES
59

BELIZE
$EC MnEXPENDITURE GROUPS 2000 2001 2002 2003
GROSS DOMESTIC PRODUCT (Current Market Prices) 2246.0 2341.8 2500.1 2668.7
TOTAL CONSUMPTION 1971.0 2138.5 2330.5 2445.8
Private 1680.3 1829.0 1973.2 2062.4
General Government 290.7 309.6 357.3 383.4
GROSS CAPITAL FORMATION 719.4 581.4 598.9 547.3
Gross Fixed Capital Formation 644.0 589.8 567.8 532.7
Increase in Stocks 75.5 -8.4 31.1 14.6
GOODS AND NON-FACTOR SERVICES -481.7 -429.2 -341.7 -291.2
Exports of Goods and Services 1173.4 1197.5 1323.4 1486.6
Imports of Goods and Services 1655.1 1626.6 1665.1 1777.8
Discrepancy 1 37.3 51.0 -87.6 -33.2
EXPENDITURE GROUPS 2000 2001 2002 2003
GROSS DOMESTIC PRODUCT (Current Market Prices) 100.0 100.0 100.0 100.0
TOTAL CONSUMPTION 87.8 91.3 93.2 91.6
Private 74.8 78.1 78.9 77.3
General Government 12.9 13.2 14.3 14.4
GROSS CAPITAL FORMATION 32.0 24.8 24.0 20.5
Gross Fixed Capital Formation 28.7 25.2 22.7 20.0
Increase in Stocks 3.4 -0.4 1.2 0.5
GOODS AND NON-FACTOR SERVICES -21.4 -18.3 -13.7 -10.9
Exports of Goods and Services 52.2 51.1 52.9 55.7
Imports of Goods and Services 73.7 69.5 66.6 66.6
Discrepancy 1 1.7 2.2 -3.5 -1.2
Table 5.5A: Expenditure on Gross Domestic Product in Current Prices - Percentage Distribution
Table 5.5: Expenditure on Gross Domestic Product in Current Prices
60

BELIZE
$BZ MnEXPENDITURE GROUPS 2000 2001 2002 2003
GROSS DOMESTIC PRODUCT (Current Market Prices) 1663.7 1734.7 1851.9 1976.8
TOTAL CONSUMPTION 1460.0 1584.1 1726.3 1811.7
Private 1244.7 1354.8 1461.6 1527.7
General Government 215.3 229.3 264.7 284.0
GROSS CAPITAL FORMATION 532.9 430.7 443.6 405.4
Gross Fixed Capital Formation 477.0 436.9 420.6 394.6
Increase in Stocks 55.9 -6.2 23.0 10.8
GOODS AND NON-FACTOR SERVICES -356.8 -317.9 -253.1 -215.7
Exports of Goods and Services 869.2 887.0 980.3 1101.2
Imports of Goods and Services 1226.0 1204.9 1233.4 1316.9
Discrepancy 1 27.6 37.8 -64.9 -24.6
1 - negative figure indicates expenditure approach yields a higher estimate of GDP than the production approach
Table 5.6: Expenditure on Gross Domestic Product in Current Prices
Fig 5.6: Expenditure on GDP in Current Prices - Percentage Distribution, 2000
76.1
13.2
32.6
-21.8
PRIVATE
GOVERNMENT
GROSS CAPITAL FORMATION
GOODS AND NON-FACTOR SERVICES
Fig 5.7: Expenditure on GDP in Current Prices - Percentage Distribution, 2003
76.3
13.8
23.1
-13.2
PRIVATE
GOVERNMENT
GROSS CAPITAL FORMATION
GOODS AND NON-FACTOR SERVICES
61


DOMINICA
$EC Mn
Industry 2000 2001 2002 2003
TOTAL 621.6 595.7 565.5 565.3
AGRICULTURE 111.7 104.3 103.6 99.9
MINING & QUARRYING 5.0 4.9 3.7 4.1
MANUFACTURING 42.7 36.9 36.0 36.3
ELECTRICITY & WATER 26.8 27.7 27.8 27.3
CONSTRUCTION 50.4 49.2 36.6 40.7
W/SALE & RETAIL TRADE 79.6 79.0 74.9 77.6
HOTELS & RESTAURANTS 15.9 14.8 14.3 15.4
TRANSPORT 60.9 57.5 50.0 52.7
COMMUNICATIONS 72.4 67.7 66.6 53.7
BANKS & INSURANCE 79.6 77.0 72.6 74.6
REAL ESTATE & HOUSING 21.3 21.5 21.7 22.2
GOVERNMENT SERVICES 111.7 116.8 120.9 118.9
OTHER SERVICES 8.1 8.4 8.7 9.0
LESS: FISIM 64.5 70.0 72.0 67.0
Industry 2000 2001 2002 2003
TOTAL 1.3 -4.2 -5.1 0.0
AGRICULTURE -1.1 -6.6 -0.7 -3.7
MINING & QUARRYING 6.0 -2.4 -25.5 11.2
MANUFACTURING 7.4 -13.6 -2.3 0.6
ELECTRICITY & WATER 2.5 3.3 0.6 -2.0
CONSTRUCTION 6.1 -2.2 -25.6 11.3
W/SALE & RETAIL TRADE 2.5 -0.7 -5.2 3.6
HOTELS & RESTAURANTS 3.9 -7.4 -3.3 8.3
TRANSPORT -1.0 -5.5 -13.1 5.3
COMMUNICATIONS -4.4 -6.5 -1.6 -19.5
BANKS & INSURANCE 0.3 -3.3 -5.8 2.8
REAL ESTATE & HOUSING 1.0 1.0 0.9 2.0
GOVERNMENT SERVICES 4.4 4.6 3.5 -1.6
OTHER SERVICES -0.5 2.7 4.6 3.0
LESS: FISIM 2.0 8.5 2.9 -7.0
Table 6.1: Gross Value Added By Industry in Constant 2000 Basic Prices
Table 6.1A: Gross Value Added By Industry in Constant 2000 Basic Prices - Percentage Change
63

DOMINICA
Fig 6.1: GVA by Industry in Constant 2000 Basic Prices - Percentage Change
-15.0
-10.0
-5.0
0.0
5.0
10.0
2000 2001 2002 2003
Perc
ent
TOTAL AGRICULTURE MANUFACTURING SERVICES
64

DOMINICA
Industry 2000 2001 2002 2003
TOTAL 100.0 100.0 100.0 100.0
AGRICULTURE 18.0 17.5 18.3 17.7
MINING & QUARRYING 0.8 0.8 0.6 0.7
MANUFACTURING 6.9 6.2 6.4 6.4
ELECTRICITY & WATER 4.3 4.6 4.9 4.8
CONSTRUCTION 8.1 8.3 6.5 7.2
W/SALE & RETAIL TRADE 12.8 13.3 13.3 13.7
HOTELS & RESTAURANTS 2.6 2.5 2.5 2.7
TRANSPORT 9.8 9.7 8.8 9.3
COMMUNICATIONS 11.6 11.4 11.8 9.5
BANKS & INSURANCE 12.8 12.9 12.8 13.2
REAL ESTATE & HOUSING 3.4 3.6 3.8 3.9
GOVERNMENT SERVICES 18.0 19.6 21.4 21.0
OTHER SERVICES 1.3 1.4 1.5 1.6
LESS: FISIM 10.4 11.8 12.7 11.9
Table 6.1B: Gross Value Added By Industry in Constant 2000 Basic Prices - Percentage Distribution
Fig.6.2: GVA By Industry in Constant 2000 Basic Prices - Percentage Distribution, 2000
18.0
12.8
11.6
12.8
18.0
26.8
AGRICULTURE W/SALE & RETAIL TRADE COMMUNICATIONS BANKS & INSURANCE GOVERNMENT SERVICESOTHER SECTORS
Fig. 6.3: GVA By Industry in Constant 2000 Basic Prices - Percentage
Distribution, 2003
17.7
13.7
9.5
13.2
21.0
24.9
AGRICULTURE W/SALE & RETAIL TRADE COMMUNICATIONS BANKS & INSURANCE GOVERNMENT SERVICESOTHER SECTORS
65

DOMINICA
$EC Mn
Industry 2000 2001 2002 2003
TOTAL 456.4 437.4 415.2 415.0
AGRICULTURE 82.0 76.6 76.1 73.3
MINING & QUARRYING 3.7 3.6 2.7 3.0
MANUFACTURING 31.3 27.1 26.5 26.6
ELECTRICITY & WATER 19.7 20.3 20.4 20.0
CONSTRUCTION 37.0 36.1 26.9 29.9
W/SALE & RETAIL TRADE 58.5 58.0 55.0 57.0
HOTELS & RESTAURANTS 11.7 10.8 10.5 11.3
TRANSPORT 44.7 42.2 36.7 38.7
COMMUNICATIONS 53.2 49.7 48.9 39.4
BANKS & INSURANCE 58.5 56.5 53.3 54.8
REAL ESTATE & HOUSING 15.7 15.8 16.0 16.3
GOVERNMENT SERVICES 82.0 85.8 88.8 87.3
OTHER SERVICES 6.0 6.1 6.4 6.6
LESS: FISIM 47.4 51.4 52.9 49.2
$EC Mn
Industry 2000 2001 2002 2003
TOTAL 621.6 607.5 577.0 580.1
AGRICULTURE 112.5 106.4 102.1 103.9
MINING & QUARRYING 5.2 5.2 3.9 4.6
MANUFACTURING 54.4 45.1 44.5 45.5
ELECTRICITY & WATER 33.9 36.1 38.7 34.4
CONSTRUCTION 52.2 52.4 39.2 45.9
W/SALE & RETAIL TRADE 72.6 73.4 69.7 73.3
HOTELS & RESTAURANTS 17.0 16.0 15.5 17.0
TRANSPORT 57.7 53.0 45.3 47.5
COMMUNICATIONS 47.8 44.3 39.6 28.7
BANKS & INSURANCE 70.1 70.1 64.8 66.6
REAL ESTATE & HOUSING 20.9 21.3 21.8 22.3
GOVERNMENT SERVICES 121.7 128.4 133.0 127.6
OTHER SERVICES 9.5 9.9 10.4 10.9
LESS: FISIM 54.0 54.1 51.5 47.9
Table 6.3 : Gross Value Added By Industry in Current Basic Prices
Table 6.2: Gross Value Added By Industry in Constant 1990 Basic Prices
66

DOMINICA
Fig 6.4: GVA in Current and Constant 1990 Basic Prices
0
100
200
300
400
500
600
700
2000 2001 2002 2003
$EC
Mn
CONSTANT 1990 BASIC PRICES CURRENT BASIC PRICES
67
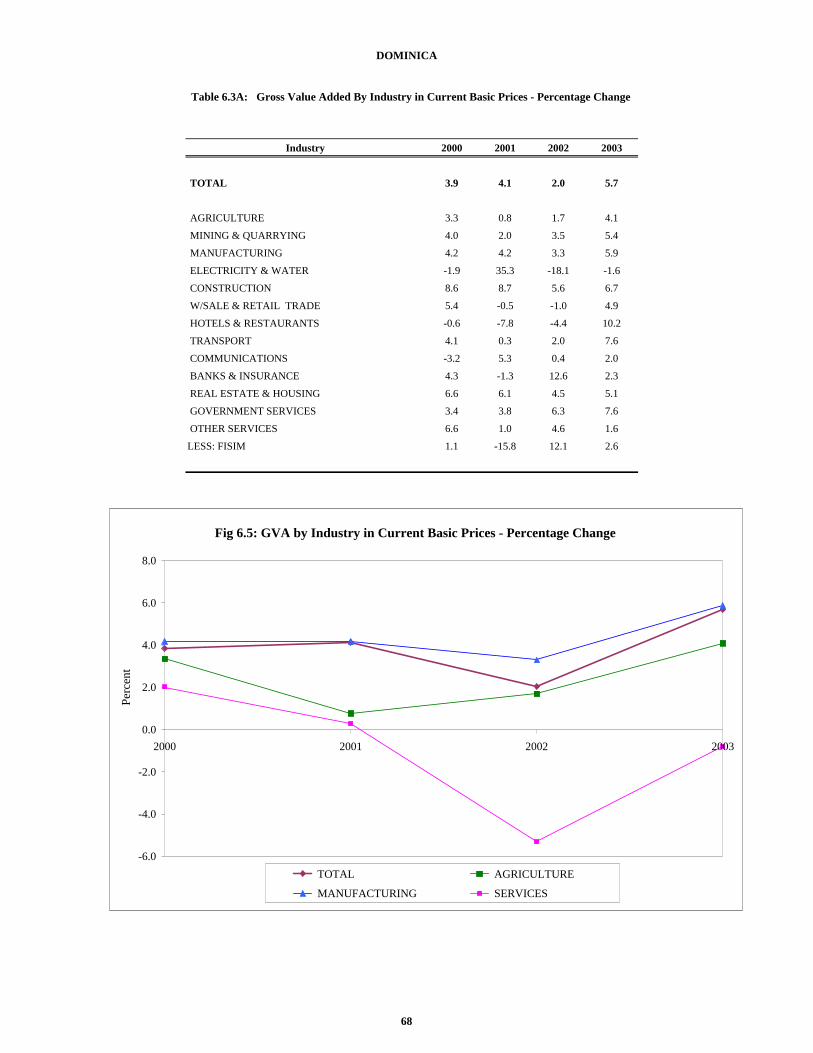
DOMINICA
Industry 2000 2001 2002 2003
TOTAL 3.9 4.1 2.0 5.7
AGRICULTURE 3.3 0.8 1.7 4.1
MINING & QUARRYING 4.0 2.0 3.5 5.4
MANUFACTURING 4.2 4.2 3.3 5.9
ELECTRICITY & WATER -1.9 35.3 -18.1 -1.6
CONSTRUCTION 8.6 8.7 5.6 6.7
W/SALE & RETAIL TRADE 5.4 -0.5 -1.0 4.9
HOTELS & RESTAURANTS -0.6 -7.8 -4.4 10.2
TRANSPORT 4.1 0.3 2.0 7.6
COMMUNICATIONS -3.2 5.3 0.4 2.0
BANKS & INSURANCE 4.3 -1.3 12.6 2.3
REAL ESTATE & HOUSING 6.6 6.1 4.5 5.1
GOVERNMENT SERVICES 3.4 3.8 6.3 7.6
OTHER SERVICES 6.6 1.0 4.6 1.6
LESS: FISIM 1.1 -15.8 12.1 2.6
Table 6.3A: Gross Value Added By Industry in Current Basic Prices - Percentage Change
Fig 6.5: GVA by Industry in Current Basic Prices - Percentage Change
-6.0
-4.0
-2.0
0.0
2.0
4.0
6.0
8.0
2000 2001 2002 2003
Perc
ent
TOTAL AGRICULTURE
MANUFACTURING SERVICES
68

DOMINICA
Industry 2000 2001 2002 2003
TOTAL 100.0 100.0 100.0 100.0
AGRICULTURE 18.1 17.5 17.7 17.9
MINING & QUARRYING 0.8 0.9 0.7 0.8
MANUFACTURING 8.8 7.4 7.7 7.8
ELECTRICITY & WATER 5.5 5.9 6.7 5.9
CONSTRUCTION 8.4 8.6 6.8 7.9
W/SALE & RETAIL TRADE 11.7 12.1 12.1 12.6
HOTELS & RESTAURANTS 2.7 2.6 2.7 2.9
TRANSPORT 9.3 8.7 7.9 8.2
COMMUNICATIONS 7.7 7.3 6.9 4.9
BANKS & INSURANCE 11.3 11.5 11.2 11.5
REAL ESTATE & HOUSING 3.4 3.5 3.8 3.8
GOVERNMENT SERVICES 19.6 21.1 23.1 22.0
OTHER SERVICES 1.5 1.6 1.8 1.9
LESS: FISIM 8.7 8.9 8.9 8.3
$EC Mn
EXPENDITURE GROUPS 2000 2001 2002 2003
GROSS DOMESTIC PRODUCT (Current Market Prices) 732.2 718.6 689.9 707.5
TOTAL CONSUMPTION 630.9 670.3 637.8 615.6
Private 470.3 517.5 490.4 480.5 General Government 160.6 152.8 147.3 135.1
GROSS CAPITAL FORMATION 205.4 171.8 142.4 177.3
Land Development - - - - Transport Equipment 36.6 22.4 26.0 24.0 Other Equipment 51.4 31.5 28.3 50.1 Construction 117.4 117.9 88.1 103.3 Increase in Stocks - - - -
GOODS AND NON-FACTOR SERVICES -104 -124 -90 -85
Exports of Goods 147.8 119.8 115.9 104.7 Exports of Non-Factor Services 242.3 204.2 215.2 235.6 Imports of Goods 352.1 312.4 276.4 276.4 Imports of Non Factor Services 142.3 135.1 145.0 149.4
Table 6.3B: Gross Value Added By Industry in Current Basic Prices - Percentage Distribution
Table 6.4: Expenditure on Gross Domestic Product in Current Prices
69

DOMINICA
EXPENDITURE GROUPS 2000 2001 2002 2003
GROSS DOMESTIC PRODUCT (Current Market Prices) 100.0 100.0 100.0 100.0
TOTAL CONSUMPTION 86.2 93.3 92.4 87.0
Private 64.2 72.0 71.1 67.9 General Government 21.9 21.3 21.4 19.1
GROSS CAPITAL FORMATION 28.1 23.9 20.6 25.1
Land Development - - - - Transport Equipment 5.0 3.1 3.8 3.4 Other Equipment 7.0 4.4 4.1 7.1 Construction 16.0 16.4 12.8 14.6 Increase in Stocks - - - -
GOODS AND NON-FACTOR SERVICES -14.2 -17.2 -13.1 -12.1
Exports of Goods 20.2 16.7 16.8 14.8 Exports of Non-Factor Services 33.1 28.4 31.2 33.3 Imports of Goods 48.1 43.5 40.1 39.1 Imports of Non Factor Services 19.4 18.8 21.0 21.1
Table 6.4A: Expenditure on Gross Domestic Product in Current Prices -Percentage Distribution
Fig 6.6: Expenditure on GDP in Current Prices - Percentage Distribution, 2000
64.2
21.9
28.1
-14.2
PRIVATEGOVERNMENT CONSUMPTIONGROSS CAPITAL FORMATIONGOODS AND NON-FACTOR SERVICES
Fig 6.7: Expenditure on GDP in Current Prices - Percentage Distribution, 2003
67.9
19.1
25.1
-12.1
PRIVATEGOVERNMENT CONSUMPTIONGROSS CAPITAL FORMATIONGOODS AND NON-FACTOR SERVICES
70

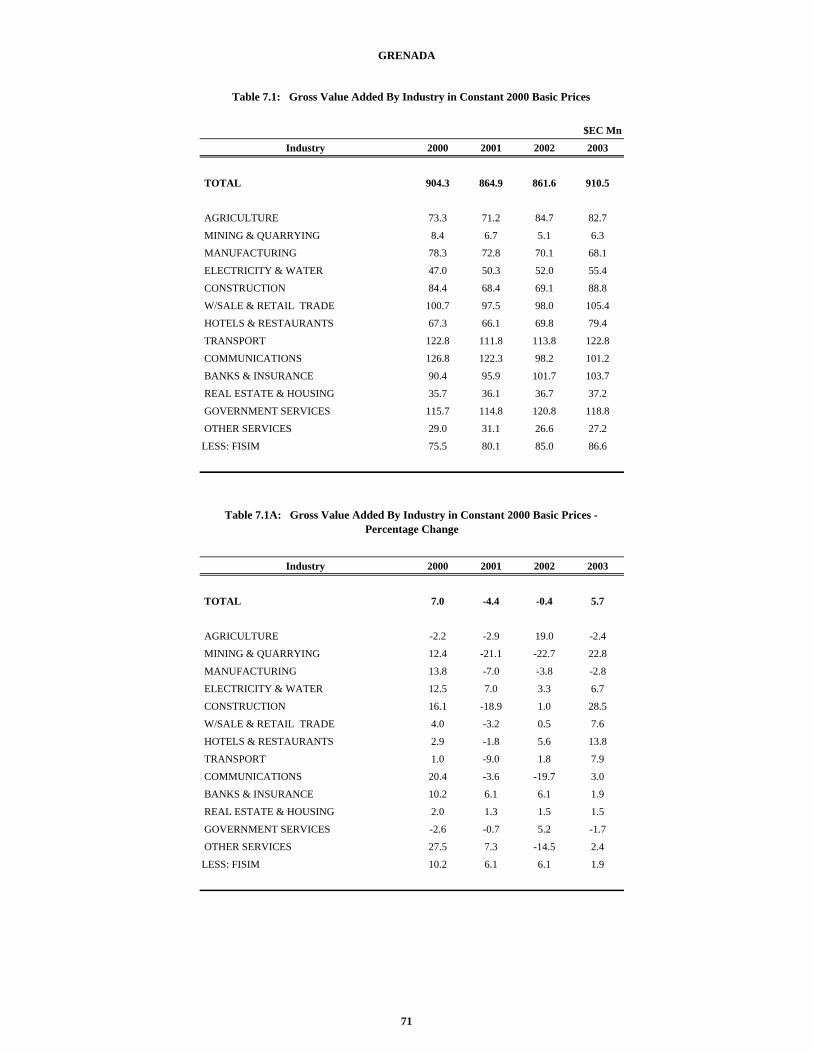
GRENADA
$EC Mn
Industry 2000 2001 2002 2003
TOTAL 904.3 864.9 861.6 910.5
AGRICULTURE 73.3 71.2 84.7 82.7
MINING & QUARRYING 8.4 6.7 5.1 6.3
MANUFACTURING 78.3 72.8 70.1 68.1
ELECTRICITY & WATER 47.0 50.3 52.0 55.4
CONSTRUCTION 84.4 68.4 69.1 88.8
W/SALE & RETAIL TRADE 100.7 97.5 98.0 105.4
HOTELS & RESTAURANTS 67.3 66.1 69.8 79.4
TRANSPORT 122.8 111.8 113.8 122.8
COMMUNICATIONS 126.8 122.3 98.2 101.2
BANKS & INSURANCE 90.4 95.9 101.7 103.7
REAL ESTATE & HOUSING 35.7 36.1 36.7 37.2
GOVERNMENT SERVICES 115.7 114.8 120.8 118.8
OTHER SERVICES 29.0 31.1 26.6 27.2
LESS: FISIM 75.5 80.1 85.0 86.6
Industry 2000 2001 2002 2003
TOTAL 7.0 -4.4 -0.4 5.7
AGRICULTURE -2.2 -2.9 19.0 -2.4
MINING & QUARRYING 12.4 -21.1 -22.7 22.8
MANUFACTURING 13.8 -7.0 -3.8 -2.8
ELECTRICITY & WATER 12.5 7.0 3.3 6.7
CONSTRUCTION 16.1 -18.9 1.0 28.5
W/SALE & RETAIL TRADE 4.0 -3.2 0.5 7.6
HOTELS & RESTAURANTS 2.9 -1.8 5.6 13.8
TRANSPORT 1.0 -9.0 1.8 7.9
COMMUNICATIONS 20.4 -3.6 -19.7 3.0
BANKS & INSURANCE 10.2 6.1 6.1 1.9
REAL ESTATE & HOUSING 2.0 1.3 1.5 1.5
GOVERNMENT SERVICES -2.6 -0.7 5.2 -1.7
OTHER SERVICES 27.5 7.3 -14.5 2.4
LESS: FISIM 10.2 6.1 6.1 1.9
Table 7.1: Gross Value Added By Industry in Constant 2000 Basic Prices
Table 7.1A: Gross Value Added By Industry in Constant 2000 Basic Prices - Percentage Change
71

GRENADA
Fig 7.1: GVA by Industry in Constant 2000 Basic Prices - Percentage Change
-10.0
-5.0
0.0
5.0
10.0
15.0
20.0
25.0
2000 2001 2002 2003
Perc
ent
TOTAL AGRICULTURE MANUFACTURING SERVICES
72

GRENADA
Industry 2000 2001 2002 2003
TOTAL 100.0 100.0 100.0 100.0
AGRICULTURE 8.1 8.2 9.8 9.1
MINING & QUARRYING 0.9 0.8 0.6 0.7
MANUFACTURING 8.7 8.4 8.1 7.5
ELECTRICITY & WATER 5.2 5.8 6.0 6.1
CONSTRUCTION 9.3 7.9 8.0 9.8
W/SALE & RETAIL TRADE 11.1 11.3 11.4 11.6
HOTELS & RESTAURANTS 7.4 7.6 8.1 8.7
TRANSPORT 13.6 12.9 13.2 13.5
COMMUNICATIONS 14.0 14.1 11.4 11.1
BANKS & INSURANCE 10.0 11.1 11.8 11.4
REAL ESTATE & HOUSING 3.9 4.2 4.3 4.1
GOVERNMENT SERVICES 12.8 13.3 14.0 13.0
OTHER SERVICES 3.2 3.6 3.1 3.0
LESS: FISIM 8.3 9.3 9.9 9.5
Table 7.1B: Gross Value Added By Industry in Constant 2000 Basic Prices - Percentage Distribution
Fig 7.2: GVA by Industry in Constant 2000 Basic Prices - Percentage
Distribution, 2000
11.1
13.6
14.0
10.0 12.8
38.5
W/SALE & RETAIL TRADE TRANSPORT COMMUNICATIONS BANKS & INSURANCE GOVERNMENT SERVICESOTHER SECTORS
.
Fig 7.3: GVA By Industry in Constant 2000 Basic Prices - Percentage
Distribution, 2003
11.613.5
11.1
11.4
13.0
39.4
W/SALE & RETAIL TRADE TRANSPORT COMMUNICATIONS BANKS & INSURANCE GOVERNMENT SERVICESOTHER SECTORS
73

GRENADA
$EC Mn
Industry 2000 2001 2002 2003
TOTAL 701.2 670.7 668.1 706.0
AGRICULTURE 56.8 55.2 65.7 64.1
MINING & QUARRYING 6.5 5.2 4.0 4.9
MANUFACTURING 60.7 56.5 54.3 52.8
ELECTRICITY & WATER 36.5 39.0 40.3 43.0
CONSTRUCTION 65.5 53.1 53.6 68.9
W/SALE & RETAIL TRADE 78.1 75.6 76.0 81.8
HOTELS & RESTAURANTS 52.2 51.2 54.1 61.6
TRANSPORT 95.2 86.7 88.2 95.2
COMMUNICATIONS 98.3 94.8 76.2 78.5
BANKS & INSURANCE 70.1 74.4 78.9 80.4
REAL ESTATE & HOUSING 27.7 28.0 28.4 28.9
GOVERNMENT SERVICES 89.7 89.0 93.7 92.1
OTHER SERVICES 22.5 24.1 20.6 21.1
LESS: FISIM 58.5 62.1 65.9 67.1
$EC Mn
Industry 2000 2001 2002 2003
TOTAL 904.3 877.9 891.3 947.1
AGRICULTURE 69.8 72.4 92.6 94.3
MINING & QUARRYING 7.6 6.0 4.7 5.7
MANUFACTURING 68.9 63.7 62.3 60.6
ELECTRICITY & WATER 46.4 51.8 59.4 59.0
CONSTRUCTION 96.7 79.7 80.9 104.3
W/SALE & RETAIL TRADE 96.4 96.3 98.2 108.0
HOTELS & RESTAURANTS 81.7 78.2 73.4 81.5
TRANSPORT 136.4 124.2 122.8 132.1
COMMUNICATIONS 78.3 75.5 59.0 57.5
BANKS & INSURANCE 89.6 93.6 99.8 115.2
REAL ESTATE & HOUSING 30.3 31.7 32.6 33.8
GOVERNMENT SERVICES 143.6 148.8 157.4 157.9
OTHER SERVICES 29.4 32.5 28.2 29.6
LESS: FISIM 70.7 76.5 80.1 92.4
Table 7.3: Gross Value Added By Industry in Current Basic Prices
Table 7.2: Gross Value Added By Industry in Constant 1990 Basic Prices
74

GRENADA
Fig 7.4: GVA in Current and Constant 1990 Basic Prices
0
100
200
300
400
500
600
700
800
900
1000
2000 2001 2002 2003
$EC
Mn
CONSTANT 1990 BASIC PRICES CURRENT BASIC PRICES
75

GRENADA
Industry 2000 2001 2002 2003
TOTAL 7.9 -2.9 1.5 6.3
AGRICULTURE 3.9 3.7 28.0 1.7
MINING & QUARRYING 12.2 -21.0 -22.6 22.8
MANUFACTURING 13.8 -7.6 -2.1 -2.8
ELECTRICITY & WATER 7.5 11.8 14.6 -0.7
CONSTRUCTION 17.2 -17.5 1.4 29.0
W/SALE & RETAIL TRADE 6.3 -0.1 2.0 10.0
HOTELS & RESTAURANTS 4.6 -4.3 -6.1 11.0
TRANSPORT 13.2 -9.0 -1.1 7.6
COMMUNICATIONS 7.0 -3.6 -21.8 -2.6
BANKS & INSURANCE 16.3 4.5 6.6 15.4
REAL ESTATE & HOUSING 4.2 4.6 3.0 3.7
GOVERNMENT SERVICES 0.8 3.6 5.8 0.3
OTHER SERVICES 30.3 10.7 -13.2 4.7
LESS: FISIM 27.2 8.1 4.7 15.4
Table 7.3A: Gross Value Added By Industry in Current Basic Prices - Percentage Change
Fig 7.5: GVA by Industry in Current Basic Prices - Percentage Change
-10.0
-5.0
0.0
5.0
10.0
15.0
20.0
25.0
30.0
2000 2001 2002 2003
Perc
ent
TOTAL AGRICULTURE MANUFACTURING SERVICES
76

GRENADA
Industry 2000 2001 2002 2003
TOTAL 100.0 100.0 100.0 100.0
AGRICULTURE 7.7 8.2 10.4 10.0
MINING & QUARRYING 0.8 0.7 0.5 0.6
MANUFACTURING 7.6 7.3 7.0 6.4
ELECTRICITY & WATER 5.1 5.9 6.7 6.2
CONSTRUCTION 10.7 9.1 9.1 11.0
W/SALE & RETAIL TRADE 10.7 11.0 11.0 11.4
HOTELS & RESTAURANTS 9.0 8.9 8.2 8.6
TRANSPORT 15.1 14.1 13.8 14.0
COMMUNICATIONS 8.7 8.6 6.6 6.1
BANKS & INSURANCE 9.9 10.7 11.2 12.2
REAL ESTATE & HOUSING 3.3 3.6 3.7 3.6
GOVERNMENT SERVICES 15.9 17.0 17.7 16.7
OTHER SERVICES 3.2 3.7 3.2 3.1
LESS: FISIM 7.8 8.7 9.0 9.8
$EC Mn
EXPENDITURE GROUPS 2000 2001 2002 2003
GROSS DOMESTIC PRODUCT (Current Market Prices) 1,105.8 1,067.1 1,092.2 1,180.9
TOTAL CONSUMPTION 817.5 902.8 985.9 1,009.5
Private 659.8 724.8 790.8 830.2
General Government 157.6 178.0 195.2 179.4
GROSS CAPITAL FORMATION 484.4 386.0 361.6 505.1
Public 78.0 122.9 115.1 160.8
Private 406.4 263.2 246.5 344.3
Increase in Stocks - - - -
GOODS AND NON-FACTOR SERVICES -196.1 -221.7 -255.3 -333.7
Exports of Goods 224.0 171.7 113.4 113.0
Exports of Non Factor Services 412.5 360.0 359.2 391.1
Imports of Goods 596.5 531.4 489.8 607.7
Imports of Non Factor Services 236.0 222.0 238.0 230.1
Table 7.3B: Gross Value Added By Industry in Current Basic Prices - Percentage Distribution
Table 7.4: Expenditure on Gross Domestic Product in Current Prices
77

GRENADA
EXPENDITURE GROUPS 2000 2001 2002 2003
GROSS DOMESTIC PRODUCT (Current Market Prices) 100.0 100.0 100.0 100.0
TOTAL CONSUMPTION 73.9 84.6 90.3 85.5
Private 59.7 67.9 72.4 70.3
General Government 14.3 16.7 17.9 15.2
GROSS CAPITAL FORMATION 43.8 36.2 33.1 42.8
Public 7.1 11.5 10.5 13.6
Private 36.8 24.7 22.6 29.2
Increase in Stocks - - - -
GOODS AND NON-FACTOR SERVICES -17.7 -20.8 -23.4 -28.3
Exports of Goods 20.3 16.1 10.4 9.6
Exports of Non Factor Services 37.3 33.7 32.9 33.1
Imports of Goods 53.9 49.8 44.8 51.5
Imports of Non Factor Services 21.3 20.8 21.8 19.5
Table 7.4A: Expenditure on Gross Domestic Product in Current Prices - Percentage Distribution
Fig 7.6: Expenditure on GDP in Current Prices - Percentage Distribution, 2000
59.7
14.3
43.8
-17.7
PRIVATE
GOVERNMENT CONSUMPTION
GROSS CAPITAL FORMATION
GOODS AND NON-FACTOR SERVICES
Fig 7.7: Expenditure on GDP in Current Prices - Percentage Distribution, 2003
70.3
15.2
42.8
-28.3
PRIVATE
GOVERNMENT CONSUMPTION
GROSS CAPITAL FORMATION
GOODS AND NON-FACTOR SERVICES
78


GUYANA
$EC Mn Industry 2000 2001 2002 2003
TOTAL 1612.2 1649.0 1667.9 1688.0
AGRIC., FORESTRY & FISHING 534.3 553.9 587.3 600.9
MINING & QUARRYING 188.5 196.4 182.9 164.8
MANUF. & PROCESSING 93.0 93.2 95.1 97.9
CONSTRUCTION & ENGIN. 136.0 138.9 133.3 139.6
DISTRIBUTION 127.9 128.6 127.3 131.1
TRANSPORT & COMMUNICATION 144.5 152.4 159.3 165.7
RENTAL OF DWELLINGS 27.7 28.2 28.2 29.4
FINANCIAL SERVICES 93.0 88.3 87.4 90.0
GOVERNMENT 207.6 207.6 205.5 205.5
OTHER SERVICES 1 59.8 61.4 61.6 63.1
Note: 1 includes Electricity and Gas
Industry 2000 2001 2002 2003
TOTAL -1.4 2.3 1.1 1.2
AGRIC., FORESTRY & FISHING -10.1 3.7 6.0 2.3
MINING & QUARRYING 5.9 4.2 -6.9 -9.9
MANUF. & PROCESSING -11.8 0.2 2.0 3.0
CONSTRUCTION & ENGIN. 6.5 2.1 -4.0 4.7
DISTRIBUTION 5.1 0.5 -1.0 3.0
TRANSPORT & COMMUNICATION 7.1 5.5 4.5 4.0
RENTAL OF DWELLINGS 5.5 2.1 0.0 4.0
FINANCIAL SERVICES 2.8 -5.0 -1.0 3.0
GOVERNMENT 4.9 0.0 -1.0 0.0
OTHER SERVICES 1 3.9 2.8 0.2 2.5
Note: 1 includes Electricity and Gas
Table 8.1 Gross Domestic Product By Industry at Factor Cost in Constant 2000 Prices
Table 8.1A Gross Domestic Product By Industry at Factor Cost in Constant 2000 Prices- Percentage Change
79
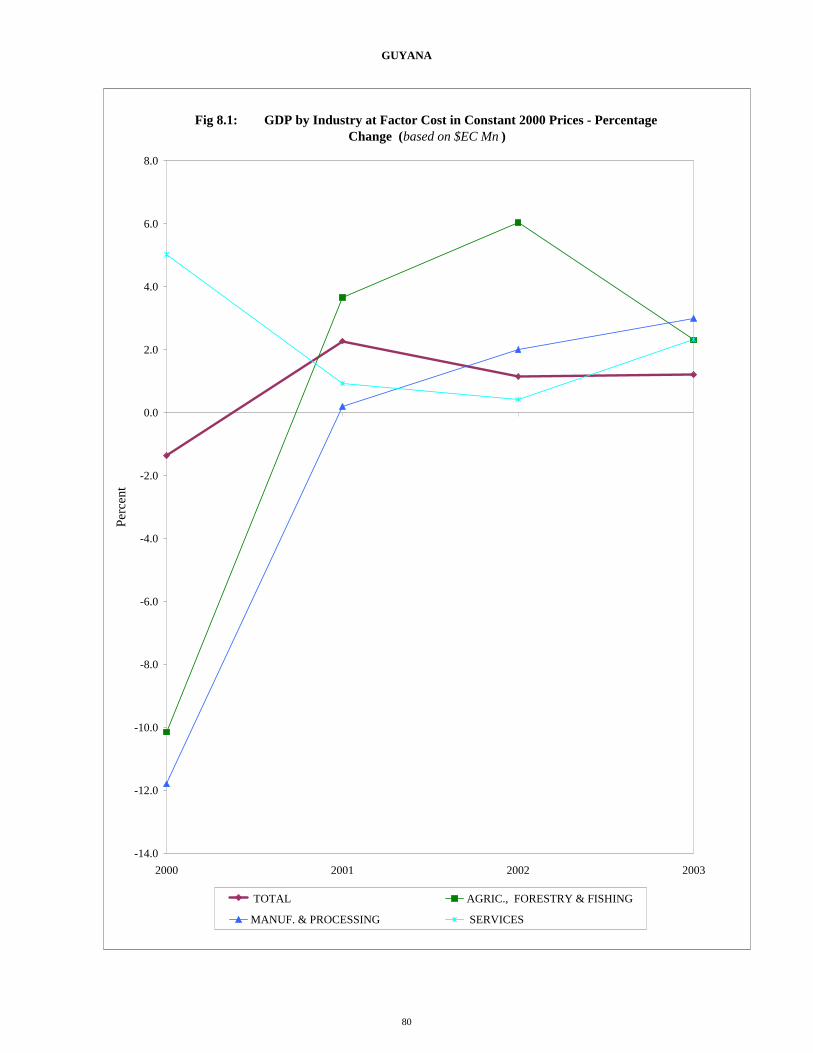
GUYANA
Fig 8.1: GDP by Industry at Factor Cost in Constant 2000 Prices - Percentage Change (based on $EC Mn )
-14.0
-12.0
-10.0
-8.0
-6.0
-4.0
-2.0
0.0
2.0
4.0
6.0
8.0
2000 2001 2002 2003
Perc
ent
TOTAL AGRIC., FORESTRY & FISHING
MANUF. & PROCESSING SERVICES
80
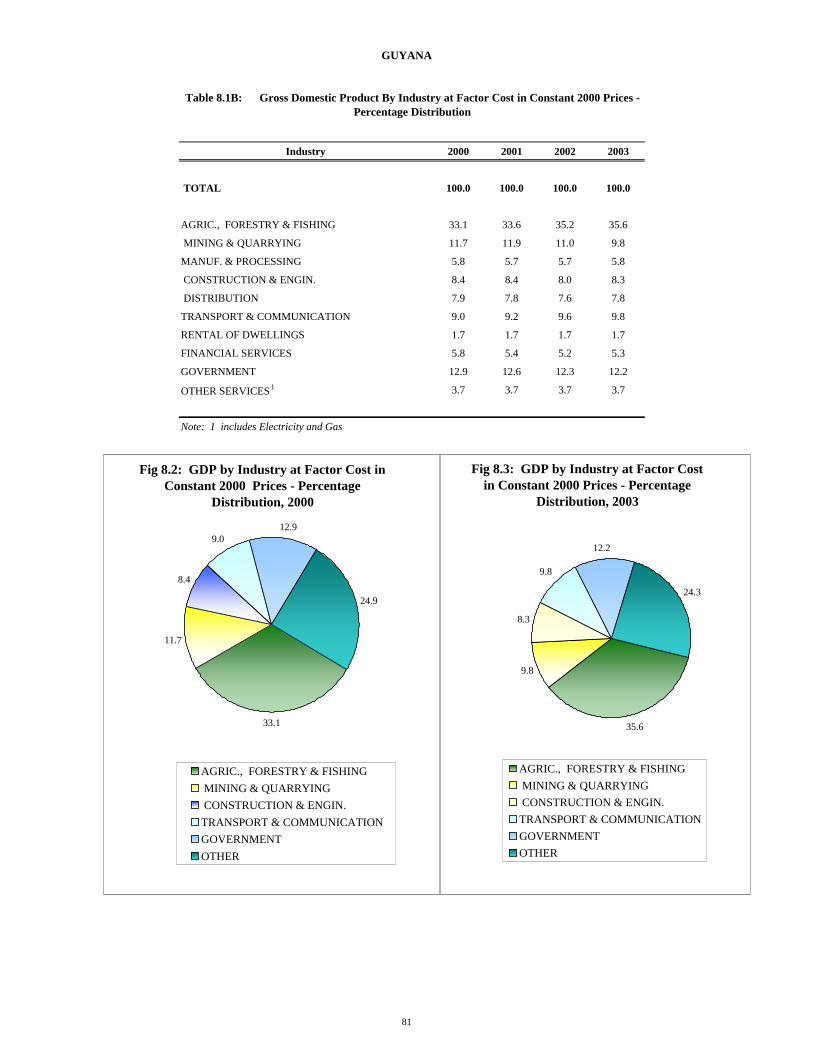
GUYANA
Industry 2000 2001 2002 2003
TOTAL 100.0 100.0 100.0 100.0
AGRIC., FORESTRY & FISHING 33.1 33.6 35.2 35.6
MINING & QUARRYING 11.7 11.9 11.0 9.8
MANUF. & PROCESSING 5.8 5.7 5.7 5.8
CONSTRUCTION & ENGIN. 8.4 8.4 8.0 8.3
DISTRIBUTION 7.9 7.8 7.6 7.8
TRANSPORT & COMMUNICATION 9.0 9.2 9.6 9.8
RENTAL OF DWELLINGS 1.7 1.7 1.7 1.7
FINANCIAL SERVICES 5.8 5.4 5.2 5.3
GOVERNMENT 12.9 12.6 12.3 12.2
OTHER SERVICES 1 3.7 3.7 3.7 3.7
Note: 1 includes Electricity and Gas
Table 8.1B: Gross Domestic Product By Industry at Factor Cost in Constant 2000 Prices - Percentage Distribution
Fig 8.2: GDP by Industry at Factor Cost in Constant 2000 Prices - Percentage
Distribution, 2000
33.1
11.7
8.4
9.012.9
24.9
AGRIC., FORESTRY & FISHING MINING & QUARRYING CONSTRUCTION & ENGIN.TRANSPORT & COMMUNICATIONGOVERNMENTOTHER
Fig 8.3: GDP by Industry at Factor Cost in Constant 2000 Prices - Percentage
Distribution, 2003
35.6
9.8
8.3
9.8
12.2
24.3
AGRIC., FORESTRY & FISHING MINING & QUARRYING CONSTRUCTION & ENGIN.TRANSPORT & COMMUNICATIONGOVERNMENTOTHER
81
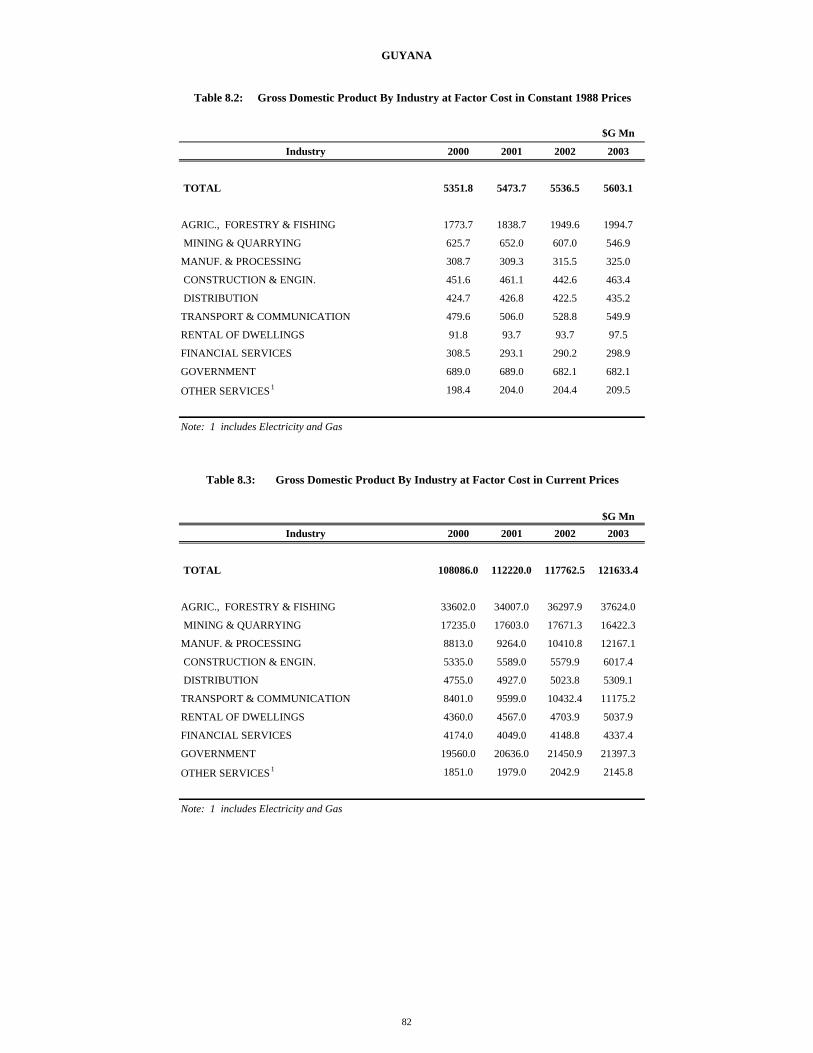
GUYANA
$G Mn
Industry 2000 2001 2002 2003
TOTAL 5351.8 5473.7 5536.5 5603.1
AGRIC., FORESTRY & FISHING 1773.7 1838.7 1949.6 1994.7
MINING & QUARRYING 625.7 652.0 607.0 546.9
MANUF. & PROCESSING 308.7 309.3 315.5 325.0
CONSTRUCTION & ENGIN. 451.6 461.1 442.6 463.4
DISTRIBUTION 424.7 426.8 422.5 435.2
TRANSPORT & COMMUNICATION 479.6 506.0 528.8 549.9
RENTAL OF DWELLINGS 91.8 93.7 93.7 97.5
FINANCIAL SERVICES 308.5 293.1 290.2 298.9
GOVERNMENT 689.0 689.0 682.1 682.1
OTHER SERVICES 1 198.4 204.0 204.4 209.5
Note: 1 includes Electricity and Gas
$G MnIndustry 2000 2001 2002 2003
TOTAL 108086.0 112220.0 117762.5 121633.4
AGRIC., FORESTRY & FISHING 33602.0 34007.0 36297.9 37624.0
MINING & QUARRYING 17235.0 17603.0 17671.3 16422.3
MANUF. & PROCESSING 8813.0 9264.0 10410.8 12167.1
CONSTRUCTION & ENGIN. 5335.0 5589.0 5579.9 6017.4
DISTRIBUTION 4755.0 4927.0 5023.8 5309.1
TRANSPORT & COMMUNICATION 8401.0 9599.0 10432.4 11175.2
RENTAL OF DWELLINGS 4360.0 4567.0 4703.9 5037.9
FINANCIAL SERVICES 4174.0 4049.0 4148.8 4337.4
GOVERNMENT 19560.0 20636.0 21450.9 21397.3
OTHER SERVICES 1 1851.0 1979.0 2042.9 2145.8
Note: 1 includes Electricity and Gas
Table 8.2: Gross Domestic Product By Industry at Factor Cost in Constant 1988 Prices
Table 8.3: Gross Domestic Product By Industry at Factor Cost in Current Prices
82
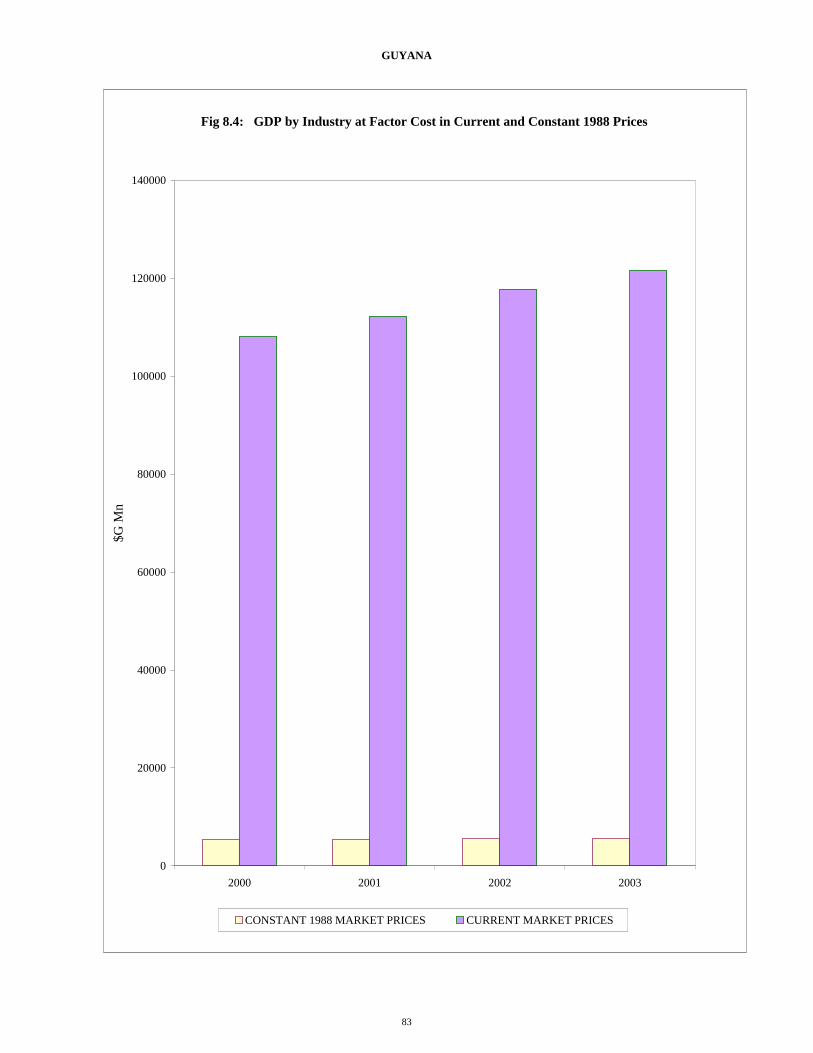
GUYANA
Fig 8.4: GDP by Industry at Factor Cost in Current and Constant 1988 Prices
0
20000
40000
60000
80000
100000
120000
140000
2000 2001 2002 2003
$G M
n
CONSTANT 1988 MARKET PRICES CURRENT MARKET PRICES
83

GUYANA
Industry 2000 2001 2002 2003
TOTAL 2.8 3.8 4.9 3.3
AGRIC., FORESTRY & FISHING -7.7 1.2 6.7 3.7
MINING & QUARRYING 6.7 2.1 0.4 -7.1
MANUF. & PROCESSING -16.7 5.1 12.4 16.9
CONSTRUCTION & ENGIN. 11.8 4.8 -0.2 7.8
DISTRIBUTION 11.4 3.6 2.0 5.7
TRANSPORT & COMMUNICATION 17.7 14.3 8.7 7.1
RENTAL OF DWELLINGS 13.3 4.7 3.0 7.1
FINANCIAL SERVICES 23.2 -3.0 2.5 4.5
GOVERNMENT 15.2 5.5 3.9 -0.3
OTHER SERVICES 1 17.9 6.9 3.2 5.0
Note: 1 includes Electricity and Gas
Table 8.3A: Gross Domestic Product By Industry at Factor Cost in Current Prices - Percentage Change
Fig 8.5: GDP by Industry at Factor Cost in Current Prices - Percentage Change (Based on $G Mn)
-10.0
-5.0
0.0
5.0
10.0
15.0
20.0
2000 2001 2002 2003
Perc
ent
TOTAL AGRIC., FORESTRY & FISHING CONSTRUCTION & ENGIN. SERVICES
84

GUYANA
$EC MnIndustry 2000 2001 2002 2003
TOTAL 1612.2 1619.3 1668.0 1681.2
AGRIC., FORESTRY & FISHING 501.2 490.7 514.1 520.0
MINING & QUARRYING 257.1 254.0 250.3 227.0
MANUF. & PROCESSING 131.5 133.7 147.5 168.2
CONSTRUCTION & ENGIN. 79.6 80.6 79.0 83.2
DISTRIBUTION 70.9 71.1 71.2 73.4
TRANSPORT & COMMUNICATION 125.3 138.5 147.8 154.5
RENTAL OF DWELLINGS 65.0 65.9 66.6 69.6
FINANCIAL SERVICES 62.3 58.4 58.8 60.0
GOVERNMENT 291.8 297.8 303.8 295.8
OTHER SERVICES 1 27.6 28.6 28.9 29.7
Note: 1 includes Electricity and Gas
Industry 2000 2001 2002 2003
TOTAL 100.0 100.0 100.0 100.0
AGRIC., FORESTRY & FISHING 31.1 30.3 30.8 30.9
MINING & QUARRYING 15.9 15.7 15.0 13.5
MANUF. & PROCESSING 8.2 8.3 8.8 10.0
CONSTRUCTION & ENGIN. 4.9 5.0 4.7 4.9
DISTRIBUTION 4.4 4.4 4.3 4.4
TRANSPORT & COMMUNICATION 7.8 8.6 8.9 9.2
RENTAL OF DWELLINGS 4.0 4.1 4.0 4.1
FINANCIAL SERVICES 3.9 3.6 3.5 3.6
GOVERNMENT 18.1 18.4 18.2 17.6
OTHER SERVICES 1 1.7 1.8 1.7 1.8
Note: 1 includes Electricity and Gas
Table 8.4: Gross Domestic Product By Industry at Factor Cost in Current Prices
Table 8.4A: Gross Domestic Product By Industry at Factor Cost in Current Prices - Percentage Distribution
85

GUYANA
$EC MnEXPENDITURE GROUPS 2000 2001 2002 2003
GROSS DOMESTIC PRODUCT (Current Market Prices) 1939.3 1925.0 1960.9 1985.3
TOTAL CONSUMPTION 1473.7 1490.1 1462.6 1676.2
Private 939.8 1049.9 995.5 1170.9
Government 534.0 440.2 467.1 505.3
GROSS CAPITAL FORMATION 746.8 741.3 745.9 775.4
Gross Fixed Capital Formation 746.8 741.3 745.9 775.4
Changes in Inventory - - - -
GOODS AND NON-FACTOR SERVICES -281.2 -306.4 -247.6 -466.3
EXPENDITURE GROUPS 2000 2001 2002 2003
GROSS DOMESTIC PRODUCT (Current Market Prices) 100.0 100.0 100.0 100.0
TOTAL CONSUMPTION 76.0 77.4 74.6 84.4
Private 48.5 54.5 50.8 59.0
Government 27.5 22.9 23.8 25.5
GROSS CAPITAL FORMATION 38.5 38.5 38.0 39.1
Gross Fixed Capital Formation 38.5 38.5 38.0 39.1
Changes in Inventory - - - -
GOODS AND NON-FACTOR SERVICES -14.5 -15.9 -12.6 -23.5
Table 8.5: Expenditure on Gross Domestic Product in Current Prices
Table 8.5A: Expenditure on Gross Domestic Product in Current Prices - Percentage Distribution
86

GUYANA
$G MnEXPENDITURE GROUPS 2000 2001 2002 2003
GROSS DOMESTIC PRODUCT (Current Market Prices) 130013.2 133404.3 138447.6 143631.7
TOTAL CONSUMPTION 98799.7 103264.1 103262.9 121268.9
Private 63001.7 72759.5 70286.9 84712.2
Government 35798.0 30504.6 32976.0 36556.7
GROSS CAPITAL FORMATION 50065.0 51375.0 52665.5 56097.8
Gross Fixed Capital Formation 50065.0 51375.0 52665.5 56097.8
Changes in Inventory - - - -
GOODS AND NON-FACTOR SERVICES -18851.5 -21234.8 -17480.8 -33735.0
Table 8.6: Expenditure on Gross Domestic Product in Current Prices
Fig 8.6: Expenditure on GDP in Current Prices - Percentage Distribution, 2000
48.0
27.2
38.1
-13.3
PRIVATE
GOVERNMENT
GROSS CAPITAL FORMATION
GOODS AND NON-FACTOR SERVICES
Fig 8.7: Expenditure on GDP in Current Prices - Percentage Distribution, 2003
53.0
22.9
35.1
-10.9
PRIVATEGOVERNMENTGROSS CAPITAL FORMATIONGOODS AND NON-FACTOR SERVICES
87


JAMAICA
$EC Mn Industry 2000 2001 2002 2003
TOTAL 21225.4 21538.4 21772.4 22265.0
AGRIC., FORESTRY & FISHING 1351.8 1430.1 1330.2 1393.3
MINING & QUARRYING 1132.1 1162.0 1200.7 1258.9
MANUFACTURING 3023.2 3046.8 3021.4 2995.8
ELECTRICITY & WATER 812.8 818.9 856.9 897.4
CONSTRUCT. & INSTALLATION 1997.2 2041.6 2089.7 2114.6
DISTRIBUTIVE TRADE 4802.6 4801.6 4807.7 4857.4
T/PORT, COMM. & STORAGE 2684.1 2820.5 2995.5 3104.8
FINANCE & INSUR. SERVICES 1839.7 1687.5 1791.9 1875.3
REAL ESTATE & BUS. SERVICES 1095.2 1107.8 1115.6 1135.5
PRODUCERS OF GOV'T SERVICES 2195.4 2208.1 2215.9 2221.2
MISCELLANEOUS SERVICES 1736.4 1716.7 1725.6 1813.2
H/HOLD & PRIVATE NPIs 103.0 103.3 103.9 104.2
LESS: IMPUTED SERVICE CHARGES 1548.2 1406.6 1482.4 1506.6
Industry 2000 2001 2002 2003
TOTAL 0.8 1.5 1.1 2.3
AGRIC., FORESTRY & FISHING -12.0 5.8 -7.0 4.7
MINING & QUARRYING -1.0 2.6 3.3 4.9
MANUFACTURING 0.6 0.8 -0.8 -0.8
ELECTRICITY & WATER 2.2 0.7 4.6 4.7
CONSTRUCT. & INSTALLATION 0.7 2.2 2.4 1.2
DISTRIBUTIVE TRADE 1.2 0.0 0.1 1.0
T/PORT, COMM. & STORAGE 6.5 5.1 6.2 3.6
FINANCE & INSUR. SERVICES 3.1 -8.3 6.2 4.6
REAL ESTATE & BUS. SERVICES 0.0 1.1 0.7 1.8
PRODUCERS OF GOV'T SERVICES -0.3 0.6 0.4 0.2
MISCELLANEOUS SERVICES 4.1 -1.1 0.5 5.1
H/HOLD & PRIVATE NPIs -1.6 0.3 0.5 0.4
LESS: IMPUTED SERVICE CHARGES 1.8 -9.1 5.4 1.6
Table 9.1: Gross Domestic Product By Industry in Constant 2000 Producers' Prices
Table 9.1A: Gross Domestic Product By Industry in Constant 2000 Producers' Prices - Percentage Change
89

JAMAICA
Fig 9.1: Gross Domestic Product by Industry in Constant 2000 Producers' Prices - Percentage Change (Based on $EC Mn )
-14.0
-12.0
-10.0
-8.0
-6.0
-4.0
-2.0
0.0
2.0
4.0
6.0
8.0
2000 2001 2002 2003
Perc
ent
TOTAL AGRIC., FORESTRY & FISHING MANUFACTURING SERVICES
90

JAMAICA
Industry 2000 2001 2002 2003
TOTAL 100.0 100.0 100.0 100.0
AGRIC., FORESTRY & FISHING 6.4 6.6 6.1 6.3
MINING & QUARRYING 5.3 5.4 5.5 5.7
MANUFACTURING 14.2 14.1 13.9 13.5
ELECTRICITY & WATER 3.8 3.8 3.9 4.0
CONSTRUCT. & INSTALLATION 9.4 9.5 9.6 9.5
DISTRIBUTIVE TRADE 22.6 22.3 22.1 21.8
T/PORT, COMM. & STORAGE 12.6 13.1 13.8 13.9
FINANCE & INSUR. SERVICES 8.7 7.8 8.2 8.4
REAL ESTATE & BUS. SERVICES 5.2 5.1 5.1 5.1
PRODUCERS OF GOV'T SERVICES 10.3 10.3 10.2 10.0
MISCELLANEOUS SERVICES 8.2 8.0 7.9 8.1
H/HOLD & PRIVATE NPIs 0.5 0.5 0.5 0.5
LESS: IMPUTED SERVICE CHARGES 7.3 6.5 6.8 6.8
Table 9.1B: Gross Domestic Product By Industry in Constant 2000 Producers' Prices - Percentage Distribution
Fig 9.2: GDP By Industry in Constant 2000 Producers' Prices: - Percentage Distribution,
2000
14.29.4
22.6
12.610.3
30.9
MANUFACTURING CONSTRUCT. & INSTALLATION DISTRIBUTIVE TRADE T/PORT, COMM. & STORAGE PRODUCERS OF GOV'T SERVICESOTHER
Fig 9.3: GDP By Industry in Constant 2000 Producers' Prices: - Percentage Distribution,
2003
13.59.5
21.8
13.9
10.0
31.3
MANUFACTURING CONSTRUCT. & INSTALLATION DISTRIBUTIVE TRADE T/PORT, COMM. & STORAGE PRODUCERS OF GOV'T SERVICESOTHER
91

JAMAICA
$J MnIndustry 2000 2001 2002 2003
TOTAL 223770.1 227069.8 229536.3 234729.8
AGRIC., FORESTRY & FISHING 14251.8 15077.4 14023.3 14689.4
MINING & QUARRYING 11935.0 12250.5 12658.4 13272.4
MANUFACTURING 31872.1 32121.1 31852.8 31583.3
ELECTRICITY & WATER 8569.3 8633.3 9033.9 9460.3
CONSTRUCT. & INSTALLATION 21056.0 21523.9 22030.3 22293.6
DISTRIBUTIVE TRADE 50631.9 50621.5 50685.3 51209.0
T/PORT, COMM. & STORAGE 28296.9 29735.4 31579.7 32732.1
FINANCE & INSUR. SERVICES 19395.0 17790.2 18891.6 19770.0
REAL ESTATE & BUS. SERVICES 11546.6 11678.9 11761.2 11971.1
PRODUCERS OF GOV'T SERVICES 23145.2 23279.3 23361.0 23416.9
MISCELLANEOUS SERVICES 18305.6 18098.2 18192.1 19115.7
H/HOLD & PRIVATE NPIs 1086.2 1089.1 1094.9 1098.8
LESS: IMPUTED SERVICE CHARGES 16321.7 14829.0 15628.2 15883.0
$J MnIndustry 2000 2001 2002 2003
TOTAL 339528.5 373042.6 408765.3 470440.2
AGRIC., FORESTRY & FISHING 21242.0 22892.1 22678.9 24250.5
MINING & QUARRYING 13826.6 14820.1 15689.5 20153.6
MANUFACTURING 43494.1 48250.0 51279.2 59105.4
ELECTRICITY & WATER 11309.4 12489.9 13577.6 17191.9
CONSTRUCT. & INSTALLATION 30962.8 35013.7 38590.2 43766.0
DISTRIBUTIVE TRADE 66776.8 72426.8 78605.2 88496.3
T/PORT, COMM. & STORAGE 36972.2 43408.2 51093.7 56539.3
FINANCE & INSUR. SERVICES 26097.6 23275.6 22177.2 35501.7
REAL ESTATE & BUS. SERVICES 19345.7 21529.6 24292.0 27200.3
PRODUCERS OF GOV'T SERVICES 40144.0 43694.8 49593.3 54643.4
MISCELLANEOUS SERVICES 23962.5 24936.5 26510.5 31289.2
H/HOLD & PRIVATE NPIs 2009.9 2100.2 2261.5 2326.3
LESS: IMPUTED SERVICE CHARGES 18746.8 15132.2 14173.9 23890.4
ADD: VALUE ADDED TAX 22131.6 23337.3 26590.3 33866.7
Table 9.2: Gross Domestic Product By Industry in Current Purchasers' Prices
Table 9.2: Gross Domestic Product By Industry in Constant 1996 Producers' Prices
92
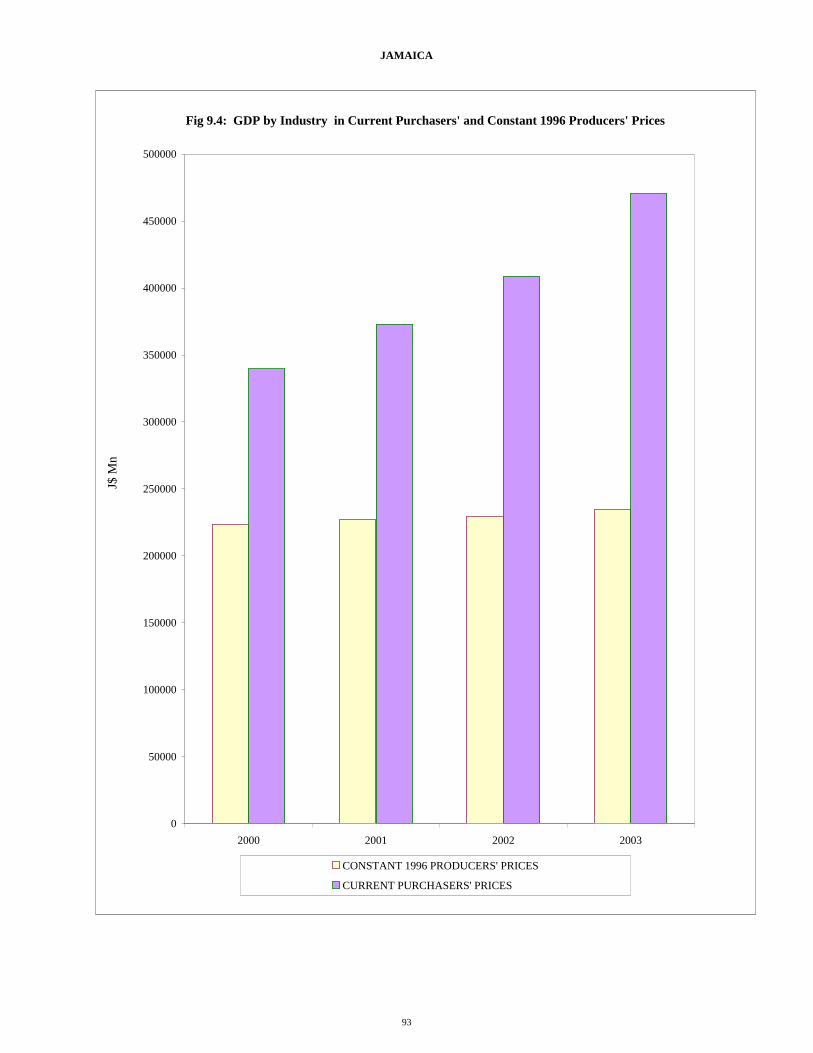
JAMAICA
Fig 9.4: GDP by Industry in Current Purchasers' and Constant 1996 Producers' Prices
0
50000
100000
150000
200000
250000
300000
350000
400000
450000
500000
2000 2001 2002 2003
J$ M
n
CONSTANT 1996 PRODUCERS' PRICES
CURRENT PURCHASERS' PRICES
93
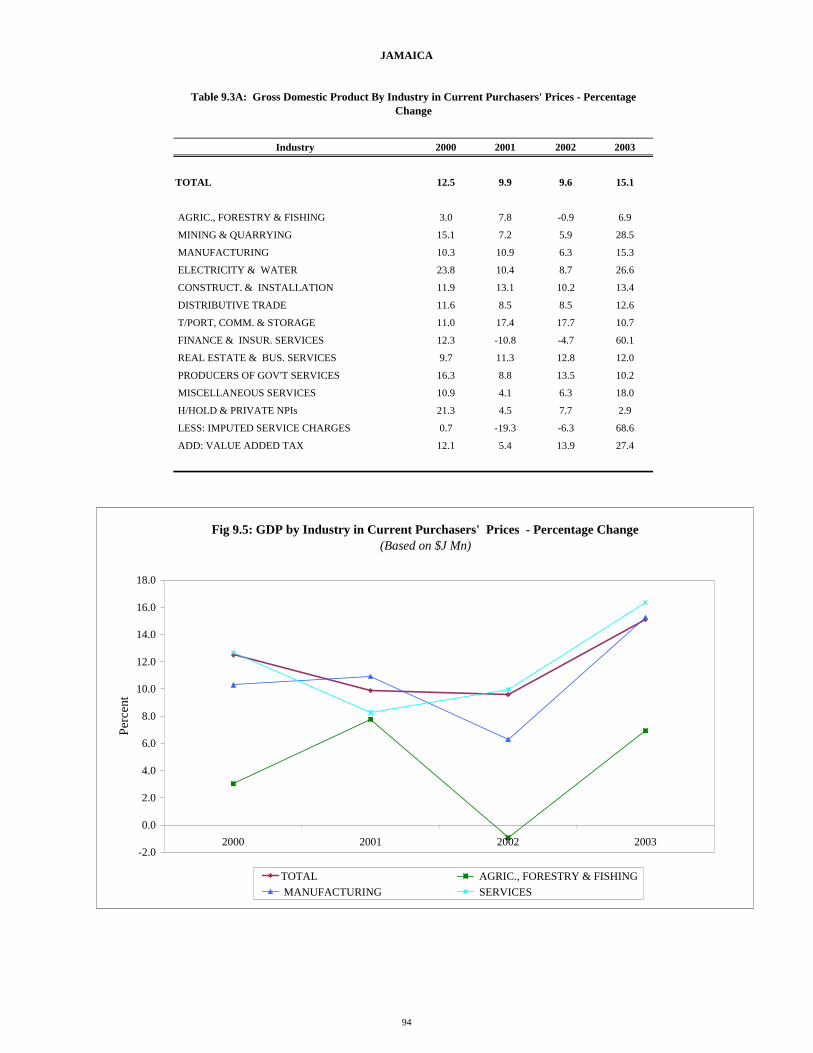
JAMAICA
Industry 2000 2001 2002 2003
TOTAL 12.5 9.9 9.6 15.1
AGRIC., FORESTRY & FISHING 3.0 7.8 -0.9 6.9
MINING & QUARRYING 15.1 7.2 5.9 28.5
MANUFACTURING 10.3 10.9 6.3 15.3
ELECTRICITY & WATER 23.8 10.4 8.7 26.6
CONSTRUCT. & INSTALLATION 11.9 13.1 10.2 13.4
DISTRIBUTIVE TRADE 11.6 8.5 8.5 12.6
T/PORT, COMM. & STORAGE 11.0 17.4 17.7 10.7
FINANCE & INSUR. SERVICES 12.3 -10.8 -4.7 60.1
REAL ESTATE & BUS. SERVICES 9.7 11.3 12.8 12.0
PRODUCERS OF GOV'T SERVICES 16.3 8.8 13.5 10.2
MISCELLANEOUS SERVICES 10.9 4.1 6.3 18.0
H/HOLD & PRIVATE NPIs 21.3 4.5 7.7 2.9
LESS: IMPUTED SERVICE CHARGES 0.7 -19.3 -6.3 68.6
ADD: VALUE ADDED TAX 12.1 5.4 13.9 27.4
Table 9.3A: Gross Domestic Product By Industry in Current Purchasers' Prices - Percentage Change
Fig 9.5: GDP by Industry in Current Purchasers' Prices - Percentage Change (Based on $J Mn)
-2.0
0.0
2.0
4.0
6.0
8.0
10.0
12.0
14.0
16.0
18.0
2000 2001 2002 2003
Perc
ent
TOTAL AGRIC., FORESTRY & FISHING MANUFACTURING SERVICES
94

JAMAICA
$EC MnIndustry 2000 2001 2002 2003
TOTAL 21225.4 21849.1 22958.4 21809.6
AGRIC., FORESTRY & FISHING 1327.9 1340.8 1273.8 1124.3
MINING & QUARRYING 864.4 868.0 881.2 934.3
MANUFACTURING 2719.0 2826.0 2880.1 2740.1
ELECTRICITY & WATER 707.0 731.5 762.6 797.0
CONSTRUCT. & INSTALLATION 1935.6 2050.7 2167.4 2029.0
DISTRIBUTIVE TRADE 4174.5 4242.0 4414.9 4102.7
T/PORT, COMM. & STORAGE 2311.3 2542.4 2869.7 2621.2
FINANCE & INSUR. SERVICES 1631.5 1363.3 1245.6 1645.9
REAL ESTATE & BUS. SERVICES 1209.4 1261.0 1364.4 1261.0
PRODUCERS OF GOV'T SERVICES 2509.6 2559.2 2785.4 2533.3
MISCELLANEOUS SERVICES 1498.0 1460.5 1489.0 1450.6
H/HOLD & PRIVATE NPIs 125.6 123.0 127.0 107.8
LESS: IMPUTED SERVICE CHARGES 1171.9 886.3 796.1 1107.6
ADD: VALUE ADDED TAX 1383.5 1366.9 1493.4 1570.1
Industry 2000 2001 2002 2003
TOTAL 100.0 100.0 100.0 100.0
AGRIC., FORESTRY & FISHING 6.3 6.1 5.5 5.2
MINING & QUARRYING 4.1 4.0 3.8 4.3
MANUFACTURING 12.8 12.9 12.5 12.6
ELECTRICITY & WATER 3.3 3.3 3.3 3.7
CONSTRUCT. & INSTALLATION 9.1 9.4 9.4 9.3
DISTRIBUTIVE TRADE 19.7 19.4 19.2 18.8
T/PORT, COMM. & STORAGE 10.9 11.6 12.5 12.0
FINANCE & INSUR. SERVICES 7.7 6.2 5.4 7.5
REAL ESTATE & BUS. SERVICES 5.7 5.8 5.9 5.8
PRODUCERS OF GOV'T SERVICES 11.8 11.7 12.1 11.6
MISCELLANEOUS SERVICES 7.1 6.7 6.5 6.7
H/HOLD & PRIVATE NPIs 0.6 0.6 0.6 0.5
LESS: IMPUTED SERVICE CHARGES 5.5 4.1 3.5 5.1
ADD: VALUE ADDED TAX 6.5 6.3 6.5 7.2
Table 9.4: Gross Domestic Product By Industry in Current Purchasers' Prices
Table 9.4A: Gross Domestic Product By Industry in Current Purchasers' Prices - Percentage Distribution
95

JAMAICA
$EC Mn
EXPENDITURE GROUPS 2000 2001 2002 2003
GROSS DOMESTIC PRODUCT (Current Purchasers' Prices) 21225.4 21849.1 22958.4 21809.6
FINAL CONSUMPTION 17956.2 19045.8 20253.3 19305.5
Private 14602.5 15581.7 16505.2 16013.3
Government 3353.7 3464.2 3748.1 3292.3
GROSS CAPITAL FORMATION 5685.6 6368.4 7310.5 6545.8
Gross Fixed Capital Formation 5647.4 6344.5 7273.2 6510.2
Increase in Stocks 38.2 23.9 37.3 35.7
GOODS AND NON-FACTOR SERVICES -2416.3 -3565.1 -4605.5 -4041.8
Exports of Goods and Services 9137.3 8470.0 8309.5 8876.7
Imports of Goods and Services 11553.6 12035.2 12915.0 12918.5
EXPENDITURE GROUPS 2000 2001 2002 2003
GROSS DOMESTIC PRODUCT (Current Purchasers' Prices) 100.0 100.0 100.0 100.0
FINAL CONSUMPTION 84.6 87.2 88.2 88.5
Private 68.8 71.3 71.9 73.4
Government 15.8 15.9 16.3 15.1
GROSS CAPITAL FORMATION 26.8 29.1 31.8 30.0
Gross Fixed Capital Formation 26.6 29.0 31.7 29.9
Increase in Stocks 0.2 0.1 0.2 0.2
GOODS AND NON-FACTOR SERVICES -11.4 -16.3 -20.1 -18.5
Exports of Goods and Services 43.0 38.8 36.2 40.7
Imports of Goods and Services 54.4 55.1 56.3 59.2
Table 9.5A: Expenditure on Gross Domestic Product in Current Purchasers' Prices - Percentage Distribution
Table 9.5: Expenditure on Gross Domestic Product in Current Purchasers' Prices
96
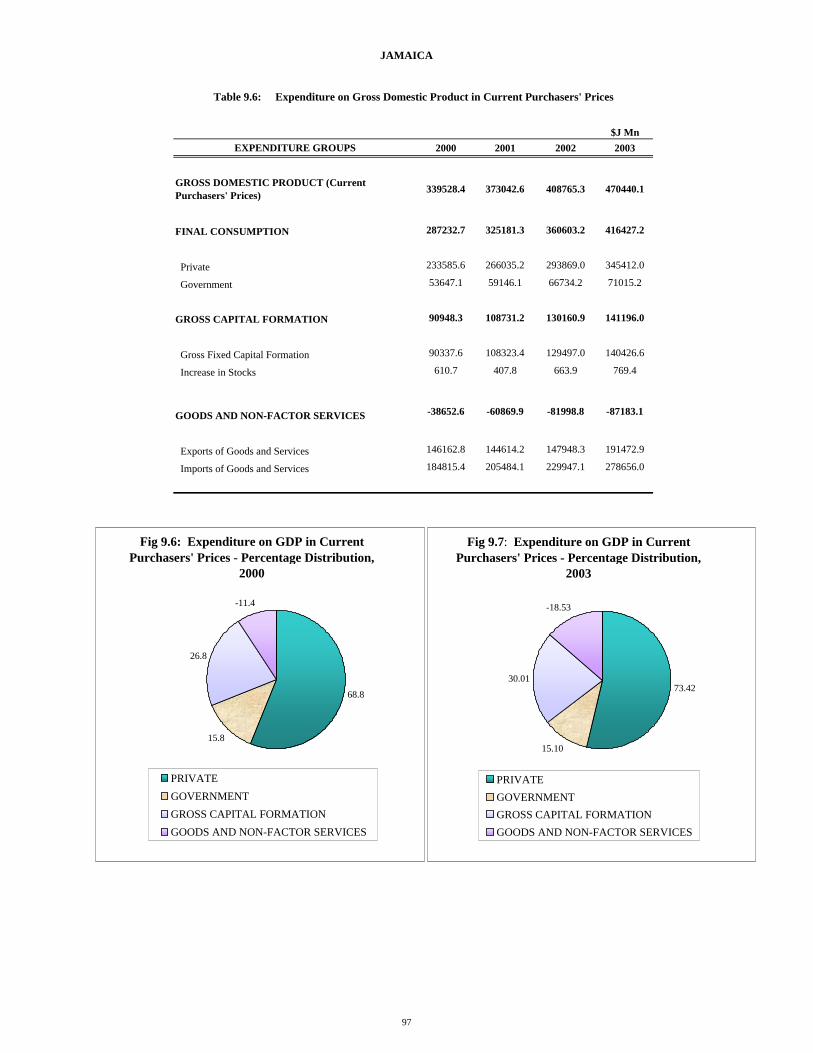
JAMAICA
$J MnEXPENDITURE GROUPS 2000 2001 2002 2003
GROSS DOMESTIC PRODUCT (Current Purchasers' Prices) 339528.4 373042.6 408765.3 470440.1
FINAL CONSUMPTION 287232.7 325181.3 360603.2 416427.2
Private 233585.6 266035.2 293869.0 345412.0
Government 53647.1 59146.1 66734.2 71015.2
GROSS CAPITAL FORMATION 90948.3 108731.2 130160.9 141196.0
Gross Fixed Capital Formation 90337.6 108323.4 129497.0 140426.6
Increase in Stocks 610.7 407.8 663.9 769.4
GOODS AND NON-FACTOR SERVICES -38652.6 -60869.9 -81998.8 -87183.1
Exports of Goods and Services 146162.8 144614.2 147948.3 191472.9
Imports of Goods and Services 184815.4 205484.1 229947.1 278656.0
Table 9.6: Expenditure on Gross Domestic Product in Current Purchasers' Prices
Fig 9.6: Expenditure on GDP in Current Purchasers' Prices - Percentage Distribution,
2000
68.8
15.8
26.8
-11.4
PRIVATEGOVERNMENTGROSS CAPITAL FORMATIONGOODS AND NON-FACTOR SERVICES
Fig 9.7: Expenditure on GDP in Current Purchasers' Prices - Percentage Distribution,
2003
73.42
15.10
30.01
-18.53
PRIVATEGOVERNMENTGROSS CAPITAL FORMATIONGOODS AND NON-FACTOR SERVICES
97


MONTSERRAT
$EC Mn
Industry 2000 2001 2002 2003
TOTAL 79.3 77.1 80.9 81.9
AGRICULTURE 1.4 1.2 1.6 1.6
MINING & QUARRYING 0.1 0.1 0.1 0.1
MANUFACTURING 0.7 0.7 0.7 0.7
ELECTRICITY & WATER 1.9 2.0 2.0 2.0
CONSTRUCTION 14.6 13.5 19.0 18.4
WHOLESALE & RETAIL TRADE 3.9 3.6 4.0 3.7
HOTELS & RESTAURANTS 1.0 1.3 1.3 0.9
TRANSPORT 5.4 5.5 5.6 6.0
COMMUNICATIONS 9.4 6.5 6.7 6.5
BANKS & INSURANCE 8.8 6.9 8.3 9.6
REAL ESTATE & HOUSING 6.5 6.7 7.0 7.3
GOVERNMENT SERVICES 25.0 25.4 25.7 26.2
OTHER SERVICES 5.8 6.1 6.3 6.3
LESS: FISIM 5.1 2.3 7.3 7.5
Industry 2000 2001 2002 2003
TOTAL -3.0 -2.8 4.9 1.2
AGRICULTURE 46.5 -17.3 38.4 0.0
MINING & QUARRYING 0.0 0.0 -28.6 0.0
MANUFACTURING 0.0 0.0 0.0 0.0
ELECTRICITY & WATER 5.1 4.9 -3.3 3.4
CONSTRUCTION -35.8 -7.7 40.9 -2.9
W/SALE & RETAIL TRADE -16.6 -7.9 9.0 -5.5
HOTELS & RESTAURANTS 4.3 27.4 2.2 -31.6
TRANSPORT -5.2 2.5 1.2 6.8
COMMUNICATIONS 33.6 -30.3 2.7 -2.6
BANKS & INSURANCE 64.5 -21.8 21.1 15.3
REAL ESTATE & HOUSING 5.5 3.3 3.8 4.5
GOVERNMENT SERVICES -0.5 1.6 1.3 2.0
OTHER SERVICES 13.6 4.9 4.7 -0.6
LESS: FISIM 11.5 -54.2 211.6 2.2
Table 10.1: Gross Value Added By Industry in Constant 2000 Basic Prices
Table 10.1A: Gross Value Added By Industry in Constant 2000 Basic Prices - Percentage Change
99

MONTSERRAT
Fig 10.1: GVA by Industry in Constant 2000 Basic Prices - Percentage Change
-30.0
-20.0
-10.0
0.0
10.0
20.0
30.0
40.0
50.0
2000 2001 2002 2003
Perc
ent
TOTAL AGRICULTURE MANUFACTURING SERVICES
100

MONTSERRAT
Industry 2000 2001 2002 2003
TOTAL 100.0 100.0 100.0 100.0
AGRICULTURE 1.8 1.5 2.0 2.0
MINING & QUARRYING 0.1 0.1 0.1 0.1
MANUFACTURING 0.9 0.9 0.9 0.9
ELECTRICITY & WATER 2.4 2.6 2.4 2.5
CONSTRUCTION 18.4 17.5 23.4 22.5
W/SALE & RETAIL TRADE 5.0 4.7 4.9 4.6
HOTELS & RESTAURANTS 1.2 1.6 1.6 1.1
TRANSPORT 6.8 7.2 6.9 7.3
COMMUNICATIONS 11.8 8.5 8.3 8.0
BANKS & INSURANCE 11.1 8.9 10.3 11.7
REAL ESTATE & HOUSING 8.2 8.7 8.6 8.9
GOVERNMENT SERVICES 31.4 32.9 31.7 32.0
OTHER SERVICES 7.3 7.9 7.8 7.7
LESS: FISIM 6.5 3.0 9.0 9.1
Table 10.1B: Gross Value Added By Industry in Constant 2000 Basic Prices - Percentage Distribution
Fig 10.2: GVA by Industry in Constant 2000 Basic Prices - Percentage
Distribution, 2000
18.4
11.8
11.18.2
31.4
19.1
CONSTRUCTION COMMUNICATIONS BANKS & INSURANCE REAL ESTATE & HOUSING GOVERNMENT SERVICESOTHER SECTORS
Fig 10.3: GVA by Industry in Constant 2000 Basic Prices - Percentage
Distribution, 2003
22.5
8.0
11.7
8.9
32.0
16.9
CONSTRUCTION COMMUNICATIONS BANKS & INSURANCE REAL ESTATE & HOUSING GOVERNMENT SERVICESOTHER SECTORS
101

MONTSERRAT
$EC Mn
Industry 2000 2001 2002 2003
TOTAL 58.5 56.9 59.7 60.4
AGRICULTURE 1.0 0.9 1.2 1.2
MINING & QUARRYING 0.1 0.1 0.1 0.1
MANUFACTURING 0.5 0.5 0.5 0.5
ELECTRICITY & WATER 1.4 1.5 1.5 1.5
CONSTRUCTION 10.8 9.9 14.0 13.6
W/SALE & RETAIL TRADE 2.9 2.7 2.9 2.8
HOTELS & RESTAURANTS 0.7 0.9 1.0 0.7
TRANSPORT 4.0 4.1 4.1 4.4
COMMUNICATIONS 6.9 4.8 5.0 4.8
BANKS & INSURANCE 6.5 5.1 6.1 7.1
REAL ESTATE & HOUSING 4.8 5.0 5.1 5.4
GOVERNMENT SERVICES 18.4 18.7 18.9 19.3
OTHER SERVICES 4.3 4.5 4.7 4.7
LESS: FISIM 3.8 1.7 5.4 5.5
$EC Mn
Industry 2000 2001 2002 2003
TOTAL 79.3 82.6 88.7 91.6
AGRICULTURE 1.1 1.0 1.3 1.4
MINING & QUARRYING 0.1 0.1 0.1 0.1
MANUFACTURING 0.6 0.6 0.6 0.6
ELECTRICITY & WATER 5.0 5.8 5.8 6.2
CONSTRUCTION 11.7 11.0 15.7 15.6
W/SALE & RETAIL TRADE 4.0 3.8 4.3 4.2
HOTELS & RESTAURANTS 0.8 1.0 1.0 0.7
TRANSPORT 6.1 6.1 6.6 6.9
COMMUNICATIONS 5.2 3.6 3.7 3.6
BANKS & INSURANCE 8.5 6.7 8.1 9.3
REAL ESTATE & HOUSING 9.9 10.7 11.5 12.1
GOVERNMENT SERVICES 25.1 27.6 29.9 30.8
OTHER SERVICES 6.3 6.9 7.2 7.1
LESS: FISIM 4.9 2.2 7.0 7.1
Table 10.3: Gross Value Added By Industry, in Current Basic Prices
Table 10.2: Gross Value Added By Industry in Constant 1990 Basic Prices
102

MONTSERRAT
Fig 10.4: GVA in Current and Constant 1990 Basic Prices
0
10
20
30
40
50
60
70
80
90
100
2000 2001 2002 2003
$EC
Mn
CONSTANT 1990 BASIC PRICES CURRENT BASIC PRICES
103

MONTSERRAT
Industry 2000 2001 2002 2003
TOTAL -1.2 4.1 7.4 3.2
AGRICULTURE 46.7 -10.9 33.7 3.1
MINING & QUARRYING 0.0 0.0 -28.6 0.0
MANUFACTURING 0.0 0.0 0.0 0.0
ELECTRICITY & WATER 49.8 17.7 0.0 6.8
CONSTRUCTION -35.7 -6.4 42.9 -0.4
WHOLESALE & RETAIL TRADE -16.2 -3.5 12.5 -2.1
HOTELS & RESTAURANTS 20.0 28.2 2.0 -31.4
TRANSPORT -9.7 0.7 7.6 5.2
COMMUNICATIONS 15.6 -30.3 2.8 -2.7
BANKS & INSURANCE 66.9 -21.5 20.7 15.2
REAL ESTATE & HOUSING 6.0 8.2 7.5 5.7
GOVERNMENT SERVICES -0.5 9.8 8.4 3.3
OTHER SERVICES 14.0 9.7 4.5 -0.6
LESS: FISIM 11.4 -54.2 211.6 2.1
Table 10.3A: Gross Value Added By Industry, in Current Basic Prices - Percentage Change
Fig 10.5: GVA by Industry in Current Basic Prices - Percentage Change
-20.0
-10.0
0.0
10.0
20.0
30.0
40.0
50.0
2000 2001 2002 2003
Perc
ent
TOTAL AGRICULTURE MANUFACTURING SERVICES
104

MONTSERRAT
Industry 2000 2001 2002 2003
TOTAL 100.0 100.0 100.0 100.0
AGRICULTURE 1.4 1.2 1.5 1.5 MINING & QUARRYING 0.1 0.1 0.1 0.1 MANUFACTURING 0.8 0.8 0.7 0.7 ELECTRICITY & WATER 6.3 7.1 6.6 6.8 CONSTRUCTION 14.8 13.3 17.7 17.1 W/SALE & RETAIL TRADE 5.0 4.6 4.9 4.6 HOTELS & RESTAURANTS 1.0 1.2 1.1 0.8 TRANSPORT 7.6 7.4 7.4 7.5 COMMUNICATIONS 6.5 4.4 4.2 3.9 BANKS & INSURANCE 10.8 8.1 9.1 10.2 REAL ESTATE & HOUSING 12.4 12.9 12.9 13.2 GOVERNMENT SERVICES 31.6 33.4 33.6 33.7 OTHER SERVICES 7.9 8.3 8.1 7.8LESS: FISIM 6.2 2.7 7.9 7.8
$EC Mn
EXPENDITURE GROUPS 2000 2001 2002 2003
GROSS DOMESTIC PRODUCT (Current Market Prices) 93.9 93.7 103.7 104.5
TOTAL CONSUMPTION 106.3 124.6 131.8 130.2
Private 58.6 75.5 83.8 71.9
General Government 47.7 49.2 48.0 58.3
GROSS CAPITAL FORMATION 43.7 39.7 53.0 63.7
Transportation Equipment 1.9 1.0 1.4 6.1
Other Equipment 10.0 8.9 9.0 15.1
Construction 31.9 29.8 42.6 42.4
Increase in Stocks 0.1 0.0 0.0 0.0
GOODS AND NON-FACTOR SERVICES -56.2 -70.6 -81.2 -89.4
Exports of Goods 3.0 2.0 4.0 4.6
Exports of NFS 42.7 38.4 38.1 34.9
Imports of Goods 51.4 46.0 60.4 66.2
Imports of NFS 50.6 64.9 62.9 62.6
Table 10.3B: Gross Value Added By Industry in Current Basic Prices - Percentage Distribution
Table 10.4: Expenditure on Gross Domestic Product in Current Prices
105

MONTSERRAT
EXPENDITURE GROUPS 2000 2001 2002 2003
GROSS DOMESTIC PRODUCT (Current Market Prices) 100.0 100.0 100.0 100.0
TOTAL CONSUMPTION 113.3 133.0 127.2 124.6
Private 62.4 80.5 80.8 68.8
General Government 50.8 52.5 46.3 55.8
GROSS CAPITAL FORMATION 46.6 42.4 51.2 60.9
Transportation Equipment 2.0 1.0 1.3 5.9
Other Equipment 10.6 9.5 8.7 14.4
Construction 33.9 31.8 41.1 40.6
Increase in Stocks 0.1 0.0 0.0 0.0
GOODS AND NON-FACTOR SERVICES -59.8 -75.4 -78.3 -85.5
Exports of Goods 3.2 2.1 3.8 4.4
Exports of NFS 45.5 40.9 36.8 33.4
Imports of Goods 54.7 49.1 58.3 63.3
Imports of NFS 53.9 69.3 60.7 59.9
Table 10.4A: Expenditure on Gross Domestic Product in Current Prices - Percentage Distribution
Fig 10.6: Expenditure on GDP in Current Prices - Percentage Distribution,
2000
62.4
50.846.6
-59.8
PRIVATEGOVERNMENT CONSUMPTIONGROSS CAPITAL FORMATIONGOODS AND NON-FACTOR SERVICES
Fig 10.7: Expenditure on GDP in Current Prices - Percentage Distribution, 2003
68.8
55.8
60.9
-85.5
PRIVATEGOVERNMENT CONSUMPTIONGROSS CAPITAL FORMATIONGOODS AND NON-FACTOR SERVICES
106


ST KITTS AND NEVIS
$EC Mn
Industry 2000 2001 2002 2003
TOTAL 765.2 777.9 775.7 780.1
AGRICULTURE 34.4 38.3 43.3 37.8
MINING & QUARRYING 3.9 3.9 4.7 2.5
MANUFACTURING 99.0 105.5 101.2 101.9
ELECTRICITY & WATER 14.0 14.6 16.0 17.7
CONSTRUCTION 142.2 148.2 139.8 133.3
WHOLESALE & RETAIL TRADE 104.2 92.3 92.6 96.7
HOTELS & RESTAURANTS 32.7 34.0 32.8 43.1
TRANSPORT 56.6 58.6 63.3 63.7
COMMUNICATIONS 80.7 82.3 76.7 75.9
BANKS & INSURANCE 97.2 96.2 98.0 101.1
REAL ESTATE & HOUSING 20.3 21.2 21.4 21.8
GOVERNMENT SERVICES 115.6 118.6 123.2 122.0
OTHER SERVICES 30.6 29.8 30.3 31.0
LESS: FISIM 66.2 65.5 67.5 68.4
Industry 2000 2001 2002 2003
TOTAL 10.4 1.7 -0.3 0.6
AGRICULTURE -5.2 11.1 13.3 -12.7
MINING & QUARRYING 27.3 1.4 19.4 -46.6
MANUFACTURING 21.3 6.6 -4.0 0.6
ELECTRICITY & WATER 15.1 3.9 9.8 10.6
CONSTRUCTION 33.9 4.2 -5.6 -4.7
W/SALE & RETAIL TRADE 0.3 -11.5 0.3 4.5
HOTELS & RESTAURANTS -20.6 3.9 -3.6 31.3
TRANSPORT 7.5 3.5 7.9 0.7
COMMUNICATIONS 11.0 2.0 -6.8 -1.1
BANKS & INSURANCE 15.5 -1.0 1.8 3.3
REAL ESTATE & HOUSING 9.8 4.5 1.0 2.0
GOVERNMENT SERVICES 6.3 2.6 3.9 -1.0
OTHER SERVICES 7.8 -2.6 1.4 2.5
LESS: FISIM 17.6 -1.0 3.0 1.4
Table 11.1: Gross Value Added By Industry in Constant 2000 Basic Prices
Table 11.1A: Gross Value Added By Industry in Constant 2000 Basic Prices - Percentage Change
107

ST KITTS AND NEVIS
Fig 11.1: GVA by Industry in Constant 2000 Basic Prices - Percentage Change
-15.0
-10.0
-5.0
0.0
5.0
10.0
15.0
20.0
25.0
2000 2001 2002 2003
Perc
ent
TOTAL AGRICULTURE
MANUFACTURING SERVICES
108

ST KITTS AND NEVIS
Industry 2000 2001 2002 2003
TOTAL 100.0 100.0 100.0 100.0
AGRICULTURE 4.5 4.9 5.6 4.8
MINING & QUARRYING 0.5 0.5 0.6 0.3
MANUFACTURING 12.9 13.6 13.0 13.1
ELECTRICITY & WATER 1.8 1.9 2.1 2.3
CONSTRUCTION 18.6 19.1 18.0 17.1
W/SALE & RETAIL TRADE 13.6 11.9 11.9 12.4
HOTELS & RESTAURANTS 4.3 4.4 4.2 5.5
TRANSPORT 7.4 7.5 8.2 8.2
COMMUNICATIONS 10.5 10.6 9.9 9.7
BANKS & INSURANCE 12.7 12.4 12.6 13.0
REAL ESTATE & HOUSING 2.6 2.7 2.8 2.8
GOVERNMENT SERVICES 15.1 15.2 15.9 15.6
OTHER SERVICES 4.0 3.8 3.9 4.0
LESS: FISIM 8.7 8.4 8.7 8.8
Table 11.1B: Gross Value Added By Industry in Constant 2000 Basic Prices - Percentage Distribution
Fig 11.2: GVA by Industry in Constant 2000 Basic Prices - Percentage
Distribution: 2000
12.918.6
13.6
12.7
15.1
27.1
MANUFACTURING CONSTRUCTION W/SALE & RETAIL TRADE BANKS & INSURANCE GOVERNMENT SERVICESOTHER
Fig 11.3: GVA by Industry in Constant 2000 Basic Prices - Percentage
Distribution: 2003
13.117.1
12.4
13.0
15.6
28.8
MANUFACTURING CONSTRUCTION W/SALE & RETAIL TRADE BANKS & INSURANCE GOVERNMENT SERVICESOTHER
109

ST KITTS AND NEVIS
$EC Mn
Industry 2000 2001 2002 2003
TOTAL 555.0 564.1 562.5 565.7
AGRICULTURE 25.0 27.7 31.4 27.4
MINING & QUARRYING 2.8 2.8 3.4 1.8
MANUFACTURING 71.8 76.5 73.4 73.9
ELECTRICITY & WATER 10.2 10.6 11.6 12.8
CONSTRUCTION 103.2 107.5 101.4 96.7
W/SALE & RETAIL TRADE 75.6 66.9 67.1 70.2
HOTELS & RESTAURANTS 23.8 24.7 23.8 31.2
TRANSPORT 41.1 42.5 45.9 46.2
COMMUNICATIONS 58.5 59.7 55.6 55.0
BANKS & INSURANCE 70.5 69.8 71.0 73.4
REAL ESTATE & HOUSING 14.7 15.4 15.5 15.8
GOVERNMENT SERVICES 83.8 86.0 89.3 88.5
OTHER SERVICES 22.2 21.6 21.9 22.5
LESS: FISIM 48.0 47.5 48.9 49.6
$EC Mn
Industry 2000 2001 2002 2003
TOTAL 765.2 792.8 802.1 821.0
AGRICULTURE 20.9 24.9 26.9 24.6
MINING & QUARRYING 2.9 2.9 3.5 2.3
MANUFACTURING 79.6 82.5 74.4 76.7
ELECTRICITY & WATER 15.1 16.0 22.0 23.7
CONSTRUCTION 122.7 140.2 137.1 129.8
W/SALE & RETAIL TRADE 105.3 95.1 97.4 104.0
HOTELS & RESTAURANTS 42.8 45.4 43.1 56.6
TRANSPORT 54.4 58.5 63.8 64.3
COMMUNICATIONS 50.1 51.0 47.8 47.3
BANKS & INSURANCE 117.4 121.3 126.6 131.9
REAL ESTATE & HOUSING 20.3 21.6 22.1 23.2
GOVERNMENT SERVICES 148.3 152.2 158.0 156.5
OTHER SERVICES 32.9 33.4 34.6 36.2
LESS: FISIM 47.5 52.1 55.2 56.0
Table 11.3: Gross Value Added By Industry in Current Basic Prices
Table 11.2: Gross Value Added By Industry in Constant 1990 Basic Prices
110

ST KITTS AND NEVIS
Fig 11.4: GVA at Factor Cost in Current and Constant 1990 Basic Prices
0
100
200
300
400
500
600
700
800
900
2000 2001 2002 2003
$EC
Mn
CONSTANT 1990 BASIC PRICES CURRENT BASIC PRICES
111

ST KITTS AND NEVIS
Industry 2000 2001 2002 2003
TOTAL 10.2 3.6 1.2 2.4
AGRICULTURE -8.5 18.8 8.4 -8.8
MINING & QUARRYING 22.6 1.4 19.6 -33.3
MANUFACTURING 10.6 3.6 -9.8 3.1
ELECTRICITY & WATER 16.3 6.1 38.0 7.6
CONSTRUCTION 30.2 14.3 -2.2 -5.3
W/SALE & RETAIL TRADE -1.1 -9.7 2.4 6.8
HOTELS & RESTAURANTS -21.8 6.1 -5.0 31.2
TRANSPORT 8.1 7.4 9.1 0.8
COMMUNICATIONS 3.5 1.9 -6.3 -1.2
BANKS & INSURANCE 22.6 3.3 4.3 4.2
REAL ESTATE & HOUSING 5.9 6.6 2.1 5.1
GOVERNMENT SERVICES 12.8 2.6 3.9 -1.0
OTHER SERVICES 9.2 1.4 3.5 4.8
LESS: FISIM 1.6 9.7 5.9 1.4
Table 11.3A: Gross Value Added By Industry in Current Basic Prices - Percentage Change
Figure 11.5: GVA by Industry in Current Basic Prices - Percentage Change
-15.0
-10.0
-5.0
0.0
5.0
10.0
15.0
20.0
25.0
2000 2001 2002 2003
Perc
ent
TOTAL AGRICULTURE MANUFACTURING SERVICES
112
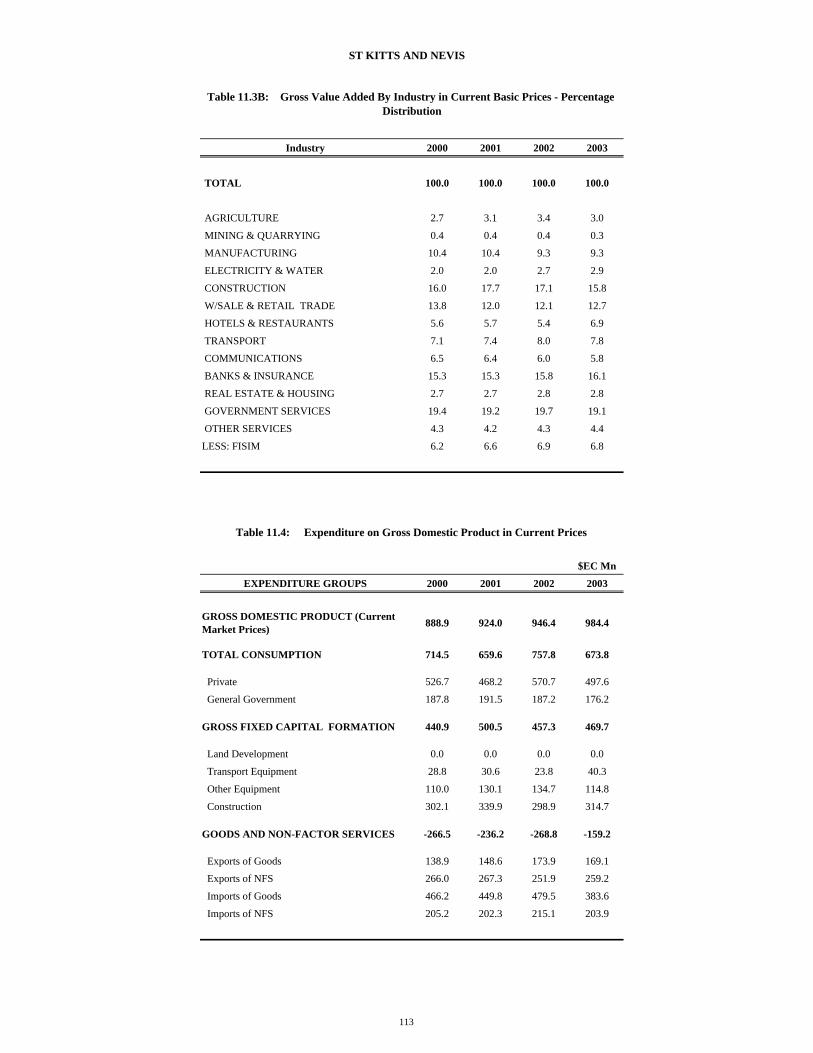
ST KITTS AND NEVIS
Industry 2000 2001 2002 2003
TOTAL 100.0 100.0 100.0 100.0
AGRICULTURE 2.7 3.1 3.4 3.0
MINING & QUARRYING 0.4 0.4 0.4 0.3
MANUFACTURING 10.4 10.4 9.3 9.3
ELECTRICITY & WATER 2.0 2.0 2.7 2.9
CONSTRUCTION 16.0 17.7 17.1 15.8
W/SALE & RETAIL TRADE 13.8 12.0 12.1 12.7
HOTELS & RESTAURANTS 5.6 5.7 5.4 6.9
TRANSPORT 7.1 7.4 8.0 7.8
COMMUNICATIONS 6.5 6.4 6.0 5.8
BANKS & INSURANCE 15.3 15.3 15.8 16.1
REAL ESTATE & HOUSING 2.7 2.7 2.8 2.8
GOVERNMENT SERVICES 19.4 19.2 19.7 19.1
OTHER SERVICES 4.3 4.2 4.3 4.4
LESS: FISIM 6.2 6.6 6.9 6.8
$EC Mn
EXPENDITURE GROUPS 2000 2001 2002 2003
GROSS DOMESTIC PRODUCT (Current Market Prices) 888.9 924.0 946.4 984.4
TOTAL CONSUMPTION 714.5 659.6 757.8 673.8
Private 526.7 468.2 570.7 497.6
General Government 187.8 191.5 187.2 176.2
GROSS FIXED CAPITAL FORMATION 440.9 500.5 457.3 469.7
Land Development 0.0 0.0 0.0 0.0
Transport Equipment 28.8 30.6 23.8 40.3
Other Equipment 110.0 130.1 134.7 114.8
Construction 302.1 339.9 298.9 314.7
GOODS AND NON-FACTOR SERVICES -266.5 -236.2 -268.8 -159.2
Exports of Goods 138.9 148.6 173.9 169.1
Exports of NFS 266.0 267.3 251.9 259.2
Imports of Goods 466.2 449.8 479.5 383.6
Imports of NFS 205.2 202.3 215.1 203.9
Table 11.4: Expenditure on Gross Domestic Product in Current Prices
Table 11.3B: Gross Value Added By Industry in Current Basic Prices - Percentage Distribution
113

ST KITTS AND NEVIS
EXPENDITURE GROUPS 2000 2001 2002 2003
GROSS DOMESTIC PRODUCT (Current Market Prices) 100.0 100.0 100.0 100.0
TOTAL CONSUMPTION 80.4 71.4 80.1 68.5
Private 59.3 50.7 60.3 50.5
General Government 21.1 20.7 19.8 17.9
GROSS FIXED CAPITAL FORMATION 49.6 54.2 48.3 47.7
Land Development 0.0 0.0 0.0 0.0
Transport Equipment 3.2 3.3 2.5 4.1
Other Equipment 12.4 14.1 14.2 11.7
Construction 34.0 36.8 31.6 32.0
GOODS AND NON-FACTOR SERVICES -30.0 -25.6 -28.4 -16.2
Exports of Goods 15.6 16.1 18.4 17.2
Exports of NFS 29.9 28.9 26.6 26.3
Imports of Goods 52.4 48.7 50.7 39.0
Imports of NFS 23.1 21.9 22.7 20.7
Table 11.4A: Expenditure on Gross Domestic Product in Current Prices - Percentage Distribution
Fig 11.6: Expenditure on GDP in Current Prices -Percentage Distribution, 2000
59.3
21.1
49.6
-30.0
PRIVATEGENERAL GOVERNMENTGROSS FIXED CAPITAL FORMATIONGOODS AND NON-FACTOR SERVICES
Fig 11.7: Expenditure on GDP in Current Prices - Percentage Distribution, 2003
50.5
17.9
47.7
-16.2
PRIVATEGENERAL GOVERNMENTGROSS FIXED CAPITAL FORMATIONGOODS AND NON-FACTOR SERVICES
114


SAINT LUCIA
$EC Mn
Industry 2000 2001 2002 2003
TOTAL 1557.7 1490.2 1497.3 1550.7
AGRICULTURE 113.7 86.5 85.4 74.2
MINING & QUARRYING 10.2 7.6 7.8 7.8
MANUFACTURING 93.1 90.6 94.0 93.5
ELECTRICITY & WATER 83.1 86.5 86.0 88.6
CONSTRUCTION 138.8 131.9 125.1 123.6
WHOLESALE & RETAIL TRADE 194.6 166.8 168.9 182.0
HOTELS & RESTAURANTS 207.3 185.4 184.3 214.9
TRANSPORT 169.4 167.2 160.8 165.0
COMMUNICATIONS 143.5 160.5 172.6 180.4
BANKS & INSURANCE 165.7 170.1 172.2 176.3
REAL ESTATE & HOUSING 111.1 116.1 119.0 121.9
GOVERNMENT SERVICES 189.3 191.4 193.1 197.1
OTHER SERVICES 76.7 71.0 72.3 72.3
LESS: FISIM 138.7 141.5 144.2 147.0
Industry 2000 2001 2002 2003
TOTAL 3.4 -4.3 0.5 3.6
AGRICULTURE 7.2 -24.0 -1.3 -13.1
MINING & QUARRYING 18.4 -25.5 1.9 0.2
MANUFACTURING 1.1 -2.6 3.7 -0.5
ELECTRICITY & WATER -2.5 4.2 -0.6 3.0
CONSTRUCTION -0.9 -5.0 -5.1 -1.2
W/SALE & RETAIL TRADE -2.9 -14.3 1.2 7.8
HOTELS & RESTAURANTS 6.6 -10.5 -0.6 16.6
TRANSPORT 2.5 -1.3 -3.8 2.6
COMMUNICATIONS 9.6 11.8 7.5 4.5
BANKS & INSURANCE 7.0 2.7 1.2 2.4
REAL ESTATE & HOUSING 6.3 4.5 2.5 2.5
GOVERNMENT SERVICES 5.2 1.1 0.9 2.1
OTHER SERVICES 7.3 -7.3 1.8 0.0
LESS: FISIM 8.7 2.0 1.9 1.9
Table 12.1: Gross Value Added By Industry in Constant 2000 Basic Prices
Table 12.1A: Gross Value Added By Industry in Constant 2000 Basic Prices - Percentage Change
115

SAINT LUCIA
Fig 12.1: GVA by Industry in Constant 2000 Basic Prices - Percentage Change
-30.0
-25.0
-20.0
-15.0
-10.0
-5.0
0.0
5.0
10.0
2000 2001 2002 2003
Perc
ent
TOTAL AGRICULTURE
MANUFACTURING SERVICES
116

SAINT LUCIA
Industry 2000 2001 2002 2003
TOTAL 100.0 100.0 100.0 100.0
AGRICULTURE 7.3 5.8 5.7 4.8
MINING & QUARRYING 0.7 0.5 0.5 0.5
MANUFACTURING 6.0 6.1 6.3 6.0
ELECTRICITY & WATER 5.3 5.8 5.7 5.7
CONSTRUCTION 8.9 8.9 8.4 8.0
W/SALE & RETAIL TRADE 12.5 11.2 11.3 11.7
HOTELS & RESTAURANTS 13.3 12.4 12.3 13.9
TRANSPORT 10.9 11.2 10.7 10.6
COMMUNICATIONS 9.2 10.8 11.5 11.6
BANKS & INSURANCE 10.6 11.4 11.5 11.4
REAL ESTATE & HOUSING 7.1 7.8 7.9 7.9
GOVERNMENT SERVICES 12.2 12.8 12.9 12.7
OTHER SERVICES 4.9 4.8 4.8 4.7
LESS: FISIM 8.9 9.5 9.6 9.5
Table 12.1B: Gross Value Added By Industry in Constant 2000 Basic Prices - Percentage Distribution
Fig 12.2: GVA by Industry in Constant 2000 Basic Prices - Percentage
Distribution, 2000
12.513.3
10.9
10.6
12.2
40.5
W/SALE & RETAIL TRADE HOTELS & RESTAURANTS TRANSPORT BANKS & INSURANCE GOVERNMENT SERVICESOTHER SECTORS
Fig 12.3: GVA by Industry in Constant 2000 Basic Prices - Percentage
Distribution, 2003
11.713.9
11.6
11.4
12.7
39.5
W/SALE & RETAIL TRADE TRANSPORT COMMUNICATIONS BANKS & INSURANCE GOVERNMENT SERVICESOTHER SECTORS
117
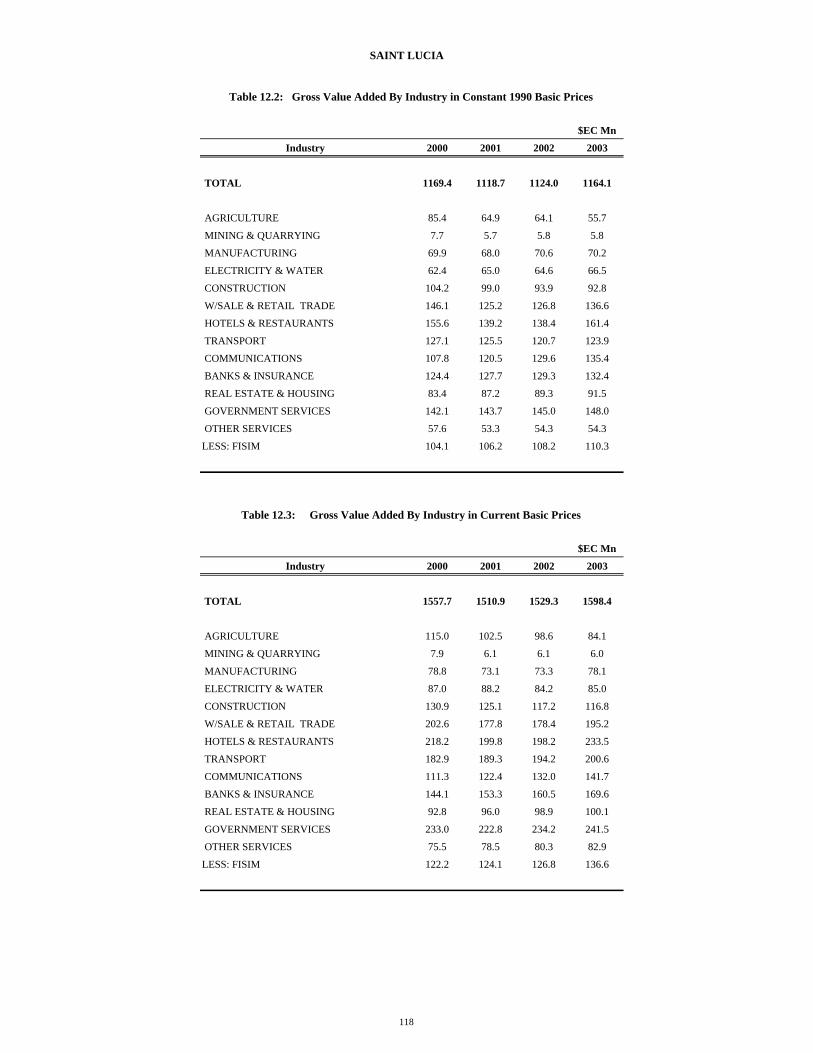
SAINT LUCIA
$EC Mn
Industry 2000 2001 2002 2003
TOTAL 1169.4 1118.7 1124.0 1164.1
AGRICULTURE 85.4 64.9 64.1 55.7
MINING & QUARRYING 7.7 5.7 5.8 5.8
MANUFACTURING 69.9 68.0 70.6 70.2
ELECTRICITY & WATER 62.4 65.0 64.6 66.5
CONSTRUCTION 104.2 99.0 93.9 92.8
W/SALE & RETAIL TRADE 146.1 125.2 126.8 136.6
HOTELS & RESTAURANTS 155.6 139.2 138.4 161.4
TRANSPORT 127.1 125.5 120.7 123.9
COMMUNICATIONS 107.8 120.5 129.6 135.4
BANKS & INSURANCE 124.4 127.7 129.3 132.4
REAL ESTATE & HOUSING 83.4 87.2 89.3 91.5
GOVERNMENT SERVICES 142.1 143.7 145.0 148.0
OTHER SERVICES 57.6 53.3 54.3 54.3
LESS: FISIM 104.1 106.2 108.2 110.3
$EC Mn
Industry 2000 2001 2002 2003
TOTAL 1557.7 1510.9 1529.3 1598.4
AGRICULTURE 115.0 102.5 98.6 84.1
MINING & QUARRYING 7.9 6.1 6.1 6.0
MANUFACTURING 78.8 73.1 73.3 78.1
ELECTRICITY & WATER 87.0 88.2 84.2 85.0
CONSTRUCTION 130.9 125.1 117.2 116.8
W/SALE & RETAIL TRADE 202.6 177.8 178.4 195.2
HOTELS & RESTAURANTS 218.2 199.8 198.2 233.5
TRANSPORT 182.9 189.3 194.2 200.6
COMMUNICATIONS 111.3 122.4 132.0 141.7
BANKS & INSURANCE 144.1 153.3 160.5 169.6
REAL ESTATE & HOUSING 92.8 96.0 98.9 100.1
GOVERNMENT SERVICES 233.0 222.8 234.2 241.5
OTHER SERVICES 75.5 78.5 80.3 82.9
LESS: FISIM 122.2 124.1 126.8 136.6
Table 12.3: Gross Value Added By Industry in Current Basic Prices
Table 12.2: Gross Value Added By Industry in Constant 1990 Basic Prices
118

SAINT LUCIA
Fig 12.4: GVA at Factor Cost in Current and Constant 1990 Basic Prices
0
200
400
600
800
1000
1200
1400
1600
1800
2000 2001 2002 2003
$EC
Mn
CONSTANT 1990 BASIC PRICES CURRENT BASIC PRICES
119
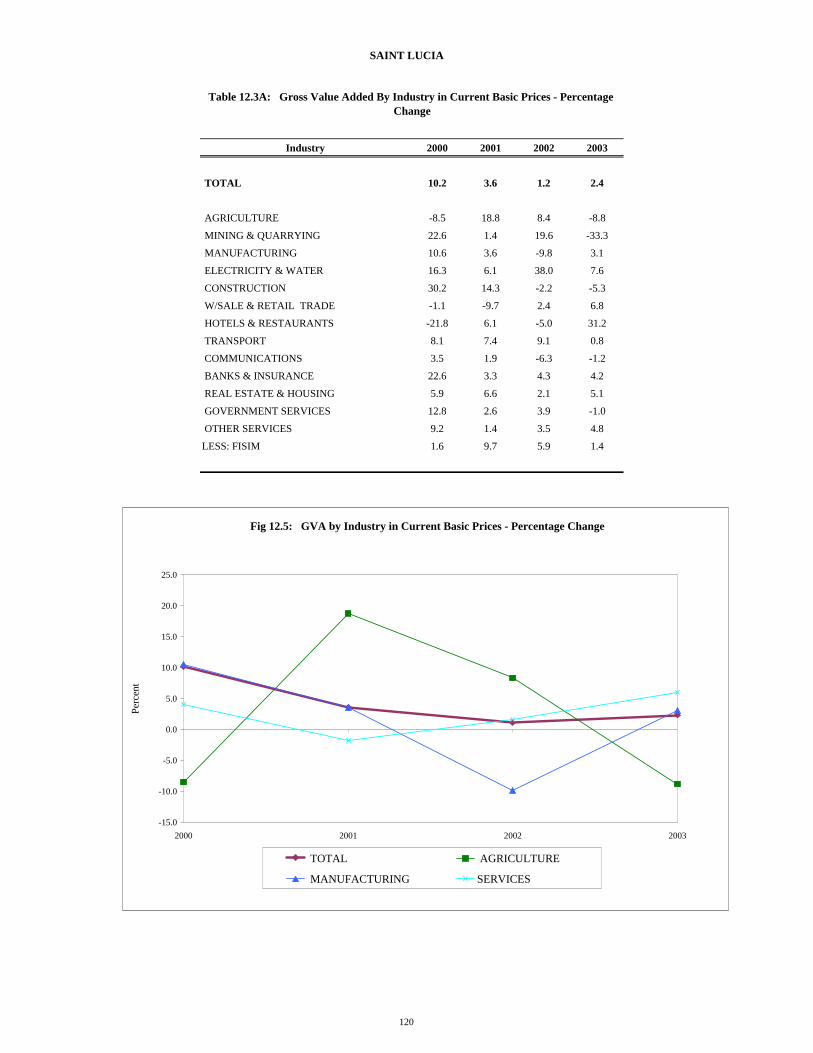
SAINT LUCIA
Industry 2000 2001 2002 2003
TOTAL 10.2 3.6 1.2 2.4
AGRICULTURE -8.5 18.8 8.4 -8.8
MINING & QUARRYING 22.6 1.4 19.6 -33.3
MANUFACTURING 10.6 3.6 -9.8 3.1
ELECTRICITY & WATER 16.3 6.1 38.0 7.6
CONSTRUCTION 30.2 14.3 -2.2 -5.3
W/SALE & RETAIL TRADE -1.1 -9.7 2.4 6.8
HOTELS & RESTAURANTS -21.8 6.1 -5.0 31.2
TRANSPORT 8.1 7.4 9.1 0.8
COMMUNICATIONS 3.5 1.9 -6.3 -1.2
BANKS & INSURANCE 22.6 3.3 4.3 4.2
REAL ESTATE & HOUSING 5.9 6.6 2.1 5.1
GOVERNMENT SERVICES 12.8 2.6 3.9 -1.0
OTHER SERVICES 9.2 1.4 3.5 4.8
LESS: FISIM 1.6 9.7 5.9 1.4
Table 12.3A: Gross Value Added By Industry in Current Basic Prices - Percentage Change
Fig 12.5: GVA by Industry in Current Basic Prices - Percentage Change
-15.0
-10.0
-5.0
0.0
5.0
10.0
15.0
20.0
25.0
2000 2001 2002 2003
Perc
ent
TOTAL AGRICULTURE
MANUFACTURING SERVICES
120

SAINT LUCIA
$EC Mn
Industry 2000 2001 2002 2003
TOTAL 100.0 100.0 100.0 100.0
AGRICULTURE 7.4 6.8 6.4 5.3
MINING & QUARRYING 0.5 0.4 0.4 0.4
MANUFACTURING 5.1 4.8 4.8 4.9
ELECTRICITY & WATER 5.6 5.8 5.5 5.3
CONSTRUCTION 8.4 8.3 7.7 7.3
W/SALE & RETAIL TRADE 13.0 11.8 11.7 12.2
HOTELS & RESTAURANTS 14.0 13.2 13.0 14.6
TRANSPORT 11.7 12.5 12.7 12.5
COMMUNICATIONS 7.1 8.1 8.6 8.9
BANKS & INSURANCE 9.2 10.1 10.5 10.6
REAL ESTATE & HOUSING 6.0 6.4 6.5 6.3
GOVERNMENT SERVICES 15.0 14.7 15.3 15.1
OTHER SERVICES 4.8 5.2 5.3 5.2
LESS: FISIM 7.8 8.2 8.3 8.5
$EC Mn
EXPENDITURE GROUPS 2000 2001 2002 2003
GROSS DOMESTIC PRODUCT (Current Market Prices) 1848.8 1769.7 1816.6 1912.6
TOTAL CONSUMPTION 1516.8 1439.7 1611.2 1704.5
Private 1086.7 950.2 1119.0 1246.5
General Government 430.1 489.5 492.1 458.0
GROSS CAPITAL FORMATION 490.7 459.4 415.9 408.4
Transport Equiptment 40.9 42.5 35.8 46.6
Other Equiptment 139.0 117.2 98.0 91.1
Construction 310.8 299.7 282.1 270.7
GOODS AND NON-FACTOR SERVICES -158.7 -129.4 -210.5 -200.3
Exports of Goods 153.2 146.1 188.9 189.0
Exports of NFS 867.0 765.2 684.7 907.1
Imports of Goods 843.6 734.6 747.9 932.9
Imports of NFS 335.3 306.1 336.2 363.5
Table 12.3B: Gross Value Added By Industry in Current Basic Prices - Percentage Distribution
Table 12.4: Expenditure on Gross Domestic Product in Current Prices
121

SAINT LUCIA
EXPENDITURE GROUPS 2000 2001 2002 2003
GROSS DOMESTIC PRODUCT (Current Market Prices) 100.0 100.0 100.0 100.0
TOTAL CONSUMPTION 82.0 81.4 88.7 89.1
Private 58.8 53.7 61.6 65.2
General Government 23.3 27.7 27.1 23.9
GROSS CAPITAL FORMATION 26.5 26.0 22.9 21.4
Transport Equiptment 2.2 2.4 2.0 2.4
Other Equiptment 7.5 6.6 5.4 4.8
Construction 16.8 16.9 15.5 14.2
GOODS AND NON-FACTOR SERVICES -8.6 -7.3 -11.6 -10.5
Exports of Goods 8.3 8.3 10.4 9.9
Exports of NFS 46.9 43.2 37.7 47.4
Imports of Goods 45.6 41.5 41.2 48.8
Imports of NFS 18.1 17.3 18.5 19.0
Table 12.4A: Expenditure on Gross Domestic Product in Current Prices - Percentage Distribution
Fig 12.6: Expenditure on GDP in Current Prices - Percentage Distribution, 2000
58.8
23.3
26.5
-8.6
PRIVATE
GENERAL GOVERNMENT
GROSS CAPITAL FORMATION
GOODS AND NON-FACTOR SERVICES
Fig 12.7: Expenditure on GDP in Current Prices - Percentage
Distribution, 2003
65.2
23.9
21.4
-10.5
PRIVATE
GENERAL GOVERNMENT
GROSS CAPITAL FORMATION
GOODS AND NON-FACTOR SERVICES
122

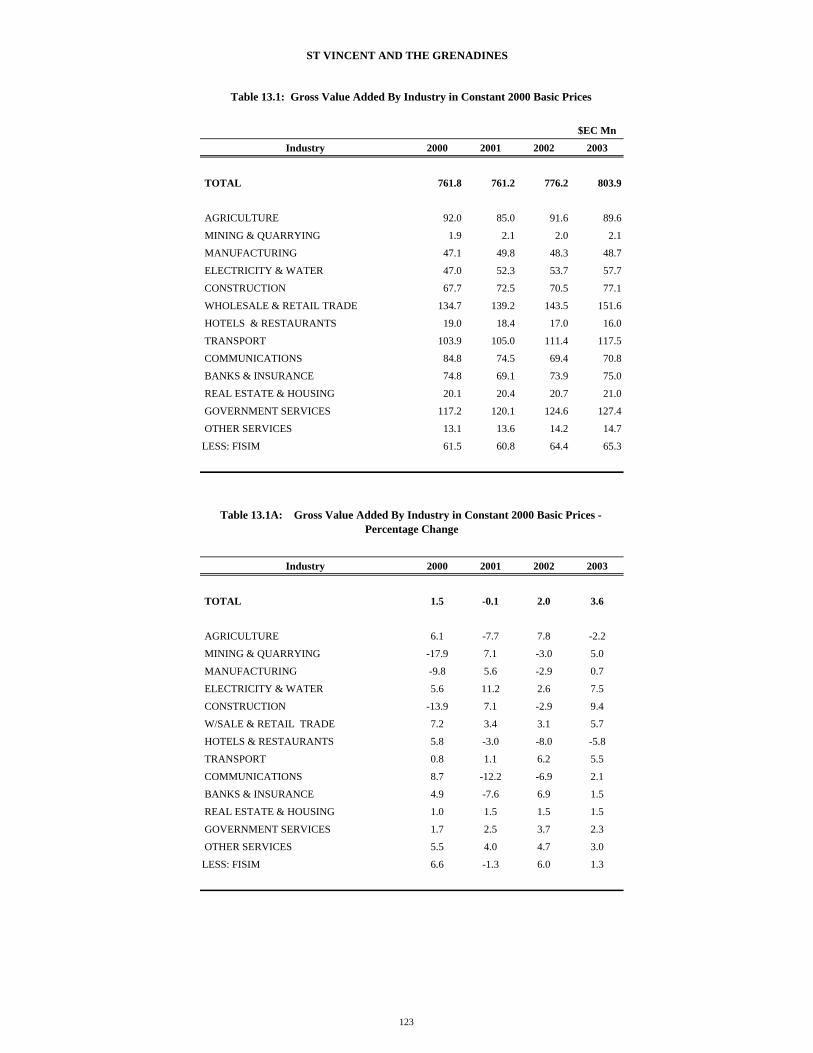
ST VINCENT AND THE GRENADINES
$EC Mn
Industry 2000 2001 2002 2003
TOTAL 761.8 761.2 776.2 803.9
AGRICULTURE 92.0 85.0 91.6 89.6
MINING & QUARRYING 1.9 2.1 2.0 2.1
MANUFACTURING 47.1 49.8 48.3 48.7
ELECTRICITY & WATER 47.0 52.3 53.7 57.7
CONSTRUCTION 67.7 72.5 70.5 77.1
WHOLESALE & RETAIL TRADE 134.7 139.2 143.5 151.6
HOTELS & RESTAURANTS 19.0 18.4 17.0 16.0
TRANSPORT 103.9 105.0 111.4 117.5
COMMUNICATIONS 84.8 74.5 69.4 70.8
BANKS & INSURANCE 74.8 69.1 73.9 75.0
REAL ESTATE & HOUSING 20.1 20.4 20.7 21.0
GOVERNMENT SERVICES 117.2 120.1 124.6 127.4
OTHER SERVICES 13.1 13.6 14.2 14.7
LESS: FISIM 61.5 60.8 64.4 65.3
Industry 2000 2001 2002 2003
TOTAL 1.5 -0.1 2.0 3.6
AGRICULTURE 6.1 -7.7 7.8 -2.2
MINING & QUARRYING -17.9 7.1 -3.0 5.0
MANUFACTURING -9.8 5.6 -2.9 0.7
ELECTRICITY & WATER 5.6 11.2 2.6 7.5
CONSTRUCTION -13.9 7.1 -2.9 9.4
W/SALE & RETAIL TRADE 7.2 3.4 3.1 5.7
HOTELS & RESTAURANTS 5.8 -3.0 -8.0 -5.8
TRANSPORT 0.8 1.1 6.2 5.5
COMMUNICATIONS 8.7 -12.2 -6.9 2.1
BANKS & INSURANCE 4.9 -7.6 6.9 1.5
REAL ESTATE & HOUSING 1.0 1.5 1.5 1.5
GOVERNMENT SERVICES 1.7 2.5 3.7 2.3
OTHER SERVICES 5.5 4.0 4.7 3.0
LESS: FISIM 6.6 -1.3 6.0 1.3
Table 13.1: Gross Value Added By Industry in Constant 2000 Basic Prices
Table 13.1A: Gross Value Added By Industry in Constant 2000 Basic Prices - Percentage Change
123

ST VINCENT AND THE GRENADINES
Fig 13.1: GVA by Industry in Constant 2000 Basic Prices - Percentage Change
-12.0
-10.0
-8.0
-6.0
-4.0
-2.0
0.0
2.0
4.0
6.0
8.0
10.0
2000 2001 2002 2003
Perc
ent
TOTAL AGRICULTURE
MANUFACTURING SERVICES
124

ST VINCENT AND THE GRENADINES
Industry 2000 2001 2002 2003
TOTAL 100.0 100.0 100.0 100.0
AGRICULTURE 12.1 11.2 11.8 11.1
MINING & QUARRYING 0.3 0.3 0.3 0.3
MANUFACTURING 6.2 6.5 6.2 6.1
ELECTRICITY & WATER 6.2 6.9 6.9 7.2
CONSTRUCTION 8.9 9.5 9.1 9.6
W/SALE & RETAIL TRADE 17.7 18.3 18.5 18.9
HOTELS & RESTAURANTS 2.5 2.4 2.2 2.0
TRANSPORT 13.6 13.8 14.4 14.6
COMMUNICATIONS 11.1 9.8 8.9 8.8
BANKS & INSURANCE 9.8 9.1 9.5 9.3
REAL ESTATE & HOUSING 2.6 2.7 2.7 2.6
GOVERNMENT SERVICES 15.4 15.8 16.0 15.8
OTHER SERVICES 1.7 1.8 1.8 1.8
LESS: FISIM 8.1 8.0 8.3 8.1
Table 13.1B: Gross Value Added By Industry in Constant 2000 Basic Prices - Percentage Distribution
Fig 13.2 GVA by Industry in Constant 2000 Basic Prices - Percentage Distribution, 2000
12.117.7
13.6
11.1
15.4
30.1
AGRICULTURE W/SALE & RETAIL TRADE TRANSPORT COMMUNICATIONS GOVERNMENT SERVICESOTHER SECTORS
Fig 13.3: GVA by Industry in Constant 2000 Basic Prices - Percentage Distribution, 2003
11.19.6
18.9
14.6
15.8
30.0
AGRICULTURE CONSTRUCTION W/SALE & RETAIL TRADE TRANSPORT GOVERNMENT SERVICESOTHER SECTORS
125

ST VINCENT AND THE GRENADINES
$EC Mn
Industry 2000 2001 2002 2003
TOTAL 612.9 612.3 624.5 646.7
AGRICULTURE 74.0 68.4 73.7 72.1
MINING & QUARRYING 1.6 1.7 1.6 1.7
MANUFACTURING 37.9 40.1 38.9 39.2
ELECTRICITY & WATER 37.8 42.1 43.2 46.4
CONSTRUCTION 54.5 58.4 56.7 62.0
W/SALE & RETAIL TRADE 108.3 112.0 115.4 122.0
HOTELS & RESTAURANTS 15.3 14.8 13.7 12.9
TRANSPORT 83.6 84.4 89.7 94.5
COMMUNICATIONS 68.2 59.9 55.8 57.0
BANKS & INSURANCE 60.2 55.6 59.4 60.3
REAL ESTATE & HOUSING 16.2 16.4 16.6 16.9
GOVERNMENT SERVICES 94.3 96.6 100.2 102.5
OTHER SERVICES 10.5 10.9 11.5 11.8
LESS: FISIM 49.5 48.9 51.8 52.5
$EC Mn
Industry 2000 2001 2002 2003
TOTAL 761.8 776.7 805.5 836.4
AGRICULTURE 82.4 74.7 80.5 75.1
MINING & QUARRYING 1.7 1.9 1.9 2.0
MANUFACTURING 46.0 53.0 54.5 54.9
ELECTRICITY & WATER 49.0 51.0 49.7 52.8
CONSTRUCTION 85.9 92.3 92.7 101.9
W/SALE & RETAIL TRADE 138.4 144.3 149.9 158.9
HOTELS & RESTAURANTS 18.1 17.6 17.0 16.1
TRANSPORT 105.5 107.4 112.4 121.7
COMMUNICATIONS 49.7 43.6 40.4 45.4
BANKS & INSURANCE 60.5 55.9 60.0 61.4
REAL ESTATE & HOUSING 18.4 18.8 19.2 19.9
GOVERNMENT SERVICES 140.9 149.7 162.6 161.7
OTHER SERVICES 14.8 15.5 16.3 17.0
LESS: FISIM 49.3 48.7 51.6 52.3
Table 13.3: Gross Value Added By Industry in Current Basic Prices
Table 13.2: Gross Value Added By Industry in Constant 1990 Basic Prices
126
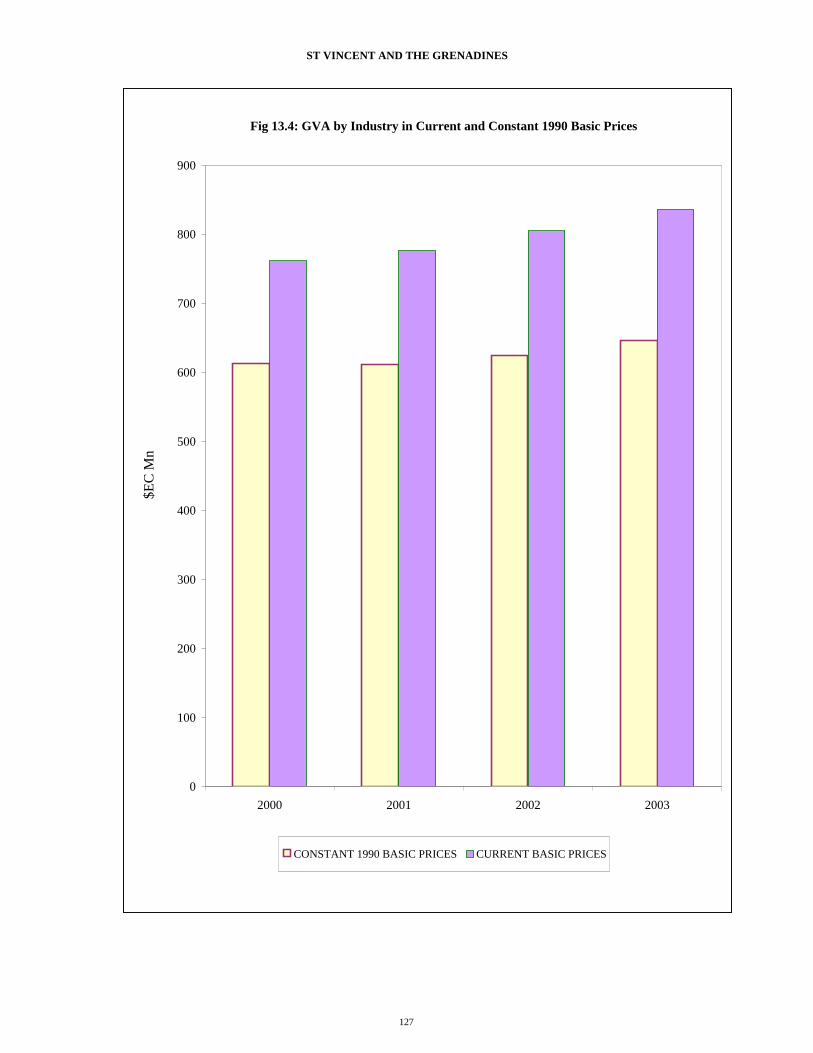
ST VINCENT AND THE GRENADINES
Fig 13.4: GVA by Industry in Current and Constant 1990 Basic Prices
0
100
200
300
400
500
600
700
800
900
2000 2001 2002 2003
$EC
Mn
CONSTANT 1990 BASIC PRICES CURRENT BASIC PRICES
127

ST VINCENT AND THE GRENADINES
Industry 2000 2001 2002 2003
TOTAL 1.7 2.0 3.7 3.8
AGRICULTURE 4.8 -9.4 7.8 -6.7
MINING & QUARRYING -17.6 6.9 0.5 5.9
MANUFACTURING -1.5 15.1 2.9 0.7
ELECTRICITY & WATER 14.2 4.1 -2.5 6.3
CONSTRUCTION -11.6 7.4 0.4 10.0
W/SALE & RETAIL TRADE 8.4 4.3 3.9 6.0
HOTELS & RESTAURANTS 6.3 -2.5 -3.1 -5.8
TRANSPORT 2.4 1.8 4.7 8.3
COMMUNICATIONS -5.6 -12.3 -7.2 12.3
BANKS & INSURANCE 2.1 -7.7 7.4 2.2
REAL ESTATE & HOUSING 2.2 2.3 2.3 3.5
GOVERNMENT SERVICES 5.6 6.3 8.6 -0.5
OTHER SERVICES 6.2 4.8 5.5 4.0
LESS: FISIM 14.7 -1.3 6.0 1.3
Table 13.3A: Gross Value Added By Industry in Current Basic Prices - Percentage Change
Fig 13.5: GVA by Industry in Current Basic Prices - Percentage Change
-15.0
-10.0
-5.0
0.0
5.0
10.0
15.0
20.0
2000 2001 2002 2003
Perc
ent
TOTAL AGRICULTURE
MANUFACTURING SERVICES
128

ST VINCENT AND THE GRENADINES
Industry 2000 2001 2002 2003
TOTAL 100.0 100.0 100.0 100.0
AGRICULTURE 10.8 9.6 10.0 9.0
MINING & QUARRYING 0.2 0.2 0.2 0.2
MANUFACTURING 6.0 6.8 6.8 6.6
ELECTRICITY & WATER 6.4 6.6 6.2 6.3
CONSTRUCTION 11.3 11.9 11.5 12.2
W/SALE & RETAIL TRADE 18.2 18.6 18.6 19.0
HOTELS & RESTAURANTS 2.4 2.3 2.1 1.9
TRANSPORT 13.8 13.8 13.9 14.6
COMMUNICATIONS 6.5 5.6 5.0 5.4
BANKS & INSURANCE 7.9 7.2 7.5 7.3
REAL ESTATE & HOUSING 2.4 2.4 2.4 2.4
GOVERNMENT SERVICES 18.5 19.3 20.2 19.3
OTHER SERVICES 1.9 2.0 2.0 2.0
LESS: FISIM 6.5 6.3 6.4 6.3
$EC Mn
EXPENDITURE GROUPS 2000 2001 2002 2003
GROSS DOMESTIC PRODUCT (Current Market Prices) 904.6 932.8 974.5 1,015.5
TOTAL CONSUMPTION 729.6 755.9 792.0 846.7
Private 553.8 571.3 590.1 647.4
General Government 175.8 184.6 201.9 199.3
GROSS CAPITAL FORMATION 247.1 277.8 292.8 343.9
Transport Equiptment 22.2 28.7 21.7 16.1
Other Machinery and Equipment 51.2 62.5 83.7 120.9
Construction 173.7 186.6 187.3 206.9
Land development - - - -
Increase in Stocks - - - -
GOODS AND NON-FACTOR SERVICES -72.1 -100.9 -110.3 -175.1
Exports of Goods 139.7 115.4 109.2 105.6
Exports of NFS 340.0 354.8 367.4 370.0
Imports of Goods 389.8 410.3 424.5 477.7
Imports of NFS 162.1 160.9 162.4 172.9
Table 13.3B: Gross Value Added By Industry in Current Basic Prices - Percentage Distribution
Table 13.4: Expenditure on Gross Domestic Product in Current Prices
129

ST VINCENT AND THE GRENADINES
EXPENDITURE GROUPS 2000 2001 2002 2003
GROSS DOMESTIC PRODUCT (Current Market Prices) 100.0 100.0 100.0 100.0
TOTAL CONSUMPTION 80.7 81.0 81.3 83.4
Private 61.2 61.2 60.6 63.8
General Government 19.4 19.8 20.7 19.6
GROSS CAPITAL FORMATION 27.3 29.8 30.0 33.9
Transport Equiptment 2.5 3.1 2.2 1.6
Other Machinery and Equip. 5.7 6.7 8.6 11.9
Construction 19.2 20.0 19.2 20.4
Land development - - - -
Increase in Stocks - - - -
GOODS AND NON-FACTOR SERVICES -8.0 -10.8 -11.3 -17.2
Exports of Goods 15.4 12.4 11.2 10.4
Exports of NFS 37.6 38.0 37.7 36.4
Imports of Goods 43.1 44.0 43.6 47.0
Imports of NFS 17.9 17.2 16.7 17.0
Table 13.4A: Expenditure on Gross Domestic Product in Current Prices - Percentage Distribution
Fig 13.6: Expenditure on GDP in Current Prices - Percentage Distribution, 2000
61.2
19.4
27.3
-8.0
PRIVATE
GENERAL GOVERNMENT
GROSS CAPITAL FORMATION
GOODS AND NON-FACTOR SERVICES
Fig 13.7: Expenditure on GDP in Current Prices - Percentage Distribution, 2003
63.8
19.6
33.9
-17.2
PRIVATE
GENERAL GOVERNMENT
GROSS CAPITAL FORMATION
GOODS AND NON-FACTOR SERVICES
130

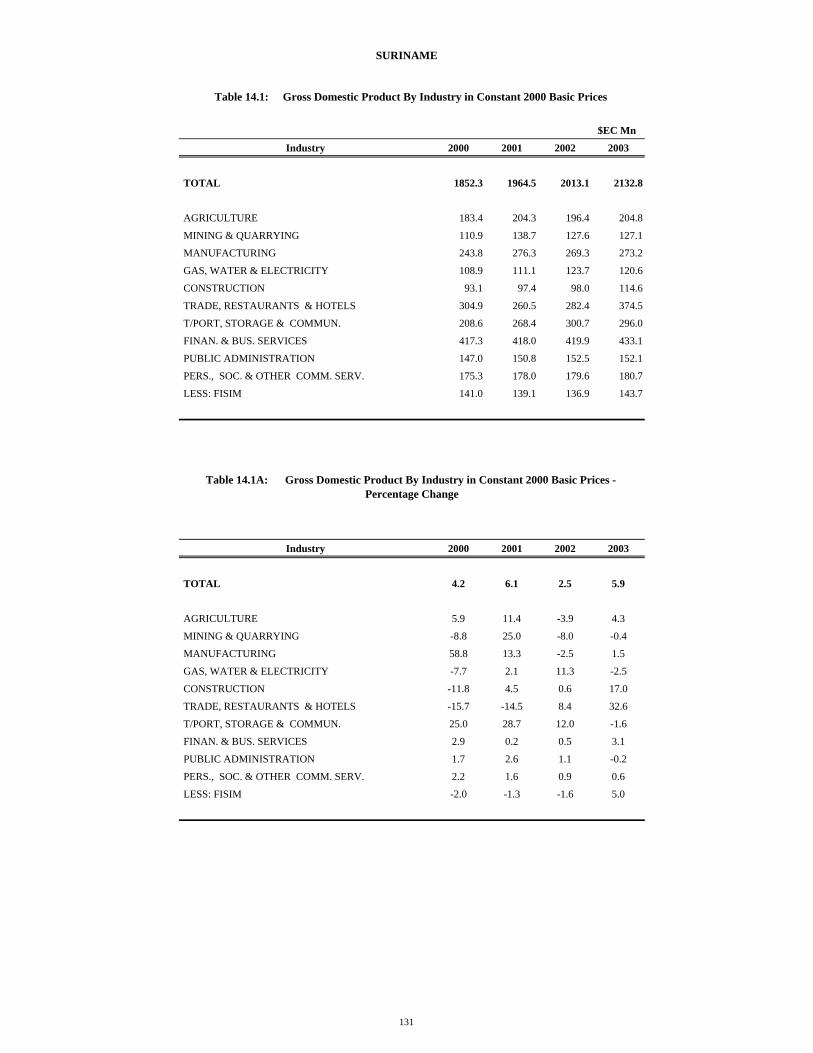
SURINAME
$EC Mn
Industry 2000 2001 2002 2003
TOTAL 1852.3 1964.5 2013.1 2132.8
AGRICULTURE 183.4 204.3 196.4 204.8
MINING & QUARRYING 110.9 138.7 127.6 127.1
MANUFACTURING 243.8 276.3 269.3 273.2
GAS, WATER & ELECTRICITY 108.9 111.1 123.7 120.6
CONSTRUCTION 93.1 97.4 98.0 114.6
TRADE, RESTAURANTS & HOTELS 304.9 260.5 282.4 374.5
T/PORT, STORAGE & COMMUN. 208.6 268.4 300.7 296.0
FINAN. & BUS. SERVICES 417.3 418.0 419.9 433.1
PUBLIC ADMINISTRATION 147.0 150.8 152.5 152.1
PERS., SOC. & OTHER COMM. SERV. 175.3 178.0 179.6 180.7
LESS: FISIM 141.0 139.1 136.9 143.7
Industry 2000 2001 2002 2003
TOTAL 4.2 6.1 2.5 5.9
AGRICULTURE 5.9 11.4 -3.9 4.3
MINING & QUARRYING -8.8 25.0 -8.0 -0.4
MANUFACTURING 58.8 13.3 -2.5 1.5
GAS, WATER & ELECTRICITY -7.7 2.1 11.3 -2.5
CONSTRUCTION -11.8 4.5 0.6 17.0
TRADE, RESTAURANTS & HOTELS -15.7 -14.5 8.4 32.6
T/PORT, STORAGE & COMMUN. 25.0 28.7 12.0 -1.6
FINAN. & BUS. SERVICES 2.9 0.2 0.5 3.1
PUBLIC ADMINISTRATION 1.7 2.6 1.1 -0.2
PERS., SOC. & OTHER COMM. SERV. 2.2 1.6 0.9 0.6
LESS: FISIM -2.0 -1.3 -1.6 5.0
Table 14.1A: Gross Domestic Product By Industry in Constant 2000 Basic Prices - Percentage Change
Table 14.1: Gross Domestic Product By Industry in Constant 2000 Basic Prices
131

SURINAME
Fig 14.1: GDP by Industry in Constant 2000 Basic Prices - Percentage Change (Based on $EC Mn)
-10.0
0.0
10.0
20.0
30.0
40.0
50.0
60.0
70.0
2000 2001 2002 2003
Perc
ent
TOTAL AGRICULTURE
MANUFACTURING SERVICES
132
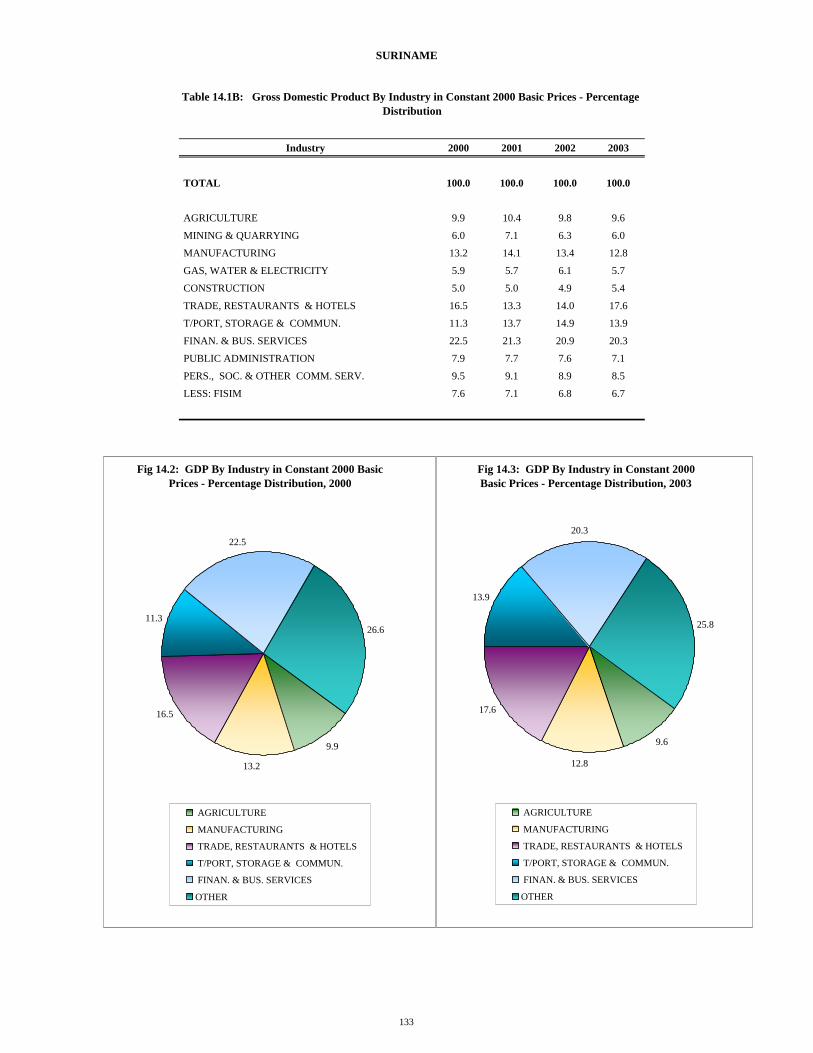
SURINAME
Industry 2000 2001 2002 2003
TOTAL 100.0 100.0 100.0 100.0
AGRICULTURE 9.9 10.4 9.8 9.6
MINING & QUARRYING 6.0 7.1 6.3 6.0
MANUFACTURING 13.2 14.1 13.4 12.8
GAS, WATER & ELECTRICITY 5.9 5.7 6.1 5.7
CONSTRUCTION 5.0 5.0 4.9 5.4
TRADE, RESTAURANTS & HOTELS 16.5 13.3 14.0 17.6
T/PORT, STORAGE & COMMUN. 11.3 13.7 14.9 13.9
FINAN. & BUS. SERVICES 22.5 21.3 20.9 20.3
PUBLIC ADMINISTRATION 7.9 7.7 7.6 7.1
PERS., SOC. & OTHER COMM. SERV. 9.5 9.1 8.9 8.5
LESS: FISIM 7.6 7.1 6.8 6.7
Table 14.1B: Gross Domestic Product By Industry in Constant 2000 Basic Prices - Percentage Distribution
Fig 14.2: GDP By Industry in Constant 2000 Basic Prices - Percentage Distribution, 2000
9.9
13.2
16.5
11.3
22.5
26.6
AGRICULTURE
MANUFACTURING
TRADE, RESTAURANTS & HOTELS
T/PORT, STORAGE & COMMUN.
FINAN. & BUS. SERVICES
OTHER
Fig 14.3: GDP By Industry in Constant 2000 Basic Prices - Percentage Distribution, 2003
9.6
12.8
17.6
13.9
20.3
25.8
AGRICULTURE
MANUFACTURING
TRADE, RESTAURANTS & HOTELS
T/PORT, STORAGE & COMMUN.
FINAN. & BUS. SERVICES
OTHER
133

SURINAME
SF MnIndustry 2000 2001 2002 2003
TOTAL 3082.2 3268.9 3349.9 3549.0
AGRICULTURE 305.1 340.0 326.8 340.7
MINING & QUARRYING 184.6 230.8 212.3 211.5
MANUFACTURING 405.7 459.7 448.1 454.6
GAS, WATER & ELECTRICITY 181.1 184.9 205.8 200.6
CONSTRUCTION 155.0 162.0 163.0 190.7
TRADE, RESTAURANTS & HOTELS 507.3 433.5 469.9 623.2
T/PORT, STORAGE & COMMUN. 347.2 446.7 500.3 492.5
FINAN. & BUS. SERVICES 694.4 695.6 698.8 720.6
PUBLIC ADMINISTRATION 244.7 250.9 253.7 253.1
PERS., SOC. & OTHER COMM. SERV. 291.7 296.3 298.9 300.6
LESS: FISIM 234.6 231.5 227.7 239.2
SF MnIndustry 2000 2001 2002 2003
TOTAL 918723.4 1223869.6 1681780.4 2147171.0
AGRICULTURE 119328.6 165411.3 173525.3 216713.0
MINING & QUARRYING 45612.0 42846.0 78399.0 116420.0
MANUFACTURING 156053.0 184222.0 240102.0 304201.0
GAS, WATER & ELECTRICITY 38150.0 61961.0 64907.0 71699.0
CONSTRUCTION 34480.1 51597.9 61982.6 84654.0
TRADE, RESTAURANTS & HOTELS 140948.0 167059.0 209039.0 344408.0
T/PORT, STORAGE & COMMUN. 87877.0 114889.0 182037.0 238986.0
FINAN. & BUS. SERVICES 141772.0 250383.0 316791.0 389436.0
PUBLIC ADMINISTRATION 96741.3 125456.0 221786.9 244916.0
PERS., SOC. & OTHER COMM. SERV. 93795.9 117807.4 201399.6 225007.0
LESS: FISIM 36034.4 57763.0 68189.0 89269.0
Table 14.3: Gross Domestic Product By Industry in Current Basic Prices
Table 14.2: Gross Domestic Product By Industry in Constant 1990 Basic Prices
134
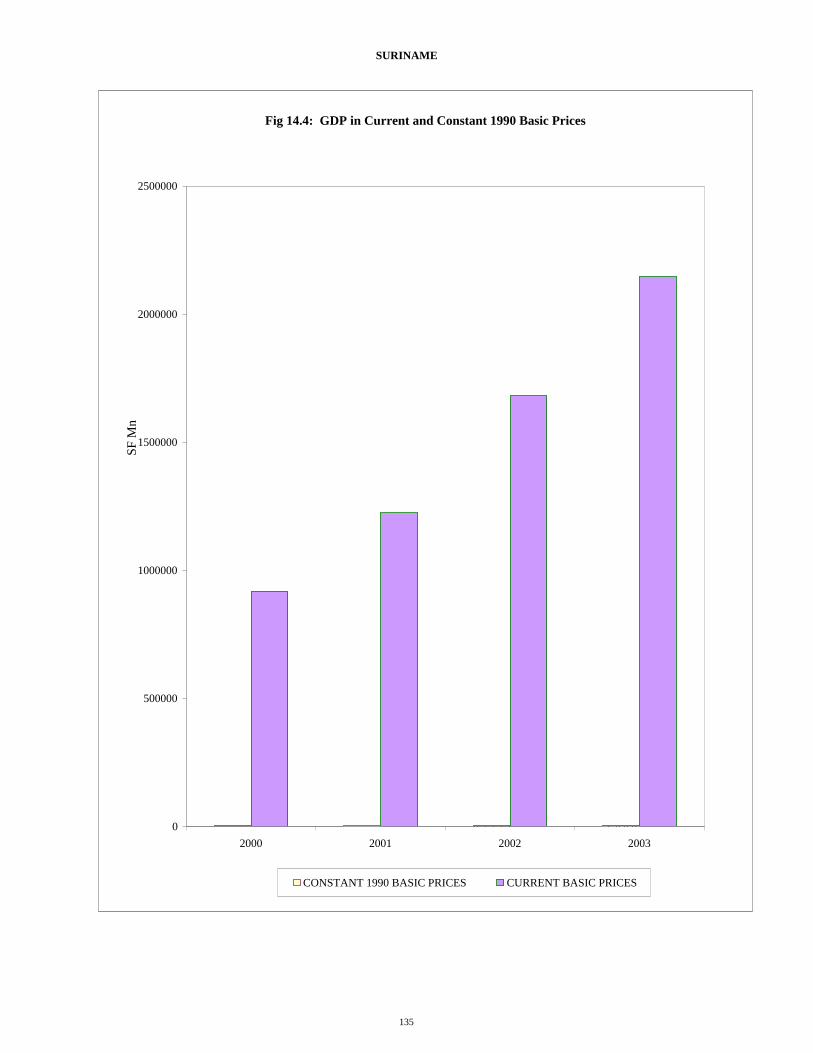
SURINAME
Fig 14.4: GDP in Current and Constant 1990 Basic Prices
0
500000
1000000
1500000
2000000
2500000
2000 2001 2002 2003
SF M
n
CONSTANT 1990 BASIC PRICES CURRENT BASIC PRICES
135

SURINAME
Industry 2000 2001 2002 2003
TOTAL 65.7 33.2 37.4 27.7
AGRICULTURE 85.3 38.6 4.9 24.9
MINING & QUARRYING -19.2 -6.1 83.0 48.5
MANUFACTURING 159.1 18.1 30.3 26.7
GAS, WATER & ELECTRICITY 49.5 62.4 4.8 10.5
CONSTRUCTION 39.9 49.6 20.1 36.6
TRADE, RESTAURANTS & HOTELS 34.2 18.5 25.1 64.8
T/PORT, STORAGE & COMMUN. 95.3 30.7 58.4 31.3
FINAN. & BUS. SERVICES 56.2 76.6 26.5 22.9
PUBLIC ADMINISTRATION 69.1 29.7 76.8 10.4
PERS., SOC. & OTHER COMM. SERV. 64.8 25.6 71.0 11.7
LESS: FISIM 14.3 60.3 18.0 30.9
Table 14.3A: Gross Domestic Product By Industry in Current Basic Prices - Percentage Change
Fig 14.5: GDP by Industry in Current Basic Prices - Percentage Change (Based on $SF Mn )
0.0
20.0
40.0
60.0
80.0
100.0
120.0
140.0
160.0
180.0
2000 2001 2002 2003
Perc
ent
TOTAL AGRICULTURE MANUFACTURING SERVICES
136
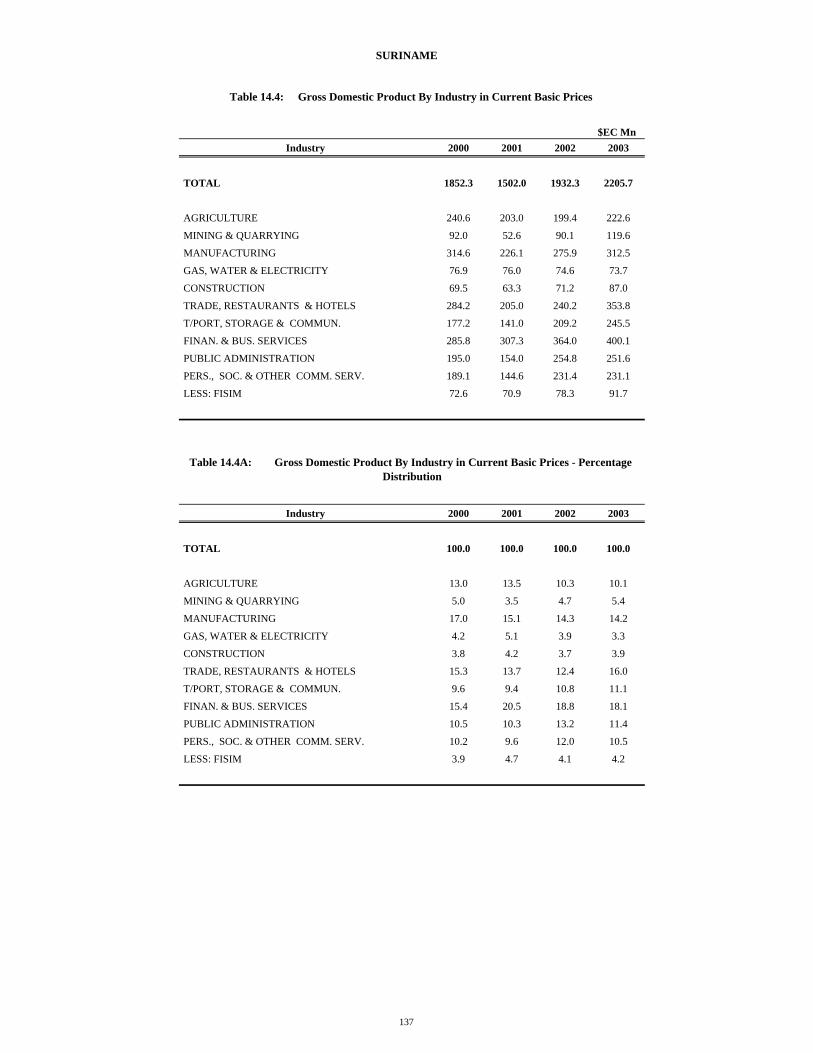
SURINAME
$EC Mn Industry 2000 2001 2002 2003
TOTAL 1852.3 1502.0 1932.3 2205.7
AGRICULTURE 240.6 203.0 199.4 222.6
MINING & QUARRYING 92.0 52.6 90.1 119.6
MANUFACTURING 314.6 226.1 275.9 312.5
GAS, WATER & ELECTRICITY 76.9 76.0 74.6 73.7
CONSTRUCTION 69.5 63.3 71.2 87.0
TRADE, RESTAURANTS & HOTELS 284.2 205.0 240.2 353.8
T/PORT, STORAGE & COMMUN. 177.2 141.0 209.2 245.5
FINAN. & BUS. SERVICES 285.8 307.3 364.0 400.1
PUBLIC ADMINISTRATION 195.0 154.0 254.8 251.6
PERS., SOC. & OTHER COMM. SERV. 189.1 144.6 231.4 231.1
LESS: FISIM 72.6 70.9 78.3 91.7
Industry 2000 2001 2002 2003
TOTAL 100.0 100.0 100.0 100.0
AGRICULTURE 13.0 13.5 10.3 10.1
MINING & QUARRYING 5.0 3.5 4.7 5.4
MANUFACTURING 17.0 15.1 14.3 14.2
GAS, WATER & ELECTRICITY 4.2 5.1 3.9 3.3
CONSTRUCTION 3.8 4.2 3.7 3.9
TRADE, RESTAURANTS & HOTELS 15.3 13.7 12.4 16.0
T/PORT, STORAGE & COMMUN. 9.6 9.4 10.8 11.1
FINAN. & BUS. SERVICES 15.4 20.5 18.8 18.1
PUBLIC ADMINISTRATION 10.5 10.3 13.2 11.4
PERS., SOC. & OTHER COMM. SERV. 10.2 9.6 12.0 10.5
LESS: FISIM 3.9 4.7 4.1 4.2
Table 14.4: Gross Domestic Product By Industry in Current Basic Prices
Table 14.4A: Gross Domestic Product By Industry in Current Basic Prices - Percentage Distribution
137

SURINAME
$EC Mn EXPENDITURE GROUPS 2000 2001 2002 2003
GROSS DOMESTIC PRODUCT (Current Market Prices) 2065.3 1777.0 2381.2 2997.7
FINAL CONSUMPTION EXPENDITURE … … … …
Government 519.0 507.2 643.9 954.8
Private … … … …
GROSS CAPITAL FORMATION 419.4 … … …
Gross Fixed Capital Formation 321.7 … … …
Increase in Stocks 97.7 … … …
GOODS AND NON-FACTOR SERVICES 128.0 50.5 -210.1 -285.4
Exports of Goods and Services 1292.4 1317.8 999.8 1476.6
Less: Imports of Goods and services 1164.4 1267.3 1209.9 1762.0
EXPENDITURE GROUPS 2000 2001 2002 2003
GROSS DOMESTIC PRODUCT (Current Market Prices) 100.0 100.0 100.0 100.0
FINAL CONSUMPTION EXPENDITURE … … … …
Government 25.1 28.5 27.0 31.8
Private … … … …
GROSS CAPITAL FORMATION 20.3 … … …
Gross Fixed Capital Formation 15.6 … … …
Increase in Stocks 4.7 … … …
GOODS AND NON-FACTOR SERVICES 6.2 2.8 -8.8 -9.5
Exports of Goods and Services 62.6 74.2 42.0 49.3
Less: Imports of Goods and services 56.4 71.3 50.8 58.8
Table 14.5A: Expenditure on Gross Domestic Product in Current Prices - Percentage Distribution
Table 14.5: Expenditure on Gross Domestic Product in Current Prices
138

SURINAME
SF MnEXPENDITURE GROUPS 2000 2001 2002 2003
GROSS DOMESTIC PRODUCT (Current Market Prices) 1024391.0 1447903.0 2240127.0 2918132.0
FINAL CONSUMPTION EXPENDITURE … … … …
Government 257405.0 413255.0 605782.6 929422.9
Private … … … …
GROSS CAPITAL FORMATION 208017.0 … … …
Gross Fixed Capital Formation 159549.0 … … …
Increase in Stocks 48468.0 … … …
GOODS AND NON-FACTOR SERVICES 63492.5 41148.2 -197631.7 -277814.5
Exports of Goods and Services 641019.3 1073795.8 940539.6 1437433.7
Less: Imports of Goods and services 577526.8 1032647.6 1138171.3 1715248.2
Table 14.6: Expenditure on Gross Domestic Product in Current Prices
139


TRINIDAD AND TOBAGO
$EC Mn
Industry 2000 2001 2002 2003
TOTAL 22103.7 23025.1 24848.9 28177.3
AGRICULTURE, FISHING & FORESTRY 269.0 261.7 277.2 227.9
MINING & QUARRYING 4172.9 4497.4 5046.0 6514.8
MANUFACTURE 3743.6 3973.2 4473.9 5644.1
ELECTRICITY & WATER 382.2 397.7 432.3 443.8
CONSTRUCTION 1649.3 1818.6 1726.2 2112.9
DISTRIBUTION SERVICES 3899.3 3814.3 3871.0 3950.7
HOTELS, G/ HOUSES & RESTAURANTS 399.3 411.3 418.7 409.1
T/PORT, STORAGE & COMMUN. 1897.7 2044.4 2236.8 2325.2
FIN., INS., REAL EST. & BUS. SERVICES 3143.2 3167.7 3533.2 3792.5
GENERAL GOVERNMENT 1672.6 1647.9 1708.1 1691.6
EDUC. CULT. & COMM. SERVICES 607.2 606.4 649.5 652.2
PERSONAL SERVICES 348.5 362.3 371.7 402.3
LESS: FISIM 953.5 862.2 856.4 938.4
VALUE ADDED TAX 872.3 884.5 960.7 948.8
Industry 2000 2001 2002 2003
TOTAL 6.9 4.2 7.9 13.4
AGRICULTURE, FISHING & FORESTRY 2.8 -2.7 5.9 -17.8
MINING & QUARRYING 10.0 7.8 12.2 29.1
MANUFACTURE 13.8 6.1 12.6 26.2
ELECTRICITY & WATER 5.5 4.1 8.7 2.7
CONSTRUCTION 7.6 10.3 -5.1 22.4
DISTRIBUTION SERVICES … -2.2 1.5 2.1
HOTELS, G/ HOUSES & RESTAURANTS … 3.0 1.8 -2.3
T/PORT, STORAGE & COMMUN. 8.9 7.7 9.4 3.9
FIN., INS., REAL EST. & BUS. SERVICES 12.4 0.8 11.5 7.3
GENERAL GOVERNMENT -6.1 -1.5 3.7 -1.0
EDUC. CULT. & COMM. SERVICES -0.8 -0.1 7.1 0.4
PERSONAL SERVICES -1.0 4.0 2.6 8.2
LESS: FISIM 14.4 -9.6 -0.7 9.6
VALUE ADDED TAX -1.4 1.4 8.6 -1.2
Table 15.1: Gross Domestic Product By Industry in Constant 2000 Market Prices
Table 15.1A: Gross Domestic Product By Industry in Constant 2000 Market Prices - Percentage Change
141

TRINIDAD AND TOBAGO
Fig 5.1: GDP by Industry in Constant 2000 Market Prices - Percentage Change (Based on $EC Mn)
-20.0
-15.0
-10.0
-5.0
0.0
5.0
10.0
15.0
20.0
25.0
30.0
2000 2001 2002 2003
Perc
ent
TOTAL AGRICULTUREMANUFACTURE SERVICES
142

TRINIDAD AND TOBAGO
Industry 2000 2001 2002 2003
TOTAL 100.0 100.0 100.0 100.0
AGRICULTURE, FISHING & FORESTRY 1.2 1.1 1.1 0.8
MINING & QUARRYING 18.9 19.5 20.3 23.1
MANUFACTURE 16.9 17.3 18.0 20.0
ELECTRICITY & WATER 1.7 1.7 1.7 1.6
CONSTRUCTION 7.5 7.9 6.9 7.5
DISTRIBUTION SERVICES 17.6 16.6 15.6 14.0
HOTELS, G/ HOUSES & RESTAURANTS 1.8 1.8 1.7 1.5
T/PORT, STORAGE & COMMUN. 8.6 8.9 9.0 8.3
FIN., INS., REAL EST. & BUS. SERVICES 14.2 13.8 14.2 13.5
GENERAL GOVERNMENT 7.6 7.2 6.9 6.0
EDUC. CULT. & COMM. SERVICES 2.7 2.6 2.6 2.3
PERSONAL SERVICES 1.6 1.6 1.5 1.4
LESS: FISIM 4.3 3.7 3.4 3.3
VALUE ADDED TAX 3.9 3.8 3.9 3.4
Table 15.1B: Gross Domestic Product By Industry in Constant 2000 Market Prices - Percentage Distribution
Fig 15.2: GDP by Industry at in Constant 2000 Prices - Percentage Distribution, 2000
18.9
16.9
17.6
8.6
14.2
23.8
MINING & QUARRYING
MANUFACTURE
DISTRIBUTION SERVICES
T/PORT, STORAGE & COMMUN.
FIN., INS., REAL EST. & BUS. SERVICES
OTHER
Fig 15.3: GDP by Industry in Constant 2000 Prices - Percentage Distribution, 2003
23.1
20.0
14.0
8.3
13.5
21.1
MINING & QUARRYING
MANUFACTUREDISTRIBUTION SERVICES
T/PORT, STORAGE & COMMUN.
FIN., INS., REAL EST. & BUS. SERVICESOTHER
143

TRINIDAD AND TOBAGO
$TT Mn
Industry 2000 2001 2002 2003
TOTAL 51370.7 53512.1 57750.7 65486.2
AGRICULTURE, FISHING & FORESTRY 625.2 608.2 644.2 529.6
MINING & QUARRYING* 9698.2 10452.3 11727.2 15140.9
MANUFACTURE 8700.4 9233.9 10397.7 13117.2
ELECTRICITY & WATER 888.2 924.2 1004.8 1031.5
CONSTRUCTION 3833.1 4226.5 4011.8 4910.5
DISTRIBUTION SERVICES 9062.3 8864.6 8996.4 9181.8
HOTELS, G/ HOUSES & RESTAURANTS 928.1 955.9 973.2 950.8
T/PORT, STORAGE & COMMUN. 4410.4 4751.4 5198.6 5403.9
FIN., INS., REAL EST. & BUS. SERVICES 7305.1 7362.0 8211.4 8814.0
GENERAL GOVERNMENT 3887.2 3829.9 3969.7 3931.3
EDUC. CULT. & COMM. SERVICES 1411.1 1409.3 1509.5 1515.7
PERSONAL SERVICES 810.0 842.1 863.8 934.9
LESS: FISIM 2216.0 2003.8 1990.3 2181.0
VALUE ADDED TAX 2027.4 2055.6 2232.7 2205.1
TT$ MnIndustry 2000 2001 2002 2003
TOTAL 51370.7 55007.2 56290.0 67301.6
AGRICULTURE, FISHING & FORESTRY 625.2 598.8 672.2 564.0
MINING & QUARRYING 9771.9 9541.3 9130.2 14167.3
MANUFACTURE 8836.1 8759.8 8888.3 11631.2
ELECTRICITY & WATER 888.2 880.6 802.6 798.5
CONSTRUCTION 3759.5 4276.8 4022.4 5068.9
DISTRIBUTION SERVICES 9062.3 9507.9 9896.6 10986.0
HOTELS, G/ HOUSES & RESTAURANTS 928.1 1002.5 1070.9 1106.5
T/PORT, STORAGE & COMMUN. 4410.4 5571.5 5657.9 5112.6
FIN., INS., REAL EST. & BUS. SERVICES 7305.1 7505.8 8890.1 9182.2
GENERAL GOVERNMENT 3887.2 4714.1 4332.9 5560.0
EDUC. CULT. & COMM. SERVICES 1933.1 2432.9 2558.3 3091.8
PERSONAL SERVICES 152.3 152.5 154.0 154.6
LESS: FISIM 2216.0 2116.0 2187.3 2486.3
PLUS: VALUE ADDED TAX 2027.3 2178.7 2400.9 2364.3
Table 15.2: Gross Domestic Product By Industry in Constant 2000 Market Prices
Table 15.3: Gross Domestic Product By Industry in Current Market Prices
144

TRINIDAD AND TOBAGO
Fig 15.4: Gross Domestic Product at Factor Cost in Current and Constant 2000 Prices
0
10000
20000
30000
40000
50000
60000
70000
80000
2000 2001 2002 2003
$TT
Mn
CONSTANT 2000 MARKET PRICESCURRENT MARKET PRICES
145

TRINIDAD AND TOBAGO
Industry 2000 2001 2002 2003
TOTAL 19.8 7.1 2.3 19.6
AGRICULTURE, FISHING & FORESTRY -4.3 -4.2 12.3 -16.1
MINING & QUARRYING 62.0 -2.4 -4.3 55.2
MANUFACTURE 41.6 -0.9 1.5 30.9
ELECTRICITY & WATER -0.7 -0.9 -8.9 -0.5
CONSTRUCTION 11.0 13.8 -5.9 26.0
DISTRIBUTION SERVICES 12.7 4.9 4.1 11.0
HOTELS, G/ HOUSES & RESTAURANTS -5.7 8.0 6.8 3.3
T/PORT, STORAGE & COMMUN. 15.5 26.3 1.6 -9.6
FIN., INS., REAL EST. & BUS. SERVICES 48.3 2.7 18.4 3.3
GENERAL GOVERNMENT -22.5 21.3 -8.1 28.3
EDUC. CULT. & COMM. SERVICES -24.3 25.9 5.2 20.9
PERSONAL SERVICES 94.0 0.1 1.0 0.4
LESS: FISIM 32.1 -4.5 3.4 13.7
PLUS: VALUE ADDED TAX 4.2 7.5 10.2 -1.5
Table 15.3A: Gross Domestic Product By Industry in Current Market Prices - Percentage Change
Fig 15.5: Gross Domestic Product by Industry in Current Market Prices - Percentage Change (Based on $TT Mn)
-20.0
-10.0
0.0
10.0
20.0
30.0
40.0
50.0
2000 2001 2002 2003
Perc
ent
TOTAL AGRICULTUREMANUFACTURING SERVICES
146

TRINIDAD AND TOBAGO
EC$MnIndustry 2000 2001 2002 2003
TOTAL 22103.7 23955.9 24470.4 29012.6
AGRICULTURE, FISHING & FORESTRY 269.0 260.8 292.2 243.1
MINING & QUARRYING 4204.6 4155.3 3969.1 6107.3
MANUFACTURE 3802.0 3814.9 3863.9 5014.0
ELECTRICITY & WATER 382.2 383.5 348.9 344.2
CONSTRUCTION 1617.6 1862.6 1748.6 2185.1
DISTRIBUTION SERVICES 3899.3 4140.7 4302.2 4735.9
HOTELS, G/ HOUSES & RESTAURANTS 399.3 436.6 465.5 477.0
T/PORT, STORAGE & COMMUN. 1897.7 2426.4 2459.6 2204.0
FIN., INS., REAL EST. & BUS. SERVICES 3143.2 3268.8 3864.7 3958.3
GENERAL GOVERNMENT 1672.6 2053.0 1883.6 2396.8
EDUC. CULT. & COMM. SERVICES 831.8 1059.5 1112.1 1332.8
PERSONAL SERVICES 65.5 66.4 66.9 66.6
LESS: FISIM 953.5 921.5 950.9 1071.8
VALUE ADDED TAX 872.3 948.8 1043.7 1019.2
Industry 2000 2001 2002 2003
TOTAL 100.0 100.0 100.0 100.0
AGRICULTURE, FISHING & FORESTRY 1.2 1.1 1.2 0.8
MINING & QUARRYING 19.0 17.3 16.2 21.1
MANUFACTURE 17.2 15.9 15.8 17.3
ELECTRICITY & WATER 1.7 1.6 1.4 1.2
CONSTRUCTION 7.3 7.8 7.1 7.5
DISTRIBUTION SERVICES 17.6 17.3 17.6 16.3
HOTELS, G/ HOUSES & RESTAURANTS 1.8 1.8 1.9 1.6
T/PORT, STORAGE & COMMUN. 8.6 10.1 10.1 7.6
FIN., INS., REAL EST. & BUS. SERVICES 14.2 13.6 15.8 13.6
GENERAL GOVERNMENT 7.6 8.6 7.7 8.3
EDUC. CULT. & COMM. SERVICES 3.8 4.4 4.5 4.6
PERSONAL SERVICES 0.3 0.3 0.3 0.2
LESS: FISIM 4.3 3.8 3.9 3.7
VALUE ADDED TAX 3.9 4.0 4.3 3.5
Table 15.4: Gross Domestic Product By Industry in Current Market Prices
Table 15.4A: Gross Domestic Product By Industry in Current Market Prices - Percentage Distribution
147

TRINIDAD AND TOBAGO
$EC Mn
EXPENDITURE GROUPS 2000 2001 2002 2003
GROSS DOMESTIC PRODUCT (Current Market Prices) 22103.7 23955.9 24470.4 29012.6
TOTAL FINAL CONSUMPTION 15271.3 16805.5 18409.3 19542.6
Private 12629.2 13518.3 15082.7 15681.8
Government 2642.1 3287.2 3326.6 3860.7
GROSS CAPITAL FORMATION 3763.0 4658.2 4706.1 5133.3
GOODS AND NON-FACTOR SERVICES 3069.4 2492.2 1354.9 4336.6
Exports of Goods and Services 13089.5 13171.2 12302.1 15894.9
Imports of Goods and Services 10020.1 10679.0 10947.2 11558.3
EXPENDITURE GROUPS 2000 2001 2002 2003
GROSS DOMESTIC PRODUCT (Current Market Prices) 100.0 100.0 100.0 100.0
TOTAL FINAL CONSUMPTION 69.1 70.2 75.2 67.4
Private 57.1 56.4 61.6 54.1
Government 12.0 13.7 13.6 13.3
GROSS CAPITAL FORMATION 17.0 19.4 19.2 17.7
GOODS AND NON-FACTOR SERVICES 13.9 10.4 5.5 14.9
Exports of Goods and Services 59.2 55.0 50.3 54.8
Imports of Goods and Services 45.3 44.6 44.7 39.8
Table 15.5: Expenditure on Gross Domestic Product in Current Market Prices
Table 15.5A: Expenditure on Gross Domestic Product in Current Market Prices - Percentage Distribution
148

TRINIDAD AND TOBAGO
$TT MnEXPENDITURE GROUPS 2000 2001 2002 2003
GROSS DOMESTIC PRODUCT (Current Market Prices) 51370.6 55007.2 56290.0 67301.6
TOTAL FINAL CONSUMPTION 35491.6 38588.6 42347.6 45333.7
Private 29351.1 31040.6 34695.3 36377.8
Government 6140.5 7548.0 7652.3 8955.9
GROSS CAPITAL FORMATION 8745.5 10696.0 10825.6 11908.0
GOODS AND NON-FACTOR SERVICES 7133.5 5722.6 3116.8 10059.9
Exports of Goods and Services 30421.0 30243.6 28299.0 36872.1
Imports of Goods and Services 23287.5 24521.0 25182.2 26812.2
Table 15.6: Expenditure on Gross Domestic Product in Current Market Prices
Fig 15.6: Expenditure on GDP in Current Market Prices - Percentage Distribution, 2000
57.1
12.0
17.0
13.9
PRIVATE
GOVERNMENT
GROSS CAPITAL FORMATION
GOODS AND NON-FACTOR SERVICES
Fig 15.7: Expenditure on GDP in Current Market Prices - Percentage Distribution,
2003
54.1
13.3
17.7
14.9
PRIVATEGOVERNMENTGROSS CAPITAL FORMATIONGOODS AND NON-FACTOR SERVICES
149

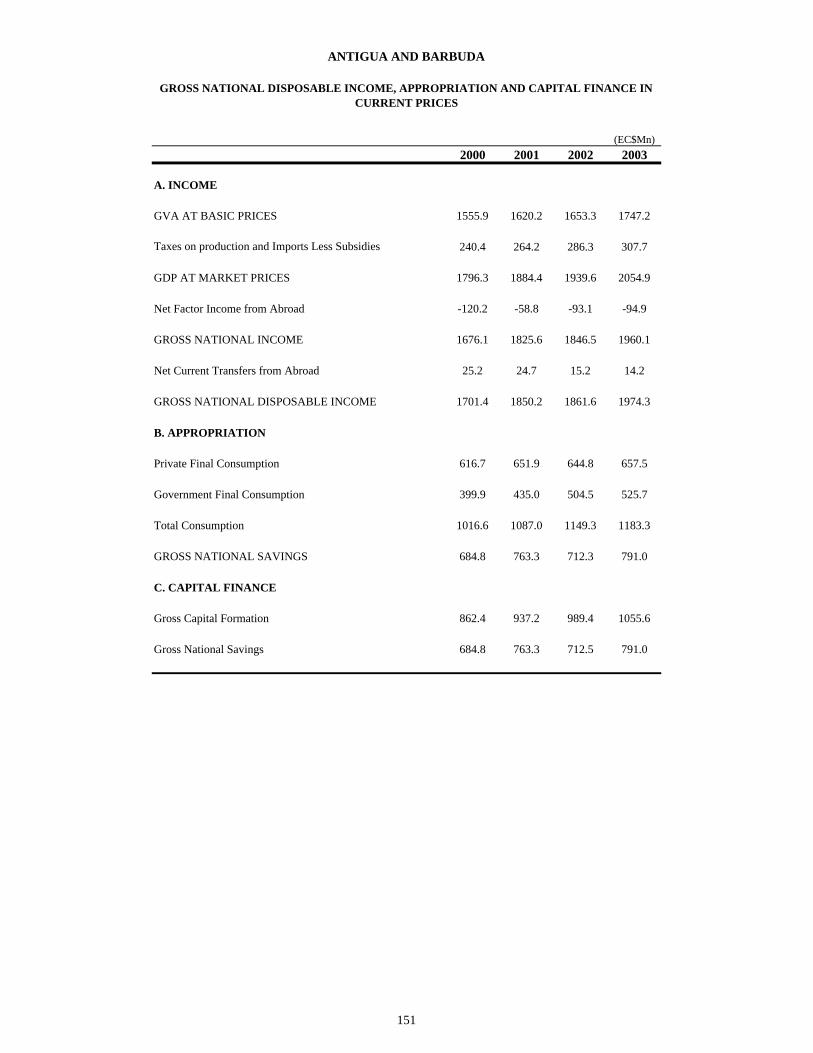
ANTIGUA AND BARBUDA
(EC$Mn)2000 2001 2002 2003
A. INCOME
GVA AT BASIC PRICES 1555.9 1620.2 1653.3 1747.2
Taxes on production and Imports Less Subsidies 240.4 264.2 286.3 307.7
GDP AT MARKET PRICES 1796.3 1884.4 1939.6 2054.9
Net Factor Income from Abroad -120.2 -58.8 -93.1 -94.9
GROSS NATIONAL INCOME 1676.1 1825.6 1846.5 1960.1
Net Current Transfers from Abroad 25.2 24.7 15.2 14.2
GROSS NATIONAL DISPOSABLE INCOME 1701.4 1850.2 1861.6 1974.3
B. APPROPRIATION
Private Final Consumption 616.7 651.9 644.8 657.5
Government Final Consumption 399.9 435.0 504.5 525.7
Total Consumption 1016.6 1087.0 1149.3 1183.3
GROSS NATIONAL SAVINGS 684.8 763.3 712.3 791.0
C. CAPITAL FINANCE
Gross Capital Formation 862.4 937.2 989.4 1055.6
Gross National Savings 684.8 763.3 712.5 791.0
GROSS NATIONAL DISPOSABLE INCOME, APPROPRIATION AND CAPITAL FINANCE IN CURRENT PRICES
151

DOMINICA
(EC$Mn)2000 2001 2002 2003
A. INCOME
GVA AT BASIC PRICES 621.6 607.5 577.0 580.1
Taxes on production and Imports Less Subsidies 110.6 111.1 112.9 127.3
GDP AT MARKET PRICES 732.2 718.6 689.9 707.5
Net Factor Income from Abroad -87.5 -55.7 -49.9 -54.8
GROSS NATIONAL INCOME 644.7 662.9 640.0 652.6
Net Current Transfers from Abroad 48.8 47.2 37.3 46.6
GROSS NATIONAL DISPOSABLE INCOME 693.5 710.1 677.3 699.2
B. APPROPRIATION
Private Final Consumption 470.3 517.5 490.4 480.5
Government Final Consumption 160.6 152.8 147.3 135.1
Total Consumption 630.9 670.3 637.8 615.6
GROSS NATIONAL SAVINGS 62.6 39.8 39.6 83.6
C. CAPITAL FINANCE
Gross Capital Formation 205.4 171.8 142.4 177.3
Gross National Savings 62.6 39.8 39.6 83.6
GROSS NATIONAL DISPOSABLE INCOME, APPROPRIATION AND CAPITAL FINANCE IN CURRENT PRICES
152
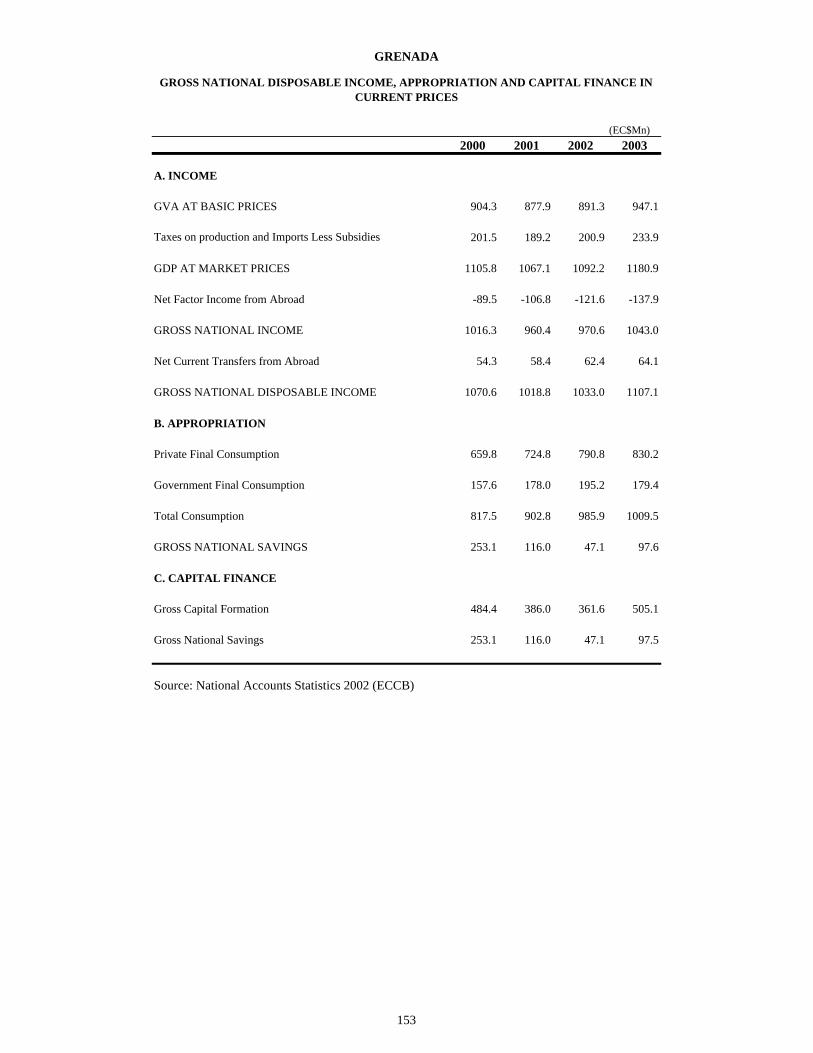
GRENADA
(EC$Mn)2000 2001 2002 2003
A. INCOME
GVA AT BASIC PRICES 904.3 877.9 891.3 947.1
Taxes on production and Imports Less Subsidies 201.5 189.2 200.9 233.9
GDP AT MARKET PRICES 1105.8 1067.1 1092.2 1180.9
Net Factor Income from Abroad -89.5 -106.8 -121.6 -137.9
GROSS NATIONAL INCOME 1016.3 960.4 970.6 1043.0
Net Current Transfers from Abroad 54.3 58.4 62.4 64.1
GROSS NATIONAL DISPOSABLE INCOME 1070.6 1018.8 1033.0 1107.1
B. APPROPRIATION
Private Final Consumption 659.8 724.8 790.8 830.2
Government Final Consumption 157.6 178.0 195.2 179.4
Total Consumption 817.5 902.8 985.9 1009.5
GROSS NATIONAL SAVINGS 253.1 116.0 47.1 97.6
C. CAPITAL FINANCE
Gross Capital Formation 484.4 386.0 361.6 505.1
Gross National Savings 253.1 116.0 47.1 97.5
Source: National Accounts Statistics 2002 (ECCB)
GROSS NATIONAL DISPOSABLE INCOME, APPROPRIATION AND CAPITAL FINANCE IN CURRENT PRICES
153

MONTSERRAT
(EC$Mn)2000 2001 2002 2003
A. INCOME
GVA AT BASIC PRICES 79.3 82.6 88.7 91.6
Taxes on production and Imports Less Subsidies 14.6 11.1 14.9 12.9
GDP AT MARKET PRICES 93.9 93.7 103.7 104.5
Net Factor Income from Abroad -7.3 -2.3 -8.3 -8.0
GROSS NATIONAL INCOME 86.6 91.4 95.3 96.51
Net Current Transfers from Abroad 45.9 57.2 67.3 79.2
GROSS NATIONAL DISPOSABLE INCOME 132.5 148.6 162.6 175.7
B. APPROPRIATION
Private Final Consumption 58.6 75.5 83.8 71.9
Government Final Consumption 47.7 49.2 48.0 58.3
Total Consumption 106.3 124.6 131.8 130.2
GROSS NATIONAL SAVINGS 26.2 24.0 30.8 45.5
C. CAPITAL FINANCE
Gross Capital Formation 43.7 39.7 53.0 63.7
Gross National Savings 26.2 24.0 30.8 45.5
GROSS NATIONAL DISPOSABLE INCOME, APPROPRIATION AND CAPITAL FINANCE IN CURRENT PRICES
154

ST. KITTS AND NEVIS
(EC$Mn)2000 2001 2002 2003
A. INCOME
GVA AT BASIC PRICES 765.2 792.8 802.1 821.0
Taxes on production and Imports Less Subsidies 123.7 131.2 144.3 163.4
GDP AT MARKET PRICES 888.9 924.0 946.4 984.4
Net Factor Income from Abroad -81.3 -93.2 -103.1 -117.9
GROSS NATIONAL INCOME 807.6 830.8 843.3 866.5
Net Current Transfers from Abroad 169.2 43.4 44.3 44.7
GROSS NATIONAL DISPOSABLE INCOME 976.7 874.1 887.6 911.1
B. APPROPRIATION
Private Final Consumption 526.7 468.2 570.7 497.6
Government Final Consumption 187.8 191.5 187.2 176.2
Total Consumption 714.5 659.6 757.8 673.8
GROSS NATIONAL SAVINGS 262.2 214.5 129.8 237.3
C. CAPITAL FINANCE
Gross Capital Formation 440.9 500.5 457.3 469.7
Gross National Savings 262.2 214.5 129.8 237.3
GROSS NATIONAL DISPOSABLE INCOME, APPROPRIATION AND CAPITAL FINANCE IN CURRENT PRICES
155
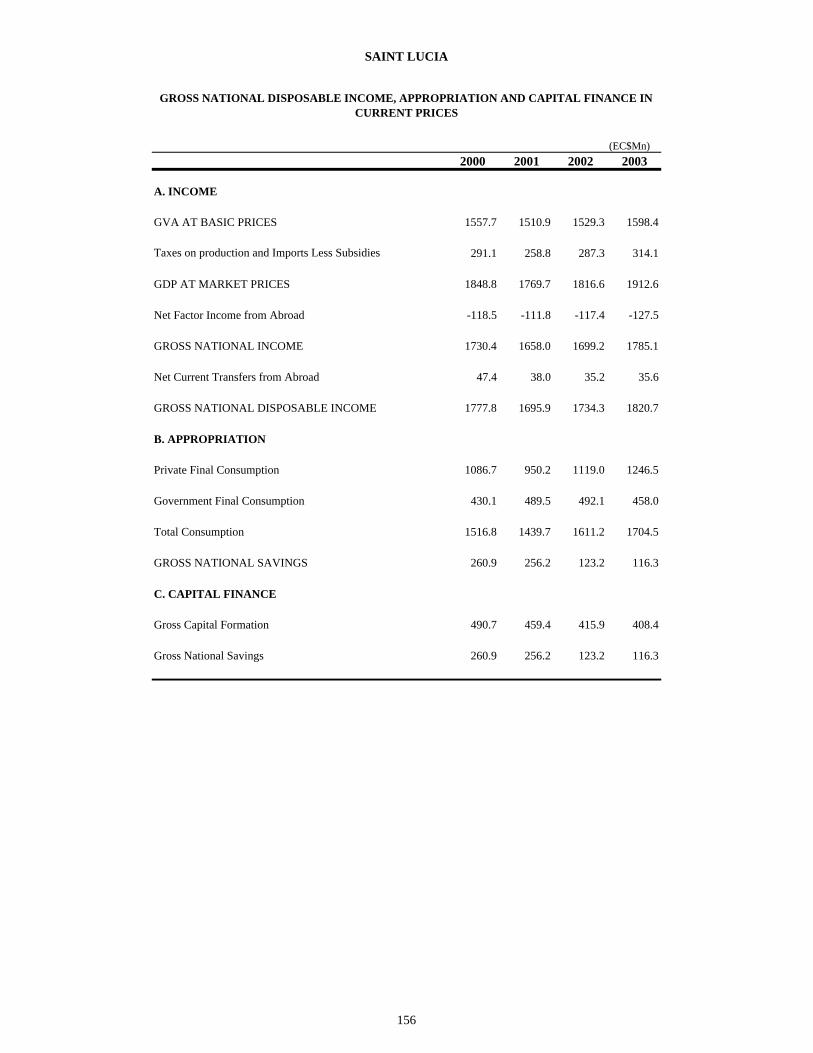
SAINT LUCIA
(EC$Mn)2000 2001 2002 2003
A. INCOME
GVA AT BASIC PRICES 1557.7 1510.9 1529.3 1598.4
Taxes on production and Imports Less Subsidies 291.1 258.8 287.3 314.1
GDP AT MARKET PRICES 1848.8 1769.7 1816.6 1912.6
Net Factor Income from Abroad -118.5 -111.8 -117.4 -127.5
GROSS NATIONAL INCOME 1730.4 1658.0 1699.2 1785.1
Net Current Transfers from Abroad 47.4 38.0 35.2 35.6
GROSS NATIONAL DISPOSABLE INCOME 1777.8 1695.9 1734.3 1820.7
B. APPROPRIATION
Private Final Consumption 1086.7 950.2 1119.0 1246.5
Government Final Consumption 430.1 489.5 492.1 458.0
Total Consumption 1516.8 1439.7 1611.2 1704.5
GROSS NATIONAL SAVINGS 260.9 256.2 123.2 116.3
C. CAPITAL FINANCE
Gross Capital Formation 490.7 459.4 415.9 408.4
Gross National Savings 260.9 256.2 123.2 116.3
GROSS NATIONAL DISPOSABLE INCOME, APPROPRIATION AND CAPITAL FINANCE IN CURRENT PRICES
156

ST. VINCENT AND THE GRENADINES
(EC$Mn)2000 2001 2002 2003
A. INCOME
GVA AT BASIC PRICES 761.8 776.7 805.5 836.4
Taxes on production and Imports Less Subsidies 142.8 156.1 169.0 179.2
GDP AT MARKET PRICES 904.6 932.8 974.5 1015.5
Net Factor Income from Abroad -52.1 -44.5 -37.9 -42.2
GROSS NATIONAL INCOME 852.5 888.2 936.6 973.3
Net Current Transfers from Abroad 44.1 34.1 32.8 33.1
GROSS NATIONAL DISPOSABLE INCOME 896.5 922.3 969.4 1006.4
B. APPROPRIATION
Private Final Consumption 553.8 571.3 590.1 647.4
Government Final Consumption 175.8 184.6 201.9 199.3
Total Consumption 729.6 755.9 792.0 846.7
GROSS NATIONAL SAVINGS 166.9 166.4 177.3 159.7
C. CAPITAL FINANCE
Gross Capital Formation 247.1 277.8 292.8 343.9
Gross National Savings 166.9 166.4 177.3 159.7
GROSS NATIONAL DISPOSABLE INCOME, APPROPRIATION AND CAPITAL FINANCE IN CURRENT PRICES
157

THE BAHAMAS
(EC$Mn)2000 2001 2002 2003
A. INCOME
GVA AT FACTOR COST 11588.1 11873.3 12492.1 12959.9
Net Indirect Taxes 1502.3 1541.6 1681.8 1572.1
Statistical Discrepancy 419.6 440.0 406.3 323.9
GVA AT MARKET PRICES 13510.0 13854.9 14580.2 14855.9
Net Factor Income from Abroad -337.0 -381.2 -470.9 -328.6
GROSS NATIONAL INCOME 13173.0 13473.7 14109.3 14527.3
Net Current Transfers from Abroad 116.9 112.9 114.5 131.8
GROSS NATIONAL DISPOSABLE INCOM 13289.9 13586.5 14223.8 14659.1
B. APPROPRIATION
Private Final Consumption 9071.3 9776.8 9691.3 10162.3
Government Final Consumption 1837.0 1972.1 2080.0 2119.5
Total Consumption 10908.4 11748.9 11771.3 12281.8
GROSS NATIONAL SAVINGS 2381.6 1837.7 2452.5 2377.3
C. CAPITAL FINANCE
Gross Capital Formation 5211.0 4805.8 4543.3 4677.6
Gross National Savings 2381.6 1837.7 2452.5 2377.3
BAHAMAS' GROSS NATIONAL DISPOSABLE INCOME, APPROPRIATION AND CAPITAL FINANCE IN CURRENT PRICES
158

THE BAHAMAS
(BH$Mn)2000 2001 2002 2003
A. INCOME
GDP AT FACTOR COST 4291.9 4397.5 4626.7 4800.0
Net Indirect Taxes 556.4 570.9 622.9 582.3
Statistical Discrepancy 155.4 163.0 150.5 120.0
GDP AT MARKET PRICES 5003.7 5131.5 5400.1 5502.2
Net Factor Income from Abroad -124.8 -141.2 -174.4 -121.7
GROSS NATIONAL INCOME 4878.9 4990.3 5225.7 5380.5
Net Current Transfers from Abroad 43.3 41.8 42.4 48.8
GROSS NATIONAL DISPOSABLE INCOM 4922.2 5032.1 5268.1 5429.3
B. APPROPRIATION
Private Final Consumption 3359.8 3621.0 3589.4 3763.8
Government Final Consumption 680.4 730.4 770.4 785.0
Total Consumption 4040.1 4351.4 4359.7 4548.8
GROSS NATIONAL SAVINGS 882.1 680.6 908.3 880.5
C. CAPITAL FINANCE
Gross Capital Formation 1930.0 1779.9 1682.7 1732.4
Gross National Savings 882.1 680.6 908.3 880.5
BAHAMAS' GROSS NATIONAL DISPOSABLE INCOME, APPROPRIATION AND CAPITAL FINANCE IN CURRENT PRICES
159

GUYANA
(EC$Mn)2000 2001 2002 2003
A. INCOME
GDP AT FACTOR COST 1612.3 1619.3 1668.0 1681.2
Net Indirect Taxes 327.1 305.7 293.0 304.1
GDP AT MARKET PRICES 1939.3 1925.0 1960.9 1985.3
Net Factor Income from Abroad -140.7 -157.5 -148.5 -70.1
GROSS NATIONAL INCOME 1798.6 1767.5 1812.4 1915.2
Net Current Transfers from Abroad 127.0 118.8 108.0 120.5
GROSS NATIONAL DISPOSABLE INCOME 1925.5 1886.3 1920.4 2035.7
B. APPROPRIATION
Private Final Consumption 939.8 1049.9 995.5 1170.9
Government Final Consumption 534.0 440.2 467.1 505.3
Total Consumption 1473.7 1490.1 1462.6 1676.2
GROSS NATIONAL SAVINGS 451.8 396.2 457.8 359.5
C. CAPITAL FINANCE
Gross Capital Formation 746.8 741.3 745.9 775.4
Gross National Savings 451.8 396.2 457.8 359.5
GROSS NATIONAL DISPOSABLE INCOME, APPROPRIATION AND CAPITAL FINANCE IN CURRENT PRICES
160

GUYANA
(G$Mn)2000 2001 2002 2003
A. INCOME
GDP AT FACTOR COST 108087.2 112219.3 117762.5 121633.4
Net Indirect Taxes 21926.0 21185.0 20685.1 21998.3
GDP AT MARKET PRICES 130013.2 133404.3 138447.6 143631.7
Net Factor Income from Abroad -9434.8 -10915.4 -10484.7 -5070.0
GROSS NATIONAL INCOME 120578.4 122488.9 127962.9 138561.7
Net Current Transfers from Abroad 8511.2 8232.8 7625.2 8716.5
GROSS NATIONAL DISPOSABLE INCOME 129089.6 130721.8 135588.1 147278.2
B. APPROPRIATION
Private Final Consumption 63001.7 72759.5 70286.9 84712.2
Government Final Consumption 35798.0 30504.6 32976.0 36556.7
Total Consumption 98799.7 103264.1 103262.9 121268.9
GROSS NATIONAL SAVINGS 30290.0 27457.6 32325.3 26009.3
C. CAPITAL FINANCE
Gross Capital Formation 50065.0 51375.0 52665.5 56097.8
Gross National Savings 30290.0 27457.6 32325.3 26009.3
GROSS NATIONAL DISPOSABLE INCOME, APPROPRIATION AND CAPITAL FINANCE IN CURRENT PRICES
161

JAMAICA
(EC$Mn)2000 2001 2002 2003
A. INCOME
GDP AT FACTOR COST 18042.5 18677.9 19572.8 18399.6
Net Indirect Taxes 3182.9 3171.2 3385.6 3409.9
GDP AT PURCHASER'S PRICES 21225.4 21849.1 22958.4 21809.6
Net Factor Income from Abroad -878.8 -1184.7 -1621.6 -1663.5
GROSS NATIONAL INCOME 20346.6 20664.4 21336.8 20146.1
Net Current Transfers from Abroad 1951.6 2052.6 2598.6 2768.3
GROSS NATIONAL DISPOSABLE INCOME 22298.3 22717.0 23935.3 22914.4
B. APPROPRIATION
Private Final Consumption 14602.5 15581.7 16505.2 16013.3
Government Final Consumption 3353.7 3464.2 3748.1 3292.3
Total Consumption 17956.2 19045.8 20253.3 19305.5
GROSS NATIONAL SAVINGS 4342.1 3671.2 3682.0 3608.8
C. CAPITAL FINANCE
Gross Capital Formation 5685.6 6368.4 7310.5 6545.8
Gross National Savings 4342.1 3671.2 3682.0 3608.8
GROSS NATIONAL DISPOSABLE INCOME, APPROPRIATION AND CAPITAL FINANCE IN CURRENT PRICES
162

JAMAICA
(J$Mn)2000 2001 2002 2003
A. INCOME
GDP AT FACTOR COST 288,613.5 318,899.6 348,486.8 396,886.3
Net Indirect Taxes 50,914.9 54,143.0 60,278.5 73,553.9
GDP AT MARKET PRICES 339,528.5 373,042.6 408,765.3 470,440.2
Net Factor Income from Abroad (14,057.8) (20,226.5) (28,872.3) (35,881.5)
GROSS NATIONAL INCOME 325,470.7 352,816.1 379,893.0 434,558.7
Net Current Transfers from Abroad 31,219.1 35,045.2 46,266.5 59,712.6
GROSS NATIONAL DISPOSABLE INCOME 356,689.8 387,861.3 426,159.5 494,271.3
B. APPROPRIATION
Private Final Consumption 233,585.6 266,035.2 293,869.0 345,412.0
Government Final Consumption 53,647.1 59,146.1 66,734.2 71,015.2
Total Consumption 287,232.7 325,181.3 360,603.2 416,427.2
GROSS NATIONAL SAVINGS 69,457.1 62,680.0 65,556.3 77,844.1
C. CAPITAL FINANCE
Gross Capital Formation 90,948.3 108,731.2 130,160.9 141,196.1
Gross National Savings 69,457.0 62,680.0 65,556.3 77,844.1
GROSS NATIONAL DISPOSABLE INCOME, APPROPRIATION AND CAPITAL FINANCE IN CURRENT PRICES
163
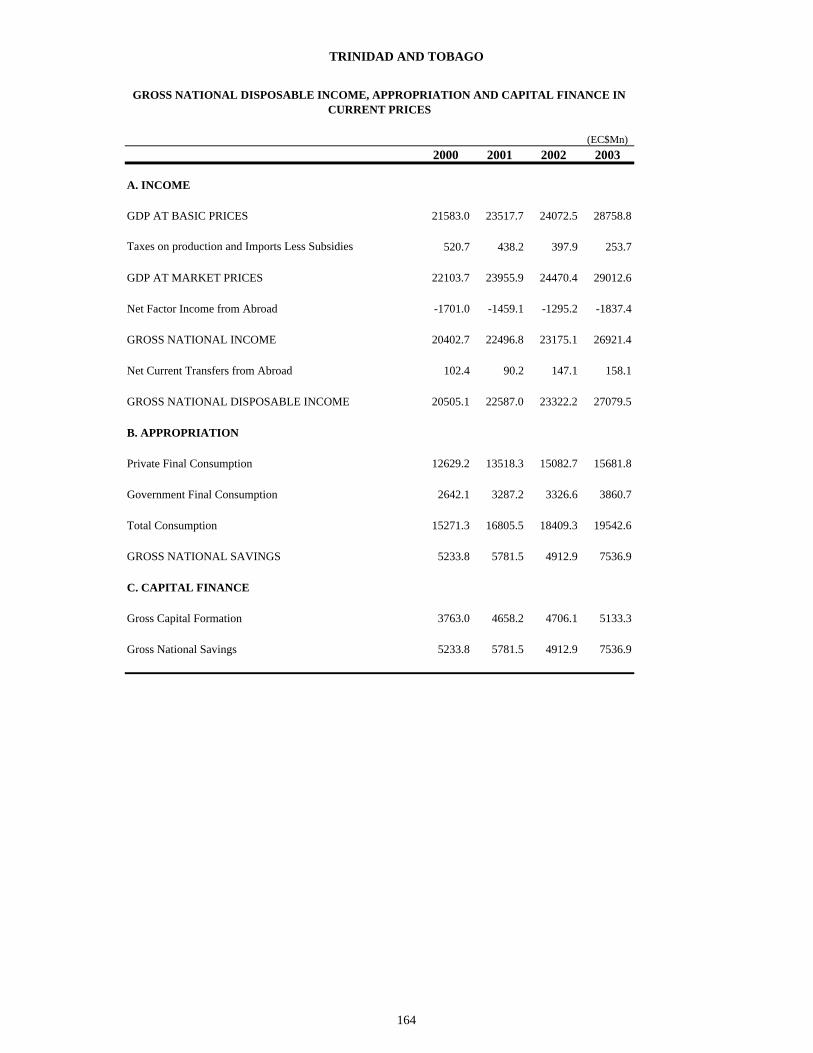
TRINIDAD AND TOBAGO
(EC$Mn)2000 2001 2002 2003
A. INCOME
GDP AT BASIC PRICES 21583.0 23517.7 24072.5 28758.8
Taxes on production and Imports Less Subsidies 520.7 438.2 397.9 253.7
GDP AT MARKET PRICES 22103.7 23955.9 24470.4 29012.6
Net Factor Income from Abroad -1701.0 -1459.1 -1295.2 -1837.4
GROSS NATIONAL INCOME 20402.7 22496.8 23175.1 26921.4
Net Current Transfers from Abroad 102.4 90.2 147.1 158.1
GROSS NATIONAL DISPOSABLE INCOME 20505.1 22587.0 23322.2 27079.5
B. APPROPRIATION
Private Final Consumption 12629.2 13518.3 15082.7 15681.8
Government Final Consumption 2642.1 3287.2 3326.6 3860.7
Total Consumption 15271.3 16805.5 18409.3 19542.6
GROSS NATIONAL SAVINGS 5233.8 5781.5 4912.9 7536.9
C. CAPITAL FINANCE
Gross Capital Formation 3763.0 4658.2 4706.1 5133.3
Gross National Savings 5233.8 5781.5 4912.9 7536.9
GROSS NATIONAL DISPOSABLE INCOME, APPROPRIATION AND CAPITAL FINANCE IN CURRENT PRICES
164

TRINIDAD AND TOBAGO
(TT$Mn)2000 2001 2002 2003
A. INCOME
GDP AT BASIC PRICES 50160.4 54001.1 55374.8 66713.0
Net Indirect Taxes 1210.2 1006.1 915.2 588.6
GDP AT MARKET PRICES 51370.6 55007.2 56290.0 67301.6
Net Factor Income from Abroad -3953.3 -3350.4 -2979.5 -4262.4
GROSS NATIONAL INCOME 47417.3 51656.8 53310.5 62450.6
Net Current Transfers from Abroad 238.1 207.1 338.4 366.8
GROSS NATIONAL DISPOSABLE INCOME 47655.4 51863.9 53648.9 62817.4
B. APPROPRIATION
Private Final Consumption 29351.1 31040.6 34695.3 36377.8
Government Final Consumption 6140.5 7548.0 7652.3 8955.9
Total Consumption 35491.6 38588.6 42347.6 45333.7
GROSS NATIONAL SAVINGS 12163.8 13275.3 11301.3 17483.7
C. CAPITAL FINANCE
Gross Capital Formation 8745.5 10696.0 10825.6 11908.0
Gross National Savings 12163.8 13275.3 11301.3 17483.7
GROSS NATIONAL DISPOSABLE INCOME, APPROPRIATION AND CAPITAL FINANCE IN CURRENT PRICES
165

STATISTICS SUB-PROGRAMME
INFORMATION AND COMMUNICATION PROGRAMME
CARIBBEAN COMMUNITY (CARICOM) SECRETARIAT
GEORGETOWN, GUYANA
P O BOX 10827