national action plan - national fruit & vegetable alliance 75 strategies, organized in nine...
TRANSCRIPT

To Promote Health Through Increased Fruit and Vegetable Consumption
National Action Plan
2010 Report Card
A
DF
BC

The National Fruit & Vegetable AllianceThe National Fruit & Vegetable Alliance (NFVA) is a national alliance of public and private partners working collaboratively and synergistically to increase nationwide access to and demand for all forms of fruits and vegetables for improved public health. The vision of NFVA is that fruits and vegetables comprise half of the food that Americans eat.
In 1991 a partnership was formed between the National Cancer Institute (NCI) and Produce for Better Health Foundation (PBH). The 5 A Day for Better Health program (5 A Day) was promoted through this partnership. In 2001, the partnership was expanded to include other federal agencies, industry associations, and public health entities in an effort to increase fruit and vegetable consumption. In October 2005, Centers for Disease Control & Prevention (CDC) replaced NCI as the lead federal agency and national health authority for the 5 A Day program. Together, CDC and PBH co-chair the broader partnership, known as the National Fruit & Vegetable Alliance.
Today, members of the National Fruit & Vegetable Alliance are organizations working to increase consumption of fruits and vegetables, including licensees of the Fruits & Veggies—More Matters® brand, members of coalitions as organized by state Fruit & Vegetable Nutrition Coordinators, and National Fruit & Vegetable Alliance Steering Committee Members. Steering Committee Members are:
American Cancer Society
American Diabetes Association
American Dietetic Association
American Frozen Food Institute
American Heart Association
California Department of Public Health
Canned Food Alliance
Centers for Disease Control & Prevention
National Council of Fruit & Vegetable Nutrition Coordinators
National Alliance for Nutrition & Activity
National Cancer Institute
Produce for Better Health Foundation
Produce Marketing Association
United Fresh Produce Association
USDA Food and Nutrition Service Food, Nutrition and Consumer Services
Research, Education and EconomicsMarketing and Regulatory Programs

[1]National Action Plan to Promote Health Through Increased Fruit and Vegetable Consumption
2010 Report Card
In 2008, obesity-related health care costs totaled an estimated $147 billion, 10% of all medical spending in the United States.5
IntroductionPeople who consume generous amounts of fruits and vegetables as part of a healthful diet are likely to have reduced risk of chronic diseases, including stroke and perhaps other cardiovascular diseases, type 2 diabetes, and certain types of cancer.1 And, because fruits and vegetables are low in calories and high in fiber, they can help control weight.2 Yet, the frequency of fruit and vegetable consumption changed little between 1994 and 2005, despite years of effort by government, nonprofit, and commercial organizations.3 With the release of the 2005 Dietary Guidelines for Americans (Dietary Guidelines) which included a large increase in the recommended amount of fruits and vegetables (5-13 daily servings,1 up from the 5-9 daily servings recommended in 2000), a new approach was needed to increase consumption.
In 2005, a National Action Plan to Promote Health Through Increased Fruit and Vegetable Consumption was developed as an outline of a new and comprehensive approach to increasing consumption. It proposed an integrated framework of policy, marketing, and communication strategies that all large and small entities which produce, provide, serve, or regulate food can use to help Americans obtain, prepare, and consume fruits and vegetables and, in so doing, achieve good health. The plan was developed with input from a variety of food, nutrition, marketing, communications, and policy leaders and included a thorough assessment of the scientific literature. Over 75 strategies, organized in nine different settings, were identified to more aggressively create an environment where Americans can increase their consumption of fruits and vegetables of all forms—fresh, frozen, canned, dried, and 100% juice.
2010 MetricsThe strategies presented in the 2005 National Action Plan spanned a wide range of actions that could be implemented by an array of entities over a broad period of time, from weeks or months to years.4 This 2010 National Action Plan Report Card outlines changes, over the past five years, regarding several of those strategies. It also narrows the list of strategies to include those of highest priority, as identified by the National Fruit and Vegetable Alliance in 2010. Metrics were collected by a thorough review of national public and private surveys as well as the scientific literature.
Objectives of the National Action PlanObjectives in 2010 remain the same as those outlined in 2005. They include:
1. Increase the accessibility and desirability of all forms of fruits and vegetables, by making them tasty, attractive, convenient, affordable, plentiful, and easily available at all eating and snacking occasions.
2. Offer practical strategies to help increase an individual’s ability to obtain and prepare meals and snacks rich in fruits and vegetables.
3. Change Americans’ attitudes and habits about including fruits and vegetables at every eating occasion. Key to making this change is identifying, communicating, and delivering the benefits of fruits and vegetables that consumers find most important, in a way that is exciting, enticing, and produces positive behavior change.
National Action Plan GoalThe National Action Plan goal is to implement, at the national, state and local levels, a set of policy, marketing, business, public health, and communication strategies that can close the gap between actual and recommended fruit and vegetable consumption.
Strategies to Increase Fruit and Vegetable IntakeThe strategies outlined on the following pages include key priorities in the following settings:• Nutrition Promotion and Marketing • Supermarkets and Other Retailers• Fruit and Vegetable Suppliers• Restaurants and Other Food Service Establishments• Schools, Child Care, and Other Institutions Feeding Children and Adolescents• Work Places• Health Care and Health Organizations• Research and Evaluation• State and Federal Policy

[2] National Fruit & Vegetable Alliance
2. Achievement of Daily Vegetable Consumption Target
Source: The NPD Group, Nutrient Intake Database
0%
5%
% o
f pop
ulat
ion
% of vegetable target in average day
10%
8%Achieve:
7%
5%
15%
20%
90-99% 100%+80-89%70-79%60-69%50-59%40-49%30-39%20-29%10-19%< 10%
Kids Adult Males Adult Females
3. Achievement of Daily Fruit Consumption Target
Source: The NPD Group, Nutrient Intake Database
0%
5%
% o
f pop
ulat
ion
% of fruit target in average day
10%
12%Achieve:
7%
5%
15%
20%
25%
30%
90-99% 100%+80-89%70-79%60-69%50-59%40-49%30-39%20-29%10-19%< 10%
Kids Adult Males Adult Females
1. Average Daily Consumption of Fruits & Vegetables Per Capita
Source: The NPD Group, Nutrient Intake Database
aver
age
num
ber o
f cup
s pe
r day
Vegetables
1.82 1.83 1.83 1.80 1.82 1.81 1.77 1.75 1.77 1.80 1.81
1.16 1.17 1.16 1.16 1.16 1.15 1.12 1.11 1.12 1.13 1.13
0.66 0.67 0.66 0.65 0.66 0.66 0.64 0.64 0.65 0.66 0.69
’99 ’00 ’01 ’02 ’03 ’04 ’05 ’06 ’07 ’08 ’09
Fruits
Only 6% of individuals achieve their recommended target for vegetables; similarly, only 8% achieve their recommended target for fruit in an average day. Source: The NPD Group, Nutrient Intake Database
Overall Consumption• Per capita fruit and vegetable consumption (in cups) has remained fairly stable overall during the past 5 years (fruit +2%, vegetables -2%, 2004 vs. 2009).
• Several groups increased their fruit consumption by at least 5% in 2009 vs. 2004. These include children ages 2-12, males 18-34, and females 18-54. Those who decreased their fruit consumption included males ages 45-54 and females 65 and older.
• No groups increased their vegetable consumption by 5% in 2009 compared to 2004. In fact, teens ages 13-17, males 65 and older, and females 55 and older decreased their consumption by at least 5% during that same five-year period.
Source: The NPD Group, Nutrient Intake Database
Current Fruit and Vegetable Consumption The average American’s fruit and vegetable consumption is far below recommended levels and has remained relatively flat.6 The average per capita fruit and vegetable consumption is 1.13 cups of vegetables and 0.68 cups of fruit (Chart 1). Only 6% of individuals achieve their recommended target for vegetables; similarly, only 8% achieve their recommended target for fruit in an average day (Charts 2 & 3). Interestingly, 8 of the states with the lowest fruit and vegetable consumption are also in the top 10 states with the highest obesity rates.7
In light of the obesity epidemic, a look at children’s fruit and vegetable consumption is relevant. Over the past 5 years, children under the age of 6 have increased their fruit by 11% and their vegetable consumption by 3%. During that same period, children ages 6-12 increased fruit consumption by 7% and vegetable consumption by 2%. However, teens ages 13-17 decreased their consumption of fruit by 2% and vegetables by 6% during that time frame (Chart 4).

[3]National Action Plan to Promote Health Through Increased Fruit and Vegetable Consumption
2010 Report Card
4. Annual Per Capita Consumption of Fruits and Vegetables by Children
Source: The NPD Group, Nutrient Intake Database
annu
al c
ups
per c
apita
Ages 2-5 Ages 6-12 Ages 13-17 Ages 2-5 Ages 6-12 Ages 13-17
1999
2004
2009
0
200
400
600
200
400
600
annu
al c
ups
per c
apita
0
+11%+7% -2%
+3%
+2%
-6%
vegetablesfruits
Nutrition Promotion and Marketing Food choices are affected by many factors, but one key area impacting food choice—especially among children—is food marketing. Foods high in calories and low in nutrients are often marketed extensively, but there are significantly fewer marketing initiatives that promote healthy food choices like fruits and vegetables. Strategies that were identified in 2005 and continue to be viewed as critical to changing the marketing environment include:
• Encourage food, beverage, restaurant, and entertainment companies to shift the mix of their marketing to children to encourage the consumption of healthy foods, especially fruits and vegetables.
• Promote fruit and vegetable intake through the federal USDA nutrition assistance programs, including use of social marketing approaches through Supplemental Nutrition Assistant Program (SNAP) education and strengthening and increasing funding for the Team Nutrition Network.
• Support development and dissemination of a behaviorally-focused communication, policy, and environmental change strategy and toolkit-like products that can be used consistently by all federal, state, nonprofit, business, and community organizations in their efforts to encourage consumption of fruits and vegetables. A clear, actionable, and consistent core message/call to action that consumers view as achievable should be used.
resultsFood Marketing In 2006, the National Academies’ Institute of Medicine (IOM) concluded that food and beverage advertising targeted at children influences their product preferences and food choices, and that food and beverage marketing practices geared to children and youth “contribute to an environment that puts their health at risk.” 8 Several food and entertainment companies pledged that same year, in partnership with the Council of Better Business Bureaus’ (CBBB) Children’s Food and Beverage Advertising Initiative (CFBAI), to voluntarily improve the nutritional quality of foods advertised to children.
In a recent comparison of the nutrition quality of food industry ads between 2004 and 2009, before and after the industry pledge, there was a modest shift away from nutritionally poor “Whoa” food advertisements, but healthy food advertising of “Go” products like fruits and vegetables remained virtually non-existent (Chart 5).9 In fact, a Federal Trade Commission (FTC) congressional report reviewed leading industry expenditures and activities regarding food marketing to children and revealed that, in 2006, only $11,463,000 was spent on fruit and vegetable marketing (excluding 100% juice) to youth, which represented

[4] National Fruit & Vegetable Alliance
Nutrition Education Food Assistance Program Nutrition Education as a Program Spending Spending % of Total Spending
SNAP $314,100,000 $37,642,000,000 0.8%
Team Nutrition $13,300,000 $11,698,500,000 0.1%
WIC Nutrition Education $358,000,000 $6,476,000,000 5.5%
Total $685,400,000 $55,816,500,000 1.2%
6. Nutrition Education for Nutrition Assistance Programs, FY 2008
5. Over Time Comparison of Nutritional Quality in Industry Food Ads
Source: Ch1ldren Now
perc
ent
84%79.4%
72.5%
12.9%16.5%
26.6%
3% 4.2%.9%
“Whoa” Ads “Slow” Ads “Go” Ads
2005
2007
2009
0%
20%
40%
60%
80%
100%
less than 1% of the $2 billion spent on all food marketing to youth.10 The amount of marketing across the entire U.S. population was no better, with less than 1% of the $9.6 billion spent on food marketing focused on fruits and vegetables, excluding juice. The FTC report will serve as a baseline for the purposes of monitoring changes over time. A second and similar report from FTC is expected in the summer of 2011.
A recent report of companies that market food to children reveals that two-thirds (68%) do not have a policy for food marketing to children.11 Food and beverage manufacturers were more likely to have such food marketing policies. Overall, 64% of food and beverage manufacturers, 24% of chain restaurants, and 22% of entertainment companies have guidelines for marketing food to children. Of the companies with these policies, 94% of the food and beverage manufacturers, 50% of the restaurants, and 46% of the entertainment companies surveyed have nutrition standards or policies not to market any of their products to children under the age of 12. This 2010 report will serve as a baseline for the purposes of monitoring such changes in corporate policies over time.
USDA Nutrition EducationIn recognition of the need to promote healthier diets, the federal government has, for decades, developed and implemented nutrition education programs. Most, but not all, of those programs are administered in conjunction with federal nutrition
assistance programs. Three USDA programs, administered through the Food and Nutrition Service (FNS), dominate the federal nutrition education landscape. These include:
SNAP-Ed, the nutrition education arm of the Supplemental Nutrition Assistance Program (SNAP), formerly known as the Food Stamp Program, which enables state SNAP agencies to provide, as part of their administrative operations, nutrition education for eligible individuals. SNAP-Ed State Plan Guidance encourages states to use effective nutrition education tools and strategies to promote good health and prevent or postpone the onset of diet-related chronic diseases.
Team Nutrition, which is responsible for school nutrition education efforts accompanying the school meals programs, provides training and technical assistance for foodservice staff, nutrition education for children and their caregivers, and school and community support for healthy eating and physical activity. This initiative utilizes a network of communication channels to deliver nutrition messages via classroom activities, school-wide events, home activities, community programs, and media events and coverage.
The WIC Nutrition Education Program, which provides nutrition education to women in the Special Supplemental Program for Women, Infants, and Children (WIC), is available to all WIC participants. Local WIC agencies must offer to participants no less than two nutrition education sessions every six months. The program is designed to improve the health, dietary habits, and nutritional status of program participants.
Chart 6 shows that nutrition education spending represents a very small percentage of the amount spent on nutrition assistance programs.12 The primary objective of these programs is, and has always been, to improve access to food for low-income U.S. residents. Nonetheless, given the extent to which dietary guideline goals are not being met, especially among low-income Americans, and the costs of diet-related

[5]National Action Plan to Promote Health Through Increased Fruit and Vegetable Consumption
2010 Report Card
Nutrition Education Food Assistance Program Nutrition Education as a Program Spending Spending % of Total Spending
Food Stamps $99,000,000 $18,800,000,000 0.5%
Team Nutrition $5,200,000 $9,856,000,000 0.1%
WIC Nutrition Education $220,800,000 $4,153,000,000 5.3%
Total $325,000,000 $32,809,000,000 1.0%
7. Nutrition Education for Nutrition Assistance Programs, FY 2000
diseases, robust nutrition education programs would seem to be in order. Instead, nutrition education spending for the nutrition assistance programs represents only about one percent of total spending for the programs.
Chart 7 reports data for nutrition education spending in Fiscal Year (FY) 2000.12 A comparison of FY 2000 data with data in Chart 6 illustrates that, in terms of nominal dollars, federal spending on nutrition education has increased significantly for each of the nutrition assistance programs. Total federal nutrition education spending in these programs grew from $325 million in FY 2000 to $685 million in FY 2008, a jump of 111%.
The comparison also shows, however, that, as a percent of total nutrition assistance spending, total nutrition education spending has remained flat. In other words, while overall nutrition assistance spending in these programs increased by $23.0 billion between FY 2000 and FY 2008, nutrition education spending grew by only $360 million.
Despite a near doubling of spending on nutrition education by the federal government since FY 2000, nutrition education appears to remain an afterthought relative to other food spending priorities. Federal spending in these three programs, as a percentage of nutrition assistance spending, started the decade at 1.0% and will likely end it, when the data is available, at 1.2% or 1.3%. Given the stagnation of fruit and vegetable consumption and surging costs associated with diet-related diseases, this consistency is a troubling symptom of our nation’s inability to make the nutrition health of Americans a top spending priority.
Fruit and Vegetable Communications Campaign With the large increase in the amount of fruits and vegetables recommended in the 2005 Dietary Guidelines for Americans, public health and private organizations recognized the need to revisit the 5 A Day messaging.Formative research was conducted in 2005, resulting in a new identity for the 5 A Day program, which is now Fruits & Veggies—More Matters®. The objective was to re-brand 5 A Day to be sustainable, adaptable, and compelling, while leveraging existing program equity which included industry and public health support for the message.
Formative research included interviews with representatives from government, industry, and medical organizations, and consumer perspectives from interviews, focus groups, and an online survey.13 Public health and private organizations clearly agreed that a compelling emotional benefit was needed to motivate consumers to eat more of all forms of fruits and vegetables (fresh, frozen, canned, dried, and 100% juice) and that messaging needed to be used consistently among national, state, and local programs.
Interviews and focus groups targeted mothers who indicated they believed that they and their families were getting enough fruit and vegetables over time, knew they could eat more, but needed to be convinced why. The most effective messages appealed to mothers’ emotional needs to be responsible, leveraged functional intrinsic values of fruit and vegetables, did not try to quantify “enough,” and focused on small steps to increase consumption. The benefits of fruits and vegetables (e.g., health, energy, variety, well-being) were important in driving decisions to eat and serve more of them. When the Fruits & Veggies—More Matters® logo and brand were viewed together, the majority (62%) of adults, both men and women, with an over-sampling of African-Americans and Hispanics, said it increased their interest in eating more fruits and vegetables. The Fruits & Veggies—More Matters public health initiative was then launched in early 2007 as a replacement for the 5 A Day program. It reflected the new Dietary Guidelines and resonated with consumers, mothers

[6] National Fruit & Vegetable Alliance
2007 2008 2009 % Change Over Time
Average Number of Unique Monthly Web Visitors to FruitsAndVeggiesMoreMatters.org
47,252 49,815 61,318 +30%
Opt-In E-mail Participants 12,404 17,405 20,350 +64%
Annual Number of Role Models (of Fruits & Veggies—More Matters message dissemination)
1 5 14 +1400%
Packaging Labels that carry Fruits & Veggies—More Matters logo
620 1363 1830 +195%
Number of Fruits & Veggies—More Matters Licensees (e.g., growers, processors, retailers and state departments of health)
341 397 414 +21%
Websites linked to FruitsAndVeggiesMoreMatters.org
505 1063 1277 +153%
Annual Media Impressions (no multiplier, print only)
90,000,000 51,000,000 102,800,000 +14%
Annual Internet Buzz Story Mentions about Fruits & Veggies—More Matters
127 466 626 +390%
8. Fruits & Veggies—More Matters Annual Performance Metrics
Mom as Gatekeeper• Gen X moms (born in 1965-1979) report that the main barriers to increasing their family’s fruit and vegetable consumption are different family preferences, the need for new preparation ideas, and limited fruit and vegetable choices on restaurant menus.
• While both Gen X & Gen Y moms (born in 1980-1990) are generally price-sensitive, Gen Y moms are more likely to identify cost as a barrier to fruit and vegetable consumption.
• Gen X moms were most likely to consult the Internet for information on how to get their family to eat more fruits and vegetables. The Internet is also the preferred source for Gen Y moms but to a lesser degree—these moms are more likely to consult individuals such as their healthcare provider, dietitians, or family members.
Source: Annual PBH Gen X Mom Survey, 2010
in particular. The initiative works to provide consumers information through consumer websites, FruitsAndVeggiesMoreMatters.org or fruitsandveggiesmatter.gov, and through a variety of intermediaries, including supermarkets, packaging, educators, health professionals, and the media. Some of the initiative’s annual performance metrics are noted in Chart 8.
Moms’ attitudes and intended behavior related to fruits and vegetables are also measured. In January of each year, starting with the 2007 baseline year, a series of 11 psychosocial questions have been asked of 1000 Gen X mothers.14 Each year the percentage of mothers who strongly agree with each of the 11 questions is averaged and compared with the 2007 baseline. One year after the launch, there was a 7% improved score in psychosocial factors over baseline. By January of 2009, in the middle of the economic downturn, these attitudes declined by 3% from baseline. In 2010, these attitudes had improved over baseline by 4%, indicating a return to positive momentum among mothers to increase fruit and vegetable consumption among family members.

[7]National Action Plan to Promote Health Through Increased Fruit and Vegetable Consumption
2010 Report Card
Supermarkets and Other RetailersSupermarkets and other retailers offer an unprecedented opportunity to increase consumers’ access to fruit and vegetables, and to provide them with the knowledge and skills they need to increase their purchases and consumption. Given that there are more than 35,000 supermarkets nationwide, such venues have the potential to deliver more than 500 million messages each week, through advertising and in-store impressions that promote eating more fruits and vegetables. Lack of access to healthy food retailing has also been linked with low fruit and vegetable consumption. Addressing this need has been added as a key strategy to this updated 2010 National
Action Plan Report Card. Priority strategies now include:
• Enhance and expand the use of supermarket media, marketing, and promotional strategies such as coupons, point-of-purchase signage, loyalty marketing, product sampling, billboards, and radio ads throughout the store and in the local community to promote increased consumption of fruits and vegetables. Also, increase access and expand the fruit and vegetable message beyond traditional grocery retail venues—such as into convenience stores and corner stores.
• Work to increase availability of retail outlets in center cities and other food deserts.
resultsSupermarket Marketing The best metric that currently exists to measure industry-wide marketing efforts by supermarkets in support of fruits and vegetables is through measurement of their collective use of the Fruits & Veggies—More Matters health initiative. Seventy-six percent of all supermarkets are licensed to use Fruits & Veggies—More Matters (Chart 9). Supermarket efforts to support consistent core messages of the Fruits & Veggies—More Matters health initiative have been strong, delivering 2.74 billion consumer ad impressions via circulars alone in 2009, up from 2.68 billion in 2008 and 1.53 billion in 2007 (Chart 10). These totals do not include in-store signage, in-store radio, or plastic bags that may contain the Fruits & Veggies—More Matters message. In fact, supermarkets remain the main venue for relaying the Fruits & Veggies—More Matters message (Chart 11). Many more impressions, however, could be made through supermarket efforts. Supermarkets provide a unique opportunity to reach millions of consumers through point-of-purchase cooking demonstrations, signs, and instructional tours.
Retail Outlets in Food Deserts Having adequate access to fruits and vegetables, through access to supermarkets, convenience stores, corner stores, and other fruit and vegetable markets, has been associated with increased fruit and vegetable consumption.15,16 One measure of access to fruits and vegetables is the percentage of census tracts, or neighborhoods, that have healthier food retailers like supermarkets, warehouse clubs, and fruit and vegetable markets within the tract or within ½-mile of tract boundaries. In 2009, 72% of neighborhoods were reported as having access to healthier food retailers; 28% are therefore lacking access.17 This measurement will serve as a baseline metric moving forward.
Importantly, funds have been provided in the president’s FY 2011 budget for a new program to address this need. The Healthy Food Financing Initiative will invest $400 million to bring grocery stores to underserved areas and help places like convenience stores carry healthier food options.
Total supermarkets: 35,300
9. Percentage of Fruits & Veggies—More Matters Licensed Supermarkets
perc
enta
ge o
f tot
al s
uper
mar
kets
2006 2007 2008 20090
70
60
50
40
30
20
10
80
65%
71%75% 76%
Source: Leemis Reports
10. Retail Consumer Ad Impressions
annu
al im
pres
sion
s in
bill
ions
2007 2008 20090.0
2.5
2.0
1.5
1.0
0.5
3.0
1.53
2.68 2.74
Source: Annual PBH Gen X Mom Survey
11. How Mom Has Become Familiar with the Fruits & Veggies—More Matters Logo
perc
ent
supermarket TV food package internet school
Communication Medium
2010
2008
0
35%
30%
25%
20%
15%
10%
5%
34 34
16
25
18
23
10
14
7
12

[8] National Fruit & Vegetable Alliance
12. Over Time Comparison of Schools with Food (Not Beverage) Vending Machines
Source: YES
perc
ent
36%38%
30%27%
77%74%
67%
55%
70%
79% 78%
68%
8th grade 10th grade 12th grade
2005
2006
2007
2008
0%
20%
10%
40%
30%
70%
60%
50%
80%
90%
13. Fruits & Vegetables Offered in Vending Machines by School Type
Source: School Nutrition Dietary Assessment Study III, 2004-2005 School Year
perc
ent
57.4%
12.2%
24%
0%2.2%
5.5%
0%
8.2%
2.9%
100% Juice Offered in Vending Machine
Fruit & Veggie Vending Offerings in or Near Cafeteria (non-juice)
Fruit & Veggie Vending Offerings Elsewhere in Schools or Outside of
School Building (non-juice)
Elementary School
Middle School
High School
0%
20%
10%
40%
30%
50%
60% 14. Number of Fruits & Veggies—More Matters Approved Labels
cum
ulat
ive
num
ber o
f app
rove
d la
bels
2007 2008 20090
2,000
1,750
1,500
1,000
750
500
250
1,250
620
1,363
1,830
Source: PBH Foundation
Fruit and Vegetable SuppliersFruit and vegetable growers, shippers, and processors can increase demand for fruits and vegetables by focusing on increasing product appeal and packaging products so that consumers can use them easily and cost-efficiently. Key strategies include:
• Develop affordable, effective technologies for selling pre-cut, conveniently packaged fruits and vegetables at venues such as convenience stores, vending machines, food kiosks in transportation centers, and sports venues.
• Use packaging, stickers, or social media to provide consumers with simple recipes and serving suggestions, appropriate health messages, and product handling and storage information.
resultsConvenient Packaging While specific metrics are not currently available, evidence suggests that improvements to increase product appeal and packaging have been made over the past 5 years. For example, steamable bag technology, allowing veggies to go from freezer or produce isle to microwave to table are more readily available, as are single-serve,
multi-serve, and family-size frozen fruit and vegetable packets. Frozen meal kits featuring protein, starch, and increased vegetable serving sizes (for skillet or steam-in-microwave preparation) are also newly available. Similarly, packaging technology now allows for the inclusion of more fruits and vegetables in vending machines. While the number of school food vending machines has decreased over time (Chart 12),18 the 2004-2005 school year provides an appropriate baseline metric for measuring healthy fruit and vegetable vending options in schools (Chart 13).19
Product Messaging The best metric that currently exists to measure industry- wide marketing efforts by fruit and vegetable growers, shippers, or processors in support of fruits and vegetables is through measurement of their collective use of the Fruits & Veggies—More Matters message. Since the launch of the Fruits & Veggies—More Matters initiative in 2007, more than 1800 labels have met the stringent nutrition criteria to carry the brand logo (Chart 14). The criteria by which a product can carry the logo is defined by CDC and outlined in the Fruits & Veggies—More Matters® Brand Guidelines.20

[9]National Action Plan to Promote Health Through Increased Fruit and Vegetable Consumption
2010 Report Card
15. Proportion of Fruits & Vegetables Consumed in Restaurants Over Time
Source: The NPD Group, Nutrient Intake Database
perc
ent
10%
12%
78%
9.5%
11.6%
79%
9%
11%
80%
1999 2004 2009
All Other Away From Home
Restaurants
In-Home
0%
20%
40%
60%
80%
100%
Restaurants and Other Food Service Establishments
As Americans increasingly eat more food prepared away from home, the role of cafeterias, restaurants, and other food service establishments becomes increasingly important. While some operators have made strides in offering more fruits and vegetables, an enormous “opportunity gap” remains. Food consumed away from home makes up about a third of the average American’s daily calories, yet it accounts for only 11% of all fruit and vegetable consumption (Chart 15). Food establishments can attract customers who are looking for healthy food options and improve their bottom line by using less expensive fruits, vegetables, and beans over higher-priced protein foods. One key strategy in this updated 2010 National Action Plan Report Card includes:
• Increase the number of fruit and vegetable menu items and fruit- and vegetable-rich entrees in restaurants, cafeterias, and vending machines. Include fruits and vegetables as part of “value meals” in place of low-nutrition options and include more fruits and vegetables as default side dishes with children’s meals.
resultsFruits & Veggies on MenusAssuring that good tasting fruit and vegetable items are offered on menus is critical to allowing Americans to choose them. While not an indicator of what was ordered or what was consumed, MenuTrends tracks what is
National Fruit & Vegetable Research & Promotion BoardBecause fruits and vegetables are out-promoted by other food products and the operating budget for the Fruits & Veggies—More Matters initiative averages only around $4 million annually, Produce for Better Health Foundation initiated an extensive dialog with fruit and vegetable industry members in 2009 about the possibility of a National Fruit & Vegetable Research & Promotion Board to raise funds to better promote fruits and vegetables.
Economic evidence favors such generic promotions, which average a benefit-cost ratio of 10-16. That is, for each dollar spent, there is a $10-$16 dollar return on investment. The objective of the proposed National Fruit & Vegetable Research & Promotion Board was to increase consumption of all forms of fruits and vegetables for better health through implementation of a comprehensive, $30-million health marketing, communications, and education effort. The effort would have been funded by a proposed 0.046% assessment of the FOB (wholesale) price of all fruits and vegetables at the 1st handler or importer level, or 46 cents of every $1000.
In order for an assessment to be initiated, those who would pay the assessment would participate in a referendum. The majority of those voting would determine referendum results. Following discussions with the industry in 2009, further work on the proposal was discontinued due to lack of industry support. Concerns were expressed that $30 million wasn’t enough funding to have an impact; any additional assessment would have been too onerous in an industry that already suffers from very slim profit margins; and, there was no guarantee that different commodities would have benefitted equally, despite everyone paying their fair share.
Commodity-specific promotion boards currently exist for some fruits and vegetables, but the possibility of a single USDA-administered promotion board representing all fruits and vegetables is highly unlikely. The Fruits & Veggies—More Matters initiative remains the only communications campaign that the industry collectively supports.
Fruits & Veggies—More Matters• In 2010, 45% of mothers said they were more likely to purchase a product with the Fruits & Veggies—More Matters logo on it, up 5% since 2009.
• Of those who were aware of the Fruits & Veggies—More Matters logo, 38% of Gen X moms in 2010 said it motivates them to help their family eat more fruits and vegetables, up from 23% in 2007. This motivational level was consistent between both Gen X and Gen Y moms. Source: Annual PBH Gen X Mom Survey, 2010
[10] National Fruit & Vegetable Alliance
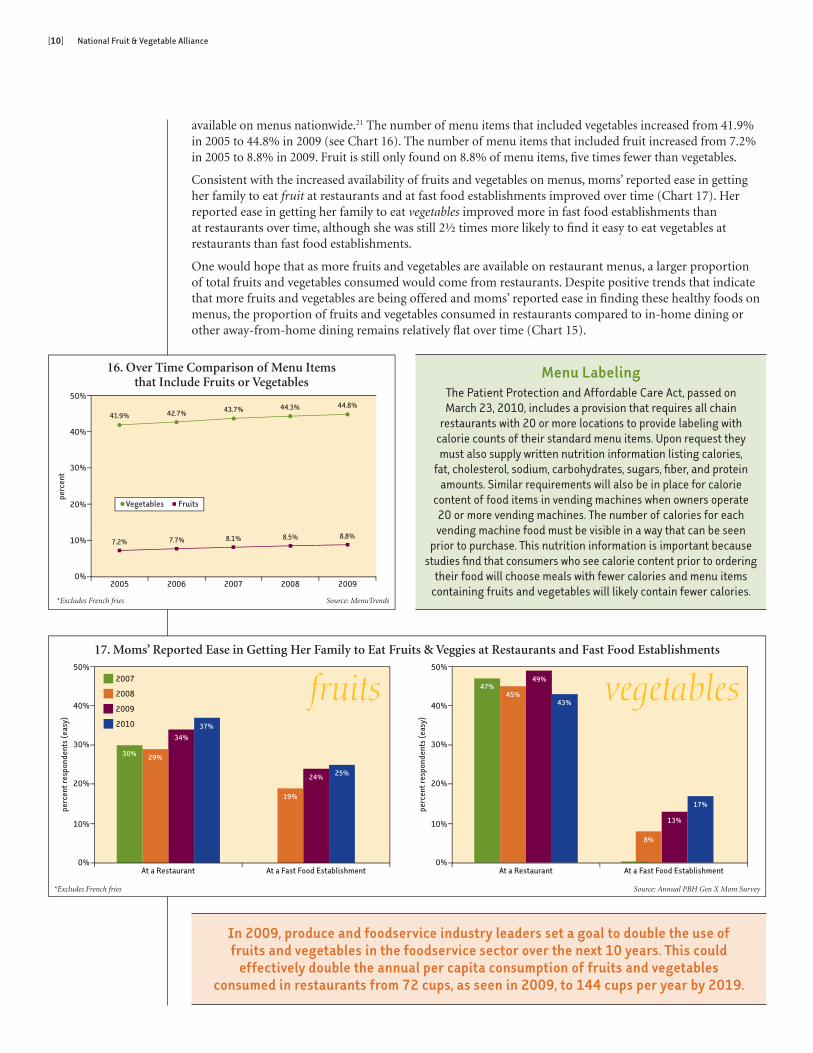
available on menus nationwide.21 The number of menu items that included vegetables increased from 41.9% in 2005 to 44.8% in 2009 (see Chart 16). The number of menu items that included fruit increased from 7.2% in 2005 to 8.8% in 2009. Fruit is still only found on 8.8% of menu items, five times fewer than vegetables.
Consistent with the increased availability of fruits and vegetables on menus, moms’ reported ease in getting her family to eat fruit at restaurants and at fast food establishments improved over time (Chart 17). Her reported ease in getting her family to eat vegetables improved more in fast food establishments than at restaurants over time, although she was still 2½ times more likely to find it easy to eat vegetables at restaurants than fast food establishments.
One would hope that as more fruits and vegetables are available on restaurant menus, a larger proportion of total fruits and vegetables consumed would come from restaurants. Despite positive trends that indicate that more fruits and vegetables are being offered and moms’ reported ease in finding these healthy foods on menus, the proportion of fruits and vegetables consumed in restaurants compared to in-home dining or other away-from-home dining remains relatively flat over time (Chart 15).
In 2009, produce and foodservice industry leaders set a goal to double the use of fruits and vegetables in the foodservice sector over the next 10 years. This could
effectively double the annual per capita consumption of fruits and vegetables consumed in restaurants from 72 cups, as seen in 2009, to 144 cups per year by 2019.
16. Over Time Comparison of Menu Items that Include Fruits or Vegetables
Source: MenuTrends*Excludes French fries
2005 2006 2007 2008 20090%
41.9% 42.7% 43.7% 44.3% 44.8%
7.2% 7.7% 8.1% 8.5% 8.8%
50%
40%
30%
20%
10%
Vegetables Fruits
perc
ent
17. Moms’ Reported Ease in Getting Her Family to Eat Fruits & Veggies at Restaurants and Fast Food Establishments
Source: Annual PBH Gen X Mom Survey*Excludes French fries
perc
ent r
espo
nden
ts (e
asy)
At a Restaurant At a Fast Food Establishment
2007
2008
2009
2010
0%
10%
20%
30%
40%
50%
perc
ent r
espo
nden
ts (e
asy)
47%45%
49%
43%
8%
13%
17%
At a Restaurant At a Fast Food Establishment0%
10%
20%
30%
40%
50%
30% 29%
34%
37%
19%
24% 25%
vegetablesfruits
Menu LabelingThe Patient Protection and Affordable Care Act, passed on March 23, 2010, includes a provision that requires all chain
restaurants with 20 or more locations to provide labeling with calorie counts of their standard menu items. Upon request they must also supply written nutrition information listing calories,
fat, cholesterol, sodium, carbohydrates, sugars, fiber, and protein amounts. Similar requirements will also be in place for calorie
content of food items in vending machines when owners operate 20 or more vending machines. The number of calories for each vending machine food must be visible in a way that can be seen
prior to purchase. This nutrition information is important because studies find that consumers who see calorie content prior to ordering
their food will choose meals with fewer calories and menu items containing fruits and vegetables will likely contain fewer calories.

[11]National Action Plan to Promote Health Through Increased Fruit and Vegetable Consumption
2010 Report Card
Schools, Child Care, and Other Institutions Feeding Children and AdolescentsProviding ample fruits and vegetables and encouraging their consumption is critical to establishing healthy eating habits in children, teens, and young adults. There are several steps that schools and other institutions feeding children can take to promote fruits and vegetables and provide greater access to these products. Key priority strategies include:
• Nutrition Standards: Increase the availability of fruits and vegetables in school lunches and breakfasts by revising the National School Lunch Program (NSLP) and School Breakfast Program (SBP) meal pattern and nutrient-standard requirements based on the 2010 Dietary Guidelines for Americans. Also, implement nutrition standards for foods and beverages served or sold on the whole school campus (including in vending machines, school stores, and a la carte) for the extended school day.
• School wellness policies: Ensure that school district wellness policies include provisions to promote fruits and vegetables throughout the school day and across the school campus.
• Salad Bars: Introduce new fruit and vegetable offerings in fun and innovative ways to increase the appeal of offerings. For example, offer salad bars or pre-plated salads and share best practices with schools.
• Fresh Fruit & Vegetable Program: Expand this snack program to more elementary schools nationwide to increase fruit and vegetable consumption among low-income students.
• Child Care: Update nutrition standards for the Child & Adult Care Food Program (CACFP); strengthen nutrition standards as part of state child care licensing requirements, inspections, and quality ratings; and train Head Start, CACFP, and other child care providers to promote and serve more fruits and vegetables.
resultsNutrition StandardsThe School Health Policies and Practices Study (SHPPS) is a national survey periodically conducted to assess school health policies and practices at the state, district, school, and classroom levels.22 The study has
been conducted every 6 years, beginning in 1994, most recently in 2006. A comparison between 2000 and 2006 data suggests sizeable increases in the availability of fruits and vegetables in school meals (Chart 18). Schools reporting that they offer low-fat, a la carte lettuce, vegetable, or bean salads increased 38% and those that reported serving low-fat, a la carte vegetables other than potatoes increased 39%. Schools offering steamed or baked vegetables, as opposed to fried vegetables, increased by 22% over the same six-year period of time.
A recent 2009 report from the Institute of Medicine recommends that the National School Lunch Program and the School Breakfast Program adopt a new set of nutrient targets and standards for menu planning.23 The report’s recommendations, if implemented, would bring school meals in line with the latest Dietary Guidelines for Americans. The amount of fruit offered in breakfasts would increase to 1 cup per day for all grades and in lunches would increase to 1 cup per day for students in grades 9-12. The amount of vegetables offered would increase to ¾ cup per day for grades K-8, and 1 cup per day for grades 9-12. Schools would provide at least ½ cup each of green
leafy vegetables, orange vegetables, and legumes per week.
On a separate front, USDA started the Healthier U.S. Schools Challenge in 2004. It is a voluntary initiative that recognizes schools participating in the NSLP that have created healthier school environments through promotion of nutrition and physical activity. In order to meet the challenge, schools need to meet rigorous standards. For example, reimbursable lunches must meet the USDA nutrition standards and must allow students the opportunity to select a different vegetable every day of the week. Dark green or orange
Source: School Health Policy and Programs Study (SHPPS) 2000 and 2006
18. Over Time Comparison of Availability of Fruits & Vegetables in Schools
perc
ent
low-fat a la carte lettuce, vegetable or bean salads offered
low-fat a la carte vegetables other than
potatoes offered
steamed or baked vegetables
(as opposed to fried)
2000
2006
0
90%
80%
70%
60%
50%
40%
30%
20%
10%
52.6%
72.8%
51%
70.8%67%
81.9%

[12] National Fruit & Vegetable Alliance
20. Public Schools that Reported Efforts to Improve Student Nutrition and Health
Source: YES
2004 2005 2006 2007 20080%
42%
52% 52% 50%45%
85%
76%78%
100%
90%
80%
70%
20%
30%
40%
50%
60%
10%
Report Having Current Efforts to Improve Student Nutrition and Health
Report Having School Wellness Policy
perc
ent
SY 1991-92
SY 1998-99
SY 2004-05
Source: School Nutrition Dietary Assessment Study (SNDA) Series
21. Salad Bars Offered Daily in National School Lunch Program by School Type
perc
ent
Elementary School Middle School High School0.0
30
20
10
40
4%
9%
13%
22%
19%18%
33%
29%
18%
19. Over Time Comparison of Schools Who Meet Healthier U.S. Schools Challenge
Source: USDA
2005 2006 2007 2008 20090
52
99
172
492
598600
400
500
300
200
100
num
ber o
f sch
ools
, cum
ulat
ive
vegetables need to be offered 3 or more days per week and cooked dry beans or peas must be offered each week. Schools must also offer a different fruit every day of the week (fresh, frozen, canned, dried, or 100% juice). Dried fruit can have no added sweetener and canned fruit must be packed in juice or light syrup. There are standards for nutrition education, school wellness policies, school fundraising, and physical activity requirements, as well.
Between 2005 and 2009, the number of schools that met the Healthier U.S. Schools Challenge increased from 52 to 598, representing a 1050% increase (Chart 19). USDA’s goal is to have 1250 schools meet the challenge by June of 2011, representing slightly more than 1% of the more than 105,000 K-12 schools in the United States.
School Wellness PoliciesThe Child Nutrition and WIC Reauthorization Act of 2004 required all school districts across the country to develop wellness policies by the beginning of the 2006-2007 school year. Wellness policies must include goals for nutrition and physical education as well as guidelines for foods and beverages served throughout the school campus. Findings from a national sample of schools in a series of Youth, Education, and Society (YES) surveys show that 85% of schools reported having a school wellness policy by 2008 (Chart 20).18 However, a separate analysis suggests that many policies are weak and the quality varies greatly, with school districts citing lack of resources as a barrier to implementation.24
Salad BarsSalad bars can provide students a wide variety of vegetables and fruits that can then be self-selected by preference. Chart 21 shows that the number of salad bars offered daily in elementary schools appears to be increasing, while the number of salad bars offered daily in high schools is declining.19, 25 According to the most recent USDA SNDA III study, 18% of high schools and middle schools and 13% of elementary schools had a salad bar offered every day during the 2004-2005 school year (Chart 21). A more recent report reflecting the 2007-2008 school year suggests that 21% of all schools have a salad bar available in the National School Lunch Program meals most or every day.26
Fresh Fruit & Vegetable Program (FFVP)The concept is simple: Offer fresh fruit and vegetable snacks during the school day and improve children’s daily consumption. In reality, the U.S. Department of Agriculture’s (USDA) Fresh Fruit and Vegetable Program is transforming schools into models for healthy behavior and better learning environments. The 2002 Farm Bill created an innovative pilot program to provide free fruit and vegetable snacks to students in participating schools. Separate and distinct from the schools’ existing meals programs, the snack program is intended to increase children’s fruit and vegetable consumption for their better health.
The original FFVP started as a pilot program in 2002 in four states (25 schools each) and selected schools in one Indian Tribal Organization. It became a permanent program in a limited number of states in 2004 and was expanded to all 50 states, the District of Columbia, Guam, Puerto Rico, and the Virgin Islands in 2008. The program operates nationwide in selected schools

[13]National Action Plan to Promote Health Through Increased Fruit and Vegetable Consumption
2010 Report Card
69
159 9
45
65
101
22. Funding Available Over Time for Fresh Fruit & Vegetable Program
Source: USDA
SY2002-2003
SY2004-2005
SY2003-2004
SY2005-2006
SY2006-2007
SY2007-2008
SY2008-2009
SY2009-2010
SY2010-2011
SY = School Year
0
120
80
100
60
40
20
mill
ions
of d
olla
rs
with a high proportion of low-income students and provides free fruits and vegetables throughout the school day in elementary schools. The program is estimated to have served 1.8 million school children in the 2009-2010 school year; expectations are that it will reach 3 million students by the 2012-2013 school year.
One of the biggest successes for increasing the consumption of fruits and vegetables over the past decade, this program funding has increased exponentially as a result of the 2008 Farm Bill (Chart 22).
Child Care Research has not been conducted to evaluate the nutritional quality of meals and snacks for the Child and Adult Care Food Program (CACFP) participating child-care sites in more than 10 years. The latest national study identified that 1/3 of snacks and breakfast meals offered did not include any fruit or vegetable item.27 In 2009, the Institute of Medicine was contracted by USDA to provide recommendations to update meal requirements for CACFP. Also, the Child Nutrition and WIC Reauthorization Act
currently under discussion may include a requirement to assess the nutritional quality of all foods provided to children in child care settings.
Work PlacesWorksites provide many opportunities to reinforce and promote healthy lifestyle behaviors. Whether through a broad worksite wellness program or through specific initiatives, employers can create a workplace environment that provides many occasions to increase employees’ motivation, opportunity, and ability to choose fruits and vegetables. Strategies include implementing healthy catering and vending policies, including a wide variety of fruit and vegetable menu options in cafeterias; implementing pricing strategies that favor healthy foods like fruit and vegetables; and providing social support and education through worksite efforts. Promoting and facilitating healthy eating at work is an excellent investment. Over time, it can save costs from diet-related diseases and lost productivity while boosting overall employee health and morale. Key priority areas include:
• Develop a regular national surveillance system, similar to the school SHPPS surveillance system, which measures worksite activities and tracks successful worksite programs and policies.
• Implement food procurement (including catering policies) for all company and/or government food purchases, events, and conferences, and food served on company and or government property to require plentiful fruits and vegetables that are prepared healthfully.
resultsNational Surveillance SystemNational worksite health promotion surveys in the United States were conducted in 1985, 1992, 1999, and 2004. Results from the three earlier surveys, however, were not readily available. The 2004 National Worksite Health Promotion Survey will serve as a baseline metric for National Action Plan purposes.28 Nutrition programs or activities were found in 22.7% of the 730 worksites surveyed. Worksite disease management programs were offered for diabetes (25% of sites), cancer (22.5%), hypertension (22.9%), cardiovascular disease (26.1%), and obesity (16.4% of sites). In terms of environment, 24% of worksites had cafeterias and most sites (79.6%) had food or beverage vending services. Overall, 37.4% of sites reported labeling healthy food choices as such and 5.6% had healthy food promotions. Only 6.1% of worksites had policies governing food choices for their catering events. Differences were noted by size of worksite, with larger worksites (750+ employees) offering more diabetes and cardiovascular disease management programs and on-site employee cafeterias.
Government Procurement PoliciesA survey of states to determine which government agencies have food procurement policies that require the availability of fruits and vegetables is currently in process.
Per capita medical spending for the obese is 42% higher than for someone of normal weight.5

[14] National Fruit & Vegetable Alliance
Health Care and Health OrganizationsMany organizations and professionals deliver health messages to individuals via a variety of forums; efforts to increase fruit and vegetable consumption are often consistent with their missions and in many instances may further their goals. A priority strategy in this area moving forward is:
• Develop a network of health care community providers and policy makers, such as primary care physicians, pediatricians, nurses, dietitians, and other health care professionals, who will help deliver consistent, behaviorally-focused messages, and practical tips about fruits and vegetables for better health outcomes. This same network will be targeted to help in the formation of guidelines, performance measures, and other recommendations that include nutritionally-based outcomes.
resultsInformation to Health Care ProvidersThe 2005 National Ambulatory Medical Care Survey (NAMCS), conducted annually by the National Center for Health Statistics, serves as a baseline indicator for this section of this National Action Plan report card.29 Ambulatory medical care, care that is delivered on an outpatient basis, is the most widely used segment of health care services in the United States. Physician offices comprise about four-fifths of all ambulatory medical care delivered. This indicator represents care given by physicians in private practices and freestanding clinics, including public health clinics and community health centers.
In 2005, health education was ordered or provided at 38.4% of ambulatory medical care visits. The most frequent counseling or education provided or ordered at office visits related to diet or nutrition (14.8%) and exercise (10.9%). Ten years earlier in 1995, diet or nutrition (13.3%) was also the most frequent counseling or education provided or ordered at office visits (Chart 23).30
Looking to the FutureThe Patient Protection and Affordable Care Act, passed in 2010, includes the following prevention and wellness provisions:
• Promotion of healthier eating habits and increased physical activity through increased funding for Community Transformation Grants.
• Grants to states or local health departments to conduct pilot programs for prevention and wellness programs designed to reduce Medicare costs.
• The Secretary of the Health and Human Services Department is to conduct a national media campaign on health promotion and disease prevention that will focus on nutrition, physical activity, and smoking cessation no later than March 2011.
• CDC to conduct a national worksite survey to assess employer-based health policies and programs by March 2012, followed by a report to Congress.
199530 200031 200529
Health education N/A N/A 38.4%
Therapeutic & preventive services (non-medication) 34.9% 35% N/A
Diet or nutrition services 13.3% 15.4% 14.8%
Exercise 10% N/A 10.9%
Weight Reduction 4.7% N/A N/A
23. Services Ordered or Provided at Physician Offices
Medicare and Medicaid spending would be 8.5% and 11.8% lower, respectively, in the absence of obesity.5

[15]National Action Plan to Promote Health Through Increased Fruit and Vegetable Consumption
2010 Report Card
Research and EvaluationFederal research efforts should reflect the important role of fruits and vegetables in reducing the risk of chronic disease. There is an urgent need to increase support and leverage research, especially federally-sponsored research, to overcome actual and perceived barriers to increased consumption of fruits and vegetables. Priority areas identified below primarily pertain to federal fruit and vegetable research efforts, but can be applied more broadly to include other research entities:
• Conduct an independent assessment of federal nutrition assistance and health programs and policies, as well as agricultural programs and policies, to determine the extent to which agriculture policy is consistent with health policy; such an assessment should include recommendations on how to better align federal health and agriculture policy.
• Build the scientific evidence base to identify strategies to increase fruit and vegetable consumption. This research can be about the impact on eating behavior when there is greater fruit and vegetable availability, nutrition education, peer counseling, physician recommendations, or changes in food marketing that occur in a variety of settings such as schools, worksites, restaurants, and supermarkets.
resultsAssessment of Health and Agriculture PoliciesA recent report was developed to determine whether the nation’s agricultural policy is consistent with its health policy and specifically the extent to which the federal government has made fruits and vegetables a national public health priority.12 High-level federal officials from the U.S. Department of Agriculture (USDA) and the U.S. Department of Health and Human Services (HHS) have extolled the health benefits of increased fruit and vegetable consumption and reiterated the need to commit additional federal resources to close the consumption gap that exists. This review of federal spending, however, found that fruits and vegetables remain a low priority for the federal government, as seen in some of the conclusions from this report:
• The Public Health and Economic Stakes Associated With the Fruit and Vegetable Consumption Gap Are Very High and Growing Rapidly
The report shows that the health care and other costs of inadequate fruit and vegetable consumption for just three diet-related, chronic diseases associated with the fruit and vegetable consumption gap—coronary heart
disease, stroke, and cancer—grew by 92% between FY 1999 and FY 2008 and currently stands at $56 billion a year.
• The Large USDA Fruit and Vegetable Spending Gap Parallels the Consumption Gap and Is Inconsistent with Dietary Guideline Priorities
Four types of USDA spending related to specific food groups were compiled and reviewed: subsidies provided through farm bills; nutrition assistance program spending; food and agricultural research; and the administration of programs benefitting specific food groups. As shown in Chart 24, USDA spends more than twice the amount of its funds on the meat group, which comprises only 8% of the daily servings recommended in the Dietary Guidelines, than it spends on fruits and vegetables, which comprise 41% of the recommended daily food servings. USDA would have to more than double its spending for fruits and vegetables (by adding $3.6 billion) to bring USDA food group spending in line with Dietary Guideline recommendations.
• Fruits and Vegetables Are a Low Priority at HHS Despite the Health Risks of the Consumption Gap
NIH spending for fruit and vegetable research associated with three major chronic diseases (i.e., cancer, coronary heart disease, and stroke) accounted for 0.78% (less than one percent) of total research spending on those diseases, despite the fact that inadequate fruit and vegetable consumption accounts for 6%-20% of the risk associated with those illnesses. A comparison of the respective health risks of inadequate fruit
24. Total USDA Spending by Food Group vs. Daily Recommended Servings, 2008-2009
perc
ent
grains meat dairy fruits and vegetables
fats and oils
% Share of Spending
% Share of Recommended Servings
0
60
50
40
30
20
10
16.3%
28.7%
43.6%
8.3%
16.3%
12.7%
19.8%
41.4%
3.9%
8.9%
Source: 2010 Gap Analysis

[16] National Fruit & Vegetable Alliance
and vegetable consumption with tobacco use found that both NIH and CDC grossly under-fund fruit and vegetable related programs and that both spend a higher, disproportionate amount on anti-tobacco projects.
• Since FY 2000, the Priority Given to Fruits and Vegetables by Federal Agencies Has Not Increased
Although the share of USDA spending for fruits and vegetables increased from 7.7% in FY 2000 to 19.8% in FY 2008 as seen in Chart 25, it remains less than half of the share of recommended servings (41%) allocated to fruits and vegetables by the Dietary Guidelines. Most of the growth in the percentage share for fruits and vegetables was a result of the new WIC fruit and vegetable voucher program and the steep drop in farm commodity program subsidies for grains and oilseeds caused by high prices.
Finally, as shown in Chart 26, the percentage of NIH cancer, coronary heart disease, and stroke research funds that were devoted to fruits and vegetables continued to be minute, despitethe significant health risks associated with the fruit and vegetable consumption gap.
• Nearly $5 Billion in Cost-Effective Annual Spending Would Be Needed to Close the Total Federal Fruit and Vegetable Spending Gap
In FY 2008, USDA, NIH, and the CDC spent about $126 billion on activities related to food, agriculture, and public health. Less than 3% of those combined budgets was spent on programs and projects related directly to fruits and vegetables. Closing the fruit and vegetable consumption gap will require closing the fruit and vegetable spending gap. As shown in Chart 27, USDA and HHS would have to more than double their spending on fruit and vegetable related projects, an increase of about $4.8 billion, to close the total fruit and vegetable spending gap. By comparison, the $56.3 billion annual economic cost of the fruit and vegetable consumption gap with respect to cancer, coronary heart disease, and stroke is nearly 12 times the amount needed to close the fruit and vegetable spending gap.
25. Change in USDA Fruit & Vegetable Spending and Recommended Servings
perc
ent o
f USD
A sp
endi
ng
1999-2000 2008-20090
50
40
20
10
30
7.7%
19.8%
33%
41.4%
Share of spending on fruits & vegetables (versus other foods)
Share of recommended servings of fruits & vegetables (versus other foods)
Source: 2010 Gap Analysis
26. NIH Research Spending for Three Diet-Related Diseases, FY 2008
perc
ent o
f NIH
spe
ndin
g
coronary heart disease cancer stroke0
20
15
10
5
0.68%
16%
0.74%
6%
1.56%
19.3%Spending on Fruit & Vegetable Projects
Risk due to Fruit & Vegetable Consumption Gap
Source: 2010 Gap Analysis
27. Additional Spending on Fruits & Vegetables Needed to Reach Fair Share
mill
ions
of d
olla
rs
USDA food group related
spending
USDA nutrition education spending
NIH research spending (cancer,
coronary heart disease, stroke)
CDC spending0
4
3
2
1
$3,651
$1,011
$97.8 $44.7
Source: 2010 Gap Analysis
Additional, or reallocated, investments needed to close the fruit and vegetable spending gap promise high benefit-cost ratios, given the $56 billion annual cost of the consumption gap, and reductions in devastating chronic illnesses such as
cancer, coronary heart disease, and stroke.

[17]National Action Plan to Promote Health Through Increased Fruit and Vegetable Consumption
2010 Report Card
Evidence Base Development One metric that can help determine the growth in evidence- based research surrounding best strategies to increase fruit and vegetable consumption is to measure funding allocated to nutrition and obesity research. Chart 28 outlines National Institutes of Health (NIH) funding for nutrition and obesity research since 2006.32 While there has been a strong 49% increase in nutrition research funding and a 40% increase in obesity- funded research between 2006 and 2010, less than 1% of all NIH research projects on nutrition is dedicated to fruits and vegetables (Chart 26). Furthermore, the combined nutrition and obesity funds represent only 6% of total NIH spending in 2006 and 8% of total NIH spending in 2009.33 With fruits and vegetables playing such a strong role in disease prevention, funding in this area of research is still lacking.
State and Federal PolicyFederal and state governments play a critical role in promoting the health and well-being of all Americans. They have powerful tools at their disposal that can help address our Nation’s most pressing health challenges of poor diet and inactivity. Nutrition assistance programs alone reach one in five Americans in the course of a year, providing food benefits and nutrition education. It is imperative that all federal, state, and local agencies include fruit and vegetable messaging and procurement practices consistent with the Dietary Guidelines for Americans in all major policies and programs. In addition to schools, child care, and nutrition education discussed earlier in this report, these policies also include USDA’s food guidance system; Special Supplemental Nutrition Program for Women, Infants, and Children (WIC) food packages; government health targets; other nutrition assistance programs; and National Institutes of Health programs and communication efforts including clinical treatment guidelines. Aligning nutrition and agriculture policies with health policies will be essential in helping consumers meet fruit and vegetable consumption goals. Priority activities in this area moving forward include:
• Supplemental Nutrition Assistance Program (SNAP): Encourage greater emphasis on and promotion of increased consumption of fruits and vegetables. For example, pilot projects should be conducted to assess the dietary impact of bonus benefits within the SNAP program when purchasing fruits and vegetables. Also, SNAP nutrition education guidance should emphasize the promotion of fruits and vegetables in state education efforts.
• WIC: Implement and promote use of new fruit/vegetable vouchers as part of WIC food packages to provide greater access to fruits and vegetables, and assure that nutrition education guidance is provided to WIC operators to promote fruits and vegetables.
• CDC: Ensure that CDC has ample funding for promoting fruits and vegetables. For example, increase funding to all states to build infrastructure and strengthen programs to support increased fruit and vegetable consumption and build capacity at CDC to better support and enhance national fruit and vegetable promotion.
resultsSupplemental Nutrition Assistance ProgramThe 2008 Farm Bill provided $20 million for pilot projects to provide incentives at the point of purchase to encourage participating SNAP households to buy fruits, vegetables, or other healthful foods and to conduct a rigorous evaluation that measures the impact of the pilot program on health and nutrition. This effort is referred to as the Healthy Incentives Pilot (HIP.) A timeline for the project is noted to the left.
28. Funding Available Over Time for Nutrition and Obesity Research
Source: Research Portfolio Outline Reporting Tools (RePORT)
mill
ions
of d
olla
rs
2006 2007 2008 2009 2010 (est.)
Nutrition
Obesity
0%
1,800
1,600
1,400
1,200
1,000
800
600
400
200
1,039
594
1,327
595
1,391
664
205
1,6051,543
831862
1,400
117
745
108
1,435
68763
American Recovery & Reinvestment Act
USDA Healthy Incentives Pilot (HIP)
$20 million allotted in Farm Bill
Request for application released to identify contractor to conduct
evaluation and pilot study
Contractor award announced
Operation phase of pilot
Final presentation of pilot results to USDA
2008
2009
2010
2011-2013
2013

[18] National Fruit & Vegetable Alliance
30. States Funded Through Nutrition and Physical Activity Program to Prevent Obesity and Other Chronic Disease
Source: CDC Division of Nutrition, Physical Activity, and Obesity
2000 2001 2002 2003 2004 20062005 2007 20092008 20100
6
28 28 28
23
25
30
20
10num
ber o
f sta
tes
12 12
20
28
25
WICAfter many years of advocacy, the WIC program now includes vouchers for the purchase of fruits and vegetables. Previously, only carrots and fruit juice could be purchased with WIC vouchers. Effective October 1, 2009, the program gives $10 per month vouchers to mothers and $6 per month vouchers to children for the purchase of any variety of fruit or vegetable. The program will reach an estimated 9 million participants in FY 2009 alone, representing an estimated value of $600 million in new fruit and vegetable purchases. Coupon redemption rates are estimated to be above 80%. Total funding and coupon redemption rates will serve as indicators of success in this program.
CDCCDC’s Division of Nutrition, Physical Activity, and Obesity (DNPAO) works to reduce obesity and obesity-related diseases through state programs, research, surveillance, training, leadership, policy and environmental change, communication and social marketing, and partnership development. DNPAO implements a cooperative agreement with 25 state health departments to prevent and control obesity and other chronic diseases through healthful eating and physical activity. The state programs coordinate statewide efforts with partners to address six target areas to prevent and control obesity, including increasing the consumption of fruits and vegetables and reducing the consumption of high energy dense foods. Indicators of success include DNPAO funding (Chart 29), the number of states funded by DNPAO obesity grants (Chart 30), and the number of enacted community fruit and vegetable bills (Chart 31). DNPAO funding was relatively flat from 2005-2010, and the number of state-funded obesity grants decreased. The number of fruit and vegetable bills enacted at the community level, however, increased over time. These bills relate to increasing access to or the availability, affordability, production, promotion, and distribution of fruits and vegetables.34, 35
2.2 2.2 2.2 2.2 2.2 2.2 2.1 2.1 2.0 2.06.2
16
27.6
34.4
39.3
41.941.941.9 4244
29. Budget of CDC’s Division of Nutrition, Physical Activity and Obesity
Source: National Alliance of Nutrition and Activity (NANA), 2010
’10’09’08’07’06’05’04’03’02’01’00’99’98’97’96’95’94’93’92’910
50
40
20
10
30
mill
ions
of d
olla
rs
Congress authorized a two-year pilot project to serve pregnant and lactating women, infants, and children up to age four.
WIC (Women, Infants, and Children) officially became a permanent national
health and nutrition program.
Institute of Medicine (IOM) panel was appointed to review WIC food package.
IOM panel reviewed WIC food package.
IOM report to USDA recommended changes to WIC food package.
USDA sought public comment on proposed changes to WIC food package.
Interim final rule proposed by USDA on new WIC food packages:
$8 voucher/month for moms; $6 voucher/month for kids.
All states implementing vouchers.
FY 2010 agriculture appropriations included funding (no specific
amount) to increase cash-value vouchers for non-breastfeeding women from $8 to $10/month.
1975
2003
2004
2005
2006
2007
Oct. 1, 2009
2010
1972WIC Program
31. Total Enacted Community Fruit and Vegetable Bills
Source: CDC, DNPAO State Legislative Database and National Conference of State Legislatures (NCSL) Food Legislation Database
2001 2002 2003 2004 2005 2006 2007 2008 20090
3
150
90
120
60
30
num
ber o
f bill
s, cu
mul
ativ
e
713
25
43
67
100
115
146

[19]National Action Plan to Promote Health Through Increased Fruit and Vegetable Consumption
2010 Report Card
Conclusion & RecommendationsAs shown on pages 20-21, significant positive changes occurred in several areas outlined in the 2005 National Action Plan, including expansion of the Fresh Fruit & Vegetable Program, inclusion of fruit and vegetable vouchers in the WIC program, the development and launch of the Fruits & Veggies—More Matters communications campaign, and increased funding for nutrition and obesity research at NIH. Other, less sizeable but equally notable progress occurred in other areas, including greater availability of fruits and vegetables on restaurant menus, a modest shift of advertising away from low nutrition foods, and better alignment of school foods with the Dietary Guidelines for Americans. The full impact of these changes may not yet be apparent.
In some priority areas, while progress could not be assessed, at least baseline metrics became available to help monitor future efforts. These include measurements on access to healthy food retail outlets and workplace food practices.
In spite of good progress in several areas, one glaring problem remains: agriculture policy still does not align with health policy in this nation. Nutrition education as a percent of nutrition assistance programs has made little progress over the past decade; the percent of USDA spending on fruits and vegetables relative to other foods and their importance in nutrition policy is not in alignment; and the percent of HHS research dollars spent specifically on fruits and vegetables has remained flat. Similarly, while advertising may be shifting away from low nutrition foods, it has not been replaced with advertising for more nutritious foods, like fruits and vegetables, and fruit and vegetable producers cannot afford to do so themselves.
While significant strides were made in some identified strategic areas and baseline metrics were created for others, consumption of fruits and vegetables remains relatively flat for the overall population during the past five years. There appears to be some positive momentum in greater consumption of fruits and vegetables among children, particularly those less than six years old. Whether this momentum is sustainable and whether it is a result of efforts outlined in this report remains to be seen.
To continue the steps toward increasing fruit and vegetable consumption, the prioritized strategies outlined in this report must be implemented. Strategies include increasing accessibility of fruits and vegetables in communities, schools, worksites, and on menus; effective nutrition education and promotion efforts that give consumers the skills and motivation they need to make better choices; and better alignment of federal policy and funding priorities with Dietary Guidelines. This 2010 National Action Plan Report Card continues to provide an outline of initiatives that together will create an environment where the healthy choice is the easy and desirable choice, and fruits and vegetables are center stage in producing a healthier America.
19801985
1995
1990
2000
2005
2010
Dietary Guidelines for Americans: Fruit & Vegetable Recommendations Over Time
“Eat a variety of foods.” and “Eat foods with adequate starch and fiber.”
“Eat a variety of foods.” and “Eat foods with adequate starch and fiber.”
“Choose a diet with plenty of vegetables, fruits, and grain products” (at least 3 vegetable servings; 2 fruit servings).
“Choose a diet with plenty of grain products, vegetables, and fruits” (3-5 servings of vegetables; 2-4 servings of fruit).
“Choose a variety of fruits and vegetables daily” (3-5 servings of vegetables; 2-4 servings of fruit).
1-2.5 cups/fruit; 1-4 cups/vegetables depending on energy needs; subgroups include dark green, orange, legumes, starchy vegetables, and other vegetables.
Available in late 2010.
National Fruit & Vegetable Alliance priorities are to:1. Encourage greater emphasis on and promotion of fruits and vegetables in federal nutrition assistance programs.
2. Use Fruits & Veggies—More Matters as a consistent message in education and marketing efforts.
3. Increase use of salad bars in schools.
4. Increase use of fruits and vegetables on restaurant and cafeteria menus.
[20] National Fruit & Vegetable Alliance
Amount of improvement Baseline Comparison Grade*
2010 National Action Report Card I. CURRENT FRUIT & VEGETABlE CONSUMPTION
1. Adult consumption (2004-2009, NPD) 1.81 cups 1.81 cups D
2. Children < 6 Years Old (2004-2009, NPD) 1.20 cups 1.29 cups D
3. Children 6-12 Years Old (2004-2009, NPD) 1.37 cups 1.43 cups D
4. Children 13-17 Years Old (2004-2009, NPD) 1.84 cups 1.76 cups F
5. Percent of males who achieve their vegetable target (2004-2009, NPD) 9.2% 7.1% F
6. Percent of females who achieve their vegetable target (2004-2009, NPD) 7% 4.9% F
7. Percent of children who achieve their vegetable target (2004-2009, NPD) 9.3% 8.1% F
8. Percent of males who achieve their fruit target (2004-2009, NPD) 4.5% 5% D
9. Percent of females who achieve their fruit target (2004-2009, NPD) 6.9% 7.4% D
10. Percent of children who achieve their fruit target (2004-2009, NPD) 12.7% 11.8% F
II. NUTRITION PROMOTION & MARkETING
A. Food marketing
1. Quality of foods marketed to children: high nutrition foods (2005-2009, Ch1ldren Now) 3% 0.9% F
2. Quality of foods marketed to children: low nutrition foods (2005-2009, Ch1ldren Now) 84% 72.5% D
3. Percent of all food marketing directed at youth that is about fruits and vegetables (excluding juice) (2006, FTC) <1% ($11,463,000)
4. Companies with child food marketing policies (2009, CSPI) 32%
5. Of companies with child food marketing policies, the percent with nutrition standards or 94% of food & beverage manufacturers, 50% that do not allow marketing of any foods to children under age of 12 (2009, CSPI) of restaurants, 46% of entertainment companies
B. USDA Nutrition Education
1. Funding for nutrition education in nutrition assistance programs (2002 vs. 2008, PBH) $325,000,000 $685,400,000 C
2. Nutrition education spending as a percent of total nutrition assistance spending (2002 vs. 2008, PBH) 1% 1.2% D
C. Fruit and Vegetable Communications Campaign
1. Development and Launch of Fruits & Veggies—More Matters (2006-2010, PBH) Completed A
III. SUPERMARkETS & OTHER RETAIlERS
1. Percent of supermarkets licensed to use Fruits & Veggies—More Matters (2006-2009, PBH) 65% 76% A
2. Supermarket-delivered consumer impressions of fruit & vegetable communications 1.53 billion 2.74 billion C campaign (2007-2009, PBH)
3. Percent of neighborhoods lacking healthy food retail access (2009, CDC) 28%
IV. FRUIT & VEGETABlE SUPPlIERS
A. Convenient Packaging (School Vending as Metric)
1. Percent of schools that offer 100% juice in vending machines 12.2% elementary, 24% middle school, 57.4% (2004-2005 School Year, SNDA III) high school, 23.3% all school average
2. Percent of schools that offer fruits and vegetables in vending machines in or near 0% elementary; 2.2% middle school, 5.5% cafeteria (2004-2005 School Year, SNDA III) high school, 1.5% all school average
3. Percent of schools that offer fruits and vegetables in vending machines elsewhere in schools 0% elementary, 8.2% middle school, 2.9% or outside of school building (2004-2005 School Year, SNDA III) high school, 2.1% all school average
4. Percent of schools that offer fruits and vegetables in vending machines, school stores, 4.2% elementary, 8.7% middle school, or canteens (2006, SHPPS) 17.9% high school
5. Percent of schools that offer 100% juice in vending machines, school stores, or 16.8% elementary, 41.1% middle school, canteens (2006, SHPPS) 64.7% high school
6. Percent of schools with food (not beverage) vending machines (2008, YES) 47% of schools had food vending machines, 25% of food items were fruit and 19% of food items were vegetables
B. Product Messaging
1. Number of Fruits & Veggies—More Matters approved labels (2007-2009, PBH) 620 1830 C
V. RESTAURANTS & OTHER FOOD SERVICE ESTABlISHMENTS
1. Restaurant items that include veggies (2005-2009, MenuTrends) 41.9% 44.8% C
2. Restaurant items that include fruit (2005-2009, MenuTrends) 7.2% 8.8% D
3. Percent of all fruits and vegetables consumed at restaurants (2004-2009, NPD) 12% 11% F
4. Annual fruit cups per capita consumed in restaurants (2004-2009, NPD) 8 cups 8 cups D
5. Annual vegetable cups per capita consumed in restaurants (2004-2009, NPD) 69 cups 64 cups F
6. Moms’ reported ease in getting their family to eat fruit at a restaurant (2007-2010, PBH) 30% 37% A
7. Moms’ reported ease in getting their family to eat vegetables at a restaurant (2007-2010, PBH) 47% 43% F
8. Moms’ reported ease in getting their family to eat fruit at a fast food establishment (2008-2010, PBH) 19% 25% B
9. Moms’ reported ease in getting their family to eat vegetables at a fast food establishment (2008-2010, PBH) 8% 17% B
VI. SCHOOlS, CHIlD CARE, AND OTHER INSTITUTIONS FEEDING CHIlDREN & ADOlESCENTS
A. Nutrition Standards (see also School Vending)
1. Percent of schools where low-fat a la carte lettuce, vegetables, or bean salads are offered (2000-2006, SHPPS) 52.6% 72.8% A
2. Percent of schools where low-fat a la carte vegetables other than potatoes are served (2000-2006, SHPPS) 51% 70.8% A
3. Percent of schools who say they steam or baked their vegetables (as opposed to frying) (2000-2006, SHPPS) 67% 81.9% A
4. Percent of schools that have adopted a policy requiring fruits and vegetables be available 1% 6% C in concession stands (2000-2006, SHPPS)
5. Percent of schools that have adopted a policy that requires that fruits and vegetables 22% be available after school (2006, SHPPS)
6. Percent of schools that have adopted a policy that requires that fruits and vegetables 17% be available during parties (2006, SHPPS)
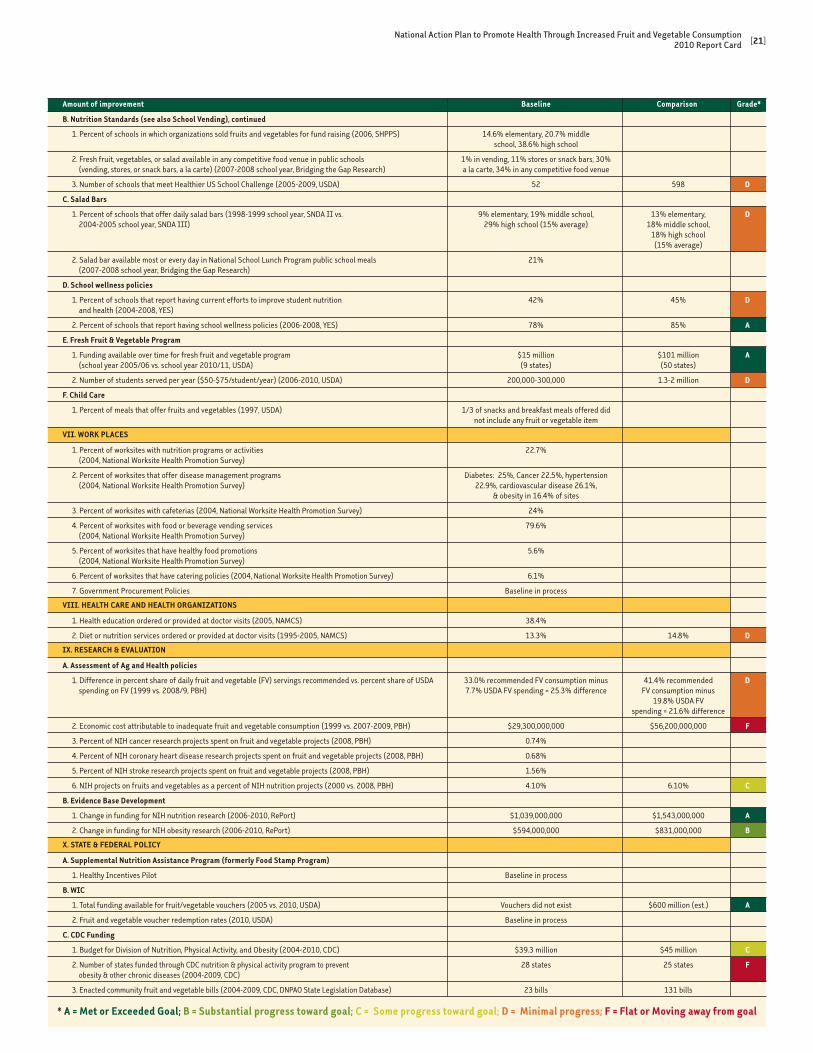
[21]National Action Plan to Promote Health Through Increased Fruit and Vegetable Consumption
2010 Report Card
Amount of improvement Baseline Comparison Grade*
* A = Met or Exceeded Goal; B = Substantial progress toward goal; C = Some progress toward goal; D = Minimal progress; F = Flat or Moving away from goal
B. Nutrition Standards (see also School Vending), continued
1. Percent of schools in which organizations sold fruits and vegetables for fund raising (2006, SHPPS) 14.6% elementary, 20.7% middle school, 38.6% high school
2. Fresh fruit, vegetables, or salad available in any competitive food venue in public schools 1% in vending, 11% stores or snack bars, 30% (vending, stores, or snack bars, a la carte) (2007-2008 school year, Bridging the Gap Research) a la carte, 34% in any competitive food venue
3. Number of schools that meet Healthier US School Challenge (2005-2009, USDA) 52 598 D
C. Salad Bars
1. Percent of schools that offer daily salad bars (1998-1999 school year, SNDA II vs. 9% elementary, 19% middle school, 13% elementary, D 2004-2005 school year, SNDA III) 29% high school (15% average) 18% middle school, 18% high school (15% average)
2. Salad bar available most or every day in National School Lunch Program public school meals 21% (2007-2008 school year, Bridging the Gap Research)
D. School wellness policies
1. Percent of schools that report having current efforts to improve student nutrition 42% 45% D and health (2004-2008, YES)
2. Percent of schools that report having school wellness policies (2006-2008, YES) 78% 85% A
E. Fresh Fruit & Vegetable Program
1. Funding available over time for fresh fruit and vegetable program $15 million $101 million A (school year 2005/06 vs. school year 2010/11, USDA) (9 states) (50 states)
2. Number of students served per year ($50-$75/student/year) (2006-2010, USDA) 200,000-300,000 1.3-2 million D
F. Child Care
1. Percent of meals that offer fruits and vegetables (1997, USDA) 1/3 of snacks and breakfast meals offered did not include any fruit or vegetable item
VII. WORk PlACES
1. Percent of worksites with nutrition programs or activities 22.7% (2004, National Worksite Health Promotion Survey)
2. Percent of worksites that offer disease management programs Diabetes: 25%, Cancer 22.5%, hypertension (2004, National Worksite Health Promotion Survey) 22.9%, cardiovascular disease 26.1%, & obesity in 16.4% of sites
3. Percent of worksites with cafeterias (2004, National Worksite Health Promotion Survey) 24%
4. Percent of worksites with food or beverage vending services 79.6% (2004, National Worksite Health Promotion Survey)
5. Percent of worksites that have healthy food promotions 5.6% (2004, National Worksite Health Promotion Survey)
6. Percent of worksites that have catering policies (2004, National Worksite Health Promotion Survey) 6.1%
7. Government Procurement Policies Baseline in process
VIII. HEAlTH CARE AND HEAlTH ORGANIzATIONS
1. Health education ordered or provided at doctor visits (2005, NAMCS) 38.4%
2. Diet or nutrition services ordered or provided at doctor visits (1995-2005, NAMCS) 13.3% 14.8% D
IX. RESEARCH & EVAlUATION
A. Assessment of Ag and Health policies
1. Difference in percent share of daily fruit and vegetable (FV) servings recommended vs. percent share of USDA 33.0% recommended FV consumption minus 41.4% recommended D spending on FV (1999 vs. 2008/9, PBH) 7.7% USDA FV spending = 25.3% difference FV consumption minus 19.8% USDA FV spending = 21.6% difference
2. Economic cost attributable to inadequate fruit and vegetable consumption (1999 vs. 2007-2009, PBH) $29,300,000,000 $56,200,000,000 F
3. Percent of NIH cancer research projects spent on fruit and vegetable projects (2008, PBH) 0.74%
4. Percent of NIH coronary heart disease research projects spent on fruit and vegetable projects (2008, PBH) 0.68%
5. Percent of NIH stroke research projects spent on fruit and vegetable projects (2008, PBH) 1.56%
6. NIH projects on fruits and vegetables as a percent of NIH nutrition projects (2000 vs. 2008, PBH) 4.10% 6.10% C
B. Evidence Base Development
1. Change in funding for NIH nutrition research (2006-2010, RePort) $1,039,000,000 $1,543,000,000 A
2. Change in funding for NIH obesity research (2006-2010, RePort) $594,000,000 $831,000,000 B
X. STATE & FEDERAl POlICy
A. Supplemental Nutrition Assistance Program (formerly Food Stamp Program)
1. Healthy Incentives Pilot Baseline in process
B. WIC
1. Total funding available for fruit/vegetable vouchers (2005 vs. 2010, USDA) Vouchers did not exist $600 million (est.) A
2. Fruit and vegetable voucher redemption rates (2010, USDA) Baseline in process
C. CDC Funding
1. Budget for Division of Nutrition, Physical Activity, and Obesity (2004-2010, CDC) $39.3 million $45 million C
2. Number of states funded through CDC nutrition & physical activity program to prevent 28 states 25 states F obesity & other chronic diseases (2004-2009, CDC)
3. Enacted community fruit and vegetable bills (2004-2009, CDC, DNPAO State Legislation Database) 23 bills 131 bills

[22] National Fruit & Vegetable Alliance
1 U.S. Department of Health and Human Services and the U.S. Department of Agriculture. Dietary Guidelines for Americans, 2005, 6th edition. 2005. Web. <http://www.health.gov/dietaryguidelines/dga2005/document/default.htm>.
2 Can eating fruits and vegetables help people to manage their weight? Research to Practice Series, No. 1. Web. <http://www.cdc.gov/nccdphp/dnpa/nutrition/pdf/rtp_practitioner_10_07.pdf>.
3 Trends in Fruit and Vegetable Consumption Among U.S. Men and Women, 1994-2005. By H. M. Blanck, C. Gillespie, J. E. Kimmons, J. D. Seymour, and M. K Serdula. Prevention of Chronic Disease, April 2008. Web. <http://www.cdc.gov/pcd/issues/2008/apr/07_0049.htm>.
4 National Action Plan to Promote Health Through Increased Fruit & Vegetable Consumption, 2005. National Fruit & Vegetable Alliance. Web. <http://www.NFVA.org>.
5 Finkelstein, E.A., J.G. Trogdon, J.W. Cohen, and W. Dietz. “Annual Medical Spending Attributable to Obesity: Payer-and Service-Specific Estimates.” Health Affairs 28, 5 (2009): w822-2831. 2009. Print.
6 State of the Plate 2010 Report. Produce for Better Health Foundation, Nov. 2010. Web. <http://www.pbhfoundation.org>. [Note: The Annual PBH Gen X Mom Survey and The NPD Group, Nutrient Intake Database are the basis for this report.]
7 F as in Fat 2010: How Obesity Threatens America’s Future. Web. <http://healthyamericans.org/reports/obesity2010/Obesity2010Report.pdf>.
8 Institute of Medicine (IOM). Food Marketing to Children: Threat or Opportunity? Publication. Washington, D.C.: National Academies, 2006. Print.
9 The Impact of Industry Self-Regulation on the Nutritional Quality of Foods Advertised on Television to Children. Ch1ldren Now, Dec. 2009. Web. <http://www.childrennow.org/uploads/documents/adstudy_2009.pdf>.
10 Marketing Food to Children and Adolescents: A Review of Industry Expenditures, Activities, and Self-Regulation. Federal Trade Commission, Washington, D.C., July 2008. Web. <http://ftc.gov/os/2008/07/P064504foodmktgingreport.pdf; http://ftc.gov/os/2008/07 P064504foodmktgingreportappendices.pdf>.
11 Report Card on Food-Marketing Policies: An Analysis of Food and Entertainment Company Policies Regarding Food and Beverage Marketing to Children. Center for Science in the Public Interest, Mar. 2010. Web. <http://www.cspinet.org/new/pdf/marketingreportcard.pdf>.
12 Rosenfeld, Allen. 2010 Gap Analysis—The Fruit and Vegetable Consumption Challenge: How Federal Spending Falls Short of Addressing Public Health Needs. Produce for Better Health Foundation, 2010. Web. <http://www.pbhfoundation.org>.
13 Produce for Better Health Foundation, 2006. Web. <http://www.pbhfoundation.org>.
14 Gen X Moms’ Attitudes and Beliefs Related to Fruit & Vegetable Consumption, 2006-2009. Produce for Better Health Foundation, 2009. Web. <http://www.pbhfoundation.org>.
15 Larson, M. I., M. Story, and M. C. Nelson. “Neighborhood Environments: Disparities in Access to Healthy Foods in the U.S.” American Journal of Preventive Medicine 36.1 (2009): 74-81. Print.
16 Access to Affordable and Nutritious Food: Measuring and Understanding Food Deserts and Their Consequences. Report to Congress: United States Department of Agriculture Economic Research Service, June 2009. Web. <http://www.ers.usda.gov/Publications/AP/AP036/AP036.pdf>.
References

[23]National Action Plan to Promote Health Through Increased Fruit and Vegetable Consumption
2010 Report Card
17 State Indicator Report On Fruits and Vegetables, 2009. Department of Health and Human Services, Centers for Disease Control and Prevention. Web. <http://www.fruitsandveggiesmatter.gov/health_professionals/research.html>.
18 Yes Results on School Policies and Programs: Overview of key findings. Series of reports for 2005, 2006, 2007, 2008. Youth, Education, and Society (YES), Ann Arbor, MI: Institute for Social Research. Web. <http://www.yesresearch.org/pubs.html#reports>.
19 School Nutrition Dietary Assessment Study-III, Vol. I: School Foodservice, School Food Environment, and Meals Offered and Served. Rep. Vol. 1. U. S. Department of Agriculture, Food and Nutrition Service, Office of Research, Nutrition and Analysis, November 2007. Print. Special Nutrition Programs Report No. CN-07-SNDA-III.
20 Fruits & Veggies—More Matters® Brand Guidelines. Produce for Better Health Foundation, 2009. Web. <http://www.pbhfoundation.org>.
21 MenuTrends Direct. Datassential, PBH inquiry on 20 May 2010. Web. <http://www.datassential.com/mt_reports.htm>.
22 School Health Policies and Practices Study (SHPPS). Summary Reports. Web. <http://www.cdc.gov/HealthyYouth/SHPPS>. See also: O’Toole, T. P., S. Anderson, C. Miller, and J. Guthrie. “Nutrition Services and Foods and Beverages Available at School: Results From the School Health Policies and Programs Study 2006.” Journal of School Health 77.8 (October 2007): 500-21. Print.
23 School Meals: Building Blocks for Healthy Children. IOM (Institute of Medicine). 2010. Web. <http://www.nap.edu/catalog/12751.html>.
24 Local School Wellness Policies: How Are Schools Implementing the Congressional Mandate? Research brief. Robert Wood Johnson Foundation, June 2009. Web. <http://www.rwjf.org/files/research/20090708localwellness.pdf>.
25 School Lunch Salad Bars. Rep. Alexandria, VA.: United States Department of Agriculture, Food and Nutrition Service, Office of Analysis, Nutrition, and Evaluation, April 2002. Print. Nutrition Assistance Program Report Ser., No. CN-02-SB.
26 Turner, L., F. J. Chaloupka, J. F. Chriqui, and A. Sandoval. “School Policies and Practices to Improve Health and Prevent Obesity: National Elementary School Survey Results: School Years 2006-2007 and 2007-2008.” Bridging the Gap Program, Health Policy Center, Institute for Health Research and Policy, University of Illinois at Chicago, 2010. Web. <http://www.bridgingthegapresearch.org/ client_files/pdfs/Publications/BTG_ExecSumm2_FINAL.pdf>.
27 Story, M., D. M. Kaphingst, and S. French. “The Role of Child Care Settings in Obesity Prevention.” The Future of Children 16.1 (Spring 2006): 143-68. Web. <http://www.futureofchildren.org/futureofchildren/publications/docs/16_01_07.pdf.>.
28 Linnan, L., B. Bowling, J. Childress, G. Lindsay, C. Blakey, S. Pronk, S. Wieker, and P. Royall. “Results of the 2004 National Worksite Health Promotion Survey.” American Journal of Public Health 98.8 (August 2008): 1503-509. Print.
29 Cherry, D. K., D. A. Woodwell, and E. A. Rechtsteiner. National Ambulatory Medical Care Survey: 2005. Web. <http://www.cdc.gov/nchs/data/ad/ad387.pdf>.
30 Woodwell, D. A. National Ambulatory Medical Care Survey: 1995 Summary. Web. <http://www.cdc.gov/nchs/data/ad/ad286.pdf>.
31 Cherry, D. K., and D. A. Woodwell. National Ambulatory Medical Care Survey: 2000 Summary. Web. <http://www.cdc.gov/nchs/data/ad/ad328.pdf>.
32 Estimates of Funding for Various Research, Condition, and Disease Categories. Research Portfolio Online Reporting Tools (RePORT). Web. <http://report.nih.gov/rcdc/categories>.

[24] National Fruit & Vegetable Alliance
33 National Institutes of Health Actual Obligations, by Institute and Center FY 1997-FY 2009. Web. <http://officeofbudget.od.nih.gov/pdfs/FY11/Actual%20Obligations%20by%20IC%201997-2009.pdf>.
34 Centers for Disease Control and Prevention (CDC) Division of Nutrition, Physical Activity, and Obesity (DNPAO) State Legislative Database. Web. <http://apps.nccd.cdc.gov/DNPALeg/index.asp>.
35 National Conference of State Legislatures (NCSL) Healthy Community Design and Access to Healthy Food Legislation Database. Web. <http://www.ncsl.org/?tabid=13227>.
References, continued


c/o: Produce for Better Health Foundation
7465 Lancaster Pike
Suite J, 2nd Floor
Hockessin, DE 19707
Phone: 302.235.2329
Fax: 302.235.5555
www.pbhfoundation.org
www.FruitsAndVeggiesMoreMatters.org
www.NFVA.org
©2010 National Fruit & Vegetable Alliance1166-1209