national electricity forecasting report · peak use. this will have a greater effect on system peak...
TRANSCRIPT
NATIONAL ELECTRICITY FORECASTING REPORT
FOR THE NATIONAL ELECTRICITY MARKET
Published: June 2016

NATIONAL ELECTRICITY FORECASTING REPORT
© The material in this publication may be used in accordance with the copyright permissions on AEMO’s website.
Australian Energy Market Operator Ltd ABN 94 072 010 327 www.aemo.com.au [email protected]
NEW SOUTH WALES QUEENSLAND SOUTH AUSTRALIA VICTORIA AUSTRALIAN CAPITAL TERRITORY TASMANIA WESTERN AUSTRALIA
IMPORTANT NOTICE
Purpose
AEMO has prepared this document in connection with its national transmission planning and
operational functions for the National Electricity Market. This report is based on information available as
at 1 June 2016 unless otherwise specified.
Disclaimer
This report contains data provided by or collected from third parties, and conclusions, opinions,
assumptions or forecasts that are based on that data.
AEMO has made every effort to ensure the quality of the information in this report but cannot
guarantee that the information, forecasts and assumptions in it are accurate, complete or appropriate
for your circumstances. This report does not include all of the information that an investor, participant
or potential participant in the National Electricity Market might require, and does not amount
to a recommendation of any investment.
Anyone proposing to use the information in this report should independently verify and check its
accuracy, completeness and suitability for purpose, and obtain independent and specific advice from
appropriate experts.
Accordingly, to the maximum extent permitted by law, AEMO and its officers, employees and
consultants involved in the preparation of this document:
make no representation or warranty, express or implied, as to the currency, accuracy, reliability
or completeness of the information in this report; and
are not liable (whether by reason of negligence or otherwise) for any statements, opinions,
information or other matters contained in or derived from this publication, or any omissions from it,
or in respect of a person’s use of the information in this report.
Version control
Version Release date Changes
1 16 June 2016
NATIONAL ELECTRICITY FORECASTING REPORT
© AEMO 2017 3
EXECUTIVE SUMMARY
This 2016 National Electricity Forecast Report (NEFR) provides independent electricity consumption forecasts for each National Electricity Market (NEM) region over a 20-year forecast period (2016–17 to 2035–36).
AEMO’s forecasts explore a range of sensitivities that represent the probable pathway for Australia
across weak, neutral (considered the most likely), and strong economic and consumer outlooks.1
For the first time, the 2016 NEFR reviews trends in and forecasts of overall electricity usage by
electricity consumers, as well as operational consumption and maximum and minimum demand from
the grid.
In summary:
Consumption of grid-supplied electricity is forecast to remain flat for the next 20 years,
despite projected 30% growth in population and average growth in the Australian
economy, increasing from an estimated 183,258 gigawatt hours (GWh) 2015–16 to 184,467
GWh in 2035–36.
Australian households are using more electric appliances than ever, and this is forecast to
continue. However, these appliances are becoming more energy efficient.
Increasing energy efficiency of household appliances is forecast to offset increasing use of
electric appliances, flattening the resultant consumption of electricity from the grid.
The outlook for grid-supplied electricity is further flattened by forecast strong growth in
rooftop photovoltaic (PV) electricity, which is projected to increase by 350% from current
levels by 2035–36. This forecast increase is equivalent to 11% of current operational
consumption.
Implications for the power system:
Although the use of air-conditioning is forecast to increase, a combination of energy
efficiency and rooftop PV is changing patterns of demand. Summer maximum demand for
electricity is forecast to occur later in the day and not grow over the next 20 years. Winter
maximum demand is forecast to grow faster and become comparable to summer maximum
demand2 from around 2030.
Minimum demand for electricity is forecast to remain flat for five years, with the potential for
a rapid reduction in the remaining forecast period driven by projected increases in rooftop
PV. While the minimum for most regions currently occurs during the overnight period, by
the mid-2020s this is forecast to start a shift to midday when the sun is strongest and
overhead, with continued growth in rooftop PV forecast to drive reductions in demand from
the grid in the middle of the day. This is already the case for South Australia.
Complex industry transformation and impact on consumption from the grid
Households are using more electric appliances3
Household electric appliance use, and the capacity and functionality (or “benefits”) of these
appliances, has increased since 2009. This trend is expected to continue in the next 20 years.
1 The three sensitivities all assume Australia achieves its commitment at the 21st Conference of the Parties for the United Nations Framework Convention on Climate Change (to reduce greenhouse gas emissions by between 26% and 28% below 2005 levels by 2030), and state governments continue to target increasing levels of renewable generation, although instruments to achieve these targets are yet to be determined. 2 Tasmania has historically been winter peaking, while mainland states have been summer peaking, driven by air-conditioning. 3 This work is based on electricity usage data for individual appliance categories from the Australian Government Department of Industry, Innovation
and Science, published in the 2015 Residential Baseline Study for Australia 2000 – 2030, see: www.energyrating.com.au.

NATIONAL ELECTRICITY FORECASTING REPORT
© AEMO 2017 4
Households now use more light bulbs, and have larger televisions, more web-connected devices,
larger capacity whitegoods, and more heating and cooling capability. To track the changing use of
technology in the household, AEMO developed a benefits index as a measure of the energy
services that electric appliances provide. This index reflects the utility that electricity users get from
using appliances, based on the number of appliances, the hours of use, and their capacity (for
example, light output, volume of refrigeration/freezer capacity, and television screen size):
From 2009 to now, the benefits indices for appliance usage have risen by 17%, led by
televisions (up 61%), network (web) access services (up 50%), air-conditioning (up 30%), and
refrigeration/freezers (up 21%). This rise is attributed to a combination of more frequent use,
increased appliance functionality, and population growth.
By 2035–36, these benefits indices are forecast to increase by another 35%, driven largely by
projected increases from cooling services (up 81% in total since 2009), televisions (up 126%)
and heating (up 59%).
Consumption of electricity from the grid is expected to remain flat
Despite increasing reliance on electricity, operational consumption4, or the amount of electricity
consumed from the grid, has declined across the NEM since 2009 as rooftop PV, energy efficiency, and
a range of other factors have offset increased electrical appliance use.
Figure 1 shows how operational consumption declined from 2009–10 to 2013–14, but has started to
increase with the commencement of Queensland’s liquefied natural gas (LNG) export industry.5
Aggregate NEM operational consumption fell from 195,000 GWh in 2009–10 to 180,000 GWh in 2014–
15, a decline of almost 8%.
Figure 1 Operational consumption 2008–09 to 2035–36
4 Operational consumption refers to the electricity used by residential, commercial, and large industrial consumers, drawn from the grid and supplied
by scheduled, semi-scheduled, and significant non-scheduled generating units (excluding rooftop PV generation and small non-scheduled generation). More detailed definitions are available at: http://www.aemo.com.au/Electricity/Planning/~/media/Files/Other/planning%202016/Operational%20Consumption%20definition%20%202016%2
0update.ashx 5 2015–16 demand is estimated on a weather-normalised basis, assuming long-run median weather outcomes.
NATIONAL ELECTRICITY FORECASTING REPORT
© AEMO 2017 5
Over the 20-year forecast period, improvement in the energy efficiency of appliances is forecast to
reduce growth in annual consumption by 0.7% per annum, and increasing electricity generation from
rooftop PV is forecast to reduce growth by another 0.5% per annum. Together these are forecast to
mostly offset forecast growth in consumption from increased population and new electricity
consumption from Queensland’s LNG plants:
Energy efficiency savings between now and 2035–36 are forecast to total 27,082 GWh.
After adjustment for the lower generation capacity of older panels, the effective capacity of rooftop
PV is expected to increase from 4.3 gigawatts (GW) now to 19 GW in 2035–36, contributing
25,400 GWh of generation that offsets operational consumption (13.8%) in this final year. Over this
period, panel efficiency is forecast to reduce by 5.2% (1 GW) as average panel age increases to
13 years. Projections assume more west-facing PV panels, market saturation by the 2030s, and
battery storage becoming economic to the mass market in the 2020s.
As a result, operational consumption from the grid is forecast to remain flat, rising only slightly to
184,467 GWh by 2035–36.
New technologies are forecast to reduce energy use
Mobile and web-connected device use is growing, while use of PCs and stationary home entertainment
devices is forecast to decline. These mobile devices use batteries and relatively less electricity.
Dependent on pricing incentives, battery storage technology may further offset increases in electricity
consumption, by enabling households to use lower cost energy from the sun during the time of evening
peak use. This will have a greater effect on system peak demand than annual electricity consumption,
by flattening the peak and changing its time each day. AEMO forecasts a low uptake of battery storage
until the early 2020s, when the technology is expected to become economic for the average consumer.
The Australian economy is also restructuring away from energy-intensive manufacturing
The main growth sectors for electricity use are forecast to be the services/commercial sector and food
and beverage manufacturing, which are expected to grow with population and income. Queensland’s
LNG export industry is also forecast to add 8.3% to Queensland’s current electricity consumption.
Energy-intensive manufacturing is expected to continue its relative decline, although it is more resilient
today than in the past. Growth drivers for Australian energy-intensive manufacturing are currently
projected to be minimal. As a result, AEMO’s forecasts remain flat for the neutral and strong economic
sensitivities, and fall in the weak economic sensitivity reflecting assumptions of business closures under
economic shocks. As an example, the projected closure of the Australian automotive manufacturing
sector is expected to reduce electricity use by 524 GWh (0.3%) by 2018–19.
Maximum and minimum demand6
The summer maximum demand for each region, shown in Table 1, is forecast to decrease across the
forecast period, despite expected increased use and capacity of cooling appliances. Winter maximum
demand is expected to grow moderately and come closer to the summer maximum demand values in
all regions except for Tasmania, where the system is already winter-peaking.
Minimum demand trends, shown in Table 2, depend strongly on the NEM region. Overall, they are
forecast to remain relatively flat for the first half of the forecast period, and then to reduce rapidly after
the minimum demand time shifts from overnight to midday when the sun is strongest.
The key drivers for these forecast changes in maximum and minimum demand are:
Continuing improvements in energy efficiency and uptake of rooftop PV, offsetting demand growth
in grid-supplied electricity from the increasing use of electric devices.
6 Maximum (minimum) demand is the highest (lowest) electricity supplied by the transmission grid at a specific time.

NATIONAL ELECTRICITY FORECASTING REPORT
© AEMO 2017 6
Rooftop PV reducing demand around midday and moving maximum demand to later in the day
when sunshine is less intense.
Increasing electrification of heating services, where electric appliances displace gas-fuelled
appliances used for heating purposes.
Minimum demand for electricity is forecast to remain flat for five years, with the potential for a rapid
reduction in the last half of the forecast period driven by forecast increases in rooftop PV. Minimum
demand for most regions currently occurs during the overnight period. By the mid-2020s, when the
effective installed capacity (after allowing for the lower efficiency of aged panels) of rooftop PV across
the NEM is forecast to reach 11 GW, minimum demands are forecast to start a shift to midday when the
sun is strongest and overhead. After that, continued growth in rooftop PV is forecast to drive reductions
in the minimum demand from the grid. This is already the case for South Australia.
The effective installed capacity of rooftop PV is forecast to increase to 19 GW by 2035–36, and to
reduce grid demand around noon to levels that may create challenges for the operation of large thermal
generators, even when these generators can be accommodated by the 2030 emissions target.
While the expected uptake of battery storage technology is forecast to provide 6.6 GWh of storage capacity by 2035–36, this is not expected to make a major impact on demand patterns at a regional level. AEMO’s analysis predicts only a mild impact on demand patterns at a regional level, based on assumed patterns of battery usage. Our modelling assumes batteries will discharge at moderate power over a number of hours in the evening.
Table 1 Maximum demand for summer and winter7 (10% POE8) (GW)
2016–17 2021–22 2026–27 2035–36
State Summer Winter Summer Winter Summer Winter Summer Winter
New South Wales 14.2 12.3 14.1 12.5 14.0 12.8 14.1 13.2
Queensland 9.6 8.5 10.0 9.2 10.3 9.7 10.6 10.5
Queensland (excl. LNG)
8.8 7.9 9.0 8.2 9.2 8.7 9.5 9.6
South Australia 3.1 2.5 2.8 2.5 2.6 2.5 2.6 2.5
Tasmania 1.5 1.8 1.5 1.8 1.5 1.8 1.5 1.9
Victoria 9.9 7.9 9.7 8.2 9.5 8.4 9.4 8.7
Table 2 Minimum demand9 (90% POE) (GW)
State 2016–17 2021–22 2026–27 2035–36
New South Wales 4.9 5.0 4.3 2.9
Queensland 4.3 4.1 3.4 1.8
Queensland (excl. LNG)
3.7 3.2 2.4 0.8
South Australia 0.6 0.3 0.0 -0.4
Tasmania 0.8 0.8 0.7 0.6
Victoria 3.1 2.5 1.8 0.5
7 Winter maximum demand is defined per calendar year. References to financial years in tables, such as 2016–17, should be read as the 2017
calendar year for winter maximum demand purposes. 8 Probability of Exceedance (POE) refers to the likelihood that a maximum demand forecast will be met or exceeded. A 10% POE maximum
demand projection is expected to be exceeded, on average, one year in 10, while 50% and 90% POE projections are expected to be exceeded,
on average, five years in 10 and nine years in 10 respectively. 9 Minimum demand is projected to continue occurring during summer, except in Queensland, where it is expected to take place in autumn.
NATIONAL ELECTRICITY FORECASTING REPORT
© AEMO 2017 7
Comparison with 2015 NEFR forecasts
As Figure 1 shows, the updated forecast of annual operational consumption in the 2016 NEFR is lower
than that forecast in the 2015 NEFR.
This is mainly due to a major change in forecast assumptions relating to Australia’s climate change
abatement policy. Australia has set a target to reduce carbon emissions by 26 – 28 per cent below
2005 levels by 2030, which builds on the 2020 target of reducing emissions by five per cent below 2000
levels. AEMO has, based on advice from the Energy Council of the Council of Australian Governments,
assumed a 28% reduction by 2030 in emissions by the electricity industry from 2005 levels in its
ongoing forecasting and planning processes.
For the 2016 NEFR, AEMO has assumed that a combination of energy efficiency trends10, electricity
pricing trends, and coal-fired generator retirements will support the achievement of the 2030 target.
While it is not yet known if abatement costs will affect prices, AEMO has assumed a partial impact in
the forecasts of the 2016 NEFR, with assumed retail prices increasing by approximately 2.5% per
annum11 for the 10 years from 2020 to support the achievement of the 2030 climate target. This
assumed increase in electricity prices is expected to further reduce operational consumption by 2.8%.
Since the 2015 NEFR, a number of other methodology improvements have also affected the forecasts:
Electricity use by Queensland’s LNG export industry has been revised down to reflect operational
data now available as the facilities have moved into production.
The impact on electricity of the closure of the Australian automotive industry has been estimated
and is included in the forecasts.
Representatives from most of Australia’s largest industrial loads have been surveyed and
interviewed, with forecasts adjusted based on advice of likely changes in consumption patterns.
Use of ‘bottom-up’ econometric models, based on meter data complemented by new data sources,
has enabled AEMO to better separate and project the range of complex industry dynamics that are
important to patterns of electricity consumption.
New and emerging technologies outlined in AEMO's 2015 Emerging Technologies Information
Paper12 with potential for material consequence to forecasts (battery storage) have been included
in the forecasts for the 2016 NEFR.
Uncertainties/sensitivities
Assumptions used in AEMO’s forecasts are subject to a range of important uncertainties:
Rapid uptake of rooftop PV and energy efficient appliances is projected to flatten prices in the
wholesale energy markets, possibly leading to changing consumer incentives if these are passed
through to households and business. Particularly from 2025, periods of low demand may introduce
different incentive effects which are not yet modelled in the forecasts. These incentive effects could
slow rooftop PV uptake relative to the assumed forecasts, which would alter projections of
minimum demand.
Given that battery storage technology is new, there is little information available to AEMO to
indicate the future charging and discharging logic affecting storage use. For this NEFR, AEMO has
assumed the period of discharge occurs over a number of hours in the evening. This results in a
small offset to maximum demand. This assumes some diversity in patterns of use, which when
aggregated to a regional level, may result in a wider spread of discharge. An alternative
assumption that discharge is load-following could result in a much larger offset during the time of
10 This includes the expected impacts of the National Energy Productivity Plan (NEPP) targeting a 40% improvement in energy productivity between
2016 and 2030. 11 Before inflation. 12 AEMO. Emerging Technologies Information Paper; June 2015. Available at: http://www.aemo.com.au/Electricity/Planning/Forecasting/National-
Electricity-Forecasting-Report/NEFR-Supplementary-Information.

NATIONAL ELECTRICITY FORECASTING REPORT
© AEMO 2017 8
the peak. AEMO will continue to monitor the development of this technology and will update
forecasts when improved information becomes available.
AEMO assumes no growth drivers for Australia’s energy-intensive manufacturing sector. AEMO’s
modelling of the manufacturing sector (excluding food/beverage) therefore assumes a relatively flat
outlook across the forecast period.
Global LNG market uncertainties are not assumed to trigger the renegotiation of buyer contracts of
Queensland's LNG output.
Climate change advice from the CSIRO suggests AEMO’s climate assumptions are sound for a
median projection of weather. This advice, however, also suggests weather variability may
increase and climate warming may exceed AEMO’s weather projections by the end of the 20-year
forecast period. The maximum and minimum demand models assume historic weather variability
patterns that will need further and continued review during 2016–17.
NATIONAL ELECTRICITY FORECASTING REPORT
© AEMO 2017 9
CONTENTS
IMPORTANT NOTICE 2
EXECUTIVE SUMMARY 3
CHAPTER 1. INTRODUCTION 11
1.1 Key definitions 11
1.2 Scenarios/sensitivities 12
1.3 Structure of report and supporting resources 13
1.4 Changes since the 2015 NEFR 14
CHAPTER 2. ANNUAL CONSUMPTION FORECASTS 17
2.1 NEM overview 17
2.2 Regional forecasts 23
CHAPTER 3. MAXIMUM DEMAND FORECASTS 24
3.1 NEM overview 24
3.2 Regional forecasts 25
CHAPTER 4. MINIMUM DEMAND FORECASTS 26
4.1 NEM overview 26
4.2 Regional forecasts 27
CHAPTER 5. DISCUSSION OF KEY TRENDS AND DRIVERS 28
5.1 Rooftop PV and battery storage 28
5.2 Energy efficiency 34
5.3 Other trends and drivers for the residential sector 36
5.4 Other trends and drivers for the business sector 45
5.5 Small non-scheduled generation forecast 50
APPENDIX A. SENSITIVITIES SUMMARY 52
GLOSSARY 54
TABLES
Table 1 Maximum demand for summer and winter (10% POE) (GW) 6
Table 2 Minimum demand (90% POE) (GW) 6
Table 3 2016 NEFR sensitivities 13
Table 4 2016 NEFR suite of resources 14
Table 5 Total (all regions and sectors) consumption over the short, medium, and long term 17
Table 6 Residential consumption over the short, medium, and long term 19
Table 7 Business consumption over the short, medium, and long term 20
Table 8 Maximum demand for summer and winter (10% POE) (GW) 24
Table 9 Minimum demand (90% POE) (GW) 26
Table 10 Effective capacity (after allowing for reduced efficiency of aged panels) – rooftop PV (MW) 29
Table 11 Installed capacity – Integrated PV and Storage Systems (MW) 29
Table 12 Rooftop PV Generation (GWh) 31
NATIONAL ELECTRICITY FORECASTING REPORT
© AEMO 2017 10
Table 13 Total growth in number of connections over five-year periods by NEM region 37
Table 14 Penetration of reverse-cycle air-conditioners/heat pumps in households 40
Table 15 Forecast impact of gas to electric appliance switching on residential demand for electricity
– NEM and regions (GWh) 41
Table 16 Change in residential electricity prices by region (average annual % change, real) 41
FIGURES
Figure 1 Operational consumption 2008–09 to 2035–36 4
Figure 2 Operational consumption 2008–09 to 2035–36, all NEM regions 18
Figure 3 Residential operational consumption 2016–36, all NEM regions 19
Figure 4 Business operational consumption 2016–36, all NEM regions 21
Figure 5 Comparison between 2015 NEFR scenarios and 2016 NEFR sensitivities 22
Figure 6 Total installed battery storage capacity in the NEM 32
Figure 7 Typical January charge/discharge profile, New South Wales 33
Figure 8 2016 NEFR energy efficiency savings forecast, compared with 2015 and 2014 forecasts 35
Figure 9 Change in demand for energy services in the NEM for different appliances 39
Figure 10 Residential retail prices: historical and forecast (Real, Dec 2015) 42
Figure 11 Annual cooling degree days for Sydney: 1860–2015 44
Figure 12 Total annual grid electricity usage (financial year) 46
Figure 13 Electricity prices – small business: historical and forecast (Real, Dec 2015) 49
Figure 14 Electricity prices – large business: historical and forecast (Real, Dec 2015) 50

NATIONAL ELECTRICITY FORECASTING REPORT
© AEMO 2017 11
CHAPTER 1. INTRODUCTION
The National Electricity Forecasting Report (NEFR) provides independent electricity consumption
forecasts over a 20-year forecast period for the National Electricity Market (NEM), and for each
NEM region.
The NEM spans Australia’s eastern and south-eastern coasts, and comprises five interconnected states
that also act as price regions: New South Wales (including the Australian Capital Territory),
Queensland, South Australia, Tasmania, and Victoria. The NEM’s 40,000 km transmission network
carries power from electricity generators to large industrial energy users and local electricity distributors
across the five states.
1.1 Key definitions
AEMO forecasts are reported as:
Annual operational consumption13:
Includes electricity used by residential and business (commercial and industrial) consumers,
and distribution and transmission losses.
Includes electricity drawn from the electricity grid, supplied by scheduled, semi-scheduled and
significant non-scheduled generating units , but not generation from rooftop PV and other small
non-scheduled generation (SNSG).14
Is measured in gigawatt hours (GWh).
Is presented on a “sent-out”15 basis (that is, the electricity supplied to the market, excluding
generator auxiliary loads from the total output of generators).
Operational maximum (minimum) demand: the highest (lowest) level of electricity drawn
from the transmission grid at any one time in a year. It is measured on a daily basis, averaged over
a 30 minute period. Maximum and minimum demand is measured in megawatts (MW), and the
forecasts are also presented this year on a “sent-out” basis.16
In the 2016 NEFR, consumption and demand forecasts are based on this sector breakdown:
Residential: residential customers only.17
Business: includes industrial and commercial users. Recognising different drivers affecting
forecasts, the business sector is further split into:
Liquefied Natural Gas (LNG) – associated with the production of LNG for export.
Coal mining – customers mainly engaged in open-cut or underground mining of black or
brown coal.
Manufacturing – traditional manufacturing business sectors, with energy-intensive operations
and electricity consumption growth that is projected to be flat due to ongoing economic
restructuring (see Section 5.4.2 for more details). This excludes food and beverage
manufacturing, which is growing, and projected to continue growing, with population.
Other business – business customers not covered by the categories above, which broadly are
projected to grow with population in the forecast period. This group is dominated by services
businesses, such as education, health care, telecommunications, and finance services, and
13 More detailed definitions are available at:
http://www.aemo.com.au/Electricity/Planning/~/media/Files/Other/planning%202016/Operational%20Consumption%20definition%20%202016%20update.ashx.
14 Rooftop PV and SNSG generally covers generators smaller than 30 MW. 15 Measured at the connection point between the generating system and the network. 16 In previous NEFRs, maximum demand was presented on as “as generated” basis. Forecast components to calculate forecasts “as generated”
will be available on AEMO’s online dynamic interface: http://forecasting.aemo.com.au. 17 In previous NEFRs, residential demand was combined with commercial and light industrial demand as “residential and commercial” demand.

NATIONAL ELECTRICITY FORECASTING REPORT
© AEMO 2017 12
also includes transport and construction services. Food and beverage manufacturing is a
projected growth sector that is included in this group.
Other key definitions used in the 2016 NEFR are:
Probability of Exceedance (POE): the likelihood a maximum or minimum demand forecast will be
met or exceeded.
The 2016 NEFR provides 10% POE maximum demand forecasts, which are expected to be
exceeded, on average, one year in 10.
Minimum demand forecasts are based on a 90% POE, which are expected to be met or
exceeded, on average, nine years in 10 (meaning the actual demand is expected to be below
the forecast minimum only, on average, one year in 10).
Rooftop PV: a system comprising one or more photovoltaic panels, installed on a residential or
commercial building rooftop to convert sunlight into electricity for use by that customer. PV
systems larger than 100 kW but smaller than 30 MW are included in the small non-scheduled
generation (SNSG) forecast. The 2016 NEFR does not consider utility-scale solar (larger than
30 MW), which generates to the grid.
Benefits Index: To track changing household use of technology, AEMO developed a benefits
index as a measure of the energy services that electric appliances provide. This index reflects the
utility that electricity users get from using appliances, based on the number of appliances, the
hours of use, and their capacity (for example, light output, volume of refrigeration/freezer capacity,
television screen size). This work is based on electricity usage data at individual appliance
categories from the Australian Government Department of Industry, Innovation and Science,
published in 2015 in the Residential Baseline Study for Australia 2000 – 2030.18
1.2 Scenarios/sensitivities AEMO has updated its scenarios framework for forecasting and planning publications. Following this
update, all AEMO’s major reports19 are exploring a range of sensitivities that represent likely pathways
for Australia across weak, neutral, and strong economic and consumer outlooks (assumptions are
detailed below).
The terms “weak”, “neutral”, and “strong” are used throughout the 2016 NEFR documents to identify the
three sensitivities.
The neutral sensitivity is considered the most likely and is the main focus of this report.
The weak and strong sensitivities are based on dynamics affecting the total energy consumption of
households and businesses.
These sensitivities should not be assumed to be a low and high outcome for the consumption of
grid-supplied energy. Indeed, a strong economy is assumed to have higher uptake of rooftop PV and
higher energy efficiency outcomes, both of which offset consumption of energy from the grid.
The key characteristics of these sensitivities are shown in Table 3. Appendix A has more detail on
assumptions across all sensitivities.
Each sensitivity has the same emission reduction policy assumptions (see Section 1.4.2).
18 Available at: http://www.energyrating.gov.au/document/report-residential-baseline-study-australia-2000-2030. 19 National Electricity Forecasting Report, National Gas Forecasting Report, NEM Electricity Statement of Opportunities, Gas Statement of
Opportunities, and National Transmission Network Development Plan.

NATIONAL ELECTRICITY FORECASTING REPORT
© AEMO 2017 13
Table 3 2016 NEFR sensitivities
Driver Weak sensitivity Neutral sensitivity Strong sensitivity
Population growth ABS projection20 C ABS projection B ABS projection A
Economic growth Weak Neutral Strong
Consumer Low confidence, less engaged
Average confidence and engagement
High confidence and more engaged
Electricity network charges- 5 years
Current AER determinations, fixed after 5 years
Electricity retail costs and margin
Assume current margins throughout
Technology uptake Hesitant consumer in a weak economy
Neutral consumer in a neutral economy
Confident consumer in a strong economy
Energy efficiency uptake Low Medium High
The forecasts of the 2016 NEFR will provide a probable “base case” for electricity consumption and
demand over the next 20 years.
These will also be used as a reference in further AEMO “Insight” publications that will explore key
forecast uncertainties, or other changes that may be relevant to the forecasts across the 20-year
forecast period. The first of these “Insight” publications will include an electric vehicle impact analysis,
scheduled for publication later in 2016.
Comparison to 2015 NEFR scenarios
While the neutral sensitivity of this NEFR is generally comparable with the medium scenario from the
2015 NEFR, the new weak and strong sensitivities are not directly comparable.
Unlike the 2015 NEFR, when the scenarios had varying assumptions regarding policy and technology
uncertainties, in this NEFR the sensitivities incorporate a common climate change policy assumption,
and represent economic, population, and consumer engagement sensitivities around a highly probable
baseline for Australia.
1.3 Structure of report and supporting resources
The 2016 NEFR (this report) provides:
Highlights of forecasts for consumption (total and operational) and maximum and minimum
demand over the next 20 years.
Insights into key trends and drivers.
A comparison with forecasts published in 2015, and with actual consumption and demand since
2009 (a historical baseline chosen because that is when operational consumption in the NEM
began to decline).
A summary of key changes to modelling and reporting approaches in the 2016 NEFR.
This report is supported by a range of resources, summarised in Table 4.
20 Australian Bureau of Statistics, 2013, Population Projections, Australia 2012 (base), cat. no. 3222.0.

NATIONAL ELECTRICITY FORECASTING REPORT
© AEMO 2017 14
Table 4 2016 NEFR suite of resources
Resource Description/link
2016 National Electricity Forecasting Report
This report. http://www.aemo.com.au/Electricity/Planning/Forecasting
Online dynamic interface Users can view graphs and key results, apply their own filters and download 2016 NEFR input and output data.
http://forecasting.aemo.com.au/
2016 NEFR Forecasting Methodology Information Paper
Details of methodology, assumptions, and changes in approach for the 2016 NEFR.
To be published later in 2016 on AEMO’s website.
Supplementary reports Consultants’ reports and additional information.
http://www.aemo.com.au/Electricity/Planning/Forecasting
2016 NEFR Insights Report –Impact of electric vehicles
To be published later in 2016 on AEMO’s website and online dynamic interface.
1.4 Changes since the 2015 NEFR
1.4.1 New forecasting methods
This NEFR continues a major shift in AEMO’s forecasting methods that commenced with the 2015
National Gas Forecasting Report (NGFR). AEMO is delivering more detailed “bottom-up” models that
embrace a mix of economic and technical methods to better capture the continuing transformation of
the energy supply and demand system.
This transformation, since the mid-late 2000s, has been driven by changes in technology that:
Sit between the consumer and the grid, such as rooftop PV, energy-efficient appliances, and
technologies that enable greater control of appliance operation and energy usage.
Have become increasingly affordable to typical residential and business consumers.
Are increasingly being adopted, in part as a possible solution to energy bill inflation.
Business consumption has also been impacted by changes in the Australian economy, with the global
financial crisis, mining boom, and subsequent commodity price collapse all contributing to a continued
transition away from energy-intensive industry.
While much of the change has been occurring beyond the bulk transmission grid, it has major
implications for the grid’s operation and development, and therefore for AEMO’s forecasting and
planning reports.
Bulk transmission data has traditionally been used as the primary source of data for forecasting.
However, this data:
Is highly aggregated (so does not provide fine detail).
Is historic (so may not be indicative of a changing future).
Does not reveal dynamics that originate beyond the grid.
This approach has made it harder, in the changing energy environment, to quickly detect and
understand key trends.
In response, AEMO is now integrating new data streams from beyond the grid, such as:
Consumer energy meter data.
Complementary data from other agencies and sources, like national account data from the
Australian Bureau of Statistics, to support greater understanding of structural change in
the economy.
By integrating detailed data from beyond the grid, AEMO can shift to finely segmented “bottom-up”
forecasting approaches that embrace forward-looking economic and structural methods, and rely less
on historic data that may not be indicative of Australia’s next generation economy and consumer.

NATIONAL ELECTRICITY FORECASTING REPORT
© AEMO 2017 15
1.4.2 Policy assumptions
Australia has set a target to reduce carbon emissions by 26–28% below 2005 levels by 2030, which
builds on the 2020 target of reducing emissions by 5% below 2000 levels.
The Energy Council of the Council of Australian Governments (COAG) has agreed that the contribution
of the electricity sector should be consistent with national emission reduction targets, and has advised
that a 28% reduction from 2005 levels by 2030 is an appropriate assumption for AEMO to use in
forecasting and planning. For the 2016 NEFR, AEMO has assumed the achievement of this target
will be supported by energy efficiency trends21, electricity pricing trends, and coal-fired
generator retirements.
While it is not yet known if abatement costs will affect prices, AEMO’s modelling has assumed a partial
impact in the 2016 NEFR forecasts, with retail prices assumed to increase by approximately 2.5% per
annum22 for the 10 years from 2020.
1.4.3 Technology assumptions
The 2016 NEFR now includes forecasts for the uptake and use of battery storage technologies,
assuming this is implemented with an energy management system that manages charging and
discharging operations.
Rooftop PV projections now include forecasts of panel age, and 2016 NEFR forecasts consider
derated generation efficiency as a result of panel age.
Electric vehicle uptake forecasts are not included in the 2016 NEFR. AEMO will, however, use the
published forecasts as the baseline for an electric vehicles impact assessment in an “Insight”
publication later in 2016.
1.4.4 Survey and interviews from the largest energy users
AEMO continues to survey and interview the largest industrial energy users to inform its energy and
demand forecasts. In previous years, the energy and demand forecast surveys were used directly in
the forecasts. In the 2016 NEFR, the survey has been used instead to inform near-term and highly
probable adjustments to the separately-determined business sector forecasts.
Forecast adjustments are now probability-weighted, based on:
Discussions with the relevant energy users.
An assessment of economic conditions relevant to the industry sectors, users, and the forecast
sensitivities (weak/neutral/strong).
1.4.5 Consumer behaviour
AEMO has implemented the following improvements to its modelling of consumer behaviour:
Energy efficiency savings: AEMO has refined energy efficiency projections and their
representation in the forecast models. In the 2015 NEFR, a small post-model adjustment was
included for energy efficiency, to add to an amount that was assumed to be captured in the historic
data inputs to a regression-based model of consumer demand. The 2016 NEFR uses new,
forward-looking economic forecasting models to model the full amount of projected energy
efficiency savings. Projected savings have been separately forecast at an appliance level, and
have been tuned to ensure consistency with consumer trends, as measured in recent meter data.
21 This includes the expected impacts of the National Energy Productivity Plan (NEPP) targeting a 40% improvement in energy productivity between
2016 and 2030. 22 Before inflation.
NATIONAL ELECTRICITY FORECASTING REPORT
© AEMO 2017 16
The projections now include a 20% rebound effect23, based on observed meter data trends.
Rebound refers to an increase in consumption that is enabled by the lower operating cost of
energy-efficient appliances.
Price elasticity of demand: Price elasticity of demand adjustments are now only applied for
permanent increases in price, measured through the bill of a typical consumer. Estimates have
been revised down to avoid overlap with energy efficiency, recognising that energy efficiency
represents a structural response to price that is occurring with shorter time-lags. Temporary price
changes, such as price reductions due to lower network charges, are no longer assumed to trigger
a permanent consumption response.
Consumption response from rooftop PV and battery storage: The 2016 NEFR now includes
an assumed increase in consumption resulting from the impact of lower-cost energy, made
available from rooftop PV and battery storage. Energy consumption is assumed to increase by
10% of the energy generated by rooftop PV. Similarly, energy consumed from batteries is
assumed to increase by 10% for energy charged from sunshine, and by 5% for energy charged
from the grid during off-peak periods.
West-facing rooftop PV panels: The projected uptake of capacity is now assumed to shift
towards increasing westerly panel orientation, in response to projected consumer incentives from
peak prices during the evening. The forecast assumes that 10% of new installed capacity by
2035–36 will be west-facing.
1.4.6 Maximum and minimum demand
The 2016 NEFR includes minimum demand forecasts for all NEM regions, after the 2015 NEFR
provided AEMO’s first minimum demand forecasts, for South Australia only.
The maximum and minimum demand forecasts are based on a new simulation work flow. Models of
30-minute demand have been reviewed, removing load closures from the historical dataset. The models
were used in a weather simulation procedure able to produce a statistical distribution of half-hourly
demand. Half-hourly demand was then forecast using integrated growth models for the individual
components and drivers of demand.
1.4.7 LNG
Since 2015, AEMO has revised down electricity use by Queensland’s LNG export industry, to reflect
operational data now available as the facilities have moved into production.
23 For the neutral sensitivity. The strong and weak sensitivities uses 30% and 10% respectively in most cases.

NATIONAL ELECTRICITY FORECASTING REPORT
© AEMO 2017 17
CHAPTER 2. ANNUAL CONSUMPTION FORECASTS
This chapter reports operational consumption (see Section 1.1 for definitions), unless otherwise stated.
Key points
Overall operational consumption is forecast to remain relatively flat across the NEM to 2035–36.
Small growth is forecast until 2020, due mostly to consumption in Queensland’s LNG plants,
then a reduction is forecast until 2030.
While steady consumption growth from the business sector, high population growth, and
consumers’ continuing embrace of more and better appliances remain as strong growth drivers,
this growth is offset by continuing investment in rooftop PV and energy-efficient appliances.
The forecasts are also flattened by a key assumption that Australia achieves its 2030 emissions
reduction target. This is assumed to entail strong improvements in energy efficiency, and also
energy price effects from the closure of coal-fired generators and other policy measures.
2.1 NEM overview
2.1.1 Total annual consumption
Table 5 summarises forecasts and growth trends and key drivers for the 20-year forecast period.
Table 5 Total (all regions and sectors) consumption over the short, medium, and long term
Timeframe Forecast (GWh) Average annual rate of change
Drivers
Short term (2016−21)
183,258 to 187,544
0.46% increase Projected increase in consumption, as:
Continuing ramp-up of LNG exports from Queensland drives growth.
Business growth is partially offset by declining residential consumption. While residential consumption is supported by strong growth in new meter connections, this is more than offset by high uptake of rooftop PV and continuing improvements in the energy efficiency of appliances.
Medium term (2021−26)
187,544 to 187,129
0.04% decrease Flat forecast in overall electricity consumption in the medium term, as:
LNG exports stabilise. Steady growth in other business sectors.
Residential consumption continues to decline and offsets business growth as rising PV and energy efficiency offset growth from increasing population and expected gas to electric appliance switching.
Long term (2026−36)
187,129 to 184,467
0.14% decrease Flat forecast of electricity consumption, as:
Medium-term residential trends continue.
Reduction in consumption due to the assumption of coal generation closures and projected changes in retail electricity prices.
Continued forecast stabilisation of the manufacturing sector and the effects on business consumption of factors such as energy efficiency and rooftop PV.
Figure 2 shows forecast operational consumption for all sectors and regions from 2016–17 to the end of
the 20-year forecast period, with actual consumption from 2008–09 to the present.
It highlights that actual consumption in the NEM peaked in 2008–09, then declined until 2013–14. This
was due to a mix of factors, including a rapid uptake of rooftop PV, improvements in the energy
efficiency of buildings and appliances, and a number of permanent business closures.

NATIONAL ELECTRICITY FORECASTING REPORT
© AEMO 2017 18
Over the past year, consumption has increased for the first time since 2008–09 due to:
Exceptional weather (cold winter followed by hot summer)
The start of production of LNG exports from Queensland, which uses electricity for
gas compression.
Figure 2 Operational consumption 2008–09 to 2035–36, all NEM regions
Across the 20-year forecast period, electricity consumption by the business sector is forecast to grow
steadily (up 0.4% annually), driven in part by Queensland’s new LNG export industry (forecast growth
equals 3.4% annually). Business consumption excluding the LNG sector is forecast increase
consumption slowly with increasing population and income, as shown in Figure 2.
Growth in business consumption is offset by a reduction in annual consumption by the residential sector
(down 16% to 2035–36), due to:
Ongoing improvements in energy efficiency (up 27,082 GWh from 2015-16, or 14.8% of total
consumption in 2015–16).
Growth in rooftop PV (up 19,794 GWh from 2015-16, or 10.8% of total consumption in 2015–16).
See Section 5.1 for more detail on rooftop PV forecasts.

NATIONAL ELECTRICITY FORECASTING REPORT
© AEMO 2017 19
2.1.2 Residential operational consumption
Table 6 summarises the forecasts and growth trends and key drivers for the 20-year forecast period.
Table 6 Residential consumption over the short, medium, and long term
Timeframe Forecast (GWh)
Average annual rate of change
Drivers
Short term (2016–17 to 2020–21)
51,074 to 49,674
0.6% decrease Forecast consumption growth, driven primarily by new meter growth and gas to electric appliance switching, is offset by energy efficiency savings and PV growth, resulting in overall forecast decrease.
Medium term
(2020–21 to 2025–26)
49,674 to 48,527
0.5% decrease Forecast consumption growth, driven primarily by new meter growth and gas to electric appliance switching, is offset by energy efficiency savings and stronger PV growth, resulting in overall forecast decrease.
Long term
(2025–26 to 2035–36)
48,527 to 42,896
1.2% decrease Forecast consumption growth, driven mainly by new meter growth and (with a predicted slowdown) gas to electric appliance switching, is offset by energy efficiency savings and strong growth in PV, resulting in a larger forecast decrease.
Figure 3 shows forecast annual operational consumption for the residential sector across all NEM
regions. It highlights the extent to which key offsetting drivers, particularly energy efficiency and the
impact of rooftop PV generation, reduce the forecast from the level it would otherwise have been.
Figure 3 Residential operational consumption 2016–36, all NEM regions
Overall, residential consumption is forecast to reduce by 16% in the 20-year forecast period (0.9%
average annual change). While population growth and appliance uptake continue as strong drivers, this
is more than offset by forecasts for continuing investment in rooftop PV and energy efficient appliances.

NATIONAL ELECTRICITY FORECASTING REPORT
© AEMO 2017 20
The key growth drivers (2035–36 consumption relative to 2015–16 consumption) are forecast to be:24
Growth from new meter connections (27% higher) driven by population and dwelling growth.
Gas to electric appliance switching (9% higher) driven by increased penetration of solar electric hot
water and heat pumps and reverse-cycle air-conditioners displacing gas usage for hot water and
area heating in the Southern regions.
Growth from increased appliance uptake and use per meter connection (11% higher), primarily
driven by increased ownership and capability of heating, cooling, white goods, and home
entertainment appliances.
Increased household consumption from rooftop PV and battery storage, due to the assumed
impact of lower cost electricity from rooftop PV and batteries (4% of 2015–16 consumption).
The projected impact of the major factors that are forecast to reduce consumption over this period,
relative to 2015–16, is:
Energy efficiency improvements: estimated savings by 2035–36 are 18,171 GWh, or 35.6% of
2015–16 residential consumption.
Rooftop PV: additional generation by 2035–36 is forecast to be 13,525 GWh, or 27% of 2015–16
residential consumption. See Section 5.1 for more detail on rooftop PV forecasts.
2.1.3 Business operational consumption
Table 7 summarises growth trends and key drivers for the 20-year forecast period.
Table 7 Business consumption over the short, medium, and long term
Timeframe Forecast (GWh) Average annual rate of change
Drivers
Short term (2016−21)
136,595 to 143,040
0.9% increase Significant increase in LNG (13.3% annually) as LNG trains ramp up, otherwise steady growth in business consumption linked with population increase.
Manufacturing is assumed to stabilise as global commodity prices return to neutral levels and a softer exchange rate is maintained. Some reduction in consumption due to the exit of automotive vehicle manufacturing, while the announcement that the Wonthaggi Desalination plant will come online contributes to a forecast increase in consumption in Victoria.
Medium term (2021−26)
143,040 to 144,485
0.2% increase Stabilisation of LNG exports flattens forecast growth of business consumption. Existing LNG trains are expected to continue to operate at plateau production.
Long term (2026−36)
144,485 to 149,257
0.3% increase Continuance of medium-term trends.
Figure 4 shows forecast operational annual consumption for the business sector across all NEM
regions, highlighting how factors such as rooftop PV and energy efficiency are projected to reduce the
forecasts. It also shows how forecasts for business consumption vary across different sectors
(defined in Section 1.1).
24 Based on forecast residential consumption without adjustment for small non-scheduled generation.

NATIONAL ELECTRICITY FORECASTING REPORT
© AEMO 2017 21
Figure 4 Business operational consumption 2016–36, all NEM regions
Overall, business consumption is forecast to increase by 9.3% in the next 20 years (0.4% average
annual growth).
Growth sectors of business and their key drivers
Other business25: Growth is projected mainly in business sectors such as education, health and
telecommunication services (7.0% increase from 2015–16 consumption). This projection is driven
by population growth and household disposable income growth. Some reduction in consumption is
forecast for these sectors as they respond to a projected rising electricity price.
LNG: Growth in LNG is projected to add 3.0% to the 2015–16 business sector consumption as
LNG trains ramp up to full production in Queensland.
Non-growth sectors of business and their key drivers
Manufacturing26: While Gross State Product is projected to drive growth in manufacturing, this
growth is forecast to be almost entirely offset by projected reductions arising from production input
costs. Growth is further projected to be offset by step adjustments for business closure and the exit
of the automotive vehicle manufacturing industry (totalling 524 GWh or 1% of 2015–16
manufacturing sector consumption). As a result, AEMO forecasts an overall flat trend for
consumption by the manufacturing sector (3,259 GWh increase or 0.3% annual increase)
Coal mining: Coal mining is projected to decline by 0.1% of the total business sector consumption
from 2015–16.
25 Other Business – business customers not engaged in manufacturing, coal mining or LNG production. This group is dominated by customers in
services businesses such as education, health care, telecommunications and finance services, and also includes transport and construction services. Food and beverage manufacturing is also included in this group.
26 Manufacturing – traditional manufacturing business sectors, with energy-intensive operations and electricity consumption growth that is projected
to be flat or to decline due to ongoing economic restructuring. This excludes food and beverage manufacturing, which is growing, and projected to continue growing, with population.

NATIONAL ELECTRICITY FORECASTING REPORT
© AEMO 2017 22
Energy efficiency savings and rooftop PV generation in the business sector
An additional 6,269 GWh of generation from rooftop PV is forecast from the business sector to
offset grid supply consumption (5% decrease relative to 2015–16 business sector consumption).
See Section 5.1 for more detail on rooftop PV forecasts.
Savings from energy efficiency are projected to total 8,911 GWh (equal to 6.5% of total business
sector consumption in 2015–16).
2.1.4 Forecast sensitivities and changes compared to the 2015 NEFR
Figure 5 compares the forecasts for weak, neutral, and strong sensitivities in the 2016 NEFR, and
compares these 2016 NEFR forecasts with the low, medium, and high scenario forecasts from
the 2015 NEFR.
Figure 5 Comparison between 2015 NEFR scenarios and 2016 NEFR sensitivities
The key differences between the forecasts are:
The 2016 NEFR forecasts are generally flatter than the 2015 NEFR, with less difference between
the weak and strong forecasts compared to the low and high projections of 2015. This is the result
of the three sensitivities all using a common climate policy assumption, as well as other
assumptions designed to forecast a highly probable baseline for Australia, removing some
uncertainties from the sensitivities.
Overall the 2016 NEFR sensitivities show a smaller difference between strong and neutral than
between neutral and weak. This is due to improvements in the modelling approach, particularly:
Interviews with the largest industrial loads that have projected business conditions to be more
challenging than was assumed in 2015.
New analysis of the energy-intensive manufacturing sector that assumes an increasing
probability of major smelter exits across the forecast period in the weak sensitivity. No major
NATIONAL ELECTRICITY FORECASTING REPORT
© AEMO 2017 23
smelter exits are forecast for the neutral or strong sensitivities. This flattens the strong and
neutral sensitivities relative to the weak.
The commencement of LNG exports from Queensland has provided actual operational data
that has been used to reduce some key forecast assumptions, contributing to a smaller
increase in forecast consumption compared with the 2015 NEFR.
The strong sensitivity assumes a higher uptake of energy efficiency and rooftop PV than the
neutral sensitivity, flattening the forecast demand for grid-supplied energy in that model.
2.2 Regional forecasts
Regional forecasts are available from the dynamic interface on AEMO’s website.27 They are also
downloadable as a PDF chart pack.28
In summary:
Regional operational consumption forecasts generally share the NEM-wide trends and forecast
dynamics that are discussed in this chapter and in Chapter 5.
Two regions contrast from the overall national trend of a flat 20-year consumption forecast.
Queensland: Electricity use by the new LNG facilities is forecast to grow by 3.4% annually over
the 20-year forecast period, as they ramp up to full production. The region’s consumption is
expected to increase annually at a rate of 0.23% over the 20-year forecast period.
South Australia: annual consumption is forecast to decline across the forecast period, driven
by projected high levels of growth in rooftop PV, which continues to be at a rate higher than
typical in other regions. The region’s consumption is expected to decline annually at a rate of
-0.5% over the 20-year forecast period.
27 For the dynamic interface, see: http://forecasting.aemo.com.au. 28 Downloadable charts are available at: http://www.aemo.com.au/Electricity/Planning/Forecasting.

NATIONAL ELECTRICITY FORECASTING REPORT
© AEMO 2017 24
CHAPTER 3. MAXIMUM DEMAND FORECASTS
Maximum demand, also called peak demand, is the highest electricity demand that is expected in any
measured time period. It remains an important measure to inform efficient asset investment in the
energy supply system, in the long-term interest of consumers.
Forecasts of maximum annual demand are strongly driven by weather, and occur on different days in
each region of the NEM. For this reason, a total maximum demand forecast is not estimated for the
NEM – forecasts are shown on a region-by-region level.
Key points
Forecasts for 10% POE maximum demand are generally flat across the NEM regions, except:
Queensland maximum demand is forecast to grow 10% over the 20-year forecast period.
South Australia maximum demand is forecast to decrease 15% over this period.
Winter maximum demand is forecast to grow at a higher rate than summer maximum demand,
and after 2030 is expected to reach levels similar to the summer peak demand.
Growth in rooftop PV is forecast to offset some growth drivers, and also to keep pushing the time
of summer maximum demand to later in the day and the year.
3.1 NEM overview
Table 8 Maximum demand for summer and winter29 (10% POE) (GW)
2016–17 2021–22 2026–27 2035–36
State Summer Winter Summer Winter Summer Winter Summer Winter
New South Wales 14.2 12.3 14.1 12.5 14.0 12.8 14.1 13.2
Queensland 9.6 8.5 10.0 9.2 10.3 9.7 10.6 10.5
Queensland (excl. LNG) 8.8 7.9 9.0 8.2 9.2 8.7 9.5 9.6
South Australia 3.1 2.5 2.8 2.5 2.6 2.5 2.6 2.5
Tasmania 1.5 1.8 1.5 1.8 1.5 1.8 1.5 1.9
Victoria 9.9 7.9 9.7 8.2 9.5 8.4 9.4 8.7
Maximum demand forecasts share many similar dynamics to annual consumption forecasts. The key
differences are:
Overall, maximum demand forecasts across the NEM regions are flat, trending slightly downwards
over the 20-year forecast period (compared to the forecasts of annual consumption, which are flat
but trend slightly upward).
For regions other than Tasmania, maximum demand is determined by air-conditioning loads. While
consumption is projected to increase, forecast energy efficiency savings for air-conditioning are
higher than for many other appliances. This is attributed to their maturity as a household appliance,
which means energy efficiency projections pick up the replacement of older air-conditioning units
by newer technology that can deliver the same cooling power with almost double the efficiency.
29 Winter maximum demand is defined per calendar year. References to financial years in tables, such as 2016–17, should be read as the 2017
calendar year for winter maximum demand purposes.

NATIONAL ELECTRICITY FORECASTING REPORT
© AEMO 2017 25
Continuing growth in rooftop PV is also projected to offset some maximum demand growth. It is
also forecast to push the period of maximum demand to later in the year during summer, when air-
conditioning loads are less significant.
The forecasted use of battery storage systems varies significantly across the regions: in 2036,
battery storage reduces the peak demand by 2% in NSW and QLD and by 5% in VIC and SA.
Tasmanian maximum demand occurs in Winter and in 2036 it is expected that battery storage
systems will have the effect of reducing it by 1%.
Summer maximum demand for electricity is forecast to occur later in the day and not grow
significantly over the next 20 years. Winter maximum demand is forecast to grow faster and
become comparable to summer demand from around 2030. The main driver for this growth is the
ongoing electrification of heating services previously delivered with gas-fuelled appliances.
3.2 Regional forecasts
Regional forecasts of maximum demand are available from the dynamic interface on AEMO’s website.30
They are also downloadable as a PDF chart pack.31
In summary:
Regional forecasts all share the national trends and forecast dynamics that are discussed in this
chapter and Chapter 5.
The two regions that contrast from the national trend of a flat projection are Queensland and
South Australia.
Queensland: LNG operations will continue to grow, and are projected to require increased
electricity for gas compression. LNG production is forecast to add 1 GW to the maximum
demand (10% POE) by the end of the 20-year forecast period. The region’s maximum demand
is expected to increase annually at a rate of 0.7% over the 20-year forecast period.
South Australia: Maximum demand is forecast to decline across the forecast period, caused
by the continuance of high levels of growth in rooftop PV, a rate higher than typical in other
regions. The lower forecast is also due to a more significant projected decline in consumption
from the business sector in South Australia than in other regions. The region’s compounded
average growth rate across the forecast period is -1% per annum.
30 For the dynamic interface, see: http://forecasting.aemo.com.au. 31 Downloadable charts are available at: http://www.aemo.com.au/Electricity/Planning/Forecasting.

NATIONAL ELECTRICITY FORECASTING REPORT
© AEMO 2017 26
CHAPTER 4. MINIMUM DEMAND FORECASTS
Minimum demand refers to the lowest electricity demand that is expected in any measured time period.
Minimum demand is becoming increasingly important for managing the security of the power system.
Challenges presented to secure power system operation by reducing minimum demand include
replacement of thermal generation with intermittent generation32, provision of frequency control
services, and network operation.
Forecasts of annual minimum demand occur on different days in each region of the NEM. For this
reason, a total minimum demand forecast is not estimated for the NEM – forecasts are shown on a
region-by-region level.
This is the first year that AEMO is providing a set of minimum demand forecasts for all regions.
Key points
Minimum demand is generally forecast to remain flat in the short term, but to reduce rapidly after
2022, driven by forecast increases in rooftop PV.
Following the trend already seen in South Australia, minimum demand is forecast to shift in all
other regions from overnight to midday by the mid-2020s.
South Australia is forecast to have negative minimum demand by 2027 (with excess generation
to export), and other regions’ minimum demand is projected to approach levels that encroach on
minimal stable levels of thermal generation.
4.1 NEM overview
Table 9 Minimum demand33 (90% POE) (GW)
State 2016–17 2021–22 2026–27 2035–36
New South Wales 4.9 5.0 4.3 2.9
Queensland 4.3 4.1 3.4 1.8
Queensland (excl. LNG)
3.7 3.2 2.4 0.8
South Australia 0.6 0.3 0.0 -0.4
Tasmania 0.8 0.8 0.7 0.6
Victoria 3.1 2.5 1.8 0.5
Minimum demand in all NEM regions except South Australia currently occurs overnight. By the
mid-2020s, minimum demand in these regions is forecast to follow trends already evident in South
Australia, and:
Start shifting from overnight to midday, the time when the sun is strongest and overhead.
Then reduce in the middle of the day, as continued growth in rooftop PV decreases demand from
the grid.
Once minimum demand shifts to midday, AEMO projects a period of rapid decrease in minimum
demand. The rate of decrease ranges from 2% annually in Tasmania (where the penetration of rooftop
PV is slower) to approximately 10% annually in Victoria.
32 Thermal generators such as coal-fired power stations provide important power system services, like inertial frequency response, to a greater
extent than do intermittent generators. 33 Minimum demand occurs during summer, except for Queensland, where minimum demand is expected to take place in autumn.
NATIONAL ELECTRICITY FORECASTING REPORT
© AEMO 2017 27
The effective capacity of rooftop PV (after allowing for the lower efficiency of aged panels) is projected
to approach 15 GW NEM-wide by 2030, and 19 GW by 2035–36.
4.2 Regional forecasts
Regional forecasts of minimum demand are available from the dynamic interface on AEMO’s website.34
They are also downloadable as a PDF chart pack.35
In summary:
Regional forecasts all share the national trends and forecast dynamics that are discussed in this
chapter and Chapter 5.
Specific regional forecasts are:
Queensland: despite the continuing ramp up of LNG activities, over the first five years
minimum demand is forecast to mildly decline. The increase from LNG stabilises by 2017-18,
and is then offset by the continued uptake of rooftop PV. Minimum demand is then forecast to
continue a pattern of decline to 2035-36, caused by rising uptake of rooftop PV.
South Australia: minimum demand is expected to become negative in 2027. This means that
at the time of minimum demand, South Australia would act as a net exporter of electricity. The
timeline for this event is moved slightly further in the future compared to the NEFR 2015
prediction, mainly due to a downward revision of rooftop PV uptake in South Australia.
Victoria: minimum demand is expected to stay flat for the very short-term. By 2017–18, it is
expected that the time of minimum demand will switch from overnight to around midday, when
the sun is most overhead. Then minimum demand is expected to decrease steadily, driven by
the increasing penetration of rooftop PV. The forecast 90% POE minimum demand in 2035–36
is 0.5 GW, only 16% of the current values.
Tasmania and New South Wales: Similar dynamics drive the evolution of minimum demand in
these regions, where a larger fraction of the demand is insensitive to weather (flat within the
day). This delays the point when rooftop PV is forecast to start driving a decrease of minimum
demand. By 2035–36, minimum demand in New South Wales is forecast to be approximately
60% of current values, and in Tasmania, approximately 75% of present values.
34 For the dynamic interface, see: http://forecasting.aemo.com.au. 35 Downloadable charts are available at: http://www.aemo.com.au/Electricity/Planning/Forecasting.

NATIONAL ELECTRICITY FORECASTING REPORT
© AEMO 2017 28
CHAPTER 5. DISCUSSION OF KEY TRENDS
AND DRIVERS
This chapter discusses the key trends and drivers that influence the forecasts for annual consumption
and maximum and minimum demand, focusing on those that have resulted in changes in 2016 NEFR
forecasts compared to the 2015 NEFR and previous NEFRs.
5.1 Rooftop PV and battery storage
This section addresses trends and drivers related to rooftop PV and battery storage, which have
influenced both residential and business forecasts.
5.1.1 Increase in capacity – rooftop PV and battery storage
Key points
Strong growth is forecast to continue for the uptake of rooftop PV, with 20 GW of installed
capacity forecast by 2035–36. At this time it is assumed 10% of capacity will have
west-facing panels to better align rooftop PV output with peak electricity costs from the grid
Also by 2035–36, 3.8 GW of rooftop PV capacity is expected to have integrated battery
storage, providing 6.6 GWh of energy storage potential.
A steady uptake in battery storage is forecast after 2021 in both the residential and the
commercial sectors. This is expected to be driven by projected retail electricity prices,
decline in battery costs, and transition to a time-of-use tariff structure.
Over the modelled period, some areas of South Australia and Queensland are forecast to be
the first to reach saturation levels for residential rooftop PV, around 2030. Parts of Victoria
are projected to follow three years later, with Tasmania following in 2035–36.
AEMO’s forecast of capacity for rooftop PV and battery storage is based on advice from external
consultancy Jacobs.36 AEMO adapted this advice to assume a westerly shift in rooftop panel
orientation, commencing from zero at the start of 2016–17 and resulting in 10% of Jacob’s capacity
projections having a westerly panel orientation by 2035–36. This reflects AEMO’s assumptions that:
Consumer incentives will continue to evolve over the period.
Grid-supplied electricity will increase in cost, relative to the value of exporting rooftop PV
generation to the grid before the evening peak.
West-facing panels, which better align rooftop PV generation with the period of peak consumption
and assumed higher energy cost, will remain economic for installation and use and add
approximately 10% to generation output during the late afternoon compared to north-facing panels.
Rooftop PV capacity forecast – NEM and regions
The annual uptake of rooftop PV systems in Australia is projected to be relatively stable up until the
time when saturation is reached in some regions.37 This results in a forecast total installed capacity of
20,634 MW in the neutral sensitivity.
The commercial sector is forecast to continue increasing, to a penetration of around 28% of total
systems installed by 2035–36.
36 Jacobs’ consultancy report “Projections of uptake of small-scale systems” is available on AEMO’s website:
http://www.aemo.com.au/Electricity/Planning/Forecasting.
NATIONAL ELECTRICITY FORECASTING REPORT
© AEMO 2017 29
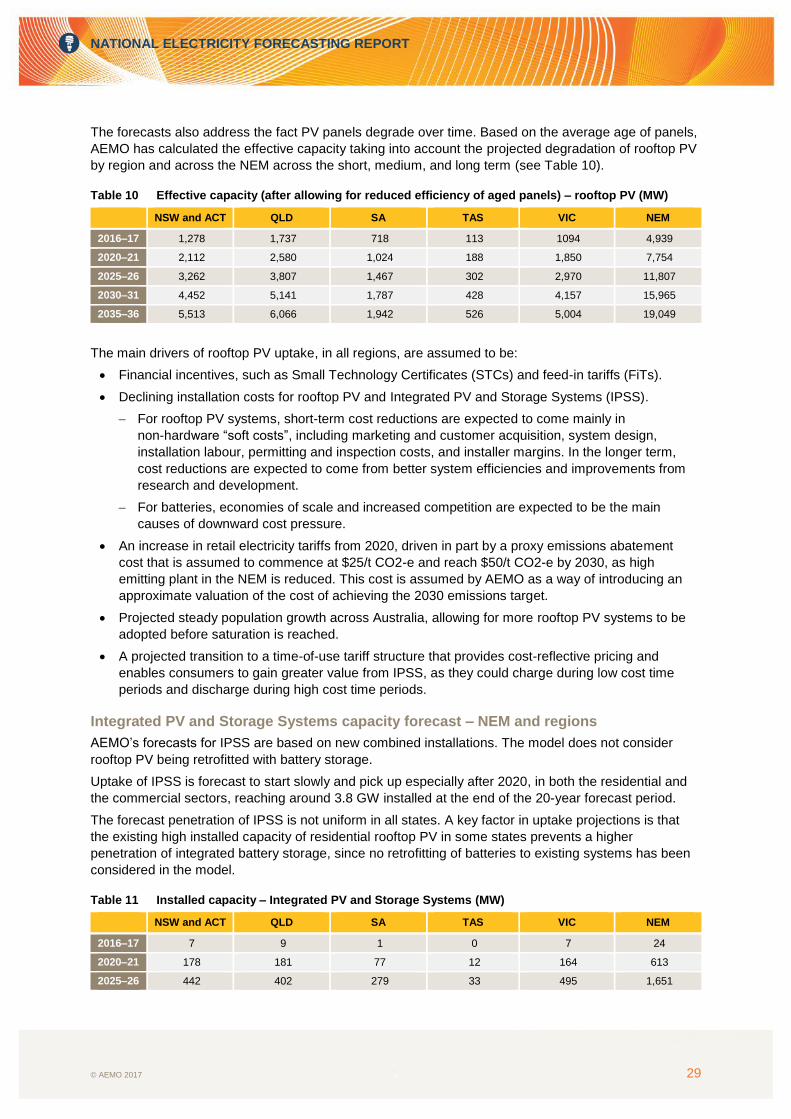
The forecasts also address the fact PV panels degrade over time. Based on the average age of panels,
AEMO has calculated the effective capacity taking into account the projected degradation of rooftop PV
by region and across the NEM across the short, medium, and long term (see Table 10).
Table 10 Effective capacity (after allowing for reduced efficiency of aged panels) – rooftop PV (MW)
NSW and ACT QLD SA TAS VIC NEM
2016–17 1,278 1,737 718 113 1094 4,939
2020–21 2,112 2,580 1,024 188 1,850 7,754
2025–26 3,262 3,807 1,467 302 2,970 11,807
2030–31 4,452 5,141 1,787 428 4,157 15,965
2035–36 5,513 6,066 1,942 526 5,004 19,049
The main drivers of rooftop PV uptake, in all regions, are assumed to be:
Financial incentives, such as Small Technology Certificates (STCs) and feed-in tariffs (FiTs).
Declining installation costs for rooftop PV and Integrated PV and Storage Systems (IPSS).
For rooftop PV systems, short-term cost reductions are expected to come mainly in
non-hardware “soft costs”, including marketing and customer acquisition, system design,
installation labour, permitting and inspection costs, and installer margins. In the longer term,
cost reductions are expected to come from better system efficiencies and improvements from
research and development.
For batteries, economies of scale and increased competition are expected to be the main
causes of downward cost pressure.
An increase in retail electricity tariffs from 2020, driven in part by a proxy emissions abatement
cost that is assumed to commence at $25/t CO2-e and reach $50/t CO2-e by 2030, as high
emitting plant in the NEM is reduced. This cost is assumed by AEMO as a way of introducing an
approximate valuation of the cost of achieving the 2030 emissions target.
Projected steady population growth across Australia, allowing for more rooftop PV systems to be
adopted before saturation is reached.
A projected transition to a time-of-use tariff structure that provides cost-reflective pricing and
enables consumers to gain greater value from IPSS, as they could charge during low cost time
periods and discharge during high cost time periods.
Integrated PV and Storage Systems capacity forecast – NEM and regions
AEMO’s forecasts for IPSS are based on new combined installations. The model does not consider
rooftop PV being retrofitted with battery storage.
Uptake of IPSS is forecast to start slowly and pick up especially after 2020, in both the residential and
the commercial sectors, reaching around 3.8 GW installed at the end of the 20-year forecast period.
The forecast penetration of IPSS is not uniform in all states. A key factor in uptake projections is that
the existing high installed capacity of residential rooftop PV in some states prevents a higher
penetration of integrated battery storage, since no retrofitting of batteries to existing systems has been
considered in the model.
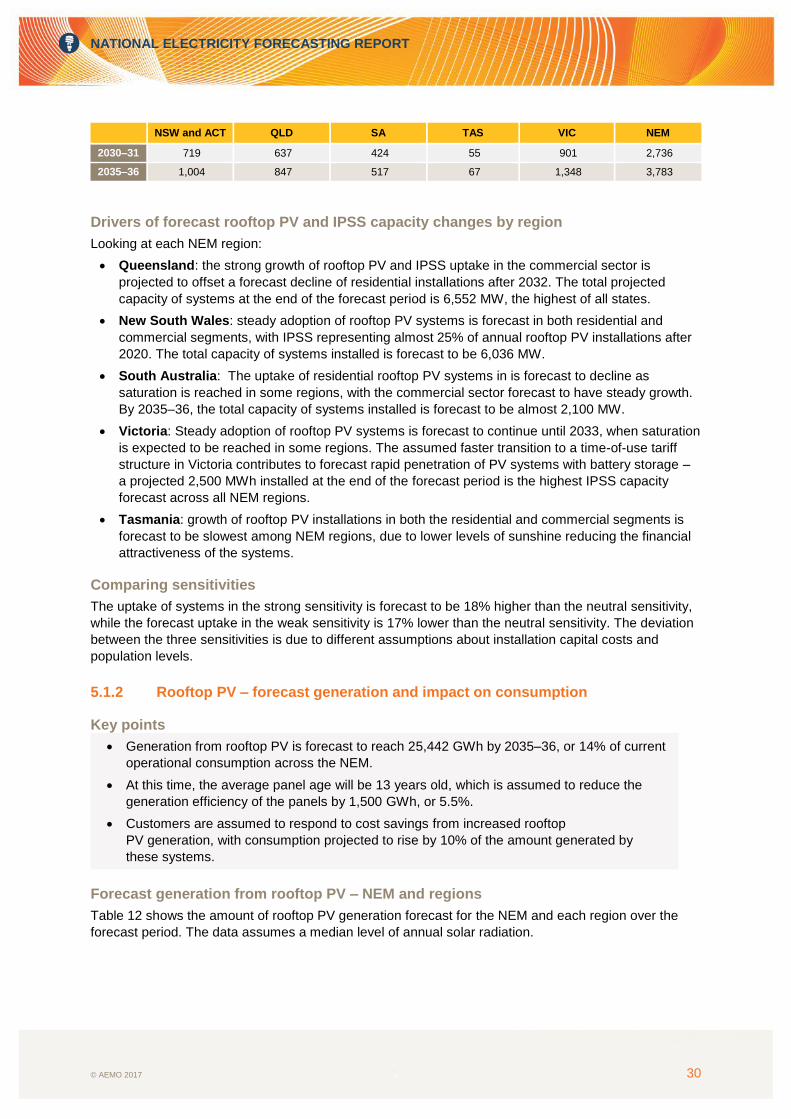
Table 11 Installed capacity – Integrated PV and Storage Systems (MW)
NSW and ACT QLD SA TAS VIC NEM
2016–17 7 9 1 0 7 24
2020–21 178 181 77 12 164 613
2025–26 442 402 279 33 495 1,651
NATIONAL ELECTRICITY FORECASTING REPORT
© AEMO 2017 30
NSW and ACT QLD SA TAS VIC NEM
2030–31 719 637 424 55 901 2,736
2035–36 1,004 847 517 67 1,348 3,783
Drivers of forecast rooftop PV and IPSS capacity changes by region
Looking at each NEM region:
Queensland: the strong growth of rooftop PV and IPSS uptake in the commercial sector is
projected to offset a forecast decline of residential installations after 2032. The total projected
capacity of systems at the end of the forecast period is 6,552 MW, the highest of all states.
New South Wales: steady adoption of rooftop PV systems is forecast in both residential and
commercial segments, with IPSS representing almost 25% of annual rooftop PV installations after
2020. The total capacity of systems installed is forecast to be 6,036 MW.
South Australia: The uptake of residential rooftop PV systems in is forecast to decline as
saturation is reached in some regions, with the commercial sector forecast to have steady growth.
By 2035–36, the total capacity of systems installed is forecast to be almost 2,100 MW.
Victoria: Steady adoption of rooftop PV systems is forecast to continue until 2033, when saturation
is expected to be reached in some regions. The assumed faster transition to a time-of-use tariff
structure in Victoria contributes to forecast rapid penetration of PV systems with battery storage –
a projected 2,500 MWh installed at the end of the forecast period is the highest IPSS capacity
forecast across all NEM regions.
Tasmania: growth of rooftop PV installations in both the residential and commercial segments is
forecast to be slowest among NEM regions, due to lower levels of sunshine reducing the financial
attractiveness of the systems.
Comparing sensitivities
The uptake of systems in the strong sensitivity is forecast to be 18% higher than the neutral sensitivity,
while the forecast uptake in the weak sensitivity is 17% lower than the neutral sensitivity. The deviation
between the three sensitivities is due to different assumptions about installation capital costs and
population levels.
5.1.2 Rooftop PV – forecast generation and impact on consumption
Key points
Generation from rooftop PV is forecast to reach 25,442 GWh by 2035–36, or 14% of current
operational consumption across the NEM.
At this time, the average panel age will be 13 years old, which is assumed to reduce the
generation efficiency of the panels by 1,500 GWh, or 5.5%.
Customers are assumed to respond to cost savings from increased rooftop
PV generation, with consumption projected to rise by 10% of the amount generated by
these systems.
Forecast generation from rooftop PV – NEM and regions
Table 12 shows the amount of rooftop PV generation forecast for the NEM and each region over the
forecast period. The data assumes a median level of annual solar radiation.

NATIONAL ELECTRICITY FORECASTING REPORT
© AEMO 2017 31
Table 12 Rooftop PV Generation (GWh)
NSW and ACT QLD SA TAS VIC NEM
2016–17 1,395 2,102 924 111 1,117 5,648
2020–21 2,647 3,547 1,384 213 2,196 9,987
2025–26 4,180 5,299 2,015 347 3,598 15,439
2030–31 5,757 7,217 2,495 499 5,091 21,059
2035–36 7,196 8,649 2,730 629 6,238 25,442
Forecast impact on consumption by region
By 2035–36, as a percentage of each region’s annual operational consumption:
South Australia is forecast to have the highest contribution of generation from PV, at 24%.
Tasmania is projected to have the lowest percentage, at 6%.
Queensland is forecast to generate 17% of its annual consumption from rooftop PV, New South
Wales 11%, and Victoria 14%.
AEMO has assumed end users will increase electricity consumption that is powered by rooftop PV,
responding to lower cost. The assumed consumption increase is 10% of the amount of PV generation.
This is equivalent to a price elasticity of demand assumption of -0.10, which is the lower bound of
AEMO’s estimates of price elastic response for the NEFR. By 2035–36, this is forecast to add 2,700
GWh (almost 1.5%) to total NEM consumption.
5.1.3 Battery storage – usage and impact on consumption
Key points
Battery storage is an emerging technology in its relative infancy. AEMO does not yet have
access to data that enables an understanding of operating practices or consumer behaviour.
By 2035–36, of the 6.6 GWh of projected installed battery storage energy capacity, AEMO
forecasts that only 90% of this would be available per charge and discharge cycle, due to
cycling costs and battery wear and tear. That would make the effective capacity 5.9 GWh.
AEMO assumes a daily usage factor of 1.25 cycles38, based on daytime charging from
rooftop PV and limited overnight charging from the grid.
Forecast battery storage for use
A total of 6,576 MWh of battery storage across the NEM in both residential and business sectors is
forecast by the end of 2036, as shown in Figure 6. In the short term, mainly business customers are
expected to find the installation of storage economically viable. As capital costs are projected to decline
quickly, and transition to a time-of-use tariff structure is assumed, more residential battery storage is
forecast to be adopted.
38 One cycle is a process of full charge and discharge.

NATIONAL ELECTRICITY FORECASTING REPORT
© AEMO 2017 32
Figure 6 Total installed battery storage capacity in the NEM
Source: Jacobs
Forecast impact on consumption
Projecting the contribution of battery storage to consumption and maximum/minimum demand depends
heavily on the assumed charging and discharging profile.
Details are in the 2016 NEFR Methodology paper, but this summary explains AEMO’s key assumptions
and forecast impacts of batteries on consumption and demand.
AEMO assumes battery storage systems will be installed with an energy management system that
will manage operation on behalf of the user. A charging/discharging profile has been assumed
that is estimated to represent the net profile for all systems, and is not optimised for an individual
user. Figure 7 shows the average charge and discharge profile39 for New South Wales in January,
and is indicative of the profile used for all regions.
Overnight charging from the grid is assumed at a discounted price to the consumer, to 25% of
storage capacity, then discharged during the business day when prices are assumed to be higher.
Daytime charging to full capacity is profiled based on typical sun-strength (capped at partial
strength) for a typical panel.
The daytime charge is discharged during the evening, spread over the hours of the evening peak.
Summer sunshine during the evening peak enables a late recharge that extends the evening use
of discharged energy.
39 The model assumes consumption increases by 10% of the discharged amount to account for a price-elastic response in consumer behaviour from
low cost electricity. The model proxies this by reducing the discharge by the amount of this consumer response. For this reason the discharge shown is ‘effective’, and therefore net of the consumer response.
0
1,000
2,000
3,000
4,000
5,000
6,000
7,000
8,000
20
15
20
16
20
17
20
18
20
19
20
20
20
21
20
22
20
23
20
24
20
25
20
26
20
27
20
28
20
29
20
30
20
31
20
32
20
33
20
34
20
35
20
36
20
37
Ins
tall
ed
Ca
pa
cit
y (
MW
h)
Residential battery storage Business battery storage

NATIONAL ELECTRICITY FORECASTING REPORT
© AEMO 2017 33
Figure 7 Typical January charge/discharge profile, New South Wales
The key assumption affecting the impact of battery storage on consumption and maximum demand was
the evening discharge logic:
Assuming that the system will align with consumer incentives means the contribution of stored
energy to a measure of maximum demand will remain small, relative to the amount of stored
energy capacity. By 2035–36, the cumulative offset for all regions, noting that maximum demand
occurs at different times, is only forecast to be 530 GW, or about 1.5 percent.
An alternative assumption, that battery discharge would be controlled to better follow the net
system load pattern or wholesale market electricity prices, rather than consumer incentives, would
result in a larger forecast impact.
The impact of battery storage operations on consumption and demand is further modified from this
charging and discharging pattern:
A depth of discharge limit of 90% was assumed, so the effective capacity per cycle is limited
to 5.9 GWh.
AEMO also assumed an approximate 10% efficiency loss in charging40, so to enable 5.9 GWh of
energy storage potential for the NEM, an additional 300 GWh (0.16% of total operational
consumption) is consumed in 2035–36.
The cost to the consumer of this stored energy was assumed to be cheaper than the retail price of
electricity during the time that it is used, encouraging a further consumption response by the
residential sector only. An assumed price-elastic consumer response adds 177 GWh (0.1%) to
total forecast NEM consumption in 2035–36.
40 Some power is consumed when batteries are charged.
-0.1
-0.09
-0.08
-0.07
-0.06
-0.05
-0.04
-0.03
-0.02
-0.01
0
0.01
0.02
0.03
0.04
0.05
0.06
00:3
0
01:3
0
02:3
0
03:3
0
04:3
0
05:3
0
06:3
0
07:3
0
08:3
0
09:3
0
10:3
0
11:3
0
12:3
0
13:3
0
14:3
0
15:3
0
16:3
0
17:3
0
18:3
0
19:3
0
20:3
0
21:3
0
22:3
0
23:3
0
Charge Proportion Discharge Proportion
Pro
po
rtio
n o
f s
tora
ge
ca
pa
cit
y
Overnight charging from the grid
Dayime charging from the sun
Discharge of overnight energy
Discharge during period of peak
evening consumption
NATIONAL ELECTRICITY FORECASTING REPORT
© AEMO 2017 34
5.2 Energy efficiency
Key points
Energy efficiency is a major factor in flattening the growth of electricity consumption.
AEMO has now estimated a rebound effect, reflecting an increase in consumption that is
enabled by the lower operating cost of energy efficiency appliances. This rebound effect is
estimated to be 20% of energy efficiency savings from appliance and building
improvements.
Energy efficiency savings are projected to total 27,082 GWh by 2035–36, reflecting 14.8% of
current annual consumption for the NEM. This forecast includes the rebound effect.
Energy efficiency is one of the key factors behind the slowdown of electricity consumption seen in
recent years across developed countries, including Australia. It is therefore an important input into the
forecast of future electricity consumption in the NEM.
As in previous NEFRs, AEMO has forecast energy efficiency using estimates of the impacts of:
Policy measures addressing the energy efficiency of appliances.
Building energy efficiency measures.
AEMO contracted Pitt & Sherry to provide these estimates.41 This analysis included:
Savings from existing federal energy efficiency programs.
Savings from existing state-based programs in Victoria, South Australia, and New South Wales.
Both the residential and commercial sectors.
Future programs, expecting additional initiatives to be implemented over time to assist meeting the
target set in the National Energy Productivity Plan for a 40% improvement in energy productivity
between now and 2030.
Trends in projected energy efficiency
Figure 8 shows the combined residential and business energy efficiency savings forecast for the NEM,
in comparison with those of previous NEFRs.
It shows that the 2016 NEFR forecast is broadly consistent with previous years. The small reduction in
the 2016 NEFR forecast is because savings have now been estimated based on most recent available
appliance sales data and measures implemented by building developers, rather than the savings
assumed when policies were implemented. (The forecast increased from 2014 to 2015, as it included
state-based schemes which were not included in 2014.)
41 Pitt & Sherry. Estimating the Effects of Energy Efficiency Policies and Programs on Usage of Electricity and Gas, June 2016. Available at:
http://www.aemo.com.au/Electricity/Planning/Forecasting.
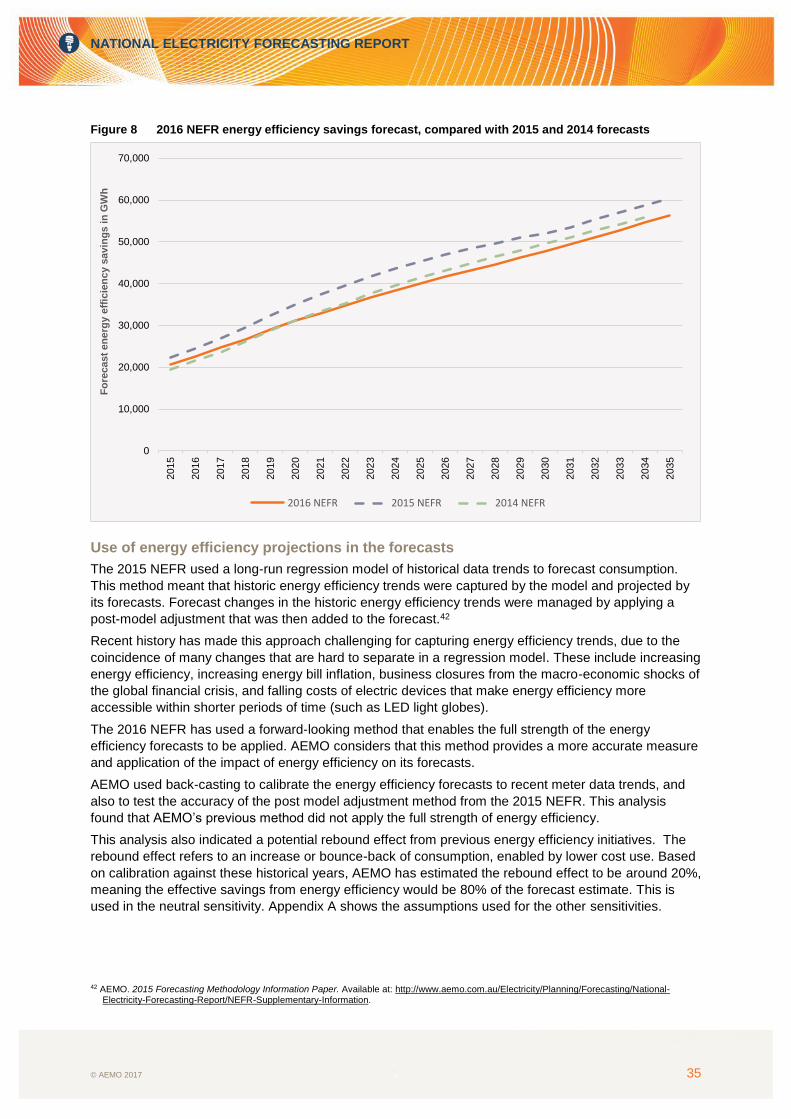
NATIONAL ELECTRICITY FORECASTING REPORT
© AEMO 2017 35
Figure 8 2016 NEFR energy efficiency savings forecast, compared with 2015 and 2014 forecasts
Use of energy efficiency projections in the forecasts
The 2015 NEFR used a long-run regression model of historical data trends to forecast consumption.
This method meant that historic energy efficiency trends were captured by the model and projected by
its forecasts. Forecast changes in the historic energy efficiency trends were managed by applying a
post-model adjustment that was then added to the forecast.42
Recent history has made this approach challenging for capturing energy efficiency trends, due to the
coincidence of many changes that are hard to separate in a regression model. These include increasing
energy efficiency, increasing energy bill inflation, business closures from the macro-economic shocks of
the global financial crisis, and falling costs of electric devices that make energy efficiency more
accessible within shorter periods of time (such as LED light globes).
The 2016 NEFR has used a forward-looking method that enables the full strength of the energy
efficiency forecasts to be applied. AEMO considers that this method provides a more accurate measure
and application of the impact of energy efficiency on its forecasts.
AEMO used back-casting to calibrate the energy efficiency forecasts to recent meter data trends, and
also to test the accuracy of the post model adjustment method from the 2015 NEFR. This analysis
found that AEMO’s previous method did not apply the full strength of energy efficiency.
This analysis also indicated a potential rebound effect from previous energy efficiency initiatives. The
rebound effect refers to an increase or bounce-back of consumption, enabled by lower cost use. Based
on calibration against these historical years, AEMO has estimated the rebound effect to be around 20%,
meaning the effective savings from energy efficiency would be 80% of the forecast estimate. This is
used in the neutral sensitivity. Appendix A shows the assumptions used for the other sensitivities.
42 AEMO. 2015 Forecasting Methodology Information Paper. Available at: http://www.aemo.com.au/Electricity/Planning/Forecasting/National-
Electricity-Forecasting-Report/NEFR-Supplementary-Information.
0
10,000
20,000
30,000
40,000
50,000
60,000
70,0002015
2016
2017
2018
2019
2020
2021
2022
2023
2024
2025
2026
2027
2028
2029
2030
2031
2032
2033
2034
2035
Fo
recast
en
erg
y e
ffic
ien
cy s
avin
gs in
GW
h
2016 NEFR 2015 NEFR 2014 NEFR

NATIONAL ELECTRICITY FORECASTING REPORT
© AEMO 2017 36
Residential energy efficiency
Energy efficiency programs are estimated to deliver savings of 18,171 GWh by 2035–36 for the
residential sector.
The main contributions to the savings are forecast to be from refrigeration and freezers, home
entertainment, lighting, and cooling.
Refrigeration and freezers have always been large contributors to household energy consumption.
Strong energy efficiency gains have been made in all areas to dampen consumption.
A new air-conditioner is almost twice as efficient as one installed in the 1990s.
LED lights use only about 20% of the power used by halogen spots.
Modern LED and OLED TVs are significantly more energy-efficient than the early generation of
plasma flat screen TVs that are due for replacement.
Some residential savings are projected to arise from building energy efficiency savings. Not all potential
savings lead to realised savings in consumption, but rather increased comfort from warmer houses
during winter and cooler during summer.
Business sector energy efficiency
Energy efficiency measures targeting the business sector are forecast to deliver 8,912 GWh of savings
by 2035–36. This corresponds to 6.5% of business consumption today.
Compared to the residential sector, relatively more energy efficiency savings in the business sector are
forecast to arise from building measures.
Building energy efficiency programs captured for the business sector include savings from:
The two Building Code of Australia measures (2006, 2010), taken from the respective
Regulatory Impact Statements for the measures, adjusted for an assumed 10% non-compliance
savings discount.
NABERS, on the basis of the reported response to this voluntary scheme. By the financial year
2014–2015, the reported take-up rate was 79% of the national office stock, and a reported average
of 8.5% energy savings for at least those buildings rated more than once. It has been assumed
the take-up rate of NABERS reaches a plateau of 90% by 2019–20 and then remains at that level.
The Commercial Buildings Disclosure (CBD) program. This interacts with the NABERS scheme,
which has declined markedly from 2011 as a result of the progressive introduction of CBD, which is
a mandatory program.
Appliance energy efficiency savings from the business sector are forecast to come mainly from
improvements to lighting, cooling, and IT appliances.
5.3 Other trends and drivers for the residential sector
5.3.1 New connections
Key points
New electricity meter connections are a growth driver for electricity consumption.
Dwelling construction trends suggest a slowdown in new meter connections, with forecasts
assuming stabilisation at a lower level than that observed over the last five years.
Population growth is projected to remain strong and to be the key driver of new connections
for the period 2026–36.
Across the NEM, new connections are forecast to grow 27% by 2035–36 from current
(2015–16) levels.

NATIONAL ELECTRICITY FORECASTING REPORT
© AEMO 2017 37
AEMO bases its projections for new active connections on building construction forecasts, purchased
from the Housing Industry Association Ltd (HIA). AEMO estimates the historic correlation, in each NEM
region, between building completions and changes in the number of active National Meter Identifiers
(NMIs, signifying individual customer meters) in AEMO’s database.
Long-term (after 2026) forecasts are based on long-term population growth trends from the Australian
Bureau of Statistics (ABS). ABS population trends are based on long-term time series and the most
recent census data (2011).43 They are used as one of the inputs of the HIA dwellings forecast, and as
main growth indicator for the last ten years of AEMO’s forecast. The regions with the largest overall
projected population growth in the period 2026–36 are Queensland (15%) and Victoria (12.9%). At the
other end of the spectrum, Tasmania’s population growth over the same ten-year period is forecast
to be 2.8%.
Building forecasts
The HIA building construction data shows a continuing trend for the proportion of multi-unit high-density
dwellings to grow, compared to single detached houses. In 2009–10, single detached houses
comprised 59% of new dwellings completed in New South Wales. Five years later, in 2014–15, this had
shrunk to 50%. In Victoria and Queensland, the trend has been even more pronounced. In the same
five-year period, detached houses went from 77% to 57% of total new constructions in Victoria, while in
Queensland, detached houses went from 72% to 60% of total new constructions.
However, HIA predicts that these trends will soon stabilise, projecting that in 2025, the proportion of
new dwellings that are single detached houses will be 48% in New South Wales and 60% in Victoria.
This stabilisation is related to a general slowdown of the building boom. Compared to the building
forecasts used in the 2015 NGFR, HIA has revised the outlook of new building completions downwards.
This revision particularly affected the Sydney area and, to a lesser extent, Queensland. Queensland’s
housing stock is expected to keep increasing with a robust population growth rate, although at a slightly
slower rate than the past two years. The Victorian housing market is expected to continue sustained
growth in the short and medium term.
New connections forecasts
These forecast building trends are reflected in the growth of the number of active NMI connections
forecast by AEMO. The total connection growth over the past five years and forecast in the next two
five-year periods is summarised in Table 10.
Table 13 Total growth in number of connections over five-year periods by NEM region
NSW and ACT QLD SA VIC TAS
2011–15 6.7% 7.3% 3.4% 7.2% n/a44
2016–20 4.4% 7.4% 3.7% 6.4% 3.3%
2021–25 4.5% 7.4% 4.0% 6.9% 3.4%
43 Australian Bureau of Statistics, 2013, Population Projections, Australia 2012 (base), cat. no. 3222.0 44 Data unavailable to AEMO.

NATIONAL ELECTRICITY FORECASTING REPORT
© AEMO 2017 38
5.3.2 Uptake and use of electric appliances
Key points
Appliance data shows that electricity is as important to households as ever, despite a
number of years of falling electricity consumption.
Operational consumption, reflecting the demand for grid-supplied electricity, has been falling
since 2009. AEMO has analysed this trend and found that it is not because households are
reducing appliance use. Indeed, analysis shows that appliance use is higher than ever, and
is forecast to increase.
This expected increase is seen across most appliance categories, driven by forecast
increase in appliance ownership, appliance use, and the quality and functionality of their
output. Some categories will, however, see a decline, most notable for stationary home
entertainment, which is projected to be replaced gradually by portable/handheld
web-streaming appliances.
For this NEFR, AEMO has, for the first time, had access to electricity usage data down to individual
appliance categories due to its new data collaboration with the Australian Government Department of
Industry, Innovation and Science.45
AEMO has used this appliance data to forecast growth in electricity consumption by the residential
sector. The approach forecasts appliance penetration and use, and then separately makes adjustments
for the energy efficiency of these appliances (see Section 5.2) and gas to electric appliance switching
(see Section 5.3.3).
Access to data at appliance level has allowed AEMO to get a better understanding of energy use, from
primary energy inputs into electricity generation, to the energy used by different groups of appliances at
end user level, and the services or benefits these appliances deliver to households and businesses.
AEMO has used the data to estimate changes to the level of energy services supplied by electricity for
households across the NEM. Energy services here is a measure based on the number of appliances
per category across the NEM, their usage hours, and their capacity and size.
The analysis went back as far as 2009, when electricity consumption in the NEM peaked. Since then,
consumption from the grid has dropped by almost 8%, but the services households get from electricity
have continued to increase.
For the residential sector, these services are up 17% since 2009, shown by the composite index46 in
Figure 9. Households now have more light fittings, larger televisions, increasing numbers of new
web-connected devices, larger capacity whitegoods, and more heating and cooling capability:
From 2009 to now, the rise in the benefits indices has been led by televisions (up 61%), network
(web) access services (up 50%), air-conditioning (up 30%), and refrigeration/freezers (up 21%).
This rise is attributed to a combination of more frequent use, increased appliance functionality, and
population growth.
45 AEMO would like to thank the E3 Committee for access to the appliance model underpinning the 2015 Residential Baseline Study for Australia
2000 – 2030, available at: www.energyrating.com.au . 46 The composite index is calculated on changes in services provided by each appliance category weighted by their estimated electricity
consumption in 2015–2016.
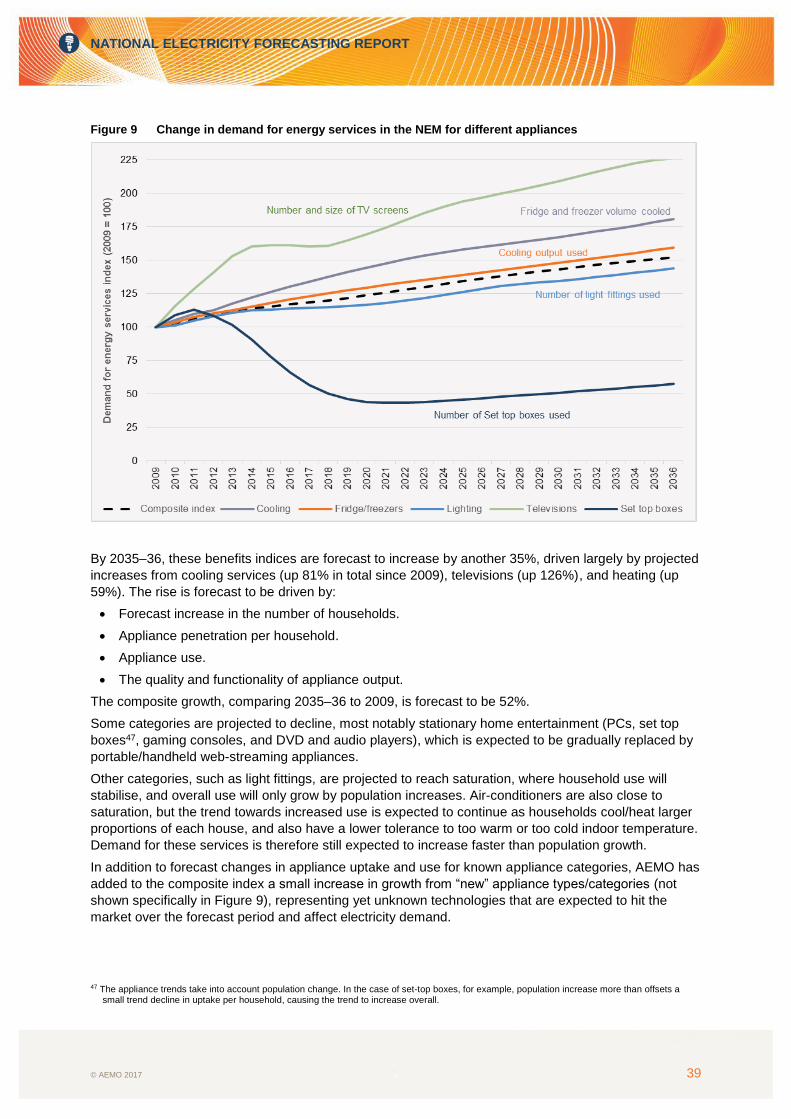
NATIONAL ELECTRICITY FORECASTING REPORT
© AEMO 2017 39
Figure 9 Change in demand for energy services in the NEM for different appliances
By 2035–36, these benefits indices are forecast to increase by another 35%, driven largely by projected
increases from cooling services (up 81% in total since 2009), televisions (up 126%), and heating (up
59%). The rise is forecast to be driven by:
Forecast increase in the number of households.
Appliance penetration per household.
Appliance use.
The quality and functionality of appliance output.
The composite growth, comparing 2035–36 to 2009, is forecast to be 52%.
Some categories are projected to decline, most notably stationary home entertainment (PCs, set top
boxes47, gaming consoles, and DVD and audio players), which is expected to be gradually replaced by
portable/handheld web-streaming appliances.
Other categories, such as light fittings, are projected to reach saturation, where household use will
stabilise, and overall use will only grow by population increases. Air-conditioners are also close to
saturation, but the trend towards increased use is expected to continue as households cool/heat larger
proportions of each house, and also have a lower tolerance to too warm or too cold indoor temperature.
Demand for these services is therefore still expected to increase faster than population growth.
In addition to forecast changes in appliance uptake and use for known appliance categories, AEMO has
added to the composite index a small increase in growth from “new” appliance types/categories (not
shown specifically in Figure 9), representing yet unknown technologies that are expected to hit the
market over the forecast period and affect electricity demand.
47 The appliance trends take into account population change. In the case of set-top boxes, for example, population increase more than offsets a
small trend decline in uptake per household, causing the trend to increase overall.
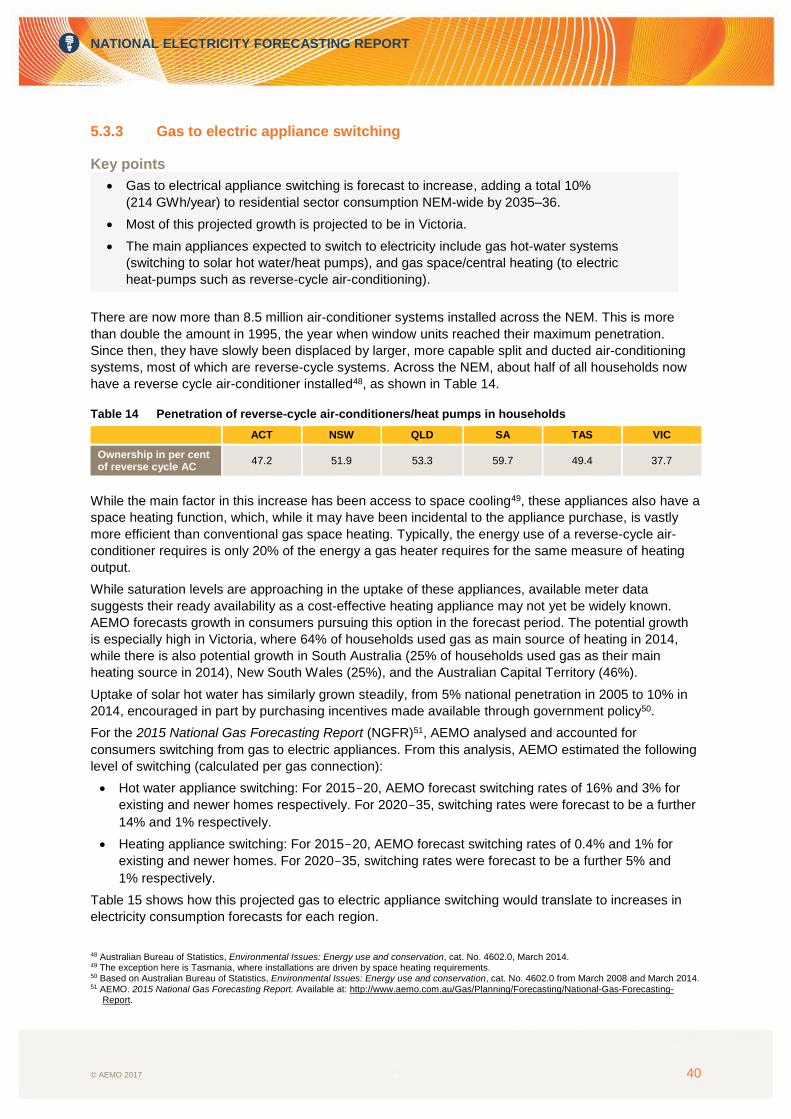
NATIONAL ELECTRICITY FORECASTING REPORT
© AEMO 2017 40
5.3.3 Gas to electric appliance switching
Key points
Gas to electrical appliance switching is forecast to increase, adding a total 10%
(214 GWh/year) to residential sector consumption NEM-wide by 2035–36.
Most of this projected growth is projected to be in Victoria.
The main appliances expected to switch to electricity include gas hot-water systems
(switching to solar hot water/heat pumps), and gas space/central heating (to electric
heat-pumps such as reverse-cycle air-conditioning).
There are now more than 8.5 million air-conditioner systems installed across the NEM. This is more
than double the amount in 1995, the year when window units reached their maximum penetration.
Since then, they have slowly been displaced by larger, more capable split and ducted air-conditioning
systems, most of which are reverse-cycle systems. Across the NEM, about half of all households now
have a reverse cycle air-conditioner installed48, as shown in Table 14.
Table 14 Penetration of reverse-cycle air-conditioners/heat pumps in households
ACT NSW QLD SA TAS VIC
Ownership in per cent of reverse cycle AC
47.2 51.9 53.3 59.7 49.4 37.7
While the main factor in this increase has been access to space cooling49, these appliances also have a
space heating function, which, while it may have been incidental to the appliance purchase, is vastly
more efficient than conventional gas space heating. Typically, the energy use of a reverse-cycle air-
conditioner requires is only 20% of the energy a gas heater requires for the same measure of heating
output.
While saturation levels are approaching in the uptake of these appliances, available meter data
suggests their ready availability as a cost-effective heating appliance may not yet be widely known.
AEMO forecasts growth in consumers pursuing this option in the forecast period. The potential growth
is especially high in Victoria, where 64% of households used gas as main source of heating in 2014,
while there is also potential growth in South Australia (25% of households used gas as their main
heating source in 2014), New South Wales (25%), and the Australian Capital Territory (46%).
Uptake of solar hot water has similarly grown steadily, from 5% national penetration in 2005 to 10% in
2014, encouraged in part by purchasing incentives made available through government policy50.
For the 2015 National Gas Forecasting Report (NGFR)51, AEMO analysed and accounted for
consumers switching from gas to electric appliances. From this analysis, AEMO estimated the following
level of switching (calculated per gas connection):
Hot water appliance switching: For 2015-20, AEMO forecast switching rates of 16% and 3% for
existing and newer homes respectively. For 2020-35, switching rates were forecast to be a further
14% and 1% respectively.
Heating appliance switching: For 2015-20, AEMO forecast switching rates of 0.4% and 1% for
existing and newer homes. For 2020-35, switching rates were forecast to be a further 5% and
1% respectively.
Table 15 shows how this projected gas to electric appliance switching would translate to increases in
electricity consumption forecasts for each region.
48 Australian Bureau of Statistics, Environmental Issues: Energy use and conservation, cat. No. 4602.0, March 2014. 49 The exception here is Tasmania, where installations are driven by space heating requirements. 50 Based on Australian Bureau of Statistics, Environmental Issues: Energy use and conservation, cat. No. 4602.0 from March 2008 and March 2014. 51 AEMO. 2015 National Gas Forecasting Report. Available at: http://www.aemo.com.au/Gas/Planning/Forecasting/National-Gas-Forecasting-
Report.
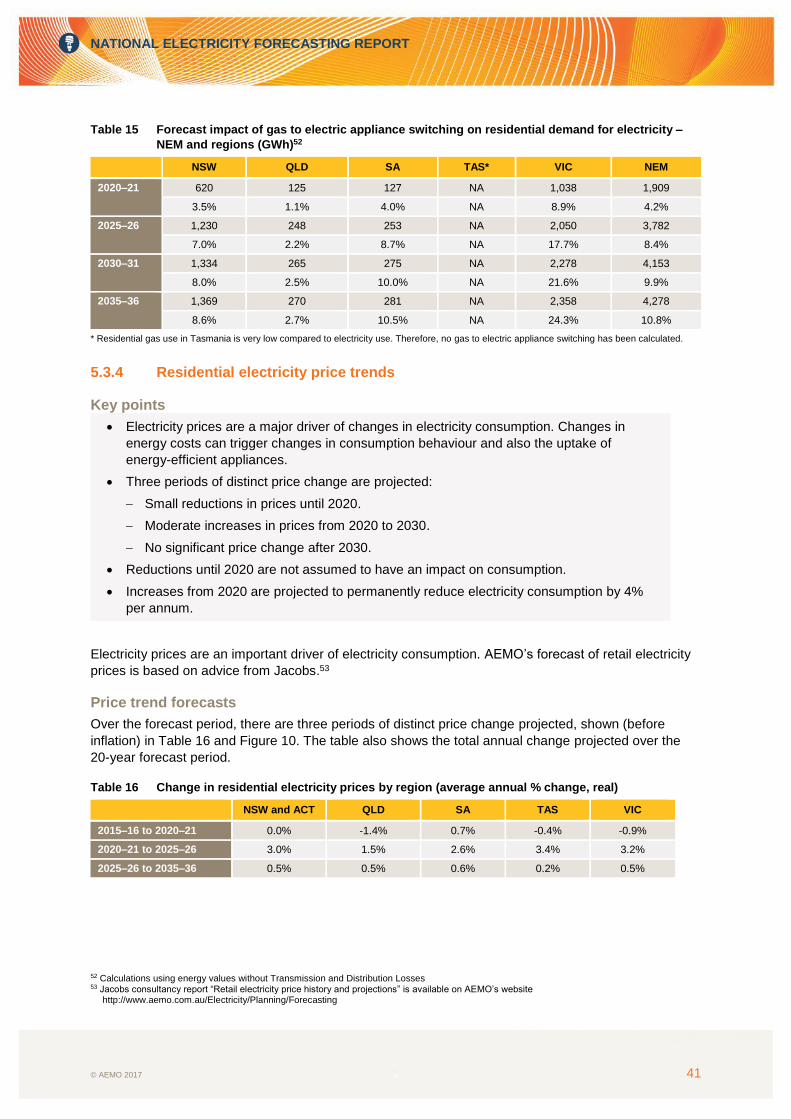
NATIONAL ELECTRICITY FORECASTING REPORT
© AEMO 2017 41
Table 15 Forecast impact of gas to electric appliance switching on residential demand for electricity –
NEM and regions (GWh)52
NSW QLD SA TAS* VIC NEM
2020–21 620 125 127 NA 1,038 1,909
3.5% 1.1% 4.0% NA 8.9% 4.2%
2025–26 1,230 248 253 NA 2,050 3,782
7.0% 2.2% 8.7% NA 17.7% 8.4%
2030–31 1,334 265 275 NA 2,278 4,153
8.0% 2.5% 10.0% NA 21.6% 9.9%
2035–36 1,369 270 281 NA 2,358 4,278
8.6% 2.7% 10.5% NA 24.3% 10.8%
* Residential gas use in Tasmania is very low compared to electricity use. Therefore, no gas to electric appliance switching has been calculated.
5.3.4 Residential electricity price trends
Key points
Electricity prices are a major driver of changes in electricity consumption. Changes in
energy costs can trigger changes in consumption behaviour and also the uptake of
energy-efficient appliances.
Three periods of distinct price change are projected:
Small reductions in prices until 2020.
Moderate increases in prices from 2020 to 2030.
No significant price change after 2030.
Reductions until 2020 are not assumed to have an impact on consumption.
Increases from 2020 are projected to permanently reduce electricity consumption by 4%
per annum.
Electricity prices are an important driver of electricity consumption. AEMO’s forecast of retail electricity
prices is based on advice from Jacobs.53
Price trend forecasts
Over the forecast period, there are three periods of distinct price change projected, shown (before
inflation) in Table 16 and Figure 10. The table also shows the total annual change projected over the
20-year forecast period.
Table 16 Change in residential electricity prices by region (average annual % change, real)
NSW and ACT QLD SA TAS VIC
2015–16 to 2020–21 0.0% -1.4% 0.7% -0.4% -0.9%
2020–21 to 2025–26 3.0% 1.5% 2.6% 3.4% 3.2%
2025–26 to 2035–36 0.5% 0.5% 0.6% 0.2% 0.5%
52 Calculations using energy values without Transmission and Distribution Losses 53 Jacobs consultancy report “Retail electricity price history and projections” is available on AEMO’s website
http://www.aemo.com.au/Electricity/Planning/Forecasting
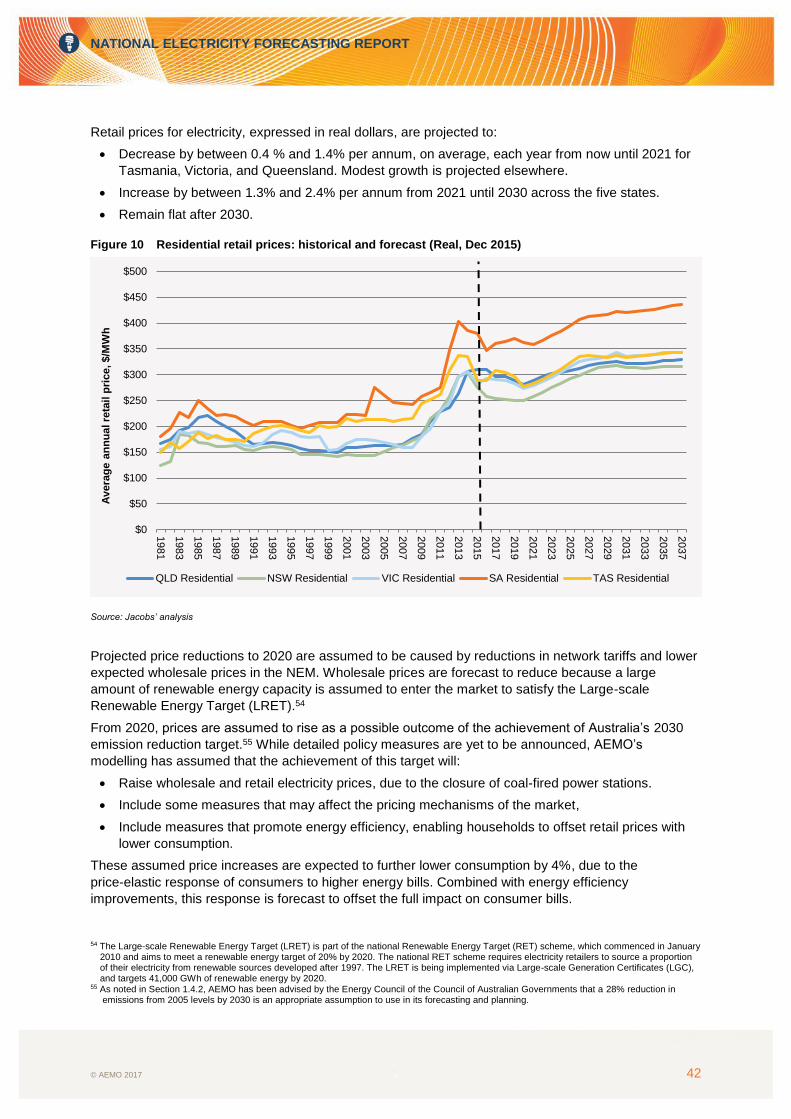
NATIONAL ELECTRICITY FORECASTING REPORT
© AEMO 2017 42
Retail prices for electricity, expressed in real dollars, are projected to:
Decrease by between 0.4 % and 1.4% per annum, on average, each year from now until 2021 for
Tasmania, Victoria, and Queensland. Modest growth is projected elsewhere.
Increase by between 1.3% and 2.4% per annum from 2021 until 2030 across the five states.
Remain flat after 2030.
Figure 10 Residential retail prices: historical and forecast (Real, Dec 2015)
Source: Jacobs’ analysis
Projected price reductions to 2020 are assumed to be caused by reductions in network tariffs and lower
expected wholesale prices in the NEM. Wholesale prices are forecast to reduce because a large
amount of renewable energy capacity is assumed to enter the market to satisfy the Large-scale
Renewable Energy Target (LRET).54
From 2020, prices are assumed to rise as a possible outcome of the achievement of Australia’s 2030
emission reduction target.55 While detailed policy measures are yet to be announced, AEMO’s
modelling has assumed that the achievement of this target will:
Raise wholesale and retail electricity prices, due to the closure of coal-fired power stations.
Include some measures that may affect the pricing mechanisms of the market,
Include measures that promote energy efficiency, enabling households to offset retail prices with
lower consumption.
These assumed price increases are expected to further lower consumption by 4%, due to the
price-elastic response of consumers to higher energy bills. Combined with energy efficiency
improvements, this response is forecast to offset the full impact on consumer bills.
54 The Large-scale Renewable Energy Target (LRET) is part of the national Renewable Energy Target (RET) scheme, which commenced in January
2010 and aims to meet a renewable energy target of 20% by 2020. The national RET scheme requires electricity retailers to source a proportion of their electricity from renewable sources developed after 1997. The LRET is being implemented via Large-scale Generation Certificates (LGC), and targets 41,000 GWh of renewable energy by 2020.
55 As noted in Section 1.4.2, AEMO has been advised by the Energy Council of the Council of Australian Governments that a 28% reduction in emissions from 2005 levels by 2030 is an appropriate assumption to use in its forecasting and planning.
$0
$50
$100
$150
$200
$250
$300
$350
$400
$450
$500
1981
1983
1985
1987
1989
1991
1993
1995
1997
1999
2001
2003
2005
2007
2009
2011
2013
2015
2017
2019
2021
2023
2025
2027
2029
2031
2033
2035
2037
Avera
ge
an
nu
al re
tail
pri
ce, $/M
Wh
QLD Residential NSW Residential VIC Residential SA Residential TAS Residential
NATIONAL ELECTRICITY FORECASTING REPORT
© AEMO 2017 43
In the long term (beyond 2030), price behaviour is projected to be dominated by movements in the
wholesale price. The projected growth varies between sensitivities:
In the strong and neutral sensitivities, regional wholesale prices are forecast to reach new
(generation) entry levels and level off from this point.
In the weak sensitivity, prices are projected to remain below new entry levels, because there would
be a wider gap between supply and demand, suppressing prices. This gap is projected to generally
continue growing throughout the forecast period, because less coal-fired capacity would be
required to close to achieve the 2030 emissions reduction target, due to lower demand.
5.3.5 Weather and climate
Key points
AEMO uses historical weather patterns to forecast annual consumption and maximum and
minimum demand. Weather in an important factor in forecasting heating and cooling load.
Climate change means historical weather outcomes may not be indicative of weather trends
for the next 20 years. AEMO is working with industry to understand the climate science.
AEMO has used a hot-weather trend since 1 January 2000 as the weather basis for its
forecasts. Climate science advice suggests that this period may have been hotter than the
long-term climate warming trend. The result is that AEMO’s forecasts may have a
hot-weather bias during the early-mid part of the 20-year forecast period. Continued climate
warming means the end of the forecast period may have projections with a cool bias.
Climate trends
Generally, the last fifteen years have been much warmer than the long-term average56 across Australia.
Eight of Australia’s ten warmest years on record were experienced since 2000. The last three years
have been very warm (all in the top five warmest years on record). Only three years during this period
were cooler than the long-term average.
This observed warming has also been experienced globally. Data from the World Meteorological
Organisation57 shows that the global temperature has exceeded the average global mean temperature
(1961–90 was the base period) since 1985. Further, all of the ten warmest years have occurred
between 1998 and the present. Preliminary data indicates that 2015 will be recorded as the warmest
year since records commenced in 1880, with 2014 the second warmest.
Figure 11 shows the climate trend since 1860 for Sydney, using a temperature-based measure of
annual cooling degrees.
A cooling degree measures the temperature difference above a critical minimum temperature that is
indicative of where a population starts to use their air-conditioners. Higher cooling degrees reflect
warmer weather and therefore greater use of air-conditioning. While the figure shows data for Sydney,
the trends are common across all major cities in the NEM.
56 The information was taken from the Bureau of Meteorology (BOM) Annual climate statement 2015. Available at:
http://www.bom.gov.au/climate/current/annual/aus/. The BOM used the period 1961–90 as their long run horizon. 57 Also sourced from the BOM Annual climate statement 2015.

NATIONAL ELECTRICITY FORECASTING REPORT
© AEMO 2017 44
Figure 11 Annual cooling degree days for Sydney: 1860–2015
It shows numerous decadal periods of cooling and warming across the time period. It also shows an
underlying warming trend that began in the 1950s and continues across the period. From 2000, the
figure shows a step-up to a hot period, which CSIRO has advised AEMO is above an underlying
long-term warming trend driven by climate change.
For the 2015 NEFR, this hot period was combined with a forecast of continuing warming which may
over-forecast climate warming and consequent consumption impacts.
Improving climate assumptions
For the 20-year forecast period of the 2016 NEFR, AEMO has instead held constant the pattern of
weather since 2000 (as it did with the 2015 NGFR).
AEMO recognises this as a conservative assumption, given advice that the climate is warming,
but notes:
This period is hotter than the underlying warming trend.
The 20-year period of the NEFR is short compared to the timeframes analysed by
climate scientists.
Even with a trend of long-term warming, weather can exhibit decadal patterns of cooling.
Acknowledging the limitation of this assumption, AEMO sought advice from the CSIRO. Initial advice
indicates that:
AEMO’s climate assumption may be suitable in the shorter term, but may not appropriately capture
the warming that could be experienced in the longer term.
Within the 20-year forecast period of the NEFR, cyclic climate variability may dominate over the
long-term trend.
0
200
400
600
800
1,000
1,200
1860
1863
1866
1870
1873
1876
1880
1883
1887
1890
1893
1897
1900
1904
1907
1910
1914
1917
1921
1924
1927
1931
1934
1938
1941
1944
1948
1951
1955
1958
1961
1965
1968
1972
1975
1978
1982
1985
1989
1992
1995
1999
2002
2006
2009
2012
CD
D y
ea
rly a
ve
rag
e
1900s2000s
Constant climateassumption due to key uncertainties
Decade long cycles of warming then cooling despite a long term warming trend

NATIONAL ELECTRICITY FORECASTING REPORT
© AEMO 2017 45
The climate assumption used is likely to lead to an underestimation of the impact of climate
change towards the end of the forecast period, while the climate data used for the beginning is
aligned with the long-term warming trend.
AEMO will continue to investigate how climate science can be used to improve the climate forecast,
including getting further advice from climate scientists. AEMO aims to complete this work plan
by late 2016.
5.4 Other trends and drivers for the business sector
This section addresses other trends and drivers that have influenced forecasts for the business sector.
For the first time, AEMO has separated business consumption into segments that are distinguished by
distinct forecast characteristics, to enable a better an understanding of key dynamics. These
segments include:
Queensland’s new LNG export industry, that uses electricity for gas liquefaction
Energy-intensive manufacturing, which data suggests is in structural decline.58
Other business, which includes sectors that are growing steadily with population, including
services (such as retail, hospitals, education), transport, and food and beverage manufacturing.
5.4.1 Queensland’s LNG export industry
Key points
Grid-supplied electricity that is consumed by Queensland’s LNG export supply chain is
forecast to increase from 4,334 GWh in 2016–17 to 8,478 GWh by 2035–36.
Electricity is used for gas production by electrically driven compressors, so electricity
consumption is closely correlated with gas production.
AEMO’s forecast of electricity use by the LNG sector is based on advice from Lewis Grey Advisory.
Their consulting report is available on AEMO’s website.59
LNG facilities’ start-up and capacity
Queensland Curtis LNG (QCLNG) commenced exports from its first LNG train on Curtis Island, near
Gladstone, in January 2015. This train was declared “commercial” (delivering LNG cargoes according to
contract) in May 2015. QCLNG’s second train became operational in July 2015 and commercial in
November 2015.
The first trains of Gladstone LNG (GLNG) and Australia Pacific LNG (APLNG) started LNG production
in September 2015 and December 2015 respectively, and exported their first cargoes shortly thereafter.
APLNG announced the transition of its first train to operational status in March 2016. APLNG’s and
GLNG’s second trains are expected to start up in the first half of 2016.
These six LNG trains are each capable of delivering about 3.9 to 4.5 million tonnes of LNG per year
when operating at their nameplate capacities.
A fourth major project, that of Arrow Energy, was cancelled as a stand-alone project earlier this year
and Arrow has yet to indicate how it will try to monetise the value of its gas reserves. According to
Lewis Grey Advisory, using the gas in a third train at one of the existing projects or another, smaller,
project is a widely canvased option. Arrow’s 50% owner, Shell, has recently taken over BG Group, the
majority owner of QCLNG.
58 AEMO analysis of national account data (ABS) 59 http://www.aemo.com.au/Electricity/Planning/Forecasting
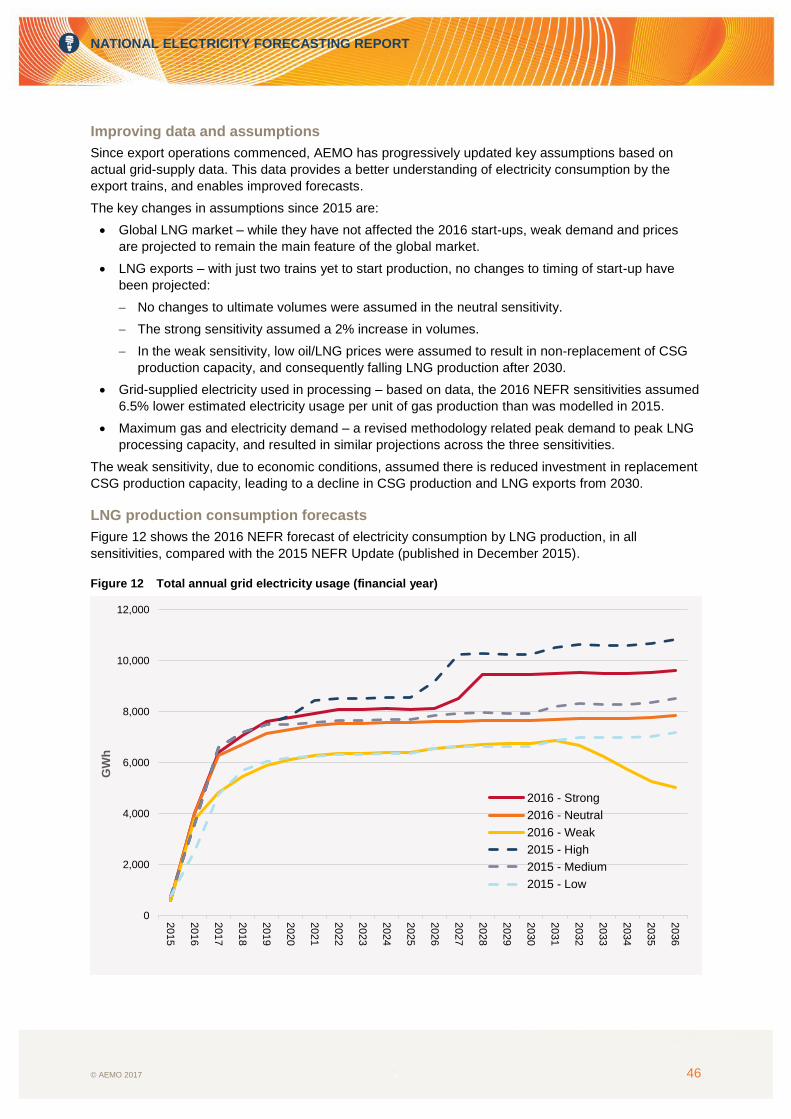
NATIONAL ELECTRICITY FORECASTING REPORT
© AEMO 2017 46
Improving data and assumptions
Since export operations commenced, AEMO has progressively updated key assumptions based on
actual grid-supply data. This data provides a better understanding of electricity consumption by the
export trains, and enables improved forecasts.
The key changes in assumptions since 2015 are:
Global LNG market – while they have not affected the 2016 start-ups, weak demand and prices
are projected to remain the main feature of the global market.
LNG exports – with just two trains yet to start production, no changes to timing of start-up have
been projected:
No changes to ultimate volumes were assumed in the neutral sensitivity.
The strong sensitivity assumed a 2% increase in volumes.
In the weak sensitivity, low oil/LNG prices were assumed to result in non-replacement of CSG
production capacity, and consequently falling LNG production after 2030.
Grid-supplied electricity used in processing – based on data, the 2016 NEFR sensitivities assumed
6.5% lower estimated electricity usage per unit of gas production than was modelled in 2015.
Maximum gas and electricity demand – a revised methodology related peak demand to peak LNG
processing capacity, and resulted in similar projections across the three sensitivities.
The weak sensitivity, due to economic conditions, assumed there is reduced investment in replacement
CSG production capacity, leading to a decline in CSG production and LNG exports from 2030.
LNG production consumption forecasts
Figure 12 shows the 2016 NEFR forecast of electricity consumption by LNG production, in all
sensitivities, compared with the 2015 NEFR Update (published in December 2015).
Figure 12 Total annual grid electricity usage (financial year)
0
2,000
4,000
6,000
8,000
10,000
12,0002015
2016
2017
2018
2019
2020
2021
2022
2023
2024
2025
2026
2027
2028
2029
2030
2031
2032
2033
2034
2035
2036
GW
h
2016 - Strong
2016 - Neutral
2016 - Weak
2015 - High
2015 - Medium
2015 - Low

NATIONAL ELECTRICITY FORECASTING REPORT
© AEMO 2017 47
5.4.2 Trends and drivers in specific business sectors
Key points
The aluminium industry has relatively little forecast change in electricity consumption, except
for the weak sensitivity, in which an increasing risk of closure is assumed by AEMO.
The black coal industry is projected to decline slowly (0.1% pa) based on survey responses.
The only significant user of electricity for desalination is the Victorian Wonthaggi plant, with
an announced 50 gigalitres (GL) water order for 2016–17.
Aluminium industry
The aluminium industry is highly energy-intensive, with the four smelters in Queensland, New South
Wales, Victoria, and Tasmania, and two alumina refineries in Queensland, using significant quantities of
both electricity and natural gas.
While electricity is an important cost input for many industries, it is particularly critical for the smelters,
which are individually the largest industrial electricity consumers in the NEM. Electricity typically
comprises one-third of the smelters’ variable costs.
When AEMO surveyed and interviewed the largest industrial users, relatively little change in electricity
consumption was forecast by the largest aluminium producers under the neutral and strong sensitivities,
and AEMO has forecast these in line with modelled manufacturing growth for each region as a whole.
In the weak case, AEMO has assumed an increasing risk of closure by most smelters across the
forecast period. This is not based on advice from large industrial users, but rather a recognition of
possible business sensitivity to adverse economic shocks and electricity price changes. AEMO notes
that it is not yet understood how possible changes in policy to achieve Australia’s 2030 emissions
reduction target could impact electricity prices, emission costs, and the aluminium industry.
Steel industry
The NEM contains large energy-intensive steelworks in Port Kembla, Whyalla, Newcastle, Sydney,
Waratah, Westernport, and Laverton. The iron and steel industry has been undergoing significant
structural change for many years. Production of crude steel has reduced from 9.7 Mt in 2003 to just
over 4.6 Mt/year in 2014.60 Over this period, production capacity has reduced significantly, exports
have largely ceased, and the industry is competing against imports for the domestic market.
There is relatively little change in electricity consumption forecast by the companies, and AEMO has
forecast these in line with modelled manufacturing growth for the relevant region as a whole.
Under the weak sensitivity, AEMO has assumed an increasing risk of business closure.
Coal industry
Based on advice from AEMO’s business surveys and interviews with business representatives, AEMO
has forecast 1% growth for the coal mining industry in 2015–16, followed by no growth for three years,
and then for the duration of the forecast period, growth of:
0.5% pa in the neutral sensitivity.
1.5% pa in the strong sensitivity.
-0.5% in the weak sensitivity.
This has been adjusted based on expected mine closures and additions revealed from the surveys.
Overall, the small underlying annual growth in the neutral sensitivity is offset by step reductions from the
surveys leading to minor forecast decline (0.1% pa).
60 Original data from the World Steel Association: http://www.worldsteel.org/statistics/statistics-archive/yearbook-archive.html. This data published
by https://knoema.com/SSY2014/steel-statistical-yearbook-2015?country=1001560-australia.

NATIONAL ELECTRICITY FORECASTING REPORT
© AEMO 2017 48
Automotive manufacturing industry
Closures of automotive vehicle manufacturing are expected to continue, with the announced exits of
GM Holden and Toyota by 2017–18.61 AEMO has incorporated the impact of this trend into the forecast
model as a post-model adjustment. The total impact is estimated to be 524 GWh of consumption,
predominantly in Victoria and South Australia.
Other manufacturing industry
AEMO has adjusted forecasts to account for the following trends that it concluded as an outcome of its
2016 business survey and interview process:
Likely reduction in Australian newsprint production over the forecast period.
Basic chemical manufacturers which are gas-intensive (such as producers of fertilisers and
ammonium nitrate) being challenged by gas price increases as well as downturns in some of their
markets, such as the mining industry.
Construction and domestic-focused infrastructure being likely to perform reasonably over the
medium term.
The continuing drive to reduce costs through cost-cutting and imports, which is expected to result
in continuing productivity gains in consumption per unit of product produced.
Desalination plants
There are currently four major seawater reverse osmosis desalination plants in NEM regions. With the
exception of Victoria’s Wonthaggi desalination plant62, all others are currently in maintenance mode.
The level of water required for desalination depends more on climatic conditions then on economic
growth (although the latter does have impact through population growth and non-residential usage). As
a result, AEMO has used the same assumptions for the neutral, strong, and weak sensitivities in all
regions, except Victoria. Different demand assumptions have been made for Victoria, based on different
population growth assumptions and in consultation with the Victorian water authorities.
5.4.3 Business electricity price trends
Key points
Business electricity price forecasts follow similar trends to the residential sector, with three
distinct periods of projected price change:
Small reductions in prices until 2020.
Moderate increases in prices from 2020 to 2030.
No significant price change after 2030.
Projected price increases during 2020 to 2030 are forecast to reduce electricity
consumption. There is no forecast change in consumption before 2020.
Across most states, the highest rate of growth in business retail prices is projected to be in
the industrial sector.
AEMO’s forecast of retail electricity prices is based on advice from Jacobs.63
61 ABC News, “Toyota to close: Thousands of jobs to go as carmaker closes Australian plants by 2017” (2014). Available at:
http://www.abc.net.au/news/2014-02-10/toyota-to-pull-out-of-australia-sources/5250114. Viewed: 2 June 2016. 62 Aquasure Media Release, “Victorian Desalination Project called into service”, 8 March 2016. Available at:
https://www.aquasure.com.au/uploads/files/water%20order-1457491174.pdf. Viewed: 2 June 2016. 63 Available at: http://www.aemo.com.au/Electricity/Planning/Forecasting.

NATIONAL ELECTRICITY FORECASTING REPORT
© AEMO 2017 49
Price trend forecasts
Forecast trends in business electricity64 retail prices are shown in Figure 13 and Figure 14. These retail
price trends are similar to forecasts for the residential sector, and generally show three periods of
distinct price change:
Business retail prices are forecast to decline up to 2020, due to projected reduced network tariffs
and lower wholesale prices.
From 2020, the wholesale component of the retail bill is projected to rise as a possible outcome of
the achievement of Australia’s emission abatement targets. These projected price increases are
expected to further lower consumption due to higher energy bills, but this is expected to be offset
by energy efficiency improvements.
Beyond 2030 prices remain stable.
Across most states, the highest rate of growth in business retail prices is forecast to occur for large
business. This is due to the higher contribution of the wholesale component costs to these consumers,
as wholesale costs are projected to grow faster than other cost components.
Figure 13 Electricity prices – small business: historical and forecast (Real, Dec 2015)
64 Shown for small businesses (annual consumption less than 10 MWh (12 MWh in Tasmania and Victoria)) and large businesses
(>1000 MWh/year).
$0
$50
$100
$150
$200
$250
$300
1981
1983
1985
1987
1989
1991
1993
1995
1997
1999
2001
2003
2005
2007
2009
2011
2013
2015
2017
2019
2021
2023
2025
2027
2029
2031
2033
2035
2037
Avera
ge
an
nu
al re
tail
pri
ce, $/M
Wh
QLD Small Business NSW Small Business VIC Small Business
SA Small Business TAS Small Business

NATIONAL ELECTRICITY FORECASTING REPORT
© AEMO 2017 50
Figure 14 Electricity prices – large business: historical and forecast (Real, Dec 2015)
5.5 Small non-scheduled generation forecast Small non-scheduled generation (SNSG) is a group of smaller generators in the NEM, which are
typically either:
Connected to the distribution networks.
Embedded behind the meter at commercial or industrial premises. Depending on the load, the
SNSG may either be net exporting to or importing from the grid.
When calculating operational consumption, energy supplied by SNSG is subtracted from residential and
business sector consumption.
AEMO has this year reviewed the list of generators making up the current SNSG fleet, and made some
adjustments to capture retired generators, newly commissioned units, and units which may already be
captured though net metering of the load it is embedded under.
The SNSG forecast to 2035–36 is split into two components:
PV installations above 100 kW but below 30 MW. This is assumed to grow at the same rate as the
commercial rooftop PV forecast. In previous years, this has been part of the rooftop PV forecast
and not included as SNSG. Including it as SNSG provides better visibility of different segments of
PV growth.
A range of different technologies, such as small-scale wind power, hydro power, gas or biomass
based cogeneration, generation from landfill gas or wastewater treatment plants, and smaller
peaking plants or emergency backup generators. AEMO has used announced retirements of
capacity to adjust forecast capacity, for each NEM region, for each technology. The forecast
capacity was converted into annual energy generation projections, based on historical capacity
factors for these technologies in each region. Similarly, the forecast impact on maximum and
minimum demand was calculated based on the technologies’ historical generation at time of
maximum or minimum demand.65
65 For maximum demand, the top 10 highest demand half-hours each year were used to calculate the average generation at time of maximum
demand. For minimum demand, the bottom 10 demand periods were used.
$0
$50
$100
$150
$200
$250
1981
1983
1985
1987
1989
1991
1993
1995
1997
1999
2001
2003
2005
2007
2009
2011
2013
2015
2017
2019
2021
2023
2025
2027
2029
2031
2033
2035
2037
Avera
ge
an
nu
al re
tail
pri
ce, $/M
Wh
QLD Large Business NSW Large Business VIC Large Business
SA Large Business TAS Large Business

NATIONAL ELECTRICITY FORECASTING REPORT
© AEMO 2017 51
Figure 15 shows the combined forecast for SNSG annual generation in GWh, and compares it with the
2015 forecast.
Figure 15 SNSG forecast for 2016 compared with the forecast from 2015
The differences in the two forecasts in the historical years 2006–16 is due the revision of units making
up the SNSG component of the forecast.
For the year 2016, the current forecast is under last year’s forecast as lower water reserves in
Tasmania limit SNSG generation from that region.
The inclusion of rooftop PV in this year’s forecast causes total forecast SNSG generation to grow much
more throughout the forecast period than in the previous forecast. It is forecast to reach 7,110 GWh by
2035–36. Last year’s forecast was flat in the later years, reaching just 4,361 GWh of annual generation
across the NEM by the end of the 20-year forecast period.
Wind power and landfill gas is expected to grow at a slow rate in all states, though with some initial
reduction in landfill gas generating capacity in South Australia due to low utilisation of existing capacity.

NATIONAL ELECTRICITY FORECASTING REPORT
© AEMO 2017 52
APPENDIX A. SENSITIVITIES SUMMARY
These weak, neutral and strong sensitivity assumptions were modelled in the 2016 NEFR and are now
being used in all AEMO major reports.
Type Weak Neutral (most probable) Strong
Economy Variable Weak Neutral Strong
Consumer Variable Low confidence, less
engaged Average confidence and
engagement High confidence, more
engaged
Population Variable Low (ABS) Medium (ABS) High (ABS)
Electricity network charge over 5 years
Fixed Current AER determinations, fixed after 5 years
Gas network charge over 5 years
Fixed Current AER determinations, fixed after 5 years
Electricity network charges – long run
Fixed Constant real
Gas network charges – long run
Fixed Constant real
Retail costs and margins
Fixed Assume current margins throughout
Tariff structure
Fixed Same as current
LRET/SRES
Fixed Assume current to 2020, with LGCs/SSTC deemable to 2030
Weather
Fixed Neutral weather assumption for consumption forecasts, probabilistic weather settings for peak demand
Rainfall- Hydro generation
Fixed Median value for water availability (last 15 years)
LNG growth
Fixed Australian LNG export growth per oil price projections
Oil prices / gas prices
Variable UD30/bbl (BR) with pricing affecting the industry as existing
contracts expire
UD60/bbl (BR) with pricing affecting the industry as existing
contracts expire
UD90/bbl (BR) with pricing affecting the industry as existing
contracts expire
Electricity wholesale prices
Variable As per the supply-side impact of this sensitivity. Assumes some abatement cost affecting end-user prices
Electricity demand Variable Based on end-point consumption (behind the meter), translated back to the grid
Other policy and regulatory settings affecting electricity prices
Fixed Status quo
Technology uptake Variable Hesitant consumer, weak
economy Neutral consumer, neutral economy
Confident consumer, strong economy
Energy efficiency (EE) Variable Policy measures deliver
lower uptake of EE Policy measures deliver medium uptake of EE
Policy measures deliver high uptake of EE
Energy efficiency rebound
Variable 20% for business EE
10% for residential EE (0% for SA.)
20% assumed for all 20% for business EE
30% for residential EE (45% for SA)
Technology cost and uptake curve
Variable Technology cost and uptake curve
assumptions for weak economy, low consumer confidence/engagement
Median technology cost and uptake curve
assumptions
Technology cost and uptake curve
assumptions for strong economy, high consumer confidence/engagement
Climate policy up to 2030 Fixed Assume Australia’s Paris commitment is achieved

NATIONAL ELECTRICITY FORECASTING REPORT
© AEMO 2017 53
Type Weak Neutral (most probable) Strong
Climate policy post 2030 Fixed 2030 status quo maintained to 2040, but including announced coal plant closures
post 2030
Climate policy impacts (energy prices)
Fixed Sensitivity assumes most of the abatement cost is delivered through the pricing mechanism of the industry.
AEMO has assumed proxy emissions abatement prices as a way of introducing an approximate valuation of the cost of achieving the 2030 emissions target into the models. In this scenario, a proxy emissions abatement price of $25/tonne CO2-e in 2020 rising to $50/tonne CO2-e by 2030.
Emissions Intensive Trade Exposed Industry pays only 20% of this cost in 2020, rising to 100% in 2030.
Sensitivity assumes most abatement cost is delivered through the pricing mechanism of the industry.
AEMO has assumed proxy emissions abatement prices as a way of introducing an approximate valuation of the cost of achieving the 2030 emissions target into the models. In this scenario, a proxy emissions abatement price of $25/tonne CO2-e in 2020 rising to $50/tonne CO2-e by 2030.
Emissions Intensive Trade Exposed Industry pays only 20% of this cost in 2020, rising to 100% in 2030.
Climate policy impacts (plant shut downs and generation replacement)
Fixed Fossil fuel plant shut-down list informs sensitivity, assumes 2030 targets are achieved. Announced shutdowns beyond 2030 assumed in sensitivity.
Technology replacement options do not include coal and are least cost
Climate policy impacts (other)
Fixed Energy efficiency initiatives consistent with National Energy Productivity Plan
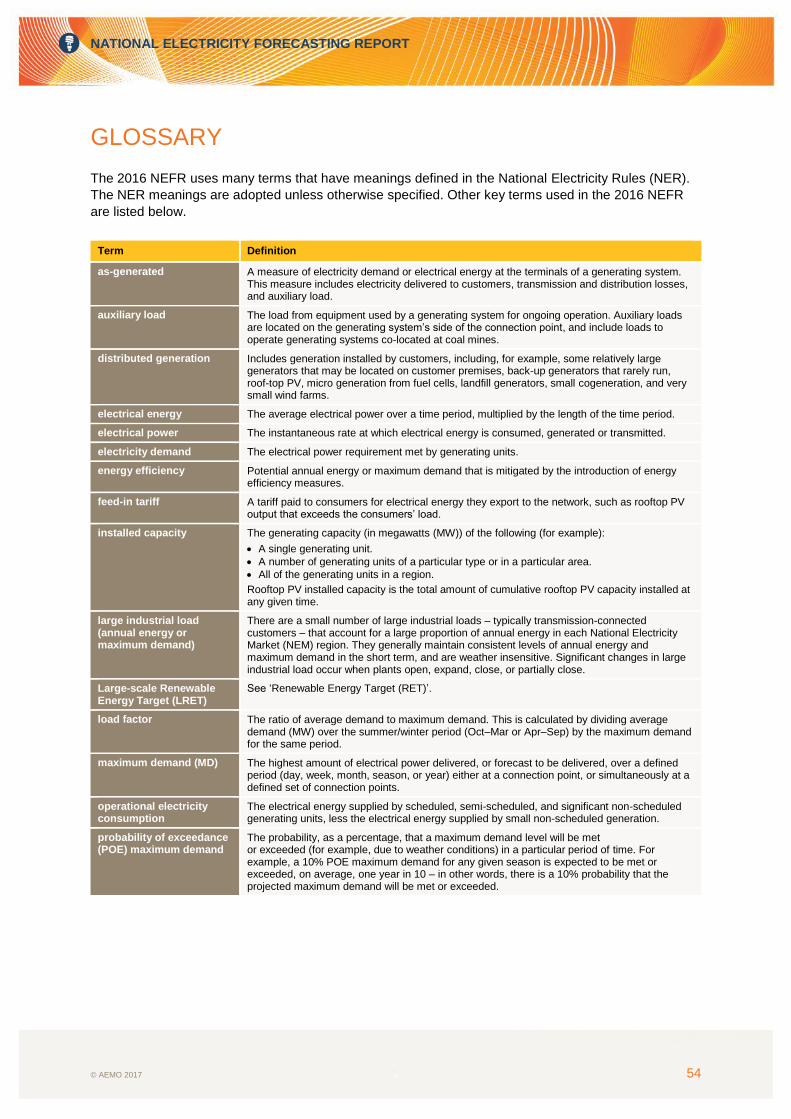
NATIONAL ELECTRICITY FORECASTING REPORT
© AEMO 2017 54
GLOSSARY
The 2016 NEFR uses many terms that have meanings defined in the National Electricity Rules (NER).
The NER meanings are adopted unless otherwise specified. Other key terms used in the 2016 NEFR
are listed below.
Term Definition
as-generated A measure of electricity demand or electrical energy at the terminals of a generating system. This measure includes electricity delivered to customers, transmission and distribution losses, and auxiliary load.
auxiliary load The load from equipment used by a generating system for ongoing operation. Auxiliary loads are located on the generating system’s side of the connection point, and include loads to operate generating systems co-located at coal mines.
distributed generation Includes generation installed by customers, including, for example, some relatively large generators that may be located on customer premises, back-up generators that rarely run, roof-top PV, micro generation from fuel cells, landfill generators, small cogeneration, and very small wind farms.
electrical energy The average electrical power over a time period, multiplied by the length of the time period.
electrical power The instantaneous rate at which electrical energy is consumed, generated or transmitted.
electricity demand The electrical power requirement met by generating units.
energy efficiency Potential annual energy or maximum demand that is mitigated by the introduction of energy efficiency measures.
feed-in tariff A tariff paid to consumers for electrical energy they export to the network, such as rooftop PV output that exceeds the consumers’ load.
installed capacity The generating capacity (in megawatts (MW)) of the following (for example):
A single generating unit.
A number of generating units of a particular type or in a particular area.
All of the generating units in a region.
Rooftop PV installed capacity is the total amount of cumulative rooftop PV capacity installed at any given time.
large industrial load (annual energy or maximum demand)
There are a small number of large industrial loads – typically transmission-connected customers – that account for a large proportion of annual energy in each National Electricity Market (NEM) region. They generally maintain consistent levels of annual energy and maximum demand in the short term, and are weather insensitive. Significant changes in large industrial load occur when plants open, expand, close, or partially close.
Large-scale Renewable Energy Target (LRET)
See ‘Renewable Energy Target (RET)’.
load factor The ratio of average demand to maximum demand. This is calculated by dividing average demand (MW) over the summer/winter period (Oct–Mar or Apr–Sep) by the maximum demand for the same period.
maximum demand (MD) The highest amount of electrical power delivered, or forecast to be delivered, over a defined period (day, week, month, season, or year) either at a connection point, or simultaneously at a defined set of connection points.
operational electricity consumption
The electrical energy supplied by scheduled, semi-scheduled, and significant non-scheduled generating units, less the electrical energy supplied by small non-scheduled generation.
probability of exceedance (POE) maximum demand
The probability, as a percentage, that a maximum demand level will be met or exceeded (for example, due to weather conditions) in a particular period of time. For example, a 10% POE maximum demand for any given season is expected to be met or exceeded, on average, one year in 10 – in other words, there is a 10% probability that the projected maximum demand will be met or exceeded.

NATIONAL ELECTRICITY FORECASTING REPORT
© AEMO 2017 55
Term Definition
Renewable Energy Target (RET)
The national Renewable Energy Target (RET) scheme, which commenced in January 2010, aims to meet a renewable energy target of 20% by 2020. Like its predecessor, the Mandatory Renewable Energy Target (MRET), the national RET scheme requires electricity retailers to source a proportion of their electricity from renewable sources developed after 1997.
The national RET scheme is currently structured in two parts:
Small-scale Renewable Energy Scheme (SRES), which is a fixed price, unlimited-quantity scheme available only to small-scale technologies (such as solar water heating) and is being implemented via Small-scale Technology Certificates (STC).
Large-scale Renewable Energy Target (LRET), which is being implemented via Large-scale Generation Certificates (LGC), and targets 41,000 GWh of renewable energy by 2020.
rooftop photovoltaic (PV) systems
A system comprising one or more photovoltaic panels, installed on a residential or commercial building rooftop, to convert sunlight into electricity.
Scenario or sensitivity A consistent set of assumptions used to develop forecasts of demand, transmission, and supply.
sent-out A measure of demand or energy (in megawatts (MW) or megawatt hours (MWh), respectively) at the connection point between the generating system and the network. This measure includes consumer load and transmission and distribution losses.
Small-scale Renewable Energy Scheme (SRES)
See ‘Renewable Energy Target (RET)’.
Summer Unless otherwise specified, refers to the period 1 November – 31 March in the same financial year for all regions except Tasmania. For Tasmania only, it includes the period 1 December – 28 February in the same financial year.
transmission losses Electrical energy losses incurred in transporting electrical energy through a transmission network.
Winter Unless otherwise specified, refers to the period 1 June–31 August in the same calendar year (for all regions).