national geospatial-intelligence activities (intel-0004)/67531/metadc15325/m2/1/high... ·...
TRANSCRIPT

National Geospatial-Intelligence Activities (INTEL-0004)
Candidate Recommendation: Close National Geospatial-Intelligence Agency (NGA) Dalecarlia and Sumner sites, Bethesda, MD; Reston 1, 2 and 3, leased installations in Reston, VA; Newington buildings 8510, 8520, and 8530, Newington, VA; and Building 213 a leased installation at the South East Federal Center, Washington, DC. Relocate all functions to a new facility at Fort Belvoir, VA. Realign the National Reconnaissance Office (NRO) facility, Westfields, VA, by relocating all NGA functions to a new facility at the Fort Belvoir, VA. Consolidate all NGA National Geospatial-Intelligence College functions on Fort Belvoir into the new facility at Fort Belvoir, VA. Justification: This recommendation is a strategic consolidation of the personnel, equipment and functions of NGA’s 22 legacy organizations into a new geospatial intelligence consolidated campus. It consolidates multiple NGA National Capital Region-based intelligence community activities now occupying small, government facilities and privately-owned leased space to a secure Department of Defense-owned location, reducing excess capacity and increasing overall military value. It optimizes mission efficiencies, improves readiness and enhances mission-partner coordination, while addressing Antiterrorism/Force Protection deficiencies. This recommendation accommodates current and surge requirements and is consistent with the 20-year Force Structure Plan. Payback: The total estimated one-time cost to the Department of Defense to implement the recommendation is $1,117.3M. The net of all costs and savings to the Department of Defense during the implementation period is a cost of $796.7M. Annual recurring savings to the Department after implementation are $127.7M with a payback expected in 8 years. The net present value of the costs and savings to the Department over 20 years is a savings of $535.1M. Economic Impact on Communities: Assuming no economic recovery, this recommendation could result in a maximum potential reduction of 5,260 jobs (2,833 direct and 2,427 indirect jobs) over the 2006-2011 period in the Bethesda-Frederick-Gaithersburg MD Metropolitan Division, which is approximately 0.7% of economic area employment. The economic impact of all recommended actions on this economic region of influence was considered and is at Appendix B of Volume I. Community Infrastructure: A review of community attributes indicates there are no issues regarding the ability of the infrastructure of the communities to support missions, forces, and personnel. There are no known community infrastructure impediments to implementation of all recommendations affecting the installation in this recommendation. Environmental Impact: This recommendation has a moderate impact on air quality at Fort Belvoir. This recommendation has the potential to impact historic properties at Fort
DCN: 1704
Belvoir. A minimal impact on cultural/historic resources is expected at the Sumner and Dalecarlia sites. Surveys and consultation with the State Historic Preservation Office may be required. Additional operations at Fort Belvoir may further impact threatened and endangered species, leading to additional restrictions on training or operations. This recommendation has no impact on dredging; land use constraints or sensitive resource areas; marine mammals, resources, or sanctuaries; noise; waste management; water resources; or wetlands. This recommendation will require spending approximately $1.7M for environmental compliance activities. This cost was included in the payback calculation. This recommendation does not otherwise impact the costs of environmental restoration, waste management, or environmental compliance activities. The aggregate environmental impact of all recommended BRAC actions affecting the base in this recommendation has been reviewed. There are no known environmental impediments to implementation of this recommendation.

CRITERIA 1-4: • Force Structure Capabilities: The Intelligence Joint Cross-Service Group (IJCSG)
scenarios have been constructed to accommodate the current and surge requirements. NGA manpower levels remain stable through Fiscal Year 2011 and end strength levels as reported in the 20-year Force Structure Plan remain relatively flat. Therefore, we find that this recommendation is consistent with the 20-year Force Structure Plan.
• Military Value Analysis Results: The Defense Intelligence Community’s functions
are very broad and diverse. Addressing each of these functions individually would result in an unworkable number of scoring plans that would not be representative of the military value of the facilities performing the functions. The IJCSG used a single scoring plan to achieve the BRAC 2005 goal of looking across the Defense Intelligence Community to optimize efficiencies and consolidate or collocate where appropriate. Binning/clustering of facilities was conducted based on Analytical Frameworks (Minimize Vulnerable Commercial Leased Space, Improve (Continuity of Operations (COOP) and Mission Assurance, Align Joint Reserve Intelligence Centers (JRICs), Improve Information Flow and Mission Synergy, Align Intelligence Education and Training, Consolidate Department of Defense Security Central Adjudication Facilities and on statistical analysis of facility attributes in the military value scoring plan. These attributes were grouped in two attribute categories: the Physical Infrastructure Attribute Category (Facility Capability, Facility Condition, Survivability/Force Protection, Specialized Equipment, Ownership/Type Space) and the Location Attribute Category (Geophysical Constraints, Mission Assurance/COOP, Buildable Land, Human & Intellectual Capital, Geographic and Professional Relationships, Economic Cost of Location). The IJCSG also looked at facilities with a low overall Military Value score. Results of this analysis support the strategy-driven scenarios being considered, but did not identify any additional data-driven scenarios. The optimization tool was not used to maximize Military Value because capacity analysis determined there was no overall excess capacity in the Defense Intelligence Community.
The results of the Military Value Scoring Plan is a “1 to 267” listing of intelligence facilities that is predominantly a reflection of a facility’s condition performing its current intelligence mission. Based on military judgment, only those buildings which directly support the intelligence function are included in the IJCSG Military Value Report. Military Value scores for those buildings ranged from a low of 7.16 to a high of 66.16 and are reported in the Draft IJCSG Military Value Report dated April 13, 2005.
This recommendation addresses several issues identified during the IJCSG military value analysis of intelligence facilities. First, it addresses the low overall military value scores of the NGA Newington, VA, Fort Belvoir, VA, and Bethesda, MD

Dalecarlia site facilities. Second, it replaces all five NGA facilities reported as Category 3, substandard and not economically or justifiably repairable. Last, it addresses three NGA facilities that ranked low in survivability with identified Antiterrorism/Force Protection vulnerabilities. Because this recommendation relocates all NGA functions to a new facility, at a location that does not currently perform intelligence functions, the relative military value scores of the locations currently performing those functions was not determinative, rather military judgment was the deciding factor in reaching this recommendation. Military Judgment considerations were deliberated within the following context: BRAC Transformational Options (TO) Goals - This recommendation supports
three of the BRAC transformational goals. First, it supports minimizing leased space across the United States (US) and movement of organizations residing in leased space to Department of Defense-owned space (TO-14) by eliminating just under 1 million square feet of leased space (almost a third of the leased space identified by the Intelligence Joint Cross-Service Group (IJCSG) in the National Capital Region (NCR)) with an annual lease savings of over $32 million. Second, it supports collocation of functions and headquarters into a “Joint Campus” to enhance interoperability and reduce costs (TO-53) saving $127.8M annually and greatly enhancing NGA’s geospatial intelligence training and analysis functions. It also eliminates redundant, costly infrastructures associated with geospatial intelligence analysis. Third, it consolidates NCR intelligence community activities now occupying small, government facilities and privately owned leased space to fewer, secure, Department of Defense-owned locations in the region (TO-59).
Relocation of Defense Intelligence Agencies Outside the NCR - The IJCSG
considered relocating the NGA outside of the NCR. This idea was rejected based on the following IJCSG Principals military judgment considerations:
o NGA needs to be in close physical proximity to its mission partners
for systems acquisition and operation. The National Reconnaissance Office (NRO) is responsible for acquisition and operation of assets needed for control, tasking and processing of space-based imaging systems. NGA is responsible for the acquisition and operation of assets used for dissemination and exploitation of processed data. Extremely close coordination is required to ensure the systems (space- and ground-based) all work together to support the full tasking, processing, exploitation, and dissemination of geospatial intelligence data.
o NGA also has a requirement to be in close proximity to its national
intelligence customers to support national intelligence analysis operations. Relocating NGA outside the NCR will greatly increase the cost of NGA support for, and maintenance of, infrastructure needed by
these national customers. Additionally, augmentation of NGA national customers (a frequent occurrence) from afar will be extremely costly.
o NGA already maintains over 35% of its personnel outside of the NCR,
primarily at its west campuses in St. Louis, MO. The IJCSG agreed that moving additional NGA resources outside of the NCR would place at risk a considerable amount of intelligence talent and experience currently residing within the NCR. This expertise could not be replaced in the short term and would have a devastating impact on NGA’s ability to complete its national intelligence mission. Also, it would place at risk the excellent contractor base with their multi-intelligence and multi-agency skills (NGA’s employee base is evenly split between government personnel and contractors).
o NGA would incur significant additional infrastructure costs to move
outside the NCR. Support for new, robust, expensive communications and geospatial intelligence-specific infrastructures needed to conduct geospatial intelligence analysis at a location outside the NCR would be extremely costly as the support within the NCR could not maintain both systems during parallel operations required for such a move. This support would need to be replicated at the new location and sustained over the two year transition period.
INT-0004 consolidates NGA at the Fort Belvoir, VA. It collocates the majority of
the NCR-based NGA functions with those portions of the Agency that are geographically constrained at Fort Belvoir, VA. From a military judgment perspective, the IJCSG decided that Fort Belvoir, VA represents the best location for NGA’s consolidated campus based on enhancements to mission effectiveness and personnel support
o This scenario consolidates the geo-graphically constrained elements with the remainder of the NGA NCR-based assets and enables a robust communications infrastructure. Specifically, this consolidation allows for synergy between the analysts performing different phases of intelligence and collocates the analysts with the NGA office that coordinates acquisition of their data. Moving imagery requires a great deal of communications throughput. Locating to Fort Belvoir, VA, shortens the required wide-area network lines of communication (greatly lessens costs) and capitalizes on Fort Belvoir’s inclusion in the Global Information Grid Bandwidth Expansion program. This recommendation also does not increase the distance to NGA’s mission partner, the NRO. Very close coordination is needed to keep the research and development and acquisition of space-based systems compatible with those of the ground-based geospatial-intelligence infrastructure.

This recommendation also provided for better support to NGA personnel. Collocating NGA with its Fort Belvoir, VA-based geographically constrained personnel maximizes support efficiency by consolidating personnel support offices, training equities required at every location occupied by analysts, and providing additional military support functions to NGA personnel and students. It also minimizes the risk of losing a considerable amount of intelligence talent and experience currently residing within the NCR as Fort Belvoir, VA, is located central to NGA’s current facilities. This site also offers sufficient land for any future expansion that may be needed, frees several old buildings at Fort Belvoir, VA for potential BRAC action, and addresses the need for NGA to vacate Building 213 at the SEFC by 2007 per GSA request (necessary for the completion of a major Department of Transportation relocation project).
NOTE: The Military Value list of facilities for the Intelligence Joint Cross-Service Group is classified and held separately. This report is available upon request to members of the Commission and Congress with the appropriate security clearances and accesses.

• Capacity Analysis Results: Capacity information shown below is taken from the Draft Intelligence Joint Cross-Service Group Capacity Analysis Report dated April 13, 2005. Department of Defense Agencies and Military Departments provided the initial data to identify square footage and personnel authorized for the accomplishment of intelligence functions at each existing location. Current Capacity was determined by identifying total useable square footage (owned, leased, or controlled by the Department of Defense) being used to perform the intelligence functions. Current Usage was computed by adding the space needs for personnel occupying the facilities to the space needed for specialized equipment and administrative support space (determined by the number of people occupying the facility). In computing the space needs of personnel occupying each facility; the IJCSG developed an algorithm by applying military judgment to Department of Defense Instruction 5035.5 space allocation standards. The difference between the Current Usage and Current Capacity was identified as excess space. The optimization tool was not used to minimize Excess Capacity because capacity analysis determined there was no overall excess capacity in the Defense Intelligence Community.
Due to a lack of space, the Intelligence Community primarily handles surge operations by reassigning and reallocating existing resources within the current available square footage. The Intelligence Community also flexes to increase 24x7 support by reallocating existing personnel from traditional first shift operations and bringing in a limited number of new personnel (reservists, annuitants, contractors with appropriate expertise and clearances). Therefore, for the purpose of this analysis, the Intelligence Joint Cross-Service Group defined Surge Capacity to be zero square feet.
This recommendation addresses the excess capacity resulting from the creation of the National Imagery and Mapping Agency (now NGA) by eliminating all of the over 176K gross square feet of current NGA excess capacity (over 10% of all leased space the IJCSG identified in the NCR). Additionally, it lessens the 210K square foot capacity shortfall identified in the draft IJCSG Capacity Analysis Report dated April 13, 2005, at the NRO’s Westfield, VA facility.
• NOTE: The Capacity Analysis list of facilities for the Intelligence Joint Cross-Service Group is classified and held separately. This report is available upon request to members of the Commission and Congress with the appropriate security clearances and accesses.

• Other Environmental Considerations: For those scenarios where the losing installation is leased property, the scenario proponent may assume, absent data to the contrary that the owner of that property will continue to lease it for similar purposes, and as such, departing such leased location will not adversely impact the environment. Furthermore, the owner of the leased property will become responsible for all environmental restoration, waste management, and environmental compliance at the leased location upon termination of the lease. The scenario proponent may assume that the closure or realignment scenario will not result in costs related to environmental restoration, waste management, and environmental compliance, unless the lease expressly requires such activities before the lease may be terminated (in which case these costs should be included in the summary). Absent any such lease requirements, the scenario proponent need only request that a summary of Scenario Environmental Impacts be completed by the Military Department or DLA for the gaining installation.
Based on the above guidance, the following leased locations do not have a Criterion 8 report: NGA Reston, VA (Leased, Buildings 1, 2, and 3) - Building 3 is under construction to accommodate personnel currently at NGA Dulles North, VA, a leased location where the lease is expiring. NGA Newington, VA (Contracted; Buildings 8510, 8520, and 8530) NGA at NRO Westfields, VA (Inter Service Support Agreement) NGA at GSA’s South East Federal Center, Washington D.C. (Lease, Building 213)

Criteria 5: COBRA Reports
Enclosures: 1. COBRA Realignment Summary Report (Classified – Not Included) 2. COBRA Personnel Summary Report (Classified – Not Included) 3. COBRA Personnel Yearly Percentages Report (Classified – Not Included) 4. COBRA Personnel Impact Report (Classified – Not Included) 5. COBRA Sustainment/Recap/BOS/Housing Change Report 6. Total COBRA One-Time Cost Report 7. COBRA Net Present Values Report 8. Total COBRA Military Construction Assets Report 9. COBRA Input Data Report (Classified – Not Included) 10. Scenario Error Report 11. COBRA Economic Impact Report (Classified – Not Included) 12. Total COBRA Realignment Detail Report (Classified – Not Included) 13. COBRA Personnel/SF/Sustainment/Recap/BOS Deltas Report (Classified
– Not Included)

National Geospatial-Intelligence Agency Activities Intelligence Joint Cross-Service Group Recommendation INTEL-0004
COBRA CBR Files
COBRA CBR files for this recommendation are classified and cannot be sanitized or extracted in an unclassified version. Classified COBRA CBR files are available upon request to members of the Commission and Congress with the appropriate security clearances and accesses.

• Treatment of Fort Belvoir in Cost Analysis: Facilities directly associated with this candidate recommendation are included in the analysis. The IJCSG directed, that for COBRA purposes, analysis be based on the Fort Belvoir Engineer Proving Ground. NGA, as a national intelligence agency, does not require base operating support from the Army. The Engineer Proving Ground, located about two miles from Fort Belvoir, VA, main post and not sharing base infrastructure, allows for a stand-alone enclave utilizing county infrastructure. Therefore, COBRA costing assumes Fort Belvoir Engineer Proving Ground and is calculated using NGA base operations support and sustainment figures.

COBRA SUSTAINMENT/RECAP/BOS/HOUSING CHANGE REPORT (COBRA v6.10) Data As Of 5/3/2005 3:55:37 PM, Report Created 5/4/2005 1:02:56 PM Department : Intelligence JCSG Option Pkg Name: INT-0004 Std Fctrs File : C:\COBRA 6.10\BRAC2005.SFF Net Change($K) 2006 2007 2008 2009 2010 2011 Total Beyond -------------- ---- ---- ---- ---- ---- ---- ----- ------ Sustain Change 0 0 0 2,455 4,920 887 8,262 242 Recap Change -2,568 -2,568 -2,568 -2,568 -2,568 -2,842 -15,683 -2,842 BOS Change 0 0 0 0 0 -29,393 -29,393 -29,393 Housing Change 0 0 0 0 0 0 0 0 -------------------------------------------------------------------------------------------------------------- TOTAL CHANGES -2,568 -2,568 -2,568 -113 2,352 -31,349 -36,814 -31,993 NGA Bethesda, MD (TEMPBASE) Net Change($K) 2006 2007 2008 2009 2010 2011 Total Beyond -------------- ---- ---- ---- ---- ---- ---- ----- ------ Sustain Change 0 0 0 0 0 -3,653 -3,653 -4,298 Recap Change -2,568 -2,568 -2,568 -2,568 -2,568 -2,568 -15,408 -2,568 BOS Change 0 0 0 0 0 -29,313 -29,313 -29,313 Housing Change 0 0 0 0 0 0 0 0 -------------------------------------------------------------------------------------------------------------- TOTAL CHANGES -2,568 -2,568 -2,568 -2,568 -2,568 -35,534 -48,374 -36,179 NGA Reston, VA (TEMPBASE) Net Change($K) 2006 2007 2008 2009 2010 2011 Total Beyond -------------- ---- ---- ---- ---- ---- ---- ----- ------ Sustain Change 0 0 0 0 0 0 0 0 Recap Change 0 0 0 0 0 0 0 0 BOS Change 0 0 0 0 0 0 0 0 Housing Change 0 0 0 0 0 0 0 0 -------------------------------------------------------------------------------------------------------------- TOTAL CHANGES 0 0 0 0 0 0 0 0 NGA Newington, VA (TEMPBASE) Net Change($K) 2006 2007 2008 2009 2010 2011 Total Beyond -------------- ---- ---- ---- ---- ---- ---- ----- ------ Sustain Change 0 0 0 0 0 0 0 0 Recap Change 0 0 0 0 0 0 0 0 BOS Change 0 0 0 0 0 0 0 0 Housing Change 0 0 0 0 0 0 0 0 -------------------------------------------------------------------------------------------------------------- TOTAL CHANGES 0 0 0 0 0 0 0 0 NGA Dulles, VA (TEMPBASE) Net Change($K) 2006 2007 2008 2009 2010 2011 Total Beyond -------------- ---- ---- ---- ---- ---- ---- ----- ------ Sustain Change 0 0 0 0 0 0 0 0 Recap Change 0 0 0 0 0 0 0 0 BOS Change 0 0 0 0 0 0 0 0 Housing Change 0 0 0 0 0 0 0 0 -------------------------------------------------------------------------------------------------------------- TOTAL CHANGES 0 0 0 0 0 0 0 0

COBRA SUSTAINMENT/RECAP/BOS/HOUSING CHANGE REPORT (COBRA v6.10) - Page 2 Data As Of 5/3/2005 3:55:37 PM, Report Created 5/4/2005 1:02:56 PM Department : Intelligence JCSG Option Pkg Name: INT-0004 Std Fctrs File : C:\COBRA 6.10\BRAC2005.SFF NGA College, VA (TEMPBASE) Net Change($K) 2006 2007 2008 2009 2010 2011 Total Beyond -------------- ---- ---- ---- ---- ---- ---- ----- ------ Sustain Change 0 0 0 0 0 -379 -379 -379 Recap Change 0 0 0 0 0 -274 -274 -274 BOS Change 0 0 0 0 0 -81 -81 -81 Housing Change 0 0 0 0 0 0 0 0 -------------------------------------------------------------------------------------------------------------- TOTAL CHANGES 0 0 0 0 0 -734 -734 -734 NGA Bldg 213 SEFC, DC (TEMPBASE) Net Change($K) 2006 2007 2008 2009 2010 2011 Total Beyond -------------- ---- ---- ---- ---- ---- ---- ----- ------ Sustain Change 0 0 0 0 0 0 0 0 Recap Change 0 0 0 0 0 0 0 0 BOS Change 0 0 0 0 0 0 0 0 Housing Change 0 0 0 0 0 0 0 0 -------------------------------------------------------------------------------------------------------------- TOTAL CHANGES 0 0 0 0 0 0 0 0 NRO Westfields, VA (TEMPBASE) Net Change($K) 2006 2007 2008 2009 2010 2011 Total Beyond -------------- ---- ---- ---- ---- ---- ---- ----- ------ Sustain Change 0 0 0 0 0 0 0 0 Recap Change 0 0 0 0 0 0 0 0 BOS Change 0 0 0 0 0 0 0 0 Housing Change 0 0 0 0 0 0 0 0 -------------------------------------------------------------------------------------------------------------- TOTAL CHANGES 0 0 0 0 0 0 0 0 BELVOIR EPG STATION, VA (TEMPBASE) Net Change($K) 2006 2007 2008 2009 2010 2011 Total Beyond -------------- ---- ---- ---- ---- ---- ---- ----- ------ Sustain Change 0 0 0 2,455 4,920 4,920 12,294 4,920 Recap Change 0 0 0 0 0 0 0 0 BOS Change 0 0 0 0 0 0 0 0 Housing Change 0 0 0 0 0 0 0 0 -------------------------------------------------------------------------------------------------------------- TOTAL CHANGES 0 0 0 2,455 4,920 4,920 12,294 4,920

TOTAL COBRA ONE-TIME COST REPORT (COBRA v6.10) - Page 1/9 Data As Of 5/3/2005 3:55:37 PM, Report Created 5/4/2005 1:02:56 PM Department : Intelligence JCSG Option Pkg Name: INT-0004 Std Fctrs File : C:\COBRA 6.10\BRAC2005.SFF (All values in 2005 Constant Dollars) Category Cost Sub-Total -------- ---- --------- Construction Military Construction 950,000,000 Total - Construction 950,000,000 Personnel Civilian RIF 1,428,280 Civilian Early Retirement 49,729 Eliminated Military PCS 0 Unemployment 106,824 Total - Personnel 1,584,832 Overhead Program Management Cost 14,671,354 Support Contract Termination 0 Mothball / Shutdown 260,100 Total - Overhead 14,931,454 Moving Civilian Moving 0 Civilian PPP 425,952 Military Moving 0 Freight 0 Information Technologies 4,814,000 One-Time Moving Costs 15,881,000 Total - Moving 21,120,952 Other HAP / RSE 0 Environmental Mitigation Costs 1,700,000 Mission Contract Startup and Termination 0 One-Time Unique Costs 127,921,000 Total - Other 129,621,000 ------------------------------------------------------------------------------ Total One-Time Costs 1,117,258,239 ------------------------------------------------------------------------------ One-Time Savings Military Construction Cost Avoidances 0 Military Moving 0 One-Time Moving Savings 0 Environmental Mitigation Savings 0 One-Time Unique Savings 87,764,000 ------------------------------------------------------------------------------ Total One-Time Savings 87,764,000 ------------------------------------------------------------------------------ Total Net One-Time Costs 1,029,494,239

COBRA ONE-TIME COST REPORT (COBRA v6.10) - Page 2/9 Data As Of 5/3/2005 3:55:37 PM, Report Created 5/4/2005 1:02:56 PM Department : Intelligence JCSG Option Pkg Name: INT-0004 Std Fctrs File : C:\COBRA 6.10\BRAC2005.SFF Base: NGA Bethesda, MD (TEMPBASE) (All values in 2005 Constant Dollars) Category Cost Sub-Total -------- ---- --------- Construction Military Construction 0 Total - Construction 0 Personnel Civilian RIF 1,368,966 Civilian Early Retirement 49,729 Eliminated Military PCS 0 Unemployment 102,373 Total - Personnel 1,521,068 Overhead Program Management Cost 14,438,733 Support Contract Termination 0 Mothball / Shutdown 185,400 Total - Overhead 14,624,133 Moving Civilian Moving 0 Civilian PPP 390,456 Military Moving 0 Freight 0 Information Technologies 0 One-Time Moving Costs 7,636,000 Total - Moving 8,026,456 Other HAP / RSE 0 Environmental Mitigation Costs 550,000 Mission Contract Startup and Termination 0 One-Time Unique Costs 3,100,000 Total - Other 3,650,000 ------------------------------------------------------------------------------ Total One-Time Costs 27,821,658 ------------------------------------------------------------------------------ One-Time Savings Military Construction Cost Avoidances 0 Military Moving 0 One-Time Moving Savings 0 Environmental Mitigation Savings 0 One-Time Unique Savings 48,057,000 ------------------------------------------------------------------------------ Total One-Time Savings 48,057,000 ------------------------------------------------------------------------------ Total Net One-Time Costs -20,235,342

COBRA ONE-TIME COST REPORT (COBRA v6.10) - Page 3/9 Data As Of 5/3/2005 3:55:37 PM, Report Created 5/4/2005 1:02:56 PM Department : Intelligence JCSG Option Pkg Name: INT-0004 Std Fctrs File : C:\COBRA 6.10\BRAC2005.SFF Base: NGA Reston, VA (TEMPBASE) (All values in 2005 Constant Dollars) Category Cost Sub-Total -------- ---- --------- Construction Military Construction 0 Total - Construction 0 Personnel Civilian RIF 0 Civilian Early Retirement 0 Eliminated Military PCS 0 Unemployment 0 Total - Personnel 0 Overhead Program Management Cost 0 Support Contract Termination 0 Mothball / Shutdown 0 Total - Overhead 0 Moving Civilian Moving 0 Civilian PPP 0 Military Moving 0 Freight 0 Information Technologies 0 One-Time Moving Costs 2,520,000 Total - Moving 2,520,000 Other HAP / RSE 0 Environmental Mitigation Costs 0 Mission Contract Startup and Termination 0 One-Time Unique Costs 26,206,000 Total - Other 26,206,000 ------------------------------------------------------------------------------ Total One-Time Costs 28,726,000 ------------------------------------------------------------------------------ One-Time Savings Military Construction Cost Avoidances 0 Military Moving 0 One-Time Moving Savings 0 Environmental Mitigation Savings 0 One-Time Unique Savings 19,275,000 ------------------------------------------------------------------------------ Total One-Time Savings 19,275,000 ------------------------------------------------------------------------------ Total Net One-Time Costs 9,451,000

COBRA ONE-TIME COST REPORT (COBRA v6.10) - Page 4/9 Data As Of 5/3/2005 3:55:37 PM, Report Created 5/4/2005 1:02:56 PM Department : Intelligence JCSG Option Pkg Name: INT-0004 Std Fctrs File : C:\COBRA 6.10\BRAC2005.SFF Base: NGA Newington, VA (TEMPBASE) (All values in 2005 Constant Dollars) Category Cost Sub-Total -------- ---- --------- Construction Military Construction 0 Total - Construction 0 Personnel Civilian RIF 0 Civilian Early Retirement 0 Eliminated Military PCS 0 Unemployment 0 Total - Personnel 0 Overhead Program Management Cost 0 Support Contract Termination 0 Mothball / Shutdown 0 Total - Overhead 0 Moving Civilian Moving 0 Civilian PPP 0 Military Moving 0 Freight 0 Information Technologies 0 One-Time Moving Costs 446,000 Total - Moving 446,000 Other HAP / RSE 0 Environmental Mitigation Costs 0 Mission Contract Startup and Termination 0 One-Time Unique Costs 0 Total - Other 0 ------------------------------------------------------------------------------ Total One-Time Costs 446,000 ------------------------------------------------------------------------------ One-Time Savings Military Construction Cost Avoidances 0 Military Moving 0 One-Time Moving Savings 0 Environmental Mitigation Savings 0 One-Time Unique Savings 0 ------------------------------------------------------------------------------ Total One-Time Savings 0 ------------------------------------------------------------------------------ Total Net One-Time Costs 446,000

COBRA ONE-TIME COST REPORT (COBRA v6.10) - Page 5/9 Data As Of 5/3/2005 3:55:37 PM, Report Created 5/4/2005 1:02:56 PM Department : Intelligence JCSG Option Pkg Name: INT-0004 Std Fctrs File : C:\COBRA 6.10\BRAC2005.SFF Base: NGA Dulles, VA (TEMPBASE) (All values in 2005 Constant Dollars) Category Cost Sub-Total -------- ---- --------- Construction Military Construction 0 Total - Construction 0 Personnel Civilian RIF 0 Civilian Early Retirement 0 Eliminated Military PCS 0 Unemployment 0 Total - Personnel 0 Overhead Program Management Cost 0 Support Contract Termination 0 Mothball / Shutdown 0 Total - Overhead 0 Moving Civilian Moving 0 Civilian PPP 0 Military Moving 0 Freight 0 Information Technologies 0 One-Time Moving Costs 0 Total - Moving 0 Other HAP / RSE 0 Environmental Mitigation Costs 0 Mission Contract Startup and Termination 0 One-Time Unique Costs 0 Total - Other 0 ------------------------------------------------------------------------------ Total One-Time Costs 0 ------------------------------------------------------------------------------ One-Time Savings Military Construction Cost Avoidances 0 Military Moving 0 One-Time Moving Savings 0 Environmental Mitigation Savings 0 One-Time Unique Savings 0 ------------------------------------------------------------------------------ Total One-Time Savings 0 ------------------------------------------------------------------------------ Total Net One-Time Costs 0

COBRA ONE-TIME COST REPORT (COBRA v6.10) - Page 6/9 Data As Of 5/3/2005 3:55:37 PM, Report Created 5/4/2005 1:02:56 PM Department : Intelligence JCSG Option Pkg Name: INT-0004 Std Fctrs File : C:\COBRA 6.10\BRAC2005.SFF Base: NGA College, VA (TEMPBASE) (All values in 2005 Constant Dollars) Category Cost Sub-Total -------- ---- --------- Construction Military Construction 0 Total - Construction 0 Personnel Civilian RIF 59,313 Civilian Early Retirement 0 Eliminated Military PCS 0 Unemployment 4,451 Total - Personnel 63,764 Overhead Program Management Cost 232,621 Support Contract Termination 0 Mothball / Shutdown 74,700 Total - Overhead 307,321 Moving Civilian Moving 0 Civilian PPP 35,496 Military Moving 0 Freight 0 Information Technologies 0 One-Time Moving Costs 0 Total - Moving 35,496 Other HAP / RSE 0 Environmental Mitigation Costs 0 Mission Contract Startup and Termination 0 One-Time Unique Costs 0 Total - Other 0 ------------------------------------------------------------------------------ Total One-Time Costs 406,581 ------------------------------------------------------------------------------ One-Time Savings Military Construction Cost Avoidances 0 Military Moving 0 One-Time Moving Savings 0 Environmental Mitigation Savings 0 One-Time Unique Savings 960,000 ------------------------------------------------------------------------------ Total One-Time Savings 960,000 ------------------------------------------------------------------------------ Total Net One-Time Costs -553,419

COBRA ONE-TIME COST REPORT (COBRA v6.10) - Page 7/9 Data As Of 5/3/2005 3:55:37 PM, Report Created 5/4/2005 1:02:56 PM Department : Intelligence JCSG Option Pkg Name: INT-0004 Std Fctrs File : C:\COBRA 6.10\BRAC2005.SFF Base: NGA Bldg 213 SEFC, DC (TEMPBASE) (All values in 2005 Constant Dollars) Category Cost Sub-Total -------- ---- --------- Construction Military Construction 0 Total - Construction 0 Personnel Civilian RIF 0 Civilian Early Retirement 0 Eliminated Military PCS 0 Unemployment 0 Total - Personnel 0 Overhead Program Management Cost 0 Support Contract Termination 0 Mothball / Shutdown 0 Total - Overhead 0 Moving Civilian Moving 0 Civilian PPP 0 Military Moving 0 Freight 0 Information Technologies 0 One-Time Moving Costs 5,279,000 Total - Moving 5,279,000 Other HAP / RSE 0 Environmental Mitigation Costs 0 Mission Contract Startup and Termination 0 One-Time Unique Costs 2,233,000 Total - Other 2,233,000 ------------------------------------------------------------------------------ Total One-Time Costs 7,512,000 ------------------------------------------------------------------------------ One-Time Savings Military Construction Cost Avoidances 0 Military Moving 0 One-Time Moving Savings 0 Environmental Mitigation Savings 0 One-Time Unique Savings 19,472,000 ------------------------------------------------------------------------------ Total One-Time Savings 19,472,000 ------------------------------------------------------------------------------ Total Net One-Time Costs -11,960,000

COBRA ONE-TIME COST REPORT (COBRA v6.10) - Page 8/9 Data As Of 5/3/2005 3:55:37 PM, Report Created 5/4/2005 1:02:56 PM Department : Intelligence JCSG Option Pkg Name: INT-0004 Std Fctrs File : C:\COBRA 6.10\BRAC2005.SFF Base: NRO Westfields, VA (TEMPBASE) (All values in 2005 Constant Dollars) Category Cost Sub-Total -------- ---- --------- Construction Military Construction 0 Total - Construction 0 Personnel Civilian RIF 0 Civilian Early Retirement 0 Eliminated Military PCS 0 Unemployment 0 Total - Personnel 0 Overhead Program Management Cost 0 Support Contract Termination 0 Mothball / Shutdown 0 Total - Overhead 0 Moving Civilian Moving 0 Civilian PPP 0 Military Moving 0 Freight 0 Information Technologies 0 One-Time Moving Costs 0 Total - Moving 0 Other HAP / RSE 0 Environmental Mitigation Costs 0 Mission Contract Startup and Termination 0 One-Time Unique Costs 0 Total - Other 0 ------------------------------------------------------------------------------ Total One-Time Costs 0 ------------------------------------------------------------------------------ One-Time Savings Military Construction Cost Avoidances 0 Military Moving 0 One-Time Moving Savings 0 Environmental Mitigation Savings 0 One-Time Unique Savings 0 ------------------------------------------------------------------------------ Total One-Time Savings 0 ------------------------------------------------------------------------------ Total Net One-Time Costs 0

COBRA ONE-TIME COST REPORT (COBRA v6.10) - Page 9/9 Data As Of 5/3/2005 3:55:37 PM, Report Created 5/4/2005 1:02:56 PM Department : Intelligence JCSG Option Pkg Name: INT-0004 Std Fctrs File : C:\COBRA 6.10\BRAC2005.SFF Base: BELVOIR EPG STATION, VA (TEMPBASE) (All values in 2005 Constant Dollars) Category Cost Sub-Total -------- ---- --------- Construction Military Construction 950,000,000 Total - Construction 950,000,000 Personnel Civilian RIF 0 Civilian Early Retirement 0 Eliminated Military PCS 0 Unemployment 0 Total - Personnel 0 Overhead Program Management Cost 0 Support Contract Termination 0 Mothball / Shutdown 0 Total - Overhead 0 Moving Civilian Moving 0 Civilian PPP 0 Military Moving 0 Freight 0 Information Technologies 4,814,000 One-Time Moving Costs 0 Total - Moving 4,814,000 Other HAP / RSE 0 Environmental Mitigation Costs 1,150,000 Mission Contract Startup and Termination 0 One-Time Unique Costs 96,382,000 Total - Other 97,532,000 ------------------------------------------------------------------------------ Total One-Time Costs 1,052,346,000 ------------------------------------------------------------------------------ One-Time Savings Military Construction Cost Avoidances 0 Military Moving 0 One-Time Moving Savings 0 Environmental Mitigation Savings 0 One-Time Unique Savings 0 ------------------------------------------------------------------------------ Total One-Time Savings 0 ------------------------------------------------------------------------------ Total Net One-Time Costs 1,052,346,000

COBRA NET PRESENT VALUES REPORT (COBRA v6.10) Data As Of 5/3/2005 3:55:37 PM, Report Created 5/4/2005 1:02:56 PM Department : Intelligence JCSG Option Pkg Name: INT-0004 Std Fctrs File : C:\COBRA 6.10\BRAC2005.SFF Year Cost($) Adjusted Cost($) NPV($) ---- ------- ---------------- ------ 2006 62,252,302 61,398,655 61,398,655 2007 -26,161,558 -25,100,012 36,298,643 2008 -18,670,178 -17,424,715 18,873,928 2009 477,903,535 433,874,715 452,748,643 2010 396,928,594 350,544,671 803,293,314 2011 -95,519,898 -82,060,039 721,233,275 2012 -127,699,253 -106,716,878 614,516,397 2013 -127,699,253 -103,810,192 510,706,205 2014 -127,699,253 -100,982,677 409,723,528 2015 -127,699,253 -98,232,176 311,491,351 2016 -127,699,253 -95,556,592 215,934,760 2017 -127,699,253 -92,953,883 122,980,876 2018 -127,699,253 -90,422,065 32,558,811 2019 -127,699,253 -87,959,207 -55,400,396 2020 -127,699,253 -85,563,431 -140,963,827 2021 -127,699,253 -83,232,910 -224,196,737 2022 -127,699,253 -80,965,866 -305,162,603 2023 -127,699,253 -78,760,570 -383,923,173 2024 -127,699,253 -76,615,340 -460,538,513 2025 -127,699,253 -74,528,541 -535,067,054

TOTAL COBRA MILITARY CONSTRUCTION ASSETS REPORT (COBRA v6.10) Data As Of 5/3/2005 3:55:37 PM, Report Created 5/4/2005 1:02:56 PM Department : Intelligence JCSG Option Pkg Name: INT-0004 Std Fctrs File : C:\COBRA 6.10\BRAC2005.SFF All values in 2005 Constant Dollars Total Milcon Cost Total Base Name MilCon* Avoidence Net Costs --------- ------- ----------- --------- NGA Bethesda 0 0 0 NGA Reston 0 0 0 NGA Newington 0 0 0 NGA Dulles 0 0 0 NGA College 0 0 0 NGA Bldg 213 SEFC 0 0 0 NRO Westfields 0 0 0 BELVOIR EPG STATION 950,000,000 0 950,000,000 ------------------------------------------------------------------------------ Totals: 950,000,000 0 950,000,000 * All MilCon Costs include Design, Site Preparation, Contingency Planning, and SIOH Costs where applicable.

COBRA MILITARY CONSTRUCTION ASSETS REPORT (COBRA v6.10) - Page 2 Data As Of 5/3/2005 3:55:37 PM, Report Created 5/4/2005 1:02:56 PM Department : Intelligence JCSG Option Pkg Name: INT-0004 Std Fctrs File : C:\COBRA 6.10\BRAC2005.SFF MilCon for Base: BELVOIR EPG STATION, VA (TEMPBASE) All values in 2005 Constant Dollars ($K) New New Using Rehab Rehab Total FAC Title UM MilCon Cost* Rehab Type Cost* Cost* ---- ----------------------------------------- --- ------ ----- ----- ------- ----- ----- 6100 General Administrative Building SF 2,200,000 n/a** 0 Default n/a** 950,000 --------------------------------------------------------------------------------------------------------------- Total Construction Cost: 950,000 - Construction Cost Avoid: 0 ---------------------------------------- Total Net Milcon Cost: 950,000 * All MilCon Costs include Design, Site Preparation, Contingency Planning, and SIOH Costs where applicable. **No New Milcon / Rehabilitation Cost breakdown is available if Total Cost was entered by the user

SCENARIO ERROR REPORT (COBRA v6.10) Data As Of 5/3/2005 3:55:37 PM, Report Created 5/4/2005 1:02:56 PM Department : Intelligence JCSG Option Pkg Name: INT-0004 Std Fctrs File : C:\COBRA 6.10\BRAC2005.SFF SCENARIO DATA: "Intelligence JCSG" is not a recognized Department.

The data in this report is rolled up by Region of Influence
INT-0004: National Geospatial-Intelligence Agency Activities
This report depicts the economic impact of the following Scenarios:
Economic Impact Report
Page 1

Page 2

Scenario Name: All Selected (see title page)Washington-Arlington-Alexandria, DC-VA-MD-WV Metropolitan Division
Base: All BasesAction: All Actions
Overall Economic Impact of Proposed BRAC-05 Action:ROI Population (2002): 3,895,337ROI Employment (2002): 2,771,791Authorized Manpower (2005): 16,399
0.59%Total Estimated Job Change: 5,319
0.19%
YEAR: 2006 2007 2008 2009 2010 2011Direct Military: 0 0 0 0 0 57Direct Civilian: 0 0 0 0 0 1770Direct Student: 0 0 0 0 0 40Direct Contractor: 0 0 0 0 0 1233Total Direct 0 0 0 0 0 3,100Indirect 0 0 0 0 0 2,219Cumulative Direct: 0 0 0 0 0 3,100Cum Indir/Induc: 0 0 0 0 0 2,219Cumulative Total: 0 0 0 0 0 5,319
ECONOMIC IMPACT DATA
Cumulative Job Change (Gain/Loss) Over Time:
Page 2
Total Estimated Job Change/ ROI Employment (2002):
Authorized Manpower (2005)/ ROI Employment (2002):
Economic Region of Influence (ROI):
0
1,000
2,000
3,000
4,000
5,000
6,0002006 2007 2008 2009 2010 2011

YEAR: 1988 1989 1990 1991 1992 1993 1994 1995 1996 1997 1998 1999 2000 2001 2002Index: 1.00 1.03 1.04 1.02 1.01 1.03 1.04 1.06 1.07 1.10 1.12 1.15 1.20 1.22 1.23
YEAR: 1990 1991 1992 1993 1994 1995 1996 1997 1998 1999 2000 2001 2002 2003ROI: 3.42% 4.87% 5.60% 5.00% 4.40% 4.48% 4.23% 3.94% 3.47% 2.82% 2.53% 3.27% 3.89% 3.75%USA: 5.60% 6.83% 7.50% 6.91% 6.09% 5.59% 5.40% 4.94% 4.51% 4.21% 3.99% 4.74% 5.79% 5.99%
`
YEAR: 1988 1989 1990 1991 1992 1993 1994 1995 1996 1997 1998 1999 2000 2001 2002ROI 35.91$ 36.47$ 36.33$ 35.74$ 36.05$ 36.18$ 36.42$ 36.33$ 36.47$ 37.51$ 38.93$ 40.22$ 41.65$ 42.28$ 42.06$ US 26.96$ 27.48$ 27.42$ 26.87$ 27.35$ 27.18$ 27.53$ 27.86$ 28.35$ 29.04$ 30.35$ 30.86$ 31.89$ 31.72$ 31.61$ Note: National trend lines are dashed
Page 3
Washington-Arlington-Alexandria, DC-VA-MD-WV Metropolitan Division Trend Data
Represents the ROI's indexed employment change since 1988
Employment Trend (1988-2002)
-
500,000
1,000,000
1,500,000
2,000,000
2,500,000
3,000,000
1988 1989 1990 1991 1992 1993 1994 1995 1996 1997 1998 1999 2000 2001 2002
Per Capita Income x $1000 (1988-2002)
$-
$5
$10
$15
$20
$25
$30
$35
$40
$45
1988 1989 1990 1991 1992 1993 1994 1995 1996 1997 1998 1999 2000 2001 2002
Unemployment Percentage Trend (1990-2003)
0.00%
1.00%
2.00%
3.00%
4.00%
5.00%
6.00%
7.00%
8.00%
1990 1991 1992 1993 1994 1995 1996 1997 1998 1999 2000 2001 2002 2003

As of: Wed Feb 16 4:00 PM EST 2005
Scenario: All Selected (see title page)
Base: All BasesAction: All Actions
Overall Economic Impact of Proposed BRAC-05 Action:1118094
7270101732
0.24%Total Estimated Job Change: -5,260
-0.72%
Cumulative Job Change (Gain/Loss) Over Time:
YEAR: 2006 2007 2008 2009 2010 2011Direct Military: 0 0 0 0 0 -57Direct Civilian: 38 54 67 32 0 -1,827Direct Student: 0 0 0 0 0 -40Direct Contractor: 0 0 0 0 0 -1,100Cumulative Direct: 38 92 159 191 191 -2,833Cum Indir/Induc: 35 85 147 176 176 -2,427Cumulative Total: 73 177 306 367 367 -5,260
ECONOMIC IMPACT DATA
Authorized Manpower (2005)/ ROI Employment (2002):
Total Estimated Job Change/ ROI Employment (2002):
Bethesda-Frederick-Gaithersburg, MD Metropolitan DivisionEconomic Region of Influence (ROI):
ROI Population (2002):ROI Employment (2002):Authorized Manpower (2005):
-6,000-5,000-4,000-3,000-2,000-1,000
01,000
2006 2007 2008 2009 2010 2011

YEAR: 1988 1989 1990 1991 1992 1993 1994 1995 1996 1997 1998 1999 2000 2001 2002Index: 1.00 1.02 1.02 1.00 1.00 1.01 1.02 1.06 1.08 1.10 1.13 1.17 1.22 1.24 1.26
YEAR: 1990 1991 1992 1993 1994 1995 1996 1997 1998 1999 2000 2001 2002 2003ROI 2.78% 3.61% 3.96% 3.70% 3.07% 3.14% 2.77% 2.81% 2.43% 1.90% 1.92% 2.38% 2.79% 2.72%US 5.60% 6.83% 7.50% 6.91% 6.09% 5.59% 5.40% 4.94% 4.51% 4.21% 3.99% 4.74% 5.79% 5.99%
`
Year 1988 1989 1990 1991 1992 1993 1994 1995 1996 1997 1998 1999 2000 2001 2002ROI 42.69$ 43.78$ 42.93$ 42.14$ 42.64$ 42.46$ 42.80$ 43.08$ 43.35$ 43.19$ 45.79$ 46.94$ 49.73$ 49.50$ 49.62$ US 26.96$ 27.48$ 27.42$ 26.87$ 27.35$ 27.18$ 27.53$ 27.86$ 28.35$ 29.04$ 30.35$ 30.86$ 31.89$ 31.72$ 31.61$ Note: National trend lines are dashed
Bethesda-Frederick-Gaithersburg, MD Metropolitan Division Trend Data
Represents the ROI's indexed employment change since 1988
Employment Trend (1988-2002)
-100,000200,000300,000400,000500,000600,000700,000800,000
1988 1989 1990 1991 1992 1993 1994 1995 1996 1997 1998 1999 2000 2001 2002
Per Capita Income x $1000 (1988-2002)
$-
$10
$20
$30
$40
$50
$60
1988 1989 1990 1991 1992 1993 1994 1995 1996 1997 1998 1999 2000 2001 2002
Unemployment Percentage Trend (1990-2003)
0.00%
1.00%
2.00%
3.00%
4.00%
5.00%
6.00%
7.00%
8.00%
1990 1991 1992 1993 1994 1995 1996 1997 1998 1999 2000 2001 2002

Page 3


Extracted from OSD BRAC database as of April 20, 2005
NGA, NGA East - Bethesda, MD Demographics The following tables provide a short description of the area near the installation/activity. NGA East - Bethesda is 7.5 miles from Washington, DC, the nearest city with a population of 100,000 or more. The nearest metropolitan statistical area (MSA) is MSA Population Washington, DC-MD-VA-WV MSA 4,923,153 The following entities comprise the military housing area (MHA): County/City Population Alexandria City 128283 Arlington 189453 District Of Columbia 572059 Fairfax 969749 Fairfax City 21498 Falls Church City 10377 Montgomery 873341 Prince George's 801515
Total 3,566,275
Child Care This attribute captures the number of nationally accredited child-care centers within the local community: 216
Cost of Living Cost of Living provides a relative measure of cost of living in the local community. General Schedule (GS) Locality pay provides a relative scale to compare local salaries with government salaries and Basic Allowance for Housing (BAH) is an indicator of the local rental market. In-state tuition is an indicator of the support provided by the state for active duty family members to participate in higher-level education opportunities. For median household income and house value, the basis of the data (either MSA or number of counties in the MHA or the county of the installation) is indicated.
Median Household Income (US Avg $41,994) $62,216 Median House Value (US Avg $119,600) $178,900
Basis: MSA
GS Locality Pay (“Rest of US” 10.9%) .1% O-3 with Dependents BAH Rate $2,006 In-state Tuition for Family Member Yes In-state Tuition Continues if Member PCSs Out of State No

Extracted from OSD BRAC database as of April 20, 2005
Education This attribute defines the population in local school districts and identifies capacity. The pupil/teacher ratio, graduation rate, and composite SAT I/ACT scores provide a relative quality indicator of education. This attribute also attempts to give communities credit for the potential intellectual capital they provide. NOTE: “MFR”--means a Memorandum For Record is on file at the installation/activity/agency to document problems in obtaining the required information. Reasons for not being able to obtain information may be that the school district refused to provide the information or the school district does not use or track the information. For each entry, the number of school districts for which data are available of the total number of school districts reported, and the number of MFRs is indicated.
Basis
School District(s) Capacity 641,588 1 of 1 district
Students Enrolled 636,532 1 of 1 district
Average Pupil/Teacher Ratio 21.6:1 1 of 1 district
High School Students Enrolled 183,204 1 of 1 district
Average High School Graduation Rate (US Avg 67.3%) 90.1% 1 of 1 district
Average Composite SAT I Score (US Avg 1026) 1008 1 of 1 district
Average ACT Score (US Avg 20.8) 20 1 of 1 district
Available Graduate/PhD Programs 108 Available Colleges and/or Universities 78 Available Vocational and/or Technical Schools 40
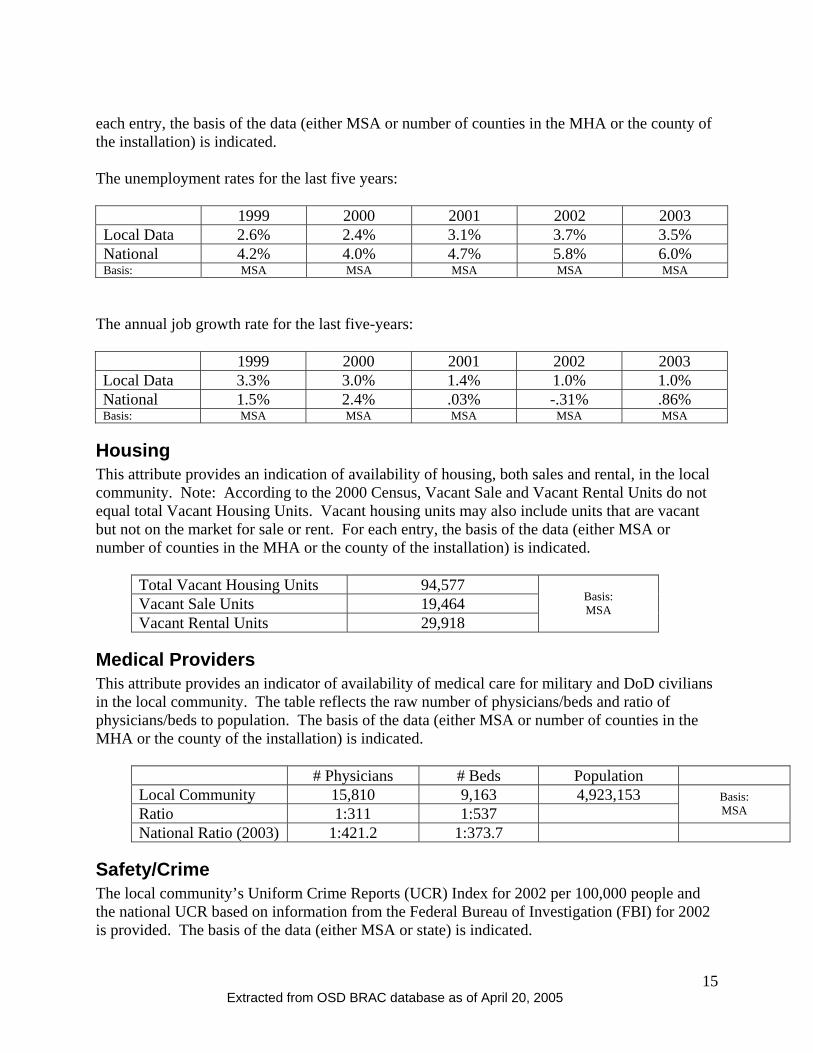
Employment Unemployment and job growth rates provide an indicator of job availability in the local community. National rates from the Bureau of Labor Statistics are also provided. For each entry, the basis of the data (either MSA or number of counties in the MHA or the county of the installation) is indicated. The unemployment rates for the last five years: 1999 2000 2001 2002 2003 Local Data 2.6% 2.3% 3.0% 3.8% 3.5% National 4.2% 4.0% 4.7% 5.8% 6.0% Basis: MSA MSA MSA MSA MSA

Extracted from OSD BRAC database as of April 20, 2005
The annual job growth rate for the last five-years: 1999 2000 2001 2002 2003 Local Data -14.3% -58.3% .0% 40.0% National 1.5% 2.4% .03% -.31% .86% Basis: MSA MSA MSA MSA
Housing This attribute provides an indication of availability of housing, both sales and rental, in the local community. Note: According to the 2000 Census, Vacant Sale and Vacant Rental Units do not equal total Vacant Housing Units. Vacant housing units may also include units that are vacant but not on the market for sale or rent. For each entry, the basis of the data (either MSA or number of counties in the MHA or the county of the installation) is indicated.
Total Vacant Housing Units 94,577 Vacant Sale Units 19,464 Vacant Rental Units 29,918
Basis: MSA
Medical Providers This attribute provides an indicator of availability of medical care for military and DoD civilians in the local community. The table reflects the raw number of physicians/beds and ratio of physicians/beds to population. The basis of the data (either MSA or number of counties in the MHA or the county of the installation) is indicated. # Physicians # Beds Population
Local Community 15,810 9,163 4,923,153 Ratio 1:311 1:537
Basis: MSA
National Ratio (2003) 1:421.2 1:373.7
Safety/Crime The local community’s Uniform Crime Reports (UCR) Index for 2002 per 100,000 people and the national UCR based on information from the Federal Bureau of Investigation (FBI) for 2002 is provided. The basis of the data (either MSA or state) is indicated.
Local UCR 4,047.1 Basis: MSA National UCR 4,118.8
Transportation Distance to an airport shows convenience and availability of airline transportation. Public transportation shows potential for members and DoD civilians to use it to commute to/from work under normal circumstances and for leisure.

Extracted from OSD BRAC database as of April 20, 2005
Distance from NGA East - Bethesda to nearest commercial airport: 10.4 miles Is NGA East - Bethesda served by regularly scheduled public transportation? Yes
Utilities This attribute identifies a local community’s water and sewer systems’ ability to receive 1,000 additional people. Does the local community’s water system have the ability to meet an expanded need of an additional 1,000 people moving in the local community? Yes Does the local community’s sewer system have the ability to meet an expanded need of an additional 1,000 people moving in the local community? Yes

Extracted from OSD BRAC database as of April 20, 2005
5
NGA, NGA East - Reston, VA (Note: This impact statement covers Reston 1, 2, and 3)
Demographics The following tables provide a short description of the area near the installation/activity. NGA East - Reston is 22.7 miles from Washington, DC, the nearest city with a population of 100,000 or more. The nearest metropolitan statistical area (MSA) is MSA Population Washington. DC-MD-VA-WV MSA 4,923,153 The following entities comprise the military housing area (MHA): County/City Population Alexandria City 128283 Arlington 189453 District Of Columbia 572059 Fairfax 969749 Fairfax City 21498 Falls Church City 10377 Montgomery 873341 Prince George's 801515
Total 3,566,275
Child Care This attribute captures the number of nationally accredited child-care centers within the local community: 216
Cost of Living Cost of Living provides a relative measure of cost of living in the local community. General Schedule (GS) Locality pay provides a relative scale to compare local salaries with government salaries and Basic Allowance for Housing (BAH) is an indicator of the local rental market. In-state tuition is an indicator of the support provided by the state for active duty family members to participate in higher-level education opportunities. For median household income and house value, the basis of the data (either MSA or number of counties in the MHA or the county of the installation) is indicated.
Median Household Income (US Avg $41,994) $62,216 Median House Value (US Avg $119,600) $178,900
Basis: MSA
GS Locality Pay (“Rest of US” 10.9%) 14.6% O-3 with Dependents BAH Rate $2,006 In-state Tuition for Family Member No In-state Tuition Continues if Member PCSs Out of State No

Extracted from OSD BRAC database as of April 20, 2005
6
Education This attribute defines the population in local school districts and identifies capacity. The pupil/teacher ratio, graduation rate, and composite SAT I/ACT scores provide a relative quality indicator of education. This attribute also attempts to give communities credit for the potential intellectual capital they provide. NOTE: “MFR”--means a Memorandum For Record is on file at the installation/activity/agency to document problems in obtaining the required information. Reasons for not being able to obtain information may be that the school district refused to provide the information or the school district does not use or track the information. For each entry, the number of school districts for which data are available of the total number of school districts reported, and the number of MFRs is indicated.
Basis
School District(s) Capacity 641,588 1 of 1 district
Students Enrolled 636,532 1 of 1 district
Average Pupil/Teacher Ratio 21.6:1 1 of 1 district
High School Students Enrolled 183,204 1 of 1 district
Average High School Graduation Rate (US Avg 67.3%) 90.1% 1 of 1 district
Average Composite SAT I Score (US Avg 1026) 1008 1 of 1 district
Average ACT Score (US Avg 20.8) 20 1 of 1 district
Available Graduate/PhD Programs 108 Available Colleges and/or Universities 78 Available Vocational and/or Technical Schools 40
Employment Unemployment and job growth rates provide an indicator of job availability in the local community. National rates from the Bureau of Labor Statistics are also provided. For each entry, the basis of the data (either MSA or number of counties in the MHA or the county of the installation) is indicated. The unemployment rates for the last five years: 1999 2000 2001 2002 2003 Local Data 2.6% 2.3% 3.0% 3.8% 3.5% National 4.2% 4.0% 4.7% 5.8% 6.0% Basis: MSA MSA MSA MSA MSA

Extracted from OSD BRAC database as of April 20, 2005
7
The annual job growth rate for the last five-years: 1999 2000 2001 2002 2003 Local Data -14.3% -58.3% .0% 40.0% National 1.5% 2.4% .03% -.31% .86% Basis: MSA MSA MSA MSA
Housing This attribute provides an indication of availability of housing, both sales and rental, in the local community. Note: According to the 2000 Census, Vacant Sale and Vacant Rental Units do not equal total Vacant Housing Units. Vacant housing units may also include units that are vacant but not on the market for sale or rent. For each entry, the basis of the data (either MSA or number of counties in the MHA or the county of the installation) is indicated.
Total Vacant Housing Units 94,577 Vacant Sale Units 19,464 Vacant Rental Units 29,918
Basis: MSA
Medical Providers This attribute provides an indicator of availability of medical care for military and DoD civilians in the local community. The table reflects the raw number of physicians/beds and ratio of physicians/beds to population. The basis of the data (either MSA or number of counties in the MHA or the county of the installation) is indicated.
# Physicians # Beds Population Local Community 15,810 9,163 4,923,153 Ratio 1:311 1:537
Basis: MSA
National Ratio (2003) 1:421.2 1:373.7
Safety/Crime The local community’s Uniform Crime Reports (UCR) Index for 2002 per 100,000 people and the national UCR based on information from the Federal Bureau of Investigation (FBI) for 2002 is provided. The basis of the data (either MSA or state) is indicated.
Local UCR 4,047.1 Basis: MSA National UCR 4,118.8
Transportation Distance to an airport shows convenience and availability of airline transportation. Public transportation shows potential for members and DoD civilians to use it to commute to/from work under normal circumstances and for leisure. Distance from NGA East - Reston to nearest commercial airport: 6.2 miles Is NGA East - Reston served by regularly scheduled public transportation? Yes

Extracted from OSD BRAC database as of April 20, 2005
8
Utilities This attribute identifies a local community’s water and sewer systems’ ability to receive 1,000 additional people. Does the local community’s water system have the ability to meet an expanded need of an additional 1,000 people moving in the local community? Yes Does the local community’s sewer system have the ability to meet an expanded need of an additional 1,000 people moving in the local community? Yes

Extracted from OSD BRAC database as of April 20, 2005
9
NGA, NGA East - Washington Navy Yard (Southeast Federal Center), DC (Note: This facility is actuallyknown as Building 213, South East Federal Center, a GSA installation)
Demographics The following tables provide a short description of the area near the installation/activity. NGA East - Washington Navy Yard (Southeast Federal Center) is within Washington, DC, the nearest city with a population of 100,000 or more. The nearest metropolitan statistical area (MSA) is MSA Population Washington, DC-MD-VA-WV PMSA 4,923,153 The following entities comprise the military housing area (MHA): County/City Population Alexandria 128283 Arlington 189453 District Of Columbia 572059 Fairfax 969749 Fairfax City 21489 Falls Church City 10377 Montgomery 873341 Prince George's 801515
Total 3,566,266
Child Care This attribute captures the number of nationally accredited child-care centers within the local community: 216
Cost of Living Cost of Living provides a relative measure of cost of living in the local community. General Schedule (GS) Locality pay provides a relative scale to compare local salaries with government salaries and Basic Allowance for Housing (BAH) is an indicator of the local rental market. In-state tuition is an indicator of the support provided by the state for active duty family members to participate in higher-level education opportunities. For median household income and house value, the basis of the data (either MSA or number of counties in the MHA or the county of the installation) is indicated.
Median Household Income (US Avg $41,994) $62,216 Median House Value (US Avg $119,600) $178,900
Basis: MSA
GS Locality Pay (“Rest of US” 10.9%) 14.6% O-3 with Dependents BAH Rate $2,006 In-state Tuition for Family Member In-state Tuition Continues if Member PCSs Out of State

Extracted from OSD BRAC database as of April 20, 2005
10
Education This attribute defines the population in local school districts and identifies capacity. The pupil/teacher ratio, graduation rate, and composite SAT I/ACT scores provide a relative quality indicator of education. This attribute also attempts to give communities credit for the potential intellectual capital they provide. NOTE: “MFR”--means a Memorandum For Record is on file at the installation/activity/agency to document problems in obtaining the required information. Reasons for not being able to obtain information may be that the school district refused to provide the information or the school district does not use or track the information. For each entry, the number of school districts for which data are available of the total number of school districts reported, and the number of MFRs is indicated.
Basis
School District(s) Capacity 641,588 1 of 1 district
Students Enrolled 636,532 1 of 1 district
Average Pupil/Teacher Ratio 21.6:1 1 of 1 district
High School Students Enrolled 183,204 1 of 1 district
Average High School Graduation Rate (US Avg 67.3%) 90.1% 1 of 1 district
Average Composite SAT I Score (US Avg 1026) 1008 1 of 1 district
Average ACT Score (US Avg 20.8) 20 1 of 1 district
Available Graduate/PhD Programs 108 Available Colleges and/or Universities 78 Available Vocational and/or Technical Schools 40
Employment Unemployment and job growth rates provide an indicator of job availability in the local community. National rates from the Bureau of Labor Statistics are also provided. For each entry, the basis of the data (either MSA or number of counties in the MHA or the county of the installation) is indicated. The unemployment rates for the last five years: 1999 2000 2001 2002 2003 Local Data 2.6% 2.3% 3.0% 3.8% 3.5% National 4.2% 4.0% 4.7% 5.8% 6.0% Basis: MSA MSA MSA MSA MSA

Extracted from OSD BRAC database as of April 20, 2005
11
The annual job growth rate for the last five-years: 1999 2000 2001 2002 2003 Local Data -14.3% -58.3% .0% 40.0% National 1.5% 2.4% .03% -.31% .86% Basis: MSA MSA MSA MSA
Housing This attribute provides an indication of availability of housing, both sales and rental, in the local community. Note: According to the 2000 Census, Vacant Sale and Vacant Rental Units do not equal total Vacant Housing Units. Vacant housing units may also include units that are vacant but not on the market for sale or rent. For each entry, the basis of the data (either MSA or number of counties in the MHA or the county of the installation) is indicated.
Total Vacant Housing Units 94,577 Vacant Sale Units 19,464 Vacant Rental Units 29,918
Basis: MSA
Medical Providers This attribute provides an indicator of availability of medical care for military and DoD civilians in the local community. The table reflects the raw number of physicians/beds and ratio of physicians/beds to population. The basis of the data (either MSA or number of counties in the MHA or the county of the installation) is indicated.
# Physicians # Beds Population Local Community 15,810 9,163 4,923,153 Ratio 1:311 1:537
Basis: MSA
National Ratio (2003) 1:421.2 1:373.7
Safety/Crime The local community’s Uniform Crime Reports (UCR) Index for 2002 per 100,000 people and the national UCR based on information from the Federal Bureau of Investigation (FBI) for 2002 is provided. The basis of the data (either MSA or state) is indicated.
Local UCR 4,047.1 Basis: MSA National UCR 4,118.8
Transportation Distance to an airport shows convenience and availability of airline transportation. Public transportation shows potential for members and DoD civilians to use it to commute to/from work under normal circumstances and for leisure. Distance from NGA East - Washington Navy Yard (Southeast Federal Center) to nearest commercial airport: 4.9 miles Is NGA East - Washington Navy Yard (Southeast Federal Center) served by regularly scheduled public transportation? Yes

Extracted from OSD BRAC database as of April 20, 2005
12
Utilities This attribute identifies a local community’s water and sewer systems’ ability to receive 1,000 additional people. Does the local community’s water system have the ability to meet an expanded need of an additional 1,000 people moving in the local community? Yes Does the local community’s sewer system have the ability to meet an expanded need of an additional 1,000 people moving in the local community? Yes

Extracted from OSD BRAC database as of April 20, 2005
13
DCAA, Mid-Atlantic Region, Reston Branch, Herndon, VA 20170, VA (Note: This impact statement covers NRO, Westfields, VA)
Demographics The following tables provide a short description of the area near the installation/activity. Mid-Atlantic Region, Reston Branch, Herndon, VA 20170 is 24.7 miles from Washington, DC, the nearest city with a population of 100,000 or more. The nearest metropolitan statistical area (MSA) is MSA Population Washington,DC-MD-VA-WV PMSA 4,923,153 The following entities comprise the military housing area (MHA): County/City Population Alexandria City 128283 Arlington 189453 Fairfax City 21498 Fairfax 969749 Falls Church City 10377 Montgomery 873341 Prince George's 801515 District of Columbia 572059
Total 3,566,275
Child Care This attribute captures the number of nationally accredited child-care centers within the local community: 209
Cost of Living Cost of Living provides a relative measure of cost of living in the local community. General Schedule (GS) Locality pay provides a relative scale to compare local salaries with government salaries and Basic Allowance for Housing (BAH) is an indicator of the local rental market. In-state tuition is an indicator of the support provided by the state for active duty family members to participate in higher-level education opportunities. For median household income and house value, the basis of the data (either MSA or number of counties in the MHA or the county of the installation) is indicated.

Extracted from OSD BRAC database as of April 20, 2005
14
Median Household Income (US Avg $41,994) $62,216 Median House Value (US Avg $119,600) $178,900
Basis: MSA
GS Locality Pay (“Rest of US” 10.9%) 14.6% O-3 with Dependents BAH Rate $2,006 In-state Tuition for Family Member No In-state Tuition Continues if Member PCSs Out of State No
Education This attribute defines the population in local school districts and identifies capacity. The pupil/teacher ratio, graduation rate, and composite SAT I/ACT scores provide a relative quality indicator of education. This attribute also attempts to give communities credit for the potential intellectual capital they provide. NOTE: “MFR”--means a Memorandum For Record is on file at the installation/activity/agency to document problems in obtaining the required information. Reasons for not being able to obtain information may be that the school district refused to provide the information or the school district does not use or track the information. For each entry, the number of school districts for which data are available of the total number of school districts reported, and the number of MFRs is indicated.
Basis
School District(s) Capacity 532,714 7 of 7 districts, 1
MFR Students Enrolled 528,506 7 of 7
districts Average Pupil/Teacher Ratio 13.0:1 7 of 7
districts, 1 MFR
High School Students Enrolled 150,859 7 of 7 districts, 1
MFR Average High School Graduation Rate (US Avg 67.3%) 88.6% 7 of 7
districts, 1 MFR
Average Composite SAT I Score (US Avg 1026) 1028 7 of 7 districts
Average ACT Score (US Avg 20.8) 22 7 of 7 districts, 1
MFR Available Graduate/PhD Programs 16 Available Colleges and/or Universities 16 Available Vocational and/or Technical Schools 39
Employment Unemployment and job growth rates provide an indicator of job availability in the local community. National rates from the Bureau of Labor Statistics are also provided. For
Extracted from OSD BRAC database as of April 20, 2005
15
each entry, the basis of the data (either MSA or number of counties in the MHA or the county of the installation) is indicated. The unemployment rates for the last five years: 1999 2000 2001 2002 2003 Local Data 2.6% 2.4% 3.1% 3.7% 3.5% National 4.2% 4.0% 4.7% 5.8% 6.0% Basis: MSA MSA MSA MSA MSA
The annual job growth rate for the last five-years: 1999 2000 2001 2002 2003 Local Data 3.3% 3.0% 1.4% 1.0% 1.0% National 1.5% 2.4% .03% -.31% .86% Basis: MSA MSA MSA MSA MSA
Housing This attribute provides an indication of availability of housing, both sales and rental, in the local community. Note: According to the 2000 Census, Vacant Sale and Vacant Rental Units do not equal total Vacant Housing Units. Vacant housing units may also include units that are vacant but not on the market for sale or rent. For each entry, the basis of the data (either MSA or number of counties in the MHA or the county of the installation) is indicated.
Total Vacant Housing Units 94,577 Vacant Sale Units 19,464 Vacant Rental Units 29,918
Basis: MSA
Medical Providers This attribute provides an indicator of availability of medical care for military and DoD civilians in the local community. The table reflects the raw number of physicians/beds and ratio of physicians/beds to population. The basis of the data (either MSA or number of counties in the MHA or the county of the installation) is indicated.
# Physicians # Beds Population Local Community 15,810 9,163 4,923,153 Ratio 1:311 1:537
Basis: MSA
National Ratio (2003) 1:421.2 1:373.7
Safety/Crime The local community’s Uniform Crime Reports (UCR) Index for 2002 per 100,000 people and the national UCR based on information from the Federal Bureau of Investigation (FBI) for 2002 is provided. The basis of the data (either MSA or state) is indicated.

Extracted from OSD BRAC database as of April 20, 2005
16
Local UCR 4,047.1 Basis: MSA National UCR 4,118.8
Transportation Distance to an airport shows convenience and availability of airline transportation. Public transportation shows potential for members and DoD civilians to use it to commute to/from work under normal circumstances and for leisure. Distance from Mid-Atlantic Region, Reston Branch, Herndon, VA 20170 to nearest commercial airport: 4.4 miles Is Mid-Atlantic Region, Reston Branch, Herndon, VA 20170 served by regularly scheduled public transportation? Yes
Utilities This attribute identifies a local community’s water and sewer systems’ ability to receive 1,000 additional people. Does the local community’s water system have the ability to meet an expanded need of an additional 1,000 people moving in the local community? Yes Does the local community’s sewer system have the ability to meet an expanded need of an additional 1,000 people moving in the local community? Yes

Extracted from OSD BRAC database as of April 20, 2005
17
FORT BELVOIR INCLUDING THE ENGINEER PROVING GROUND, VA (Note: This impact statement also covers Newington Buildings 8510, 8520, and 8530)
Demographics The following tables provide a short description of the area near the installation/activity. FORT BELVOIR INCLUDING THE ENGINEER PROVING GROUND is 8 miles from Alexandria, VA, the nearest city with a population of 100,000 or more. The nearest metropolitan statistical area (MSA) is MSA Population Washington DC MSA 4,923,153 The following entities comprise the military housing area (MHA): County/City Population Alexandria 128283 Arlington 189453 District Of Columbia 572059 Fairfax 969749 Falls Church 10377 Montgomery 873341 Prince George's 801515
Total 3,544,777
Child Care This attribute captures the number of nationally accredited child-care centers within the local community: 79
Cost of Living Cost of Living provides a relative measure of cost of living in the local community. General Schedule (GS) Locality pay provides a relative scale to compare local salaries with government salaries and Basic Allowance for Housing (BAH) is an indicator of the local rental market. In-state tuition is an indicator of the support provided by the state for active duty family members to participate in higher-level education opportunities. For median household income and house value, the basis of the data (either MSA or number of counties in the MHA or the county of the installation) is indicated. Median Household Income (US Avg $41,994) $62,216 Median House Value (US Avg $119,600) $178,900
Basis: MSA
GS Locality Pay (“Rest of US” 10.9%) 14.6% O-3 with Dependents BAH Rate $2,006

Extracted from OSD BRAC database as of April 20, 2005
18
In-state Tuition for Family Member No In-state Tuition Continues if Member PCSs Out of State No
Education This attribute defines the population in local school districts and identifies capacity. The pupil/teacher ratio, graduation rate, and composite SAT I/ACT scores provide a relative quality indicator of education. This attribute also attempts to give communities credit for the potential intellectual capital they provide. NOTE: “MFR”--means a Memorandum For Record is on file at the installation/activity/agency to document problems in obtaining the required information. Reasons for not being able to obtain information may be that the school district refused to provide the information or the school district does not use or track the information. For each entry, the number of school districts for which data are available of the total number of school districts reported, and the number of MFRs is indicated.
Basis
School District(s) Capacity 227,602 2 of 2 districts
Students Enrolled 220,963 2 of 2 districts
Average Pupil/Teacher Ratio 15.6:1 2 of 2 districts
High School Students Enrolled 66,102 2 of 2 districts
Average High School Graduation Rate (US Avg 67.3%) 96.7% 2 of 2 districts
Average Composite SAT I Score (US Avg 1026) 1077 2 of 2 districts
Average ACT Score (US Avg 20.8) 21 2 of 2 districts
Available Graduate/PhD Programs 6 Available Colleges and/or Universities 15 Available Vocational and/or Technical Schools 2
Employment Unemployment and job growth rates provide an indicator of job availability in the local community. National rates from the Bureau of Labor Statistics are also provided. For each entry, the basis of the data (either MSA or number of counties in the MHA or the county of the installation) is indicated. The unemployment rates for the last five years: 1999 2000 2001 2002 2003 Local Data 2.6% 2.4% 3.1% 3.7% 3.5% National 4.2% 4.0% 4.7% 5.8% 6.0% Basis: MSA MSA MSA MSA MSA

Extracted from OSD BRAC database as of April 20, 2005
19
The annual job growth rate for the last five-years: 1999 2000 2001 2002 2003 Local Data 3.3% 3.0% 1.4% 1.0% 1.0% National 1.5% 2.4% .03% -.31% .86% Basis: MSA MSA MSA MSA MSA
Housing This attribute provides an indication of availability of housing, both sales and rental, in the local community. Note: According to the 2000 Census, Vacant Sale and Vacant Rental Units do not equal total Vacant Housing Units. Vacant housing units may also include units that are vacant but not on the market for sale or rent. For each entry, the basis of the data (either MSA or number of counties in the MHA or the county of the installation) is indicated.
Total Vacant Housing Units 94,577 Vacant Sale Units 19,464 Vacant Rental Units 29,918
Basis: MSA
Medical Providers This attribute provides an indicator of availability of medical care for military and DoD civilians in the local community. The table reflects the raw number of physicians/beds and ratio of physicians/beds to population. The basis of the data (either MSA or number of counties in the MHA or the county of the installation) is indicated.
# Physicians # Beds Population Local Community 15,810 9,163 4,923,153 Ratio 1:311 1:537
Basis: MSA
National Ratio (2003) 1:421.2 1:373.7
Safety/Crime The local community’s Uniform Crime Reports (UCR) Index for 2002 per 100,000 people and the national UCR based on information from the Federal Bureau of Investigation (FBI) for 2002 is provided. The basis of the data (either MSA or state) is indicated.
Local UCR 4,047.0 Basis: MSA National UCR 4,118.8
Extracted from OSD BRAC database as of April 20, 2005
20
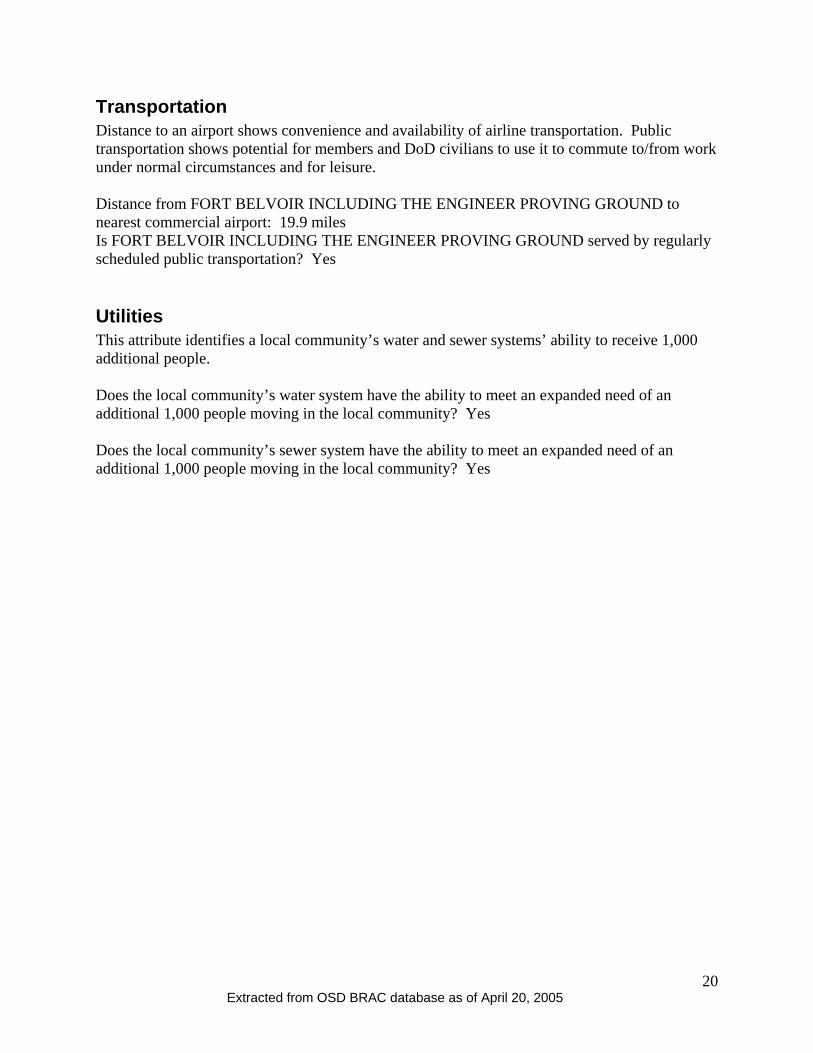
Transportation Distance to an airport shows convenience and availability of airline transportation. Public transportation shows potential for members and DoD civilians to use it to commute to/from work under normal circumstances and for leisure. Distance from FORT BELVOIR INCLUDING THE ENGINEER PROVING GROUND to nearest commercial airport: 19.9 miles Is FORT BELVOIR INCLUDING THE ENGINEER PROVING GROUND served by regularly scheduled public transportation? Yes
Utilities This attribute identifies a local community’s water and sewer systems’ ability to receive 1,000 additional people. Does the local community’s water system have the ability to meet an expanded need of an additional 1,000 people moving in the local community? Yes Does the local community’s sewer system have the ability to meet an expanded need of an additional 1,000 people moving in the local community? Yes

Page 1 of 4
SUMMARY OF SCENARIO ENVIRONMENTAL IMPACTS [TABS FINAL VERSION] SCENARIO # 401 TITLE: INT-0004 CONSOLIDATE NCR-BASED NGA AT FT BELVOIR GENERAL DESCRIPTION: Close NGA Dalecalia and Sumner sites, Bethesda MD. National Intelligence College, Ft Belvoir, VA; Reston 1,2,3 leased installations in Reston, VA; Newington buildings 8510, 8520 and 8530, Newington, VA; Dulles North, a leased installation in Dulles, VA; and Building 213 at the South East Federal Center, Washington DC. Relocate all functions to a new facility at the Engineer Proving Grounds, Ft Belvoir, VA. Realign the National Reconnaissance Office facility, Westfields, VA, by relocating all NGA functions to a new facility at the Engineer Proving Grounds, Ft Belvoir, VA. Note: Dalecarlia and Sumner sites are parcels belonging to Ft Myer. Some components of this scenario are Classified, however, this SSEI contains no Classified information. ANALYST:____________________ DATE: LAST UPDATED: 3/30/05
Env Resource Area
Gaining Installation Assessment Inst Name: Ft Belvoir
Analyst Comments (& data source(s) that drive assessment)
Air
Qua
lity
Impact Expected. Ft Belvoir is in moderate Non-Attainment for Ozone and PM 2.5. Added operations will require New Source Review permitting and Air Conformity Analysis.
#213 –Moderate Non-Attainment for Ozone (1-hour), proposed/projected for Non-Attainment for Ozone (8-hour) and PM2.5. #211 - No permit thresholds projected to be exceeded (substantial buffers exist on current permit) #220 – Has a Major Title V Permit and (Natural) Minor Operating Permit. #218/ISR – No mission impact/No restr.
Cul
tura
l/ A
rche
olog
ical
/Trib
al
Res
ourc
es
12 historic/prehistoric sites identified, with restrictions on construction in certain areas. 58 historic properties identified. Potential impacts may occur, since resources must be evaluated on a case-by-case basis, thereby causing increased delays and costs.
#230/231/233- 100% surveyed with 12 historic/prehistoric sites that restrict future construction in certain areas. No native peoples sites. #235 - 58 historic properties, 1 district and 4 resources outside of district. #201 – No mission operations constraints. #234 – No tribes interested in resources. #236 – No Programmatic Agreement. .
Dre
dgin
g
No Impact. #227 - If new activity requires dredging, then dredging may not be able to occur in the short term due to known dredging impediments #226, 228 - N/A
Land
Use
C
onst
rain
ts/
Sens
itive
R
esou
rce
Are
as
No Impact. Buildable Acres - approx 2,355 acres available, 150 req'd, (Based on Scenario summary) #201, 254– No restrictions/coordination required. #256 – One Sensitive Resource Area that restricts airspace. CERL Study – high encroachment projected.
Mar
ine
Mam
mal
s/
Mar
ine
Res
ourc
es/
Mar
ine
Sanc
tuar
ies No Impact #248, 250, 252, 253 – N/A

Page 2 of 4
Noi
se
No Impact. #239 - No noise contours off-installation.
Thre
aten
ed&
End
ange
red
Spec
ies/
Crit
ical
Hab
itat
Federally listed species includes Bald Eagle (Haliaeetus leucocephalus). Restrictions for TES include aircraft height restriction over nest during nesting season, and no land-disturbing training or timber clear cutting along undeveloped/undisturbed shorelines. Additional operations may further impact threatened / endangered species leading to additional restrictions on training or operations.
#249 Restrictions for TES are in place – no clear cutting or training 750 feet inland along undisturbed and undeveloped shoreline. Restricted helicopter flying #259 1 TES identified, Bald Eagle #260-262,264 - No habitat restrictions, no proposed critical habitat #263 – No candidate species ISR2 shows no impact.
Was
te
Man
agem
ent No Impact. #269 – No RCRA Subpart X Permit; none
required.
Wat
er R
esou
rces
No Impact. #276,278 – No restrictions #279 - Doesn't discharge to imp waterway. #293 – No water use restrictions have been reported #824/825 indicates adequate water avail IREM – potable water infr. can support 19,000 more people. #282 – No industrial wastewater treatment plant
Wet
land
s No impact. Land outside of wetlands is available for construction.
#251 – Installation was surveyed in 97 #257 – 10.2% of installation has wetlands that restrict operations, permits needed if planning to disturb wetlands.

Page 3 of 4
SUBJECT: SUMMARY OF SCENARIO ENVIRONMENTAL IMPACTS (CONTINUED); SCENARIO # 401
Env Resource
Area
Losing Installation Assessment Inst Name: Sumner & Dalecarlia
Sites
Analyst Comments (& data source(s) that drive assessment)
Air
Qua
lity No Impact.
Cul
tura
l/Arc
heol
ogic
al/
Trib
al
Res
ourc
es Minimal impact expected.
Surveys and consultation with the SHPO may be required to ensure protection of seven historical resources.
#230, 231, 232 - No arch resources, Native Peoples sites, no high potential for arch sites #235 - 7 historic properties reported
Dre
dgi
ng No Impact
Land
Use
C
onst
rain
ts/
Sens
itive
R
esou
rce
Are
as No impact. #273 - No MMRP sites
Installation has no operational ranges. Installation has no DERA sites (IRP or MMRP sites) Reference : http://63.88.245.60/DERPARC_FY03/do/home https://aerp.apgea.army.mil/aedbr/
Mar
ine
Mam
mal
s/M
arin
e R
esou
rces
/ M
arin
e S
t
No Impact
Noi
se No Impact
Thre
aten
ed&
En
dang
ered
Sp
ecie
s/
Crit
ical
H
abita
t
No impact #259, 260, 263,264 - No TES, Critical Habitat, or Candidate Species
Was
te
Man
age
men
t
No Impact #269 - No RCRA Subpart X permit #265 - No HW TSD facility #272 - No permitted solid waste disposal facility
Wat
er
Res
ourc
es
No Impact #275, 281 - No ground or surface water contamination reported

Page 4 of 4
Wet
land
s No impact.
SUBJECT: SUMMARY OF SCENARIO ENVIRONMENTAL IMPACTS (CONTINUED);
SCENARIO 401 IMPACTS OF COSTS
Env
Resource Area
Gaining Installation Inst Name:_Fort Belvoir
Losing Installation Inst Name: Sumner & Dalecarlia Sites
Envi
ronm
enta
l R
esto
ratio
n*
None None
Was
te M
anag
emen
t
None None
Envi
ronm
enta
l C
ompl
ianc
e
Ft Belvoir: Air Conformity Analysis ($25K-$75K), & New Source Review ($100K-$500K). Endangered Species Management (incl monitoring) - $20K-$2M Re-alignment NEPA at gaining base (EIS)- $1M (Based on size of facility/compound)
Environmental Baseline Survey (EBS) $300K-500K. Access controls / caretaker management of historical sites $500K - 1M (annually). Asbestos / lead paint removal - $200K - $1M.
COBRA Costs:
Ft Belvoir: Air Conformity Analysis $50K New Source Review $100K NEPA (EIS) - $1M.
EBS plus disposal EA - $550K.