natural england joint publication jp039
TRANSCRIPT

1
Natural England Joint Publication JP039
The Biodiversity Metric 3.0
Auditing and accounting for biodiversity
Calculation Tool:
Short Guide
First published July 2021
www.gov.uk/natural-england

2
Further information Natural England evidence can be downloaded from our Access to Evidence Catalogue. For more information about Natural England and our work see Gov.UK. For any queries contact the Natural England Enquiry Service on 0300 060 3900 or e-mail [email protected] .
Copyright
This report is published by Natural England under the Open Government Licence - OGLv3.0 for public sector information. You are encouraged to use, and reuse, information subject to certain conditions. For details of the licence visit Copyright. Natural England photographs are only available for non-commercial purposes. If any other information such as maps or data cannot be used commercially this will be made clear within the report.
ISBN 978-1-78354-780-7
© Natural England and other parties 2021

3
The Biodiversity Metric 3.0 – Calculation Tool Guidance This guide shows you how to use the biodiversity metric 3.0 calculation tool in six quick steps.
If you are an off-site habitat provider start at Step 3. Before starting you will need to know the following about your project:
• The types of habitat involved (on-site and off-site)
• The size of each habitat parcel (in hectares or, if linear, kilometres)
• If there will be any delays in creating/enhancing habitat
• If any of the habitat has been created/enhanced in advance
• The condition of each habitat parcel
• Whether the site(s) are in locations identified as local nature priorities
Contents
Start
STEP 1: Entering Baseline Data
STEP 2: Entering On- Site Post-Development Data
STEP 3: Entering Off-Site Data (NOTE: only needed when creating or enhancing
habitat outside the project ‘red line’ boundary)
STEP 4: Hedgerows, Lines of Trees, Rivers and Streams
STEP 5: The Results
STEP 6: Saving and Submitting Your Assessment
Additional Functions
4
START
Back to Top
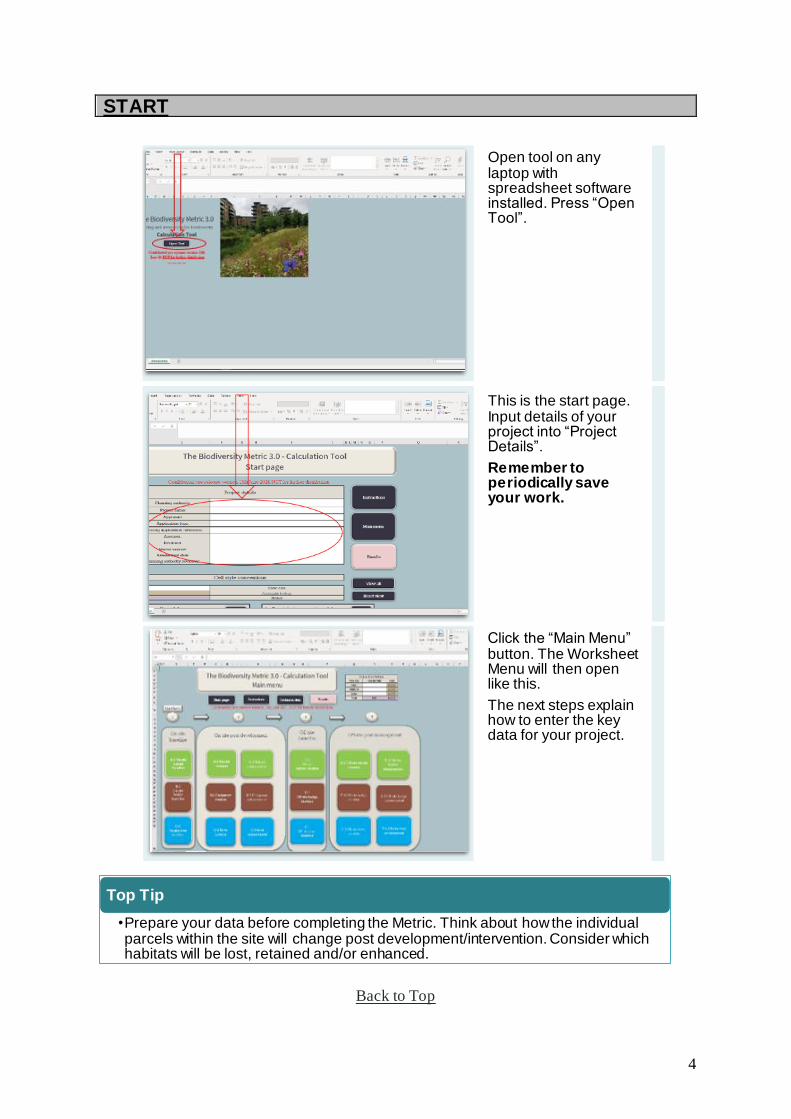
Click the “Main Menu” button. The Worksheet Menu will then open like this.
The next steps explain how to enter the key data for your project.
Open tool on any laptop with spreadsheet software installed. Press “Open Tool”.
This is the start page. Input details of your project into “Project Details”.
Remember to periodically save your work.
Top Tip
•Prepare your data before completing the Metric. Think about how the individual parcels within the site will change post development/intervention. Consider which habitats will be lost, retained and/or enhanced.
5
Step 1: Entering Baseline Data
Back to Top
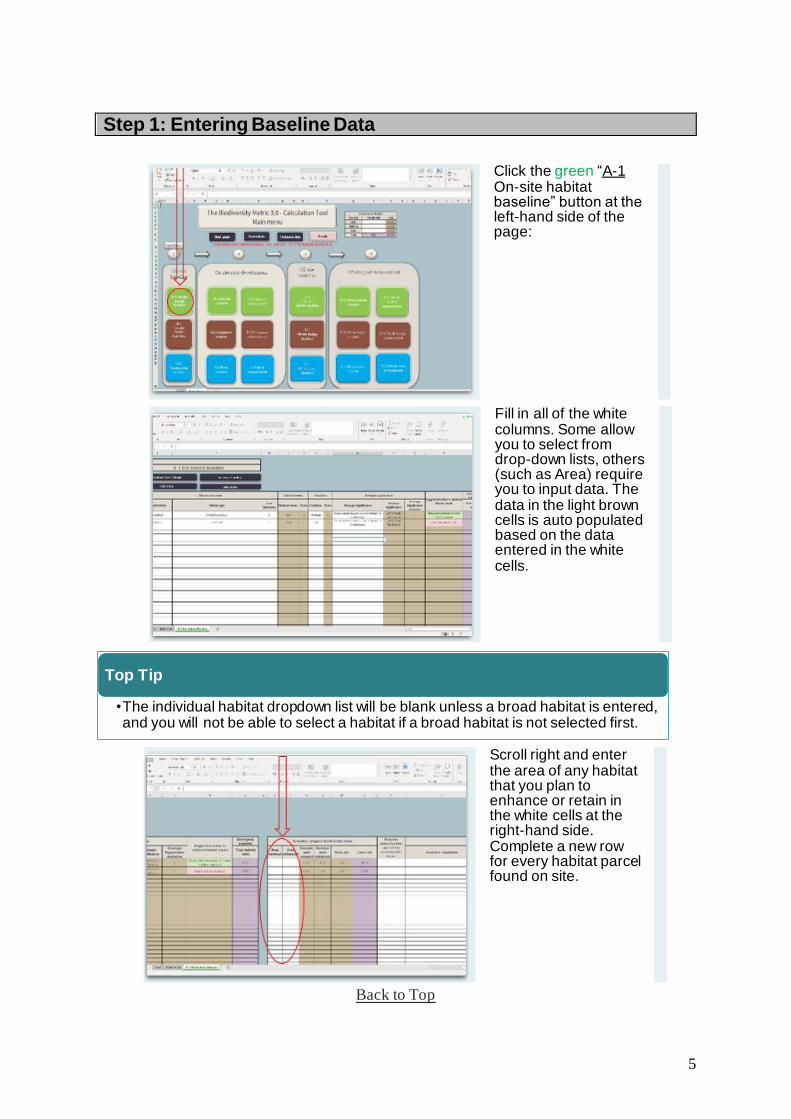
Click the green “A-1 On-site habitat baseline” button at the left-hand side of the page:
Fill in all of the white columns. Some allow you to select from drop-down lists, others (such as Area) require you to input data. The data in the light brown cells is auto populated based on the data entered in the white cells.
Top Tip
•The individual habitat dropdown list will be blank unless a broad habitat is entered, and you will not be able to select a habitat if a broad habitat is not selected first.
Scroll right and enter the area of any habitat that you plan to enhance or retain in the white cells at the right-hand side. Complete a new row for every habitat parcel found on site.

6
Back to Top
Top Tips
•If any of the habitat entered in the on-site or off-site baseline tabs is proposed for enhancement, ensure the full detailed view is used in the enhancement tab until all the baseline data is entered.
•An error will be generated if data is entered into both the advance creation and the delayed creation cells for the same habitat parcel.
An error flag will be generated if a Very High Distinctiveness habitat is entered into the metric unless it is retained, enhanced or it is confirmed that bespoke compensation has been agreed.
When you have finished entering all the site baseline data scroll left and click the “Main menu” button.
Top Tips
•Consider ‘Strategic significance’ separately for each individual habitat entry in the metric and not in a blanket fashion on a site wide basis.
•Use the comments section to record any additional justifications for the assessment of habitat type, condition or location if needed.

7
Step 2: Entering On-Site Post-Development Data
Back to Top
In the Main Menu there are two buttons to enter data relating to habitat present on-site post development: “A-2 Habitat Creation” and “A-3 Habitat Enhancement”.
Data can be entered into each as appropriate by clicking the relevant green button.
When you have finished entering the habitat creation data click the “Main menu” button in the top left of the screen to return to the worksheet menu.
Click on the “A-2 Habitat Creation” button and a new sheet will open.
Input data into each of the white columns as appropriate, in the same way as was done for the baseline habitat. You will need to complete a new row for each habitat parcel on-site.

8
Back to Top
If required, click the “A-3 Habitat Enhancement” button and enter data for any habitats enhanced by filling in the white columns.
You will notice that the current habitat data is prepopulated from the baseline data entered earlier.
When finished return to the “Main menu”.
If you are seeking to achieve a biodiversity net gain outcome on-site no further data input is needed. You can now skip to “Step 4” to check the results and see whether
an on-site biodiversity net gain has been achieved.
Top Tips
•If an error flag is triggered there is a discrepancy bigger than 0.01 ha between the baseline and post development site areas that needs to be addressed.
•If a trading error occurs in either the distinctiveness or condition movement cells in the enhancement tab the tool will not calculate a value. To resolve the error, change the proposed habitat or proposed condition.

9
Step 3: Entering Off-Site Data (NOTE: only needed when creating or enhancing habitat outside the project ‘red line’ boundary)
Back to Top
Projects creating or enhancing any habitats outside a development site will need to enter data in the off-site baseline habitat, off-site habitat enhancement and/or creation sheets.
These are accessed using the green buttons highlighted under points 3 and 4 to the right-hand side on the main menu.
Off-site data should be entered into the white columns on each of the off-site sheets, starting with the D-1 off-site habitat baseline sheet. In the same way as the previous sheets, the light brown cells auto populate based on the data input into the white cells.
When entering baseline data scroll right on the screen to ensure that all white data entry fields are completed, including any areas in the off-site baseline that will be retained or enhanced. Complete a new row for each habitat parcel.

10
Back to Top
Step 4: Hedgerows, Lines of Trees, Rivers and Streams
If your project contains hedgerows, lines of trees or rivers, or streams or watercourses then you will need to fill in the additional metric modules for these habitats.
An error flag will be generated if a Very High Distinctiveness habitat is entered into the metric, unless it is retained, enhanced or it is confirmed that bespoke compensation has been agreed.
When all “off-site” baseline data has been entered click on the ‘main menu’ button.
Then click on the “D-2 Off-site habitat creation” and / or “D-3 Off-site habitat enhancement” buttons as appropriate for your project and enter data into each of the white columns.
You will need to complete a new row for each habitat parcel on-site.

11
Step 5: The Results
Back to Top
On-site and off-site project data for these habitats should be entered in the same way as for area habitats by inputting data into the white columns.
Click on the “Results” to see whether or not your project has achieved a forecast net biodiversity gain.
On this screen you can click to see the “Headline results”, “Detailed results” or the ”Habitat trading summary”.
12
Back to Top
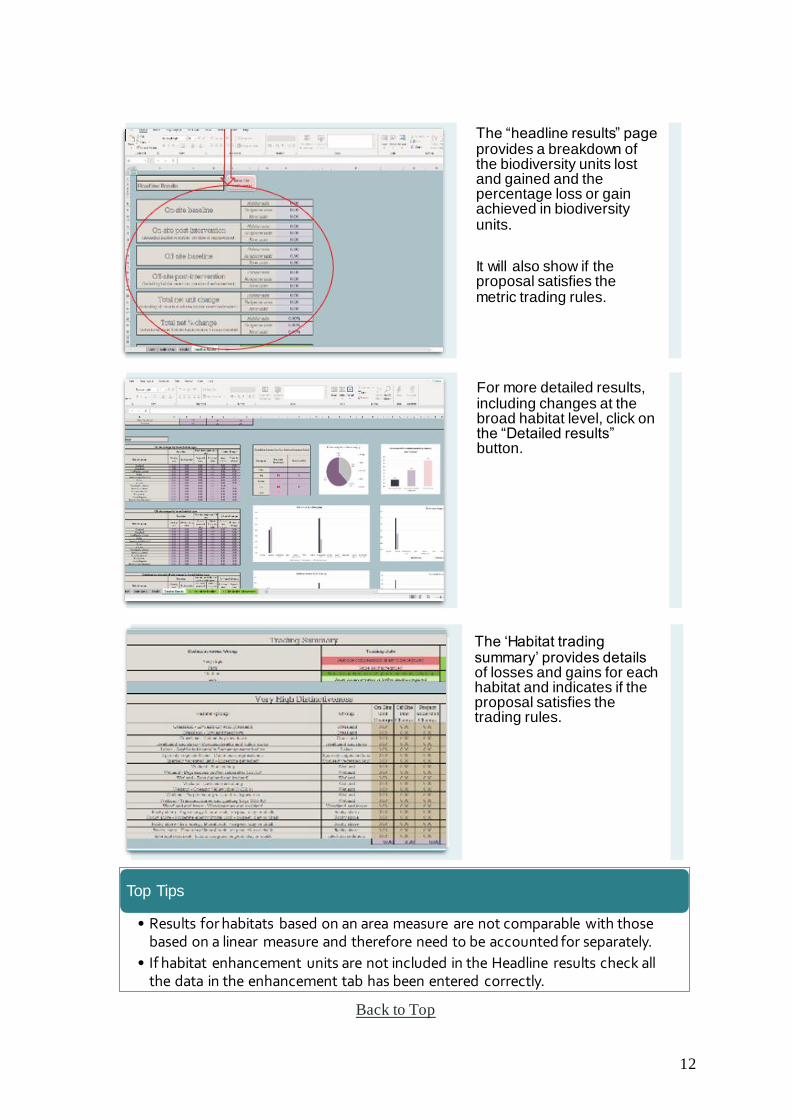
The “headline results” page provides a breakdown of the biodiversity units lost and gained and the percentage loss or gain achieved in biodiversity units.
It will also show if the proposal satisfies the metric trading rules.
The ‘Habitat trading summary’ provides details of losses and gains for each habitat and indicates if the proposal satisfies the trading rules.
For more detailed results, including changes at the broad habitat level, click on the “Detailed results” button.
Top Tips
• Results for habitats based on an area measure are not comparable with those based on a linear measure and therefore need to be accounted for separately.
• If habitat enhancement units are not included in the Headline results check all the data in the enhancement tab has been entered correctly.
13
Step 6: Saving and Submitting Your Assessment
Additional Functions
Back to Top
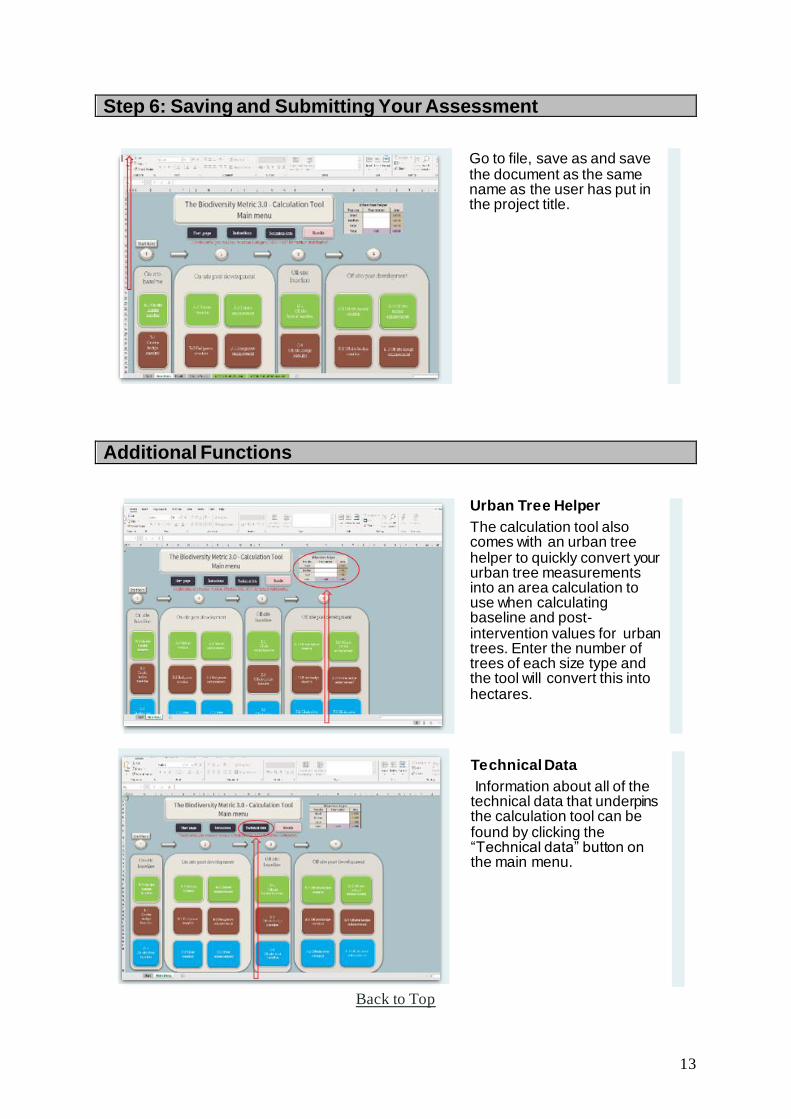
Go to file, save as and save the document as the same name as the user has put in the project title.
Urban Tree Helper
The calculation tool also comes with an urban tree helper to quickly convert your urban tree measurements into an area calculation to use when calculating baseline and post-intervention values for urban trees. Enter the number of trees of each size type and the tool will convert this into hectares.
Technical Data
Information about all of the technical data that underpins the calculation tool can be found by clicking the “Technical data” button on the main menu.

14
Back to Top
Instructions
A copy of these instructions can be accessed at any point in the tool by pressing the instructions button.
Additional help and detailed instructions describing all of the functions of the calculation tool can be found in Chapter 4 of The Biodiversity Metric 3.0 – User Guide