natural resources conservation service idaho … of the annual streamflow in the western united...
TRANSCRIPT

Natural Resources Conservation Service
Idaho Water Supply Outlook Report April 1, 2017
March 2017 – somewhere near Banner Summit on Highway 21 southwest of Stanley, Idaho.
Finding a place to park and getting over the snowbanks to enjoy beautiful Idaho is a challenge when the snow is this deep! Photo: Janet Kellam

For more water supply and resource management information:
Contact: Your local county Natural Resources Conservation Service Office Internet Web Address: http://www.id.nrcs.usda.gov/snow/ Natural Resources Conservation Service Snow Surveys 9173 West Barnes Drive, Suite C Boise, Idaho 83709-1574 (208) 378-5700 ext. 5
To join a free email subscription list contact us by email at: [email protected]
Water Supply Outlook Report Federal - State – Private Cooperative Snow Surveys
How forecasts are made Most of the annual streamflow in the western United States originates as snowfall that has accumulated in the mountains during the winter and early spring. As the snowpack accumulates, hydrologists estimate the runoff that will occur when the snow melts. Measurements of snow water equivalent at selected manual snow courses and automated SNOTEL sites, along with precipitation, antecedent streamflow, and indices of the El Niño / Southern Oscillation are used in computerized statistical and simulation models to produce runoff forecasts. Unless otherwise specified, all forecasts are for flows that would occur naturally without any upstream influences. Forecasts of any kind, of course, are not perfect. Streamflow forecast uncertainty arises from three primary sources: (1) uncertain knowledge of future weather conditions, (2) uncertainty in the forecasting procedure, and (3) errors in the data. The forecast, therefore, must be interpreted not as a single value but rather as a range of values with specific probabilities of occurrence. The middle of the range is expressed by the 50% exceedance probability forecast, for which there is a 50% chance that the actual flow will be above, and a 50% chance that the actual flow will be below, this value. To describe the expected range around this 50% value, four other forecasts are provided, two smaller values (90% and 70% exceedance probability) and two larger values (30%, and 10% exceedance probability). For example, there is a 90% chance that the actual flow will be more than the 90% exceedance probability forecast. The others can be interpreted similarly. The wider the spread among these values, the more uncertainty is in the forecast. As the season progresses, forecasts become more accurate, primarily because a greater portion of the future weather conditions become known; this is reflected by a narrowing of the range around the 50% exceedance probability forecast. Users should take this uncertainty into consideration when making operational decisions by selecting forecasts corresponding to the level of risk they are willing to assume about the amount of water to be expected. If users anticipate receiving a lesser supply of water, or if they wish to increase their chances of having an adequate supply of water for their operations, they may want to base their decisions on the 90% or 70% exceedance probability forecasts, or something in between. On the other hand, if users are concerned about receiving too much water (for example, threat of flooding), they may want to base their decisions on the 30% or 10% exceedance probability forecasts, or something in between. Regardless of the forecast value users choose for operations, they should be prepared to deal with either more or less water. (Users should remember that even if the 90% exceedance probability forecast is used, there is still a 10% chance of receiving less than this amount.) By using the exceedance probability information, users can easily determine the chances of receiving more or less water.
USDA is an equal opportunity provider and employer. To file a complaint of discrimination, write: USDA, Office of the Assistant Secretary for Civil Rights, Office of Adjudication, 1400 Independence Ave., SW, Washington, DC 20250-9410 or call (866) 632-9992 (Toll-free Customer Service), (800) 877-8339 (Local or Federal relay), (866) 377-8642 (Relay voice users).

IDAHO WATER SUPPLY OUTLOOK REPORT
April 1, 2017 SUMMARY For 99% of Idaho, there will be no surface water shortages this year. The concerns across most of the state, especially in southern Idaho, are of too much snow and how to safely release the excess water. There was abundant and early runoff in March; many streams set new record highs as the warm temperatures and rain flushed out the remaining valley snowpack and started melting the mid-elevation snowpack. Nighttime mountain temperatures, especially in the mid-elevation zones stayed above freezing for about 10 consecutive days in mid-March. This jumpstarted the snow melting process in these zones and resulted in high streamflows across the state. March rains up to 7,000 feet elevation also fed the streams, keeping reservoir operators on their toes. By month’s end, mountain temperatures were again below freezing at night. This reduced the amount of snowmelt water feeding the streams, so they temporarily subsided, but the snowpack is ripe and ready to melt. Rapid increases in streamflow can be expected with additional rainfall. All eyes will be watching the future weather for when warm temperatures return and if additional rain will accompany them. April weather will be critical in determining whether we gradually melt snow out of the mountains or if the higher elevation snowpack continues to accumulate though the month and even into May as it did in 2011. Short and median length forecasts for the next two weeks call for more of the same for the Pacific Northwest with the possibility of above average precipitation and cooler than normal temperatures. Keep an eye on the sky and your mouse on these weather forecasts to stay informed: Weather and Climate The stage is still set for abundant streamflow this year as a result of the October rains, water year-to-date precipitation nearly twice normal in central Idaho, record high snowpack in the central mountains, the fast response in streams following the recent rain events, and extended period of high water in many rivers. Less rain or snowmelt water will be needed to fill the soil moisture profile, which will lead to increased runoff. In heavy snow years, the snowpack is often more efficient in producing streamflow, which is a reason users should consider using the higher streamflow forecasts. Water demand for crops in the spring is a function of the spring precipitation, temperature and soil moisture; a wet spring may decrease the irrigation demand, which means additional water may be available to use or release. More details follow in this report; and tools are available on the Idaho Snow Survey web page. This year, the details are in the data and individual sites, comparing this year to other similar years will help users better understand what may happen. SNOWPACK Don’t let the melting of the valley and mid-elevation snowpack and abundant water flowing in the rivers across the state fool you, there is still incredible snow yet to melt in our mountains before the rivers can return to lower, safer levels. March brought rain in the lower elevation, and up to 7,000 feet in the Boise Mountains that helped to melt more of the mid-elevation snow across the state. This is good news: a gradual melt of this year’s abundant snowpack with a reduction in the snow covered area in the mountains. This is a good time to be a splitter rather than a lumper. Users need to look at the details of the hydro-climate conditions in their particular basin. These include but are not limited to record high fall rains, saturation level of the soils, increase in spring/base flows, impact of March

precipitation falling as rain or snow in the higher elevation, and current snowline elevations especially on the north-facing slopes. This winter’s intense storms and higher winds on the ridge tops has redistributed the snow more than we have observed in recent years. Sightings of huge cornices keep coming in along with snow drifting and accumulation in different places this year. These large cornices will continue feeding the streams well into summer and some mountain passes and trails may not be passable until late summer. Users can use these reports to compare March 1 SWE to April 1 SWE to better understand changes in the snow water content in their basins: Idaho and all Western States Monthly Snowpack Reports Use this link to compare historic data SWE data to this year’s data: Snow Course and SNOTEL Snow Water Data Tables - Period of Record - Individual Sites And historic snow indexes: Historical Snow Indexes and Snow Graphs for Idaho Basins The following is a summary of the snow conditions from north to south: Northern Idaho (Panhandle Region and Clearwater basins) are the closest to normal conditions across the state that we will see this year, but this was not reflected in the March runoff levels. Overall, the Salmon River basin snow is 132% of median, the highest since 2006 and generally increase from 117% in the Little Salmon to 158% in the Salmon basin above Salmon. The Weiser snowpack is mostly melted, but that’s normal for this time of year, and it’s at 110% of median – its highest since 2011. Overall, the Payette basin is 116% of median with the SF Payette at 139%. The snowpack in the Boise headwaters is 140 to 150% of median. The Boise basin snowpack is the highest since 1997, and still the 8th highest since records start in 1961. The Big Wood basin snowpack remains record high since the 7-station index starts in 1961. The Little Wood snow is 174% of median, the highest since 1983 and 6th highest since the records start in 1961. At 172% of median, the Big Lost snowpack is the highest since 1997 and 9th highest since 1961. As a whole, the Henrys Fork snowpack is 114% of median but quickly increases to 133% on the eastside of the Tetons in the Snake basin above Jackson Lake. The rest of the Upper Snake River tributaries range from 179% of median in the Hoback basin to 119% in the Salt. The Snake above Palisades Reservoir snowpack is 141% of median, the highest since 1997, and 11th highest since the 17-station index starts in 1961. The Willow, Blackfoot and Portneuf basins range from 86 to 115% of median. At 142% of median, the Bear River snowpack is at its highest since 1997, and 8th highest since 1961. Snowpacks across Idaho’s southern border range from 100 to 120% of median and have lost some of the mid-elevation snow, but the higher elevation snow is still near normal or higher. PRECIPITATION March precipitation varied across the state ranging from 67% of average in the Mud Lake area to 235% of average in the Payette and Priest basins. The near normal or below normal is actually good news in some parts of the state and may ease concerns when this year’s snowpacks melt. The lowest March precipitation fell in the Little Lost to Mud Lake region at 67 to 90% of average. Basins that received 180 to 220% of average in March include the West Central Mountains and all the basins north to the Canadian border. Amounts were 120 to 160% of average in the Big Wood, Henrys Fork, Snake above Palisades Reservoir, and Owyhee basins. Near normal amounts (95 to 115%) were measured in the Little Wood, Big Lost, eastern Idaho, Oakley, Salmon Falls, Bruneau and Bear River basins. Water year-to-date precipitation is above average across the entire state with a few basins (Little Wood and Big Lost) receiving almost twice their normal amounts, 190%, since the water year started October 1, 2016. The lowest amounts received this water year range from 125 to 145% of average in Idaho’s most northern and most southern basins. These include the Weiser, Salmon, Clearwater, and

Panhandle Region in the north and Idaho’s southern basins stretching from the Owyhee River to Goose Creek. It is interesting to note many basins across the state have received more than their annual precipitation amounts in the first 6 months of this water year, with 6 more months to go. The Big Wood basin leads the state having received 122% of its annual precipitation while the Mud Lake area and Little Lost basin have received 70 to 80% of their annual precipitation. For more details, view the Idaho SNOTEL Precipitation Update Report #2 (MTD Prec as Percent of Average Monthly Prec & YTD Prec as Percent of Average Annual Prec) RESERVOIRS Idaho’s reservoirs are actively catching, storing and releasing water from the abundant and early runoff the past two months as reservoir operators try to make space in the reservoirs for when the higher elevation snow melts. Here is a brief summary from north to south: Lake Pend Oreille and Priest Lake are 131% and 149% of average, 65% and 85% full, respectively. In contrast, Lake Coeur d’Alene is 280% of average, and currently storing nearly twice its summer capacity of 238,500 acre-feet. Dworshak Reservoir is storing average amounts at two-thirds full. The Payette reservoir system is 123% of average, 79% full, with releases being made from Cascade Reservoir. The Boise reservoir system is 112% of average, 67% full and releases began in mid-February to make room for when the high elevation snow melts. Lake Lowell is 88% full while Mann Creek reservoir is 70% full. Moving east to the Big Wood basin, Magic Reservoir is nearly full and passing inflows. Camas Creek just peaked at 5,200 CFS (cubic-feet per second) and the Big Wood River is reaching 1,200 CFS in Hailey. Little Wood and Mackay reservoirs are 65% of average, 45% full. Little Wood Reservoir started releasing water at the end of January. The snowpack that feeds the Little Wood Reservoir is the highest since 1983. Mackay Reservoir started making gradual releases in mid-February to melt the snow and ice in the stream channel. The flow reached Arco on March 22 and was spotted approaching Highway 26 at the rest areas. With the Big Lost River predicted at 191% of average these flows should continue reaching the sinks, which is good news. Jackson Lake and Palisades Reservoir have a combined storage of 75% of average, and are 44% full as drafting continues to lower the storage levels. Henrys Lake, Island Park Reservoir and Grassy Lake are 105 to 110% of average, which is 86 to 97% full. Ririe and Blackfoot reservoirs are 145% of average, about 80% full, while American Falls Reservoir is storing near average amounts and 87% full. Across southern Idaho, Bear Lake increased 122,800 acre-feet in March to 108% of average and is now half full. This is one of the largest March increases since storage records began in 1912. Releases are being made from Montpelier Reservoir as it decreased to 1,300 acre-feet, 1/3 full. Releases were occurring at Oakley Reservoir which is now 158% of average, 62% full. Salmon Falls Reservoir had its greatest increase ever between January 31 and March 31 – 67,900 acre-feet; its previous maximum increase was 41,200 acre-feet in 1986. Wildhorse Reservoir is 164% of average, 90% full while Lake Owyhee is 136% of average, which is nearly full at 94% with releases being made out of the Glory Hole. Brownlee Reservoir was drafted almost 250,000 acre-feet in March even with huge amounts of water flowing down the Snake River. Brownlee outflows reached nearly 75,000 cfs to bring the reservoir storage levels to 76% of average, 59% of capacity.

STREAMFLOW Streamflow forecasts mirror the record high snowpack in central Idaho. Residents can expect April through September volumes to be near record high in the Little Wood basin and the highest volumes seen in the Big Wood River since 1997. The Big Lost River below Mackay Reservoir is forecast at 183% of average, which is the highest April through September runoff volumes since the consecutive big water years of 1982, 1983 and 1984. This is great news for the aquifers in the Big Lost basin. The Henrys Fork is forecast at 116% of average, but the forecasts quickly increase to 150 to 180% of average in the Snake River tributaries in Wyoming. The Snake River near Heise is forecast at 166% of average, 100,000 acre-feet less or just 2% less than the April through September that occurred in 2011. Most streams in the Bear River basin are forecast at 150 to 250% of average. Luckily, Bear Lake is only half full and able to capture more of the runoff. Southern Idaho’s high desert drainages are forecast at 125 to 170% of average. The Payette basin forecasts are now in the 135 to 170% of average range thanks to better than twice normal March precipitation. That’s a 13 to 20% point increase! All Boise basin rivers are forecast at 170 to 200% of average. The SF Boise is seeing the highest volumes because of its proximity to the high snowpack zone observed the southern part of the Central Mountains extending to the Wood and Lost River drainages. Forecasts have increased in the Salmon basin and to the north because of March precipitation. The MF Salmon River and Salmon River above Salmon are forecast at 180% of average while White Bird is forecast at 146%. Streams in the Clearwater basin to the Canadian border are forecast at 100 to 125% of average. This means there will be abundant water supplies across Idaho this year, even too much in some basins. April and even May can bring more snow to the higher elevations. We are not in the dry season yet and most, if not all, basins are still primed from the abundant moisture received this water year. Therefore, it is a good idea evaluate water management decisions based on the higher projected volumes, the 30% and 10% chance of exceedance forecasts. These exceedance forecasts are explained in the Surface Water Supply Index (SWSI) tables and graphs which can be used to find similar runoff years. Note: The volumes referenced in these narratives are the 50% Chance of Exceeding Forecast, unless otherwise noted. Users may wish to use a different forecast to reduce their risk of having too much or too little water. RECREATION March weather brought more powder days for winter recreationists and allowed river runners to get their boats wet with all the runoff that occurred. Remember, the goal is to return home to ski or ride another day. For the river runners, the same is true as rivers will be big this year. Just look at the Owyhee River and how long it has and will be floatable this year. Receiving a year’s worth of precipitation in less than 6 months has primed the soils and increased spring flows. This means our rivers will be high for an extended period of time this spring and summer no matter how the snow melts. Add more rain and snow on the already high snowpacks and the peak flows will be even higher. Compound that by another extended period of non-freezing night time temperatures or record high day time temperatures and we’ll see how the rivers respond when the high elevation snow starts melting. Three things are certain this year: 1) there will be an extended high water season, 2) the streamflow peaks are likely to be big, and 3) there will be a long streamflow recession season for all to enjoy after

the snowmelt streamflow peaks have passed. So be patient, keep an eye on the sky, check the weather for changing conditions, and know your boating skills and boating limits. Joint Meeting of the Western Snow Conference & Weather Modification Association You still have time to registration for the 85th Annual Western Snow Conference. The Weather Modification Association will be in Boise, Idaho April 17-20, 2017 for joint meeting and very interesting discussions. http://www.westernsnowconference.org/ This first combined conference will kick off April 17 with a short course entitled "Tracing the Effects of Cloud Seeding through the Hydrologic Cycle." April 18 will begin with a joint plenary session, followed by concurrent sessions of oral and poster presentations. On April 20, a technical tour will include a visit to the Dry Creek Experimental Watershed, a NRCS SNOTEL site, and a collaborative weather station for youth education.

IDAHO SURFACE WATER SUPPLY INDEX (SWSI) April 1, 2017 The Surface Water Supply Index (SWSI) is a predictive indicator of surface water availability within a watershed for the spring and summer water use season. The index is calculated by combining pre-runoff reservoir storage (carryover) with forecasts of spring and summer streamflow. SWSI values are scaled from +4.0 (abundant supply) to -4.0 (extremely dry), with a value of zero indicating a median water supply as compared to historical occurrences. The SWSI analysis period is from 1981 to present. SWSI values provide a more comprehensive outlook of water availability by combining streamflow forecasts and reservoir storage where appropriate. The SWSI index allows comparison of water availability between basins for drought or flood severity analysis. Threshold SWSI values have been determined for some basins to indicate the potential for agricultural irrigation water shortages.
BASIN or REGION
SWSI Value
Most Recent Year With Similar SWSI
Value
Agricultural Water Supply Shortage May Occur When
SWSI is Less Than
Spokane 1.4
1996 NA
Clearwater 1.8
2009 NA
Salmon 3.0
1999
NA
Weiser 1.8
1995
NA
Payette 3.8
1996 NA
Boise 4.0
1983 -2.0
Big Wood 4.0
1983 0.3
Little Wood 3.9 1983
-1.5
Big Lost 3.2 1995
0.8
Little Lost 3.6 1995 1.5
Teton 2.7 1986 -3.9
Henrys Fork 2.7
1999 -1.7
Snake (Heise) 3.6
2011 -1.7
Oakley 3.2 2006 0.1
Salmon Falls 3.6 2011 -0.8
Bruneau 3.2 2006 NA
Owyhee 3.1 1998
-2.6
Bear River 2.4
2011 -3.9
SWSI SCALE, PERCENT CHANCE OF EXCEEDANCE, AND INTERPRETATION
-4 -3 -2 -1 0 1 2 3 4 |------|------|------|------|------|------|------|------|
99% 87% 75% 63% 50% 37% 25% 13% 1% ------------------------------------------------------------------------ |Much | Below | Near Normal | Above | Much | |Below | Normal | Water Supply | Normal | Above | ---------------------------------------------------------------------- NA=Not Available / Not Applicable; Note: The Percent Chance of Exceedance is an indicator of how often a range of SWSI values
might be expected to occur. Each SWSI unit represents about 12% of the historical occurrences. As an example of interpreting the
above scale, the SWSI can be expected to be greater than -3.0, 87% of the time and less than -3.0, 13% of the time. Half the time,
the SWSI will be below and half the time above a value of zero. The interval between -1.5 and +1.5 described as "Near Normal
Water Supply," represents three SWSI units and would be expected to occur about one-third (36%) of the time.

#*
#*
")
#*
#*#*#*#*
#*#*#*#*
#*
#*#*
#*#*#*
#*
#*#*
#*#*#*#*
#*#*
#*#*
#*#*#*#*#*
#*
")
#*
#*
#* #*
#*#*#*
#*#*
#*
#*
#*#*
#*
#*#*
#*#*#*
#*
#*#*
#*#*#*
#*
#*#*
#*
#*#*#*
#*
#*#*
")
#*
#*
SALMON RIVERBASINS
SOUTHSIDE SNAKERIVER BASINS
PANHANDLE REGION
CLEARWATER BASIN
BEAR RIVER BASIN
UPPER SNAKE RIVER BASIN
WEST CENTRAL
BASINS
WOOD & LOST BASINS
Copyright:© 2014 Esri
0 50 100 150 20025Miles
¯
This map is prepared by the USDA-NRCS Idaho Snow Survey Office. http://www.nrcs.usda.gov/wps/portal/nrcs/main/id/snow/
Water Supply Forecast April 1, 2017
Forecasted April to July Flow as a Percentage of the 1981 to 2010 Average
Provisional Data - Subject to Revision
#* > 180%#* 150 - 179%#* 130 - 149%#* 110 - 129%") 90 - 109%
#*70 - 89%#*
50 - 69%#*
25 - 49%#*
0 - 24%( No Data
AverageForecast
Above Average
BelowAverage

SALMON RIVERBASINS
SOUTHSIDE SNAKERIVER BASINS
PANHANDLE REGION
CLEARWATER BASIN
BEAR RIVER BASIN
UPPER SNAKE RIVER BASIN
WEST CENTRAL
BASINS
WOOD & LOST BASINS
96
142
158
113
113
145
98
102
105
103
103
115
110
133
111
179
172
115
123
152
133
107
120
112
107
103
106
143
104
119
86
178
139
98
137
126
114144
117
111
85
174
136
Copyright:© 2014 Esri
0 50 100 150 20025Miles
¯
This map is prepared by the USDA-NRCS Idaho Snow Survey Office. http://www.nrcs.usda.gov/wps/portal/nrcs/main/id/snow/
Percent of Median SnowpackApril 1, 2017
Basin-wide Snow Water Equivilant as a Percentage of the 1981 to 2010 Median
MedianSnowpack
Above
Below
Provisional Data - Subject to Revision
>= 150%130 - 149%110 - 129%90 - 109%70 - 89%50 -69%0 - 49%No Data

SALMON RIVERBASINS
SOUTHSIDE SNAKERIVER BASINS
PANHANDLE REGION
CLEARWATER BASIN
BEAR RIVER BASIN
UPPER SNAKE RIVER BASIN
WEST CENTRAL
BASINS
WOOD & LOST BASINS
122
119
180
93
191
217
95
200
199
213
203
153
150
206
111
112
154
88
104
230119
198
90
197
118
103
130
239
228
117
96
158
243
233
186
249129
207
226
67
109
222
221
Copyright:© 2014 Esri
0 50 100 150 20025Miles
¯
This map is prepared by the USDA-NRCS Idaho Snow Survey Office. http://www.nrcs.usda.gov/wps/portal/nrcs/main/id/snow/
Monthly Precipitation March 2017
Monthly Precipitation as a Percentage of the 1981 to 2010 Average
Provisional Data - Subject to Revision
>= 150%130 - 149%110 - 129%90 - 109%70 - 89%50 -69%0 - 49%No Data
AveragePrecipitation
Above
Below

SALMON RIVERBASINS
SOUTHSIDE SNAKERIVER BASINS
PANHANDLE REGION
CLEARWATER BASIN
BEAR RIVER BASIN
UPPER SNAKE RIVER BASIN
WEST CENTRAL
BASINS
WOOD & LOST BASINS
136
164
175
141
143
157
123
135
122
131
126
151
155
134
197
192
148
157
143
169
135
124
154
135
152
164
150
161
140
156
180
163
166
183154
160172
132
139
190
133
134
162
Copyright:© 2014 Esri
0 50 100 150 20025Miles
¯
This map is prepared by the USDA-NRCS Idaho Snow Survey Office. http://www.nrcs.usda.gov/wps/portal/nrcs/main/id/snow/
Water Year to Date Precipitation April 1, 2017
Basin-wide Water Year Precipitation as a Percentage of the 1981 to 2010 Average
Provisional Data - Subject to Revision
>= 150%130 - 149%110 - 129%90 - 109%70 - 89%50 -69%0 - 49%No Data
AveragePrecipitation
Above
Below

Panhandle Region
April 1, 2017
WATER SUPPLY OUTLOOK
Precipitation and Snowpack
For the second consecutive month, precipitation was much above average in the Panhandle, ranging
from 191% of average in the Kootenai River drainage to 239% of average in the Priest River
watershed. Water year-to-date precipitation is now 125 to 160% of average. Snowpack in the
Panhandle Region is near normal for April 1, and ranges from 90 to 110% of median, except for the
Moyie drainage at 136%.
Storage and Streamflow Forecasts
Lake Coeur d’Alene is 280% of average, while Lake Pend Oreille and Priest Lake are 131% and
149% of average, respectively. Streamflow forecasts are slightly above normal, and forecast volumes
range from 100 to 125% of average in these northern Idaho basins. Water supplies should be
adequate during the runoff season based on these April 1 streamflow forecasts.

Priest Lake 100.9 83.1 67.6 119.3
Lake Coeur d' Alene 463.6 181.3 165.5 238.5
Noxon Rapids Reservoir 330.1 310.7 309.9 335.0
Lake Pend Oreille 1011.9 605.6 773.0 1561.3
Hungry Horse Lake 2918.5 2529.4 2081.0 3451.0
Flathead Lake 1080.0 715.8 762.6 1791.0
Kootenai ab Bonners Ferry 26 113% 96%
Reservoir Storage (KAF): End of March
Reservoir NameCurrent
(KAF)Last YR
Average
(KAF)
Capacity
(KAF)
Spokane River 17 98% 95%
Palouse River 2 111% 76%
Coeur d' Alene River 10 98% 92%
St. Joe River 6 103% 98%
Priest River 5 106% 111%
Rathdrum Creek 3 93% 112%
Basin Name# of
Sites
% of Median
2017 2016
Moyie River 6 136% 100%
3630 2850
Normals based on 1981-2010 reference period: streamflow, precipitation, & reservoir normals are averages, SWE normals are medians.
1) 90% and 10% exceedance probabilities are actually 95% and 5%
2) Forecasts are for unimpaired flows. Actual flow will be dependent on management of upstream reservoirs and diversions
Watershed Snowpack Analysis: April 1, 2017
2980 3350 2620
APR-SEP 2350 2730 2990 105% 3250
Spokane R at Long Lake APR-JUL 2120 2480 2730 104%
2390
APR-SEP 2020 2360 2600 105% 2830 3170 2480
1420 1120
Spokane R nr Post Falls 2 APR-JUL 1950 2280 2510 105% 2730 3070
1240 1350 1050
APR-SEP 1030 1150 1230 110% 1310
St. Joe R at Calder 2 APR-JUL 975 1090 1160 110%
700
APR-SEP 545 660 735 99% 815 930 740
1180 830
NF Coeur dAlene R at Enaville APR-JUL 515 625 700 100% 775 885
1030 1110 780
APR-SEP 895 980 1040 125% 1090
Priest R nr Priest River 2 APR-JUL 855 930 980 126%
11800
APR-SEP 12900 14000 14800 116% 15700 16800 12800
15600 11500
Pend Oreille Lake Inflow 2 APR-JUL 12000 13000 13700 116% 14400 15500
12900 14300 10500
APR-SEP 10900 12500 13300 116% 14000
Clark Fork R at Whitehorse Rapids 1 & 2 APR-JUL 10200 11600 12200 116%
117
APR-SEP 131 144 154 125% 163 176 123
11300 7590
Boundary Ck nr Porthill APR-JUL 126 139 147 126% 156 169
9360 10100 6600
APR-SEP 9110 9850 10200 134% 10500
Kootenai R at Leonia 1 & 2 APR-JUL 7950 8690 9030 137%
375
APR-SEP 400 455 490 127% 525 580 385
10%
(KAF)
30yr Avg
(KAF)
Moyie R at Eastport APR-JUL 385 440 475 127% 510 560
Panhandle Region Streamflow Forecasts - April 1, 2017
Forecast Exceedance Probabilities for Risk Assessment
<--Drier-------------------Projected Volume-------------------Wetter-->
Forecast PointForecast
Period
90%
(KAF)
70%
(KAF)
50%
(KAF) % Avg
30%
(KAF)

Clearwater River Basin
April 1, 2017
WATER SUPPLY OUTLOOK
Precipitation and Snowpack
During March, precipitation was more than twice average for the Clearwater River basin, and water
year-to-date precipitation increased to 124% of average, which, amazingly, is the lowest in the state.
A series of storms in early March briefly increased the snowpack to above normal conditions, but
things settled down to end March and the basin returned to near normal snowpack conditions.
Storage and Streamflow Forecasts
Dworshak Reservoir is 97% of average, which is 67% of capacity and nearly identical to the March 1
storage levels. Streamflow forecasts are similar to February 1 forecasts, with all forecasts between
112% and 115% of average. Near normal water supplies are expected which will provide an
enjoyable fishing and rafting season as well.

Reservoir NameCurrent
(KAF)Last YR
Average
(KAF)
Capacity
(KAF)
Dworshak Reservoir 2336.9 2918.4 2417.0 3468.0
Selway River 4 103% 100%
Clearwater Basin Total 16 103% 102%
NF Clearwater River 8 102% 105%
Lochsa River 2 107% 98%
Normals based on 1981-2010 reference period: streamflow, precipitation, & reservoir normals are averages, SWE normals are medians.
1) 90% and 10% exceedance probabilities are actually 95% and 5%
2) Forecasts are for unimpaired flows. Actual flow will be dependent on management of upstream reservoirs and diversions
Watershed Snowpack Analysis: April 1, 2017
Basin Name# of
Sites
% of Median
2017 2016
Reservoir Storage (KAF): End of March
6890
APR-SEP 6930 7740 8290 114% 8840 9660 7270
5990 4540
Clearwater R at Spalding 2 APR-JUL 6590 7360 7890 115% 8410 9180
5230 5710 4310
APR-SEP 4290 4790 5140 113% 5490
Clearwater R at Orofino APR-JUL 4090 4580 4900 114%
2410
APR-SEP 2420 2710 2920 114% 3120 3410 2570
1910 1480
Dworshak Reservoir Inflow 2 APR-JUL 2270 2560 2750 114% 2950 3230
1700 1820 1410
APR-SEP 1460 1600 1690 114% 1780
Lochsa R nr Lowell APR-JUL 1400 1530 1610 114%
1920
APR-SEP 1960 2140 2270 112% 2400 2580 2020
10%
(KAF)
30yr Avg
(KAF)
Selway R nr Lowell APR-JUL 1870 2050 2170 113% 2290 2460
Clearwater River Basin Streamflow Forecasts - April 1, 2017
Forecast Exceedance Probabilities for Risk Assessment
<--Drier-------------------Projected Volume-------------------Wetter-->
Forecast PointForecast
Period
90%
(KAF)
70%
(KAF)
50%
(KAF) % Avg
30%
(KAF)

Salmon River Basin
April 1, 2017
WATER SUPPLY OUTLOOK
Precipitation and Snowpack
The Salmon River basin received 185% of average precipitation during March. The western most
Salmon River areas received the most precipitation with respect to normal. The Little Salmon, SF
Salmon, and MF Salmon received 220 to 230% of average monthly precipitation. Water year-to-date
precipitation is 143% of average. Snowpack in the Salmon River basin as a whole is 132% of median
with the Salmon basin above the town of Salmon reporting the highest at 158%.
Storage and Streamflow Forecasts
Continued above average precipitation during March helped maintain high forecast volumes.
Forecast volumes range from 180 to 185% of average for the MF Salmon and Salmon River above
Salmon, while the remaining forecast points are projected at 140 to 150% of average. The much
above normal high elevation snowpack will keep river levels high long into the summer for the Salmon
River and its tributaries.

Salmon Basin Total 27 132% 114%
SF Salmon River 3 123% 108%
Little Salmon River 4 117% 112%
Lemhi River 9 133% 122%
MF Salmon River 3 145% 114%
Basin Name# of
Sites
% of Median
2017 2016
Salmon River ab Salmon 8 158% 116%
9790 5940
Normals based on 1981-2010 reference period: streamflow, precipitation, & reservoir normals are averages, SWE normals are medians.
1) 90% and 10% exceedance probabilities are actually 95% and 5%
2) Forecasts are for unimpaired flows. Actual flow will be dependent on management of upstream reservoirs and diversions
Watershed Snowpack Analysis: April 1, 2017
8260 8900 5370
APR-SEP 7400 8110 8590 145% 9080
Salmon R at White Bird APR-JUL 6770 7400 7830 146%
191
APR-SEP 250 275 295 144% 310 335 205
455 290
Johnson Ck at Yellow Pine Id APR-JUL 230 255 275 144% 295 320
405 440 270
APR-SEP 365 395 410 141% 430
Sf Salmon R nr Krassel Ranger Station APR-JUL 335 365 385 143%
690
APR-SEP 1180 1310 1390 181% 1480 1600 770
176 90
MF Salmon R at MF Lodge APR-JUL 1080 1190 1270 184% 1340 1460
126 150 74
APR-SEP 96 117 133 148% 149
Lemhi R nr Lemhi APR-JUL 79 98 111 150%
775
APR-SEP 1400 1520 1610 179% 1690 1820 900
10%
(KAF)
30yr Avg
(KAF)
Salmon R at Salmon APR-JUL 1220 1330 1400 181% 1470 1580
Salmon River Streamflow Forecasts - April 1, 2017
Forecast Exceedance Probabilities for Risk Assessment
<--Drier-------------------Projected Volume-------------------Wetter-->
Forecast PointForecast
Period
90%
(KAF)
70%
(KAF)
50%
(KAF) % Avg
30%
(KAF)

West Central Basins
April 1, 2017
WATER SUPPLY OUTLOOK
Precipitation and Snowpack
March marks the second consecutive month of more than double average monthly precipitation for
the West Central basins. Monthly precipitation ranged from 206% (Weiser River basin) to 234%
(Payette River basin), and water year-to-date precipitation ranges from 134% to 166% of average in
these basins, with the Boise River basin being the highest. Snowpack ranges from 104% of median in
the NF Payette basin to 150% in the Boise headwater streams. The snowpack below 6,000 ft began
melting during March; however, minimal melt was observed above 6,000 ft. This means the
impressive high mountain snowpack is still in place.
Storage and Streamflow Forecasts
Reservoir storage in the Boise system is 112% of average, 67% of capacity. The Payette system is
123% of average, 79% of capacity. Streamflow forecasts in the Weiser basin and upper North Fork
Payette are about 130% of average, and increase to well above average (160 to 200% of average) in
the South Fork Payette and Boise River basin. Water supplies will be more than adequate in the
Payette and Boise River basins with reservoir releases now being made and should be plentiful in the
Weiser River basin.

Mann Creek Reservoir 7.8 8.5 8.7 11.1
Sub-Basin Total 678.0 571.9 552.7 855.1
Lake Lowell 145.6 145.6 113.0 165.2
Deadwood Reservoir 120.1 79.1 90.6 161.9
Cascade Reservoir 557.9 492.8 462.1 693.2
Lucky Peak Reservoir 170.3 234.1 167.5 293.2
Sub-Basin Total 675.8 752.0 603.2 1015.6
Anderson Ranch Reservoir 376.7 285.7 245.3 450.2
Arrowrock Reservoir 128.8 232.2 190.4 272.2
Weiser Basin Total 8 110% 105%
Reservoir Storage (KAF): End of March
Reservoir NameCurrent
(KAF)Last YR
Average
(KAF)
Capacity
(KAF)
Payette Basin Total 16 116% 106%
Mann Creek 1 107% 116%
NF Payette River 9 104% 104%
SF Payette River 5 139% 113%
Canyon Creek 2 119% 101%
Boise Basin Total 17 130% 105%
MF & NF Boise Rivers 6 137% 109%
Mores Creek 4 114% 100%
Basin Name# of
Sites
% of Median
2017 2016
SF Boise River 8 152% 112%
700 400
Normals based on 1981-2010 reference period: streamflow, precipitation, & reservoir normals are averages, SWE normals are medians.
1) 90% and 10% exceedance probabilities are actually 95% and 5%
2) Forecasts are for unimpaired flows. Actual flow will be dependent on management of upstream reservoirs and diversions
Watershed Snowpack Analysis: April 1, 2017
555 665 370
APR-SEP 360 450 515 129% 590
Weiser R nr Weiser APR-JUL 335 420 485 131%
1480
APR-SEP 2220 2390 2500 153% 2620 2790 1630
240 131
Payette R nr Horseshoe Bend 2 APR-JUL 2130 2260 2360 159% 2450 2590
210 225 123
APR-SEP 190 205 215 164% 225
Deadwood Reservoir Inflow 2 APR-JUL 181 194 205 167%
400
APR-SEP 685 740 780 171% 820 880 455
1000 640
SF Payette R at Lowman APR-JUL 615 665 700 175% 735 790
900 975 625
APR-SEP 725 810 865 135% 920
NF Payette R nr Banks 2 APR-JUL 720 795 845 135%
485
APR-SEP 555 620 660 133% 705 770 495
120 83
NF Payette R at Cascade 2 APR-JUL 540 600 640 132% 685 745
106 116 80
APR-SEP 87 96 103 124% 110
Lake Fork Payette R nr McCall APR-JUL 84 93 100 125%
1260
APR-SEP 2300 2440 2530 186% 2620 2760 1360
2230 1140
APR-JUL 2150 2280 2380 189% 2470 2610
240 275 119
Boise R nr Boise 2 APR-JUN 1970 2050 2100 184% 2160
APR-SEP 164 194 215 181%
635
Mores Ck nr Arrowrock Dam APR-JUL 158 187 210 183% 230 265 115
1090 585
APR-SEP 950 1020 1060 167% 1110 1170
1060 1110 510
Boise R nr Twin Springs APR-JUL 880 945 985 168% 1030
APR-SEP 920 975 1020 200%
30yr Avg
(KAF)
SF Boise R at Anderson Ranch Dam 2 APR-JUL 875 930 965 203% 1000 1060 475
<--Drier-------------------Projected Volume-------------------Wetter-->
Forecast PointForecast
Period
90%
(KAF)
70%
(KAF)
50%
(KAF) % Avg
30%
(KAF)
10%
(KAF)
West Central Basins Streamflow Forecasts - April 1, 2017
Forecast Exceedance Probabilities for Risk Assessment

Wood & Lost River Basin
April 1, 2017
WATER SUPPLY OUTLOOK
Precipitation and Snowpack
Of the 15 SNOTEL sites in or near the Little Lost, Big Lost, Little Wood, Big Wood, and Camas
Creek drainages, 14 sites have received the most water-year-to-date precipitation through
April 1 on record (SNOTEL precipitation data generally dates back to the early 1980s), and 1
site is reporting the second most on record (Lost-Wood Divide). Water year-to-date precipitation
ranges from 180 to 195% of average in the Wood and Big Lost River basins, while the Little Lost and
basins to the east range from 135 to 160% of average. Minimal snowmelt occurred above 7,000 feet
during March, and the snowpack is still 170 to 180% of median in the Big Wood, Little Wood, and Big
Lost basins, while the Little Lost and Birch-Medicine Lodge drainages are 120 to 140% of median.
Storage and Streamflow Forecasts
Mackay Reservoir is 66% of average (46% of capacity), Little Wood Reservoir is 65% of average
(43% of capacity), and Magic Reservoir is 208% of average (97% of capacity). Streamflow forecasts
generally range from 180% to 270% of average, except for the Little Lost, which is forecast at 146%
of average. With reservoir releases being made from these three major reservoirs this year, water
surplus is a concern but any excess water will benefit aquifers. Detailed snow and streamflow
forecast information is available on the following page.

Magic Reservoir 186.1 89.1 89.3 191.5
Mackay Reservoir 20.5 34.4 31.2 44.4
Little Wood Reservoir 12.8 22.3 19.8 30.0
Big Wood Basin Total 12 163% 111%
Reservoir Storage (KAF): End of March
Reservoir NameCurrent
(KAF)Last YR
Average
(KAF)
Capacity
(KAF)
Big Wood River ab Hailey 7 178% 115%
Camas Creek 5 126% 102%
Fish Creek 3 187% 100%
Little Wood River 4 174% 98%
Big Lost River ab Mackay 6 178% 108%
Big Lost Basin Total 7 172% 107%
Birch-Medicine Lodge Creeks 4 120% 121%
Little Lost River 4 143% 108%
Basin Name# of
Sites
% of Median
2017 2016
Camas-Beaver Creeks 4 85% 96%
795 265
Normals based on 1981-2010 reference period: streamflow, precipitation, & reservoir normals are averages, SWE normals are medians.
1) 90% and 10% exceedance probabilities are actually 95% and 5%
2) Forecasts are for unimpaired flows. Actual flow will be dependent on management of upstream reservoirs and diversions
Watershed Snowpack Analysis: April 1, 2017
695 755 250
APR-SEP 590 650 690 260% 735
Big Wood R bl Magic Dam 2 APR-JUL 560 620 660 264%
82
APR-SEP 154 194 225 271% 255 305 83
560 182
Camas Ck nr Blaine APR-JUL 154 194 225 274% 255 305
480 525 170
APR-SEP 405 450 480 264% 515
Big Wood R ab Magic Reservoir APR-JUL 380 420 450 265%
235
APR-SEP 495 530 555 209% 575 615 265
235 83
Big Wood R at Hailey APR-JUL 445 475 495 211% 520 550
200 220 77
APR-SEP 171 190 205 247% 215
Little Wood R nr Carey 2 APR-JUL 161 178 190 247%
69
APR-SEP 157 175 187 249% 199 215 75
330 150
Little Wood R ab High Five Ck APR-JUL 146 163 174 252% 185 200
250 280 123
APR-SEP 220 250 275 183% 295
Big Lost R bl Mackay Reservoir APR-JUL 186 215 235 191%
159
APR-SEP 260 290 310 172% 330 360 180
63 34
Big Lost R at Howell Ranch APR-JUL 230 255 275 173% 295 320
45 50 28
APR-SEP 39 46 51 150% 56
Little Lost R nr Howe APR-JUL 33 38 41 146%
30yr Avg
(KAF)
Camas Ck at Camas APR-JUL 33 42 49 175% 55 65 28
Forecast Exceedance Probabilities for Risk Assessment
<--Drier-------------------Projected Volume-------------------Wetter-->
Forecast PointForecast
Period
90%
(KAF)
70%
(KAF)
50%
(KAF) % Avg
30%
(KAF)
10%
(KAF)
Wood and Lost Basins Streamflow Forecasts - April 1, 2017

Upper Snake River Basin
April 1, 2017
WATER SUPPLY OUTLOOK
Precipitation and Snowpack
Precipitation was above average for the fourth consecutive month, with individual basins generally
receiving 100 to 150% of average. Water year-to-date precipitation ranges from 150 to 200% of
average in these Upper Snake basins. Snowpacks vary significantly, ranging from 90 to 180% of
median in the Upper Snake basins, with greater amounts higher up in the system in the Hoback
(179%) and Pacific Creek (156%) drainages. As a whole, the Snake River above American Falls
snowpack is 128% of median.
Storage and Streamflow Forecasts
Combined reservoir storage for Palisades and Jackson Lake is 75% of average, and 44% of capacity.
Overall, the 8 major reservoirs are 92% of average, and 66% of capacity. Streamflow forecasts
decreased slightly from last month and generally range from 140 to 180% of average in the Upper
Snake River basin, with lesser amounts forecast for the Henrys Fork, Falls River, and Teton River
(110 to 135%). Water supplies will be plentiful for the numerous water users who rely on the Upper
Snake River and its tributaries and, depending on snowmelt timing, could present water management
challenges.

Basin-Wide Total 3018.9 3377.8 3267.1 4577.9
Blackfoot Reservoir 276.3 194.2 186.4 337.0
American Falls Reservoir 1462.8 1366.6 1497.0 1672.6
Sub-Basin Total 217.4 214.3 205.4 240.8
Ririe Reservoir 63.8 52.7 44.8 80.5
Island Park Reservoir 116.4 120.4 111.8 135.2
Grassy Lake 13.5 13.5 12.3 15.2
Sub-Basin Total 998.5 1550.0 1333.5 2247.0
Henrys Lake 87.5 80.4 81.3 90.4
Jackson Lake 536.6 570.9 430.7 847.0
Palisades Reservoir 461.9 979.1 902.8 1400.0
Snake River ab American Falls 55 128% 102%
Reservoir Storage (KAF): End of March
Reservoir NameCurrent
(KAF)Last YR
Average
(KAF)
Capacity
(KAF)
Blackfoot River 5 103% 105%
Portneuf River 6 115% 110%
Snake ab Palisades Resv 35 141% 101%
Willow Creek - Ririe 7 86% 107%
Greys River 4 145% 106%
Salt River 5 119% 102%
Gros Ventre River 5 144% 98%
Hoback River 6 179% 100%
Pacific Creek 4 156% 107%
Buffalo Fork 4 137% 102%
Henrys Fork ab Rexburg 20 114% 96%
Snake River ab Jackson Lake 13 133% 99%
Henrys Fork-Falls River 11 115% 96%
Teton River 9 112% 98%
Normals based on 1981-2010 reference period: streamflow, precipitation, & reservoir normals are averages, SWE normals are medians.
1) 90% and 10% exceedance probabilities are actually 95% and 5%
2) Forecasts are for unimpaired flows. Actual flow will be dependent on management of upstream reservoirs and diversions
Watershed Snowpack Analysis: April 1, 2017
Basin Name# of
Sites
% of Median
2017 2016
2650
APR-SEP 3580 4280 4760 169% 5240 5950 2810
138 81
Snake R at Neeley 2 APR-JUL 3380 4010 4430 167% 4860 5480
98 110 64
APR-SEP 86 101 112 138% 123
Portneuf R at Topaz APR-JUL 69 82 90 141%
3780
Willow Ck nr Ririe 2 APR-JUL 52 72 87 143% 104 132 61
6010 3240
APR-SEP 5600 5990 6260 166% 6530 6920
6060 6430 3500
Snake R nr Heise 2 APR-JUL 4830 5180 5420 167% 5660
APR-SEP 5190 5560 5810 166%
370
Snake R nr Irwin 2 APR-JUL 4490 4820 5050 168% 5270 5600 3010
610 300
APR-SEP 505 570 615 166% 660 730
635 670 360
Salt R ab Reservoir nr Etna APR-JUL 420 475 515 172% 555
APR-SEP 545 580 610 169%
2500
Greys R ab Reservoir nr Alpine APR-JUL 470 505 525 172% 545 580 305
4210 2170
APR-SEP 4080 4300 4450 178% 4600 4820
530 570 320
Snake R ab Reservoir nr Alpine 2 APR-JUL 3590 3780 3900 180% 4030
APR-SEP 435 475 500 156%
173
Buffalo Fk ab Lava Ck nr Moran APR-JUL 385 420 440 157% 465 495 280
325 164
APR-SEP 250 275 295 171% 310 340
1280 1370 845
Pacific Ck at Moran APR-JUL 240 265 280 171% 300
APR-SEP 1070 1160 1220 144%
510
Snake R nr Moran 2 APR-JUL 975 1050 1110 145% 1160 1240 765
775 465
APR-SEP 665 720 755 148% 795 850
2250 2500 1790
Snake R at Flagg Ranch APR-JUL 605 655 690 148% 725
APR-SEP 1670 1920 2080 116%
435
Henrys Fk nr Rexburg 2 APR-JUL 1330 1520 1650 118% 1780 1970 1400
580 365
APR-SEP 465 530 570 131% 615 680
280 315 193
Teton R nr St Anthony APR-JUL 395 450 485 133% 525
APR-SEP 205 235 260 135%
435
Teton R nr Driggs APR-JUL 164 190 210 136% 225 250 154
530 365
APR-SEP 475 525 560 129% 590 640
855 945 710
Falls R nr Ashton 2 APR-JUL 390 430 460 126% 490
APR-SEP 640 730 795 112%
30yr Avg
(KAF)
Henrys Fk nr Ashton 2 APR-JUL 480 555 605 114% 655 730 530
Forecast Exceedance Probabilities for Risk Assessment
<--Drier-------------------Projected Volume-------------------Wetter-->
Forecast PointForecast
Period
90%
(KAF)
70%
(KAF)
50%
(KAF) % Avg
30%
(KAF)
10%
(KAF)
Upper Snake River Basin Streamflow Forecasts - April 1, 2017

Southside Snake
River Basins
April 1, 2017
WATER SUPPLY OUTLOOK
Precipitation and Snowpack
Monthly precipitation was close to average during March in the Southside Snake River basins, and
ranged from 90 to 120% of average. The water year-to-date precipitation is 135 to 150% of average.
As the red line illustrates in the snowpack chart above, widespread snowmelt began in early March,
but as temperatures cooled to end the month and precipitation returned, melt slowed and snowpack
increases were observed. Area snowpacks are now closer to “normal,” and range from 95 to 115% of
median.
Storage and Streamflow Forecasts
Oakley Reservoir is currently 158% of average (62% capacity), Salmon Falls is 199% of average
(61% of capacity), while Lake Owyhee is 136% of average (94% of capacity). Streamflow forecasts
range from 130 to 155% of average for Oakley Reservoir Inflow, Salmon Falls Creek and the Bruneau
River, while the Owyhee basin is forecast at about 170%. Releases are being made from Owyhee
Reservoirs as water managers watch the situation closely. Irrigators and water sport recreationalists
can expect plentiful runoff in 2017.

Lake Owyhee 675.4 404.8 495.8 715.0
Brownlee Reservoir 832.3 1020.1 1102.0 1420.0
Salmon Falls Reservoir 111.2 42.7 56.0 182.6
Wild Horse Reservoir 64.3 25.0 39.2 71.5
Reservoir NameCurrent
(KAF)Last YR
Average
(KAF)
Capacity
(KAF)
Oakley Reservoir 46.8 22.4 29.6 75.6
Owyhee Basin Total 20 96% 67%
Owyhee Basin Snotel Total 8 100% 95%
Bruneau River 8 113% 113%
Reynolds Creek 7 96% 101%
Goose-Trapper Creeks 6 107% 112%
Salmon Falls Creek 8 105% 120%
Basin Name# of
Sites
% of Median
2017 2016
Raft River 6 111% 110%
36800 22280
Normals based on 1981-2010 reference period: streamflow, precipitation, & reservoir normals are averages, SWE normals are medians.
1) 90% and 10% exceedance probabilities are actually 95% and 5%
2) Forecasts are for unimpaired flows. Actual flow will be dependent on management of upstream reservoirs and diversions
Watershed Snowpack Analysis: April 1, 2017Reservoir Storage (KAF): End of March
29600 33000 19848
APR-SEP 25700 29500 31300 140% 33000
Snake R bl Lower Granite Dam 1 APR-JUL 23200 26600 28100 142%
375
APR-SEP 420 570 670 165% 770 915 405
865 365
Owyhee R bl Owyhee Dam 2 APR-JUL 385 530 630 168% 730 875
695 840 345
APR-SEP 380 525 625 171% 720
Owyhee R nr Rome APR-JUL 360 505 600 174%
22
APR-SEP 21 30 36 171% 42 50 21
10.6 7.6
Owyhee R nr Gold Ck 2 APR-JUL 23 31 37 168% 43 52
325 370 192
Reynolds Ck at Tollgate APR-JUL 4.9 6.6 7.7 101% 8.9
APR-SEP 225 265 295 154%
74
Bruneau R nr Hot Spring APR-JUL 215 255 285 156% 310 355 183
128 70
APR-SEP 82 97 108 146% 118 133
43 52 26
Salmon Falls Ck nr San Jacinto APR-JUL 78 93 103 147% 113
APR-SEP 24 31 37 142%
6.1
Oakley Reservoir Inflow APR-JUL 22 28 33 138% 39 48 24
7.9 5
APR-SEP 6.2 7.1 7.7 126% 8.3 9.3
34 43 20
Trapper Ck nr Oakley APR-JUL 5.1 5.8 6.4 128% 7
APR-SEP 17.6 24 29 145%
30yr Avg
(KAF)
Goose Ck abv Trapper Ck nr Oakley APR-JUL 16.5 22 27 144% 32 40 18.7
Forecast Exceedance Probabilities for Risk Assessment
<--Drier-------------------Projected Volume-------------------Wetter-->
Forecast PointForecast
Period
90%
(KAF)
70%
(KAF)
50%
(KAF) % Avg
30%
(KAF)
10%
(KAF)
Southside Snake River Basins Streamflow Forecasts - April 1, 2017

Bear River Basin
April 1, 2017
WATER SUPPLY OUTLOOK
Precipitation and Snowpack
For the fourth consecutive month, monthly precipitation was above average in the Bear River basin.
Water year-to-date precipitation is now 164% of average for the Bear River above the Idaho-Utah
border. Snowpacks in the Bear River drainages decreased in March but are still 120 to 165% of
median.
Storage and Streamflow Forecasts
Bear Lake storage is 108% of average, which is 51% of capacity. Montpelier Reservoir is being
drafted and is now 68% of average, 33% full. The April through July streamflow forecasts range
from 160 to 190% of average in the Bear River basin and its tributaries, except for the Bear River
below Stewart Dam, which is forecast at 260% of average. Water shortages will not be an issue in
the Bear River and its tributaries this year.

Montpelier Reservoir 1.3 2.8 1.9 4.0
Reservoir NameCurrent
(KAF)Last YR
Average
(KAF)
Capacity
(KAF)
Bear Lake 663.7 530.9 611.9 1302.0
Bear River ab ID-UT Line 25 142% 107%
Malad River 1 109% 100%
Mink Creek 4 119% 113%
Cub River 3 134% 104%
Bear River ab WY-ID Line 11 157% 105%
Montpelier Creek 2 142% 113%
Basin Name# of
Sites
% of Median
2017 2016
Smiths-Thomas Forks 4 165% 105%
140 43
Normals based on 1981-2010 reference period: streamflow, precipitation, & reservoir normals are averages, SWE normals are medians.
1) 90% and 10% exceedance probabilities are actually 95% and 5%
2) Forecasts are for unimpaired flows. Actual flow will be dependent on management of upstream reservoirs and diversions
Watershed Snowpack Analysis: April 1, 2017Reservoir Storage (KAF): End of March
270 285 111
Blacksmith Fk nr Hyrum APR-JUL 97 110 119 277% 127
Logan R nr Logan APR-JUL 230 245 255 230%
205
Little Bear at Paradise APR-JUL 84 95 102 227% 109 120 45
580 183
APR-SEP 400 470 520 254% 570 640
205 225 104
Bear R bl Stewart Dam 2 APR-JUL 370 435 475 260% 515
APR-SEP 167 184 195 188%
3.8
Smiths Fk nr Border APR-JUL 145 160 170 191% 180 195 89
320 128
Big Ck nr Randolph APR-JUL 3.7 5.8 7.2 189% 8.6 10.7
250 295 121
APR-SEP 156 205 235 184% 270
Bear R ab Resv nr Woodruff APR-JUL 143 188 220 182%
112
APR-SEP 159 180 194 158% 210 230 123
10%
(KAF)
30yr Avg
(KAF)
Bear R nr UT-WY State Line APR-JUL 145 164 177 158% 190 210
Bear River Basin Streamflow Forecasts - April 1, 2017
Forecast Exceedance Probabilities for Risk Assessment
<--Drier-------------------Projected Volume-------------------Wetter-->
Forecast PointForecast
Period
90%
(KAF)
70%
(KAF)
50%
(KAF) % Avg
30%
(KAF)

Streamflow Adjustment List for All Forecasts Published in Idaho Water Supply Outlook Report: Streamflow forecasts are projections of runoff volumes that would occur
without influences from upstream reservoirs or diversions. These values are referred to as natural, unregulated or adjusted flows. To make these adjustments, changes in reservoir storage, diversions, and inter-basin transfers are added or subtracted from the observed (actual) streamflow volumes. The following list documents the adjustments made for each forecast point. (Revised Feb. 2015). Panhandle Region
Kootenai R at Leonia, MT (2) + Lake Koocanusa storage change Moyie R at Eastport – no corrections Boundary Ck nr Porthill – no corrections Clark Fork R at Whitehorse Rapids (2) + Hungry Horse storage change + Flathead Lake storage change + Noxon Res storage change Pend Oreille Lake Inflow (2) + Pend Oreille R at Newport, WA + Hungry Horse Res storage change + Flathead Lake storage change + Noxon Res storage change + Lake Pend Oreille storage change + Priest Lake storage change Priest R nr Priest R (2) + Priest Lake storage change NF Coeur d' Alene R at Enaville - no corrections St. Joe R at Calder- no corrections Spokane R nr Post Falls (2) + Lake Coeur d' Alene storage change Spokane R at Long Lake, WA (2) + Lake Coeur d' Alene storage change + Long Lake, WA storage change Clearwater River Basin
Selway R nr Lowell - no corrections Lochsa R nr Lowell - no corrections Dworshak Res Inflow (2) + Clearwater R nr Peck - Clearwater R at Orofino + Dworshak Res storage change Clearwater R at Orofino - no corrections Clearwater R at Spalding (2) + Dworshak Res storage change Salmon River Basin
Salmon R at Salmon - no corrections Lemhi R nr Lemhi – no corrections MF Salmon R at MF Lodge – no corrections SF Salmon R nr Krassel Ranger Station – no corrections Johnson Creek at Yellow pine – no corrections Salmon R at White Bird - no corrections West Central Basins
Boise R nr Twin Springs - no corrections SF Boise R at Anderson Ranch Dam (2) + Anderson Ranch Res storage change Mores Ck nr Arrowrock Dam – no corrections
Boise R nr Boise (2) + Anderson Ranch Res storage change + Arrowrock Res storage change + Lucky Peak Res storage change SF Payette R at Lowman - no corrections Deadwood Res Inflow (2) + Deadwood R bl Deadwood Res nr Lowman + Deadwood Res storage change Lake Fork Payette R nr McCall – no corrections NF Payette R at Cascade (2) + Payette Lake storage change + Cascade Res storage change NF Payette R nr Banks (2) + Payette Lake storage change + Cascade Res storage change Payette R nr Horseshoe Bend (2) + Deadwood Res storage change + Payette Lake storage change + Cascade Res storage change Weiser R nr Weiser - no corrections Wood and Lost Basins
Little Lost R bl Wet Ck nr Howe - no corrections Big Lost R at Howell Ranch - no corrections Big Lost R bl Mackay Res nr Mackay (2) + Mackay Res storage change Little Wood R ab High Five Ck – no corrections Little Wood R nr Carey (2) + Little Wood Res storage change Big Wood R at Hailey - no corrections Big Wood R ab Magic Res (2) + Big Wood R nr Bellevue (1912-1996) + Big Wood R at Stanton Crossing nr Bellevue (1997 to present) + Willow Ck (1997 to present) Camas Ck nr Blaine – no corrections Magic Res Inflow (2) + Big Wood R bl Magic Dam + Magic Res storage change Upper Snake River Basin
Falls R nr Ashton (2) + Grassy Lake storage change + Diversions from Falls R ab nr Ashton Henrys Fork nr Ashton (2) + Henrys Lake storage change + Island Park Res storage change Teton R nr Driggs - no corrections Teton R nr St. Anthony (2) - Cross Cut Canal into Teton R + Sum of Diversions for Teton R ab St. Anthony + Teton Dam for water year 1976 only
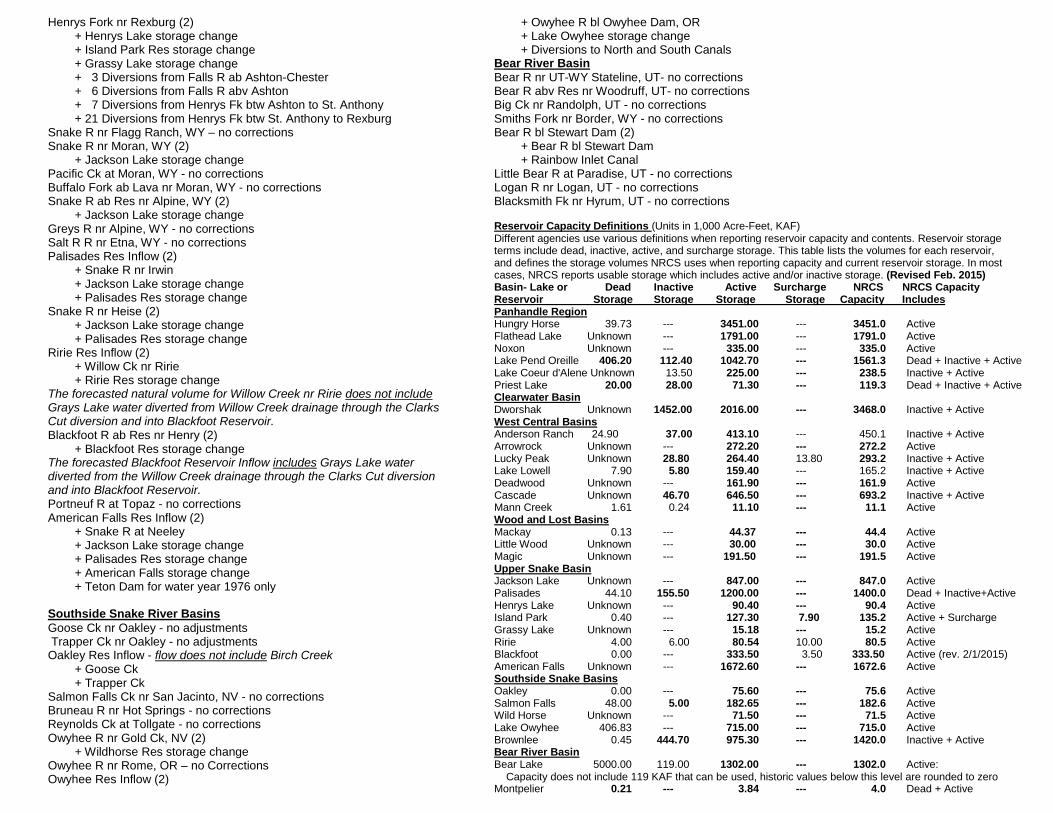
Henrys Fork nr Rexburg (2) + Henrys Lake storage change + Island Park Res storage change + Grassy Lake storage change + 3 Diversions from Falls R ab Ashton-Chester + 6 Diversions from Falls R abv Ashton + 7 Diversions from Henrys Fk btw Ashton to St. Anthony + 21 Diversions from Henrys Fk btw St. Anthony to Rexburg Snake R nr Flagg Ranch, WY – no corrections Snake R nr Moran, WY (2) + Jackson Lake storage change Pacific Ck at Moran, WY - no corrections Buffalo Fork ab Lava nr Moran, WY - no corrections Snake R ab Res nr Alpine, WY (2) + Jackson Lake storage change Greys R nr Alpine, WY - no corrections Salt R R nr Etna, WY - no corrections Palisades Res Inflow (2) + Snake R nr Irwin + Jackson Lake storage change + Palisades Res storage change Snake R nr Heise (2) + Jackson Lake storage change + Palisades Res storage change Ririe Res Inflow (2) + Willow Ck nr Ririe + Ririe Res storage change The forecasted natural volume for Willow Creek nr Ririe does not include Grays Lake water diverted from Willow Creek drainage through the Clarks Cut diversion and into Blackfoot Reservoir. Blackfoot R ab Res nr Henry (2) + Blackfoot Res storage change The forecasted Blackfoot Reservoir Inflow includes Grays Lake water diverted from the Willow Creek drainage through the Clarks Cut diversion and into Blackfoot Reservoir. Portneuf R at Topaz - no corrections American Falls Res Inflow (2) + Snake R at Neeley + Jackson Lake storage change + Palisades Res storage change + American Falls storage change + Teton Dam for water year 1976 only Southside Snake River Basins
Goose Ck nr Oakley - no adjustments Trapper Ck nr Oakley - no adjustments Oakley Res Inflow - flow does not include Birch Creek + Goose Ck + Trapper Ck Salmon Falls Ck nr San Jacinto, NV - no corrections Bruneau R nr Hot Springs - no corrections Reynolds Ck at Tollgate - no corrections Owyhee R nr Gold Ck, NV (2) + Wildhorse Res storage change Owyhee R nr Rome, OR – no Corrections Owyhee Res Inflow (2)
+ Owyhee R bl Owyhee Dam, OR + Lake Owyhee storage change + Diversions to North and South Canals Bear River Basin
Bear R nr UT-WY Stateline, UT- no corrections Bear R abv Res nr Woodruff, UT- no corrections Big Ck nr Randolph, UT - no corrections Smiths Fork nr Border, WY - no corrections Bear R bl Stewart Dam (2) + Bear R bl Stewart Dam + Rainbow Inlet Canal Little Bear R at Paradise, UT - no corrections Logan R nr Logan, UT - no corrections Blacksmith Fk nr Hyrum, UT - no corrections Reservoir Capacity Definitions (Units in 1,000 Acre-Feet, KAF) Different agencies use various definitions when reporting reservoir capacity and contents. Reservoir storage terms include dead, inactive, active, and surcharge storage. This table lists the volumes for each reservoir, and defines the storage volumes NRCS uses when reporting capacity and current reservoir storage. In most cases, NRCS reports usable storage which includes active and/or inactive storage. (Revised Feb. 2015) Basin- Lake or Dead Inactive Active Surcharge NRCS NRCS Capacity Reservoir Storage Storage Storage Storage Capacity Includes Panhandle Region Hungry Horse 39.73 --- 3451.00 --- 3451.0 Active Flathead Lake Unknown --- 1791.00 --- 1791.0 Active Noxon Unknown --- 335.00 --- 335.0 Active Lake Pend Oreille 406.20 112.40 1042.70 --- 1561.3 Dead + Inactive + Active Lake Coeur d'Alene Unknown 13.50 225.00 --- 238.5 Inactive + Active Priest Lake 20.00 28.00 71.30 --- 119.3 Dead + Inactive + Active Clearwater Basin Dworshak Unknown 1452.00 2016.00 --- 3468.0 Inactive + Active West Central Basins Anderson Ranch 24.90 37.00 413.10 --- 450.1 Inactive + Active Arrowrock Unknown --- 272.20 --- 272.2 Active Lucky Peak Unknown 28.80 264.40 13.80 293.2 Inactive + Active Lake Lowell 7.90 5.80 159.40 --- 165.2 Inactive + Active Deadwood Unknown --- 161.90 --- 161.9 Active Cascade Unknown 46.70 646.50 --- 693.2 Inactive + Active Mann Creek 1.61 0.24 11.10 --- 11.1 Active Wood and Lost Basins Mackay 0.13 --- 44.37 --- 44.4 Active Little Wood Unknown --- 30.00 --- 30.0 Active Magic Unknown --- 191.50 --- 191.5 Active Upper Snake Basin Jackson Lake Unknown --- 847.00 --- 847.0 Active Palisades 44.10 155.50 1200.00 --- 1400.0 Dead + Inactive+Active Henrys Lake Unknown --- 90.40 --- 90.4 Active Island Park 0.40 --- 127.30 7.90 135.2 Active + Surcharge Grassy Lake Unknown --- 15.18 --- 15.2 Active Ririe 4.00 6.00 80.54 10.00 80.5 Active Blackfoot 0.00 --- 333.50 3.50 333.50 Active (rev. 2/1/2015) American Falls Unknown --- 1672.60 --- 1672.6 Active Southside Snake Basins Oakley 0.00 --- 75.60 --- 75.6 Active Salmon Falls 48.00 5.00 182.65 --- 182.6 Active Wild Horse Unknown --- 71.50 --- 71.5 Active Lake Owyhee 406.83 --- 715.00 --- 715.0 Active Brownlee 0.45 444.70 975.30 --- 1420.0 Inactive + Active Bear River Basin Bear Lake 5000.00 119.00 1302.00 --- 1302.0 Active: Capacity does not include 119 KAF that can be used, historic values below this level are rounded to zero Montpelier 0.21 --- 3.84 --- 4.0 Dead + Active
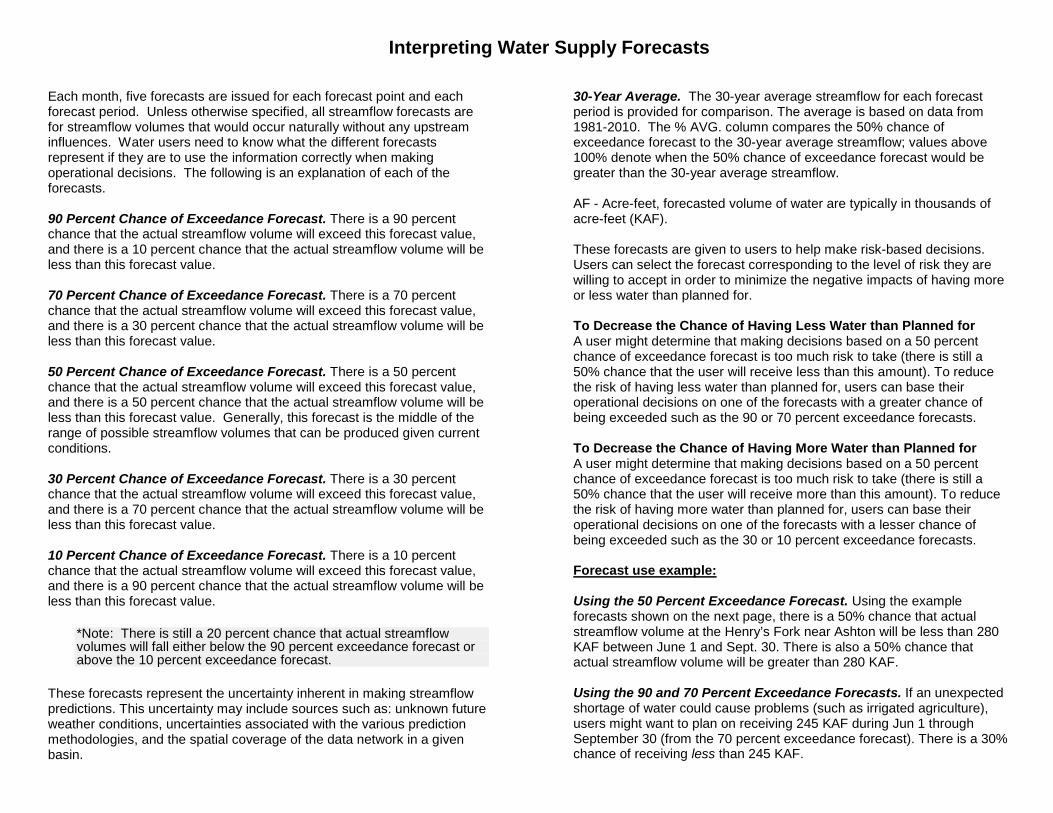
Interpreting Water Supply Forecasts
Each month, five forecasts are issued for each forecast point and each forecast period. Unless otherwise specified, all streamflow forecasts are for streamflow volumes that would occur naturally without any upstream influences. Water users need to know what the different forecasts represent if they are to use the information correctly when making operational decisions. The following is an explanation of each of the forecasts. 90 Percent Chance of Exceedance Forecast. There is a 90 percent chance that the actual streamflow volume will exceed this forecast value, and there is a 10 percent chance that the actual streamflow volume will be less than this forecast value. 70 Percent Chance of Exceedance Forecast. There is a 70 percent chance that the actual streamflow volume will exceed this forecast value, and there is a 30 percent chance that the actual streamflow volume will be less than this forecast value. 50 Percent Chance of Exceedance Forecast. There is a 50 percent chance that the actual streamflow volume will exceed this forecast value, and there is a 50 percent chance that the actual streamflow volume will be less than this forecast value. Generally, this forecast is the middle of the range of possible streamflow volumes that can be produced given current conditions. 30 Percent Chance of Exceedance Forecast. There is a 30 percent chance that the actual streamflow volume will exceed this forecast value, and there is a 70 percent chance that the actual streamflow volume will be less than this forecast value. 10 Percent Chance of Exceedance Forecast. There is a 10 percent chance that the actual streamflow volume will exceed this forecast value, and there is a 90 percent chance that the actual streamflow volume will be less than this forecast value.
*Note: There is still a 20 percent chance that actual streamflow volumes will fall either below the 90 percent exceedance forecast or above the 10 percent exceedance forecast.
These forecasts represent the uncertainty inherent in making streamflow predictions. This uncertainty may include sources such as: unknown future weather conditions, uncertainties associated with the various prediction methodologies, and the spatial coverage of the data network in a given basin.
30-Year Average. The 30-year average streamflow for each forecast period is provided for comparison. The average is based on data from 1981-2010. The % AVG. column compares the 50% chance of exceedance forecast to the 30-year average streamflow; values above 100% denote when the 50% chance of exceedance forecast would be greater than the 30-year average streamflow. AF - Acre-feet, forecasted volume of water are typically in thousands of acre-feet (KAF). These forecasts are given to users to help make risk-based decisions. Users can select the forecast corresponding to the level of risk they are willing to accept in order to minimize the negative impacts of having more or less water than planned for. To Decrease the Chance of Having Less Water than Planned for A user might determine that making decisions based on a 50 percent chance of exceedance forecast is too much risk to take (there is still a 50% chance that the user will receive less than this amount). To reduce the risk of having less water than planned for, users can base their operational decisions on one of the forecasts with a greater chance of being exceeded such as the 90 or 70 percent exceedance forecasts. To Decrease the Chance of Having More Water than Planned for A user might determine that making decisions based on a 50 percent chance of exceedance forecast is too much risk to take (there is still a 50% chance that the user will receive more than this amount). To reduce the risk of having more water than planned for, users can base their operational decisions on one of the forecasts with a lesser chance of being exceeded such as the 30 or 10 percent exceedance forecasts. Forecast use example: Using the 50 Percent Exceedance Forecast. Using the example forecasts shown on the next page, there is a 50% chance that actual streamflow volume at the Henry’s Fork near Ashton will be less than 280 KAF between June 1 and Sept. 30. There is also a 50% chance that actual streamflow volume will be greater than 280 KAF. Using the 90 and 70 Percent Exceedance Forecasts. If an unexpected shortage of water could cause problems (such as irrigated agriculture), users might want to plan on receiving 245 KAF during Jun 1 through September 30 (from the 70 percent exceedance forecast). There is a 30% chance of receiving less than 245 KAF.

Alternatively, if users determine the risk of using the 70 percent exceedance forecast is too great, then they might plan on receiving 198 KAF (from the 90 percent exceedance forecast). There is 10% chance of receiving less than 72 KAF. Using the 30 or 10 Percent Exceedance Forecasts. If an unexpected excess of water could cause problems (such as operating a flood control reservoir), users might plan on receiving 315 KAF between June 1 and
Sept. 30 (from the 30 percent exceedance forecast). There is a 30% chance of receiving more than 315 KAF. Alternatively, if users determine the risk of using the 30 percent exceedance forecast is too great, then they might plan on receiving 360 KAF (from the 10 percent exceedance forecast). There is a 10% chance of receiving more than 360 KAF. Users could also choose a volume in between any of these values to reflect their desired risk level.
Interpreting Snowpack Plots Basin snowpack plots represent snow water equivalent indices using the average daily SNOTEL data1 from several sites in or near individual basins. The solid red line (2015), which represents the current water year snowpack water content, can be compared to the normal dashed black line (Median) which is considered “normal”, as well as the SNOTEL observed historical snowpack range for each basin. This allows users to gather important information about the current year’s snowpack as well as the historical variability of snowpack in each basin. The gray shaded area represents the interquartile range (also known as the “middle fifty”), which is the 25th to 75th percentiles of the historical daily snowpack data for each basin. Percentiles depict the value of the average snowpack below which the given percent of historical years fall. For example, the top part of the interquartile range (75th percentile) indicates that the snowpack index has been below this line for 75 percent of the period of record, whereas the reverse is true for the lower part of the interquartile range (25th percentile). This means 50 percent of the time the snowpack index is within the interquartile range (gray area) during the period of record. 1 All data used for these plots come from daily SNOTEL data only and does not include snow course data (collected monthly), whereas the official basin snowpack percent of normal includes both SNOTEL and snow course data, potentially leading to slight discrepancies between plots and official basin percent of normal.
Upper Snake River Basin Streamflow Forecasts - June 1, 2015
Forecast
Period
Forecast Exceedance Probabilities for Risk Assessment
30yr Avg
(KAF)
<---Drier----------------Projected Volume-------------Wetter--->
Forecast Point90%
(KAF)
70%
(KAF)
50%
(KAF) % Avg
30%
(KAF)
10%
(KAF)
Henrys Fk nr Ashton JUN-JUL 72 106 129 56 152 186 230
JUN-SEP 198 245 280 68 315 360 410

USDA Natural Resources Conservation Service 9173 West Barnes Drive, Suite C Boise ID 83709-1574
OFFICIAL BUSINESS
Issued by Leonard Jordan, Acting Chief Natural Resources Conservation Service Washington, DC Released by Curtis Elke, State Conservationist Shawn Nield, State Soil Scientist Natural Resources Conservation Service Boise, Idaho Prepared by Idaho Snow Survey Staff Ron Abramovich, Water Supply Specialist Danny Tappa, Hydrologist John Wilford, Electronics Technician Forecasts and Assistance provided by Rashawn Tama, Forecast Hydrologist Jolyne Lea, Forecast Hydrologist NRCS, National Water and Climate Center, Portland, Oregon Numerous other groups and agencies provide funding and/or cooperative support for the collection, operation and maintenance of the Cooperative Idaho Snow Survey Program. Your cooperation is greatly appreciated.