naturgy 1h21 results presentation
TRANSCRIPT

1H21 Results28 July 2021
Scenario
Consolidated results
Results by business unit
Summary

Scenario
1. Scenario
4
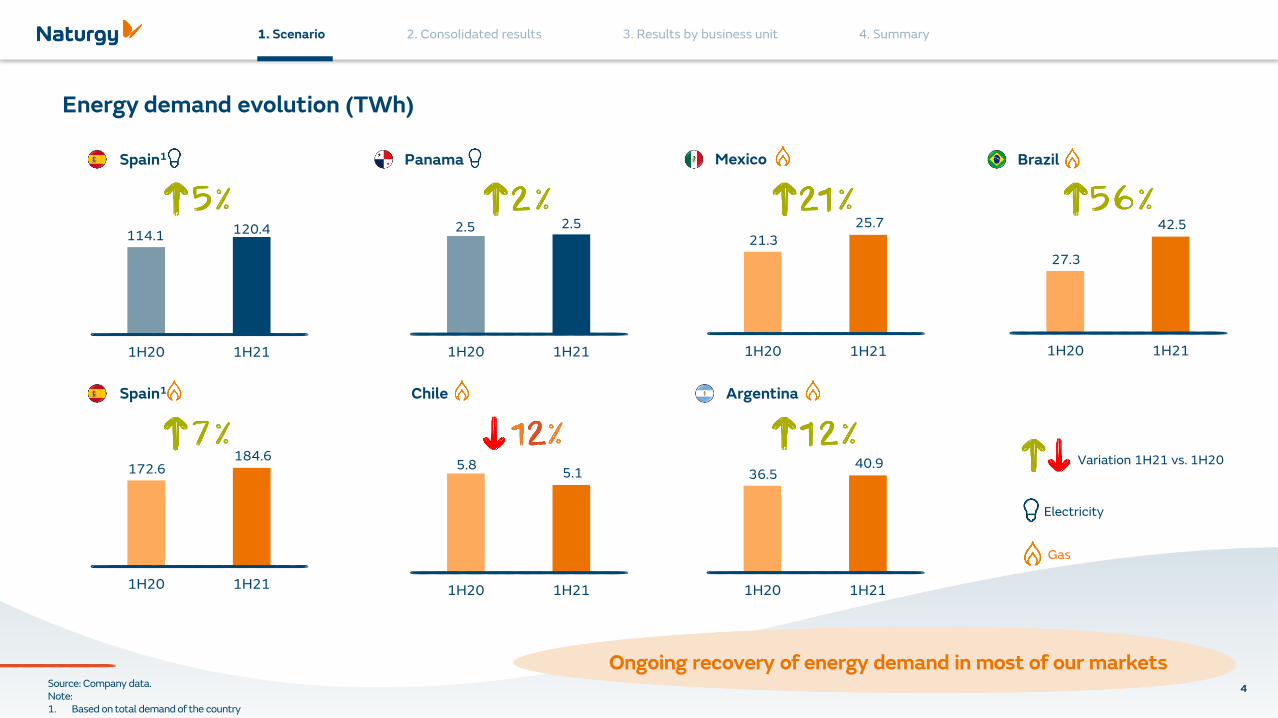
Spain1 Panama Brazil
Spain1 Chile Argentina
Mexico
Electricity
Gas
Variation 1H21 vs. 1H20
Source: Company data.Note:1. Based on total demand of the country
Ongoing recovery of energy demand in most of our markets
Energy demand evolution (TWh)
114.1 120.4
1H20 1H21
172.6184.6
1H20 1H21
2.5 2.5
1H20 1H21
21.3
25.7
1H20 1H21
27.3
42.5
1H20 1H21
5.85.1
1H20 1H21
36.540.9
1H20 1H21
1. Scenario
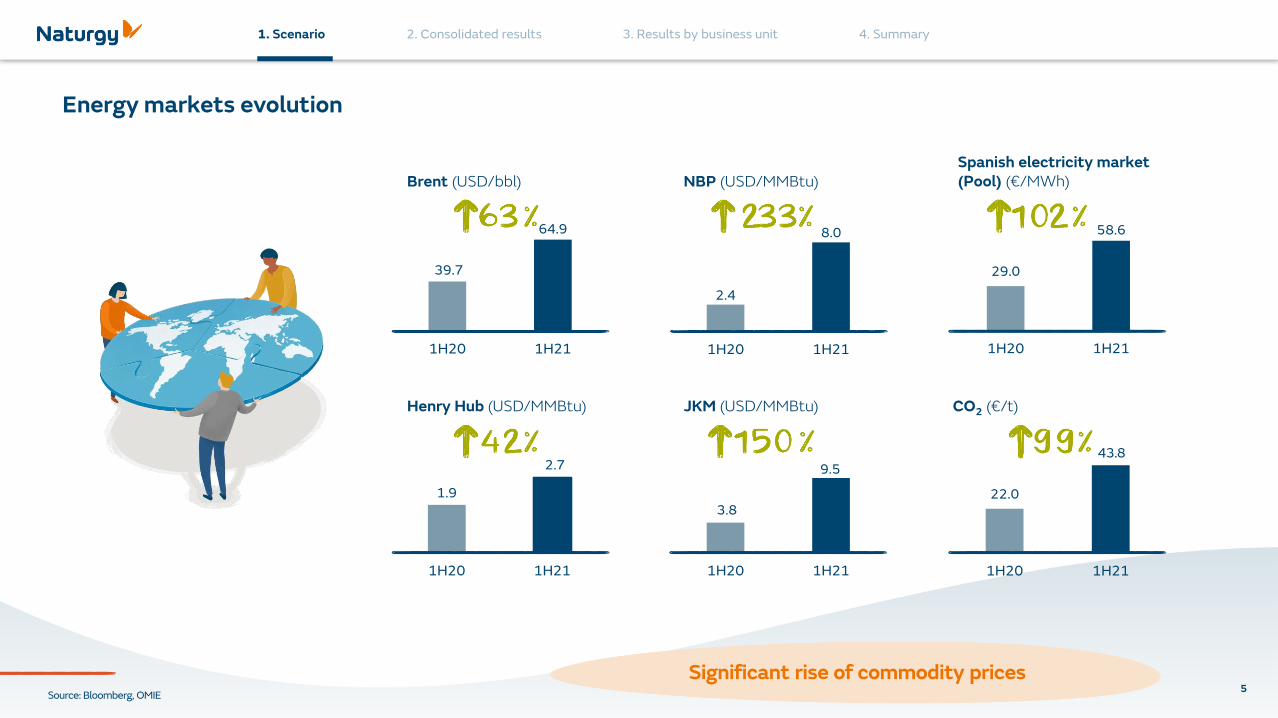
39.7
64.9
1H20 1H21
1.9
2.7
1H20 1H21
2.4
8.0
1H20 1H21
3.8
9.5
1H20 1H21
22.0
1H20 1H21
29.0
58.6
1H20 1H21
5
Energy markets evolution
Brent (USD/bbl)
Henry Hub (USD/MMBtu)
NBP (USD/MMBtu)
JKM (USD/MMBtu)
Spanish electricity market(Pool) (€/MWh)
CO2 (€/t)
43.8
Significant rise of commodity pricesSource: Bloomberg, OMIE
1. Scenario
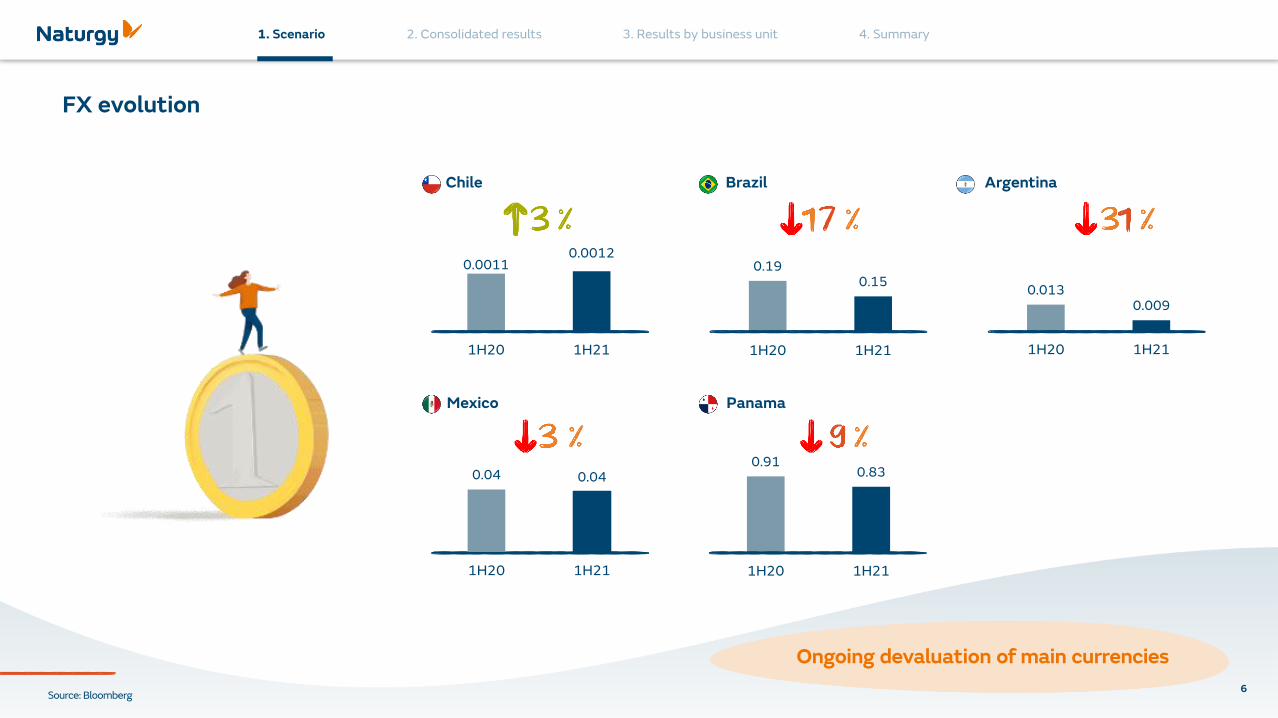
0.910.83
1H20 1H21
6
FX evolution
0.00110.0012
1H20 1H21
Chile
0.190.15
1H20 1H21
Brazil
0.0130.009
1H20 1H21
Argentina
0.04 0.04
1H20 1H21
Mexico Panama
Ongoing devaluation of main currencies
Source: Bloomberg

Consolidated results

2. Consolidated results
8
Operations recovering in line with pandemic evolution
Key highlightsKey figures (€m, % vs. 1H20)
Ordinary EBITDA Ordinary Net income
Capex CF from operations
Positive results in Networks Spain supported by recovery of energy demand and operational improvements
LatAm activities negatively impacted by ongoing FX depreciation
Employee voluntary departure plan incurring ~€300m of restructuring costs in 1H21
Liberalised activities mainly supported by contract renegotiations leading to improved margins
vs. 1H20 vs. 1H20
vs. 1H19vs. 1H19
2. Consolidated results
9
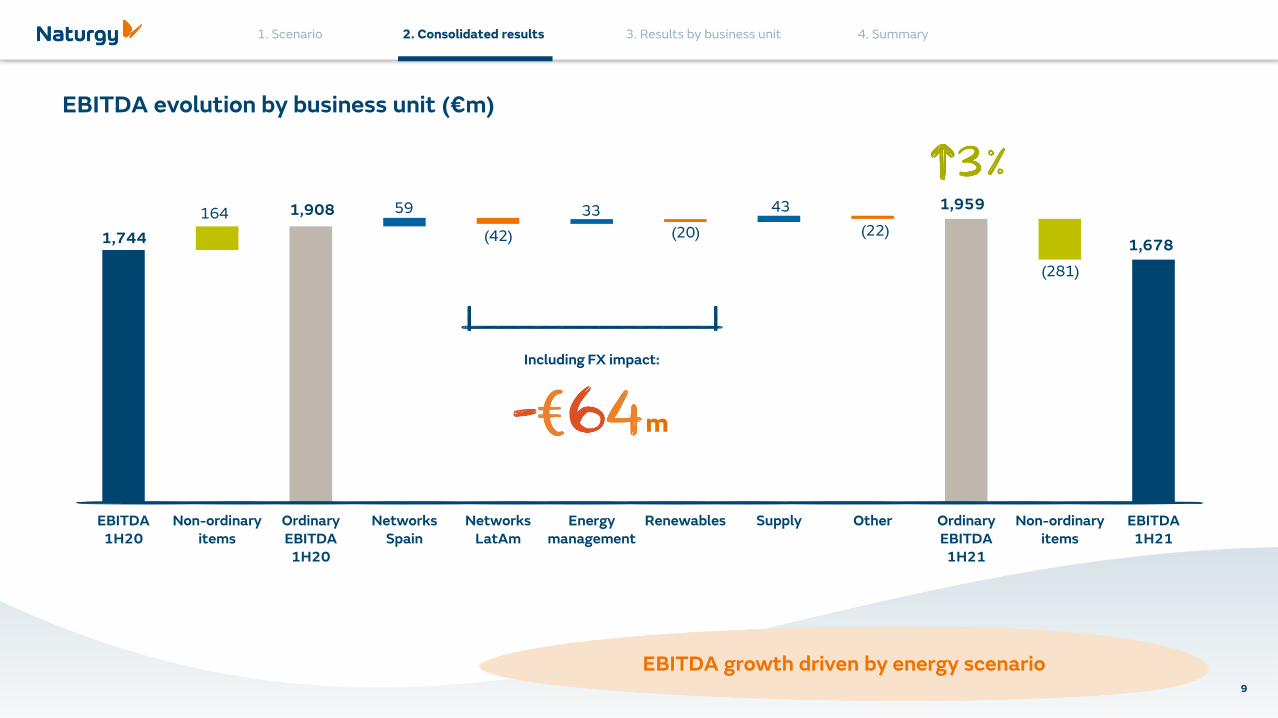
EBITDA evolution by business unit (€m)
EBITDA growth driven by energy scenario
EBITDA1H20
Non-ordinaryitems
OrdinaryEBITDA1H20
NetworksSpain
NetworksLatAm
Energymanagement
Renewables Supply Other OrdinaryEBITDA1H21
Non-ordinaryitems
EBITDA1H21
1,678
1,95959
(42)
33
Including FX impact:
1,908
1,744 (20)
(281)
164 43
(22)
m

2. Consolidated results
10
Net income evolution (€m)
Net income growth driven by activity and financial results
Netincome1H20
Non-ordinaryitems
OrdinaryNet
income1H20
Activity Financial resultand others
OrdinaryNet
income1H21
Non-ordinaryitems
Netincome1H21
484
557
334
18
476142
63
(1,219)
(73)
2. Consolidated results
11
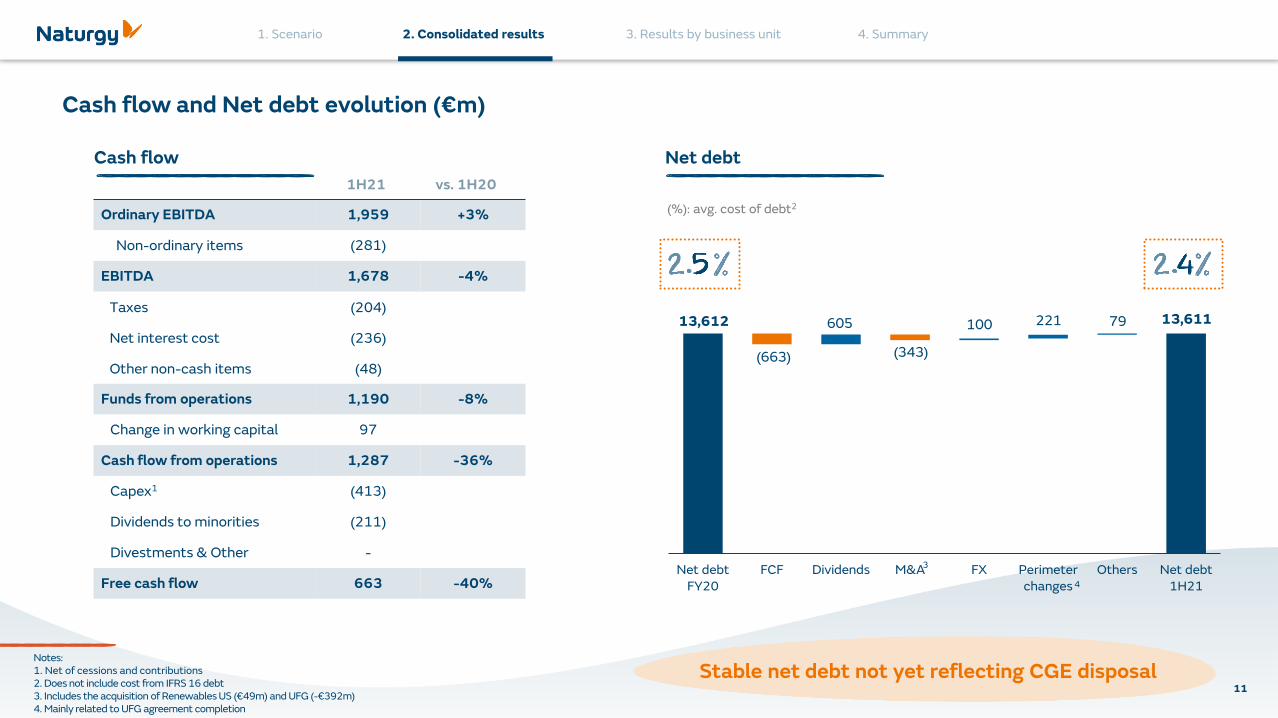
Net debtFY20
FCF Dividends M&A FX Perimeterchanges
Others Net debt1H21
Cash flow and Net debt evolution (€m)
Stable net debt not yet reflecting CGE disposal
(%): avg. cost of debt2
Cash flow Net debt
1H21 vs. 1H20
Ordinary EBITDA 1,959 +3%
Non-ordinary items (281)
EBITDA 1,678 -4%
Taxes (204)
Net interest cost (236)
Other non-cash items (48)
Funds from operations 1,190 -8%
Change in working capital 97
Cash flow from operations 1,287 -36%
Capex1 (413)
Dividends to minorities (211)
Divestments & Other -
Free cash flow 663 -40%
3
13,612
(663)
605 79100 221 13,611
4
(343)
Notes:1. Net of cessions and contributions2. Does not include cost from IFRS 16 debt3. Includes the acquisition of Renewables US (€49m) and UFG (-€392m)4. Mainly related to UFG agreement completion

Results by business unit

3. Results by business unit
13
Networks Spain
EBITDA1H20
Non-ordinaryitems
OrdinaryEBITDA1H20
Gasnetworks
Electricitynetworks
OrdinaryEBITDA1H21
Non-ordinaryitems
EBITDA1H21
696769
828
649
73 39
(179)
Gas networks: higher sales and operational improvements partially offset by new regulatory framework
Electricity networks: growth driven by investment and efficiencies partially offset by the second year financial remuneration adjustment included as part of the regulatory period 2020-25
Ordinary EBITDA evolution by key drivers (€m)
OrdinaryEBITDA
1H20
Demand Regulation Tariff/prices
Other Opex OrdinaryEBITDA
1H21
769 82846
(20)
2 26
20
5
Results supported by recovery of energy demand and operational improvements
EBITDA evolution by business line (€m) Highlights
m capex, of which ~85% remunerated
3. Results by business unit
14
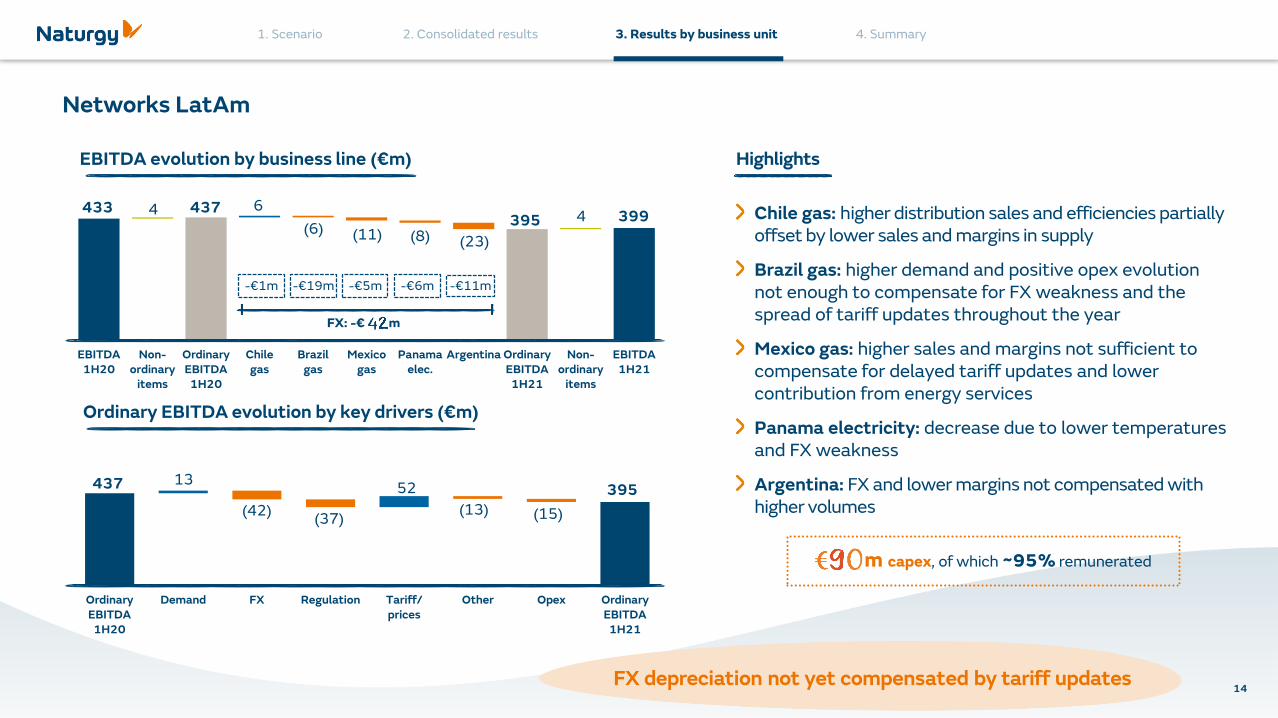
Networks LatAm
EBITDA1H20
Non-ordinary
items
OrdinaryEBITDA
1H20
Chilegas
Brazilgas
Mexicogas
Panamaelec.
Argentina OrdinaryEBITDA1H21
Non-ordinary
items
EBITDA1H21
-€1m -€6m -€11m
433 437395 3994 6
(8)4
(23)
Chile gas: higher distribution sales and efficiencies partially offset by lower sales and margins in supply
Brazil gas: higher demand and positive opex evolution not enough to compensate for FX weakness and the spread of tariff updates throughout the year
Mexico gas: higher sales and margins not sufficient to compensate for delayed tariff updates and lower contribution from energy services
Panama electricity: decrease due to lower temperatures and FX weakness
Argentina: FX and lower margins not compensated with higher volumes
OrdinaryEBITDA1H20
Demand FX Regulation Tariff/prices
Other Opex OrdinaryEBITDA
1H21
437 39513
(42) (15)(37)
52
(13)
(6)
-€5m
(11)
-€19m
Ordinary EBITDA evolution by key drivers (€m)
EBITDA evolution by business line (€m) Highlights
m capex, of which ~95% remunerated
FX depreciation not yet compensated by tariff updates
FX: -€ m

3. Results by business unit
15
Energy management
EBITDA1H20
Non-ordinary
items
OrdinaryEBITDA
1H20
Markets& procur.
Int.LNG
Pipelines(EMPL)
Spainthermal
gen.
Int.thermal
gen.
OrdinaryEBITDA1H21
Non-ordinary
items
EBITDA1H21
- -€11m -€11m
347 357390
3661092
(12) (24)
46 Markets and procurement: higher sales and margins driven by improved gas procurement and higher selling prices
International LNG: price recovery not translated into margins due to significant weight of contracted sales
Pipelines (EMPL): tariff updates offset by capacity step down and US$ depreciation
Spain thermal generation: higher pool prices and CCGTs sales and margins
International thermal generation: higher availability not sufficient to offset FX impact and lower excess sales / margins
OrdinaryEBITDA1H20
Demand FX Tariff/prices& contract.
changes
EMPLstep down
Other Opex OrdinaryEBITDA
1H21
3573907
(19)(5)
63
(6)
(80)
€3m
(7)
(13)
-
EBITDA evolution by business line (€m)
Ordinary EBITDA evolution by key drivers (€m)
Contract renegotiations leading to improved margins
Highlights
FX: -€ m
m capex, of which ~15% remunerated

3. Results by business unit
16
Renewables
EBITDA1H20
Non-ordinary
items
OrdinaryEBITDA1H20
Spain& USA
Australia LatAm OrdinaryEBITDA1H21
Non-ordinary
items
EBITDA1H21
- -€3m
193 198178 1855
(25)
6 7 Spain: lower solar production due to temporary weather damage repairs and higher opex from activity expansion
Australia: lower margins on quarterly mark to market valuation of existing PPAs
LatAm: new capacity coming into operation in Chile
OrdinaryEBITDA
1H20
Demand FX Tariff/prices &contract.changes
Other Opex OrdinaryEBITDA
1H21
198 178
43
(3)
(15)(20)
(1)
-
(25)
EBITDA evolution by business line (€m) Highlights
Ordinary EBITDA evolution by key drivers (€m)
m capex, of which ~95% remunerated
Results impacted by temporary repairs and higher opex in Spain
FX: -€ m

3. Results by business unit
17
Supply
EBITDA1H20
Non-ordinaryitems
OrdinaryEBITDA1H20
Supply OrdinaryEBITDA1H21
Non-ordinaryitems
EBITDA1H21
134171
214
15137
43
(63)
Gas supply: higher margins and sales in the retail and industrial segments partially offset by lower sales to wholesale Europe
Power supply: higher margins in the retail and S&ME segments offset by lower sales and margin compression in the industrial segment
OrdinaryEBITDA
1H20
Demand Tariff/prices
Other Opex OrdinaryEBITDA1H21
171
214
(8)
40 47
EBITDA evolution by business line (€m) Highlights
Ordinary EBITDA evolution by key drivers (€m)
m capex, of which ~95% remunerated
Improvement mainly supported by higher gas sales and margins

Summary

4. Summary
19
Positive results in Networks Spain supported by recovery of energy demand and operational improvements
LatAm activities negatively impacted by ongoing FX depreciation
Liberalised activities mainly supported by contract renegotiations leading to improved margins
Current trading and scenario supportive of a 2021 ordinary EBITDA of around €3.9-4.0bn
Summary

Appendix
20

21
Naturgy's financial disclosures contain magnitudes and metrics drafted in accordance with International Financial Reporting Standards (IFRS) and others that are based on the Group's disclosure model, referred to asAlternative Performance Metrics (APM), which are viewed as adjusted figures with respect to those presented in accordance with IFRS.
The chosen APMs are useful for persons consulting the financial information as they allow an analysis of the financial performance, cash flows and financial situation of Naturgy, and a comparison with other companies.
Below is a glossary of terms with the definition of the APMs. Generally, the APM terms are directly traceable to the relevant items of the consolidated balance sheet, consolidated income statement, consolidated statementof cash flows or Notes to the Financial Statements of Naturgy. To enhance the traceability, a reconciliation is presented of the calculated values.
Alternative performance metrics
Definition and termsReconciliation of values
Relevance of use30 June 2021 30 June 2020
EBITDA Operating profit Euros 1,678 million Euros 1,744 millionMeasure of earnings before interest, taxes, depreciation and amortization and provisions
Ordinary EBITDA EBITDA - Non-ordinary items Euros 1,959 million = 1,678 + 281 Euros 1,908 million = 1,744+ 164
EBITDA corrected of impacts like restructuring costs and other non-ordinary items considered relevant for a better understanding of the underlying results of the Group
Ordinary Net incomeAttributable net income of the period - Non-ordinary items
Euros 557 million = 484 + 73 Euros 476 million = 334 + 142
Attributable Net Income corrected of impacts like assets write-down, discontinued operations, restructuring costs and other non-ordinary items considered relevant for a better understanding of the underlying results of the Group
Investments (CAPEX)Investments in intangible assets + Investments in property, plant & equipment
Euros 439 million = 90 + 349 Euros 552 million = 61 + 491Realized investments in property, plant & equipment and intangible assets
Net Investments (net CAPEX)CAPEX - Other proceeds/(payments) of investments activities
Euros 413 million = 439 - 26 Euros 527 million = 552 – 25Total investments net of the cash received from divestments and other investing receipts
Gross financial debtNon-current financial liabilities + "Current financial liabilities"
Euros 17,554 million = 14,746 + 2,808 Euros 17,539 million1 = 14,968 + 2,571 Current and non-current financial debt
Alternative Performance Metrics (i/ii)
Note: 1. As of 31/12/2020
22
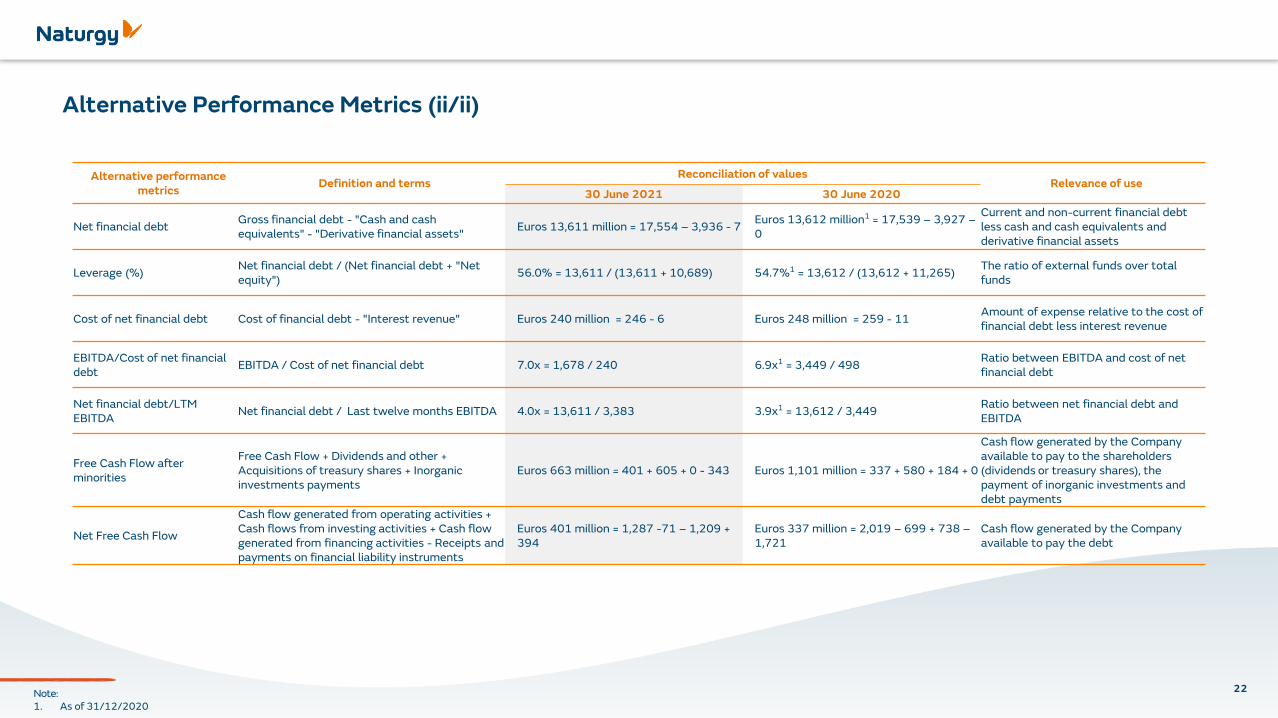
Alternative Performance Metrics (ii/ii)
Alternative performance metrics
Definition and termsReconciliation of values
Relevance of use30 June 2021 30 June 2020
Net financial debtGross financial debt - "Cash and cash equivalents" - "Derivative financial assets"
Euros 13,611 million = 17,554 – 3,936 - 7Euros 13,612 million1 = 17,539 – 3,927 –0
Current and non-current financial debt less cash and cash equivalents and derivative financial assets
Leverage (%)Net financial debt / (Net financial debt + "Net equity")
56.0% = 13,611 / (13,611 + 10,689) 54.7%1 = 13,612 / (13,612 + 11,265)The ratio of external funds over total funds
Cost of net financial debt Cost of financial debt - "Interest revenue" Euros 240 million = 246 - 6 Euros 248 million = 259 - 11Amount of expense relative to the cost of financial debt less interest revenue
EBITDA/Cost of net financial debt
EBITDA / Cost of net financial debt 7.0x = 1,678 / 240 6.9x1 = 3,449 / 498Ratio between EBITDA and cost of net financial debt
Net financial debt/LTM EBITDA
Net financial debt / Last twelve months EBITDA 4.0x = 13,611 / 3,383 3.9x1 = 13,612 / 3,449Ratio between net financial debt and EBITDA
Free Cash Flow after minorities
Free Cash Flow + Dividends and other + Acquisitions of treasury shares + Inorganic investments payments
Euros 663 million = 401 + 605 + 0 - 343 Euros 1,101 million = 337 + 580 + 184 + 0
Cash flow generated by the Company available to pay to the shareholders (dividends or treasury shares), the payment of inorganic investments and debt payments
Net Free Cash Flow
Cash flow generated from operating activities + Cash flows from investing activities + Cash flow generated from financing activities - Receipts and payments on financial liability instruments
Euros 401 million = 1,287 -71 – 1,209 + 394
Euros 337 million = 2,019 – 699 + 738 –1,721
Cash flow generated by the Company available to pay the debt
Note: 1. As of 31/12/2020

23
ESG Metrics
ESG metrics 1H21 1H20 Change Comments
Health and safety
Accidents with lost time1 units 6 1 - Increase in accident ratio as a consequence of the exceptionally low 1Q20, but improving significantly from previous normalized quarters
LT Frequency rate2 units 0.15 0.02 -
Environment
GHG Emissions M tCO2 e 6.1 6.7 -9.0%Higher renewable (+21.6%) than thermal (+2.3%) production in the period
Emission factor t CO2/GWh 250 292 -14.4%
Emissions-free installed capacity % 36.1 33.8 6.8%New renewable capacity coming into operation in Chile, as well as the shutdown of the coal capacity in June 2020
Higher renewable productionEmissions-free net production % 38.8 34.2 13.5%
Interest in people
Number of employees persons 8,006 9,496 -15.7% Perimeter changes and workforce optimization
Training hours per employee hours 11.1 14.1 -21.3%COVID-19 crisis and organizational changes have required to overhaul training programs, with a growing relevance of on-line format and temporary impacts in ratio evolution
Women representation % 31.4 32.7 -4.0%Slight reduction as a consequence of higher women representation in companies exiting the consolidation perimeter
Society and integrity
Economic value distributed €m 10,336 8,149 26.8% Increase in Economic value distributed following higher activity and taxes
Notifications received by the ethics committee3 units 39 36 8.3% Complaints within normal parameters
Notes: 1. In accordance to OSHA criteria2. Calculated for every 200,000 working hours3. Change of criteria in 2020 in order to make the metric more comparable with sector standards
This document is the property of Naturgy Energy Group, S.A. (Naturgy) and has been prepared for information purposes only.
This communication contains forward-looking information and statements about Naturgy. Such information can include financial projections and estimates, statementsregarding plans, objectives and expectations with respect to future operations, capital expenditures or strategy.
Naturgy cautions that forward-looking information are subject to various risks and uncertainties, difficult to predict and generally beyond the control of Naturgy. Theserisks and uncertainties include those identified in the documents containing more comprehensive information filed by Naturgy and their subsidiaries before the differentsupervisory authorities of the securities markets in which their secuirities are listed and, in particular, the Spanish National Securities Market Commission.
Except as required by applicable law, Naturgy does not undertake any obligation to publicly update or revise any forward-looking information and statements, whether as aresult of new information, future events or otherwise.
This document includes certain alternative performance measures (“APMs”), as defined in the Guidelines on Alternative Performance Measures issued by the EuropeanSecurities and Markets Authority in October 2015. For further information about this matter please refer to this presentation and to the corporate website(www.naturgy.com).
This document does not constitute an offer or invitation to purchase or subscribe shares, in accordance with the provisions of the restated text of the Securities MarketLaw approved by Royal Legislative Decree 4/2015, of 23 October and their implementing regulations. In addition, this document does not constitute an offer of purchase,sale or exchange, nor a request for an offer of purchase, sale or exchange of securities, in any other jurisdiction.
The information and any opinions or statements made in this document have not been verified by independent third parties; therefore, no warranty is made as to theimpartiality, accuracy, completeness or correctness of the information or the opinions or statements expressed herein.
Disclaimer
24

This presentation is property of Naturgy Energy Group, S.A. Both its content and design are for the exclusive use of its personnel.
©Copyright Naturgy Energy Group, S.A.
CAPITAL MARKETS
Tel. 34 912 107 815
e-mail: [email protected]
website: www.naturgy.com