naval postgraduate school postgraduate school monterey, california thesis ... reviewing instruction,...
TRANSCRIPT
NAVAL POSTGRADUATE
SCHOOL
MONTEREY, CALIFORNIA
THESIS
Approved for public release; distribution is unlimited
AN EMPIRICAL EXAMINATION OF THE IMPACT OF JROTC PARTICIPATION ON ENLISTMENT, RETENTION
AND ATTRITION
by
Janet H. Days Yee Ling Ang
December 2004
Thesis Advisor: Robert M. McNab Associate Advisor: Elda Pema

THIS PAGE INTENTIONALLY LEFT BLANK

i
REPORT DOCUMENTATION PAGE Form Approved OMB No. 0704-0188 Public reporting burden for this collection of information is estimated to average 1 hour per response, including the time for reviewing instruction, searching existing data sources, gathering and maintaining the data needed, and completing and reviewing the collection of information. Send comments regarding this burden estimate or any other aspect of this collection of information, including suggestions for reducing this burden, to Washington headquarters Services, Directorate for Information Operations and Reports, 1215 Jefferson Davis Highway, Suite 1204, Arlington, VA 22202-4302, and to the Office of Management and Budget, Paperwork Reduction Project (0704-0188) Washington DC 20503. 1. AGENCY USE ONLY (Leave blank)
2. REPORT DATE December 2004
3. REPORT TYPE AND DATES COVERED Master’s Thesis
4. TITLE AND SUBTITLE: An Empirical Examination of the Impact of JROTC Participation on Enlistment, Retention and Attrition 6. AUTHOR(S) Janet Days and Yee Ling Ang
5. FUNDING NUMBERS
7. PERFORMING ORGANIZATION NAME(S) AND ADDRESS(ES) Naval Postgraduate School Monterey, CA 93943-5000
8. PERFORMING ORGANIZATION REPORT NUMBER
9. SPONSORING /MONITORING AGENCY NAME(S) AND ADDRESS(ES)
N/A
10. SPONSORING/MONITORING AGENCY REPORT NUMBER
11. SUPPLEMENTARY NOTES The views expressed in this thesis are those of the author and do not reflect the official policy or position of the Department of Defense or the U.S. Government. 12a. DISTRIBUTION / AVAILABILITY STATEMENT Approved for public release; distribution is unlimited.
12b. DISTRIBUTION CODE
13. ABSTRACT (maximum 200 words) Our primary research interest is whether participation in the Junior Reserve Offices Training Corps (JROTC) program influences youths’ propensity to enlist; and for those who subsequently enlist, the influence on retention rates and propensity to reenlist. The novelty of this thesis lies in conducting multivariate analysis of the impact of JROTC participation on enlistment, retention and reenlistment. Our data sources are (1) the 1980 High School and Beyond (HS&B) survey and (2) Defense Manpower Data Center (DMDC) enlisted personnel cohort files from Fiscal Year (FY) 1980 to 2000. We employ a number of econometric models with the HS&B data, including single equation PROBIT and LOGIT models, two-stage least squares (2SLS) with instrumental variables (IVs) and bivariate PROBIT equation. Our results show that JROTC positively influence enlistment when we treat JROTC participation as exogenous for both high school seniors and sophomores. The impact of JROTC participation on military enlistment decisions becomes negligible however, when we account for self-selection into the JROTC program of high school students. Using PROBIT and LOGIT models on the DMDC data, we find that enlisted personnel who graduated from JROTC are more likely to reenlist than non-JROTC graduates. Using the Cox proportional hazard survival analysis method, we find that JROTC graduates personnel tend to stay longer and complete their first-term than non-JROTC graduates. Synthesizing the results, we conclude that policy-makers might find it worthwhile to actively target JROTC cadets for enlistment because in the long run, it pays off in terms of higher first-term completion rates which results in cost savings in the form of enlistment bonuses and training costs. One possible extension of our study is to monetize our results for a cost-benefit analysis of the JROTC program vis-à-vis other recruitment programs. Quantifying the net benefits and costs of the JROTC program will allow policy-makers to make more informed decisions with regard to the future direction of the JROTC program.
15. NUMBER OF PAGES
143
14. SUBJECT TERMS Multivariate Analysis, JROTC, Recruitment, Retention, Re-enlistment, Personnel Policy
16. PRICE CODE
17. SECURITY CLASSIFICATION OF REPORT
Unclassified
18. SECURITY CLASSIFICATION OF THIS PAGE
Unclassified
19. SECURITY CLASSIFICATION OF ABSTRACT
Unclassified
20. LIMITATION OF ABSTRACT
UL NSN 7540-01-280-5500 Standard Form 298 (Rev. 2-89) Prescribed by ANSI Std. 239-18

ii
THIS PAGE INTENTIONALLY LEFT BLANK
iii
Approved for public release, distribution is unlimited
AN EMPIRICAL EXAMINATION OF THE IMPACT OF JROTC PARTICIPATION ON ENLISTMENT, RETENTION AND ATTRITION
Janet H. Days Lieutenant, United States Navy
B.S (Honors), Communication and Management, Old Dominion University, 1999
Submitted in partial fulfillment of the requirements for the degree of
MASTER OF BUSINESS ADMINISTRATION
from the
NAVAL POSTGRADUATE SCHOOL
March 2005
Yee Ling Ang Civilian, Ministry of Defense, Singapore
B.B.A. (Honors), National University of Singapore, 1997
Submitted in partial fulfillment of the requirements for the degree of
MASTER OF SCIENCE IN MANAGEMENT
from the
NAVAL POSTGRADUATE SCHOOL December 2004
Authors: Janet H. Days Yee Ling Ang
Approved by: Robert M. McNab
Thesis Advisor
Elda Pema Associate Advisor Douglas A. Brook Dean, Graduate School of Business and Public Policy

iv
THIS PAGE INTENTIONALLY LEFT BLANK

v
ABSTRACT
Our primary research interest is whether participation in the Junior Reserve
Offices Training Corps (JROTC) program influences youths’ propensity to enlist; and for
those who subsequently enlist, the influence on retention rates and attrition. The novelty
of this thesis lies in conducting multivariate analysis of the impact of JROTC
participation on enlistment, reenlistment and attrition. Our data sources are (1) the 1980
High School and Beyond (HS&B) survey and (2) Defense Manpower Data Center
(DMDC) enlisted personnel cohort files from Fiscal Year (FY) 1980 to 2000.
We employ a number of econometric models with the HS&B data, including
single equation PROBIT and LOGIT models, two-stage least squares (2SLS) with
instrumental variables (IVs) and bivariate PROBIT equation. Our results show that
JROTC positively influence enlistment when we treat JROTC participation as exogenous
for both high school seniors and sophomores. The impact of JROTC participation on
military enlistment decisions becomes negligible however, when we account for self-
selection into the JROTC program of high school students.
Using PROBIT and LOGIT models on the DMDC data, we find that enlisted
personnel who graduated from JROTC are more likely to reenlist than non-JROTC
graduates. Using the Cox proportional hazard survival analysis method, we find that
JROTC graduates personnel tend to stay longer and complete their first-term than non-
JROTC graduates.
Synthesizing the results, we conclude that policy-makers might find it worthwhile
to actively target JROTC cadets for enlistment because in the long run, it pays off in
terms of higher first-term completion rates which results in cost savings in the form of
enlistment bonuses and training costs. One possible extension of our study is to monetize
our results for a cost-benefit analysis of the JROTC program vis-à-vis other recruitment
programs. Quantifying the net benefits and costs of the JROTC program will allow
policy-makers to make more informed decisions with regard to the future direction of the
JROTC program.

vi
THIS PAGE INTENTIONALLY LEFT BLANK
vii
TABLE OF CONTENTS
I. INTRODUCTION........................................................................................................1 A. INTRODUCTION............................................................................................1 B. THESIS .............................................................................................................2 C. ORGANIZATION ...........................................................................................4
II. BACKGROUND OF JROTC .....................................................................................5 A. INTRODUCTION............................................................................................5 B. HISTORICAL OVERVIEW ..........................................................................5 C. JROTC PROGRAMS BY THE SERVICES.................................................7
1. Army JROTC (AJROTC)...................................................................8 2. Air Force JROTC (AFJROTC)..........................................................8 3. Naval JROTC (NJROTC)...................................................................9 4. Marine Corps JROTC (MCJROTC) ...............................................10
D. JROTC FUNDING ........................................................................................10 E. PROGRAM OUTCOMES ............................................................................13 F. CONCLUSION ..............................................................................................14
III. LITERATURE REVIEW .........................................................................................15 A. INTRODUCTION..........................................................................................15 B. RECRUITMENT STUDIES.........................................................................15
1. Enlistment Decision ...........................................................................15 2. Propensity to Enlist............................................................................19 3. Enlistment Incentives.........................................................................22
C. RETENTION AND REENLISTMENT STUDIES ....................................25 1. Pecuniary Factors on Retention and Reenlistment.........................26 2. Individual Characteristics on Retention and Reenlistment ...........29
D. STUDIES ON JROTC...................................................................................30 1. Benefits of Navy JROTC...................................................................30 2. Benefits of JROTC.............................................................................31 3. Benefits of JROTC Career Academy...............................................33
E. CONCLUSION ..............................................................................................35
IV. DATA DESCRIPTION .............................................................................................37 A. INTRODUCTION..........................................................................................37 B. HIGH SCHOOL & BEYOND DATA..........................................................37
1. Overall Descriptive Statistics ............................................................38 2. JROTC Participants Data Description ............................................42 3. Military Enlistment Intentions and Decisions Data Description...47
C. DMDC COHORT DATA..............................................................................48 1. Military Enlistment by JROTC participants from FY80- FY00...49 2. Distribution of Recruits with JROTC Participation by Service....51 3. Distribution of Recruits with JROTC by Gender...........................52 4. Distribution of Recruits with JROTC by Race ...............................54 5. Distribution of Recruits with JROTC by AFQT ............................56

viii
D. CONCLUSION ..............................................................................................58
V. THEORETICAL FRAMEWORK...........................................................................59 A. INTRODUCTION..........................................................................................59 B. BINARY RESPONSE MODELS .................................................................59
1. Linear Probability Model (LPM) .....................................................59 2. LOGIT and PROBIT Models ...........................................................60 3. Maximum Likelihood Estimation (MLE)........................................61
C. SPECIFICATION MODEL FOR ENLISTMENT DECISIONS..............62 1. Enlistment...........................................................................................63 2. JROTC................................................................................................63 3. Demographics.....................................................................................63 4. Ability to Afford College ...................................................................64 5. Educational Expectations..................................................................64 6. Military Interest .................................................................................64 7. Family Background ...........................................................................65 8. Peer Influence.....................................................................................65 9. Civilian Labor Market ......................................................................65
D. SPECIFICATION MODEL FOR REENLISTMENT DECISIONS........66 1. Reenlistment .......................................................................................66 2. JROTC Graduate...............................................................................67 3. Demographic Variables .....................................................................67 4. Educational Qualification .................................................................68 5. Entry Pay Grade ................................................................................68 6. Term of Enlistment ............................................................................68 7. Branch of Service ...............................................................................68 8. AFQT Mental Category ....................................................................69 9. Highest Paygrade ...............................................................................69
E. SURVIVAL ANALYSIS ...............................................................................69 1. Cox Proportional-Hazards Model ....................................................70
F. SPECIFICATION MODEL FOR ATTRITION PATTERN ....................72 1. Survival Time .....................................................................................72 2. Right-censored Data ..........................................................................73 3. Variables of Interest ..........................................................................73
G. CONCLUSION ..............................................................................................73
VI. RESULTS FROM HIGH SCHOOL & BEYOND DATA .....................................75 A. INTRODUCTION..........................................................................................75 B. ENLISTMENT DECISION EMPIRICAL FINDINGS .............................75
1. Single Equation LOGIT and PROBIT Models with Exogenous JROTC Variable ................................................................................76
2. Two-stage Least Squares Model with Endogenous JROTC Variable...............................................................................................80
3. Bivariate PROBIT Models with Endogenous JROTC Variable ...85 C. SUMMARY OF RESULTS ..........................................................................88
VII. RESULTS FROM DMDC DATA ............................................................................89

ix
A. INTRODUCTION..........................................................................................89 B. REENLISTMENT DECISION EMPIRICAL FINDINGS........................89 C. LOGIT AND PROBIT MODEL RESULTS ...............................................90
1. Hypothesized Effects of Variables on Reenlistment ......................93 a. JROTC Graduate ....................................................................93 b. Military Experience.................................................................94 c. Demographics..........................................................................94
2. Interpretation of Coefficients............................................................95 a. JROTC Graduate ....................................................................95 b. Military Experience.................................................................95 c. Demographics..........................................................................96
3. Interpretation of Partial Effects – Probit ........................................97 4. Model Goodness of Fit .......................................................................99
D. SURVIVAL ANALYSIS MODEL RESULTS ..........................................100 1. Hypothesized Effects of Variables on Attrition ............................102 2. Interpretation of Hazard Ratios .....................................................105
a. JROTC Graduates.................................................................105 b. Military Experience...............................................................105 c. Demographics........................................................................107
E. SUMMARY OF RESULTS ........................................................................108
VIII. CONCLUSION ........................................................................................................111 A. INTRODUCTION........................................................................................111 B. IMPLICATIONS OF STUDY ....................................................................111 C. LIMITATIONS OF STUDY.......................................................................113 D. FUTURE SCOPE.........................................................................................113 E. CONCLUSION ............................................................................................114
LIST OF REFERENCES....................................................................................................115
APPENDICES......................................................................................................................119
INITIAL DISTRIBUTION LIST .......................................................................................125

x
THIS PAGE INTENTIONALLY LEFT BLANK

xi
LIST OF FIGURES
Figure 1. Race Composition of JROTC Participants from the Sophomore and Senior
Cohorts.............................................................................................................45

xii
THIS PAGE INTENTIONALLY LEFT BLANK
xiii
LIST OF TABLES
Table 1. JROTC Funding by Services for FY 1999-2005 .............................................11 Table 2. Cost per Cadet and per JROTC Unit by Services for FY 1999-2005..............12 Table 3. Voluntary Education FY03..............................................................................24 Table 4. Summary Statistics of the HSB 1980 Sophomore and Senior Cohort.............39 Table 5. Participation Rate of the 1980 Sophomore and Senior Cohort........................42 Table 6. JROTC Participation Rate of Survey Respondents .........................................42 Table 7. Summary Statistics of JROTC Participants in the HSB 1980 Sophomore
and Senior Cohort ............................................................................................43 Table 8. Enlistment Rate of 1980 HSB Sophomore and Senior Cohort ........................48 Table 9. Enlistment Rate of 1980 HSB Sophomore Cohort who were JROTC
Participants.......................................................................................................48 Table 10. Enlistment Rate of 1980 Senior Cohort who were JROTC Participants .........48 Table 11. Recruits With/Without JROTC........................................................................50 Table 12. Distributions of Recruits by Service with JROTC...........................................52 Table 13. Recruit Distributions with JROTC by Gender.................................................53 Table 14. NJROTC Enrollment History SY94- SY04.....................................................54 Table 15. Distribution of JROTC Participants by Race...................................................55 Table 16. AFQT Categories .............................................................................................56 Table 17. Recruit Distribution With JROTC by AFQT Category ...................................57 Table 18. Coefficients, Standard Errors & Partial Effects of the 1980 Sophomore
and Senior Cohort Single Equation LOGIT and PROBIT Models..................77 Table 19. First Stage Regression Of 1980 Sophomore And Senior Cohort ....................81 Table 20. Coefficients, Standard Errors & Partial Effects For The 1980 Sophomore
And Senior Cohort Two-Stage Least Squares Models ....................................83 Table 21. Coefficients, Standard Errors & Partial Effects for the 1980 Sophomore
and Senior Cohort Bivariate PROBIT Models ................................................86 Table 22. Summary of Coefficients of JROTC................................................................88 Table 23. Coefficients, Standard Errors & Partial Effects Of The Single Equation
Reenlistment LOGIT And PROBIT Models ...................................................91 Table 24. Regression Results Using the Cox Regression Method.................................100 Table 25. Summary of JROTC coefficients...................................................................110

xiv
THIS PAGE INTENTIONALLY LEFT BLANK
xv
ACKNOWLEDGMENTS
This thesis proved to be a challenging endeavor for us. There are several people
that have aided us in the successful completion of our thesis. First of all, we would like
to thank Professor Kathy Kocher who has been instrumental in providing the High
School & Beyond Data set. Also, we would like to thank Professor Kathy Kocher and
Dennis Mar for their assistance with the DMDC data set, without which the data mining
process would have been arduous.
We would also like to thank our Associate Advisor, Professor Elda Pema, for
teaching us STATA that helped save time on our empirical analysis. Her countless hours
and dedication to our thesis, despite her hectic schedule, is deeply appreciated.
Last but not least, we would like to thank our primary advisor, Professor Robert
M. McNab, for his inspiration and foresight. His enthusiasm, drive and continued
support were paramount to the completion of this thesis.
This was a tremendous learning experience that would not have been possible if
not for the aforementioned persons. We would also like to thank our family for their
support throughout.

xvi
THIS PAGE INTENTIONALLY LEFT BLANK
1
I. INTRODUCTION
A. INTRODUCTION
As of the 2003 Fiscal Year (FY)1, there are 3,145 Junior Reserve Officer Training
Corps (JROTC) units in high schools across the United States with a total enrollment of
485,220 high school students. With total expenditures of 191 million dollars in FY 2003,
the JROTC program is thought not only to be a method of developing citizenship values
and leadership skills but also an indirect recruiting tool for the military.
Anecdotal evidence and previous studies do suggest that JROTC participants
ascend to military service at a rate higher than their non-JROTC peers. However, there is
a paucity of empirical evidence whether such an effect actually exists. Even if, as
suggested by previous studies, JROTC does influence enlistment propensity, questions
remain as to the magnitude of JROTC's influence and whether this influence is similar to
other recruiting methods. There is an absence of evidence upon which we can determine
whether the costs of JROTC are balanced by quantifiable benefits in terms of an
increased number of accessions to the armed forces.
If JROTC positively influences enlistment propensity at a unit cost lower or
comparable to other recruiting methods, than the policy implications are relatively
straightforward. JROTC, as a cost-effective recruiting tool, should be continued at its
current funding level, or, if relatively cheaper than other tools, expanded. On the other
hand, if JROTC does not positively influence enlistment propensity or does so at a higher
unit cost relative to other recruiting methods, then the implications are also clear.
JROTC, as a cost-ineffective program, should be reduced or cancelled altogether and the
funds reallocated to other recruiting methods.
Related to the question of whether JROTC influences enlistment propensity is the
heretofore-unaddressed question of whether JROTC participation influences retention
and attrition. Previous research noted that JROTC graduates attrited at a consistently
lower rate over the first-term attrition relative to non-JROTC enlistees. While these
1 Estimates from FY2004/2005 President’s Budget.

2
findings were based on descriptive data from the Defense Manpower Data Centre
(DMDC), they suggested that JROTC may provide a more realistic job preview (RJP)
and that JROTC graduates are better able to adapt to military lifestyle. Higher retention
rates or first-term completion rates reduce the need for the military to sustain a given end-
strength with large recruitment numbers. If those who have successfully completed their
first-terms are also more likely to re-enlist, costs are reduced in the form of enlistment
bonuses and training costs. Again, to the best of our knowledge, the literature is silent on
this issue.
However, examining the impact of JROTC on retention and attrition alone does
not present the whole picture. By examining the joint effects of JROTC on propensity to
enlist and retention and attrition, we may be better able to assess the total impact of
JROTC on military accessions and first-term completion. Ignoring this potential joint
effect may bias our conclusions in an unknown direction.
If JROTC positively influences the propensity to enlist and retention behavior,
JROTC should be continued at its current funding level or further expanded, if relatively
cheaper than other recruiting tools or programs. The policy implications are the same if
JROTC positively influences either one and has no impact on the other. If JROTC
negatively influences or have no impact on propensity to enlist and retention or attrition,
the policy implications are also clear. JROTC should be reduced or cancelled altogether.
On the other hand, if JROTC positively influences propensity to enlist while negatively
influences retention, or vice versa, further research will be needed to quantify the
aggregate impact of JROTC participation.
B. THESIS
In this thesis, we review the current state of knowledge on the influence of
JROTC on enlistment propensity, retention and attrition. We examine whether JROTC
participants have a higher propensity to enlist in the military compared to non-JROTC
participants. This requires data that track the post-secondary movements of high school
students, as JROTC graduates may not enlist in the military directly from high school.
However, the military only has information on enlistees that have participated in a

3
JROTC program prior to enlistment. This poses a serious selection bias in our empirical
study of JROTC’s propensity to enlist. We employ proprietary educational survey data
that tracks the post-secondary movements of JROTC participants from 1980 to 1996 to
conduct our study. We believe that we will not only be able to track participants’
accession decision but also control for self-selection issues.
Next, we examine if JROTC graduates are more likely to successfully complete
their first-term than non-JROTC graduates. Success is indicated by the first-term attrition
rate (failure to complete first-term service) as depicted in most retention studies.
Previous studies compared the attrition rates of enlisted JROTC graduates to enlisted
non-JROTC graduates using descriptive statistics and concluded that the first-term
attrition rates of JROTC graduates were consistently lower than those of all recruits who
entered the military in a given year. The above findings need further research due to the
perception of JROTC participants are “at-risk” youths who would have not fared well in
the military if not for the positive intervention of JROTC in their lives. We, therefore,
examine the effect of JROTC on retention and attrition, using survival analysis, taking
into account the demographic make-up of the JROTC graduates, the Armed Forces
Qualification Test (AFQT) category and the separation category.
The third portion of our thesis examines if JROTC graduates are most likely to
reenlist then non-JROTC graduates. We deploy the same explanatory variables used in
the retention model with reenlistment behavior as the dependent variable.
The final portion of our thesis synthesizes all the findings and evaluates if JROTC
adds value to the military by examining the joint impact of JROTC on propensity to
enlist, retention, and attrition. We study both the aggregate impact of JROTC on the
military and the impact of JROTC on individual services (Army, Navy, Marine Corp and
Air Force).
We find that this is a topic worth pursuing, considering that the JROTC program
is federally funded and its appropriation is under the recruiting and training sub-group
activity of the Operations and Maintenance section of the services’ budget reports. Our
background study of the funding for the JROTC program reveals that the services face
pressures to provide better programs within limited resources. The military finds itself

4
periodically questioning the worth of the JROTC program (primarily in terms of
supporting DoD mission), and seeking justification on the social benefits of the program
without necessarily being rewarded by increased financial resources for the program.
C. ORGANIZATION
The next chapter traces the history and development of the JROTC program to
allow the reader adequate background information regarding the program. We present
our literature review in Chapter III. Here we discuss the empirical models traditionally
employed to explore military manpower issues to include enlistment decisions and
attrition. We discuss the two main data sources that we have for the purpose of this
study, the High School & Beyond (HSB) data and Defense Manpower Data Centre
(DMDC) data in Chapter IV. From our literature search, we conceptualize the models
that we can utilize and develop the theoretical framework in Chapter V, followed by the
analysis of the findings in Chapter VI and VII for HS&B and DMDC data respectively.
Chapter VIII concludes our study and discusses ways in which our findings could lead to
other areas of study.
5
II. BACKGROUND OF JROTC
A. INTRODUCTION
In this chapter, we review the history and structure of the Junior Reserve Officers’
Training Corps (JROTC) program. We examine the differences in the program offered by
the four military branches of service. We also look at the benefits of the JROTC program,
especially the unintended consequences on military recruitment.
B. HISTORICAL OVERVIEW
The birth of the JROTC came about in 1916 with the passing of the National
Defense Act of 1916. JROTC remained the sole program of the U.S. Army until 1964,
when it was expanded to the other services. The stated purpose of JROTC was to
develop good citizenship and responsibility in young people. The program included
military-based courses taught by retired military personnel, hosted by high schools who
agreed to participate in the program. The original course included a three-hour period of
instruction per week over a three-year time frame. Graduates of the three-year program
received a certificate of eligibility for a reserve commission at the age of 21.
In the first three decades since its inception, JROTC experienced modest growth.
By 1939, there were 295 units established in high schools across the nation, however, the
JROTC program was relatively stagnant from 1947 to 1964 due to personnel and funding
shortages. 2
The passage of the Reserve Officer Training Corps (ROTC) Revitalization Act of
1964 improved the prospects of the JROTC program. In the early 1960s, Secretary of
Defense Robert S. McNamara ordered an evaluation of defense spending. Upon review,
he felt that the benefits of the program (in terms of producing officers or making direct
contributions to the military) did not justify the financial outlay of $4.7 million. JROTC
thus faced a drastic reduction in its budget. Concerned community leaders, parents and
2 Centre for Strategic & International Studies (CSIS), Junior Reserve Officers’ Training Corps: Contributions to America’s Communities: Final Report of the CSIS Political-Military Studies Project on the JROTC (CSIS May 1999),41.

6
teachers, who were convinced of the citizenship values of JROTC, beseeched members of
Congress to re-consider McNamara’s decision. An ad-hoc committee, consisting of nine
military and two non-military members, was formed to assess the value of JROTC and
National Defense Cadet Corps (NDCC). The committee, as there was substantial
national interest in the continuation and expansion of JROTC, reported that JROTC
should be continued, if not expanded. NDCC was not as popular due to the lack of direct
Army personnel support and funding.
The committee findings and a proposed bill by the House of Representatives to
extend the program to other services culminated in the passage of the ROTC Vitalization
Act of 1964. The passage of the Act resulted in significant changes to the JROTC
program. First, the number of JROTC units increased substantially with increase in the
cap for Army (up to 650 units) and the expansion of the program to the other services.
The program grew from 294 units with student enrollment at 74,421 in the academic year
1963-1964 to a total of 646 units with student enrollment at 110,839 ten years later for
Army.3
The JROTC program was also made more appealing to the high school students
by establishing a multi-track program that included academic and technical tracks. The
expanded program allowed placement of students entering the Senior ROTC program or
the Armed Services. Finally, all JROTC instructor positions had to be filled by retired
military personnel, increasing the connection between the program and the services.
The end of the Vietnam War and the introduction of the All Volunteer Force
(AVF) in 1973 resulted in an effort to improve the program’s recruiting potential to
improve the accession numbers for the military. JROTC graduates could now enter at
higher pay grades (E-2 through E-4), depending on their performance and experience in
JROTC. In addition, qualified graduates were given a special “honors” category for
nomination to a military academy. The passage of Public Law 94-361 also saw an
expansion of JROTC units from 1,200 to 1,600. Young women, for the first time, were
allowed to participate in the JROTC program in 1972 but were not counted toward
3 Coumbe, A.T. & Harford, L.S, “US Army cadet command: The 10 year history”, US Army Cadet
Command, 1996: 261.

7
enrollment. In 1973, female participation was recognized with the passage of Public Law
93-165 which stated that females could be counted for enrollment in JROTC.
In the 1980s, budget constraints limited the growth of JROTC. While the passage
of laws had authorized the expansion of JROTC units, the growth of the program was
impeded by the lack of resources. At the same time, concerns about the worth of the
JROTC program cropped up again and this led to the establishment of the JROTC
Improvement Plan (JRIP). The JRIP called for many changes, to include increasing
staffing levels, a co-coordinated growth policy for JROTC and utilizing JROTC for
recruiting purposes. The final recommendations, however, focused on enhancing the
JROTC’s image, raising the cadet performance and quality and improving the
management of JROTC program.4.
The JROTC program was revitalized in the 1990s by President George H.W.
Bush who initiated a marked increase in the program (from 1,500 to 2,900 units). His
ardent support came from the justifications that JROTC increased high school completion
rate, reduced drug use, raised self-esteem, and kept kids on the “right track”. The
National Defense Authorization Act of 1993 raised the maximum allowable number of
JROTC units to 3,500 while the issue of funding was left to the discretion of the DoD and
the individual Services. The services worked toward the 2,900 number and there was a
60% increase in JROTC units during this period. The expansion of the program focused
on placing units in areas like the northern plains, northeast and New England where it
was underrepresented and in inner-city areas, defined as cities with populations greater
than 150,000.5 In the FY2005 budget submittal, the plan is to have 3312 units, with the
Army planning to establish JROTC units at 45 more high schools.6
C. JROTC PROGRAMS BY THE SERVICES
The Navy, Marine Corps and Air Force quickly developed their respective
JROTC programs with the passage of the ROTC Vitalization Act of 1964. The major
4 Ibid, p. 267. 5 The new units in urban areas were primarily concentrated in California, Florida, Georgia, Maryland
and Texas. 6 FY2005 President’s Budget.
8
elements were modeled after the more established Army program and where differences
occur; it reflects the different branch of services that it represents. The Army and the
Marine Corps prefer to emphasize the leadership and citizenship aspects of the JROTC
mission, while the Navy and the Air Force programs have extensive instruction in naval
science and aerospace science, respectively.
1. Army JROTC (AJROTC) The Army supported 1,510 JROTC units in FY2002 and will support 1,600
JROTC units in FY2004. The AJROTC program has the stated goal of being a “public
service program available to high school students” that “fosters good citizenship,
patriotism, and leadership skills for this valuable potential pool of military applicants.”7
This is encapsulated in its mission “to motivate young people to be better citizens”. The
management of AJROTC falls under the command and control of the U.S. Army Cadet
Command.
The program of instruction (POI), the primary vehicle for achieving the stated
objectives of AJROTC, has gone through several changes to adapt to the changing needs
of society. The POI following the birth of JROTC till the 1970s was focused on military
related training. The JRIP initiative in the 1980s saw the POI’s shift in emphasis toward
a more academic program within science and technology emphasis. The latest version of
the curriculum, as of June 2004, incorporated the latest educational theories used in
secondary education and with each chapter being linked with National Secondary School
standards to show a cross-connection with the standard high school curriculum.8
2. Air Force JROTC (AFJROTC) The Air Force JROTC program is the second largest with 744 units worldwide.
The AFJROTC program has the stated goal that “its program is primarily designed to
motivate young Americans to be better citizens with emphasis on self-discipline, personal
7 Department of the Army FY2004/2005 Biennial Budget Estimates: Operation and Maintenance,
February 2003: 335-1. 8 More details can be found the Army JROTC website:
https://gateway.usarmyjrotc.com/http://portal.usarmyjrotc.com/jrotc/dt/estunit.html. Accessed 15 Aug, 2004.

9
responsibility, values, and graduation from high school.”9 Its mission is similar to the
Army’s and worded simply as “to build better citizens for America”. The AFJROTC
program falls under the command and control of the Air Force Officer Accession and
Training Schools (AFOATS/CC) command.
The AFJROTC curriculum is based on the Air Force’s core values of integrity
first, service before self and excellence. It emphasizes both aerospace studies and
leadership/life skills. Therefore, students get to study and discuss the heritage of flight
and navigation, aerospace vehicles, rocketry propulsion, space travel, and aviation
careers, and at the same time are exposed military customs and courtesies, flag etiquette,
basic drill, management, human relations and communication skills. The hosting schools
could emphasize either portion of this curriculum, depending on the needs of the
students. The AFJROTC program mentions that it aims to provide students promising
future either with the Air Force or in the private sector.10
3. Naval JROTC (NJROTC) The Navy supported 584 JROTC units in FY2002 and will support 662 units in
FY2004, with a full authorization goal of 700 units by FY2005. The NJROTC program
“provides the opportunity for secondary school students to learn the basic elements of
and requirements for national security and their personal obligations as Americans”.11 It
falls under the command and control of the Chief of Naval Education and Training
(CNET).
Like the Air Force curriculum, the Navy POI emphasizes nautical and maritime
related topics and leadership education. Besides classroom instruction, the program is
augmented by community service activities that encourage students to participate in civic
programs like drug and alcohol awareness programs, food drives and so on.12
9 Department of the Air Force FY2004/2005 Biennial Budget Estimates: Operation and Maintenance,
February 2003: 625. 10 More details can be found on the Air Force Officer Accession and Training Schools website:
http://www.afoats.af.mil/AFJROTC/default.htm. Accessed June 2004. 11 Department of the Navy FY2004/2005 Biennial Budget Estimates: Operation and Maintenance,
February 2003: Exhibit OP-5. 12 More details can be found on the Naval JROTC website: https://www.njrotc.navy.mil/. Accessed
June 2004.

10
4. Marine Corps JROTC (MCJROTC) The MCJROTC program is the smallest of the service program with 223 high
school units in FY2002. The MCJROTC program seeks “to provide a course in
leadership education to develop informed citizens, strengthen character by teaching of
discipline, and develop an understanding of the responsibilities of citizenship.”13 The
MCJROTC program office falls under the command of the Training and Education
Division and there is no reported intent to expand the program as of FY2005.
The MCJROTC curriculum emphasizes citizenship, character building, service to
the United States, personal responsibility, and a sense of accomplishment in the high
school student.14
D. JROTC FUNDING
JROTC funding comes from the DoD Operation and Maintenance (O&M)
appropriation. It provides for instructor salaries/travel, curriculum, equipment, and
supplies, printing/mail, maintenance repairs, and headquarters and staff. Table 1 shows
the funding of JROTC across all services for FY1999-2005. Table 2 provides the
corresponding unit cost per cadet and per unit.
13 U.S. Marine Corps, Junior Reserve Officers’ Training Corps Program Pamphlet, HQ Marine Corps
Training Command, Quantico, Virginia, 1989. 14 More details can be found on the Marine Corps JROTC website:
http://www.tecom.usmc.mil/jrotc/curriculum.cfm. Accessed June 2004.

11
Table 1. JROTC Funding by Services for FY 1999-2005
Source: Office of the Under Secretary of Defense and President’s Budget: FY2001 – 2004/2005. * Projected estimates.
SERVICE PROGRAM FY1999 FY2000 FY2001 FY2002 FY2003* FY2004* FY2005*
Army JROTC Appropriations ($ thousands) 73,300 83,000 83,836 92,043 97,061 129,978 136,628
Average Cadet Enrollment 227,000 230,000 245,250 250,008 272,579 280,079 287,579
No of Units 1,370 1,420 1,465 1,510 1,555 1,600 1,645 Navy JROTC Appropriations ($ thousands) 23,121 25,913 28,183 32,283 36,817 40,333 44,544
Average Cadet Enrollment 63,395 69,749 74,513 77,958 82,732 87,441 91,973
No of Units 434 490 560 584 623 662 700 Marine Corps JROTC Appropriations ($ thousands) 10,547 11,039 12,628 13,074 13,299 13,200 13,291
Average Cadet Enrollment 22,215 22,374 23,770 25,557 26,781 28,066 29,461
No of Units 178 210 220 223 223 223 223 Air Force JROTC Appropriations ($ thousands) 26,105 32,263 34,766 41,574 43,363 43,413 45,197
Average Cadet Enrollment 91,656 97,426 106,284 113,017 103,128 103,128 113,927
No of Units 609 669 729 744 744 744 744 JROTC Totals Appropriations ($ thousands) 133,073 152,215 159,413 178,974 190,540 226,924 239,660
Average Cadet Enrollment 404,266 419,549 449,817 466,540 485,220 498,714 522,940
No of Units 2,591 2,789 2,974 3,061 3,145 3,229 3,312

12
Table 2. Cost per Cadet and per JROTC Unit by Services for FY 1999-2005
Derived by author The Naval Postgraduate School (NPS) study on the JROTC program in 2003
opined that the services are likely to reach the legislative authorization of 3,500 JROTC
units by FY06, provided the services receive necessary funds.15 The NPS study observed
that the projected austere budget environment in the future mean tighter budget for
JROTC program. In order to meet the increasing demands of the JROTC program as
well as its expansion, the current funding level is not adequate. The NPS study suggested
asking Congress for additional funding but it also acknowledged that the request requires
huge congressional support. This is not likely in view of the costs already associated
with the current war on terrorism.
15 Graduate School of Business, Naval Postgraduate School, A Comprehensive Study of the Junior
Reserve Officer Training Corps Program: Review of Curricular Materials, Budgeting Issues and Recruitment, 2003,8.
SERVICE PROGRAM FY1999 FY2000 FY2001 FY2002 FY2003* FY2004* FY2005*
Army JROTC Cost per Cadet ($) 323 361 342 368 356 464 475 Cost per JROTC unit ($) 53,504 58,451 57,226 60,956 62,419 81,236 83,057
Navy JROTC Cost per Cadet ($) 365 372 378 414 445 461 484 Cost per JROTC unit ($) 53,274 52,884 50,327 55,279 59,096 60,926 63,634
Marine Corps JROTC Cost per Cadet ($) 475 493 531 512 497 470 451 Cost per JROTC unit ($) 59,253 52,567 57,400 58,628 59,637 59,193 59,601
Air Force JROTC Cost per Cadet ($) 285 331 327 368 420 421 397 Cost per JROTC unit ($) 42,865 48,226 47,690 55,879 58,284 58,351 60,749
JROTC Totals Cost per Cadet ($) 329 363 354 384 393 455 458 Cost per JROTC unit ($) 51,360 54,577 53,602 58,469 60,585 70,277 72,361

13
E. PROGRAM OUTCOMES
Anecdotal findings and previous studies have attested to the success of the
program in terms of positive academic and social outcomes associated with JROTC
participation.16 Detractors of the JROTC program, on the other hand, have always
criticized the program on the premise that it goes against the basic tenet of public
education by “introducing guns into the schools”. 17 Whether JROTC influences
outcomes, military recruitment and accession, and values is still a matter of debate.
In terms of academic outcomes, various studies conducted by hosting high schools have
found that JROTC cadets, when measured against key indicators of student performance
perform just as well as their non-JROTC peers. The indicators include better class
attendance rates, lower drop-out rates and higher graduation rates. 18 These studies
emphasized the significance of the results due to the higher proportion of “at risk”
students relative to national norms amongst the JROTC participants. Anecdotally,
principals of schools with JRTOC units indicate that having JROTC reduces disciplinary
problems in their schools.
Previous research also suggests positive social outcomes in terms of meeting the
objectives of the JROTC program in instilling citizenship and character development.
For example, JROTC graduates reported higher levels of self-esteem, personal maturity
and personal efficacy than a comparison group of college students. There appears to be a
positive correlation between Army JROTC participation and assertiveness, caring, social
integration and demographic values scores among students compare with a sample of
non-JROTC students, amidst other similar studies. 19
16 Ibid, 62-85. 17 America Friends Service Committee Online, Making Soldiers in the Public Schools: An Analysis of
the Army JROTC Curriculum, April 1995,3 [www.afsc.org/youthmil/jrotc/msitps.pdf] Accessed June 2004. 18 Taylor, W.J, Junior officers’ training corps contributing to America’s communities: Final report of
the CSIS Political-Military studies project on the JROTC, Center for Strategic and International Studies, Washington, DC, (1999).
19 , D.F., & Ritter, D.L, Comparison of democratic maturity and self-fulfillment between high school AFJROTC students and upper division college students, Education , 120(3), 2000: 410-415; Reiger, R.C., & DeMoulin, D.F., Comparing democratic maturity test score between high school ARMY JROTC students and other students, Education, 121(1),2000: 43-45.
14
Although JROTC is not a recruiting tool, the exposure of JROTC participants to
the military life probably has an influence in their future career choice. The NPS study
examined JROTC’s impact on accession and first-term attrition of JROTC graduates.
Relying on cohort accession files from DMDC and general descriptive data, the study
found that JROTC graduates had consistently lower first-term attrition than non-JROTC
enlistees. The study further examined the first-term attrition patterns along racial groups,
AFQT categories and reason for discharge and found that: first-term attrition rate is
relatively lower for JROTC graduates who are minorities than for whites; it is lower for
JROTC graduates in higher AFQT categories with differences between them and all
recruits greatest in lower AFQT categories; it is lower also when recruits are examined by
reason for discharge. While the results are suggestive, we must caution that the
descriptive statistics do not provide rigorous causal linkages between JROTC and the
variables of interest. JROTC participation, for example, may merely signal a pre-existing
commitment to join the military. Our thesis, therefore, seeks to examine the purported
relationship between JROTC graduates and propensity to enlist, retention and attrition.
through various multivariate regression techniques. Until such an analysis is completed,
we hesitate to draw any conclusions on the basis of descriptive statistics.
F. CONCLUSION
The comparison of the four services’ JROTC program has one common theme,
which is to instill citizenship values in high school students. Yet, as a youth program,
JROTC is controversial. Civilian proponents and opponents of the JROTC program
differ in their tastes for the military way of life. The former believed in the positive
academic and social outcomes of the program while the latter abhorred the concept of
guns and violence included in high school education. Within the military, the question of
the value-added of JROTC to the military keeps surfacing. There is therefore, definite
interest from all stakeholders of the JROTC program to find out the influence of JROTC,
if any, on military recruiting, retention and attrition via a more comprehensive program
of analysis.
15
III. LITERATURE REVIEW
A. INTRODUCTION
In this chapter, we aim to provide an overview of the relevant studies on
enlistment decisions, retention and re-enlistment. The literature search allows us to
gather the pertinent factors, in addition to the impact of JROTC participation, that are
important in youths’ decisions to enlist and military personnel’s decision to re-enlist.
Since the explanatory variable of interest is JROTC participation, we are also interested
to find out if there have been previous studies that included JROTC as one of the
independent variables. This chapter presents the literature review in three broad sections
- recruitment studies, retention and re-enlistment studies, and JROTC-related studies.
The recruitment studies section looks at studies relating to enlistment decisions,
propensity to enlist and enlistment incentives. The retention and reenlistment studies
section looks at the factors that affect the decision to stay or leave the military. The last
section looks at existing literature on JROTC programs and its social and academic
outcomes.
B. RECRUITMENT STUDIES
1. Enlistment Decision McFadden (1983) assumes that individuals choose the activity that yields the
highest expected utility. In the context of military enlistment study, the choice is between
military employment and non-military employment. Therefore, the individual’s decision
to enlist in the military is the result of enlistment utility being greater than the utility of
the other alternatives. This random utility framework expresses the probability that the
individual chooses the activity as a function of the characteristics of the individual and
the attributes of the choice.
The probability that an individual enlists is higher when the coefficients on the
individual characteristics and choice attributes for enlistment are higher than other
alternatives. Individual i will be more likely to enlist than another individual j if
16
individual i has characteristics that tend to raise the utility of enlisting relative to other
alternatives. Similarly, if the military has an attribute that increases the utility of enlisting
relative to other alternatives, the probability of enlisting increases. While JROTC was
not the focus of the study, McFadden’s work suggests that if JROTC positively
influences the utility of military service for the ith individual, the probability of the ith
individual enlisting will increase.
Hosek and Peterson (1985, 1990) and Kilburn and Klerman (1999) utilized a
random utility framework to examine enlistment decisions using individual-level data.
Hosek and Peterson (1985, 1990) looked at individuals’ choice between military
enlistment and non-military employment whereas Kilburn and Klerman (1999) expanded
Hosek and Peterson’s studies to include individuals’ choice amongst military enlistment,
college and civilian employment. Both studies included supply and demand factors in
their specification models. Hosek and Peterson (1985, 1990) had used the 1980 wave of
the National Longitudinal Survey of Youth (NLSY) and the 1979 DoD Survey of
Personnel Entering Military Service, while Kilburn and Klerman (1999) had used the
1992 and 1994 wave of the National Educational Longitudinal Study (NELS).
On the supply side, Hosek and Peterson (1985, 1990) hypothesized that an
individual who expects higher returns to educational investments would be more likely to
acquire more education after high school and thus would be less likely to enlist in the
military. Also, if an individual finds that education costs are higher or education is less
available, the probability of enlisting is higher as compared to pursuing higher education.
Better civilian labor market opportunities also reduce the likelihood to enlist in the
military. Black and Hispanic race ethnicity are included in the Hosek and Peterson
model to study their impact on the decision to enlist and it was found that black men were
more likely to enlist than non-blacks while Hispanics were less likely to enlist as
compared to whites.
On the demand side, Hosek and Peterson (1985, 1990) hypothesized that an
individual who is in an area with higher recruiter density would be more likely to enlist in
the military. They included enlistment standard measures to control for the eligibility of
the individual to enlist. Hosek and Peterson (1985) chose demand variables that vary
17
across states but not across time. The usual factor that lies on the demand side of the
enlistment market, like national advertising, enlistment incentives and number of
recruiters, which could not be studied with individual-level data as they vary at the
national level.
The Hosek and Peterson (1985, 1999) studies found that the high school graduates
were more responsive to work-related variables like pay, length of job, labor force
experience, employment status, and duration of joblessness that impact their enlistment
decisions. The high school seniors, on the other hand, were more responsive to
educational-related variables like learning proficiency measures, financial ability for
education, expectations of more education; and parental-related variables like parental
influence.
The Hosek and Peterson study looked at demographic characteristics of
individuals, educational aspirations and influence of parents and recruiters but not the
impact of JROTC. One possible reason that JROTC was never a factor in the traditional
enlistment models is that JROTC is perceived as a citizenship program rather than a
recruiting tool. However, the JROTC program does provide a realistic job preview of the
military lifestyle and thus create a possibly positive influence in the participants’ military
enlistment decisions. Moreover, there is a military incentive in JROTC participation
whereby graduates of the program can enlist into the military at an advanced paygrade.
Kilburn and Klerman (1999) replicated Hosek and Peterson’s study. They added
additional variables to capture factors that were of importance at the time of the study but
might have been relatively unimportant in the 1980s. The new variables included
average in-state tuition at a four-year institution, whether youths come from an immigrant
household, whether the parents’ have served in the military and whether the individuals
ever used marijuana or were arrested to indicate if they are likely to meet the military’s
moral standards.
Kilburn and Klerman (1999) deleted some variables based on the reasoning that
these variables could be endogenous to the choice decision between enlistment and

18
alternative activities, like the indicator if the respondent lives at home20, resulting in
correlation with the error term of the logit models, hence, biased estimates. Another
reason is that some of the variables, like labor-market variables for graduates who have
enlisted21, are not meaningful in the study. Therefore, the Kilburn and Klerman (1999)
study looked at recruiter density and AFQT category IV instead.
Kilburn and Klerman (1999), however, could not replicate Hosek and Peterson
(1985, 1990) results in that many of the explanatory variables lacked significance. For
the high school seniors, the blacks appear to enlist at a lower rate compared to whites,
contrary to Hosek and Peterson’s findings but providing further evidence on the recent
trend of declining enlistment propensity for blacks in the 1990s (see Orvis et al. (1996)).
Also, the study found that a working mother increases the probability of enlistment for
high school seniors. On the other hand, if individuals come from an immigrant
household (using English as a first language as proxy) negatively influenced enlistment
probability.
For the high school graduates segment, Kilburn and Klerman (1999) found that
graduates in the higher AFQT categories were more likely to enlist opposite that of the
high school seniors. Other differences include having a parent in the military raises the
probability of enlistment, not using marijuana reduces the probability of enlistment and
having an arrest record increases the likelihood of enlistment.
Again, JROTC was not factored into the Kilburn and Klerman (1999) study,
possibly for the same reason put forth earlier. We conclude from our literature search on
military enlistment decisions studies that there has never been an empirical study done on
20 According to Kilburn and Klerman (1999), if the individual is a senior and plans to relocate at the
end of his senior year, it is unlikely that the individual will set up a separate household at time of responding to the survey.
21 Kilburn and Klerman (1999) explained that graduate enlistees are likely to respond negatively to the question of whether they are currently employed when they are in the Delayed Entry Program (DEP).

19
the impact of JROTC participation on the decision to enlist although there have been
anecdotal findings that JROTC participation has a positive impact.22
The random utility framework underpins the theoretical model developed for the
purpose of this study. As the High School and Beyond (HS&B) data is different from the
data used in the above two studies, the literature review of their specification models
provides a template for the type of covariates to be taken into consideration but
impossible to replicate the exact same type of variables. Both of these studies run two
sets of regression, one for the seniors and one for the graduate pool of eligible applicants.
This implicitly implies that the decision behaviors for these two groups are different but
there was no statistical evidence reported in these studies that the two groups should be
estimated separately. We will discuss the estimation methods for our HS&B data in
Chapter V.
2. Propensity to Enlist Enlistment propensity is an overall measure of youths’ interests and plans
pertaining to military service. Military planners are especially interested in the
relationship between propensity to enlist and actual enlistment. If it is found that
individuals who state positive enlistment intentions are more likely to enlist than those
stating negative intentions, military recruiters will then find it more worthwhile to target
their recruiting efforts at those individuals with high propensity to enlist. 23 Previous
research suggests that there is a relationship between enlistment intentions and
propensity.
The Youth Attitude Tracking Study (YATS) was the primary tool used from 1975
to 1998 by the Department of Defense (DoD) to measure the propensity of youth to enlist
in the armed forces. Previous research shows that YATS propensity measures are valid
measures of enlistment behavior. A RAND study shows that high quality youth
providing an unaided mention of plans to enlist are seven times more likely to enlist than
22 See Department of the Army FY2004/2005 Biennial Budget Estimates: Operation and Maintenance, February 2003: 335-1. Taylor, W.J, Junior officers’ training corps contributing to America’s communities: Final report of the CSIS Political-Military studies project on the JROTC, Center for Strategic and International Studies, Washington, DC, (1999).
23 Orvis, Bruce R. & Sastry, N, Military Recruiting Outlook: Recent Trends in Enlistment Propensity and Conversion of Potential Enlisted Supply, RAND Corporation, 1996: 51-53.

20
those who say they will “probably not” or “definitely not” serve24. YATS provided a
nationally representative sample of youth from ages 16 to 24. It was the only mechanism
in place that measured propensity to enlist, which has been found to have a strong
correlate with enlistment behavior. This information is important because the increasing
number of high school graduates attending colleges limits the supply of high quality
applicants to the services. The empirical predictive validity of YATS propensity, as
discussed below, as a measure of enlistment behavior has been shown repeatedly over the
past 20 years.
Administered by the Defense Manpower Data Centre (DMDC), the YATS
focused on two different types of propensity measures, positive and negative. In 1980,
RAND provided the first evidence on the relationship between intentions and enlistment
decisions. Combining data from the YATS and the Military Entrance Processing
Command (MEPCOM), researchers were able to match survey responses to actual
enlistment decisions. The 1980 study showed a strong relationship between stated
propensity to serve in the military (intention) and enlistment, at both the individual and
aggregated levels.25
RAND conducted the intention-propensity study again in 1994 with FY94 survey
data and FY95 MEPCOM enlisted records. RAND used survival analysis techniques that
include the various enlistment periods and YATS survey periods. The goal was to
examine propensity trends during the same time frame. The methodology applied to
conduct trend analysis was to build an econometric model, which predicted respondents’
aptitude from their self-reported demographic and academic characteristics.26
The methodology employed to assess the propensity to enlist was the weighting of
the survey data. The Office of the Secretary of Defense, in particular the Office of
Accession Policy and the Defense Manpower Data Center in collaboration with DMDC
24 Defense Manpower Data Center, Youth Tracking Study, 1998 Propensity and Advertising Report
DMDC Report 2000-02, July 2000. 25 Orvis Bruce R., Martin Gahart, Alvin K. Ludwig, with Karl F. Schutz , Validity and Usefulness
of Enlistment Intention Information, Santa Monica, CA: RAND, R-3775FMP, 1992. 26 Ibid.
21
developed the procedure. The sample results needed to be weighted to reflect differences
between the composition of the sample and that of the population it is supposed to
represent.27
The results were analogous to those from the 1980 study with the exception of the
stated propensity of one race ethnic group. The decline in propensity to enlist in the FY95
study is much steeper for African Americans than any other racial ethnic group. Relative
to the FY89 survey, enlistment propensity appeared to decline 10 percent for whites. The
same time period also saw a decrease in positive propensity to enlist for blacks.
Bachman et al. examined the correlates of propensity and enlistment in the
military28. Their goal was to examine factors correlated with plans for military service
(military propensity) and actual enlistment in the service. They used bivariate and
multivariate regression analysis independently for men and women. They set out to
predict what factors lead some young men and women to choose military service, and
what factors lead to successful enlisting among those who choose military service. In
order to answer those questions they used cross-sectional and longitudinal panel survey
data29. Survey data from nationwide samples totaled more than 100,000 high school
seniors (classes 1984-1991). In addition, data also included a sub sample of 15,000
seniors who were tracked beyond their senior year for one or two years
The findings indicated that those who enlist directly after high school intended to
do so by the end of their senior year. In addition, those that actually enlist have no desire
to attend college and view the military as a potential career option. It must be stated that
although panel data was utilized, the surveys used did not track respondents throughout
their decision making process. The surveys only captured their responses at or near the
end of the process when various options had been weighed. The MTF surveys used in
27 Bruce Orvis, Narayan Sastry and Laurie McDonald, Military Recruiting Outlook, Recent Trends in
Enlistment Propensity and Conversion of Potential Enlisted Supply, Santa Monica, CA: RAND, 1996. 28 Jerald G. Bachman et al., Who Chooses Military Service? Correlates of Propensity and Enlistment
in the U.S Armed Forces, Military Psychology, Vol. 12. No. 1, 2000. 29 Survey derived from the Monitoring the Future (MTF) survey. MTF devised to study changes in
the beliefs, attitudes, and behavior of young people. Nationwide sample consisted of 100,000 high school seniors and post graduation data is collected. The MTF gauges propensity and enlistment data as well as a broad range of other measurable characteristics.
22
this study contain several hundred questions that bear on a broad range of questions
dealing with behaviors and attitudes. There were no questions that addressed whether a
student participated in JROTC.
3. Enlistment Incentives Enlistment incentives and their corresponding effectiveness are of great interest to
academics, policy makers and military personnel alike. In this section, we examine the
literature on enlistment incentives and how they possibly impact the enlistment decisions.
The consensus appears to be that education and bonus incentives generally tend to have a
positive impact on enlistment decisions.
Bachman and Blair (1985) stressed that the typical high school student planning
to attend college tends to have an otherwise negative perception of the military and feels
as if it is an interruption in their educational plans.30 The “college in exchange for
service” formula is a means of attracting able individuals who can learn quickly, serve
quickly, and then leave quickly to make room for other recruits. There are many
incentives to joining the military and the most widely used is the Voluntary Education
Program (VOLED). In order to analyze the effect of participation in VOLED on
retention, they estimated a binomial probit model. The dependent variable was whether
the sailor reenlisted or extended at the end of first-term. They tracked the FY92 cohort
of obligors through to their first enlistment decision (24,756 observations) to examine the
effects of VOLED on retention. Retention was measured by reenlistments and extensions
of more than one year. Bachman and Blair found that sailors who decided to participate
in VOLED had higher reenlistment rates than those who did not participate in VOLED.
Gilroy (1986) found that pay has a very strong effect on enlistments31. However,
the effect varies depending upon the occupational specialty code. A one percent increase
in relative military pay would cause the enlistment supply to increase by 0.50 to 3.61.32
30 Jerald G. Bachman and John D. Blair, Citizen Force or Career Force? Implications of Ideology in
the All-Volunteer Army, Armed Forces and Society, Vol. 2, No. 1, November 1985, pp 81-96. 31Curtis Gilroy, Army Manpower Economics, West view Press, Boulder and London, 1986 32 Martin Binkin, America’s Volunteer Military: Progress and Prospects, The Brookings Institution,
Washington, DC 1984.
23
As for enlistment bonuses, the magnitude of a bonus is much smaller than that of relative
pay. This may imply that it is expensive to use bonuses to channel recruits to various
occupational specialties.33
Warner (1990) determined that, between 1981 and 1986, the average present
value of Army educational benefits increased by nearly 70 percent.34 According to an
estimate of the effects of Army educational benefits on enlistments, such an increase
would induce high-quality enlistments to rise by about 29 percent. Because actual
enlistments nearly doubled over this period, more than one-quarter of the increase in the
Army’s high quality enlistments apparently can be traced to increases in the Army’s
educational benefits. During the period of this study, however, the country was
experiencing a recession; therefore, the impact of the ACF on enlistments may be a proxy
for the economic downturn and not the influence of educational benefits on enlistments.
Gilroy, Phillips and Blair (1990) examined the effects of the Army College Fund
(ACF) on recruiting.35 The ACF is an enlisted incentive option designed to aid in the
recruitment of highly qualified soldiers for critical or shortage Military Occupational
Specialties (MOS). The ACF supplements the basic Montgomery GI Bill (MGIB)
entitlement. They found that a 10 percent increase in the ACF amount results in a 1.4
percent increase in the supply of enlistments. The study also suggested that relative to
bonus programs, educational benefits enhance the flow of prior service individuals into
the military.
Aasch and Dertouzos (1994) analyzed the relative cost-effectiveness of enlistment
bonuses and educational benefits.36 They found that educational benefits significantly
expand enlistment supply and increase incentives for first-term completion.
33Ibid. 34 John T. Warner, Military Recruiting Programs During the 1980s: Their Success and Policy Issues,
Contemporary Policy Issues, Vol. VIII, October 1990, pp 47-67. 35 Curtis Gilroy, Robert L. Phillips, and John Blair, the All Volunteer Army Fifteen Years Later,
Armed Forces and Society, Vol. 16, No 3, Spring 1990, pp 329-350. 36 Beth Aasch and James Dertouzos, Educational Benefits Versus Enlistment Bonuses: A Comparison
of Recruiting Options, RAND Corp, MR-302-OSD) Santa, Monica, CA 1994.

24
Garcia et al. (2002) study also looked at VOLED in a project commissioned by
the Chief of Naval Personnel which requisitioned the Center of Naval Analysis (CNA) to
determine the effectiveness of VOLED and its impact on retention for the Navy sailors.
VOLED provides an incentive to sailors to pursue off-duty education to enhance their
investment in human capital. VOLED consists of four elements: Tuition assistance
(TA), the Program for Afloat College Education (PACE), the Academic Skills Learning
Centers (ASLCs) and the education centers. TA accounted for 54 percent or 30.9 million
of VOLED expenditures in FY98.37 About 60,800 active duty enlisted sailors, 18.1
percent of the force, participated in the VOLED in FY97. Currently, over 300,000
servicemen and women are enrolled in post secondary courses leading to associates,
bachelors, masters and doctorate degrees. Table 3 outlines the most recent breakdown
across services of VOLED participation rates and expenditures.
Table 3. Voluntary Education FY03 Army Navy Marines Air Force DOD total INDIVIDUAL ENROLLMENTS High School Completions 332 93 12 176 613 Non Credit Courses Language 0 0 0 632 632 Military Specialty 0 5,318 0 0 5,318 Basic Skills 18,025 11,768 2,392 5,161 37,346 Postsecondary Undergraduate 283,904 163,164 76,908 254,409 778,385 Graduate 30,162 11,859 4,688 39,305 86,014 Navy Undergraduate includes PACE DEGREES COMPLETED Army Navy Marines Air Force DOD TotalHigh School/GED 84 64 22 36 206 Associate Degrees 3,374 1,371 510 15,264 20,519 Baccalaureate Degrees 2,282 1,459 715 4,065 8,521 Graduate Degrees 1,526 323 197 2,196 4,242 Doctorate Degrees DNC 1 0 38 39 EXPENDITURES (in millions) Army Navy Marines Air Force DOD TotalPersonnel Costs $35.7 $10.8 $3.0 $33.1 $82.6Contract Costs (Non Instructional) $0.0 $0.0 $0.5 $0.0 $0.5Contract Costs (Instructional) $2.0 $20.3 $0.5 $0.1 $22.8Tuition Assistance $157.3 $58.7 $35.4 $120.2 $371.6TOTAL EXPENDITURES $195.0 $89.8 $39.3 $153.3 $477.5
37 Federico E. Garcia, Ernest Joy and David L. Reese, Effectiveness of the Voluntary Education
Program, CAN, Alexandria, Va (2002)

25
DANTES TESTING (FUNDED) Army Navy Marines Air Force DOD TotalCLEP General 4,039 7,458 1,716 23,303 36,516 CLEP Subject 4,865 6,078 1,600 17,667 30,210 DSSTs 7,118 8,564 1,498 36,224 53,404 EXCEL 2,091 2,359 233 3,080 7,763 SAT 1,134 3,530 643 381 5,688 ACT 2,103 3,118 502 266 5,989 GRE 548 195 34 798 1,575 GMAT 274 210 34 331 849 PRAXIS 663 338 69 253 1,323 GED 582 1,751 321 10 2,664 GUIDANCE 31,943 5,324 997 5,162 43,426 ASE 1,603 1,534 123 351 3,611 Total Testing: 56,963 40,459 7,770 87,826 193,018
Source: Under Secretary of Defense and Personnel Readiness: DOD Voluntary Education.
(http://www.voled.doded.mil)
C. RETENTION AND REENLISTMENT STUDIES
In this section, we review the previous studies of the retention and reenlistment
behavior of military personnel. The military is especially concerned on the first-term
completion rates and reenlistment rates as they have an impact on the force mix and
manpower costs (accession and training). The literature review of these studies helps
construct our theoretical model for the study of the impact of JROTC on retention and
reenlistment.
Most of the studies investigated the retention effects of two main categories of
variables. The first category is the impact of pay-related variables to include relative
military pay, retention bonuses, and the returns to the decision to stay in the military
compared to alternative civilian employment. The second category examines how
individual characteristics (aptitude scores, race or educational qualification) or work
environment (incidence of sea duty, length of deployment and time spent underway while
not deployed) affect first-term completion reenlistment eligibility.

26
1. Pecuniary Factors on Retention and Reenlistment Quester and Adedeji (1991) analyzed the impact of bonuses, grade and
dependency status on re-enlistment. 38 There have been substantial changes in the
characteristics of enlisted Marines and Marine Corps policy, and these changes led to this
research on first-term reenlistment decisions. First, the responsiveness of high quality
marines to incentives had not been investigated. Secondly, with the increase in marriages
and dependency status of marines, the potential retention implications were not observed.
Thirdly, the researchers were interested in the impact of the implementation of long-term
contracts. Generally, the first term enlistment contract was three to four years, but most
recently the first term enlistment contracts are four or six years. Finally, the time in
service requirement has increased for promotion to corporal and sergeant, which was
directly impacted by high retention. Larger numbers of marines remained in service,
therefore, slowing down the promotion norms.
The Quester and Adedeji study restricted the population sample to “recommended
and eligible” marines in the first 72 months of service.39 To obtain valid estimates of the
effects of particular variables on the reenlistment decision, a multivariate model was
estimated. The goal was to partition out the independent effects of grade, compensation,
and marital status on the reenlistment decision. Some characteristics, however, vary
together. Fortunately, there is sufficient variation in the data to allow estimation.
The researchers used two basic specifications for the reenlistment equation. The
first model specification includes the pay index and civilian unemployment rate variables.
The pay index is the simple average of pay index value for the current quarter and is
constructed by obtaining the ratio of military pay series to civilian pay series. The second
model specification omits pay index and civilian unemployment rate, and adds instead a
set of control variables, one for each fiscal year. The results of this study were higher
promotion percentages; longer initial enlistments and high SRB’s are associated with
higher re-enlistment rates. Moreover, minorities, females, and married marines are more
38 Quester, A and A. Adedeji, “Reenlisting in the Marine Corps: The Impact of Bonuses, Grade, and
Dependency Status,” C.N.A Corporation, Alexandria, VA, July 1991. 39 Ibid.

27
likely to reenlist than other groups. Lastly, a higher military to civilian pay index and
high unemployment are associated with re-enlistment probabilities.
Warner and Asch (1995) employed an Annualized Cost of Leaving (ACOL)
model40 to compare the present value of future streams of military earnings and civilian
earnings in a specific time horizon. The ACOL model states that an individual chooses to
stay in the military if the net returns to staying in the military are greater than the taste for
civilian life. The weakness of the ACOL model lies in its inability to incorporate
dynamic changes in the environment. Nevertheless, the positive correlation between
reenlistments and pay (either through bonuses or regular compensation) has been well
established both theoretically and empirically.41
Mackin and Darling (1996) looked at the impact of incentive pay on officers’
retention behavior. The findings could provide some insights to the utility of introducing
incentive pay for the enlisted personnel. Mackin and Darling conducted a comprehensive
cost benefit analysis of the feasibility of the Surface Warfare Officer (SWO) Career
Incentive Pay (CIP).42 The costs of introducing SWOCIP was weighed against the
benefits of reduction in the number of accessions hence cost savings of accession and
training costs.
As there had been no study of pay and retention elasticity estimates for the SWO
community, Mackin and Darling used the estimates from the aviation and nuclear officer
communities as proxies. A criticism of this study lies in their use of pay and retention
elasticity estimates from the aviation and nuclear officer communities that do not share
similar traits as that of the SWO community like different contract obligation, training
costs, working conditions and demographics. Nevertheless, applying transition analysis
and sensitivity analysis, the study found that the SWO community is responsive to pay
changes and that the SWOCIP implementation, in particular a CIP quantum of ten
40Warner, J., and B. Asch, “The Economics of Military Manpower,” Handbook of Defense
Economics, Volume 1, Elsevier Science, BV, 1995. 41 Ibid. 42 Mackin, C., and K. Darling, “Economic Analysis of Proposed Surface Warfare Officer Career
Incentive Pay,” Bureau of Naval Personnel, Washington, DC, September 1996.

28
thousand dollars, would bring about significant cost savings while giving the Navy the
ammunition to retain high-quality officers.
Hansen and Wagner (2002) estimated the relationship between military
compensation and enlisted retention using standard logistic regression43. They asserted
that to effectively man a volunteer force, the Navy must offer compensation that
motivates men and women not only to enlist in the Navy, but also to remain in the Navy
past their initial commitments. 44 The baseline model employed encapsulated three
general categories of variables: variables that affect military compensation, variables that
affect civilian earnings opportunities and those that reflect a relative preference for
military service. In this study, in order to identify those who reenlist, the researchers
exclude service members who do not extend beyond three years. Women were excluded
as well due to their small sample size. Those that are ineligible to reenlist remained in
the sample and the justification was inferred that servicemen made bad decisions. The
findings suggest that estimates of the pay elasticity of reenlistment are highly sensitive to
the choice of empirical specification. The researchers found that pay elasticity’s differ
significantly between models and thus could not be used as an accurate tool to predict
reenlistments. The same data was used to estimate each alternative model and the
differences in pay elasticity did not reflect actual changes in the responsiveness to pay of
Navy enlisted personnel, but rather shifts in the magnitude of responsiveness that these
models attribute to pay.45
The covariates used in this study provide ideas on the factors that have to be
controlled in our theoretical models for retention and reenlistment. We note that using
the ACOL model to reflect relative preference for military service in this study could
result in selection bias. This is because the researchers obtained civilian pay data from
veterans and not a random sample of civilians. This created a self-selection bias because
those who left the service had made the decision to leave already.
43Hansen, M. J. Wagner, “Why Do Pay Elasticity Differ?” C.N.A Corporation, Alexandria, VA,
March 2002. 44 Ibid. 45 Ibid.

29
2. Individual Characteristics on Retention and Reenlistment Ward and Tan (1985), in one of the first empirical studies, examined the retention
behavior of “quality” enlisted personnel using the 1974 cohort in all services.46 They
constructed a single measure of quality by combining performance-based measures with
entry-level and background characteristics. Performance-based measures include the
length of time for promotion to E-4 and E-5, while the entry-level characteristics include
education levels and AFQT scores. Quality was estimated for eight different occupation
groups. They argued that background characteristics were useful in predicting
subsequent performance as measured by promotion rates.
Cooke and Quester (1992) examined the background characteristics of Navy
enlisted personnel that are likely to increase the likelihood of contract completion. The
researchers define a successful enlistee as one who completed his or her enlistment, was
eligible to reenlist, and either reenlisted or extended. Using logistic models to estimate
the relationship between recruit background characteristics and successful outcomes in
the Navy47, the study found that recruits who were high school graduates, with high
AFQT scores, and entered through the Delayed Entry Program (DEP) were more likely to
be complete their first-term enlistment contract. In addition, black and Hispanic recruits
were more likely than other to complete their first enlistment and be promoted. The
study also concluded that characteristics associated with contract completion are also
good predictors of retention and promotion.
From our literature review on retention and reenlistment studies, we conclude that
retention and reenlistment models have often included variables other than pay. The non-
pecuniary aspects include personal characteristics, such as marital status, race, education,
and mental group. These same factors could also be used to find out the relative tastes
for the military life via the ACOL model. If a retention model includes those personal
characteristics and the ACOL variable, the question of multicollinearity arises. However,
one could argue that those personal characteristics should be included as the ACOL
46Ward, M. and H. Tan, “The Retention of High Quality Personnel in the U.S Armed Forces, “ The Rand Corporation, Santa Monica, CA 1985.
47Cooke, W., and A. Quester, “What Characterizes Successful Enlistees in the All-Volunteer Force: A Study of Male Recruits in the U.S Navy,” Social Science Quarterly, volume 73, Number 2, June 1992.

30
variable might not be able to capture all these effects on retention or reenlistment
behaviors. Personal characteristics should certainly be included if there is an independent
interest in their effects on retention and reenlistment. 48
Various studies have been conducted on officer and enlisted personnel retention
and reenlistment but none had included JROTC participant as one of the explanatory
variables. As our primary interest in this study is the impact of the personal
characteristic of JROTC participation on retention and reenlistment, the personal
characteristic of JROTC participation will be included in our analysis.
D. STUDIES ON JROTC
To date there is a consensus on literature pertaining to the positive impact JROTC
participation has on participant’s performance. Some researchers claim heightened
performance in high school and on college entrance exams for JROTC participants. In
this section, we discuss some studies on performance of JROTC participants.
1. Benefits of Navy JROTC Balley et al. (1992) study was perhaps the only one study that had attempted to
evaluate the benefits of JROTC to the military. This study, in particular, looked at the
benefits of Navy JROTC (NJROTC) to the Navy.49 Balley et al. administered a survey
to NJROTC cadets in 38 NJROTC units (out of 300 units) and they received 5,521
responses. Overall, the NJROTC host school administrators, instructors, community
leaders, and cadets shared positive perceptions of the value of the program. The positive
impact of NJROTC program on youths’ education was evident when almost two-thirds of
the NJROTC cadets agreed that NJROTC participation was a major factor in their
decisions to remain in school.50
On the impact of the NJROTC program on the cadets’ propensity to enlist, the
study found that approximately 20 percent of the respondents indicated military
48 Ibid. 49 Balley, Hodak, Sheppard and Hassen, Technical Report 92-015, Benefits Analysis of the Naval
Junior Reserve Officers Training Corps, Naval Training Systems Center, Orlando, FL, June 1992. 50 Ibid.

31
enlistment as their career plans after high school while the majority at 60 percent planned
to attend college. Of the 762 cadets who indicated they were planning to enlist in the
service, 20 percent had been in the NJROTC program for at least three years; and 32
percent of the youth had held after school jobs. A total of 592 cadets had elected to take
the Naval Science course voluntarily.51 Of those possibly interested in enlistment, the
majority reported satisfaction with their overall experience in the NJROTC program.
When compared to the overall sample population, a higher percentage of cadets (66.6%)
expressed an interest in enlisting after high school. Cadets agreed that participation in the
program was a major factor in their decision to remain in school.
One-third of the NJROTC cadets expressed interest in enlisting in the Navy. For
the total sample population, more cadets expressed an interest in enlisting in the Navy
(30.8%).52 For the remaining branches of service, 12 percent are interested in the
Marine Corps; 11 percent in the Air Force; and 9 percent in the Army. Nine percent of
the cadets expressed an interest in the Coast Guard and six percent in the Merchant
Marine.
Bally et al. (1992) merely reported the survey results and did not attempt an
empirical analysis of the data obtained that could shed some insights to the enlistment
propensity behavior of the NJROTC cadets. Furthermore, Bally et al. only surveyed
NJROTC cadets in the identified NJROTC units when a comparison of NJROTC cadets
and non-NJROTC cadets in those units would have given more robust qualitative
findings.
2. Benefits of JROTC The Center for Strategic and International Studies (CSIS) conducted a study in
1999 to objectively evaluate if JROTC benefits the participants and communities and to
provide possible recommendations for policy makers. The researchers employed field
research methodology and randomly selected high schools that host JROTC programs
from three urban cities, Chicago, Washington D.C and El Paso. The field research
studied high school students from School Year (SY) 1993 to 1998 and included JROTC
51 Ibid. 52 Ibid.

32
participants from 28 JROTC units. This research involved personal interviews and
written surveys with more than 150 school officials, including principals, assistant
principals, academic counselors, security personnel, teachers and JROTC instructors. 53
In addition, several students completed written questionnaires or were directly involved
in focus groups sharing their perceptions of JROTC and how the program has impacted
their educational experience.
In Chicago, there are 75 public schools in which there are 40 JROTC units (33
Army units, four Navy units, one Air Force unit and two Marine Corp units). 54 With the
help of the Directorate of Army Instruction (DAI) located in the Chicago Public School
District (CPS) central administration, the researchers obtained useful information on
JROTC and non-JROTC participants in 16 of the 18 schools visited by the research team.
Data provided to the research team included grade point averages (GPA), suspension
rates, absentee information, graduation rates and college entrance examination scores.
The CSIS study followed a single cohort of JROTC and non-JROTC participants
in Chicago from SY 93 (freshmen) to SY 97 (seniors) and tabulated their findings based
on the information provided by DAI. Specifically on educational outcomes, the
researchers used the average GPA scores of the students as proxy for the impact of
JROTC program on the students’ academic performance. The CSIS study found that in
SY 1993-1994, the JROTC students’ GPA scores were lower than that of the non-
participants. However, in the subsequent school years, the GPA scores of JROTC
participants improved and even surpassed that of the non-JROTC participants. This
seems to suggest that JROTC program has a positive influence on the educational
outcomes of the participants. The field research for high schools located in the
Washington DC and El Paso cities yield similar results.
Again, the CSIS study was of a descriptive nature and there was no attempt to
carry out any empirical analysis. The conclusion from the CSIS study was that JROTC
program benefits a significant segment of our nation’s youth and their communities based
53 Center for Strategic and International Studies, Junior Reserve Officers’ Training Corps: Contributions to America’s Communities. Final Report. Washington, DC, May 1999.
54 Ibid.
33
on their study of high schools located in three urban cities.55 The chosen urban cities,
however, might not be a representative sample of the population of high schools that host
JROTC units. The positive impact of the JROTC program could have been overstated as
the three urban cities chosen typically have students that come from the lower
socioeconomic stratum; therefore, the JROTC program has a higher positive intervention
impact for these students as compared to other school districts.
Typically, many research studies on the benefits of JROTC tend to espouse the
program’s benefits to “at risk” youths. The “at risk” label was originally created to
identify students at risk of dropping out of school. However, the “at risk” label has over
time, shifted to tag youths with potential capacity for violence, drug use, or crime.
Furthermore, educators have been pressured to identify “at risk” students at earlier ages;
beginning in elementary school before any evidence of substance abuse or criminal
activity exists. The perception of the JROTC as a program designed specifically for “at
risk” youth requires empirical evidence as the demographic shifts over the years could
make this label irrelevant today.
3. Benefits of JROTC Career Academy The Director of Special Projects and Research, in the Office of the Under
Secretary of Defense for Personnel and Readiness commissioned Elliot et al. (2000) to
conduct a study to determine the effects of the JROTC Career Academy programs on
student outcomes. 56 Career academies are schools within schools and the students
receive academic and vocational instruction with a specific career theme. The JROTC
Career Academy is therefore, a career academy model with the JROTC program of
instruction. Similar to high schools with JROTC programs, JROTC career academies
aim to foster academic and vocational skills, while giving students a sense of civic and
personal responsibility. As of year 2000, there were 36 JROTC Career Academies
operating in 33 cities in 23 states, with a total of approximately 3,800 students.
55 Ibid. 56 Marc Elliot, Lawrence Hanser and Curtis Gilroy, Evidence of Positive Student Outcomes in JROTC
Career Academies, RAND, Santa Monica, CA, 2000.

34
Elliot et al. (2000) collected data on almost 7,000 students in schools on the West
Coast and in the Midwest, including students in JROTC Career Academies, other career
academies, magnet schools and other programs. The study is a quasi-experimental
design with non-randomly chosen multiple comparison groups. The almost 7000
students included students in JROTC Career Academies, and students in three
comparison groups; (1) students in other academy or magnet programs in the target and
other schools; (2) students in regular JROTC programs; and (3) students not enrolled in
any special programs. A multiple regression model was used to test whether students in
the JROTC academies performed better than students in other programs. A series of
variables were used such as absenteeism, GPA, dropout rates and credits earned.
Of the whole sample, more than half of the students were Hispanic, nearly one
quarter were African American, 16 percent were white, and 49 percent were females. Of
the students who attended the JROTC academies, 77 percent were Hispanic, 11 percent
were African American, ten percent were white, and 48 percent were female. The
percentage of Hispanic participants is noticeably high and attributed to the influx of
Hispanics migrating to the west coast.
Elliot et al. (2000) was cautious to speculate on why students prefer the JROTC
Career Academies to other programs. They suggest that some students were attracted due
to the combination of the JROTC military-style instruction with the vocational
components associated with career academies. Some students may have enrolled because
they did not meet the performance levels required for other career academy and magnet
programs. In addition, many teachers and counselors focused on the military discipline
aspect of the JROTC Career Academies and assumed that the programs were appropriate
for student who needed extra discipline. Teachers and counselors thus referred students
with poor discipline, attendance and academic performance, including low grades and
few earned credits to academies.
The study did not find evidence that the JROTC Career Academy’s regimented
teaching style played a role in the programs’ success. However, they could not rule out
this influence from the finding that JROTC Career Academy students performed better
than students in the regular JROTC programs. In focus groups, students mentioned that

35
the major factor in their success was the nurturing environment provided by the academy.
The findings show that JROTC Career Academy students had a mean GPA 40 percent
higher than students in regular schools; lower rates of absenteeism, lower drop out rates,
and earned more credits than students at other career academies and magnet schools.57
Selection bias poses the question of validity for this study. The students who
participated in the career academies self selected into the programs or were chosen by
counselors for a variety of reasons. Selection effects make it difficult to discern whether
observed differences in performance are the result of pre-intervention differences in the
groups being compared or whether they are attributable to the effect of the treatment.58
Experimental designs, that include random assignment to conditions, eliminate this
problem by ensuring that groups are not systematically different prior to treatment. To
minimize potential bias from selection effects, Elliot et al. used propensity weighting.
This is a technique that attempts to weight the samples from each of several groups in
such a way that they resemble the sample in a particular group of interest.59
E. CONCLUSION
We have reviewed the pertinent studies on enlistment decisions, retention and
reenlistment and related JROTC studies. We found that JROTC participation, as an
explanatory variable in any empirical framework has not been carried out before. Major
studies on the benefits of the JROTC program to the military or the communities were
purely qualitative. The literature review points to an interesting aspect of this study - the
empirical examination of the impact of JROTC on the military is first of its kind. The
findings from our thesis will be of great interest to policy makers in DOD and JROTC
administrators in all branches of services.
57 Ibid. 58 Ibid. 59 Ibid.

36
THIS PAGE INTENTIONALLY LEFT BLANK

37
IV. DATA DESCRIPTION
A. INTRODUCTION
This chapter describes the two data sets – High School & Beyond (HSB) 1980
senior and sophomore cohort survey data and Defense Manpower Data Center (DMDC)
enlisted personnel cohort data – that will be used to determine the impact of JROTC
participation on military enlistment decision, retention and re-enlistment. The first
section will describe the HSB data set, followed by the DMDC data set.
B. HIGH SCHOOL & BEYOND DATA
The High School & Beyond (HS&B) study follows a representative sample of high
school sophomores and high school seniors in 1980, collecting information on high
school programs, family background, goals, values, post-high school plans and post-high
employment. The students in the 1980 sample were selected using a two-stage
probability strategy, with 1,122 schools selected in the first-stage and within each stratum
schools, 36 seniors and 36 sophomores were randomly selected.
In this stratified national sample, there were 14,825 sophomores and 11,995 seniors
selected from the 1,122 high schools sample. Certain groups of students and schools
were selected with probabilities higher than their occurrence in the population to allow
for meaningful study of the educational experience and impact on the students. These
special strata included the Hispanic strata that ensure sufficient numbers of Cuban, Puerto
Rican and Mexican students for separate analyses; Catholic schools stratum with high
proportions of black students; public alternative schools stratum; and private schools
stratum with high-achieving students.
Both senior and sophomore cohorts had follow-up surveys conducted in years
1982, 1984 and 1986. A fourth follow-up survey was conducted in 1992 for the
sophomore cohort. The base year 1980 sample and the first follow-up 1982 sample for
the sophomore cohort provide useful information on the sophomores’ intentions to enlist

38
and their subsequent decision to enlist. The 1984 and beyond sample sets shed more light
on the enlistment decisions and other post-high school plans of these high school
sophomores.
Similarly, the base year 1980 sample provides useful information on the high
school seniors’ intention to enlist as well as the decision to enlist. The follow-up surveys
in 1982, 1984 and 1986 for the senior cohorts, however, have a different emphasis
compared to the sophomore cohort. The surveys for the senior cohort are geared toward
finding out the values, opinions and voting behavior of the seniors after high school
whereas the surveys for the sophomore cohort tend to focus more on the employment and
schooling opportunities of the sophomores after high school.
The following paragraphs provide a description of the sophomore and senior
cohort data in the following order: overview of the data, JROTC participant data and
enlisted personnel data.
1. Overall Descriptive Statistics Table 4 provides the summary of the statistics of the 1980 HSB Sophomore and
Senior Cohort that are useful in the empirical analysis of the impact of the JROTC
participants on military enlistment. The main variables of interest are JROTC
participation of the high school students, military enlistments of the high school
sophomores and seniors after high school, their demographic profiles, family
background, educational aspirations, attitudes, military intentions and family income. The
region and urbanity of the high schools are also included in the data description to serve
as control for the external economic environment.

39
Table 4. Summary Statistics of the HSB 1980 Sophomore and Senior Cohort Sophomore Senior Variable Obs Mean Std. Dev. Min Max Obs Mean Std. Dev. Min Max JROTC 74125 0.02 0.13 0 1 47980 0.04 0.19 0 1 Enlisted 74125 0.02 0.14 0 1 47980 0.04 0.19 0 1 Demographics Black 74125 0.15 0.36 0 1 47980 0.27 0.44 0 1 White 74125 0.62 0.49 0 1 47980 0.48 0.50 0 1 Native 74125 0.02 0.15 0 1 47980 0.02 0.14 0 1 Asian 74125 0.03 0.18 0 1 47980 0.04 0.18 0 1 Hispanic 74125 0.16 0.37 0 1 47980 0.19 0.39 0 1 Male 74125 0.50 0.50 0 1 47980 0.35 0.48 0 1 Female 74125 0.50 0.50 0 1 47980 0.40 0.49 0 1 Single 74125 0.69 0.46 0 1 47980 0.73 0.44 0 1 Married 74125 0.14 0.35 0 1 47980 0.15 0.36 0 1 Family Background Father in military 74125 0.02 0.13 0 1 47980 0.02 0.13 0 1 Mother in military 74125 0.00 0.03 0 1 47980 0.00 0.04 0 1 Father is HS grad* 74125 0.24 0.43 0 1 47980 0.03 0.16 0 1 Father is College grad* 74125 0.18 0.38 0 1 47980 0.06 0.24 0 1 Mother is HS grad 74125 0.33 0.47 0 1 Mother is College grad 74125 0.12 0.32 0 1 Individuals’ Education Expectations Amostly 74125 0.10 0.30 0 1 47980 0.03 0.16 0 1 Bmostly 74125 0.17 0.38 0 1 47980 0.05 0.21 0 1 Cmostly 74125 0.11 0.31 0 1 47980 0.03 0.18 0 1 Highest educ expected - HS 74125 0.14 0.35 0 1 47980 0.10 0.30 0 1 Highest educ expected - Col 74125 0.16 0.37 0 1 47980 0.25 0.44 0 1 College plans in HS 74125 0.26 0.44 0 1 47980 0.32 0.47 0 1 Individuals’ Attitudes Positive attitude 74125 0.78 0.41 0 1 47980 0.82 0.39 0 1 Self-worth 74125 0.80 0.40 0 1 47980 0.83 0.38 0 1 Discipline 74125 0.11 0.32 0 1 47980 0.14 0.34 0 1 Suspension 74125 0.09 0.29 0 1 47980 0.11 0.32 0 1 Absenteeism 74125 0.28 0.45 0 1 47980 0.38 0.49 0 1 Individuals Military Intentions Military aspiration 74125 0.02 0.14 0 1 47980 0.01 0.10 0 1 Military interest in 1980 74125 0.04 0.19 0 1 47980 0.04 0.18 0 1
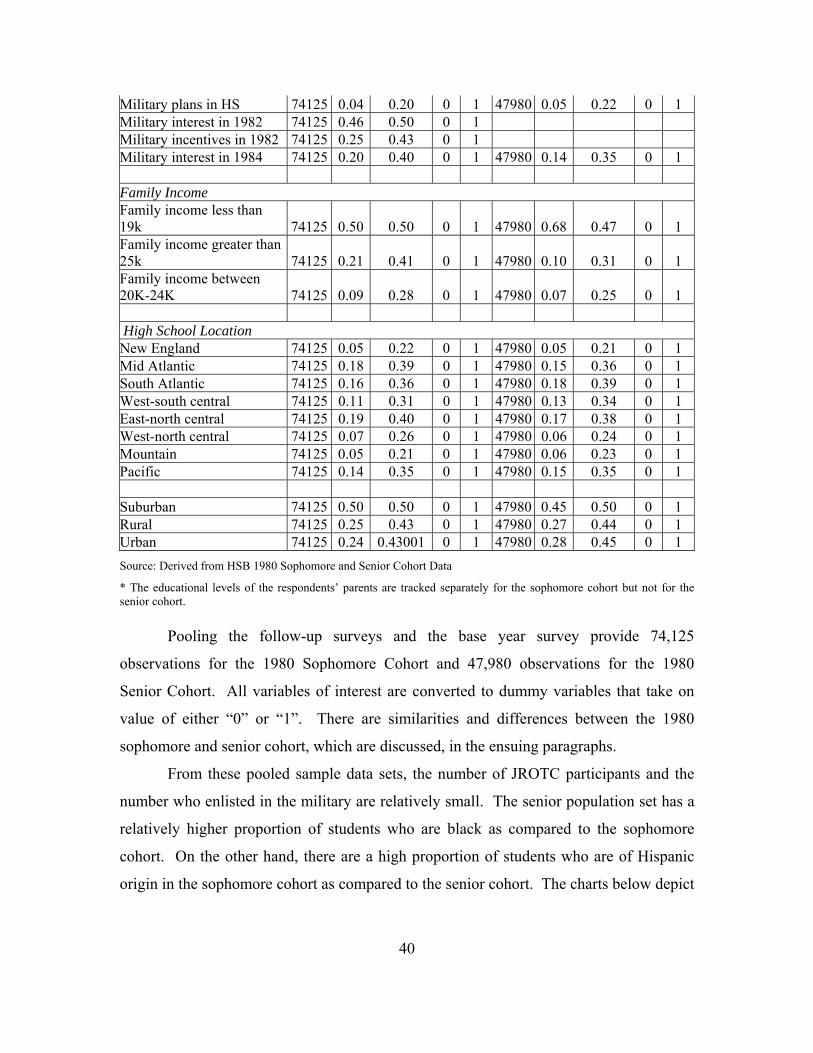
40
Military plans in HS 74125 0.04 0.20 0 1 47980 0.05 0.22 0 1 Military interest in 1982 74125 0.46 0.50 0 1 Military incentives in 1982 74125 0.25 0.43 0 1 Military interest in 1984 74125 0.20 0.40 0 1 47980 0.14 0.35 0 1 Family Income Family income less than 19k 74125 0.50 0.50 0 1 47980 0.68 0.47 0 1 Family income greater than 25k 74125 0.21 0.41 0 1 47980 0.10 0.31 0 1 Family income between 20K-24K 74125 0.09 0.28 0 1 47980 0.07 0.25 0 1 High School Location New England 74125 0.05 0.22 0 1 47980 0.05 0.21 0 1 Mid Atlantic 74125 0.18 0.39 0 1 47980 0.15 0.36 0 1 South Atlantic 74125 0.16 0.36 0 1 47980 0.18 0.39 0 1 West-south central 74125 0.11 0.31 0 1 47980 0.13 0.34 0 1 East-north central 74125 0.19 0.40 0 1 47980 0.17 0.38 0 1 West-north central 74125 0.07 0.26 0 1 47980 0.06 0.24 0 1 Mountain 74125 0.05 0.21 0 1 47980 0.06 0.23 0 1 Pacific 74125 0.14 0.35 0 1 47980 0.15 0.35 0 1 Suburban 74125 0.50 0.50 0 1 47980 0.45 0.50 0 1 Rural 74125 0.25 0.43 0 1 47980 0.27 0.44 0 1 Urban 74125 0.24 0.43001 0 1 47980 0.28 0.45 0 1 Source: Derived from HSB 1980 Sophomore and Senior Cohort Data
* The educational levels of the respondents’ parents are tracked separately for the sophomore cohort but not for the senior cohort.
Pooling the follow-up surveys and the base year survey provide 74,125
observations for the 1980 Sophomore Cohort and 47,980 observations for the 1980
Senior Cohort. All variables of interest are converted to dummy variables that take on
value of either “0” or “1”. There are similarities and differences between the 1980
sophomore and senior cohort, which are discussed, in the ensuing paragraphs.
From these pooled sample data sets, the number of JROTC participants and the
number who enlisted in the military are relatively small. The senior population set has a
relatively higher proportion of students who are black as compared to the sophomore
cohort. On the other hand, there are a high proportion of students who are of Hispanic
origin in the sophomore cohort as compared to the senior cohort. The charts below depict

41
the relative percentages of the composite race breakdown of the 1980 sophomore and
senior cohort.
Composite Race of the 1980 Sophomore Cohort
Native2%
Asian3% Black
15%
White63%
Hispanic16%
Missing1%
Composite Race of the 1980 Senior Cohort
Hispanic19%
Native2%
Black27%
White47%
Missing1%
Asian4%
In the sophomore cohort, a higher proportion of the educational attainment of the
students’ parents is high school graduates whereas in the senior cohort, there are a higher
proportion of parents who are college graduates. It is to be noted that while the
sophomore cohort survey tracks the education level of the students’ father and mother,
the senior cohort survey only has composite data on the educational level of the students’
parents. This might explain the disparity between the two data sets. Both the sophomore
and senior cohort data sets have approximately the same proportion of parents who are in
the military.
The participation rate in all waves for the survey for both the sophomore and
senior cohort is relatively high at above 90 percent for all years except for the last wave
that garnered approximately 85 percent response rate as described in Table 5 below.

42
Table 5. Participation Rate of the 1980 Sophomore and Senior Cohort Sophomore Senior
Year Participate Did not participate
Total Participation Rate (%)
Participate Did not participate
Total Participation Rate (%)
1980 13,749 1,076 14,825 92.74% 11,500 495 11,995 95.87% 1982 14,102 723 14,825 95.12% 11,227 768 11,995 93.60% 1984 13,682 1,143 14,825 92.29% 10,925 1,070 11,995 91.08% 1986 13,425 1,400 14,825 90.56% 10,536 1,459 11,995 87.84% 1992 12,640 2,185 14,825 85.26%
Source: Derived from HSB 1980 Sophomore and Senior Cohort Data
2. JROTC Participants Data Description From the HSB data, the number of sophomores who participated in the JROTC
Program was 333 and 251 in year 1980 and 1982 respectively. For the seniors, the
number of participants was 435 in 1980.
Table 6. JROTC Participation Rate of Survey Respondents
Sophomore Senior
JROTC Non-
JROTC Total
Participation Rate (%)
JROTCNon-
JROTC Total
Participation Rate (%)
1980 333 13,416 13,749 2.42% 435 11,065 11,500 3.78% 1982 251 13,851 14,102 1.78% - - - -
Source: Derived from HSB 1980 Sophomore and Senior Cohort Data
Table 7 below provides the summary of the statistics, which consists of the same
variables collected in Table 4, for the JROTC participants in year 1980 and 1982 for the
sophomore cohort and only year 1980 for the senior cohort. The average percentage of
all survey participants for each variable is also shown for purpose of comparison.
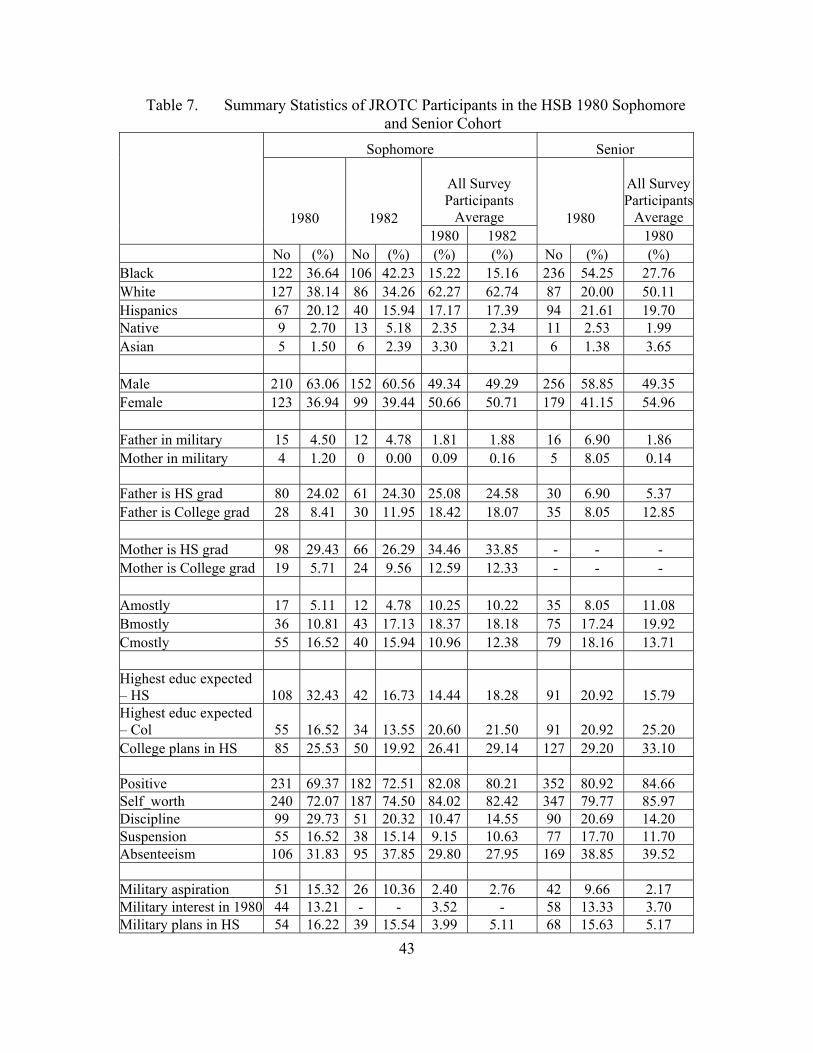
43
Table 7. Summary Statistics of JROTC Participants in the HSB 1980 Sophomore and Senior Cohort
Sophomore Senior
All Survey Participants
Average
All Survey Participants
Average
1980
1982 1980 1982
1980 1980
No (%) No (%) (%) (%) No (%) (%) Black 122 36.64 106 42.23 15.22 15.16 236 54.25 27.76 White 127 38.14 86 34.26 62.27 62.74 87 20.00 50.11 Hispanics 67 20.12 40 15.94 17.17 17.39 94 21.61 19.70 Native 9 2.70 13 5.18 2.35 2.34 11 2.53 1.99 Asian 5 1.50 6 2.39 3.30 3.21 6 1.38 3.65 Male 210 63.06 152 60.56 49.34 49.29 256 58.85 49.35 Female 123 36.94 99 39.44 50.66 50.71 179 41.15 54.96 Father in military 15 4.50 12 4.78 1.81 1.88 16 6.90 1.86 Mother in military 4 1.20 0 0.00 0.09 0.16 5 8.05 0.14 Father is HS grad 80 24.02 61 24.30 25.08 24.58 30 6.90 5.37 Father is College grad 28 8.41 30 11.95 18.42 18.07 35 8.05 12.85 Mother is HS grad 98 29.43 66 26.29 34.46 33.85 - - - Mother is College grad 19 5.71 24 9.56 12.59 12.33 - - - Amostly 17 5.11 12 4.78 10.25 10.22 35 8.05 11.08 Bmostly 36 10.81 43 17.13 18.37 18.18 75 17.24 19.92 Cmostly 55 16.52 40 15.94 10.96 12.38 79 18.16 13.71 Highest educ expected – HS 108 32.43 42 16.73 14.44 18.28 91 20.92 15.79 Highest educ expected – Col 55 16.52 34 13.55 20.60 21.50 91 20.92 25.20 College plans in HS 85 25.53 50 19.92 26.41 29.14 127 29.20 33.10 Positive 231 69.37 182 72.51 82.08 80.21 352 80.92 84.66 Self_worth 240 72.07 187 74.50 84.02 82.42 347 79.77 85.97 Discipline 99 29.73 51 20.32 10.47 14.55 90 20.69 14.20 Suspension 55 16.52 38 15.14 9.15 10.63 77 17.70 11.70 Absenteeism 106 31.83 95 37.85 29.80 27.95 169 38.85 39.52 Military aspiration 51 15.32 26 10.36 2.40 2.76 42 9.66 2.17 Military interest in 1980 44 13.21 - - 3.52 - 58 13.33 3.70 Military plans in HS 54 16.22 39 15.54 3.99 5.11 68 15.63 5.17
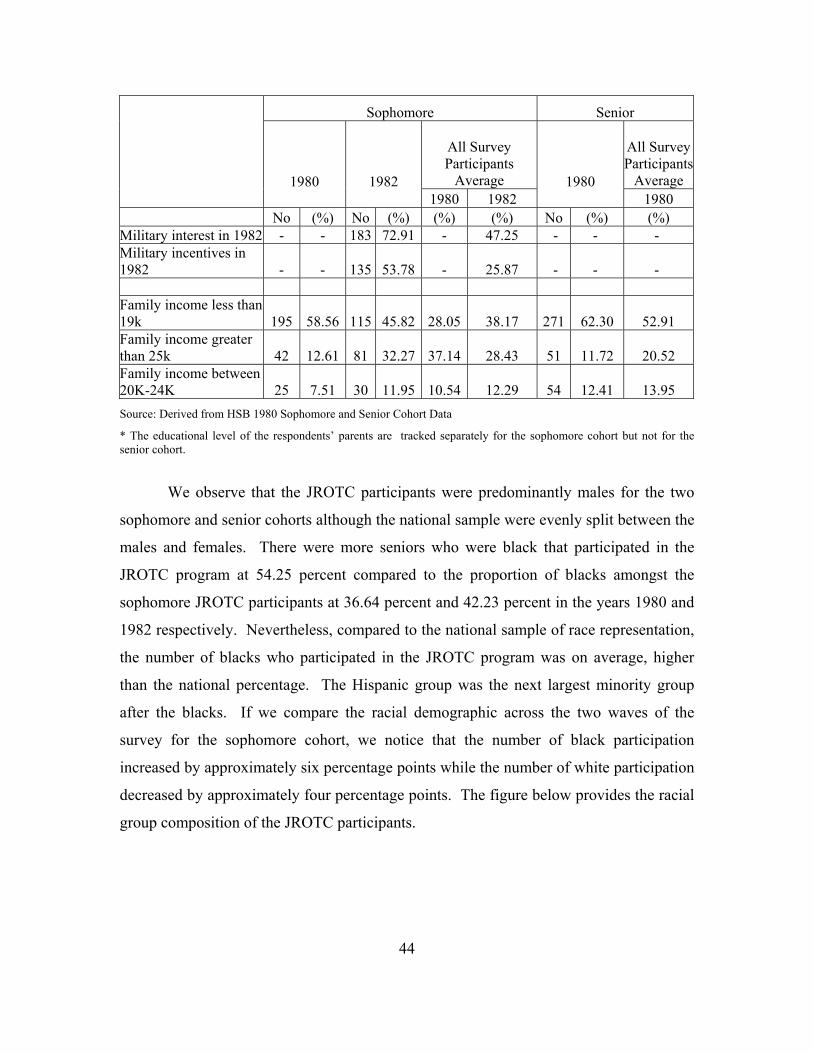
44
Sophomore Senior
All Survey Participants
Average
All Survey Participants
Average
1980
1982 1980 1982
1980 1980
No (%) No (%) (%) (%) No (%) (%) Military interest in 1982 - - 183 72.91 - 47.25 - - - Military incentives in 1982 - - 135 53.78 - 25.87 - - - Family income less than 19k 195 58.56 115 45.82 28.05 38.17 271 62.30 52.91 Family income greater than 25k 42 12.61 81 32.27 37.14 28.43 51 11.72 20.52 Family income between 20K-24K 25 7.51 30 11.95 10.54 12.29 54 12.41 13.95 Source: Derived from HSB 1980 Sophomore and Senior Cohort Data
* The educational level of the respondents’ parents are tracked separately for the sophomore cohort but not for the senior cohort.
We observe that the JROTC participants were predominantly males for the two
sophomore and senior cohorts although the national sample were evenly split between the
males and females. There were more seniors who were black that participated in the
JROTC program at 54.25 percent compared to the proportion of blacks amongst the
sophomore JROTC participants at 36.64 percent and 42.23 percent in the years 1980 and
1982 respectively. Nevertheless, compared to the national sample of race representation,
the number of blacks who participated in the JROTC program was on average, higher
than the national percentage. The Hispanic group was the next largest minority group
after the blacks. If we compare the racial demographic across the two waves of the
survey for the sophomore cohort, we notice that the number of black participation
increased by approximately six percentage points while the number of white participation
decreased by approximately four percentage points. The figure below provides the racial
group composition of the JROTC participants.
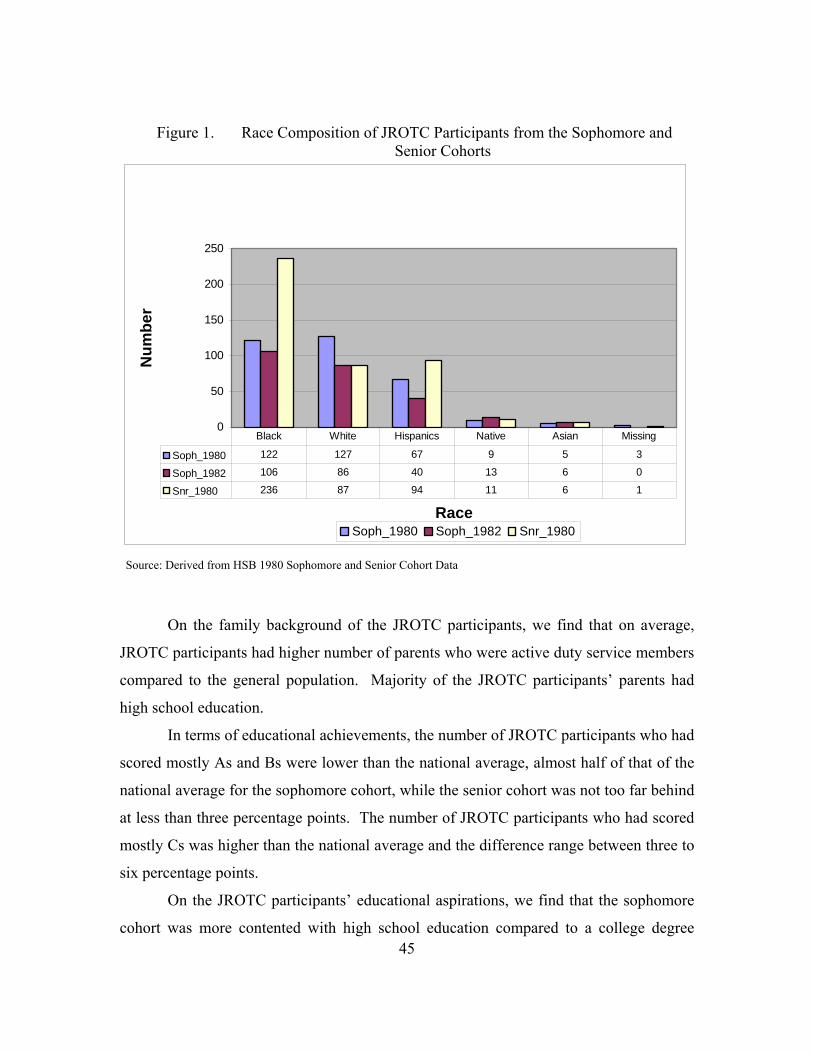
45
Figure 1. Race Composition of JROTC Participants from the Sophomore and Senior Cohorts
0
50
100
150
200
250
Race
Num
ber
Soph_1980 Soph_1982 Snr_1980
Soph_1980 122 127 67 9 5 3
Soph_1982 106 86 40 13 6 0
Snr_1980 236 87 94 11 6 1
Black White Hispanics Native Asian Missing
Source: Derived from HSB 1980 Sophomore and Senior Cohort Data
On the family background of the JROTC participants, we find that on average,
JROTC participants had higher number of parents who were active duty service members
compared to the general population. Majority of the JROTC participants’ parents had
high school education.
In terms of educational achievements, the number of JROTC participants who had
scored mostly As and Bs were lower than the national average, almost half of that of the
national average for the sophomore cohort, while the senior cohort was not too far behind
at less than three percentage points. The number of JROTC participants who had scored
mostly Cs was higher than the national average and the difference range between three to
six percentage points.
On the JROTC participants’ educational aspirations, we find that the sophomore
cohort was more contented with high school education compared to a college degree

46
compared to the senior cohort, which was split evenly. Nevertheless, approximately 20
to 30 percent of the JROTC participants in both cohorts had thought about college while
they were in high school.
The JROTC participants for both sophomores and seniors were not any less
positive about themselves compared to the average population. The average population
who felt positive about themselves or had self-worth ranged from 82 percent to 85
percent. The JROTC participants who thought so about themselves ranged from 69
percent to 80 percent.
On disciplinary situations in schools like discipline problems, suspension and
absenteeism from school, there appear to be a higher incidence amongst JROTC
participants compared to the population average. While approximately one fifth of the
population had ever had disciplinary problems, about one quarter of the JROTC
participants had the same problem. For suspension, average ten percent of the population
admitted to being suspended, while the average response rate for the JROTC participants’
was16 percent. Absenteeism occurs at a much higher rate with approximately one-third
of the population admitting to cutting class. The response rate of the JROTC participants
admitting to cutting class was on average similar to the population percentage.
The expressed interest of the JROTC participants with regard to military lifestyle
and intention to enlist was higher than the population average. Nine to 15 percent of the
JROTC participants amongst the sophomores and seniors had listed military enlistment as
their career goals compared to the population, which was approximately two percent. As
the 1980 sophomore cohort became seniors in 1982, the interest in military increased
tremendously from 13 percent to 72 percent. This behavior was not exhibited amongst
the 1980 senior cohort, where only 13 percent of them indicated interest in the military.
The last variable of interest is the economic background of the JROTC
participants. The 1980 survey separated the family income question by one-sevenths
while the 1982 survey used one-fifths. This thesis decided to have the cut-off for the
lower income group at 19 thousand or less per annum, the middle income group that had
annual family income that range from 20 to 24 thousand, and the high income group with
an annual family income of 25 thousand and above. Almost half of the JROTC
47
participants fall into the lower income group while slightly less than a third of the
sophomore population falls into this category. For the senior cohort, almost half of the
population as well as the JROTC participants fall into this category. As expected, the
high-income group is the minority group here with an average of 12 percent of the
population found in this category while for the JROTC participants; it ranges from seven
percent to 12 percent.
This section provides interesting insights to the demographics, educational
expectations, family background and socio-economic background of the JROTC
participants. We have read articles that had commented that the JROTC program is
designed for “at-risk” youths. This seems to conjecture that JROTC participants as being
from the lower socio-economic strata, or did not excel academically and were problem
kids in school. From the information gathered from the 1980 HSB sophomore and
senior cohorts, we did not observe JROTC participants as predominantly composed of
any particular minority groups. We also did not observe that the JROTC participants
performed any less satisfactorily compared to the average population and the family
income distribution of the JROTC participants was not overly skewed toward the lower
income group when compared to the population sample. However, our sample size for
JROTC is small in the first place. We want to see if similar observations are made with
the DMDC data.
3. Military Enlistment Intentions and Decisions Data Description This section looks at the enlistment decisions made by the sophomores and
seniors in the 1980 HSB survey. Table 8 looks at the overall enlistment rate for the
population in both sophomore and senior cohort. We note that the average enlistment
rate was less than five percent and tapers off at the last wave of the survey. Table 9 and
Table 10 compared the enlistment rates of the sophomores and seniors who had
participated in the JROTC program during high school to those who had not. The
enlistment rate of the non-JROTC participants was similar to the population. On the
other hand, the enlistment rate of the JROTC participants was almost twice that of the
population. This seems to suggest that JROTC participants were more positively inclined
to the military compared to the non-JROTC participants.

48
Table 8. Enlistment Rate of 1980 HSB Sophomore and Senior Cohort Sophomore Senior
Enlisted Did not enlist Total
% Enlisted Enlisted
Did not enlist Total
% Enlisted
1980 - - - - 395 11,105 11,500 3.43% 1982 369 13,733 14,102 2.62% 447 10,780 11,227 3.98% 1984 527 13,155 13,682 3.85% 495 10,430 10,925 4.53% 1986 555 12,870 13,425 4.13% 392 10,144 10,536 3.72% 1992 98 12,542 12,640 0.78% - - - -
Source: Derived from HSB 1980 Sophomore and Senior Cohort Data
Table 9. Enlistment Rate of 1980 HSB Sophomore Cohort who were JROTC
Participants Non-JROTC Participants JROTC Participants
Enlisted Did not enlist Total % Enlisted Enlisted
Did not enlist Total
% Enlisted
1982 342 13,509 13,851 2.47% 27 224 251 10.76% 1984 505 12,941 13,446 3.76% 22 214 236 9.32% 1986 535 12,666 13,201 4.05% 20 204 224 8.93% 1992 93 12,344 12,437 0.75% 5 198 203 2.46%
Source: Derived from HSB 1980 Sophomore and Senior Cohort Data
Table 10. Enlistment Rate of 1980 Senior Cohort who were JROTC Participants
Non-JROTC Participants JROTC Participants
Enlisted Did not enlist Total % Enlisted Enlisted
Did not enlist Total
% Enlisted
1980 343 10,722 11,065 3.10% 52 383 435 11.95% 1982 405 10,424 10,829 3.74% 42 356 398 10.55% 1984 454 10,099 10,553 4.30% 41 331 372 11.02% 1986 367 9,811 10,178 3.61% 25 333 358 6.98%
Source: Derived from HSB 1980 Sophomore and Senior Cohort Data
C. DMDC COHORT DATA
The Defense Manpower Data Center (DMDC) located in Monterey, California, is
an excellent source of information for the purpose of our thesis. We obtained the enlisted
cohort files from DMDC and they included all branches of service - Army, Navy, Air
Force, and Marine Corp.
The definition of a cohort means all personnel who entered the military in a given
fiscal year (FY), which in this case runs from October through September. The cohorts

49
obtained were for enlisted personnel who entered service from FY1980 to FY2000.
These cohort files were matched with corresponding active duty inventory files at 3-year
intervals for the tracking of changes in pay grade and rank.
The main identifier of enlistees who were JROTC graduates in the cohort files lies
in the variable “Youth Program”. This field in the data set provides information on the
youth programs that the enlistees had undertaken prior to enlistment, including JROTC
participation in all services for three or four years. Participation in JROTC for two years
or less was not captured. One possible reason for tracking only those who had
participated for three or more years was that they are eligible for accelerated
advancement upon enlisting in the service solely based on their participation in the
JROTC program.
The 19 cohort files obtained from DMDC each contain sixty-five variables and
the ensuing paragraphs provide the description of the pertinent variables that will be
useful for the purpose of this thesis. In our data description, we excluded the Navy
reserve and Coast Guard records that had been provided to us by DMDC. The number of
Navy Reserve records is small and inconsequential. The Coast Guard records on active
duty inventory and loss data only began from December 1988 and moreover, there was
no Coast Guard JROTC program. Therefore, the Coast Guard recruits are excluded. We
were unable to read the information from the FY1987 cohort file as it was corrupted and
hence, FY1987 was also excluded from the data description. Lastly, those enlisted
personnel who were not qualified for reenlistment were also excluded from the sample
population.
1. Military Enlistment by JROTC participants from FY80- FY00. This section will characterize the DMDC data using frequency distributions and
descriptive analysis. We will examine the number of accessions, recruiting trends and
the number of personnel who participated in JROTC over a nineteen- year period. The
numbers of accessions in FY80-FY00 are 4,992,962. Cohorts are tracked longitudinally
and included in the accession files is the Inter-Service Separation Codes (ISCs), which
describes why a recruit was discharged from the military.

50
Table 11 indicates the total number of recruits for each fiscal year that enlisted in
all services and the total number of JROTC participants.
Table 11. Recruits With/Without JROTC FY Entry All Recruits JROTC Participants Percentage of cohort
1980 380,403 5542 1.45 1981 352,816 5043 1.42 1982 323,823 4849 1.49 1983 320,499 5208 1.62 1984 325,371 7010 2.15 1985 311,992 6611 2.11 1986 324,516 6570 2.02 1988 272,976 6919 2.53 1989 285,762 7002 2.45 1990 230,313 6485 2.81 1991 195,361 5849 2.99 1992 192,538 6802 3.53 1993 198,336 6620 3.33 1994 169,041 6049 3.57 1995 164,812 6503 3.94 1996 179,200 7258 4.05 1997 196,211 8237 4.19 1998 185,940 8504 4.57 1999 191,257 7750 4.05 2000 191,795 7274 3.79
TOTAL 4,992,962 132,085 2.64 Source: Derived from Defense Manpower Data Center Cohort Files
It is interesting to note that as the number of recruits continues to decline each
fiscal year, the number of JROTC participants’ increases on average. This can be
attributed to the military drawdown; hence, the proportion of recruits that are JROTC
participants appears to increase. In the early eighties, the average percentage of JROTC
participants that enlisted in the services was two percent. In the early nineties,
approximately three percent of new recruits were JROTC participants. This small
proportion is one measure that indicates the number of JROTC participants within the
military is increasing at a relatively constant rate. In addition, increasing further are the
appropriations from the Office of the Under Secretary of Defense and President’s Budget
for JROTC. As noted earlier in Table 2.1, a steady increase in funding by each service
has been approved to augment potential growth and expansion of the JROTC program.

51
The American Friends Service Committee (AFSC), which is an organization that
promotes social justice and peace programs throughout the world are strong proponents
against JROTC. AFSC reports in a 1994 study that 45 percent of all cadets who complete
JROTC enter some branch of service60. The data encompassing the past nineteen years
does not support that claim. Similar claims have been made by other organizations;
hence, the importance of empirical analysis on the effects of JROTC on recruitment,
retention and attrition.
2. Distribution of Recruits with JROTC Participation by Service We would like to further explore the distribution of recruits by service. Table 12
details the number of JROTC participants that enlisted by service. The Army has
traditionally had higher participation rates than the other services respectively. In
addition, the Army JROTC program is allocated the largest percentage of funding from
the Department of Defense (DoD) Operation and Maintenance (O&M) appropriation.
60 American Friends Service Committee, “ Making Soldiers in the Public Schools”, 1994.
The AFSC is founded by Quakers to provide conscientious objectors with an opportunity to aid civilian war victims. AFSC’s work is based on the Quaker belief in the worth of every person and faith in the power of peace to overcome violence and injustice. AFSC received over $250k in government grants in FY02.
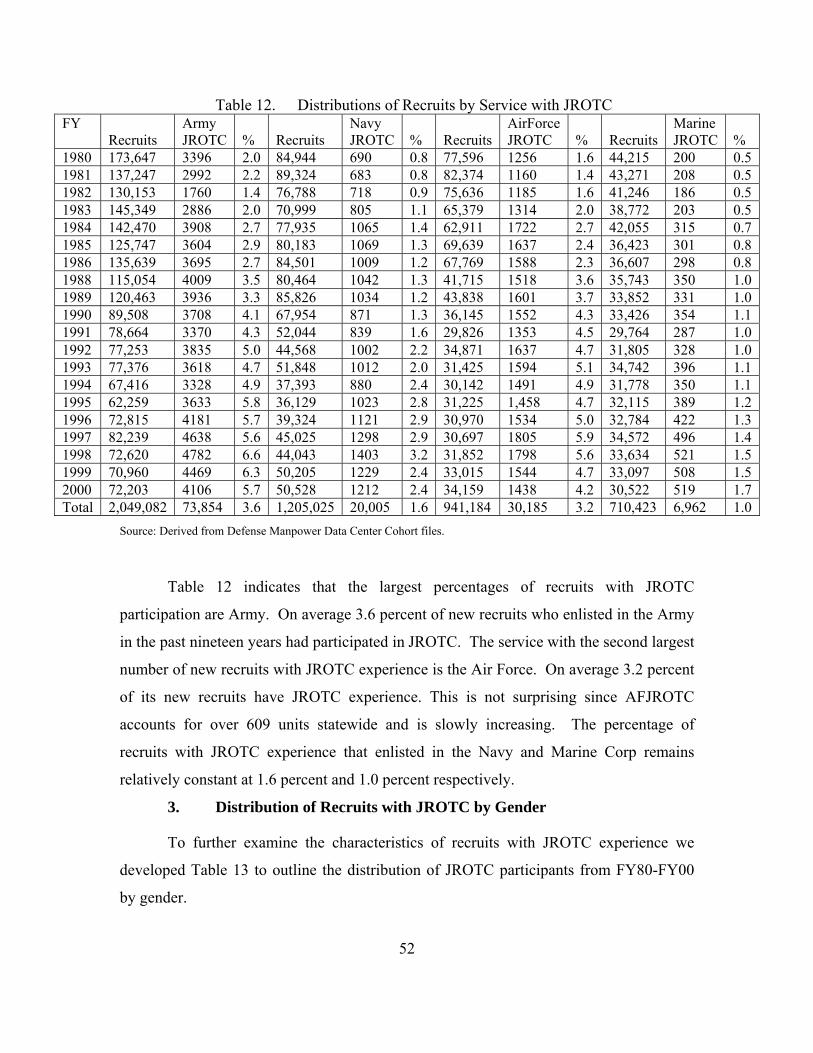
52
Table 12. Distributions of Recruits by Service with JROTC FY
Recruits Army JROTC
%
Recruits
Navy JROTC
%
Recruits
AirForce JROTC
%
Recruits
Marine JROTC
%
1980 173,647 3396 2.0 84,944 690 0.8 77,596 1256 1.6 44,215 200 0.5 1981 137,247 2992 2.2 89,324 683 0.8 82,374 1160 1.4 43,271 208 0.5 1982 130,153 1760 1.4 76,788 718 0.9 75,636 1185 1.6 41,246 186 0.5 1983 145,349 2886 2.0 70,999 805 1.1 65,379 1314 2.0 38,772 203 0.5 1984 142,470 3908 2.7 77,935 1065 1.4 62,911 1722 2.7 42,055 315 0.7 1985 125,747 3604 2.9 80,183 1069 1.3 69,639 1637 2.4 36,423 301 0.8 1986 135,639 3695 2.7 84,501 1009 1.2 67,769 1588 2.3 36,607 298 0.8 1988 115,054 4009 3.5 80,464 1042 1.3 41,715 1518 3.6 35,743 350 1.0 1989 120,463 3936 3.3 85,826 1034 1.2 43,838 1601 3.7 33,852 331 1.0 1990 89,508 3708 4.1 67,954 871 1.3 36,145 1552 4.3 33,426 354 1.1 1991 78,664 3370 4.3 52,044 839 1.6 29,826 1353 4.5 29,764 287 1.0 1992 77,253 3835 5.0 44,568 1002 2.2 34,871 1637 4.7 31,805 328 1.0 1993 77,376 3618 4.7 51,848 1012 2.0 31,425 1594 5.1 34,742 396 1.1 1994 67,416 3328 4.9 37,393 880 2.4 30,142 1491 4.9 31,778 350 1.1 1995 62,259 3633 5.8 36,129 1023 2.8 31,225 1,458 4.7 32,115 389 1.2 1996 72,815 4181 5.7 39,324 1121 2.9 30,970 1534 5.0 32,784 422 1.3 1997 82,239 4638 5.6 45,025 1298 2.9 30,697 1805 5.9 34,572 496 1.4 1998 72,620 4782 6.6 44,043 1403 3.2 31,852 1798 5.6 33,634 521 1.5 1999 70,960 4469 6.3 50,205 1229 2.4 33,015 1544 4.7 33,097 508 1.5 2000 72,203 4106 5.7 50,528 1212 2.4 34,159 1438 4.2 30,522 519 1.7 Total 2,049,082 73,854 3.6 1,205,025 20,005 1.6 941,184 30,185 3.2 710,423 6,962 1.0
Source: Derived from Defense Manpower Data Center Cohort files.
Table 12 indicates that the largest percentages of recruits with JROTC
participation are Army. On average 3.6 percent of new recruits who enlisted in the Army
in the past nineteen years had participated in JROTC. The service with the second largest
number of new recruits with JROTC experience is the Air Force. On average 3.2 percent
of its new recruits have JROTC experience. This is not surprising since AFJROTC
accounts for over 609 units statewide and is slowly increasing. The percentage of
recruits with JROTC experience that enlisted in the Navy and Marine Corp remains
relatively constant at 1.6 percent and 1.0 percent respectively.
3. Distribution of Recruits with JROTC by Gender
To further examine the characteristics of recruits with JROTC experience we
developed Table 13 to outline the distribution of JROTC participants from FY80-FY00
by gender.
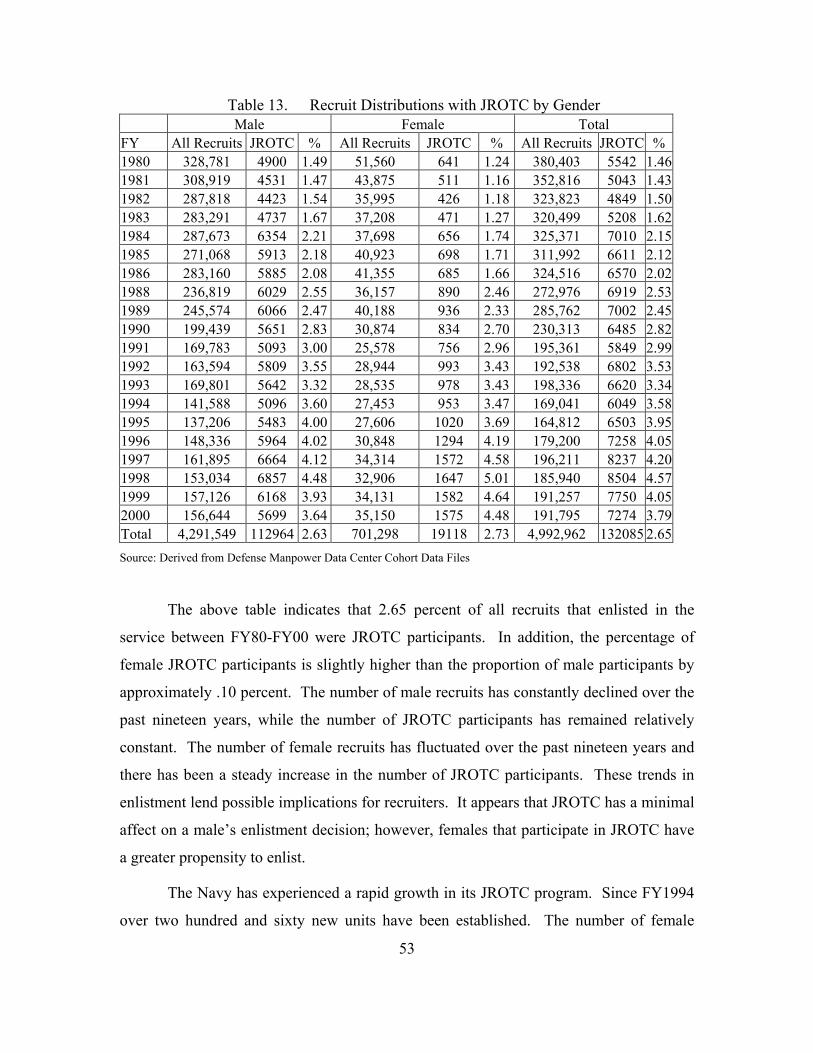
53
Table 13. Recruit Distributions with JROTC by Gender Male Female Total FY All Recruits JROTC % All Recruits JROTC % All Recruits JROTC % 1980 328,781 4900 1.49 51,560 641 1.24 380,403 5542 1.461981 308,919 4531 1.47 43,875 511 1.16 352,816 5043 1.431982 287,818 4423 1.54 35,995 426 1.18 323,823 4849 1.501983 283,291 4737 1.67 37,208 471 1.27 320,499 5208 1.621984 287,673 6354 2.21 37,698 656 1.74 325,371 7010 2.151985 271,068 5913 2.18 40,923 698 1.71 311,992 6611 2.121986 283,160 5885 2.08 41,355 685 1.66 324,516 6570 2.021988 236,819 6029 2.55 36,157 890 2.46 272,976 6919 2.531989 245,574 6066 2.47 40,188 936 2.33 285,762 7002 2.451990 199,439 5651 2.83 30,874 834 2.70 230,313 6485 2.821991 169,783 5093 3.00 25,578 756 2.96 195,361 5849 2.991992 163,594 5809 3.55 28,944 993 3.43 192,538 6802 3.531993 169,801 5642 3.32 28,535 978 3.43 198,336 6620 3.341994 141,588 5096 3.60 27,453 953 3.47 169,041 6049 3.581995 137,206 5483 4.00 27,606 1020 3.69 164,812 6503 3.951996 148,336 5964 4.02 30,848 1294 4.19 179,200 7258 4.051997 161,895 6664 4.12 34,314 1572 4.58 196,211 8237 4.201998 153,034 6857 4.48 32,906 1647 5.01 185,940 8504 4.571999 157,126 6168 3.93 34,131 1582 4.64 191,257 7750 4.052000 156,644 5699 3.64 35,150 1575 4.48 191,795 7274 3.79Total 4,291,549 112964 2.63 701,298 19118 2.73 4,992,962 132085 2.65Source: Derived from Defense Manpower Data Center Cohort Data Files
The above table indicates that 2.65 percent of all recruits that enlisted in the
service between FY80-FY00 were JROTC participants. In addition, the percentage of
female JROTC participants is slightly higher than the proportion of male participants by
approximately .10 percent. The number of male recruits has constantly declined over the
past nineteen years, while the number of JROTC participants has remained relatively
constant. The number of female recruits has fluctuated over the past nineteen years and
there has been a steady increase in the number of JROTC participants. These trends in
enlistment lend possible implications for recruiters. It appears that JROTC has a minimal
affect on a male’s enlistment decision; however, females that participate in JROTC have
a greater propensity to enlist.
The Navy has experienced a rapid growth in its JROTC program. Since FY1994
over two hundred and sixty new units have been established. The number of female

54
cadets has increased significantly as well as the number of minorities enrolled. Table 14
is provided to further explore the distribution of cadets by gender enrolled in NJROTC
from School Year (SY) 94 – SY95.
Table 14. NJROTC Enrollment History SY94- SY04
SY 94-95 95-96 96-97 97-98 98-99 99-00 00-01 01-02 02-03 03-04 No. of Units 359 397 435 435 434 434 490 553 584 623 Enrollment Males 26,414 30,333 33,966 35,533 36,421 36,827 40,687 44,149 46,906 49,059 Females 18,353 22,441 25,791 27,191 26,974 27,421 26,826 29,034 33,024 37,010Total Cadets 44,767 52,774 59,757 62,724 63,395 64,248 67,513 73,183 79,930 86,069 Black 14,080 16,118 17,585 17,276 17,751 20,605 23,418 24,882 27,176 27,147 Indian 305 432 320 365 633 537 672 732 799 889 Oriental 1,280 1,582 1,958 2,268 2,536 2519 2,732 2,927 3,197 4,238 Hispanic 5,884 7,268 8,805 9,613 9,509 9772 11,136 16,100 17,584 19,656Other 4409 2,354 2,195 2,397 1,822 Minorities 21,549 25,400 28,668 29,522 30,429 37,842 40,312 46,836 51,153 53,752 NS-1 26,549 30,928 34,803 34,303 34,864 35,392 41,695 46,364 48,366 48,336 NS-2 11,536 12,311 14,820 16,222 16,909 17,611 16,328 18,033 20,619 22,619 NS-3 4,356 6,742 6,915 8,646 9,375 9,676 9,814 9,853 10,241 10,241 NS-4 2,523 2,849 3,396 4,038 4,848 5,432 5,355 5,399 5,456 5,456 Total NS Enroll 44,964 52,830 59,934 63,209 65,996 68,111 73,192 79,649 84,682 86,652
Source: Navy Education and Training Center (NETC), NJROTC Ops, Citizen Development
As indicated by Table 14 the number of females enrolled in NJROTC increased
proportionally from SY94 – SY04. Another interesting trend is the number of minorities
that participated in the program. From SY 99 – SY 04 half of the cadets enrolled in
NJROTC are minorities, the majority were blacks. This is an interesting parallel since
data indicates that on average the majority of recruits with JROTC are minorities. The
expansion of JROTC has left many larger cities underrepresented; hence, a change in the
composition of the units. To further explore the distribution of JROTC participants by
race see Table 15.
4. Distribution of Recruits with JROTC by Race
To further explore the minority representation of JROTC we have compiled from
the DMDC data a table that represents the minority representation for all services from

55
FY80 – FY00. Table 15, which details the distribution of recruits by race, indicates that
the majority of JROTC participants for the past nineteen years have been minorities,
more specifically blacks. This can partially be attributed to the locations of JROTC units
and the expansion of these units in urban areas. This also amplifies the under
representation of whites in the JROTC program. It is clearly evident that blacks who
participate in JROTC are more likely to enlist in the military then whites. It is not
possible from the data to ascertain the reasons why blacks are so highly represented in the
JROTC program. Previous research has not investigated the possible correlations
between JROTC participation and propensity to enlist. We would like to further explore
this phenomenon through empirical analysis.
Table 15. Distribution of JROTC Participants by Race. White Black Hispanic Other
FY All Recruits JROTC %
All Recruits JROTC %
All Recruits JROTC %
All Recruits JROTC %
1980 278,849 3261 1.17 84,016 2077 2.47 17,428 203 1.16 110 1 0.911981 269,586 2990 1.11 68,018 1867 2.74 15,154 182 1.20 58 4 6.901982 249,416 2961 1.19 60,931 1753 2.88 13,385 134 1.00 91 1 1.101983 249,895 3189 1.28 57,299 1850 3.23 13,190 168 1.27 115 1 0.871984 251,141 3933 1.57 59,071 2828 4.79 15,139 248 1.64 20 1 5.001985 238,931 3785 1.58 57,499 2540 4.42 15,542 285 1.83 20 1 5.001986 246,191 3694 1.50 61,488 2587 4.21 16,814 289 1.72 23 0 0.001988 202,714 3740 1.84 55,974 2848 5.09 14,211 331 2.33 77 0 0.001989 209,483 3795 1.81 60,431 2881 4.77 15,792 325 2.06 56 1 1.791990 169,967 3564 2.10 46,996 2620 5.57 13,288 301 2.27 62 0 0.001991 152,033 3540 2.33 31,611 2002 6.33 11,649 307 2.64 68 0 0.001992 149,309 4086 2.74 31,497 2426 7.70 11,656 289 2.48 76 1 1.321993 153,755 3975 2.59 32,864 2336 7.11 11,585 300 2.59 132 9 6.821994 128,686 3708 2.88 29,542 1979 6.70 10,742 358 3.33 71 4 5.631995 122,568 3991 3.26 29,623 2101 7.09 12,541 406 3.24 80 5 6.251996 129,403 4247 3.28 33,811 2522 7.46 15,882 482 3.03 104 7 6.731997 137,294 4701 3.42 38,718 2897 7.48 19,925 628 3.15 274 11 4.011998 129,032 4857 3.76 36,148 2883 7.98 20,510 754 3.68 250 10 4.001999 131,793 4483 3.40 37,806 2589 6.85 21,561 674 3.13 97 4 4.122000 133,868 4272 3.19 38,356 2414 6.29 19,496 585 3.00 75 3 4.00Total 3,733,914 76772 2.06 951,699 48000 5.04 305,490 7249 2.37 1859 64 3.44Source: Derived from Defense Manpower Data Center Cohort Files
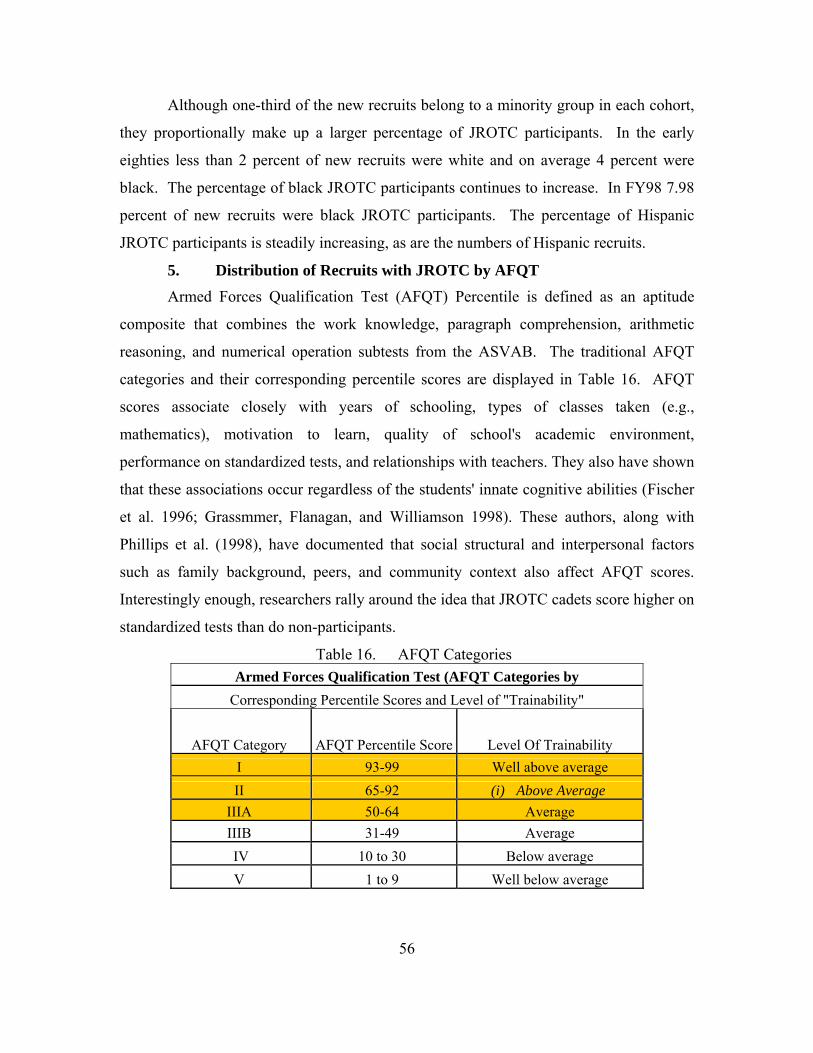
56
Although one-third of the new recruits belong to a minority group in each cohort,
they proportionally make up a larger percentage of JROTC participants. In the early
eighties less than 2 percent of new recruits were white and on average 4 percent were
black. The percentage of black JROTC participants continues to increase. In FY98 7.98
percent of new recruits were black JROTC participants. The percentage of Hispanic
JROTC participants is steadily increasing, as are the numbers of Hispanic recruits.
5. Distribution of Recruits with JROTC by AFQT Armed Forces Qualification Test (AFQT) Percentile is defined as an aptitude
composite that combines the work knowledge, paragraph comprehension, arithmetic
reasoning, and numerical operation subtests from the ASVAB. The traditional AFQT
categories and their corresponding percentile scores are displayed in Table 16. AFQT
scores associate closely with years of schooling, types of classes taken (e.g.,
mathematics), motivation to learn, quality of school's academic environment,
performance on standardized tests, and relationships with teachers. They also have shown
that these associations occur regardless of the students' innate cognitive abilities (Fischer
et al. 1996; Grassmmer, Flanagan, and Williamson 1998). These authors, along with
Phillips et al. (1998), have documented that social structural and interpersonal factors
such as family background, peers, and community context also affect AFQT scores.
Interestingly enough, researchers rally around the idea that JROTC cadets score higher on
standardized tests than do non-participants.
Table 16. AFQT Categories Armed Forces Qualification Test (AFQT Categories by
Corresponding Percentile Scores and Level of "Trainability"
AFQT Category AFQT Percentile Score Level Of Trainability I 93-99 Well above average II 65-92 (i) Above Average
IIIA 50-64 Average IIIB 31-49 Average IV 10 to 30 Below average V 1 to 9 Well below average

57
Table 17 indicates there was a steady increase in the number of recruits that were
classified in category I-IIIA. In the eighties on average 1.4 percent of the force recruited
with JROTC experience fell into AFQT category I-IIIA and a proportionally large
number (2.2 percent) fell in category IV. By 1990, the number of recruits with JROTC
doubled; however, the percentage of recruits that fell in category I-IIIA remained
relatively constant. We observe a larger percentage of recruits fell into category III-B.
Most surprising is the number of recruits with JROTC that enlisted in the service from
FY95 – FY00 that fell in category IV. An assumption would be that recruits with JROTC
experience would score higher on the ASVAB due to the critical skills and cognitive
abilities derived from the JROTC program. The data indicates that from FY80 – FY00
3,085,967 category I-IIIA recruits enlisted, and of those 77,666 or 2.52 percent had
JROTC experience.
Table 17. Recruit Distribution With JROTC by AFQT Category
Source: Derived from Defense Manpower Data Center Cohort Files
I-IIIA III-B IV FY All Recruits JROTC % All Recruits JROTC % All Recruits JROTC %
1980 143,524 1946 1.36 99,225 1392 1.40 125,134 2125 1.70 1981 163,181 1983 1.22 104,355 1447 1.39 70,007 1527 2.18 1982 164,624 3738 2.27 98,758 1654 1.67 45,167 1023 2.26 1983 181,127 2499 1.38 97,744 1951 2.00 31,317 695 2.22 1984 187,111 3199 1.71 102,480 2817 2.75 29,176 942 3.23 1985 193,008 3431 1.78 92,348 2517 2.73 19,313 615 3.18 1986 209,358 3532 1.69 96,650 2673 2.77 11,420 335 2.93 1988 184,238 4010 2.18 73,970 2524 3.41 10,001 351 3.51 1989 186,508 4060 2.18 77,593 2434 3.14 14,620 470 3.21 1990 158,637 4053 2.55 62,728 2227 3.55 5,673 165 2.91 1991 145,070 4126 2.84 47,338 1658 3.50 1,034 48 4.64 1992 147,380 4893 3.32 43,800 1871 4.27 376 14 3.72 1993 142,671 4396 3.08 52,936 2131 4.03 1,637 68 4.15 1994 123,411 4180 3.39 43,242 1795 4.15 1,208 54 4.47 1995 118,316 4327 3.66 43,389 2099 4.84 1,138 51 4.48 1996 125,057 4481 3.58 50,108 2664 5.32 1,343 76 5.66 1997 135,704 5056 3.73 57,185 3036 5.31 1,915 118 6.16 1998 126,699 5124 4.04 56,071 3241 5.78 1,986 127 6.39 1999 124,753 4468 3.58 61,827 3099 5.01 2,732 174 6.37 2000 125,590 4164 3.32 62,053 3019 4.87 1,529 71 4.64 Total 3,085,967 77,666 2.52 1,423,800 46249 3.25 376,726 9049 2.40

58
D. CONCLUSION
The mining of the data sets from the HSB surveys and DMDC cohort files
provide useful information that enables us to conduct an empirical analysis of the impact
of JROTC on military enlistment, reenlistment and attrition. The next chapter presents
our regression models and findings, which will then allow us to evaluate the efficacy of
the JROTC program with respect to the military.
59
V. THEORETICAL FRAMEWORK
A. INTRODUCTION
In this chapter, we explore several econometric models that best fit our theoretical
specification models for our study on the impact of JROTC participation on military
enlistment decisions, reenlistment decisions and attrition decisions. As our response
variables are binary in nature, we examine the feasibility of using binary response models
to include the linear probability LOGIT and PROBIT models. We also examine whether
survival analysis methods can be employed to estimate the attrition patterns of JROTC
graduates and non-JROTC graduates. We discuss the set of covariates that goes into the
respective specification models in each section. We choose the covariates in our
specification models based on our literature review in Chapter III.
B. BINARY RESPONSE MODELS
In our study of whether JROTC provides a discernable benefit for the Armed
Forces, our response variables include the decision to enlist and the decision to reenlist.
These are binary response variables, also known as limited dependent variables, whose
probability value lies between zero and one. The econometric models for limited
dependent variable include the simple linear probability model (LPM) and more
advanced binary response models like logit or probit.61
1. Linear Probability Model (LPM) The normal multiple least squares regression model is specified as :
0 1 1 ... k ky x xβ β β µ= + + + +
An assumption of the classical linear regression model is that E(µ|x1,…,xk)=0,
such that 0 1 1( | ) ... k kE y x x xβ β β= + + + . When the dependent variable is limited to zero
one values, the expected value of y given a set of x variables is the same as the
probability that y=1, or 0 1 1 2 2( / ) ( 1/ ) ... k kE y x p y x X X Xβ β β β+= = = + + +
61 See Woolridge(2003) for more detailed explanation of the econometric models specified in this
chapter.

60
The coefficients in the LPM therefore, measure the change in the probability of y
in response to changes in xk ceteris paribus. If the underlying assumptions held, we can
estimate the impact of various explanatory variables on qualitative events like youths’
decisions to enlist or military personnel’s decisions to reenlist using the Ordinary Least
Squares (OLS) estimator. The inadequacies of the LPM for a binary response variable;
however, lie in the results of the fitted probabilities and the partial effects of the
explanatory variables. The fitted probabilities are not constrained to the zero one
interval, which may lead to estimated probabilities that are negative or greater than one.
The LPM also gives constant change effect of the explanatory variables on y where in
some cases, different marginal effects are desired.
2. LOGIT and PROBIT Models The LOGIT and PROBIT models, another form of binary response models, avoid
the limitations of the LPM. From Woolridge (2003), the general form of the binary
response model is as follows:
0 1 1 0( 1| ) ( ... ) ( )0 ( ) 1
k kP y x G x x G xG z
β β β β β= = + + + = +< <
G is a function with values strictly between zero and one for all real numbers z
such that the binary response model also lies between zero and one. Depending on the
assumption of the function G, the binary response model can be a logit or probit model.
In a logit model, the function G is the logistic function with cumulative distribution
function for a standard logistic random variable:
( ) exp( ) /[1 exp( )] ( )0 ( ) 1
G z z z zG z
= + = Λ< <
In a probit model, the function G is the standard normal cumulative distribution
function, with ( )zφ as the standard normal density, expressed as an integral:
1/ 2 2
( ) ( ) ( )
( ) (2 ) exp( / 2)0 ( ) 1
z
G z z v dv
z zG z
φ
φ π−∞
−
= Φ =
= −< <
∫

61
Both logit and probit functions are increasing functions. As z - ∞ , G(z) 0, and
as z ∞ , G(z) 1. The choice of logit or probit as the fitting binary response model
depends on the preference on the assumption for the error term, e. We assume that e is
not correlated with x and that e has either the standard logistic distribution or the standard
normal distribution. If the normality assumption of e is preferred, probit model is chosen
over logit model. In reality, it is difficult to justify the selection of one model over
another.
As in the LPM, we want to find out the effect of x on the probability that y=1. It
is straightforward for the LPM but not so for the probit and logit models. The partial
effects of x for nonlinear G(.) depend on the nature of the x variables. If x is a continuous
variable, the partial effect of x on P(y=1|x) is obtained from the partial derivative:
0( ) ( ) , where ( ) ( )j
j
p x dGg x g z zx dz
β β β∂ = + ≡∂
If x is a binary explanatory variable, the partial effect from changing for example,
x1 from zero to one, ceteris paribus, is
0 1 1 0 2 2( ... ) ( ... )k k k kG x x G x xβ β β β β β+ + + − + + +
3. Maximum Likelihood Estimation (MLE) Typically, we use the Maximum Likelihood Estimation (MLE) for nonlinear
binary response models instead of OLS. MLE is an estimation method where the
parameter estimates are chosen to maximize the log-likelihood function and it is based on
the distribution of y given x. From Woolridge (2003), if we have the density function yi
given a set of vectors xi as 1( | : ) [ ( )] [1 ( )] , 0,1y y
i i if y x G x G x yβ β β −= − =
When y = 1, we have ( )iG x β and when y=0, we obtain 1 ( )iG x β− . The log-
likelihood function is therefore, a function of the parameters and the data (xi,yi) and given
as follows
( ) log[ ( )] (1 ) log[1 ( )]0 (.) 1
i i i i iy G x y G xG
β β β= + − −< <

62
Since G(.) lies strictly between the values zero and one, the log-likelihood
function is well defined for all values of β. In the most condensed form of explanation,
the MLE method sums up ( )i β across all observations for a random sample size n and
chooses the estimated value β̂ , that maximizes this log-likelihood. The application of
MLE to LOGIT and PROBIT models comes from the general principal that the MLE is
consistent, asymptotically normal, and asymptotically efficient.
C. SPECIFICATION MODEL FOR ENLISTMENT DECISIONS
In the study of youths’ enlistment decisions, we treat success as the response
variable for high school graduates that indicated that they had enlisted in the military at
time of survey. The probability of success, in this case, military enlistment, takes on a
value of one and zero, if otherwise. The latent variable model for enlistment decision is *
i i iiY X JROTCβ δ ε= + +
where *iY is the net benefit a respondent receives from enlisting in the military, iX is a
vector of individual characteristics, and iJROTC is the JROTC participation dummy
variable. The vector of individual characteristics include the respondents’ demographics,
ability to afford college, educational expectations, military interest, family background,
peer influence, and the civilian labor market. The respondents of the HS&B survey will
enlist in the military if the expected net benefits of enlisting are positive. Therefore, the
probability that a student enlists in the military is
( 1) ( 0) [ ]
( 1) ( 0) [ ]
i i i i i
i i i i i
P Yi P X JROTC X JROTCor
P Yi P X JROTC X JROTC
β δ ε β δ
β δ ε β δ
= = + + > = Φ +
= = + + > = Λ +
where [ ]i iX JROTCβ δΦ + is the evaluation of the standard normal cdf and
[ ]i iX JROTCβ δΛ + is the evaluation of the logistic cdf. Depending on one’s assumption
of the error variable distribution, we can adopt either a PROBIT or LOGIT model.

63
1. Enlistment
The dependent variable is a dummy variable that takes on a value of “1” if the
respondents replied “yes” to question asked on their employment by the military. For the
1982 wave and 1980 wave of the HSB survey for the sophomore and senior cohort
respectively, the questions on military employment included the branch of service that
they had been accepted in while the later years asked if the respondents were on active
duty service at time of survey.
2. JROTC
The most important explanatory variable in this study is the indicator of JROTC
participation. The JROTC participation variable is set up as a dummy variable where it
takes on the value of one for respondents who had participated in the JROTC program.
We hypothesized that participation in the JROTC program increases the probability to
enlist in the military. We are, however, cautious about the magnitude of the impact given
the relatively small number of JROTC participants in the HS&B sample.
3. Demographics We include in our specification the following demographic characteristics of the
survey respondents: race/ethnicity, gender, marital status, number of children and age.
For the race variable, we create dummy variables for the various racial groups provided
in the survey but we are primarily interested in the dummy variables of whether the
respondents were white, black or Hispanics. Previous studies had shown that blacks are
more likely to enlist while the Hispanics effect is at best inconclusive.
For the gender variable, we have dummy variables if the respondents were male
or female. Similarly, we create dummy variables for whether the respondents were never
married or married. We expect that an unmarried male is more likely to enlist in the
military than a married male and also an unmarried female is also more likely to enlist in
the military than a married female.
In the HS&B survey results, the number of children is recorded categorically for
some years and others, discrete inputs by the respondents. We choose to create dummy
variables for different number of children to control for ease of interpretation. Similarly,
we treat age in the same manner. We expect that high school graduates with more
64
children or who are older are less likely to enlist partly due to the resistance from the
military in accepting potential enlistees that have large number of dependents or who are
older.
4. Ability to Afford College The likelihood of enlisting in the military decreases if the individual finds higher
education more affordable. The 1980 and 1982 waves of the HS&B data contained
information on the ability of the respondents to finance their college education. Dummy
values of one and zero are created for the responses where the respondents were
definitely able to afford college and not able to afford college respectively. Other
indicators of the respondents’ ability to afford college include the number of siblings of
the respondents and the family income. We expect that the more number of siblings in
the household, the less resources the respondents’ parents have available to send them for
higher education, thus increasing the likelihood of enlisting in the military. We also
expect that the more affluent the family background of the respondents, the more likely
they are to pursue higher education and less inclined toward enlisting in the military after
high school.
5. Educational Expectations
We hypothesize that the higher educational expectations an individual has, the
less likelihood of enlisting in the military. The proxies for this factor include the
respondents’ college expectations, their school grades, the highest level of education they
had expected to receive, their college plans after high school and their level of
disappointment if they were not able to attend college. We expect that if the respondents
have college expectations and performing well academically, they are more likely to
pursue college and less likely to enlist in the military. On the other hand, if they have
only the desire to complete high school, their motivation to join the military is likely to
be higher. We therefore, create dummy variables for college expectations, academic
grades and high school education only expectations.
6. Military Interest We expect that respondents who actively seek out military information or express
desire to join the military are more likely to enlist in the military. Indicators of military
interest include the individuals’ expressed aspiration to join the military after high school,
65
where they had taken the ASVAB test, spoken to a military recruiter or obtained military
information. The dummy variable of military interest takes on a value of one if the
individuals exhibit any of the abovementioned behaviors.
7. Family Background In this category, we extract information on the respondents’ family including
family structure (staying with either parent, both parents, others or alone), parents’
educational qualifications, parents’ occupations and parents’ influence on their children’s
academic progress and post high school plans. We expect that respondents staying with
both parents and whose parents take an active interest in their schoolwork and post high
school activities are more likely to pursue higher education and therefore, less likely to
seek enlistment in the military after high school. Similarly, we expect that the higher
level of education attained by their parents, the higher the expectations placed on their
children to pursue higher education and hence, they are less receptive to their children
joining the military after high school. On the other hand, if the respondents’ parents are
in the military, the military background of the parents could have a positive effect on
their children’s propensity to enlist in the military. Again, the qualitative nature of these
variables is captured by creating dummy variables for each of the events mentioned.
8. Peer Influence We attempt to capture the influence of friends in the individuals’ decisions to
either pursue college education or to enlist in the military. We expect that if the peers of
the respondents prefer to enlist in the military, the peer influence would have a positive
effect on the respondents’ decision to enlist in the military. Conversely, if the peers
influence the college plans of the respondents, they will be less likely to enlist in the
military.
9. Civilian Labor Market
As the HS&B data did not capture sufficient data on the civilian labor
employment opportunities for the subsequent follow-up years’ surveys after the base year
1980, we proxy the civilian economy using the census region of the high schools and the
urbanity of the high schools. We will be interested to find out if the census region and
the urbanity have any impact on the respondents’ decision to enlist in the military.
66
D. SPECIFICATION MODEL FOR REENLISTMENT DECISIONS
In the study of the reenlistment decisions of the military personnel, we treat
success in the response variable for the enlisted personnel as those who reenlisted after
first-term. The probability of success, military reenlistment, takes on a value of one and
zero otherwise. The latent variable model for the reenlistment decision is *
i i iiY X JROTCβ δ ε= + +
where *iY is the net benefit the enlisted personnel receives from reenlisting in the
military, iX is a vector of individual characteristics, iJROTC is the JROTC graduate
dummy variable. The vector of individual characteristics included are assumed to be
dependent on a set of covariates, namely JROTC graduate status, demographics,
educational qualification at time of recruitment, entry pay grade, term of enlistment,
branch of service, AFQT category and civilian labor economy. The enlisted personnel
will reenlist in the military if the expected net benefits of reenlisting are positive.
Therefore, the probability that the enlisted personnel reenlist after the first-term is
( 1) ( 0) [ ]
( 1) ( 0) [ ]
i i i i i
i i i i i
P Yi P X JROTC X JROTCor
P Yi P X JROTC X JROTC
β δ ε β δ
β δ ε β δ
= = + + > = Φ +
= = + + > = Λ +
where [ ]i iX JROTCβ δΦ + is the evaluation of the standard normal cdf and
[ ]i iX JROTCβ δΛ + is the evaluation of the logistic cdf. Depending on one’s assumption
of the error variable distribution, we can adopt either a PROBIT or LOGIT model. The
theoretical specification model is as follows:
0 1 2
3 4 5
6 7
Pr( 1)
i
Reenlistment JROTC DemographicsEducation EntryPayGrade EnlistmentTermBranchofService AFQTCategory
β β ββ β ββ β ε
= = + + ++ + +
+ +
1. Reenlistment
The dependent variable is a dummy variable that takes on a value of “1” if the
enlisted personnel reenlist at the expiration of term of service and “0” if they separate
from the military.
67
2. JROTC Graduate
The DMDC data captures the youth program that the enlisted personnel had
participated in prior to enlistment as a means to determine their entry grades. This is
because certain youth programs, like for example JROTC, entitle enlisted personnel who
enter the military an advanced pay grade. However, not all enlistees have participated in
youth programs. We are primarily interested in the JROTC youth program amidst other
programs like the Civil Air Patrol or Sea Cadets. As the JROTC program is akin to a
realistic job preview of the military lifestyle, we expect that enlistees who were JROTC
graduates are more likely to reenlist.
3. Demographic Variables We include in our specification the following demographic characteristics of the
enlisted personnel: race/ethnicity, marital status and enlistment age. For the race
variable, we create dummy variables for non-white, white, black and Hispanic based on
the categories specified in the DMDC cohort files. Previous literature reports that blacks
are more likely to complete their terms of service and reenlist.
The marital status from the DMDC dataset is interacted with the number of
children and we have four dummy variables: single with no children, married with no
children, single with children and married with children. We expect that given the
benefits associated with enlistees with dependents, military members with more
dependents are less likely to seek changes to their current career status and thus are more
likely to stay with the military and reenlist.
The gender of the enlisted personnel could also affect the reenlistment decision.
We hypothesize that males are more likely to reenlist compared to females, as the latter
tend to drop out of their careers once they have families.
We include the enlisted personnel’s age at enlistment because typically the
military targets youths in the age group of 17 to 25 and we like to find out if the age at
time of enlistment has an impact on subsequent reenlistment decisions. Presumably,
members who join later reach reenlistment at an older age and the responsibilities of
families could motivate their decision to reenlist and stay with the military.
68
4. Educational Qualification
We expect that the higher educational qualification that enlistees have at time of
enlistment, the less likely they are to reenlist. This is because we expect that enlisted
personnel with higher levels of education are likely to leave the military for better civilian
opportunities, therefore, decreases the likelihood of reenlistment. Dummy variables were
constructed for all levels of education, including non-high school diploma graduate, high
school diploma graduate, some college, college graduate and those who obtained General
Education Diploma (GED).
5. Entry Pay Grade
This variable seeks to identify the impact entry pay grade has on the reenlistment
decision. We create dummy variables for each enlisted rank from E1 to E9. We
acknowledge that there will be some collinearity between the dummy variable JROTC
and entry pay grades from E3 to E4 as individuals who participate in JROTC for three of
four years enter the service with an advanced pay grade. However, since our interest lies
estimating the effect of JROTC on reenlistment decisions, we include the entry pay grade
to control for non-JROTC graduates who enter at various entry pay grades.
6. Term of Enlistment
The term of enlistment refers to the length of service in which the enlistees are
contracted for. The contract length typically ranges from one to six years. We expect
that the contract length impacts reenlistment decisions as the time spend in the military
could possibly affect the individuals’ psychological perceptions of their fit with the
military organization. As such, we hypothesize that a longer contractual length increases
the probability of reenlistment with the military
7. Branch of Service As we have the population-wide data from DMDC, we include the branch of
service (Army, Navy, Marine Corp and the Air Force) to control for unintended effects
due to the unequal distribution of JROTC graduates amongst the four services. The
Army, being the largest force, naturally has the largest number of JROTC units and
therefore, the largest number of JROTC graduates. The inclusion of this variable also

69
allows us to find out whether the accession service of the JROTC graduates has any
impact on their reenlistment decisions.
8. AFQT Mental Category
The AFQT score measures both the individuals’ cognitive ability to absorb
military training and their potential performance or aptitude for service. We use the
AFQT mental category as proxy for the “quality” of the enlisted personnel. The DMDC
data has nine categories for this variable - Category I,II,IIIA,IIIB, IVA, IVB, IVC, V and
unknown62 – in which we combine Category I, II and IIIA to represent the dummy
variable for “high quality” and the rest as “low quality”. We expect that the “high
quality” enlisted personnel are more likely to stay till completion of service but reenlist at
a lower rate as they face higher opportunity costs associated with remaining in the
military.
9. Highest Paygrade The variable highest paygrade is used as a proxy for a performance
indicator. Enlisted personnel who acquire the higher paygrades do so because of
sustained military performance and training. We create dummy variables for each
paygrade rank E1 to E9. The inclusion of this variable will account for those non-JROTC
participants who remain in the service some prescribed amount of time.
E. SURVIVAL ANALYSIS
We conduct survival analysis when we have survival data. Survival data refers to
any data that deals with time until an event occurs. We see survival data typically in the
medical field where an event includes death or onset of disease or relapse of a disease.
Another common application of survival analysis lies in the industrial sector where
survival times are typically tied to failure of a unit or some component in a unit. If we
have a random variable, T, that represents survival time, the cumulative distribution
function is ( ) Pr( )P t T t= ≤ and probability density function is p(t) = P(t)/ t. d d The
survival function is then
62 The nine categories represent AFQT percentile scores from the highest to the lowest
correspondingly, except for the unknown category. The percentile scores are 93-99, 65-92, 50-64,31-49,21-30, 16-20, 10-15, 1-9.
70
( ) Pr( ) 1 ( )S t T t P t= > = −
This leads us to the hazard function, which looks at the probability of failure (like
death) at time t, conditional on survival to that time.
0
Pr[( ) | )]h(t)= lim
( )( )
t
t T t t T tt
f tS t
∆ →
≤ < + ∆ ≥∆
=
One common feature of survival data is the censoring of data. A common form of
censoring is right-censoring where the subjects of a study survived to a future time
beyond which the success or failure status is not known as the observation period has
expired or the study ends before the end-point is reached. Left-censoring occurs when
the initial time at risk is not known. Interval censoring occurs when both right censoring
and left censoring appear for the same observation.
The statistical methods under the umbrella of survival analysis include
parametric, semi-parametric and non-parametric statistical methods. For parametric
survival analysis methods, we assume the knowledge of the distributions of the survival
times like log-logistic, exponential, Weibull or Gompertz. For non-parametric models,
there are no assumptions of the survival times like the Kaplan and Meier estimators. The
semi-parametric models lie in between by assuming a parametric form for the effects of
the explanatory variables but make no assumptions on the distributions of the survival
times.
The covariates in any survival analysis whose values do not change over time are
called time independent and conversely, those covariates whose values vary with time,
are known as time-dependent covariates. The common estimation method is the Cox
proportional hazard (PH) model which we elaborate further in the following paragraphs.
1. Cox Proportional-Hazards Model The Cox proportional-hazards (PH) model, which is a semi-parametric model, is a
popular model in survival analysis which can be used in analyzing time independent
variables. Let ijX (t) be the jth covariate of the ith person where i = 1,…,n and j = 1,…,p.
It is natural to think of the set of covariates as forming an n x p matrix, and we use iX to

71
denote the covariate vector for subject i, that is, the ith row of the matrix. When all
covariates are fixed over time iX , it is just a vector of covariate values which looks like
multiple linear regressions. When the data set has a combination of time independent and
time-dependent covariates, we can use Xi for both time-fixed and time-varying covariate
processes, employing iX (t) when we wish to emphasize the time varying structure.
A parametric model that examines the relationship between survival distribution
and the covariates, takes on the following form,
0log ( )i j ijh t Xα β= +
The anti-log of the log-linear regression equation above gives
0( )( ) j ji
Xih t e α β+=
where 0α is a constant and represents the log-baseline function as 0log ( )ih t α= when all
the covariates are zero. The Cox PH model by not making any assumption of the
baseline hazard function gives us the semi-parametric form as follows.
00
( )( ) ( ) j ji
Xih t h t e α β+=
When we have two observations, iX and 'iX ,
''
j iji
j i ji
XX
η βη β
==
the hazard ratio for these two observations gives us the proportional hazards model that is
independent of time.
' '
0
' 0
( ) ( )( ) ( )
i i
i i
i
i
h t h t e eh t h t e e
η η
η η= =
The Cox proportional regression model assumes that the effects of the predictor
variables are constant over time. Furthermore, there should be a linear relationship
between the endpoint and predictor variables. Predictor variables that have a highly
skewed distribution may require logarithmic transformation to reduce the effect of

72
extreme values. Logarithmic transformation of a variable var can be obtained by entering
LOG (var) as predictor variable.
A key reason for the popularity of the Cox model is that, even though the baseline
hazard is not specified, reasonably good estimates of regression coefficients, hazard
ratios of interest, and adjusted survival curves can be obtained for a wide variety of data
situations. Another appealing property of the Cox model is that even though the baseline
hazard part of the model is unspecified, it is still possible to estimate the betas in the
exponential part of the model. The Cox model is also applicable when survival time
information is available and the data is censored. In sum, the Cox model uses more
information, the survival times, than the logistic model, which considers a (0, 1) outcome
and ignores survival times and censoring.
F. SPECIFICATION MODEL FOR ATTRITION PATTERN
To further explore the possible effects of JROTC, we examine the attrition
patterns of first term enlistees. First term enlistees are characterized as service members
who depart the service after completion of their initial contract. Contract times range
from two to six years. The data was converted to survival time data as to analyze the
attrition patterns. Survival analysis is a collection of statistical procedures for data
analysis for which the outcome variable of interest is time until separation from the
service. The theoretical specification model is as follows:
0 1 2
3 4 5
6 7
( ) ( )*exp(
i
H t h t JROTC DemographicsEducation EntryPayGrade EnlistmentTermBranchofService AFQTCategory
β ββ β ββ β ε
= + ++ + +
+ +
1. Survival Time
The survival time is the dependent variable which is defined as the time to reach
the event of interest is attrition. It is taken as the difference between the date of
separation and date of entry of each enlisted personnel. The probability of separating
from the military at the end of obligated service is characterized as attrition. The hazard

73
is defined as attrition, which is a natural reduction in workforce. The baseline hazard at
time t represents the hazard for a person with the value 0 for all the predictor variables.
2. Right-censored Data
The enlisted personnel cohort files data was cut-off in year 2003. For those who
are still in service as at the censored point, the date of separation is coded as zero. As
such, we identify those who are still in service as of year 2003 using a dummy variable.
3. Variables of Interest The variables of interest in the survival model are similar to that of the
reenlistment model. Specifically, we have JROTC, demographics, education, entry pay
grade, enlistment-term, branch of service, AFQT category as our right-hand side
variables. The hypothesized effects for the survival model are similar to that of the
reenlistment model. All the variables are categorical with the exception of age.
G. CONCLUSION
The chapter explains the econometric models available in our empirical study of
the impact of JROTC on the military. Binary response models like the LPM, LOGIT and
PROBIT are suitable for our study on the impact of JROTC on enlistment and
reenlistment decisions. Survival analysis method like the semi-parametric Cox PH model
in suitable for our study on the attrition patterns of JROTC graduates and non-JROTC
graduates. We present the results of this empirical study in the next chapter.

74
THIS PAGE INTENTIONALLY LEFT BLANK

75
VI. RESULTS FROM HIGH SCHOOL & BEYOND DATA
A. INTRODUCTION
We present the results of our empirical findings on the impact of JROTC
participation on military enlistment, attrition and reenlistment in this chapter. We utilize
the 1980 High School & Beyond (HS&B) data that surveyed a stratified sample of high
school sophomores and students where information on JROTC participation and military
enlistment were recorded. We extract the HS&B data using cross-sectional sample and
then compare each cohort using four econometric methods: single equation logit, single
equation probit, two-stage least squares (2SLS) with instrumental variable (IV) and
bivariate probit equation. The last two regression methods treat JROTC participation as
endogenous, in that high school students self-select into the JROTC program for reasons
that have no impact on the enlistment decision but would have otherwise cause the
estimation results of the JROTC variable to be biased.
B. ENLISTMENT DECISION EMPIRICAL FINDINGS
The 1980 HS&B Sophomore Cohort and Senior Cohort datasets provide rich
information on the high school students’ educational attainment, values, aspirations,
employment after high school and their family background. From this vast amount of
qualitative information, we select pertinent information that allows us to study the impact
of JROTC participation on military enlistment decision. We present the summary of the
definitions of the variables selected in our model specifications in Appendix A.
In this study, we treat the data as one cross-sectional data across all years using
the latest information for the chosen variables. For both cohorts, we first treat JROTC as
an exogenous variable that is not correlated with any unobserved effects. We use single
equation probit and logit models for this.
However, as the impact of JROTC on enlistment decision could be overstated if
selectivity bias exists, we employ bivariate probit model that uses Maximum Likelihood
Estimators (MLE) and the two-stage least squares (2SLS) with instrumental variables
(IV) method that treat JROTC variable as endogenous. As it is often touted that the

76
JROTC program targets “at risk” youths, there is a possibility that students who are “at
risk” self-select into the JROTC program. As a consequence of their participation in the
JROTC program, these students could have a more favorable inclination toward enlisting
in the military.
In the 2SLS with IV model, we select the following instruments from the
respondent’s days in high school 63 : remedial lessons taken, views on the value of
citizenship, disciplinary problems in school, family structure and family income, to
explain JROTC participation and not the enlistment decision. In the bivariate probit
model, the same instruments form the right-hand side variables of the second probit
equation with JROTC as the dependent variable. Demographics variables are added in
the two models to control for self-selection due to race, ethnic group or age. The
following paragraphs present our results using the methods described above.
The cross-sectional dataset has 14,825 and 11,995 observations for the sophomore and
senior cohort population respectively. After accounting for missing observations, we
have 11,805 and 9,360 observations in the sophomore and senior final sample
respectively.
1. Single Equation LOGIT and PROBIT Models with Exogenous JROTC Variable
Table 18 presents the more significant results from the single equation LOGIT
and PROBIT models of the 1980 sophomore and senior cohort cross-sectional data. We
find that most of the logit odds ratios and probit partial effects exhibit similar behavior
and statistical significance in the two cohorts. From the reported “pseudo R-squared”
values for both logit and probit models, the covariates explain approximately 23 percent
and 36 percent of the variance in the sophomore and senior model respectively.
63 For the cross-sectional datasets, we obtain IVs from variables that occur in either year 1980 or 1982
for the sophomore cohort and year 1980 for the senior cohort.
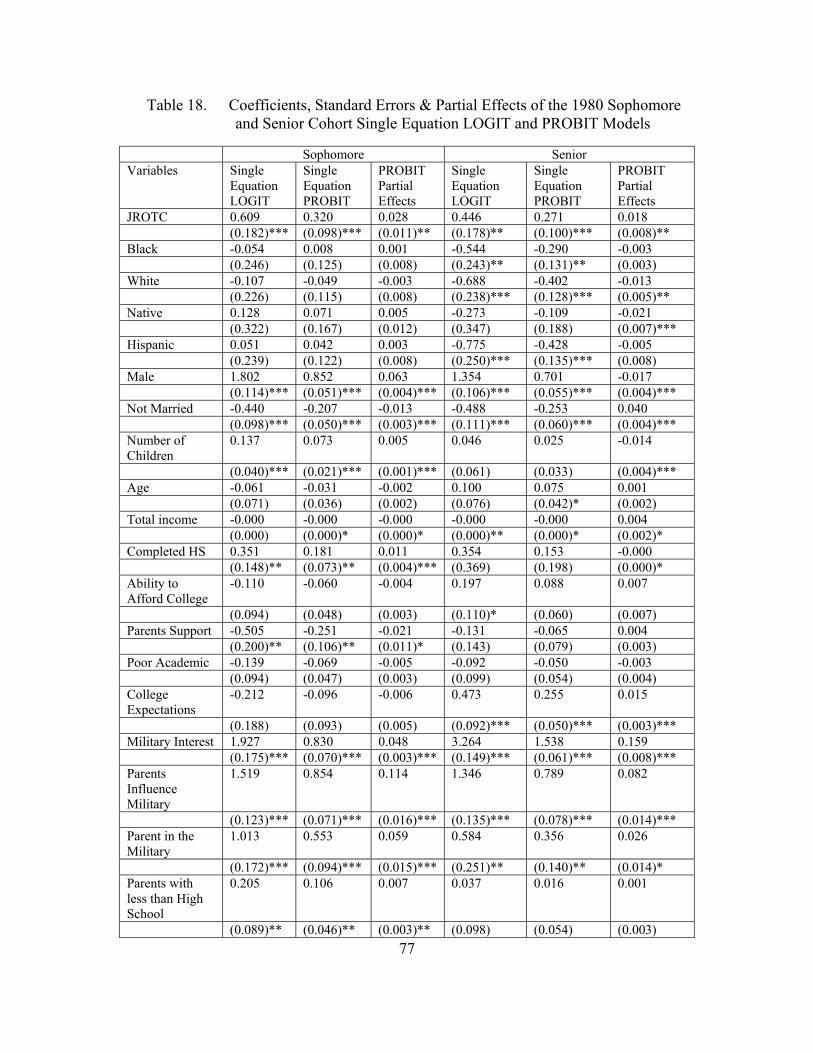
77
Table 18. Coefficients, Standard Errors & Partial Effects of the 1980 Sophomore and Senior Cohort Single Equation LOGIT and PROBIT Models
Sophomore Senior
Variables Single Equation LOGIT
Single Equation PROBIT
PROBIT Partial Effects
Single Equation LOGIT
Single Equation PROBIT
PROBIT Partial Effects
JROTC 0.609 0.320 0.028 0.446 0.271 0.018 (0.182)*** (0.098)*** (0.011)** (0.178)** (0.100)*** (0.008)** Black -0.054 0.008 0.001 -0.544 -0.290 -0.003 (0.246) (0.125) (0.008) (0.243)** (0.131)** (0.003) White -0.107 -0.049 -0.003 -0.688 -0.402 -0.013 (0.226) (0.115) (0.008) (0.238)*** (0.128)*** (0.005)** Native 0.128 0.071 0.005 -0.273 -0.109 -0.021 (0.322) (0.167) (0.012) (0.347) (0.188) (0.007)*** Hispanic 0.051 0.042 0.003 -0.775 -0.428 -0.005 (0.239) (0.122) (0.008) (0.250)*** (0.135)*** (0.008) Male 1.802 0.852 0.063 1.354 0.701 -0.017 (0.114)*** (0.051)*** (0.004)*** (0.106)*** (0.055)*** (0.004)*** Not Married -0.440 -0.207 -0.013 -0.488 -0.253 0.040 (0.098)*** (0.050)*** (0.003)*** (0.111)*** (0.060)*** (0.004)*** Number of Children
0.137 0.073 0.005 0.046 0.025 -0.014
(0.040)*** (0.021)*** (0.001)*** (0.061) (0.033) (0.004)*** Age -0.061 -0.031 -0.002 0.100 0.075 0.001 (0.071) (0.036) (0.002) (0.076) (0.042)* (0.002) Total income -0.000 -0.000 -0.000 -0.000 -0.000 0.004 (0.000) (0.000)* (0.000)* (0.000)** (0.000)* (0.002)* Completed HS 0.351 0.181 0.011 0.354 0.153 -0.000 (0.148)** (0.073)** (0.004)*** (0.369) (0.198) (0.000)* Ability to Afford College
-0.110 -0.060 -0.004 0.197 0.088 0.007
(0.094) (0.048) (0.003) (0.110)* (0.060) (0.007) Parents Support -0.505 -0.251 -0.021 -0.131 -0.065 0.004 (0.200)** (0.106)** (0.011)* (0.143) (0.079) (0.003) Poor Academic -0.139 -0.069 -0.005 -0.092 -0.050 -0.003 (0.094) (0.047) (0.003) (0.099) (0.054) (0.004) College Expectations
-0.212 -0.096 -0.006 0.473 0.255 0.015
(0.188) (0.093) (0.005) (0.092)*** (0.050)*** (0.003)*** Military Interest 1.927 0.830 0.048 3.264 1.538 0.159 (0.175)*** (0.070)*** (0.003)*** (0.149)*** (0.061)*** (0.008)*** Parents Influence Military
1.519 0.854 0.114 1.346 0.789 0.082
(0.123)*** (0.071)*** (0.016)*** (0.135)*** (0.078)*** (0.014)*** Parent in the Military
1.013 0.553 0.059 0.584 0.356 0.026
(0.172)*** (0.094)*** (0.015)*** (0.251)** (0.140)** (0.014)* Parents with less than High School
0.205 0.106 0.007 0.037 0.016 0.001
(0.089)** (0.046)** (0.003)** (0.098) (0.054) (0.003)

78
Parents with High School
-0.178 -0.068 -0.004 0.395 0.211 0.013
(0.213) (0.105) (0.006) (0.178)** (0.098)** (0.007)* Number of Siblings
0.016 0.008 0.001 0.023 0.012 0.001
(0.013) (0.007) (0.000) (0.012)* (0.007)* (0.000)* Friends Influence Military
1.209 0.695 0.084 0.614 0.372 0.027
(0.173)*** (0.101)*** (0.019)*** (0.190)*** (0.109)*** (0.011)** Friends Influence College
-0.238 -0.132 -0.009 -0.246 -0.135 -0.007
(0.097)** (0.050)*** (0.004)** (0.103)** (0.057)** (0.003)** Census Region Dummies
Yes Yes Yes Yes Yes Yes
Constant -3.345 -1.678 -7.622 -4.403 (2.067) (1.054) (1.921)*** (1.052)*** Observations 11,805 11,805 11,805 9,360 9,360 9,360 Log Likelihood -2210.929 -2213.490 -2213.490 -1738.994 -1740.419 -1740.419 Chi2 1339.806 1334.684 1334.684 1967.959 1965.109 1965.109 Pseudo R squared adjusted
0.233 0.232 0.232 0.361 0.361 0.361
Standard errors in parentheses * significant at 10%; ** significant at 5%; *** significant at 1%
We find that the JROTC variable is statistically significant at the five percent
significance level for both cohorts across the logit and probit econometric models. The
results show that the JROTC participation increases the probability of enlisting in the
military. The odds ratio of JROTC enlisting the military is 0.609 and 0.446 for the
sophomore and senior cohort respectively, ceteris paribus. The probit partial effects are
of smaller magnitude with the JROTC participation increasing the probability of
enlistment by 0.028 and 0.018 the sophomore and senior cohort respectively, ceteris
paribus.
For the rest of the variables, we find that the race/ethnic demographic variables
for the sophomore cohort have no impact on the enlistment decision while blacks or
whites or Hispanics in the senior cohort reduce the probability of enlisting in the military
for both the econometric models, ceteris paribus. Males in both cohorts increase the
likelihood of enlisting in the military compared to females, ceteris paribus. For marital
status, we find that sophomores and seniors who are not married reduce the likelihood of
79
enlisting in the military, ceteris paribus. On the other hand, as the number of children
increases by one, the likelihood of enlisting in the military increases, ceteris paribus, with
the exception of the seniors using probit model. An increase of one child reduces the
probability of a senior enlisting in the military by 0.014, ceteris paribus. The age variable
in both cohorts does not display any statistical significance.
The total income variable is significant for the sophomore cohort at the ten
percent level but both logit and probit models reported the coefficients as approximately
zero such that the impact of this variable on the enlistment decision is negligible.
Being a high school graduate positively impacts the enlistment decision for the
sophomores but not the seniors. For example, a sophomore who is a high school
graduate increases the probability of enlisting in the military by 0.011 or display odds
ratio of 0.351, ceteris paribus.
We find that the ability to afford college in the logit and probit models for both
cohorts is not statistically significant but parental support for those in the senior cohort
reduces the probability of enlisting in the military, ceteris paribus. As for college
expectations, it is statistically significant in the senior cohort and both logit and probit
reported positive coefficient estimates, which means that having college expectations
increase the likelihood of enlisting in the military. As for those with poor academic
performance during high school, there is no significant impact on the decision to enlist.
We find that for those who expressed interest in the military increases the
probability of military enlistment compared to those who did not, ceteris paribus. For
those whose parents influence their post-high school plans toward the military and whose
fathers or mothers are in the military, the sophomores and seniors are also more likely to
enlist in the military, ceteris paribus. In addition, sophomores whose parents have less
than high school education are more likely to enlist in the military, ceteris paribus. The
picture is reversed for the seniors. The number of siblings for sophomores has no impact
on the enlistment decision whereas it is positively significant at the ten percent level for
the seniors.

80
The influence of friends with regard to post high school plans have a significant
impact on the respondents’ decision to enlist in the military. both logit and probit models
show positive relationship between the influence of friends to join the military and the
military enlistment decision. The opposite relationship is reported between friends
influence to go to college and the military enlistment decision for the senior cohort.
2. Two-stage Least Squares Model with Endogenous JROTC Variable
We posit that JROTC is endogenous in the enlistment model and we address the
endogeneity problem by choosing a number of instrumental variables. The unobserved
factors in the enlistment equation would include ability and taste for military life. For
example, someone with a strong preference for military life would join JROTC and also
enlist in the military with a higher probability than others. On the other hand, those with
low ability will not qualify for enlistment. The JROTC program targets “at-risk” youths
who may display lower ability. Therefore, the JROTC variable would be correlated with
unobservables left in the error term and as a result, our estimates of fixed impacts on
enlistment will be biased.
With the 2SLS model, we first determine the IVs that characterize “at-risk”
youths. Typically, “at-risk” youths are those whose academic performance needs help,
come from broken families, have low self-esteem, or from the lower socio-economic
status. From the HS&B data, we derive IVs that capture the abovementioned factors, but
do not belong in the enlistment model. The IVs include whether the high school students
have taken remedial lessons, have discipline problems in school, live with single parent,
and have low self-esteem. Their socio-economic background is captured by the family
income reported in the HS&B data. We also include one aspect of JROTC participation,
that is, the inclination toward being a community leader or in general, being able to
contribute to society. JROTC, being a youth program that inculcates citizenship values,
could possibly attract like-minded students to participate.
After the IVs are selected, we run a general test of joint significance of the IVs by
first regressing the JROTC variable against all exogenous variables. With the regression
results, we conduct a joint significance test of the IVs with the null hypothesis that the
IVs are not jointly significant. We obtain a p-value of 0.0046 for which we reject the null
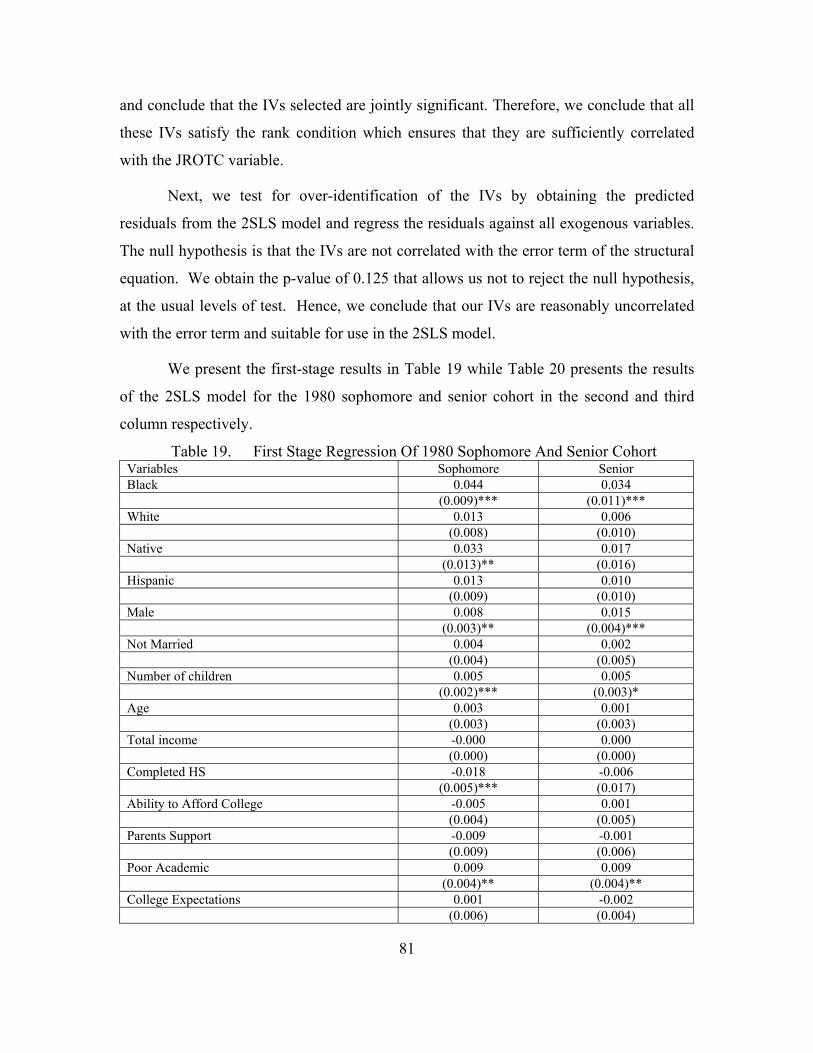
81
and conclude that the IVs selected are jointly significant. Therefore, we conclude that all
these IVs satisfy the rank condition which ensures that they are sufficiently correlated
with the JROTC variable.
Next, we test for over-identification of the IVs by obtaining the predicted
residuals from the 2SLS model and regress the residuals against all exogenous variables.
The null hypothesis is that the IVs are not correlated with the error term of the structural
equation. We obtain the p-value of 0.125 that allows us not to reject the null hypothesis,
at the usual levels of test. Hence, we conclude that our IVs are reasonably uncorrelated
with the error term and suitable for use in the 2SLS model.
We present the first-stage results in Table 19 while Table 20 presents the results
of the 2SLS model for the 1980 sophomore and senior cohort in the second and third
column respectively.
Table 19. First Stage Regression Of 1980 Sophomore And Senior Cohort Variables Sophomore Senior Black 0.044 0.034 (0.009)*** (0.011)*** White 0.013 0.006 (0.008) (0.010) Native 0.033 0.017 (0.013)** (0.016) Hispanic 0.013 0.010 (0.009) (0.010) Male 0.008 0.015 (0.003)** (0.004)*** Not Married 0.004 0.002 (0.004) (0.005) Number of children 0.005 0.005 (0.002)*** (0.003)* Age 0.003 0.001 (0.003) (0.003) Total income -0.000 0.000 (0.000) (0.000) Completed HS -0.018 -0.006 (0.005)*** (0.017) Ability to Afford College -0.005 0.001 (0.004) (0.005) Parents Support -0.009 -0.001 (0.009) (0.006) Poor Academic 0.009 0.009 (0.004)** (0.004)** College Expectations 0.001 -0.002 (0.006) (0.004)

82
Military Interest 0.014 0.018 (0.003)*** (0.004)*** Parents Influence Military 0.011 0.044 (0.008) (0.010)*** Parent in the Military 0.035 0.022 (0.009)*** (0.014) Parents with less than High School 0.000 -0.003 (0.003) (0.004) Parents with High School 0.001 0.017 (0.007) (0.008)** Number of Siblings 0.000 0.001 (0.001) (0.001) Friends Influence Military 0.073 0.043 (0.012)*** (0.013)*** Friends Influence College 0.003 0.002 (0.004) (0.005) Census Region Dummies Yes Yes Live with Single Parent 0.009 0.008 (0.008) (0.007) Remedial Lessons 0.005 0.005 (0.003) (0.004) Values community service 0.011 0.010 (0.003)*** (0.005)** Low Esteem 0.000 0.006 (0.004) (0.004) Discipline Problems in School 0.005 -0.002 (0.003) (0.004) Family Income -0.000 -0.000 (0.000) (0.000)** Constant -0.062 -0.017 (0.079) (0.085) Observations 11,805 9,360 R-squared 0.04 0.04
Standard errors in parentheses * significant at 10%; ** significant at 5%; *** significant at 1%

83
Table 20. Coefficients, Standard Errors & Partial Effects For The 1980 Sophomore And Senior Cohort Two-Stage Least Squares Models
Sophomore Senior JROTC 0.702 -0.232 (0.378)* (0.378) Black -0.031 -0.020 (0.023) (0.020) White -0.011 -0.033 (0.014) (0.014)** Native -0.015 0.002 (0.027) (0.028) Hispanic -0.005 -0.035 (0.015) (0.015)** Male 0.076 0.075 (0.006)*** (0.007)*** Not Married -0.026 -0.031 (0.006)*** (0.007)*** Number of children 0.005 0.004 (0.003) (0.005) Age -0.005 0.007 (0.005) (0.005) Total income -0.000 -0.000 (0.000)* (0.000)** Completed HS 0.035 0.023 (0.011)*** (0.029) Ability to Afford College -0.002 0.013 (0.006) (0.008)* Parents Support -0.025 -0.012 (0.016) (0.009) Poor Academic -0.016 -0.003 (0.007)** (0.008) College Expectations -0.013 0.031 (0.010) (0.006)*** Military Interest 0.039 0.199 (0.007)*** (0.011)*** Parents Influence Military 0.227 0.244 (0.025)*** (0.030)*** Parent in the Military 0.072 0.055 (0.026)*** (0.030)* Parents with less than High School 0.011 -0.000 (0.006)* (0.006) Parents with High School -0.006 0.028 (0.011) (0.015)* Number of Siblings 0.001 0.002 (0.001) (0.001)* Friends Influence Military 0.187 0.137 (0.046)*** (0.038)*** Friends Influence College -0.017 -0.016 (0.007)** (0.008)** Census Region Dummies Yes Yes
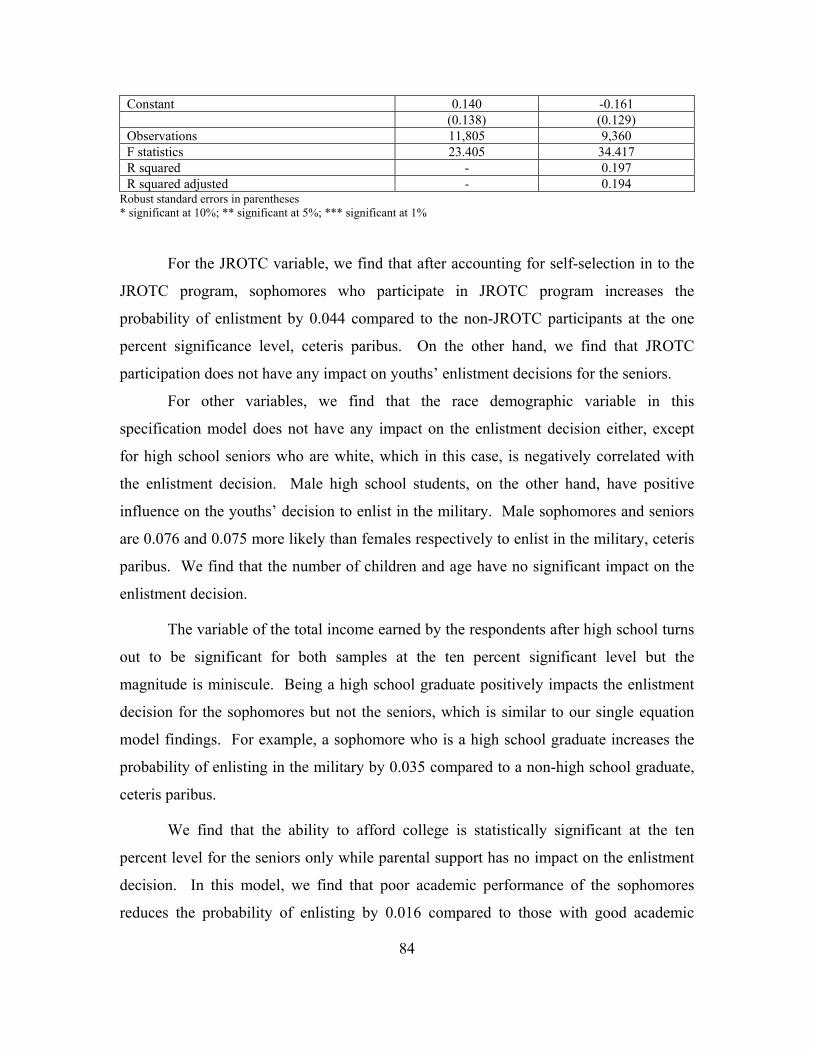
84
Constant 0.140 -0.161 (0.138) (0.129) Observations 11,805 9,360 F statistics 23.405 34.417 R squared - 0.197 R squared adjusted - 0.194
Robust standard errors in parentheses * significant at 10%; ** significant at 5%; *** significant at 1%
For the JROTC variable, we find that after accounting for self-selection in to the
JROTC program, sophomores who participate in JROTC program increases the
probability of enlistment by 0.044 compared to the non-JROTC participants at the one
percent significance level, ceteris paribus. On the other hand, we find that JROTC
participation does not have any impact on youths’ enlistment decisions for the seniors.
For other variables, we find that the race demographic variable in this
specification model does not have any impact on the enlistment decision either, except
for high school seniors who are white, which in this case, is negatively correlated with
the enlistment decision. Male high school students, on the other hand, have positive
influence on the youths’ decision to enlist in the military. Male sophomores and seniors
are 0.076 and 0.075 more likely than females respectively to enlist in the military, ceteris
paribus. We find that the number of children and age have no significant impact on the
enlistment decision.
The variable of the total income earned by the respondents after high school turns
out to be significant for both samples at the ten percent significant level but the
magnitude is miniscule. Being a high school graduate positively impacts the enlistment
decision for the sophomores but not the seniors, which is similar to our single equation
model findings. For example, a sophomore who is a high school graduate increases the
probability of enlisting in the military by 0.035 compared to a non-high school graduate,
ceteris paribus.
We find that the ability to afford college is statistically significant at the ten
percent level for the seniors only while parental support has no impact on the enlistment
decision. In this model, we find that poor academic performance of the sophomores
reduces the probability of enlisting by 0.016 compared to those with good academic
85
performance, ceteris paribus. This is as expected given that those who perform badly in
school are unlikely desirable candidates for the military. As for college expectations, it is
statistically significant for the seniors but not sophomores.
Our results also showed that respondents who expressed interest in the military
display a higher propensity to enlist in the military than those who did not. Sophomores
who expressed military interest are 0.032 more likely to enlist compared to those who did
not, ceteris paribus. Sophomores who indicated military interest is 0.039 more likely to
enlist compared to those who did not while seniors who indicated military interest is
0.199 more likely to enlist than those who did, ceteris paribus. Both coefficients are
statistically significant at the one percent significance level.
We find that respondents whose parents influence their post-high school plans
toward the military or whose parents are in the military are more likely to enlist in the
military than whose parents did not exhibit the same characteristics. The educational
background of the respondents’ parents does not impact the enlistment decision much in
this model. Sophomores whose parents have less than high school education are 0.011
more likely to enlist in the military compared to those whose parents have high school or
more education at the ten percent significance level, ceteris paribus. The number of
siblings the respondents have in both samples did not seem to impact the enlistment
decision in any way, except for the senior population but the impact is small. An increase
in the number of sibling increases the probability of enlisting by 0.002, ceteris paribus.
The influence of friends with regard to post high school plans have a significant
impact on the respondents’ decision to enlist in the military. Sophomores and seniors
influenced by friends to join the military are 0.187 and 0.137 more likely to enlist in the
military compared to those without such peer influence, ceteris paribus. Therefore, we
find that the coefficients are negative for peer influence to go to college after high school
although it is significant for the senior population and not the sophomore population.
3. Bivariate PROBIT Models with Endogenous JROTC Variable Table 21 presents the results of the bivariate PROBIT model, including the partial
effects for the sophomores in the first three columns and seniors in the last three columns.

86
Table 21. Coefficients, Standard Errors & Partial Effects for the 1980 Sophomore and Senior Cohort Bivariate PROBIT Models
Sophomores Seniors
Variables (1) (2) Partial effects
(1) (2) Partial effects
JROTC 0.842 0.0011423 0.117 0.0002694 (0.603) (0.480) Black 0.006 0.0000030 -0.289 -0.0005315 (0.125) (0.131)** White -0.048 -0.0000241 -0.402 -0.0008563 (0.115) (0.128)*** Native 0.070 0.0000374 -0.108 -0.0002044 (0.166) (0.188) Hispanic 0.042 0.0000213 -0.428 -0.0007015 (0.122) (0.135)*** Male 0.849 0.0005124 0.701 0.001613 (0.051)*** (0.055)*** Not Married -0.206 -0.0000970 -0.253 -0.0005523 (0.049)*** (0.060)*** Number of children 0.072 0.0000355 0.025 0.0000517 (0.021)*** (0.033) Age -0.032 -0.0000158 0.075 0.0001562 (0.036) (0.042)* Total income -0.000 0.0000000 -0.000 0.0000000 (0.000)* (0.000)* Completed HS 0.184 0.0000775 0.153 0.0002767 (0.073)** (0.198) Poor Academic -0.071 -0.0000348 -0.049 -0.0001006 (0.047) (0.054) Ability to Afford College
-0.059 -0.0000288
0.089 0.000177
(0.048) (0.060) Parents Support -0.249 -0.0001656 -0.065 -0.0001417 (0.106)** (0.079) College Expectations -0.096 -0.0000425 0.255 0.0005884 (0.093) (0.050)*** Military Interest 0.827 0.0003672 1.538 0.0059645 (0.070)*** (0.062)*** Parents Influence Military
0.849 0.0011442
0.789 0.0031407
(0.071)*** (0.078)*** Parent in the Military 0.550 0.0005298 0.355 0.0010159 (0.094)*** (0.140)** Parents with less than High School
0.105 0.0000550
0.016 0.0000333
(0.046)** (0.054) Parents with High School
-0.070 -0.0000320
0.211 0.0005259
(0.105) (0.098)** Number of Siblings 0.008 0.0000038 0.012 0.0000252 (0.007) (0.007)*

87
Friends Influence Military
0.689 0.0007954
0.372 0.0010798
(0.101)*** (0.109)*** Friends Influence College
-0.131 -0.0000687
-0.135 -0.0003012
(0.050)*** (0.057)** Census Region Dummies
Yes
Yes
Live with Single Parent
-0.108 -0.0000621
0.148 0.0002628
(0.107) (0.092) Remedial Lessons 0.162 0.0000823 0.153 0.0003131 (0.049)*** (0.052)*** Values community service
0.259 0.0001514
0.268 0.0005997
(0.050)*** (0.057)*** Low Esteem 0.004 0.0000022 0.097 0.000187 (0.060) (0.054)* Discipline Problems in School
0.202 0.0001006
0.064 0.0001264
(0.050)*** (0.052) Family Income -0.000 0.0000000 -0.000 0.0000000 (0.000)*** (0.000)*** Constant -1.664 -1.966 -4.405 -2.010 (1.051) (0.120)*** (1.052)*** (0.096)*** Observations 11,805 11,805 9,360 9,360 Log pseudo-likelihood
-3677.204 -3065.004
Wald Chi2 1031.551 1164.730 Prob Wald > Chi2 0.000 0.000
Standard errors in parentheses * significant at 10%; ** significant at 5%; *** significant at 1% The first probit equation regresses enlistment variable against all exogeneous
variable and JROTC. The second probit equation estimates JROTC with all the IVs
identified in the 2SLS model.
We do not find any statistical significance of the JROTC variable in the bivariate
probit model. The partial effects, if any, are very small. Other variables like the
demographics, affordability of college, college expectations, parental support, military
interest, family and peer influence to join the military display similar results as that of the
2SLS model.

88
C. SUMMARY OF RESULTS
Our empirical findings show that JROTC participation increase youths’
probability of enlisting in the military when we treat the JROTC variable as exogenous
for both the sophomore and senior cohort. From our single equation probit and logit
models, we find that JROTC participation increase youths’ probability of enlisting in the
military. When we factor in self-selection into the JROTC program, we find that both
2SLS and bivariate probit model both present negligible impact of JROTC on enlistment
decisions. Table 22 presents a summary of the coefficients of the JROTC variable using
the four econometric methods.
Table 22. Summary of Coefficients of JROTC Single
Equation LOGIT Odds Ratio
Single Equation PROBIT
PROBIT Partial Effects
2SLS/OLS Bivariate PROBIT
Bivariate PROBIT Partial Effects
Sophomore 0.609 0.320 0.028 0.702 0.842 0.0011423 (0.182)*** (0.098)*** (0.011)** (0.378)* (0.603) Senior 0.446 0.271 0.018 -0.232 0.117 0.0002694 (0.178)** (0.100)*** (0.008)** (0.378) (0.480)
89
VII. RESULTS FROM DMDC DATA
A. INTRODUCTION
In this chapter we intend to further contribute to the empirical evidence on the
determinants of JROTC’s impact on reenlistment and attrition. We worked on a sample
drawn from the Defense Manpower Data Center, which consists of the entire population
of recruits that enlisted in the Army, Navy, Air Force and Marine Corps from FY80 to
FY00, excluding FY87. Its longitudinal nature makes it possible to look at whether a
recruit participated in JROTC prior to entering the military, and the way information is
displayed allows simultaneous estimations of the whole population. The theoretical
framework allows us to estimate jointly the decision to reenlist and the impact JROTC
has on attrition. The empirical strategy applied uses a logit and probit model to extend
the principles of generalized linear models to better treat the case of a dichotomous
dependent variable (reenlist). Further, we analyzed survival-time data by the method of
Proportional Hazards Regression (Cox) to determine whether survival rates for JROTC
participants are higher then that of non-JROTC participants
B. REENLISTMENT DECISION EMPIRICAL FINDINGS
The DMDC Cohort files are fiscal year files that track the careers of active duty
enlisted service members, including prior service people, who entered active duty
through the U.S Military Entrance Processing Command (USMEPCOM). Using the
USMECOM files and the active duty master and loss files, an individual is tracked
quarterly for the first four and a half years and then every six months until the career has
been followed. Among the explanatory variables used for both models we have gathered
variables indicating JROTC participation, demographics, and military experience. Youth
program designates JROTC participation. Demographics predictors include age at entry,
highest year of education, sex, race ethnicity, and marital status/dependents. Military
experience variables are Armed Service Vocational Aptitude Battery (ASVAB) raw
scores, prior service, paygrade, highest paygrade and reenlistment eligibility. The
variable groupings are not all inclusive and contain an array of other variables that could
90
be used for future research. We have selected from the data elements those variables that
combined with JROTC participation have an impact on retention and attrition. The
summary of the variables and their definitions is provided in Appendix B.
Two methods were employed to analyze the data. First, because the percentage of
JROTC participants in each cohort was relatively small, we appended the data sets to
create one massive data set, which contains cohorts FY80 through FY00, excluding
FY87. We were able to append the data because each file contained the same variables
but different observations. Secondly, we had to create a second data set by which to
manipulate it in ways to facilitate summary and analysis of survival time data. The data
preparation and organization we do in order to subsequently apply easy estimation
methods for discrete time models are closely related to the tasks which one has to do if
incorporating time-varying covariates of a continuous time model. Because we focus on
time-to-absorbing-event data there are no complications arising from left censoring, gaps,
left truncation, or multiple events. There are no missing values and the data do not need
to be weighted. Lastly, there are no time varying covariates. In this model, all the
explanatory variables in our regressions have a fixed value for each subject. For both
analysis methods JROTC is the covariate of interest and is used to determine the impact
JROTC has on reenlistment and attrition.
The survival time data used for this analysis has a very simply structure. There is
one row in the data set for each ‘subject’. Columns in the data set (variables) contain at
least two types of information for each subject. The length of time in the state (the
survival time = the length of time the subject was exposed to the risk of experiencing a
‘failure’; and censoring status (a variable equal to 1 if the person experienced a ‘failure’,
and equal to 0 otherwise). Other columns in the data set include variables used as
regressors in estimation of multivariate hazard models.
C. LOGIT AND PROBIT MODEL RESULTS
The logit and probit model results for the reenlistment model are summarized in
Table 23. As indicated by the table both logit and probit led to the same conclusions for
the same data. The probit model differs from the logistic model in that the dependent

91
variable is no longer the odds of one outcome versus another, rather, we are now seeking
to predict, or cumulative normal probability of one outcome versus another. However,
since the probits are formed in the same fashion (cumulatively, using the highest category
as the baseline or denominator) as the logits, the general approach to interpretation is
identical to that of the logit model.
Table 23. Coefficients, Standard Errors & Partial Effects Of The Single Equation
Reenlistment LOGIT And PROBIT Models Variables Logit Model Probit Model Partial Effects from
Probit a JROTC 0.168 0.089 0.035
(0.008)*** (0.005)*** (0.002)*** Highest Paygrade E1 -5.405 -3.011 -0.585
(0.014)*** (0.007)*** (0.001)*** Highest Paygrade E2 -5.327 -2.989 -0.502
(0.015)*** (0.008)*** (0.001)*** Highest Paygrade E3 -4.464 -2.566 -0.533
(0.014)*** (0.007)*** (0.001)*** Highest Paygrade E4 -3.216 -1.863 -0.589
(0.013)*** (0.007)*** (0.002)*** Highest Paygrade E5 -0.944 -0.497 -0.182
(0.014)*** (0.007)*** (0.002)*** Highest Paygrade E6 2.237 1.085 0.401
(0.021)*** (0.010)*** (0.003)*** Highest Paygrade E7 4.590 1.968 0.565
(0.069)*** (0.024)*** (0.002)*** Highest Paygrade E8 5.669 2.404 0.581
(0.214)*** (0.067)*** (0.003)*** Highest Paygrade E9 6.296 2.726 0.585
(0.579)*** (0.171)*** (0.003)*** Age -0.019 -0.012 -0.005
(0.001)*** (0.000)*** (0.000)*** Navy 0.420 0.229 0.090
(0.004)*** (0.002)*** (0.001)*** Air force 0.648 0.374 0.148
(0.004)*** (0.003)*** (0.001)*** Entry paygrade E2 -0.101 -0.050 -0.019
(0.004)*** (0.002)*** (0.001)*** Entry paygrade E3 0.026 0.034 0.013
(0.005)*** (0.003)*** (0.001)*** Entry paygrade E4 -0.667 -0.347 -0.128
(0.010)*** (0.006)*** (0.002)*** Entry Paygrade E5 -3.030 -1.630 -0.383
(0.017)*** (0.009)*** (0.001)*** Marine Corps -0.344 -0.179 -0.069
(0.005)*** (0.003)*** (0.001)*** Female 0.024 0.002 0.001
(0.004)*** (0.002) (0.001) Term of Enlistment two years 0.935 0.529 0.209
(0.007)*** (0.004)*** (0.002)*** Term of Enlistment three years
0.343 0.195 0.077
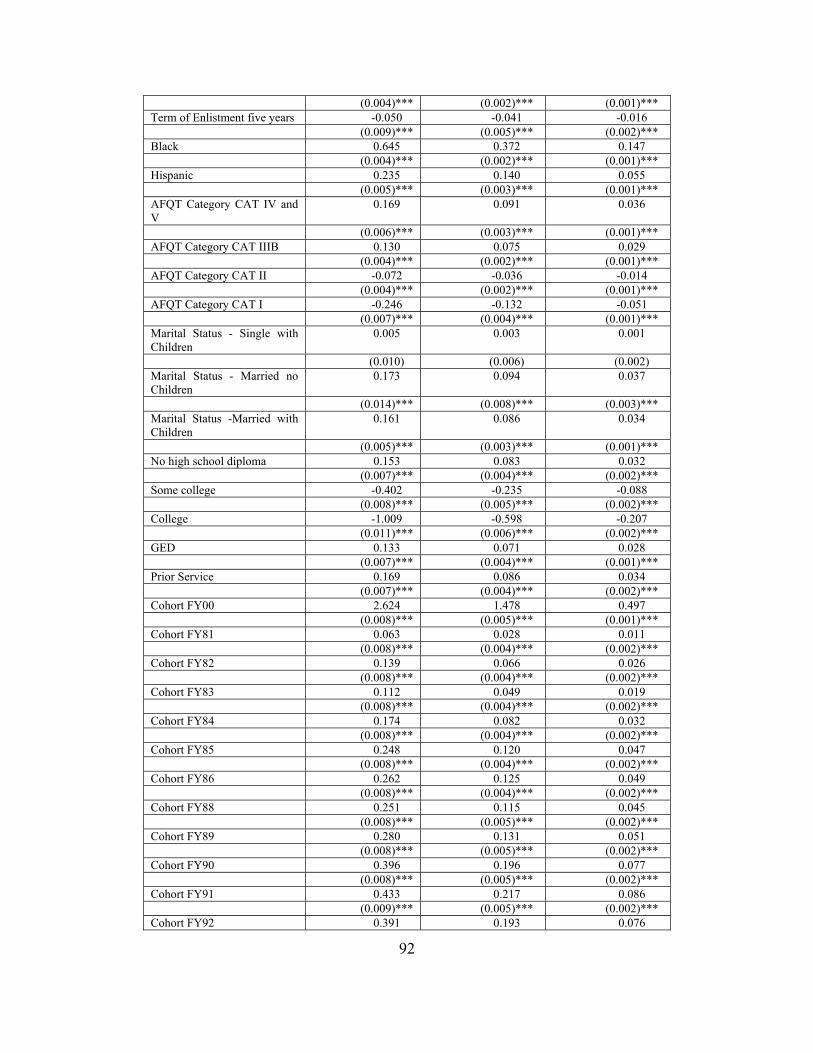
92
(0.004)*** (0.002)*** (0.001)*** Term of Enlistment five years -0.050 -0.041 -0.016
(0.009)*** (0.005)*** (0.002)*** Black 0.645 0.372 0.147
(0.004)*** (0.002)*** (0.001)*** Hispanic 0.235 0.140 0.055
(0.005)*** (0.003)*** (0.001)*** AFQT Category CAT IV and V
0.169 0.091 0.036
(0.006)*** (0.003)*** (0.001)*** AFQT Category CAT IIIB 0.130 0.075 0.029
(0.004)*** (0.002)*** (0.001)*** AFQT Category CAT II -0.072 -0.036 -0.014
(0.004)*** (0.002)*** (0.001)*** AFQT Category CAT I -0.246 -0.132 -0.051
(0.007)*** (0.004)*** (0.001)*** Marital Status - Single with Children
0.005 0.003 0.001
(0.010) (0.006) (0.002) Marital Status - Married no Children
0.173 0.094 0.037
(0.014)*** (0.008)*** (0.003)*** Marital Status -Married with Children
0.161 0.086 0.034
(0.005)*** (0.003)*** (0.001)*** No high school diploma 0.153 0.083 0.032
(0.007)*** (0.004)*** (0.002)*** Some college -0.402 -0.235 -0.088
(0.008)*** (0.005)*** (0.002)*** College -1.009 -0.598 -0.207
(0.011)*** (0.006)*** (0.002)*** GED 0.133 0.071 0.028
(0.007)*** (0.004)*** (0.001)*** Prior Service 0.169 0.086 0.034
(0.007)*** (0.004)*** (0.002)*** Cohort FY00 2.624 1.478 0.497
(0.008)*** (0.005)*** (0.001)*** Cohort FY81 0.063 0.028 0.011
(0.008)*** (0.004)*** (0.002)*** Cohort FY82 0.139 0.066 0.026
(0.008)*** (0.004)*** (0.002)*** Cohort FY83 0.112 0.049 0.019
(0.008)*** (0.004)*** (0.002)*** Cohort FY84 0.174 0.082 0.032
(0.008)*** (0.004)*** (0.002)*** Cohort FY85 0.248 0.120 0.047
(0.008)*** (0.004)*** (0.002)*** Cohort FY86 0.262 0.125 0.049
(0.008)*** (0.004)*** (0.002)*** Cohort FY88 0.251 0.115 0.045
(0.008)*** (0.005)*** (0.002)*** Cohort FY89 0.280 0.131 0.051
(0.008)*** (0.005)*** (0.002)*** Cohort FY90 0.396 0.196 0.077
(0.008)*** (0.005)*** (0.002)*** Cohort FY91 0.433 0.217 0.086
(0.009)*** (0.005)*** (0.002)*** Cohort FY92 0.391 0.193 0.076
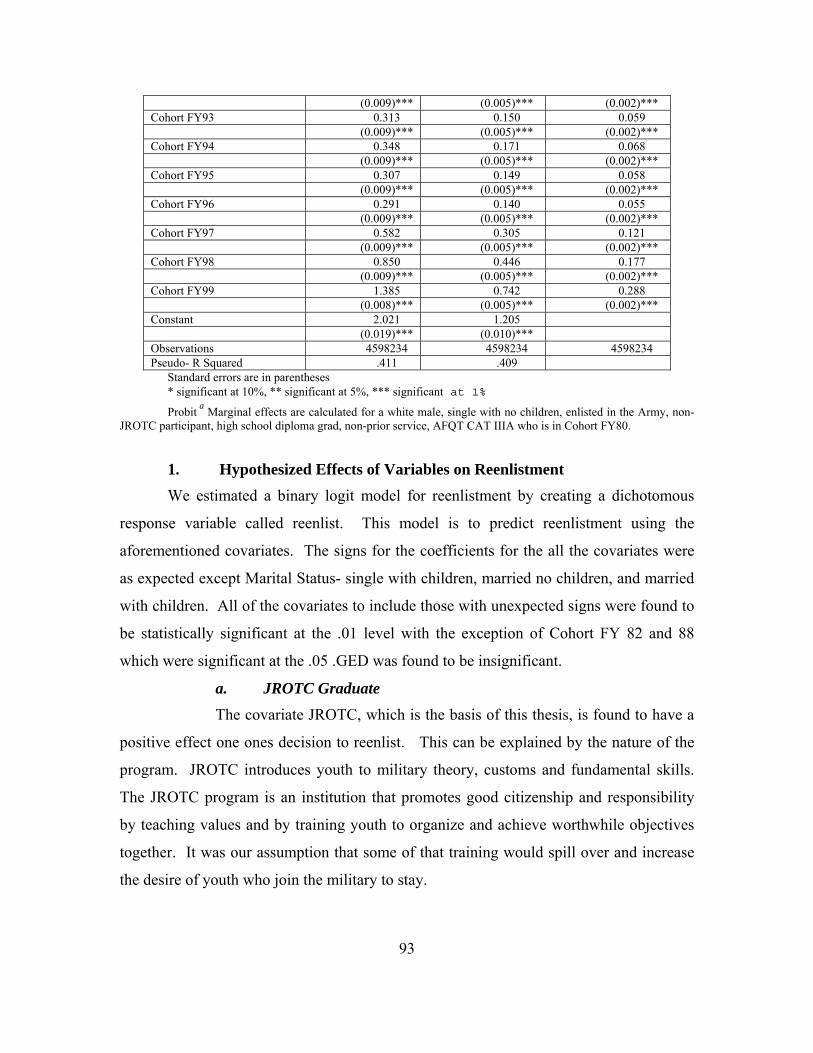
93
(0.009)*** (0.005)*** (0.002)*** Cohort FY93 0.313 0.150 0.059
(0.009)*** (0.005)*** (0.002)*** Cohort FY94 0.348 0.171 0.068
(0.009)*** (0.005)*** (0.002)*** Cohort FY95 0.307 0.149 0.058
(0.009)*** (0.005)*** (0.002)*** Cohort FY96 0.291 0.140 0.055
(0.009)*** (0.005)*** (0.002)*** Cohort FY97 0.582 0.305 0.121
(0.009)*** (0.005)*** (0.002)*** Cohort FY98 0.850 0.446 0.177
(0.009)*** (0.005)*** (0.002)*** Cohort FY99 1.385 0.742 0.288
(0.008)*** (0.005)*** (0.002)*** Constant 2.021 1.205
(0.019)*** (0.010)*** Observations 4598234 4598234 4598234 Pseudo- R Squared .411 .409
Standard errors are in parentheses * significant at 10%, ** significant at 5%, *** significant at 1%
Probit a Marginal effects are calculated for a white male, single with no children, enlisted in the Army, non-JROTC participant, high school diploma grad, non-prior service, AFQT CAT IIIA who is in Cohort FY80.
1. Hypothesized Effects of Variables on Reenlistment We estimated a binary logit model for reenlistment by creating a dichotomous
response variable called reenlist. This model is to predict reenlistment using the
aforementioned covariates. The signs for the coefficients for the all the covariates were
as expected except Marital Status- single with children, married no children, and married
with children. All of the covariates to include those with unexpected signs were found to
be statistically significant at the .01 level with the exception of Cohort FY 82 and 88
which were significant at the .05 .GED was found to be insignificant.
a. JROTC Graduate The covariate JROTC, which is the basis of this thesis, is found to have a
positive effect one ones decision to reenlist. This can be explained by the nature of the
program. JROTC introduces youth to military theory, customs and fundamental skills.
The JROTC program is an institution that promotes good citizenship and responsibility
by teaching values and by training youth to organize and achieve worthwhile objectives
together. It was our assumption that some of that training would spill over and increase
the desire of youth who join the military to stay.

94
b. Military Experience
We hypothesized that the covariate, term of enlistment (1-3 year contract),
would have a negative impact on ones decision to reenlist. In other words the shorter the
initial term, the less commitment the individual is willing to make to the military.
Results indicated that all of the defined terms of enlistment had a positive impact on ones
decision to reenlist with the exception of three years. We further hypothesized that
military personnel with higher AFQT scores would be more likely to depart the military
and pursue other options; hence, the results indicated that personnel that fell into the two
highest AFQT categories were less likely to reenlist. This is most likely due to the desire
of higher scoring individuals to seek out employment opportunities in the civilian sector.
Military personnel with high AFQT scores qualify for the more technical jobs, which
provide skills and training that are transferable to the civilian sector. This would
inevitably lead to a desire to continue advanced education; therefore, departing the
service after their initial term.
c. Demographics An explanation for the unexpected signs on Marital Status SNC, MNC,
and MWC would be, it is difficult for single parents to maintain a military career with
lengthy duty periods and possible deployments. Single parents find it difficult to meet all
the demanding requirements with the given time constraints when they have children to
care for, thus, they do not reenlist. Married personnel without children have more options
available and are not necessarily tied to the military because of the need for medical care
and family support services. Married personnel with no children have more flexibility
and if not satisfied would be more likely to depart the service if they felt better
opportunities were available in the civilian sector.
The service of accession clearly has an impact on ones decision to reenlist
and is promulgated by their taste and liking of that service. We hypothesized that service
of accession would have a positive impact on reenlistment. Results indicate that the
Marine Corp has a negative impact on ones decision to reenlist. That can be explained by
the robust training and demanding nature of the Marine Corps.

95
2. Interpretation of Coefficients
The coefficients are the results of the logit and probit regressions. These
coefficients indicate the amount of change expected in the log odds when there is a one
unit change in the predictor variable with all of the other variables in the model held
constant. Coefficients close to 0 suggest that there is no change due to the predictor
variable. The base case is characterized as a high quality recruit. White male, single no
children, entry paygrade E1, entered the Army, non-JROTC participant, eligible for
reenlistment, high school diploma grad, contracted for 4 years, and AFQT Mental
Category IIIA. This service member would be the most likely candidate to reenlist.
a. JROTC Graduate
The coefficient for JROTC in the logit model is 0.168. Thus, I would
predict that the log odds for reenlistment would increase by .168 for every additional
military member who participated in JROTC when all other predictor variables are held
constant. The predictability of reenlist based on the explanatory variable JROTC is
minimal at best. It must be noted that estimated logit coefficients do not provide a direct
interpretation because of the non-linear nature of the model. A change in Y from a one
unit change in X1 does not just depend on β but also on the values of the other predictor
variables. The interpretation of the probit model is if people participate in JROTC, on
average, the probit (probability of reenlistment) will increase by 0.089. We will further
explore the predictor variables that indicate a negative impact on the log odds of
reenlisting.
b. Military Experience The coefficient for age in the logit model is -0.019; therefore, the log odds
for reenlistment would decrease by .019 for each additional year of age, ceteris paribus.
Interpreting the probit model indicates that for each additional year of age, on average,
the probit (probability of reenlistment) will not change. For each remaining covariate
with a negative coefficient the probabilities of reenlistment decrease proportionally. The
coefficient for Marine Corps is -0.344; therefore, the log odds for reenlistment would
decrease by .344 for each member that enlists in the Marine Corps. It was no surprise
that, personnel with high AFQT scores were less likely to reenlist. For AFQT Mental
96
Category II the coefficient is -0.072; therefore, the log odds for reenlistment would
decrease by .072 for every additional recruit in AFQT Mental Category II and .246 for
AFQT Mental Category I respectively.
c. Demographics Other predictors that proportionally decreased the log odds for
reenlistment were personnel with some college or a college degree, personnel who
entered in the service in paygrades E2, E4 and E5, personnel who’s highest paygrade was
E1 – E5 and contract lengths for greater than 5 years. The coefficient for the variable
some college is -0.402; hence, the log odds for reenlistment would decrease for each
additional recruit with some college. We would assume that depending on the economic
conditions that member may feel as though they can achieve more in the civilian sector.
In addition, they may have joined the service simply for the educational benefits and the
desire to serve only one term. In that instance it would hold true that enlisted personnel
with some college would be less likely to reenlist.
Personnel with college degrees are also less likely to reenlist as well. This is not
to say that these personnel leave the service. Programs such as Officer Candidate School
are offered to high quality enlisted personnel who posses a bachelors degree in a sought
after specialty. Personnel whose highest paygrade was E1 –E5 were found to be less
likely to reenlist. This can be attributed to many factors; however, lack of steady
progression in the ranks may lead to atrophy. One of the biggest accomplishments for an
enlisted person is to advance in paygrade, which leads to greater responsibility, higher
pay and overall job satisfaction. If a service member in unable to promote he/she is less
likely to reenlist.
The coefficient for enlisted personnel who are single with children is -
0.005. This translates into, the log odds for reenlistment will decrease by 0.005 for each
recruit that is single and has children. Single enlisted personnel with children typically
have a difficult time in the military due to child care constraints. The pay is not
substantial enough to pay child care and living expenses on the civilian economy. For
single Navy and Army personnel this is extremely taxing. The service member is
required to have a guardian available in the event of a deployment. Also, some find it
97
extremely difficult to leave young children behind while they deploy; hence, a lower
reenlistment rate for enlisted persons that are single and have children.
The coefficient for the variable term of enlistment – 5 years is -0.050. This
translates into a decrease in the log odds of reenlistment by .050. This result was
surprising. A longer contract length is a sign of commitment and typically longer
contract lengths are associated with reenlistment bonuses. Unfortunately, some enlisted
personnel only have the opportunity to experience one command and from that one
experience they draw their overall conclusions about the military. If the initial tour of a
new recruit is not a positive experience than they would be less inclined to reenlist. One
variable that produced a positive effect on reenlistment was female. The coefficient for
the variable female is .024; therefore, the log odds for reenlistment would increase for
each female recruit. Females have historically been under represented in the armed
forces as noted in chapter four. Traditionally, the armed services did not employ many
females because there were several jobs that were combat related and not open to
females. Surprisingly, the number of female new recruits has increased; in addition, the
number of females that participate in JROTC has increased significantly in the past
decade.
Obviously, if a member is not qualified to re-enlist than they would
definitively have a negative impact or cause a decrease in the log odds of reenlisting;
therefore, those enlisted personnel that were not eligible for reenlistment were excluded
from the sample population.
All of the cohorts were statistically significant at the 0.10 level and they
all had a positive impact on the log odds to reenlist. This could be directly related to the
end of the drawdown and depressed economic conditions; furthermore, the past four
years have seen an increase in the unemployment rate. Jobs growth is lagging and the
military is a source of stability and steady income
3. Interpretation of Partial Effects – Probit As previously stated all of the covariates in the reenlistment model were found to
be statistically significant at the 0.10 level. Estimating the partial (or ceteris paribus)
effect of an explanatory variable on a response variable is fundamental in the empirical
98
social sciences. If we assume that all explanatory variables are exogenous, and that the
response variable has a conditional expectation linear in functions of the explanatory
variables, then partial effects are easily estimated by ordinary least squares.
The results of the partial effects probit model were similar to that of the logit
model. The covariates which had a negative impact on reenlistment were the same as
those in the logit model. The coefficient for the covariate highest paygrade is -0.585;
which translates to a decrease in reenlistment by .585. All of the remaining covariates of
highest paygrade had a negative impact on reenlistment respectively. The coefficient for
the covariate age is -0.005. This result indicates that age decreases reenlistment by 0.005.
Entry paygrade was also found to have a negative impact on reenlistment at -0.019, -
0.128, and -0.383 respectively. The service of accession that had a negative impact on
reenlistment was Marine Corps at -0.069. The higher term of enlistment, 5 years, had a
negative impact on reenlistment at -0.016. Lastly, personnel found to have some college
or a college degree tend to be less likely to reenlist at -0.088 and -0.207 respectively.
All of the remaining covariates were found to positively impact reenlistment. The
variable of interest, JROTC, is statistically significant and positively influences reenlist
by 0.035 or 3.5%. As a result of longevity in the service those personnel that acquired
the higher paygrades E6 – E9 were more likely to reenlist. A service-member who
acquired the rank of E6 would impact reenlistment by .401 or 40%. Enlisted personnel in
the Air Force were found to reenlist 0.148 or 14% more often than Navy personnel at
0.090 or 9%. Although statistically significant females impact on reenlistment was
marginal at .001 or less than .1%. Military personnel who enlisted for two or three year
contracts were more likely to reenlist at .209 or 20% and .077 or 7.7% respectively.
Black military personnel were found to be more likely to reenlist than their Hispanic
counterparts at 0.147 or 14% vice 0.055 or 5.5%. Those personnel who scored in the
lower AFQT categories are more likely to reenlist. The covariates for AFQT Category
IIIB and IV are 0.001which translates to lower AFQT category effects reenlistment by
less than one percent. The same holds true for personnel who do not have a high school
diploma or recipients of the GED. The impact on reenlistment for non-high school grads
and GED recipients is less than 1%. Although statistically significant, marital status was
99
found to have a minimal effect on reenlistment. Personnel who are single with no
children, or married with children impact reenlistment by .001 and .003 respectively.
Lastly, the cohort personnel belong to have a marginal effect on reenlistment at less than
1%.
4. Model Goodness of Fit When employing a multivariate model, there is always the concern of the
statistical significance of each of the predictor variables as well as the overall goodness of
fit of the model. For both the probit and logit models the same predictor variables were
used to predict reenlistment for approximately 4, 598,234 observations. This data
spanned the course of 19 years and the size of the population surely impacted the
significance of each covariate. All of the covariates used to estimate these models were
found to be significant at the .1 with the exception of the three previously mentioned.
Goodness-of-fit is essential in determining whether a model is sound. For a logit
model, one must look at the likelihood ratio chi-square with 55 degrees of freedom. One
degree of freedom is used for each predictor variable in the logistic regression model.
The likelihood-ratio chi-square is defined as 2(L1 - L0), where L0 represents the log
likelihood for the “constant only” model and L1 is the log likelihood for the full model
with the constant and predictors. The likelihood chi square test is calculated manually as
2*(-3355728.6 – (-3175705.2) = 360046.8. The Prob>chi2 is the probability of obtaining
the chi square statistic given that the null hypothesis is true. In other words, this is the
probability of obtaining this chi-square statistic (360046.8) if there is in fact no effect of
the independent variables, taken together, on the dependent variable. In this case, the
model is statistically significant because the p-value is less than .000.
Another measure of goodness-of- fit for logit models is observing the correctly
predicted observations in the sample, or pseudo- R2. Technically, R2 cannot be computed
the same way in logistic regression as it is in OLS regression. The pseudo- R2, in logistic
regression, is defined as (1 - L1)/L0, where L0 represents the log likelihood for the
“constant-only” model and L1 is the log likelihood for the full model with constant
predictors. The pseudo- R2 for this model is 0.411. This translates into 41.1% correctly
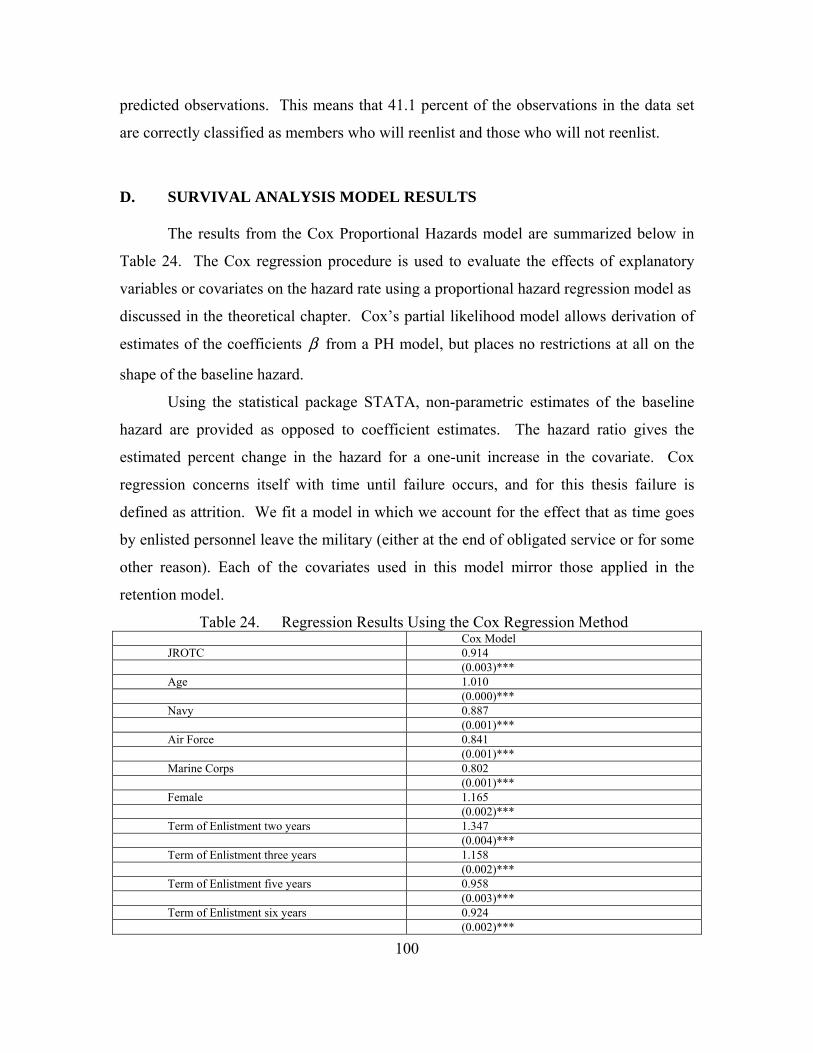
100
predicted observations. This means that 41.1 percent of the observations in the data set
are correctly classified as members who will reenlist and those who will not reenlist.
D. SURVIVAL ANALYSIS MODEL RESULTS
The results from the Cox Proportional Hazards model are summarized below in
Table 24. The Cox regression procedure is used to evaluate the effects of explanatory
variables or covariates on the hazard rate using a proportional hazard regression model as
discussed in the theoretical chapter. Cox’s partial likelihood model allows derivation of
estimates of the coefficients β from a PH model, but places no restrictions at all on the
shape of the baseline hazard.
Using the statistical package STATA, non-parametric estimates of the baseline
hazard are provided as opposed to coefficient estimates. The hazard ratio gives the
estimated percent change in the hazard for a one-unit increase in the covariate. Cox
regression concerns itself with time until failure occurs, and for this thesis failure is
defined as attrition. We fit a model in which we account for the effect that as time goes
by enlisted personnel leave the military (either at the end of obligated service or for some
other reason). Each of the covariates used in this model mirror those applied in the
retention model.
Table 24. Regression Results Using the Cox Regression Method Cox Model JROTC 0.914 (0.003)*** Age 1.010 (0.000)*** Navy 0.887 (0.001)*** Air Force 0.841 (0.001)*** Marine Corps 0.802 (0.001)*** Female 1.165 (0.002)*** Term of Enlistment two years 1.347 (0.004)*** Term of Enlistment three years 1.158 (0.002)*** Term of Enlistment five years 0.958 (0.003)*** Term of Enlistment six years 0.924 (0.002)***

101
Black 0.786 (0.001)*** Hispanic 0.880 (0.002)*** AFQT Category IV and V 0.907 (0.002)*** AFQT Category IIIB 0.948 (0.001)*** AFQT Category II 1.040 (0.001)*** AFQT Category I 1.140 (0.003)*** Marital Status – Single with Children 1.041 (0.004)*** Marital Status – Married no Children 1.027 (0.005)*** Marital Status – Married with Children 1.022 (0.002)*** No High School Diploma 0.917 (0.002)*** Some College 1.080 (0.003)*** College graduate 1.471 (0.006)*** GED 1.000 (0.002) Prior service 0.970 (0.002)*** Entry Paygrade E2 1.045 (0.002)*** Entry paygrade E3 1.114 (0.002)*** Entry paygrade E4 1.289 (0.005)*** Entry paygrade E5 3.003 (0.016)*** Highest paygrade E2 77.223 (0.803)*** Highest paygrade E3 43.832 (0.454)*** Highest paygrade E4 21.170 (0.219)*** Highest paygrade E5 9.031 (0.093)*** Highest paygrade E6 3.066 (0.032)*** Highest paygrade E7 1.617 (0.018)*** Highest paygrade E8 1.069 (0.015)*** Highest paygrade E9 0.622 (0.018)*** Cohort FY00 0.731 (0.003)*** Cohort FY81 0.993 (0.002)*** Cohort FY82 0.994 (0.003)**
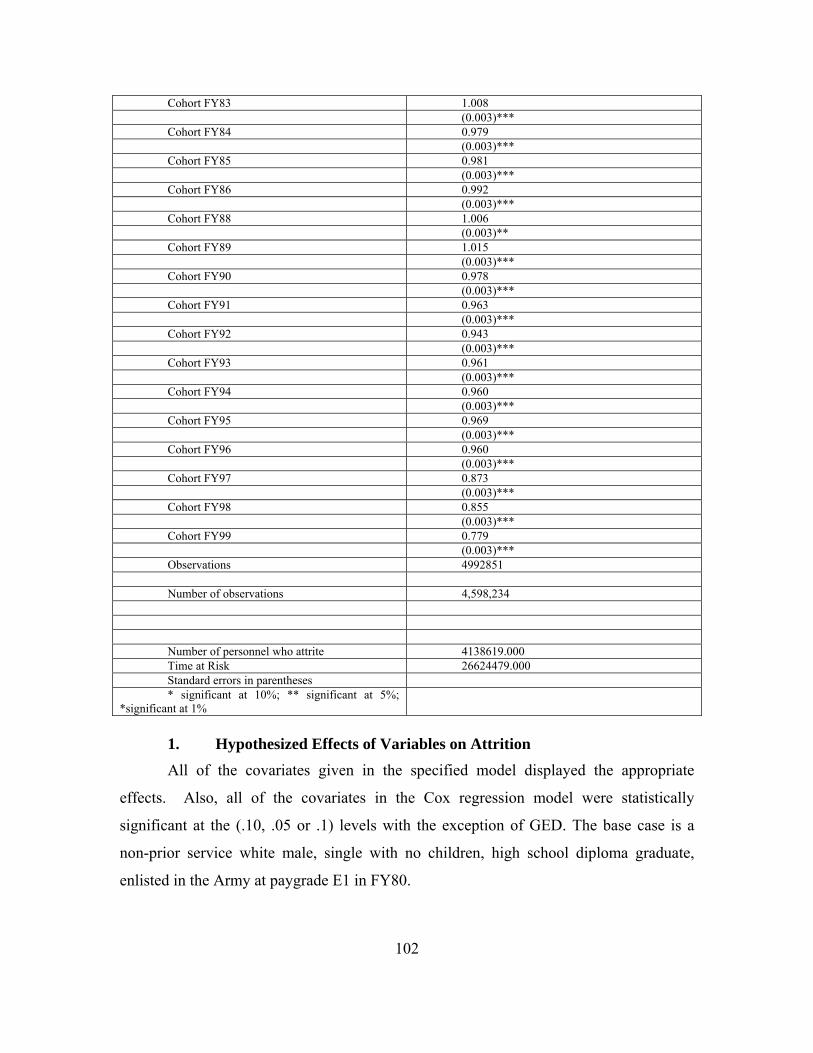
102
Cohort FY83 1.008 (0.003)*** Cohort FY84 0.979 (0.003)*** Cohort FY85 0.981 (0.003)*** Cohort FY86 0.992 (0.003)*** Cohort FY88 1.006 (0.003)** Cohort FY89 1.015 (0.003)*** Cohort FY90 0.978 (0.003)*** Cohort FY91 0.963 (0.003)*** Cohort FY92 0.943 (0.003)*** Cohort FY93 0.961 (0.003)*** Cohort FY94 0.960 (0.003)*** Cohort FY95 0.969 (0.003)*** Cohort FY96 0.960 (0.003)*** Cohort FY97 0.873 (0.003)*** Cohort FY98 0.855 (0.003)*** Cohort FY99 0.779 (0.003)*** Observations 4992851 Number of observations 4,598,234 Number of personnel who attrite 4138619.000 Time at Risk 26624479.000 Standard errors in parentheses * significant at 10%; ** significant at 5%;
*significant at 1%
1. Hypothesized Effects of Variables on Attrition
All of the covariates given in the specified model displayed the appropriate
effects. Also, all of the covariates in the Cox regression model were statistically
significant at the (.10, .05 or .1) levels with the exception of GED. The base case is a
non-prior service white male, single with no children, high school diploma graduate,
enlisted in the Army at paygrade E1 in FY80.

103
We hypothesized that the shorter the term of enlistment the more likely an
enlisted person would attrite. A term of enlistment of one year is naturally not significant
because you cannot enlist for a one year term; therefore, that variable would have no
impact on attrition. We did however hypothesize that enlisted personnel with some
college would probably depart the service after initial tour to continue college education
with educational benefits received in the military. The fact that some college and college
graduates were both statistically significant may be indicative of the number of enlisted
personnel that actually join the military with some college background.
The only variable that was found to be insignificant in determining attrition is
GED. This could be explained by the requirements for personnel to enlist. In the early
eighties the services enlisted many recruits who did not have a high school diploma or
equivalency certificate. With the advent of newer technologies and the requirements for
military personnel to be better equipped and capable of learning a high school diploma is
now required for entrance in the armed services. Each branch of service has specific
quotas for the number of personnel that can enter with a GED. The Army only allows 10
percent of their total enlistments each year to have a GED. To even be considered, a high
school dropout (GED) must score at least a 50 on the AFQT. Even with a GED, the
chances are not good if enlisting in the Air Force. Only about ½ of a percent of all Air
Force enlistments each year are GED-Holders. To even be considered for one of these
few slots, a GED-holder must score a minimum of 65 on the AFQT. As with the Army
and Air Force, those without a high school education are ineligible. The Marine Corps
limits GED enlistments to no more than 5 percent per year. Those with a GED must
score a minimum of 50 on the AFQT to even be considered. Lastly, the Navy allows
only 5 to 10 percent per year, but they must score a minimum of 50 on the AFQT.
Additionally, high school dropouts must be at least 19 years of age, and show a proven
work history.
JROTC participation, the variable of interest is hypothesized to reduce attrition.
Not withstanding the specified purpose of the JROTC program, we assumed that
participants who self-selected into the program would have a positive taste for the
military; thus, remain in active service.

104
The effects of service of accession were expected to vary across cohorts. Ones
liking for a particular type of job and work environment would dictate the choice of
service chosen. All of the services were statistically significant and positively impacted
attrition. It was surprising that enlisted personnel who chose the Marine Corp were not
more inclined to attrite. As mentioned previously, the Marine Corp is a challenging
career choice and after an initial enlistment some may not be inclined to sign on for an
additional tour. It is likely that enlisted personnel who incur an initial obligation of 5 or 6
years would be less likely to attrite. We hypothesized that enlisted personnel who
accepted an initial obligation of more than 5 years are somewhat committed to their
decision to serve and will be less likely to attrite.
Previous research has indicated that blacks and minorities are more prone to the
military and less likely to attrite. The reasons are varied and it has not been definitively
proven; however, the opportunities for education and personal growth without many of
the obstacles that exist in the civilian sector are what draw blacks and minorities to
military service. Additionally, the south has always had the largest number of Army
enlistees and that is attributed to the overwhelming Army presence in the South. There
are Army bases in over 26 of the states the highest concentration is in the Southern
region. Blacks and minorities tend to migrate to where the opportunities for growth and
advancement are residing and the military has been a stepping stone for many.
AFQT Mental category is a predictor of ones aptitude and skill ability. We
hypothesized that enlisted personnel who fall into the top two AFQT categories (CATI,
II) would be more likely to leave the military because they would typically qualify for the
more technical jobs; hence, would gain the training and knowledge on behalf of the
military and proceed to the civilian sector where the average wage is proportionally
higher. This was the effect we encountered. Enlisted personnel in the top two AFQT
categories were found to have a higher probability of attrition. Prior enlisted personnel
were also found to have a greater propensity to remain in the military. That can be
explained by their decision to return to military after some specified period of times.
Many enlisted persons leave the military after their initial enlistment only to find
themselves unprepared to function in the civilian sector. If an enlisted person leaves the

105
military they can reenter prior to expiration of 180 days. Typically, there is no loss of
paygrade; however, job availability may dictate military occupational specialty (MOS)
received.
2. Interpretation of Hazard Ratios The interpretation of hazard ratios requires careful consideration. The output
included p-values for the tests of the null hypotheses that each regression coefficient is
zero, or, equivalently, that each hazard ratio is one. That all hazard ratios are apparently
close to one is a matter of scale. Hence, any value less than one represents a decrease in
the hazard, and any value greater than one represents an increase in hazard.
a. JROTC Graduates
The variable of interest, JROTC, indicates that holding all other variables
constant, JROTC participants have a smaller hazard ratio than non-JROTC participants.
In fact, the hazard ratio can be interpreted to indicate that JROTC participants have about
91 percent of the hazard of non-JROTC participants, which is highly significant at the .01
level compared against the base case, which was non-JROTC participant. JROTC
participants’ survival rate is greater than that of non-JROTC participants. All of the
covariates in the model were found to be influential in affecting the survival of enlisted
personnel with the exception of the three previously mentioned.
b. Military Experience All of the variables for service of accession were found to be highly
significant (<0.01 level) when compared against the base case which was Army. Enlisted
personnel who join the Navy, as hypothesized, exhibited a hazard just 88 percent of the
hazard for Army enlistees. Personnel who joined the Air Force exhibited a hazard just 84
percent of the hazard for Army enlistees, ceteris paribus. Additionally, Marine enlisted
personnel exhibit a hazard just 80 percent of the hazard for that of Army enlisted
personnel indicating that their survival rate is higher than Army enlistees.
The most influential of the length of contract variables was term of
enlistment (6 yrs). Enlisted personnel who signed an initial contract of 6 years when
compared against the base case, which is 4 year term of enlistment , exhibited a hazard

106
just 92 percent of the hazard for 4 year contract holders, ceteris paribus. Conversely, 3
year contract holders exhibit a hazard 115 percent that of 4 year contract holders
indicating that their survival rate is much lower than 4 year contract holders.
The AFQT Mental Categories were found to be highly significant when
compared against the base case which was Mental Category IIIA. Enlisted personnel in
Mental Category IIIB, as hypothesized, exhibited a hazard just 94 percent of the hazard
for CAT IIIA personnel, ceteris paribus. On the other hand, CAT I personnel exhibit
hazards 104 percent that of CAT IIIA personnel indicating that their survival rate is much
lower than CAT IIIA personnel.
The model indicates that, ceteris paribus, prior service enlisted personnel
have a smaller hazard ratio than non-prior service personnel. Consequently, the hazard
ratio can be interpreted to indicate that prior service personnel have about 97 percent of
the hazard of the non-prior enlisted personnel, which is significant at the 0.10 level. Prior
enlisted personnel have a higher survival rate than non-prior enlisted personnel.
The variable entry paygrade was found to be highly significant when
compared against the base case which was E1. None of the entry paygrades had a
dominant impact on survival. Enlisted personnel who entered at paygrade E2 exhibited
hazards 104 percent that of E1 personnel indicating that their survival rate is much lower
than E1 personnel.
The variable highest paygrade was statistically significant. The highest
paygrade that had the most significant impact on attrition was E9. Enlisted personnel
who acquired the rank of E9, as hypothesized, exhibited a hazard just 62 percent of the
hazard of E1 personnel, ceteris paribus. Conversely, E7 personnel exhibit hazards 161
that of E1 personnel indicating that their survival rate is much lower than E1 personnel.
Typically, once enlisted personnel reach paygrade E7 they are usually eligible for
retirement and this would explain the low survival rate for personnel with highest
paygrade E7.
The fiscal year that an enlisted person joins the military has been found to
impact their survival rate. All cohorts were found to be highly significant (<.01 level)
107
when compared against the base case which was FY80. Enlisted personnel who joined in
FY97, FY98, FY99 and FY00, exhibited a hazard 87 percent, 84 percent, 77 percent and
73 percent, prospectively for FY80 enlisted personnel, ceteris paribus.
c. Demographics The interpretation of the hazard rate for age at enlistment, which was also
significant at the .01 level, is slightly different from that for binary variables. The hazard
ratio of 1.010 indicates that a one-year increase in age increases the hazard by 100(1-
1.010) percent, or -1.0 percent. Thus, if all else is held constant, the difference in hazard
between a 22 and 20 year old enlisted person would be (-)2 percent increase for the 22
year old. The size of the hazard for the variable age was unexpected and not as
hypothesized. We assumed that as an enlisted persons age increased their survival rate
would increase.
As hypothesized, the variables for minorities were found to be significant
at the .01 level. The variable Black was found to be the most influential affecting the
survival of enlisted personnel. The variable Hispanic was also found to have a profound
affect on the survival rate of enlisted personnel, when compared against the base case
which was white. Black enlisted personnel, as hypothesized, exhibited a hazard just 78
percent of the hazard for white enlisted personnel, ceteris paribus. In addition, Hispanic
enlisted personnel exhibited a hazard just 88 percent of the hazard for white enlisted
personnel, ceteris paribus. Hence, Black and Hispanic enlisted personnel have a higher
survival rate than white enlisted personnel.
Marital status, as hypothesized, was found to be significant at all levels.
Enlisted personnel who are single with children exhibit a hazard 104 percent that of
personnel who are single with no children, which is the base case. Ceteris paribus,
personnel who are single with children have a lower survival rate than personnel who are
single without children. These results imply that enlisted personnel who are single with
children, married and or married with children have a lower survival rate than enlisted
personnel who are single with no children.
One significant effect was related to gender. The model indicates that,
ceteris paribus, female enlisted personnel have a larger hazard ratio than male enlisted

108
personnel. The hazard can be interpreted to indicate that female enlisted personnel have
about 116 percent of the hazard of male enlisted personnel, which is significant at all
levels. As hypothesized, the survival rate for female enlisted personnel is lower than that
of their male counterparts.
The education variables were all found to be significant at the .01 level
with the exception of GED when compared to the base case high school diploma
graduate. As hypothesized, enlisted personnel with some college, college grads, or GED-
holders all have low survival rates. Personnel with college degrees exhibited a hazard 147
percent of the hazard for high school diploma graduates, ceteris paribus. The survival
rate of enlisted personnel who are college graduates is lower than that of enlisted
personnel who are high school diploma graduates.
E. SUMMARY OF RESULTS
There was not a significant difference between the outcomes of the logit and
probit models. The covariate of interest, JROTC was found to have a positive impact on
the log odds of reenlisting. Descriptive statistics reported that of the 4,992, 962
observations analyzed, 1,985,986 or 39.78% reenlisted and 3,006,976 or 60.22% of the
overall population did not reenlist. Of those enlisted personnel that did reenlist 61,448 or
3.09% were JROTC participants. Additionally, JROTC was found to increase the logs
odds of reenlisting by .168 (a small margin). This finding leads one to conclude that
JROTC participants do not make up a significant segment of the enlisted ranks in the
armed forces; furthermore, the fact that they participated in JROTC does not necessarily
mean they will reenlist.
There are possible implications from these findings because millions of dollars
are spent annually to establish new JROTC units across the country. If JROTC is a
program devised to build youth with discipline and high moral caliber than the program
should continue to be funded and additional monies allocated. If the underline purpose of
JROTC is build an arsenal of young men and women trained and ready to respond to the
nation at a moments notice than the plan should be re-evaluated. There is a
misinterpretation that JROTC builds the future military force by introducing military

109
theory in the countries highs schools. When in all actuality, JROTC is merely a club or
organization for youth in rural and urban areas to grow and learn to be responsible
citizens.
The results indicate that JROTC participation has a small impact on survival rates
and there are other variables that have a greater impact. Nevertheless, JROTC
participation does impact attrition of enlisted personnel. JROTC participants have a
higher survival rate than non-JROTC participants. The variable that had the greatest
impact on survival rates was highest paygrade. As a performance indicator, highest
paygrade can be used to measure sustained superior performance and military aptitude.
The military experience variable that had the most significant impact on survival
rates, when compared to the base case (Army) is service of accession (Air Force). The
Air Force has a long reputation of being the service of choice for many youth, who desire
technical training, well maintained bases, and a civilianized culture. When compared to
the Army, which is known for teamwork, technical expertise and decision making,
enlisted personnel have a lower hazard ratio in the Air Force.
The demographic variable that had the greatest impact on survival rate is enlisted
personnel who are black when compared to the base case which is enlisted personnel who
are white. This is an important observation because the number of JROTC participants
that are black has increased two-fold over the past ten years. (Refer to Table 15). Enlisted
personnel who are Hispanic were also found to have high survival rates. As hypothesized,
females have low survival rates due in part to the smaller number of females that enlist in
the military. When compared to the base case, enlisted personnel who are married with
or without children had lower survival rates than enlisted personnel who are single with
no children. This outcome was contrary to what we hypothesized. We assumed that
married personnel have more responsibility and thus remain in the military as a means of
stability. In addition, the military has a comprehensive health insurance program, which
is typically a tremendous expense in the civilian sector. Lastly, enlisted personnel who
are high school diploma graduates have a higher survival rate than non-high school
diploma graduates to include GED recipients.

110
Table 25 below summarizes the coefficients, hazard ratios and partial effects
derived from the model estimates. All estimation methods employed yield statistically
significant results for JROTC.
Table 25. Summary of JROTC coefficients
LOGIT Odds Ratios
PROBIT Partial Effects
Hazard Ratios
JROTC 0.168 0.035 0.914 Standard Error (0.008)*** (0.002)*** (0.003)***
111
VIII. CONCLUSION
A. INTRODUCTION
Our primary research objective is to conduct an empirical analysis of the impact
of JROTC participation on military enlistment, retention and reenlistment. The High
School & Beyond (HSB) survey data provides us with individual level data on JROTC
participation and military enlistment decisions. Using single equation probit and logit
models, we find that JROTC participation increase youths’ probability of enlisting in the
military. On the other hand, there is a possibility that the high school students self-select
into the JROTC participation based on certain characteristics but have no bearing on the
enlistment decision. Using two methods, two-stage least squares (2SLS) and bivariate
probit equation, we find that JROTC participation has no impact on the enlistment
decision.
From the Defense Manpower Data Centre (DMDC) enlisted personnel cohort
data, we find that enlisted personnel who graduated from JROTC have a positive
influence on the reenlistment decision. Using survival analysis on the survival rate of
JROTC graduates and non-JROTC graduates tend to stay longer than non-JROTC
graduates.
B. IMPLICATIONS OF STUDY
Our thesis research is a departure from previous studies that look at JROTC
military outcomes in only general descriptive terms. Our study looked at individual-level
data from the 1980 HS&B study and enlisted personnel cohort data, and conduct
empirical analysis of the impact of JROTC participation on military enlistment, retention
and reenlistment. The study should be of interest to many, not least that the funding for
JROTC programs in high schools comes from the Defense budget in which insofar, the
effectiveness and efficacy of the JROTC program with respect to the military has not
been examined.
First, the multivariate analysis of JROTC influence on propensity to enlist using
the 1980 HS&B data suggest that the JROTC program, at least in the 1980s, supports the
112
claim that it is a “thinly disguised recruiting tool” before taking into consideration self-
selection into the JROTC program itself. In our treatment of JROTC participation as an
endogenous variable, we use instrumental variables that attempt to characterize “at-risk”
youths like extra help in schoolwork, disciplinary problems and low socio-economic
status, which are related with the decision to participate in the JROTC program. The
results then show that JROTC has no impact on recruitment numbers. Therefore,
depending on the specification model chosen, the benefits of funding the JROTC
program by DoD could or could not spillover to recruitment numbers.
On the other hand, our findings on JROTC military retention outcomes suggest
that participants in the JROTC program are more likely to remain in the military and
reenlist once they chose the military as a career. The JROTC program with its objectives
of preparing the students for leadership roles while making them aware of their rights,
responsibilities, and privileges as American citizens seem to make them better able to
adapt to military service without difficulty. Moreover, JROTC participants are
introduced to military training and ideology so they are fully aware prior to joining the
military what is required and what the military has to offer in the way of benefits and
opportunities. We would expect that JROTC participants who join the military would
chose to continue their service because of the opportunities and benefits allotted to them.
Therefore, policy-makers might find it worthwhile to actively target JROTC
cadets for enlistment because in the long run, it pays off in terms of higher first-term
completion rates. This translates to sustaining a given end-strength with smaller number
of accession which results in cost savings in the form of enlistment bonuses and training
costs. Policy-makers could then utilize the JROTC program as a recruitment tool by
bringing in recruiters to give guest lectures or have the instructors providing an overview
of the various recruitment websites and other enlistment information. If the JROTC
cadets do not wish to join the military after high school but opt to go to college,
information on ROTC scholarships or other military educational incentives could also
attract them to enlist in the military.
113
C. LIMITATIONS OF STUDY
Our study acknowledges the datedness of the 1980 HS&B data. Moreover, it is a
highly stratified sample and the number of JROTC participants made up approximately
three percent of the population. The information that we have also does not allow us to
differentiate between JROTC participants who choose not to enlist in the military after
high school or those who would like to enlist but not accepted by the military. The
choice of the instrumental variables (IV) is also subjective and good IVs are hard to find.
Ideally, data from JROTC units that track high school students and post-high school
employment decisions will give us better information.
Our reenlistment and survival analysis models did not factor in labor statistics
such as economic conditions and unemployment rates. Instead, we attempt to capture
changes in the economic conditions over the past twenty years using the cohort year
dummy variables. The inclusion of the actual statistics might help explain our models
better. We also would like to model the promotion rate of the enlisted personnel but we
are not able to with the format of the enlisted personnel cohort data that DMDC has
provided to us.
D. FUTURE SCOPE
We see our research as the first step toward more comprehensive studies
pertaining to JROTC military outcomes. One possible extension of our study is to
monetize our results for a cost-benefit analysis of the JROTC program vis-à-vis other
recruitment programs. Quantifying the net benefits and costs of the JROTC program will
allow policy-makers to make more informed decisions with regard to the future direction
of the JROTC program
We also feel that the analysis of the impact of JROTC participation on the
military could be further strengthened with data collected from JROTC units and
matching them to DMDC enlistment data. At the present moment, services do not track
the JROTC cadets and the numbers who subsequently choose to enter the military. We
114
feel that this is a worthwhile pursuit to allow policy-makers a better feel of the direct
impact of JROTC participation on accession rates.
E. CONCLUSION
The term “Junior Reserve Officer’s Training Corps (JROTC)” may be appropriate
in its early days where the objective is to develop a reserve force or a military training
corps. Today, JROTC cadets do not have the obligation to serve in the military once they
graduate from high school. The primary benefits of the JROTC program are similar to
that of other non-military youth programs that teach good values and make a better
person out of the participants. Still, the DoD continues to fund the JROTC program by
providing the necessary teaching instructors, textbooks, equipment and uniforms.
With tight budget figures in the recent years, there has never been a greater need
to justify every single defense dollar spent. Our research findings on the influence of
JROTC participation on propensity to enlist, retention rates and attrition is the first step
toward justifying the existence and continued funding of the JROTC program from the
defense budget.
115
LIST OF REFERENCES
1. http://gateway.usarmyjrotc.com/http://portal.usarmyjrotc.com/jrotc/dt/estunit.htm June 2004 2. http://www.afoats.af.mil/AFJROTC/default.htm, June 2004 3. https://www.njrotc.navy.mil/, June 2004 4. http://www.tecom.usmc.mil/jrotc/curriculum.cfm, June 2004 5. Aasch, B., and Dertouzos, J., Educational Benefits Versus Enlistment Bonuses: A
Comparison of Recruiting Options, RAND Corp, MR-302-OSD) Santa, Monica, CA 1994.
6. America Friends Service Committee Online, Making Soldiers in the Public
Schools: An Analysis of the Army JROTC Curriculum, April 1995, p3. www.afsc.org/youthmil/jrotc/msitps.pdf, June 2004
7. Bachman, J., and Blair, J.D., Who Chooses Military Service? Correlates of
Propensity and Enlistment in the U.S Armed Forces, Military Psychology. Vol.12. No.1., 2000.
8. Bachman, J., and Blair, J.D., Citizen Force or Career Force? Implications of
Ideology in the All-Volunteer Army, Armed Forces and Society. Vol. 2, No. 1, November 1985, pp 81-96.
9. Balley, Hodak, Sheppard and Hassen, Technical Report 92-015, Benefits Analysis
of the Naval Junior Reserve Officers Training Corps, Naval Training Systems Center, Orlando, FL, June 1992.
10. Binkin, America’s Volunteer Military: Progress and Prospects, The Brookings
Institution, Washington, DC 1984. 11. Centre for Strategic & International Studies (CSIS), Junior Reserve Officers’
Training Corps: Contributions to America’s Communities: Final Report of the CSIS Political-Military Studies Project on the JROTC (CSIS May 1999), 41
12. Cooke, W., and A. Quester, “What Characterizes Successful Enlistees in the All-
Volunteer Force: A Study of Male Recruits in the U.S Navy,” Social Science Quarterly, volume 73, Number 2, June 1992.

116
13. Coumbe, A.T. & Harford, L.S, “US Army Cadet Command: The 10 year history”,
US Army Cadet Command, 1996: 261. 14. Defense Manpower Data Center, Youth Tracking Study, 1998 Propensity and
Advertising Report DMDC Report 2000-02, July 2000. 15. Department of the Army FY2004/2005 Biennial Budget Estimates: Operation and
Maintenance, February 2003: 335-1. 16. Department of the Air Force FY2004/2005 Biennial Budget Estimates: Operation
and Maintenance, February 2003: 625. 17. Department of the Navy FY2004/2005 Biennial Budget Estimates: Operation and
Maintenance, February 2003: Exhibit OP-5. 18. DeMoulin, D.F., & Ritter, D.L, Comparison of democratic maturity and self-
fulfillment between high school AFJROTC students and upper division college students, Education, 120(3), 2000: 410-415
19. Enlistment Propensity and Conversion of Potential Enlisted Supply, Santa
Monica, CA: RAND, 1996 20. Elliot, M., Hanser. L., and Gilroy, C. Evidence of Positive Student Outcomes in
JROTC Career Academies, RAND, Santa Monica, CA, 2000 21. Gilroy, C. Army Manpower Economics, West View Press, Boulder and London,
1986 22. Gilroy, C. Phillips, R.L., and Blair, J., The All Volunteer Army Fifteen Years
Later, Armed Forces and Society, Vol. 16, No 3, Spring 1990, pp 329-350. 23. Hansen, M. J. & Wenger, “Why Do Pay Elasticity Differ?” C.N.A Corporation,
Alexandria, VA, March 2002. 24. Hosek, James R., Christine Peterson, Enlistment Decisions of Young Men, Santa
Monica, CA, RAND, R-3238-FMP, 1985 25. Hosek, James R., Christine Peterson, Serving Her Country: An Analysis of
Women’s Enlistment, Santa Monica, CA, RAND, R-3853-FMP, 1985 26. Kilburn, Rebecca, Jacob A. Klerman, Enlistment Decisions in the 1990s:
Evidence from Individual-Level Data, RAND, MR944-OSD/A, 1999.
117
27. McFadden, D., “Econometric Analysis of Qualitative Response Models” in Zvi Griliches and M. Intrilligator (eds.), Handbook of Econometrics, Vol. 2, Amsterdam, North Holland, 1983.
28. Mackin, C., and K. Darling, “Economic Analysis of Proposed Surface Warfare
Officer Career Incentive Pay,” Bureau of Naval Personnel, Washington, DC, September 1996.
29. Martin, Federico E. Garcia, Ernest Joy and David L. Reese, Effectiveness of the
Voluntary Education Program, CNA, Alexandria, VA (2002) 30. Orvis, Bruce R. & Sastry, N., Military Recruiting Outlook: Recent Trends in
Enlistment Propensity and Conversion of Potential Enlisted Supply, RAND Corporation, 1996: 51-53.
31. Orvis, Bruce R., Martin Gahart, Alvin K. Ludwig, with Karl F. Schutz, Validity
and Usefulness of Enlistment Intention Information, RAND, Santa Monica, CA: R-3775FMP, 1992.
32. Quester, A and A. Adedeji, “Reenlisting in the Marine Corps: The Impact of
Bonuses, Grade, and Dependency Status,” C.N.A Corporation, Alexandria, VA, July 1991
33. Reiger, R.C., & DeMoulin, D.F., Comparing Democratic Maturity Test Scores
between High School ARMY JROTC students and other students, Education, 121(1), 2000: 43-45
34. STATA User’s Guide, STATA Corporation, College Station, Texas, 2003 35. Taylor, W.J., Junior Officers’ Training Corps Contributing to America’s
Communities: Final report of the CSIS Political-Military studies project on the JROTC, Center for Strategic and International Studies, Washington, DC, (1999).
36. U.S. Marine Corps, Junior Reserve Officers’ Training Corps Program Pamphlet,
HQ Marine Corps Training Command, Quantico, Virginia, 1989. 37. Ward, M. and H. Tan, The Retention of High Quality Personnel in the U.S Armed
Forces, Rand Corporation, Santa Monica, CA 1985. 38. Warner, J., and B. Asch, “The Economics of Military Manpower,” Handbook of
Defense Economics, Volume 1, Elsevier Science, BV, 1995. 39. Warner, J. T., Military Recruiting Programs during the 1980s: Their Success and
Policy Issues, Contemporary Policy Issues, Vol. VIII, October 1990, pp 47-67.

118
40. Woolridge, Jeffrey M., Introductory Econometrics – A Modern Approach, 2nd Edition, 2003.

119
APPENDICES
Appendix A. Summary of Variables and Descriptions for HS&B Data
Variables Description Type
Dependent Variable Enlisted 1 if enlisted in any of the survey years, 0 if otherwise Binary
Covariates JROTC 1 if participated in JROTC for sophomores in 1980 and 1982,
seniors in 1980, 0 otherwise Binary
Demographics Black Composite race variable, 1 if black , 0 if otherwise Binary
White Composite race variable, 1 if white, 0 if otherwise Binary
Native Composite race variable, 1 if native, 0 if otherwise Binary
Hispanic Composite race variable, 1 if Hispanic, 0 if otherwise Binary
Asian Composite race variable, base case, 1 if Asian, 0 if otherwise Binary
Male Composite race variable, 1 if male, 0 if otherwise Binary
Female Composite race variable, base case, 1 if female, 0 if otherwise Binary
Not Married 1 if never married in all survey years, 0 if otherwise Binary
Number of Children
Number of children in 1992 for sophomores and 1986 for seniors Interval
Age Age of participants in 1992 for sophomores and 1986 for seniors Interval
Total income Total income earned by the sophomores and seniors after high
school. Interval
Educational Expectations and Ability to Afford
College
Poor Academic 1 if respondents’ grades are mostly C’s , test composite quartile falls in the C’s range, or have repeated grade, 0 otherwise
Binary
Completed HS 1 if completed high school, 0 otherwise Binary
Ability to Afford College
1 if able to afford college, 0 otherwise Binary
Parents Support 1 if receive parental support in the form of money, car, food,
lodging, medical care or clothing, 0 otherwise Binary
College 1 if highest expected education is college, 0 if otherwise Binary

120
Expectations Military Interest
Military Interest 1 if aspiration at age 30 is to be in the military, seek military information, talk to military recruiter, post high school plan is to be in the military or have taken the ASVAB test, 0 if otherwise
Binary
Family Background Parents Influence Military
1 if parents influence respondents’ post high school plans to join the military, 0 if otherwise
Binary
Parent in the Military
1 if father’s or mother’s occupation is military, 0 if otherwise Binary
Parents with less than High School
1 if parents have less than high school education, 0 if otherwise Binary
Parents with High School
1 if parents have high school education, 0 if otherwise Binary
Parents with College
Base case, 1 if parents have at least college education, 0 if otherwise
Binary
Number of Siblings
Number of siblings in 1992 for sophomores and 1986 for seniors Interval
Peer Influence Friends Influence Military
1 if friends influence respondents’ post high school plans to join the military, 0 if otherwise
Binary
Friends Influence College
1 if friends influence respondents’ post high school plans to go to college, 0 if otherwise
Binary
Census Region
New England 1 if New England, 0 if otherwise Binary
Mid Atlantic 1 if Mid Atlantic, 0 if otherwise Binary
South Atlantic 1 if South Atlantic, 0 if otherwise Binary
East-south Central 1 if East-south Central, 0 if otherwise Binary
West-south Central
1 if West-south Central, 0 if otherwise Binary
East-north Central 1 if East-north Central, 0 if otherwise Binary
West-north Central
1 if West-north Central, 0 if otherwise Binary
Mountain 1 if Mountain, 0 if otherwise Binary
Pacific Base case, 1 if Pacific, 0 if otherwise Binary
Urbanity
Suburban 1 if suburban, 0 otherwise Binary
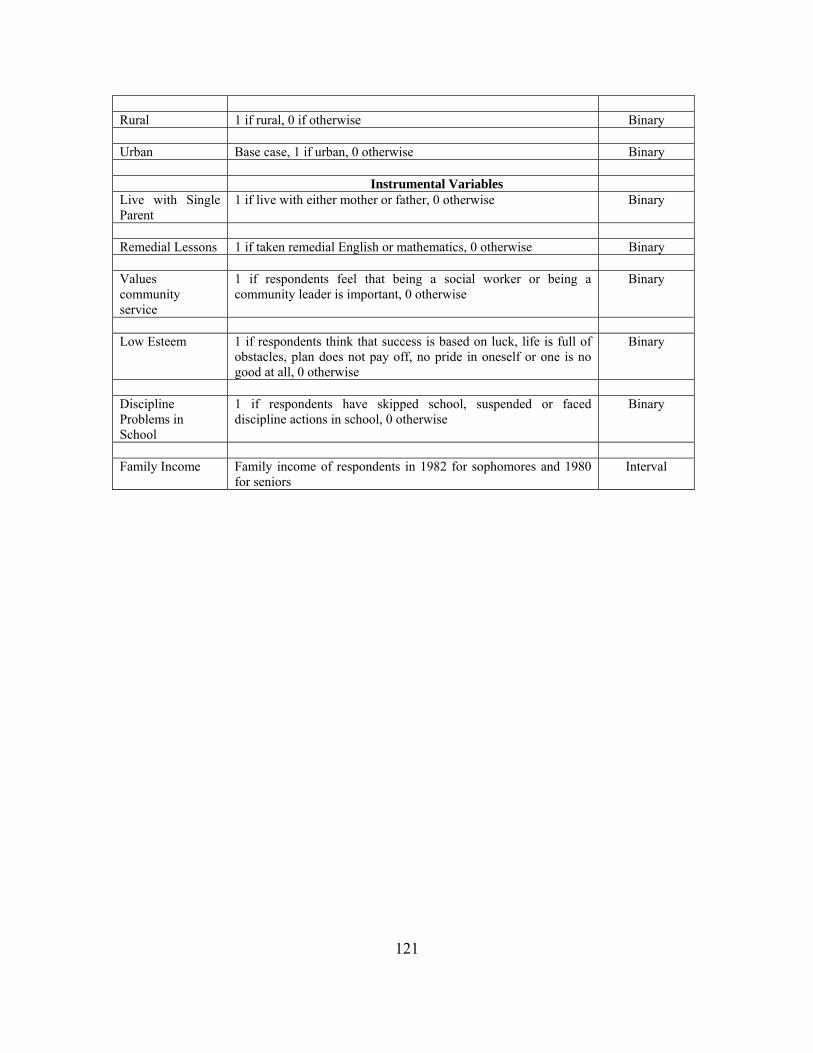
121
Rural 1 if rural, 0 if otherwise Binary
Urban Base case, 1 if urban, 0 otherwise Binary
Instrumental Variables
Live with Single Parent
1 if live with either mother or father, 0 otherwise Binary
Remedial Lessons 1 if taken remedial English or mathematics, 0 otherwise Binary
Values community service
1 if respondents feel that being a social worker or being a community leader is important, 0 otherwise
Binary
Low Esteem 1 if respondents think that success is based on luck, life is full of
obstacles, plan does not pay off, no pride in oneself or one is no good at all, 0 otherwise
Binary
Discipline Problems in School
1 if respondents have skipped school, suspended or faced discipline actions in school, 0 otherwise
Binary
Family Income Family income of respondents in 1982 for sophomores and 1980
for seniors Interval

122
Appendix B Summary of Variables and Descriptions for DMDC Data
Variable Description Type
JROTC 1 if JROTC participant, 0 if non-JROTC participant Binary Demographics Age Age at enlistment Interval Female 1 if female, 0 if male Binary Black 1 if black, 0 if non-black Binary Hispanic 1 if Hispanic, 0 if non-Hispanic Binary Marstat – SWC 1 if Single with Children, 0 if otherwise Binary Marstat- MN C 1 if Married with no Children, 0 if otherwise Binary Marstat – MWC 1 if Married with Children, 0 if otherwise Binary NHSD 1 if non-High School Grad, 0 if otherwise Binary HSDG 1 if High School Grad, 0 if otherwise Binary SC 1 if Some College, 0 if otherwise Binary Coll 1 if College Graduate, 0 if otherwise Binary GED 1 if GED, 0 if otherwise Binary Military Experience TOE 1 yr 1 if Term of Enlistment 1 yr, 0 if otherwise Binary TOE 2 yr 1 if Term of Enlistment 2 yr, 0 if otherwise Binary TOE 3 yr 1 if Term of Enlistment 3 yr, 0 if otherwise Binary TOE 4yr 1 if Term of Enlistment 4 yr, 0 if otherwise Binary TOE 5 yr 1 if Term of Enlistment 5 yr, 0 if otherwise Binary TOE 6 yr 1 if Term of Enlistment 6 yr, 0 if otherwise Binary AFQT CAT I 1 if AFQT Category I, 0 if otherwise Binary AFQT CAT II 1 if AFQT Category II, 0 if otherwise Binary AFQT CAT III 1 if AFQT Category III, 0 if otherwise Binary AFQT CAT IV 1 if AFQT Category IV, 0 if otherwise Binary AFQT CAT V 1 if AFQT Category V, 0 if otherwise Binary SVCOA NAVY 1 if Service of Accession Navy, 0 if otherwise Binary SVCOA AIR FORCE 1 if Service of Accession Air Force, 0 if otherwise Binary SVCOA MARINE CORPS 1 if Service of Accession Marine Corps, 0 if otherwise Binary SVCOA ARMY 1 if Service of Accession Army, 0 if otherwise Binary Prior 1 if prior enlisted, 0 if otherwise Binary Non-Prior 1 if non-prior enlisted, 0 if otherwise Binary Entry paygrd E1 1 if Entry paygrade E1, 0 if otherwise Binary Entry paygrd E2 1 if Entry paygrade E2, 0 if otherwise Binary Entry paygrd E3 1 if Entry paygrade E3, 0 if otherwise Binary Entry paygrd E4 1 if Entry paygrade E4, 0 if otherwise Binary Entry paygrd E5 1 if Entry paygrade E5, 0 if otherwise Binary FY80 1 if Enlisted in FY80, 0 if otherwise Binary FY81 1 if Enlisted in FY81, 0 if otherwise Binary FY82 1 if Enlisted in FY82, 0 if otherwise Binary FY83 1 if Enlisted in FY83, 0 if otherwise Binary FY84 1 if Enlisted in FY84, 0 if otherwise Binary FY85 1 if Enlisted in FY85, 0 if otherwise Binary FY86 1 if Enlisted in FY86, 0 if otherwise Binary FY88 1 if Enlisted in FY88, 0 if otherwise Binary FY89 1 if Enlisted in FY89, 0 if otherwise Binary FY90 1 if Enlisted in FY90, 0 if otherwise Binary FY91 1 if Enlisted in FY91, 0 if otherwise Binary
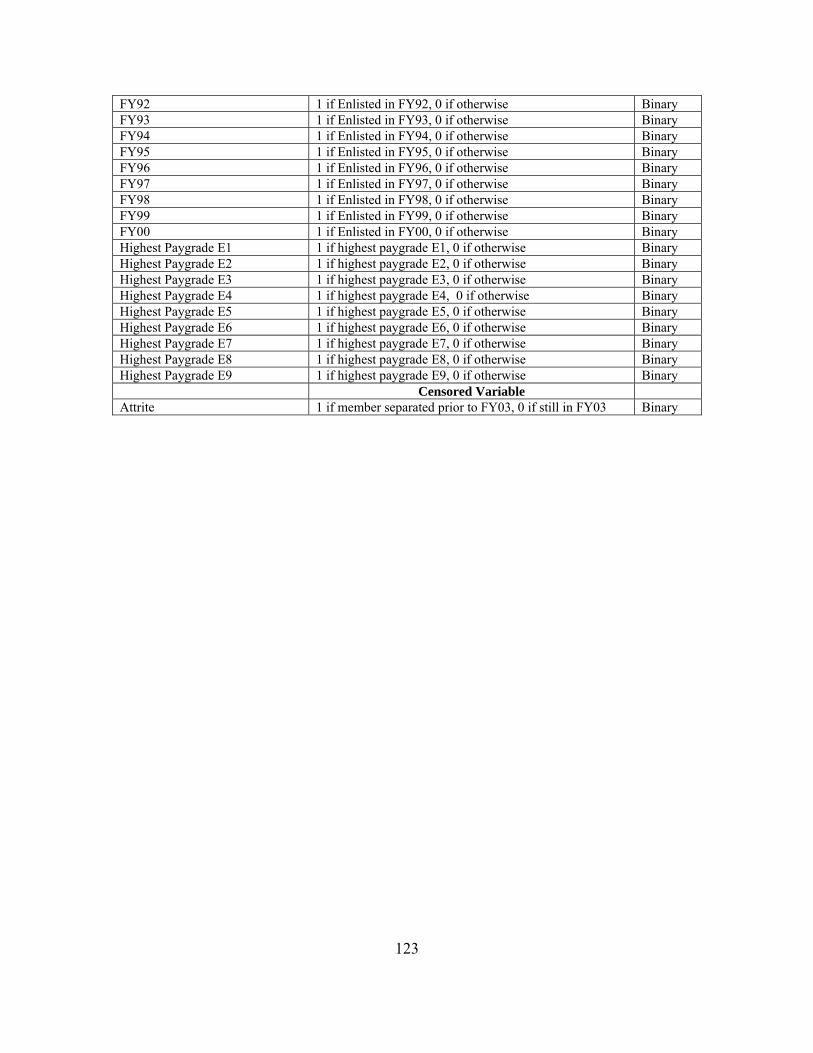
123
FY92 1 if Enlisted in FY92, 0 if otherwise Binary FY93 1 if Enlisted in FY93, 0 if otherwise Binary FY94 1 if Enlisted in FY94, 0 if otherwise Binary FY95 1 if Enlisted in FY95, 0 if otherwise Binary FY96 1 if Enlisted in FY96, 0 if otherwise Binary FY97 1 if Enlisted in FY97, 0 if otherwise Binary FY98 1 if Enlisted in FY98, 0 if otherwise Binary FY99 1 if Enlisted in FY99, 0 if otherwise Binary FY00 1 if Enlisted in FY00, 0 if otherwise Binary Highest Paygrade E1 1 if highest paygrade E1, 0 if otherwise Binary Highest Paygrade E2 1 if highest paygrade E2, 0 if otherwise Binary Highest Paygrade E3 1 if highest paygrade E3, 0 if otherwise Binary Highest Paygrade E4 1 if highest paygrade E4, 0 if otherwise Binary Highest Paygrade E5 1 if highest paygrade E5, 0 if otherwise Binary Highest Paygrade E6 1 if highest paygrade E6, 0 if otherwise Binary Highest Paygrade E7 1 if highest paygrade E7, 0 if otherwise Binary Highest Paygrade E8 1 if highest paygrade E8, 0 if otherwise Binary Highest Paygrade E9 1 if highest paygrade E9, 0 if otherwise Binary Censored Variable Attrite 1 if member separated prior to FY03, 0 if still in FY03 Binary

124
THIS PAGE INTENTIONALLY BLANK

125
INITIAL DISTRIBUTION LIST
1. Defense Technical Information Center Ft. Belvoir, Virginia
2. Dudley Knox Library Naval Postgraduate School Monterey, California
3. NETC Naval Education and Training Professional Development and Technology Center Pensacola, Florida
4. CNRC Navy Recruiting Command Millington, Tennessee
5. CDR Mark Watson Citizenship Development NJROTC OPS Pensacola, Florida
6. LCDR Mike Bernard NSTC Operations Analysis Officer (N513) Pensacola, Florida
7. Professor Robert N. McNab Naval Postgraduate School Monterey, California
8. Assistant Professor Elda Pema
Naval Postgraduate School Monterey, California
9. Director Manpower Defense Management Group, Manpower Division Ministry of Defense, Singapore