naval postgraduate school - apps.dtic.mil · 4. title and subtitle the carrier readiness team —...
TRANSCRIPT
NAVAL
POSTGRADUATE SCHOOL
MONTEREY, CALIFORNIA
THESIS
Approved for public release; distribution is unlimited
THE CARRIER READINESS TEAM — REALIZING THE VISION OF THE NAVAL AVIATION
ENTERPRISE
by
Carroll F. LeFon, Jr.
March 2009
Thesis Advisor: Charles Calvano Second Reader: Ben Roberts

THIS PAGE INTENTIONALLY LEFT BLANK

i
REPORT DOCUMENTATION PAGE Form Approved OMB No. 0704-0188 Public reporting burden for this collection of information is estimated to average 1 hour per response, including the time for reviewing instruction, searching existing data sources, gathering and maintaining the data needed, and completing and reviewing the collection of information. Send comments regarding this burden estimate or any other aspect of this collection of information, including suggestions for reducing this burden, to Washington headquarters Services, Directorate for Information Operations and Reports, 1215 Jefferson Davis Highway, Suite 1204, Arlington, VA 22202-4302, and to the Office of Management and Budget, Paperwork Reduction Project (0704-0188) Washington DC 20503. 1. AGENCY USE ONLY (Leave blank)
2. REPORT DATE March 2009
3. REPORT TYPE AND DATES COVERED Master’s Thesis
4. TITLE AND SUBTITLE The Carrier Readiness Team — Realizing the Vision of the Naval Aviation Enterprise 6. AUTHOR(S) Carroll F. LeFon, Jr.
5. FUNDING NUMBERS
7. PERFORMING ORGANIZATION NAME(S) AND ADDRESS(ES) Naval Postgraduate School Monterey, CA 93943-5000
8. PERFORMING ORGANIZATION REPORT NUMBER
9. SPONSORING /MONITORING AGENCY NAME(S) AND ADDRESS(ES) N/A
10. SPONSORING/MONITORING AGENCY REPORT NUMBER
11. SUPPLEMENTARY NOTES The views expressed in this thesis are those of the author and do not reflect the official policy or position of the Department of Defense or the U.S. Government. 12a. DISTRIBUTION / AVAILABILITY STATEMENT Approved for public release; distribution is unlimited
12b. DISTRIBUTION CODE A
13. ABSTRACT (maximum 200 words)
Naval aviation is a large and complex operation, with multiple stakeholders and an ingrained tension between generating combat readiness for current operations and procurement funds for future capabilities. Naval aviation leadership has developed an enterprise approach to managing these often competing requirements that uses modern business process tools under the fundamental principle of alignment. This process showed remarkable results at the factory-level, with production efforts generating significant savings and process efficiencies. From that initial success, the enterprise model was enlarged to overall management of aircraft flight hours, supply parts, personnel and production of replacement airframes. It was further enlarged to encompass the aircraft carrier fleet.
This thesis examines the environment that drove the need to employ an enterprise construct, comparing it to the systems engineering approach used to bring new material solutions from concept of operations, to development and sustainment over the product lifecycles. It analyzes the tools and processes used, the benefits gained and the costs of executing under the enterprise management scheme. It analyzes how the Naval Aviation Enterprise model has been exported to other warfighting enterprises and the Navy generally. It concludes that enterprise alignment using modern business process tools indeed provides naval leadership with powerful leverage to generate combat readiness at reduced cost, now and in the future. It also concludes that further work remains to be done to ensure that an ingrained culture of consumption becomes cost-aware, and that real alignment of missions, functions and tasks must be undertaken to ensure that “quick wins” translate eventually into sustained, strategic change management.
15. NUMBER OF PAGES
145
14. SUBJECT TERMS Systems engineering, business process engineering, Naval Aviation Enterprise, Carrier Readiness Team, enterprise, alignment.
16. PRICE CODE
17. SECURITY CLASSIFICATION OF REPORT
Unclassified
18. SECURITY CLASSIFICATION OF THIS PAGE
Unclassified
19. SECURITY CLASSIFICATION OF ABSTRACT
Unclassified
20. LIMITATION OF ABSTRACT
UU NSN 7540-01-280-5500 Standard Form 298 (Rev. 2-89) Prescribed by ANSI Std. 239-18

ii
THIS PAGE INTENTIONALLY LEFT BLANK

iii
Approved for public release; distribution is unlimited
THE CARRIER READINESS TEAM — REALIZING THE VISION OF THE NAVAL AVIATION ENTERPRISE
Carroll F. LeFon, Jr.
B.S., United States Naval Academy, 1982
Submitted in partial fulfillment of the requirements for the degree of
MASTER OF SCIENCE IN SYSTEMS ENGINEERING MANAGEMENT
from the
NAVAL POSTGRADUATE SCHOOL March 2009
Author: Carroll F. LeFon, Jr.
Approved by: Charles Calvano Thesis Advisor
Ben Roberts, Ph.D. Second Reader
David H. Olwell, Ph.D. Chairman, Department of Systems Engineering

iv
THIS PAGE INTENTIONALLY LEFT BLANK

v
ABSTRACT
Naval aviation is a large and complex operation, with multiple stakeholders and
an ingrained tension between generating combat readiness for current operations and
procurement funds for future capabilities. Naval aviation leadership has developed an
enterprise approach to managing these often competing requirements that uses modern
business process tools under the fundamental principle of alignment. This process
showed remarkable results at the factory-level, with production efforts generating
significant savings and process efficiencies. From that initial success, the enterprise
model was enlarged to overall management of aircraft flight hours, supply parts,
personnel and production of replacement airframes. It was further enlarged to encompass
the aircraft carrier fleet.
This thesis examines the environment that drove the need to employ an enterprise
construct, comparing it to the systems engineering approach used to bring new material
solutions from concept of operations to development and sustainment over the product
lifecycles. It analyzes the tools and processes used, the benefits gained and the costs of
executing under the enterprise management scheme. It analyzes how the Naval Aviation
Enterprise model has been exported to other warfighting enterprises and the Navy
generally. It concludes that enterprise alignment using modern business process tools
indeed provides naval leadership with powerful leverage to generate combat readiness at
reduced cost, now and in the future. It also concludes that further work remains to be
done to ensure that an ingrained culture of consumption becomes cost-aware, and that
real alignment of missions, functions and tasks must be undertaken to ensure that “quick
wins” translate eventually into sustained, strategic change management.
.

vi
THIS PAGE INTENTIONALLY LEFT BLANK

vii
TABLE OF CONTENTS
I. INTRODUCTION........................................................................................................1 A. BACKGROUND ..............................................................................................1 B. RESEARCH QUESTIONS.............................................................................2 C. BENEFITS OF STUDY...................................................................................3 D. SCOPE AND METHODOLOGY ..................................................................3
1. Scope......................................................................................................3 2. Methodology .........................................................................................3
II. THE NAVAL AVIATION ENTERPRISE................................................................5 A. INTRODUCTION............................................................................................5 B. DRIVERS..........................................................................................................7
1. Introduction..........................................................................................7 2. Naval Aviation Pilot and Naval Flight Officer (NFO)
Production ............................................................................................8 3. Intermediate Jet Engine Maintenance at Naval Air Station
(NAS) Lemoore.....................................................................................9 4. Current Readiness .............................................................................10 5. Future Readiness................................................................................12 6. Culture ................................................................................................13
C. CHANGING THE BUSINESS MODEL .....................................................15 1. The Toolset .........................................................................................15
a. Lean .........................................................................................16 b. Six Sigma.................................................................................17 c. Theory of Constraints .............................................................19 d. AIRSpeed ................................................................................19
2. The Naval Aviation Pilot Production Initiative (NAPPI)...............20 3. NAS Lemoore Jet Engine Production..............................................27 4. Balancing Current Readiness and Future Recapitalization ..........30
D. MISSIONS, VISIONS AND TASKS............................................................34 1. Introduction........................................................................................34 2. Mission and Vision.............................................................................36 3. Tasks....................................................................................................38
E. MAPPING STRATEGY TO TASKS — ORGANIZATION, ACTIONS, TOOLS AND METHODS ........................................................39 1. Organization.......................................................................................39 2. Actions, Tools and Methods ..............................................................41
F. CHAPTER SUMMARY................................................................................42
III. THE CARRIER READINESS TEAM ....................................................................45 A. INTRODUCTION..........................................................................................45
1. Background ........................................................................................45 B. ARCHITECTURE.........................................................................................49
1. Developing the Model ........................................................................49

viii
2. Architecture........................................................................................50 C. MISSION, VISION AND TASKS ................................................................51
1. Mission ................................................................................................51 2. Vision and Tasks ................................................................................52
D. MAPPING STRATEGY TO TASK.............................................................54 1. Driving Change ..................................................................................54 2. Measuring Change .............................................................................56
E. RISKS AND BENEFITS ...............................................................................59 1. Keeping the Horse in Front of the Cart ...........................................59
F. CHAPTER SUMMARY................................................................................62 1. Getting It Mostly Right .....................................................................62
IV. CRT COMPONENT PILLARS ...............................................................................63 A. INTRODUCTION..........................................................................................63
1. Execution ............................................................................................63 B. TRAINING AND PERSONNEL READINESS TEAM .............................63
1. Fixing Carrier Training ....................................................................63 C. LIFE-CYCLE MANAGEMENT TEAM.....................................................75
1. Gaining Visibility on Maintenance Costs ........................................75 2. Shipyard Maintenance Costs ............................................................81
D. OPERATIONAL PROCESS IMPROVEMENT AND STANDARDIZATION TEAM.....................................................................86 1. Introduction........................................................................................86 2. Charter................................................................................................87 3. Methodology .......................................................................................88 4. Accomplishments ...............................................................................90
E. CHAPTER SUMMARY................................................................................92 1. Teamwork...........................................................................................92
V. APPLICATION OF STUDY ....................................................................................95 A. INTRODUCTION..........................................................................................95
1. Problem Solving .................................................................................95 B. APPLICABILITY TO OTHER ENTERPRISES.......................................98
1. Extending the Model..........................................................................98 2. The Surface Warfare Enterprise....................................................101
C. CHAPTER SUMMARY..............................................................................108 1. Replication........................................................................................108
VI. CONCLUSION ........................................................................................................111 A. KEY POINTS AND RECOMMENDATIONS .........................................111
1. Key Points .........................................................................................111 2. Recommendations ............................................................................112
B. AREAS TO CONDUCT FURTHER RESEARCH ..................................115 1. Education..........................................................................................115 2. Organizational Realignment ...........................................................116 3. Information Sharing ........................................................................116

ix
LIST OF REFERENCES....................................................................................................117
INITIAL DISTRIBUTION LIST .......................................................................................121

x
THIS PAGE INTENTIONALLY LEFT BLANK

xi
LIST OF FIGURES
Figure 1. Aviator time-to-train ..........................................................................................8 Figure 2. Cost of generating readiness ............................................................................10 Figure 3. The readiness “bathtub”...................................................................................12 Figure 4. Airframes budget vs. acquired .........................................................................13 Figure 5. Flying hour program cost centers ....................................................................14 Figure 6. T-Notch and Son of T-Notch ...........................................................................26 Figure 7. Spaghetti Diagram enhancement from ............................................................28 Figure 8. NAE Conceptual Framework...........................................................................38 Figure 9. NAE Organization ...........................................................................................41 Figure 10. CRT Structure ..................................................................................................51 Figure 11. Aircraft Carrier Cost Drivers ...........................................................................53 Figure 12. The CRT “Big Six”..........................................................................................57 Figure 13. Carriers Ready for Tasking..............................................................................58 Figure 14. Navy Mission Essential Task List Functional Flow ........................................66 Figure 15. NMET Roll-up Example..................................................................................67 Figure 16. Initial CV SHARP Black Box Decomposition ................................................71 Figure 17. Ultimate CV SHARP Architecture ..................................................................72 Figure 18. PRMAR M Ratings..........................................................................................74 Figure 19. Ship RFT — Equipment ..................................................................................79 Figure 20. Carrier Maintenance Schedule Adherence.......................................................82 Figure 21. Maintenance Churn..........................................................................................83 Figure 22. Notional Ranking Matrix (From Allardyce, 2007) ..........................................89 Figure 23. Notional Accessibility Matrix (From Allardyce, 2007)...................................90 Figure 24. The Naval Enterprise .....................................................................................100 Figure 25. SWE Organizational Diagram (From McPherson, 2007)..............................104 Figure 26. The SWE “Bridge Plot” .................................................................................106 Figure 27. CLASSRON Readiness Radar Chart (From Fagnani, 2008).........................106

xii
THIS PAGE INTENTIONALLY LEFT BLANK

xiii
LIST OF TABLES
Table 1. Numbers of Aircraft Procured vs. Budgeted....................................................12

xiv
THIS PAGE INTENTIONALLY LEFT BLANK
xv
LIST OF ACRONYMS AND ABBREVIATIONS
ADCON Administrative Command
AIMD Aviation Intermediate Maintenance Department
ASNRD&A Assistant Secretary of the Navy for Research Development and Acquisition
AVDL Aviation Depot Level Repairable (spare parts)
BOD Board of Directors
CEB CNO Executive Board
CFFC Commander, Fleet Forces Command
CFT Cross-functional Team
CLASSRON ship class squadrons, subordinate to the surface TYCOM — a Type Wing equivalent
CNAF Commander, Naval Air Forces
CNAL Commander, Naval Air Force U.S. Atlantic Fleet, variously AIRLANT
CNAP Commander, Naval Air Force U.S. Pacific Fleet, variously AIRPAC
CNATRA Chief of Naval Aviation Training
CNI Commander, Naval Infrastructure
CNO Chief of Naval Operations
CNSF Commander, Naval Surface Forces, also COMNAVSURFOR
CNSL Commander, Naval Surface Forces Atlantic Fleet
CO Commanding Officer
COCOM Combatant Commander
COH Complex Overhaul
CPF Commander, U.S. Pacific Fleet
CRT Carrier Readiness Team
CY Calendar Year
DASN Deputy Assistant Secretary of the Navy
DoD Department of Defense
DON Department of the Navy
FHP Flying Hour Program
FMC/MC Fully Mission Capable / Mission Capable

xvi
FRE Fleet Readiness Enterprise
FXP Fleet Exercise Publication
FY Fiscal Year
FYDP Future Years Defense Plan
GAO Government Accounting Office
LCMT Life Cycle Management Team
LPO Leading Petty Officer
MPT&E Manpower, Personnel, Training and Education
NAE Naval Aviation Enterprise
NAPPI Naval Aviation Pilot Production Initiative
NAPT Naval Aviator Production Team, a NAPPI CFT
NAS Naval Air Station
NAVAIR Naval Air Systems Command
NAVICP Naval Inventory Control Point, a subordinate echelon to NAVSUP
NAVMAC Navy Manpower Analysis Center
NAVRIP Naval Aviation Readiness Integrated Improvement Team
NAVSEA Naval Sea Systems Command
NAVSUP Naval Supply Systems Command
NETC Naval Education and Training Command
NETWARCOM Naval Network Warfare Command
NFO Naval Flight Officer
NMCI Navy Marine Corps Intranet
NMPC Naval Manpower and Personnel Command
NNFE Naval Netwar/FORCEnet Enterprise
NSAWC Naval Strike and Air Warfare Center
OMN Operations and Maintenance Navy
OPCON Operational Command
OPIS Operational Process Improvement Standardization
OPNAV Office of the Chief of Naval Operations
PB President’s Budget
POM Program Objective Memoranda (a Navy budget submission)
PPBS Planning, Programming and Budgeting System

xvii
PVM Process Value Management
RFT Ready for Training, Ready for Tasking
RIF Reduction in Force (lay-offs)
SFDM Single, Fleet-Driven Metric
SLEP Service Life Extension Plan
SORTS Status of Resources and Training System
SPAWAR Space and Air Warfare Systems Command
SWE Surface Warfare Enterprise
SYSCOM Systems Command
TFR Total Force Readiness, the NAE’s Manpower CFT
TGI Thomas Group International
TOC Theory of Constraints or Total Ownership Cost, variously
TPS Toyota Production System
TYCOM Type Commander (i.e., CNAP or CNAL)
TYPEWING Type Wing (aviation command echelon subordinate to TYCOM)
ULT Unit Level Training
USE Undersea Enterprise
WRFT Warships Ready For Tasking (SWE)

xviii
THIS PAGE INTENTIONALLY LEFT BLANK
xix
EXECUTIVE SUMMARY
Naval aviation is a growingly complex and operationally expensive organization
that has come to the recognition that the old way of managing its business lines is not
sustainable. In order to successfully manage the changes required to satisfy the several
internal stakeholders in the enterprise, as well as its external customers while operating in
resource-constrained environment, the Naval Aviation Enterprise (NAE) has developed
several cross-functional teams (CFTs) to act as change influence agents, using newly
created metrics of performance and cost.
The carrier force has successfully appropriated the NAE’s cost-wise readiness
structure and approach to management. Operating under the aegis of the Current
Readiness CFT, the Carrier Readiness Team (CRT) set itself at the task of determining
what the drivers are that contribute to the delivery of carriers ready for tasking at reduced
cost. Their efforts have successfully aligned many contributing streams of value from
several previously stove piped organizations in support of the single, fleet driven metric.
CRT leadership developed three main supporting teams to help achieve the
enterprise vision of cost-wise readiness. Over time that vision evolved to include a focus
on meeting the combatant commander’s steady-state demand signal for carrier air power
in the face of reduced asset inventory — Ao.
Other warfighting claimancies have adopted the enterprise approach. The Surface
Warfare Enterprise (SWE) leadership, already familiar with enterprise behavior in the
rationalization of ship maintenance processes, developed a similar output as did the NAE:
Warfighting units — in this case, warships ready for tasking at reduced cost. Critical to
the SWE vision was the creation of CLASSRONs from within the TYCOM staffs,
commanded — as opposed to led — by a post-major command captain with experience
in the appropriate warfighting arena.
Although the kind of business process engineering used by the NAE and systems
engineering employed by the acquisition community seem to have, at first blush, little to
do with one another, they are similar in effect. The first concerns itself with management

xx
methodologies, strategies and processes, the second with products — systems, sub-
systems, components — and their lifecycles. There should not be an air gap between
management at the top of an enterprise and the products (outputs) at the production level
Alignment works, but the journey is not complete. Necessary and continuing
improvements to process will require an ongoing commitment to changing a culture of
consumption to one of cost-wise readiness generation. This will require a commonly
shared perception of the several stakeholders of the “main thing” — an output where
resources are directed and contributing efforts aligned. This output will in turn drive
process and organizational structure. Inertia must not become the constraint.

xxi
ACKNOWLEDGMENTS
The author would like to thank his long-suffering wife Mary for her patience and support
through a hideously protracted process. His children Christopher, Ashley and Katherine
are also worthy of praise for their humor and encouragement.
As my thesis advisor, Captain Chuck Calvano, USN (retired) has been an outstanding
resource; a thoughtful mentor, an ally and a real friend, although we have never met. I
hope we do someday.
Mark Rhoades, lecturer on Systems Engineering at the Naval Postgraduate School, was
assigned responsibility to track my progress through this process. He has been a positive
scold, and I thank him for it.
Finally, I owe an unpayable debt of gratitude to Rick Rosenthal, late Professor of
Operations Research at the Naval Postgraduate School. His example of dedicated
professorship while struggling heroically with cancer was truly inspirational. Whenever I
started to feel sorry for myself or despair of finishing this effort, I remembered how he
gave everything he had to teach my cohort, almost to his last breath. I’m glad to have
made his acquaintance and humbled to have walked the same earth as he did.

xxii
THIS PAGE INTENTIONALLY LEFT BLANK

1
I. INTRODUCTION
A. BACKGROUND
Naval aviation is a growingly complex and operationally expensive organization
that has come to the recognition that the old way of managing its business lines is not
sustainable. In order to successfully manage the changes required to satisfy the several
internal stakeholders in the enterprise, as well as its external customers while operating in
resource-constrained environment, the NAE has developed several cross-functional teams
to act as change influence agents, using newly created metrics of performance and cost.
In many ways, the application of business models and an enterprise view of
managing cost and output parallels elements of the systems engineering process. An
enterprise view is essentially a top-down view of the system — in this case, the “system
of naval aviation” as a whole. It is interdisciplinary and cross-functional, with an input-
process-output methodology. When it comes to the cost of generating current readiness
with aircraft, parts and people versus acquiring new assets for re-capitalization it is
especially important to have a life cycle orientation from concept development all the
way through disposal. Finally, assessing cost centers and tying them to readiness outputs
is essentially a definition of system requirements and measuring the impact of those
requirements against the stated need — akin to traceability (Blanchard & Fabrycky,
2006).
Naval Aviation has embraced modern business methodologies such as Lean Six
Sigma and Theory of Constraints in order to more efficiently create “readiness” at a
reduced cost. The Naval Aviation Enterprise, or NAE, proposes to lower total system cost
of ownership via cost savings and avoidances to maximize current readiness at reduced
cost while enabling future force recapitalization. In support of this enterprise vision,
several cross-functional teams (CFTs) have been developed. The Carrier Readiness Team
or CRT is one such team. This thesis will examine the overall NAE construct and goals in
general and the implementation of the vision in the CRT in particular.

2
The CRT has several component sub-pillars, including a Life-Cycle Management
Team, a Training and Personnel Readiness Team and an Operational Process
Standardization team. Business tools such as Lean Six Sigma, Process Value
Management and Theory of Constraints are used to fully understand the system inputs
and outputs, align resources to requirements and continually improve processes in order
to move towards ever-increasing levels of efficiency.
The thesis will review the development of the NAE, its Enterprise-wide vision
and the realization of that vision within the CRT. Results will be analyzed,
recommendations made for improving the efficiency of both the NAE and CRT and
exporting the processes of the NAE and CRT to other war fighting enterprises discussed.
B. RESEARCH QUESTIONS
To properly research the environment surrounding the development of an
enterprise approach to managing naval aviation, its contributions and recommendations
for further application going forward, a series of research questions were asked:
1. What is an “enterprise” approach and what were the drivers leading to the creation of an Enterprise approach to managing naval aviation?
2. What tools and processes are in place within the Enterprise generally? 3. How are those tools and processes realized in the CRT?
a. External contract support
b. Analysis, tools and methods used
c. Early wins
d. Out-year vision 4. What are the metrics generated by the CRT and its various teams? 5. What discoveries have been made in the process?
a. What efficiencies have resulted?
b. What are the costs of the organization? 6. How is the developed model transferred to other enterprises?

3
C. BENEFITS OF STUDY
This thesis will study the development and execution of an enterprise model of
business management and its application to naval aviation. Key processes and results will
be researched and detailed, with lessons presented for broader applicability and internal
refinement.
D. SCOPE AND METHODOLOGY
1. Scope
The thesis will focus on the NAE generally and Carrier Readiness Team’s
implementation of the NAE vision particularly. Tools and processes developed will be
tied to outputs and efficiencies.
2. Methodology
1. Survey primary stakeholders (Commander, Naval Air Forces, Commander, Naval Air Forces Reserve, USMC Aviation, Naval Education and Training Command, Naval Air Systems Command, etc.) at the initiation of the NAE as to their drivers behind developing the enterprise approach.
2. Discuss early attempts at incorporating business methodologies to the NAE, including the Naval Aviation Pilot Production Initiative (NAPPI) and the Naval Aviation Readiness Improvement Program (NAVRIP).
3. Discuss the evolution of the separate strands of Theory-of-constraints, Lean and Six Sigma in the AIRSpeed program.
4. Research and document the process of incorporating the NAE vision in the Carrier Readiness team and its associated sub-pillars.
5. Research and document the efforts of the CRT; inputs, process and outputs.
6. Analyze and report processes improved and efficiencies garnered both in terms of direct cost savings and avoidances.
7. Draw conclusions and make recommendations based on the research.

4
THIS PAGE INTENTIONALLY LEFT BLANK

5
II. THE NAVAL AVIATION ENTERPRISE
A. INTRODUCTION
After the Berlin Wall came down in 1991, naval aviation — like the military
generally — came under increasing fiscal pressure as national leadership sought a “peace
dividend” from historically high Cold War spending levels. Reductions in funding levels
across the naval air force in operations, manpower and materiel accounts eventually
resulted in markedly adverse readiness impacts. Admiral Vern Clark, U.S. Navy Chief of
Naval Operations (CNO) from 2000 to 2005, put it this way:
(We) had to improve current readiness because although we were a 12-carrier Navy on paper, we could not deliver the required number of fully-equipped aircraft carriers in time of war. The Navy’s “business of warfighting” needed to be transformed for us to provide the forward presence and warfighting capability the country needed, “anywhere…anytime,” and at the time, we couldn’t do it. It was also clear to me that current readiness wasn’t about what we wanted to have; it was about what we needed to have in order to fight and win. (Massenburg & Pierce, 2007)
Admiral Clark was convinced that funding levels were about right and that, in any
case, the Navy’s budgetary top line was unlikely to increase sufficiently to permit
managers to operate as they traditionally had. Better financial management and
awareness across all of the several, separate commands would be necessary to operate the
current force as directed by national command authority and to recapitalize the force to
replace aging, increasingly expensive ships and aircraft.
One of the major problems with running naval aviation more efficiently was that
each of the several stakeholders used different metrics for success. The operational forces
tended to use consumption-based metrics such as hours flown and steaming days, while
supply nodes focused on stocks of spares on hand, and maintenance facilities focused on
work actions completed. The systems commands (SYSCOMs) meanwhile were
concerned more with the acquisition of new systems than optimizing the life cycle cost of
systems already deployed, a tendency augmented by the fact that the staff of the Office of

6
the Chief of Naval Aviation (OPNAV) worried more about the upcoming year of the two-
year budget cycle than the current, or “execution year. In short, none of these critically
interdependent nodes shared a common operational framework or unified single metric
for success (J. Zortman, personal communication, February 1, 2008).
The nature of this problem was so-called “stove piping,” a familiar concern to
large businesses trying to integrate separate product lines under one management
architecture in order to create shareholder value by increasing profits and reducing costs.
Not only did naval aviation’s business lines have different views of value, each of them
had a different way of looking at costs.
Early in his tenure as CNO, Admiral Clark issued his top five priorities, many that
seemed directly targeted at a naval aviation community he had already deemed
“unaffordable” (Malone, 2003) in its then-existing state:
1. Manpower
2. Current readiness
3. Future readiness
4. Quality of service
5. Alignment
In a speech he gave to the Naval War College in 2000 and recorded in the
professional journal All Hands in the summer of 2000, Admiral Clark described what he
meant by alignment:
This involves a couple of things. First, we must ensure that our organizations, systems and processes are aligned to deliver exactly what they are designed to produce -- a combat-capable Navy, ready to sail into harm's way. Second, alignment involves clear communication, from the recruiter, to the LPO (Leading Petty Officer]) to the CO (Commanding Officer) to the CNO.
It's about communicating realistic expectations and then helping Sailors accomplish realistic goals -- in a word, credibility. This type of situation is not conducive to good retention. Together, with commanding officers and senior enlisted leadership, we will work to rid ourselves of message
7
mismatch -- saying one thing and meaning something else. My goal is to eliminate message mismatch and align our words, expectations and deeds. (pp. 5-6)
Naval aviation’s ownership cost and culture of consumption caught the CNO’s
attention, and he was not entirely satisfied that the aviators could solve their problems
without executive guidance. After five CNO Executive Boards — a grueling deep dive
known inside the Navy as a “CEB” — the solution arrived at by naval aviation leadership
was to take an enterprise-wide view of metrics and costs in order to achieve the vision of
an affordable, effective operating force in balance with an executable acquisition and re-
capitalization program.
B. DRIVERS
1. Introduction
The form of any organization is shaped to a degree by the environment it operates
within. Naval aviation is no exception, but in the pre-alignment timeframe the
stakeholders who would ultimately comprise the NAE were obligated to conform to
differing environmental, command organization and regulatory drivers. Significantly, an
important element of naval culture requires even interdependent commands to solve their
problems within their own command structure. As previously mentioned, OPNAV was
driven by CNO to service the POM budget cycle, the SYSCOMs by the requirement to
develop and acquire new systems under the supervision of the Assistant Secretary of the
Navy for Research, Development and Acquisition (ASNRD&A) and the operating forces
by the demand signals generated by the operational fleet commanders and combatant
commanders.
During times of relative prosperity in the operating accounts, all of these
stakeholders could serve their respective masters with relative ease, but by the late 1990s,
signs of strain were becoming apparent. Several significant problems emerged almost
simultaneously; overviews are provided below.

8
One of the first cracks in the system was revealed in the production of student
naval aviators and naval flight officers.
2. Naval Aviation Pilot and Naval Flight Officer (NFO) Production
Pilot and NFO production is under the cognizance of the Chief of Naval Aviation
Training, or CNATRA. By the late 1990s CNATRA’s aircrew production rates were
insufficient to replace fleet pilots operating on the line. With no replacements inbound,
fleet commands extended the operational tours of experienced pilots. This led to an
inefficient pooling of students between major training phases in the pipeline: More
students were sent to CNATRA to make up the shortfall, while fewer instructor pilots
were available to train them. It was not uncommon for students who had gone through
rigorous and compressed undergraduate educations to find that they would spend as much
as four years completing what had been designed to be an 18 to 24-month training
process (Figure 1, from Massenburg and Pierce, 2007). Not only was this demoralizing
for the students, it was inefficient from a personnel resources standpoint: Many of the
pooled students were engaged in “busy work” rather than the exciting careers they had
been promised, even as the instructor pilots who could have helped accelerate their
training were held in place at their fleet squadrons for lack of replacements.
Time to Train
0
10
20
30
40
50
60
Strike Pilot Maritime Pilot Helo Pilot Strike NFO E-2 NFO Maritime NFO
Aircrew
FY97 BaselineGoal
Figure 1. Aviator time-to-train
9
3. Intermediate Jet Engine Maintenance at Naval Air Station (NAS) Lemoore
An air station Aviation Intermediate Maintenance Departments (AIMD) is
responsible for the repair and rework of parts whose failure modes are beyond the
capability of squadron-level maintenance organizations. This level of repair is referred to
as AIMD “production.”
Commander “CJ” Jaynes reported as officer-in-charge of the NAS Lemoore
Aviation Intermediate Maintenance Department (AIMD) in June of 2000, and
immediately recognized that she had a leadership challenge on hand: Her department’s
production of the General Electric F404 engines used to propel FA-18 fighters based in
Lemoore was woefully insufficient to the fleet demand signal. There were 30 “bare
firewalls,” or holes in the airframe where an engine should go on the fighter flight line,
each of them representing a production shortfall. Thirty-five engines and nearly 200 sub-
modules littered the production floor awaiting maintenance. To make matters worse,
production quality for those engines actually produced was abysmal, with the average
delivery requiring return and AIMD rework after fewer than 200 hours on the wing; this
against a 400-hour expectation.
The AIMD jet shop was manned at only 61 percent of its authorization and was
working around the clock in 12-hour shifts in an attempt to catch up to the demand
signal. Morale was poor, with only half of CDR Jaynes’ experienced, second term sailors
opting to re-enlist. No help was on the way. (Cross, 2007)

10
4. Current Readiness
By 2000, the cost of operating naval aviation was increasing by 8 to 14 percent
per year (J. Zortman, personal communication, February 1, 2008) with no concomitant
increase in readiness (from Massenburg & Pierce, 2007)).
Figure 2. Cost of generating readiness
From a systems engineering standpoint, the cost of the Flying Hour Program can
be considered a system input, with aviation readiness as the desired output. One of the
major difficulties naval aviation leadership dealt with during the late 1990s was the fact
that system response was non-linear: Funding increases on the input side were not
resulting in parallel increases in readiness. There had to be something wrong in the
process, and in fact, naval aviation’s “black box” — the business process where funding
inputs became readiness outputs — was often swallowing the fiscal investment whole.
This was at least partly because the cost of operating the force was greatly outrunning
naval aviation’s predictions.
Fuel prices had increased over the late 1990s, but naval aviation’s cost increases
were not solely, nor even mostly, due to inflation in the price of jet fuel. In fact, much of
the cost increases were found in a category of aviation spare parts known as aviation
depot level repairables, or AVDLR. AVDLR consumption rates were increasing as the
airframes aged. These cost increases, as well as unconstrained increases in the demand

11
for naval aviation sorties, generated increased maintenance costs and other inefficiencies.
To make things worse, spare parts that should have been either in transit from Inventory
Control Points or in local supply lockers were either unavailable or arriving episodically
and unpredictably.
To overcome these shortfalls, maintenance crews at the squadron level
circumvented the supply system by cannibalizing parts from flight line aircraft — a
costly practice that masked the supply problem even as it doubled local maintenance
workloads: Parts removed from one jet and installed in another generated a dual
maintenance requirement, the first to “rob” the source airframe and the second to
eventually replace the robbed part (Curtin, 2001).
According to a 2001 GAO report:
Cannibalizations have several adverse impacts. They increase maintenance costs by increasing workloads, may affect morale and the retention of personnel, and sometimes result in the unavailability of expensive aircraft for long periods of time. Cannibalizations can also create unnecessary mechanical problems for maintenance personnel. As shown by a recent survey, over half of all aircraft maintenance personnel work more than 50 hours a week (some work 70 hours or more) compared with the average of 40 hours. A Navy study notes that the additional work generated by cannibalizations adversely affects morale and lowers reenlistment rates. (p. 2)
A much more efficient process would have been to perform a one-time
installation of a new part received from supply. The problem became sufficiently severe
that squadrons returning from deployment would arrive at their home base only to find
maintenance personnel from deploying squadrons waiting for them on the flight line with
wrenches in hand. Everything: Parts, personnel and flying hour funds were surged
forward to deployers with the bill paid by squadrons left behind at home base. Squadrons
recently returned from deployment saw their readiness rates plunge into ever-deeper
“bathtubs” seen in Figure 3 (from Department of the Navy, 2000). Increasingly these
readiness deficits required ever more Herculean efforts to claw out of in preparation for
follow-on deployments, most of that effort falling on the backs of deploying sailors.

12
Figure 3. The readiness “bathtub”
5. Future Readiness
As the bathtub got deeper year after year, and with the cost of the flying hour
program increasing, naval aviation leadership responded to shortfalls in operating
accounts by raiding the future year’s acquisition plan (Table 1, from Massenburg and
Pierce, 2007).
Table 1. Numbers of Aircraft Procured vs. Budgeted
Table 1 shows that naval aviation had ordered 133 aircraft of all types in the
president’s budget (PB) submission to Congress in 1997, aircraft that would actually be
1997 1998 1999 2000Budgeted 133 150 187 200Actual (+5) 123 88 100 100Deficit -10 -62 -87 -100Net Deficit -10 -72 -159 -259
13
delivered five years later in fiscal year 2002. Because of operating account shortfalls,
however, when FY02 came “into execution,” leadership reprogrammed funding for 10 of
those aircraft from the procurement account (Aircraft Procurement — Navy, or APN) to
an account supporting operations and maintenance funding known as OMN. Fewer new
airplanes coming on line inevitably resulted in an increasing average age for those
aircraft currently in the stable. Older aircraft come with a commensurately increased
operating cost per flight hour.
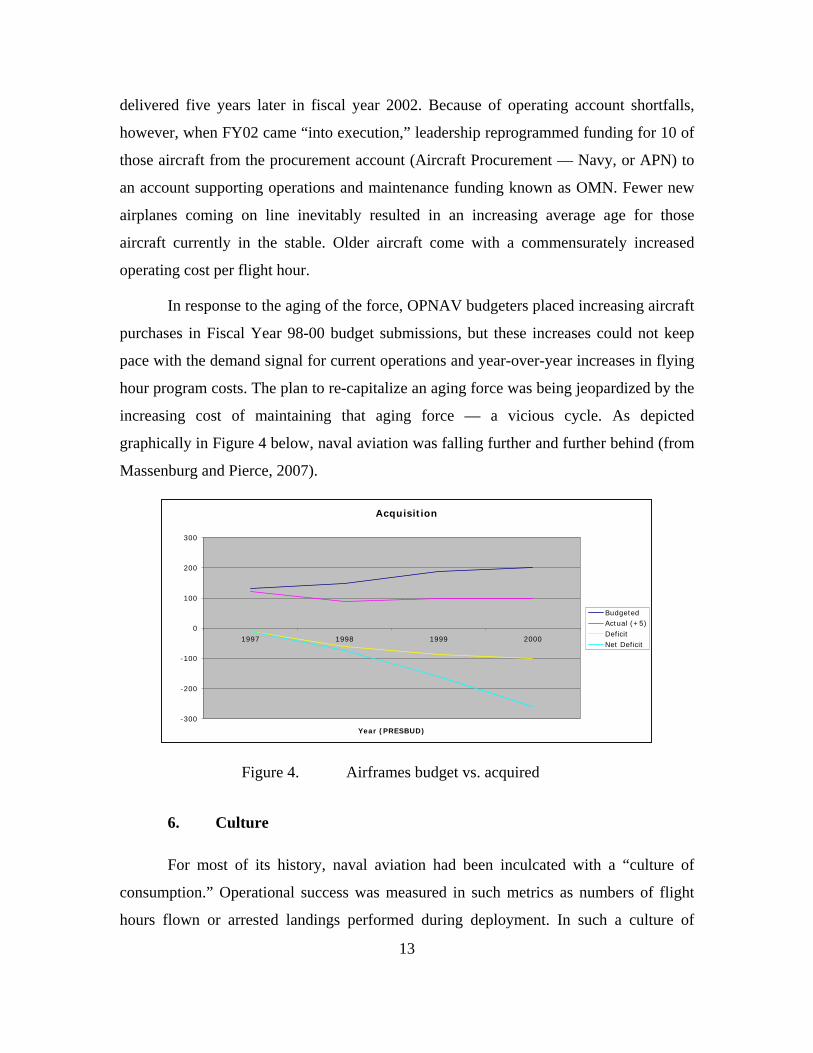
In response to the aging of the force, OPNAV budgeters placed increasing aircraft
purchases in Fiscal Year 98-00 budget submissions, but these increases could not keep
pace with the demand signal for current operations and year-over-year increases in flying
hour program costs. The plan to re-capitalize an aging force was being jeopardized by the
increasing cost of maintaining that aging force — a vicious cycle. As depicted
graphically in Figure 4 below, naval aviation was falling further and further behind (from
Massenburg and Pierce, 2007).
Acquisition
-300
-200
-100
0
100
200
300
1997 1998 1999 2000
Year (PRESBUD)
BudgetedActual (+5)DeficitNet Deficit
Figure 4. Airframes budget vs. acquired
6. Culture
For most of its history, naval aviation had been inculcated with a “culture of
consumption.” Operational success was measured in such metrics as numbers of flight
hours flown or arrested landings performed during deployment. In such a culture of
14
consumption, more was always better. Successful commanding officers “executed” their
budgets even if doing so made little fiscal or operational sense — end of fiscal year
“burn-ex’s” winging squadron aircraft around the country with little in the way of
training return on investment were common. Leadership had grown up being told — and
believing — that under-execution of obligated funds would lead to reductions in those
funds in subsequent years.
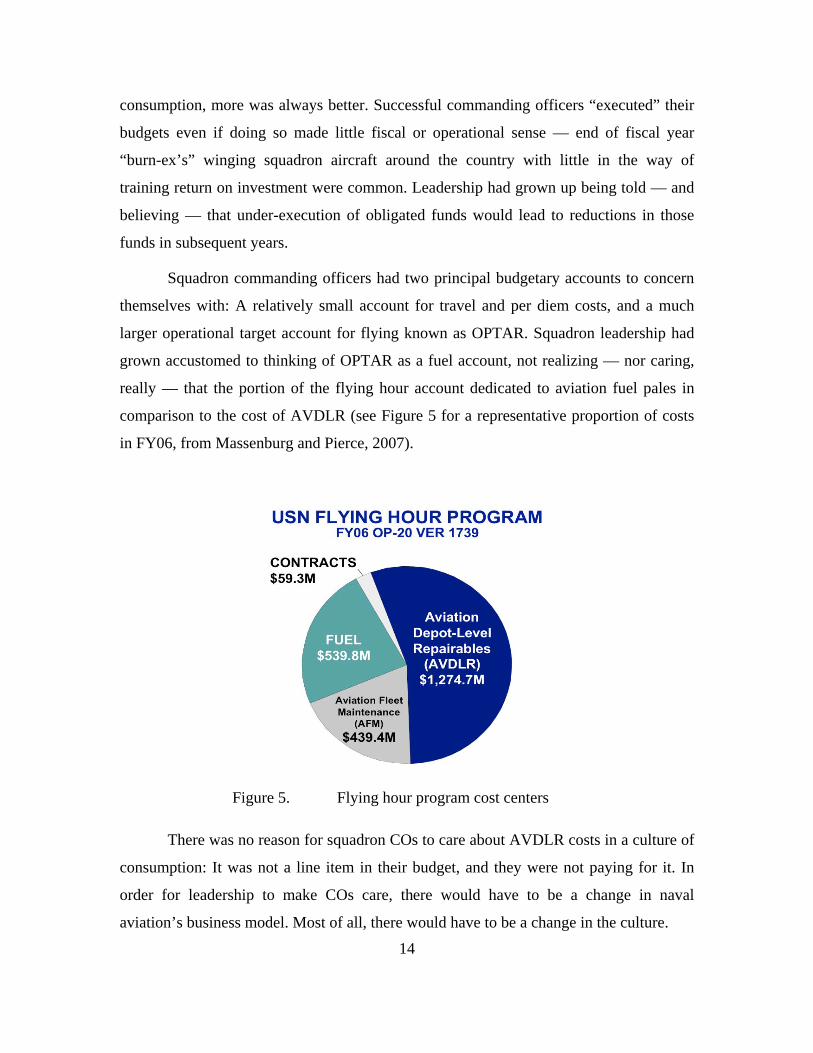
Squadron commanding officers had two principal budgetary accounts to concern
themselves with: A relatively small account for travel and per diem costs, and a much
larger operational target account for flying known as OPTAR. Squadron leadership had
grown accustomed to thinking of OPTAR as a fuel account, not realizing — nor caring,
really — that the portion of the flying hour account dedicated to aviation fuel pales in
comparison to the cost of AVDLR (see Figure 5 for a representative proportion of costs
in FY06, from Massenburg and Pierce, 2007).
Figure 5. Flying hour program cost centers
There was no reason for squadron COs to care about AVDLR costs in a culture of
consumption: It was not a line item in their budget, and they were not paying for it. In
order for leadership to make COs care, there would have to be a change in naval
aviation’s business model. Most of all, there would have to be a change in the culture.

15
C. CHANGING THE BUSINESS MODEL
1. The Toolset
As the late 1990s came to a close then, naval aviation leadership realized that they
faced significant challenges. On 10 September 2001, Chief of Naval Operations Vern
Clark stood at the Washington Navy Yard alongside the President of the United States in
a ceremony to present the President of Australia with a ship’s bell from a World War II
cruiser named USS Canberra. But as he relates in the foreword to VADM Massenburg’s
2007 manuscript “The Edge of the Envelope — Changing the Way We Do Business in
Government,” his mind was elsewhere:
I’d been the Chief of Naval Operations for fourteen months and I was worried we could no longer afford the Navy’s existing force structure. At that very moment, I was contemplating major cuts to those forces on the order of two complete battle groups, which equated to two aircraft carriers, sixteen carrier-based squadrons totaling over 100 aircraft, and several smaller ships such as cruisers, destroyers, frigates, and replenishment vessels. The number of aircraft carriers, air wings, ships, and submarines had simply become too expensive to sustain and adequately support. While cutting the force was a last ditch effort, I didn’t know what else to do. There was only so much money to go around. (Foreword, p. 5)
“Everything changed” the next day (11 September 2001) except this: No cuts to
the force were foreseeable in the near future as the country geared up for war overseas,
and no “new money” would be forthcoming from CNO to make up for shortfalls in naval
aviation’s flying hour program — an account that was by then under-funded by well over
one hundred million dollars. Naval aviation had a problem, and they would have to solve
it within their own command structure.
To do so, leadership would need to institute significant changes to their business
model. There would have to be a top-down driven cultural change away from a “culture
of consumption.” Leadership turned their eyes to the business world and saw many good
examples to think upon.
16
By the end of the 1990s, there were three production-oriented execution
philosophies finding favor in the U.S. and abroad: Lean, Six Sigma and the Theory of
Constraints. Each of these would become important tools in the process of “fixing” naval
aviation, whether the problem was pilot production, jet engine repair or finding the right
balance between force recapitalization and current operations. Books have been written
— are being written — about each of these approaches to production optimization, and
no treatment here could do them full justice. Nevertheless, a brief discussion is required
to make sense of later matter.
a. Lean
Lean manufacturing is a process that aspires to eliminate waste of all kinds
in the production process. Lean was the design philosophy incorporated in the post-war
Toyota Production System (TPS) as described by Taichi Ono in his 1988 book “The
Toyota Production System.” Western appreciation of the TPS and refinements to the
system are significantly tied to the study of the “little green book” written by Shigeo
Shingo, author of, “A Study of the Toyota Production System from an Industrial
Engineering Standpoint.”
The main goals of Lean manufacturing in the TPS were to minimize
overburdening, known by the Japanese term “muri,” reduce inconsistencies in production
(mura) and eliminate waste (muda) (Toyota Production System, 2008). There are seven
forms of waste, according to Shingo:
1. Overproduction
2. Waiting
3. Transporting
4. Inappropriate processing
5. Unnecessary inventory
6. Unnecessary/excess motion
7. Defects

17
In addition to these Seven Wastes, the latest issue of the seminal book on
Lean manufacturing, “Lean Thinking,” identifies another waste source to add to the list,
and one of particular interest to Navy leadership:
8. Underutilization of employees. (MacBride, 2008)
At least five of these eight were represented in the aviator production
shortfall faced by naval aviation: Waiting, inappropriate processing, unnecessary
inventory, excess motion, and underutilization.
In his study of the Toyota Production System, and in his value stream
mapping process, Shingo makes a distinction between “processes” as value added steps
and as distinct from “operations,” which are the actions performed upon work in process
by people and machines. In Shingo’s view, these two characteristics of production — that
are not normally distinguished from one another — are very different indeed: Process is
inherently critical to production, while operations are inherently suspect sources of waste
(Shingo, 1989).
b. Six Sigma
The emphasis on Six Sigma is to eliminate variations in processes as a
way of inexpensively reducing output (product) variations — it is in essence a process
standardization system whose end result is increased quality for all stakeholders, and
ultimately increased profit margins.
The meaning of Six Sigma has evolved over time: Initially intended to be
a series of metrics, it became next a methodology and then finally a management model
(Motorola University, 2008a). Because it focuses on output or process quality without
regard to cost, it is frequently linked to Lean Manufacturing, which focuses more on
streamlining individual processes and reducing wasteful “operations” across the
production cycle. The two are used together in the TPS to increase quality at reduced
cost.

18
Six Sigma is a Motorola-developed methodology (Motorola University,
2008b), although heavily influenced by preceding streams of industrial production
thought such as quality control, W. Edwards Deming’s “Total Quality Management,” and
Zero Defects.
Six Sigma proponents navigate by the following guidelines (Six Sigma,
2008):
1. Continuous efforts to reduce variation in process outputs is key to business success
2. Manufacturing and business processes can be measured, analyzed, improved and controlled
3. Succeeding at achieving sustained quality improvement requires commitment from the entire organization, particularly from top-level management
There are eight steps in any Six Sigma strategy (Harry & Schroeder,
2000): “Recognize, Define, Measure, Analyze, Improve, Control, Standardize and
Integrate.”
1. R Recognize functional problems that link to operational issues.
2. D Define the processes that contribute to the functional problems.
3. M Measure the capability of each process that offers operational leverage.
4. A Analyze the data to assess prevalent patterns and trends.
5. I Improve the key product/service characteristics created by the key processes.
6. C Control the process variables that exert undue influence.
7. S Standardize the methods and processes that create best-in-class performance.
8. I Integrate standard methods and processes into the design cycle.

19
c. Theory of Constraints
The Theory of Constraints (TOC) is a management philosophy that
essentially seeks to identify the primary bottleneck — the constraint — on production or
performance and seeks to push against its boundaries. The TOC implementation process
has several key steps:
1. Identify the constraint (the thing that prevents the organization from obtaining more of the goal)
2. Decide how to exploit the constraint (make sure the constraint is doing things that the constraint uniquely does, and not doing things that it should not do)
3. Subordinate all other processes to above decision (align all other processes to the decision made above)
4. Elevate the constraint (if required, permanently increase capacity of the constraint; "buy more")
5. If, as a result of these steps, the constraint has moved, return to Step 1. Don't let inertia become the constraint.
d. AIRSpeed
Ultimately, these separate but complimentary streams of thought — Lean
Six Sigma and Theory of Constraints — would be woven into the Naval Aviation
AIRSpeed initiative, the name given to the enterprise-wide effort to intellectually assault
naval aviation’s endemic problems. AIRSpeed would first touch aviation supply and
maintenance depots in 1999. Depot AIRSpeed was intended to optimize depot production
processes. In 2003, Enterprise AIRSpeed rolled out to fleet repair sites and processes,
followed by NAVAIR AIRSpeed in 2004, intended to encompass corporate and
acquisition community processes. All were intended to help accomplish the mission of
naval aviation by decreasing cycle times and inventory while improving reliability, all at
reduced cost (Moore, 2005). But in 1997, with students waiting in the pipeline up to four
years to get their wings, and fleet pilots extending on station due to lack of replacements,
all of that was still far in the future.

20
2. The Naval Aviation Pilot Production Initiative (NAPPI)
The pilot production shortfalls of the late 1990s were one of the first wake-up
calls to naval aviation that the train had come off the rails. In business language,
production cycle times were causing unacceptable downstream bottlenecks. Additionally,
long gaps between training events resulted in sub-optimal performance and increased
refresher training for the sake of improved quality — the business equivalent of wasteful
“rework.”
Leadership’s first instinct upon realizing the nature of the pilot production
problem was to throw more resources at it: More instructors, more repair parts and more
flying hours, but by the late 90s these options were no longer available (J. Zortman,
personal communication, February 1, 2008). The Navy then hired Thomas Group
International (TGI), a Dallas-based consulting firm to help solve the problem. The
Thomas Group had earned a reputation as change agents who were able to help
production-oriented companies optimize repetitive tasks using a philosophy they called
Process Value Management (PVM).
Fundamental to Process Value Management is the principle that businesses are comprised of linked and interdependent processes, and that weaknesses or ambiguities in these linkages cause low process speed and poor output quality. Process Value Management is a metrics-driven process plan that identifies and removes barriers, manages cultural change, and enlists the top leadership of an organization to solve problems cross-functionally. It also uses Actions in Process to track progress and ensure resources match task volume. Process Value Management helped us analyze the cycle time of aviator production from a total process view. (Massenburg and Pierce, 2007)
One of the fundamental tenets of PVM is that cultures are fiercely resistant to
change and that change therefore must be determinedly driven from the top down — an
interesting analogue to the systems engineering precept, which emphasizes a top-down
approach that views the system as a whole of inter-related functionalities. The Thomas
Group’s model is to use all of the modern business practices in the tool chest under the
umbrella of very senior leadership teams that act as change agents — in the case of naval
aviation, three star flag officers at the aviation type commander (TYCOM), aviation

21
SYSCOM and Naval Supply Systems Command (NAVSUP) level. Working beneath
them are cross-functional teams organized into appropriately focused areas, typically led
by Navy captains and Marine colonels. Working beneath each of the cross-functional
teams were so-called “barrier-removal teams,” ad hoc groups that stood up in response to
identified process inefficiencies to identify, analyzed and eliminated barriers to
production, and stood down again once their particular barrier had either been eliminated
or elevated to the next level.
The Thomas Group’s strength was its ability to sustain a course of discovery that enabled leaders to understand their processes intimately and to identify the sources of problems. For the first time aviation leaders saw pilot training as a holistic system that started with fleet aviator requirements, based on rotation inside squadrons, and flowed all the way back up pipe to the recruitment of prospects. It became clear that the three commands involved in pilot training were making decisions that optimized their individual functions but that cumulatively subverted the entire process, creating pools of pilots between training phases (where skills atrophied as they waited). (Perkins, 2007 p. 5)
In 1998, the student aviator pipeline inventory, or “work in process” from a
business perspective, was 3,257 students against an optimum number of 2,900 for just-in-
time replacement of pilots rotating to shore duty from the fleet. Because of the delays in
training (longer cycle time), the annual output of aviators was 751 graduates — finished
goods — against an annual requirement of 1,017. The solution to this problem was found
in total cycle time process improvement using best commercial processes in a way that
integrated all of the process stakeholders.
The Thomas Group looked at all elements in pilot production using a value stream
mapping process, identifying value added steps along the way, and distinguishing them
from non-value added iterations. TGI noted the existence of multiple wastes in pilot
production, including that unevenness in production that the Toyota Production System
labels “mura.” This resulted in alternating iterations of overproduction and waiting.
Although the Navy’s pilot production system is time-tested from a quality standpoint,
waiting also results in unnecessary/excess motion for rework (retraining) — itself an
indicator of a quality or process defect.

22
But these were things that any critical observer could have noted. Naval aviation
knew it had problems, what it needed was solutions. What the Thomas Group noted was
that there were two cultural issues impeding pilot production: First, the naval aviation
training process lacked a single metric, common to all stakeholders, which defined
success. Second, naval aviation training lacked a “single process owner” who cared about
all elements of the pilot production enterprise and who was empowered to enforce
change. Getting at pilot production cost and quality centers required a cultural mindset
shift, and just as culture is traditionally both the most difficult process improvement
barrier to remove, it also has the highest impact. Getting the “just in time” student
through the training process in response to a fleet-driven “pull” signal would require
multiple process owners to align and agree to share a common production mindset and
metrics.
Naval aviation had previous experience overcoming barriers in production due to
multiple process owners and non-aligned metrics. In 1996, a sudden shortfall in the
production of the TF-34 engines that powered the Navy’s S-3 Viking anti-submarine
warfare aircraft presaged the later production issues experienced in FA-18 production at
NAS Lemoore. Over 20 S-3s were on Navy flight lines with no engines under their
wings. Readiness rates suffered even as cycle times, work-in-process and maintenance
man-hours per flight hour — an important metric of maintenance efficiency — rose.
Ultimately a process team was formed from all of the individual stakeholders to address
the perceived problem. Initial efforts were somewhat random and disconnected, leading
senior members to realize in time that a systems-wide approach to solving the problem
was necessary. Their first realization was that there was 1) no “single process owner”
responsible for determining, 2) what would be the single, fleet-driven metric of success
— in systems terms, measuring the output of the process. Each separate business arm had
its own leadership and reporting chain of command, and significantly, its own metrics for
success. Individually, each line was operating within its controls — the problem was
always with someone else.
Blame shifting aside, engine production rates and deliveries fell further and
further behind. Eventually, Mr. Dave Chipman, a propulsion systems engineer for the

23
Naval Air Systems Command was identified as a universally acceptable single process
owner. This was the start of a successful transition away from stove-piped measures of
success towards a single metric: The number of turbofan engines required by the fleet.
That metric enabled the creation of common output for the cross-functional investment:
Zero engine deficit, zero engines in maintenance and 41 spare engines awaiting a
requirement:
The team examined the reasons behind the large number of engine removals, increased the number of engines produced at the overhaul facilities, and improved engine reliability. In concert with the Defense Logistics Agency, they also changed the metrics behind the existing parts forecasting models from historical demand to projected demand, by examining the rate at which failed and damaged parts were replaced. Traditionally, parts had always been pushed to the customer irrespective of demand, in part because the customer had been trained to “ask for everything” instead of figuring out just what was needed. The new model created a system more closely aligned with actual demand, which minimized waste in terms of time and material. Twenty-four months after the Viking engine team sprang into action, the engine deficit fell from its zenith of 61 to zero. (Massenburg & Pierce, 2007)
This process clearly energized the team to create the “right” readiness. What it did
not do was concern itself with the cost of producing that readiness, nor the timeliness of
that production. Recognizing those layers of business nuance was still to come.
With the experience of the TF-34 Engine Team to guide them, naval aviation
training team members quickly realized that similar stovepipes were affecting aviator
production. Assisted by their TGI consultants, naval aviation formed a management team
composed of four key elements: A Naval Aviator Production Team (NAPT) was created
composed of senior naval aviation (flag level) leadership including the Type Commander,
CNATRA, OPNAV N1 and N88, the Bureau of Personnel, and Headquarters, Marine
Corps (HQMC). Below that team were three cross-functional teams (CFTs), representing
the officer accession to aviation preflight indoctrination phase (CFT 1), the preflight
indoctrination to warfare designation phase (CFT 2) and the designation to fleet phase
(CFT 3). The CFTs interacted with process owners at the type wing and squadron level,
while also maintaining ties between themselves to minimize gaps and seams. Beneath

24
these standing teams existed ad hoc sub-process barrier removal teams. These teams
stood up as barriers to process improvement were identified. Once the barriers were
elevated to the proper level of visibility for elimination, the teams stood down again.
After conducting a series of site visits and hundreds of interviews, the Thomas
Group team “identified barriers to the aviation training process and examined the
relationship between those barriers and the desired end-state condition” (Massenburg &
Pierce, 2007). One month later a flag-level workshop set out the goals for the NAPT — a
30 percent increase in aviator production and a 36 percent reduction in time-to-train.
The NAPT met monthly via video-teleconference and quarterly in physical
proximity for the fourth key element of the NAPPI process: A production alignment
conference to ensure that training command pipeline production was matched to
validated fleet requirements. The TGI consultants performed value stream mapping
across the entire spectrum of production processes and operations. Their assumption was
that each organization’s output has a process flow that can be mapped, a history that can
be analyzed, and a performance baseline — the way things are — as contrasted to an
entitlement: The way things ought to be in a balanced system. The measurements applied
to the training system were costs (dollars and man-hours), first pass yield and cycle time.
Although many distinct metrics were generated to highlight production bottlenecks and
shortfalls, the NAPT finally agreed upon a single, fleet-driven metric: Aircraft ready for
training (RFT).
RFT seems at first blush a non-intuitive “main thing” to focus on, especially since
the process shortfall pain had been felt in the slow production of newly trained personnel
and extended fleet terms for experienced aviators. But by using a value stream mapping
process — itself an analogue to the systems engineering functional flow block diagram -
and the Theory of Constraints, the NAPT realized that the flow of pilots from the training
command to the fleet and flight instructors back from the fleet to the training command
was a closed-loop system with very little slack: New instructors could not be freed from
their fleet squadrons until replacement pilots graduated from flight school, and
replacement pilots could not be produced in a timely fashion without instructor pilots.

25
The common thread that linked them was that both needed aircraft to fly, and that the
funding to create those flyable aircraft came from a common, stressed source.
End-to-end pilot production is a long lead-time process with few opportunities for
leadership to meaningfully intervene over the short term. But all stakeholders in the
cross-functional NAPPI team had some responsibility for the production of aircraft ready
for training. Finally, the training need was immediate and RFT was the most sensitive
constraint to manipulation. RFT was therefore chosen as the single, fleet-driven metric,
although there were various drill-down panes in a five-element “cockpit” chart used to
pulse other contributors to the value stream.
Using the cross-functional team approach along with top-down driven culture
change, multiple barriers to efficient production were identified, elevated and removed.
One of the most significant barriers removed ended up being the most controversial: In an
era of underproduction, the training pipeline was carrying too much student pilot
overhead. In order to train more pilots in a timely fashion, the enterprise would have to
train fewer of them. This seemed counter-intuitive.
The problem was one of excess student loading, a work-in-process inventory
overage that was choking the system made worse by the fact that training squadron
commanding officers continued to accept students they couldn’t efficiently train. Part of
the reason for this excess inventory was that the Navy had deliberately under-accessed
flight students in the mid-1990s in response to a post-Cold War draw down of aviation
squadrons from 227 to 144 — a reduction of 3,000 billets. The Bureau of Naval
Personnel decided to meet new force strength limits by reducing accessions and retaining
excess winged aviators rather than executing an emotionally wrenching reduction in
force, or “RIF”. This short-term decision to under-access led to the down stream effect of
insufficient aviators in year groups 93-95, resulting in a so-called “T-Notch.” (Gallardo,
1999)
In Figure 6 on the following page, the inventory (Y-axis) of aviation officers
(both pilot and NFO) is shown in blue columns, with the junior-most year groups
(representing accessions) to left of the X-axis and their prospective department heads at

26
the squadron level depicted to the right. Attrition of all types — flight school
performance or civilian transition at the end of obligated service - is represented by the
gap between the blue columns and the green inventory control line at the top of the graph
(from Laukaitis, 2001).
Figure 6. T-Notch and Son of T-Notch
Counter-intuitively — almost perversely — a second order reduction in
accessions, shown as the “Son of T-Notch” in the graphic above, was required to
eliminate the backlog in pilot production. :
Ultimately, the initial key to producing pilots more efficiently was to induct fewer trainees into the system, thereby preventing the build-up of the pools. Both the appearance and substance of that solution, however, threatened to disrupt established equities, but (RADM John Nathman, the aviation resource sponsor at OPNAV N88), who saw the waste of the existing disconnected process, garnered support to push it through. Over several years NAPPI helped reduce the Time-To-Train (TTT) by 40 percent and increase the number of flight-ready aviators moving through the training program by 30 percent. (Perkins, 2007)
Once a commonly accepted definition of system requirements had been matched
to a set of metrics other improvements to the production chain were possible. One of
these was a transition to a production view of resources — planes, parts and people — in

27
the training commands and fleet replacement squadrons. This production view supplanted
the previous “fleet view” of resource requirements.
The fleet view had been to apply the most resources to whichever organization
was most instantly challenged — a process that had resulted in inefficient and episodic
pulsing of resources. By creating a linkage between the production flow requirement and
an entitlement of resources to support that requirement, the right resources could be
spread throughout the production chain from street to fleet, optimizing resource
allocations (Pittman, 2002). From a systems engineering perspective, this is analogous to
a rigorous definition of stakeholder requirements with an emphasis on functional analysis
and allocation.
Alignment, adoption of common metrics, reduction in inventory and the use of
innovative business processes resulted in an increase of 252 aviators produced from
FY1998 to FY2000, and reduced time-to-train from an average 180 weeks to 126 weeks
— a 30 percent reduction in cycle time. These efficiencies resulted in a savings of over
1300 man-years and claimed cost avoidances of $150 million (Pittman, 2002).
NAPPI had resulted in significant efficiencies and savings, but it was still
considered a case study — a “one off.” The enterprise view of all naval aviation was still
to come.
3. NAS Lemoore Jet Engine Production
As previously discussed (p. 9, above), when Commander “CJ” Jaynes reported as
officer-in-charge of the Aviation Intermediate Maintenance Department at Naval Air
Station Lemoore, her jet engine repair shop was manned at 61 percent and working 12-
hour shifts, while falling ever further behind in the process. There were 30 bare firewalls
on the flight line and engine reliability on the wing was less than half of the specified
400-flight hours mean-time-between-failure. Thirty-five engines and 200 sub-modules sat
on her production floor as work-in-process.
CDR Jaynes had reported to NAS Lemoore from a stint of duty at Northrop
Grumman Integrated Systems, in El Segundo, California where she had been exposed to

28
Lean manufacturing techniques. She discovered that there was no process in place at
Lemoore beyond putting more people to work for longer hours. Morale was rock bottom,
enlisted personnel retention was poor and quality of work suffered. Receiving permission
from VADM Nathman in San Diego to employ a Boeing expert in Lean manufacturing,
and using what she had learned in El Segundo, CDR Jaynes, trained all enlisted personnel
in a grade of E-5 and above in Lean concepts (Cross, 2007). She implemented process
flow charting — so-called “spaghetti diagrams” — which are used by Lean proponents to
document the current workflow in an organization, as well as “clocking,” a method of
determining the source of discontinuities and bottlenecks in the production chain.
Figure 7. Spaghetti Diagram enhancement (from Kumar & Yin, 2004)
Prior to CDR Jaynes’ efforts, production team members looking for parts would
wander over to a parts bin and rummage around for their particular need. There were
significant holes in inventory and no one had a clear insight on what was on order or
when it would arrive. In response, CDR Jaynes instituted a “kanban” system of inventory
management.

29
The kanban (Japanese for “board”) system generates a demand signal to the next
level of the supply chain each time a part is used in production. In the jet shop for
example, when a part goes from the ready bench to an engine, a kanban card issues a
replacement request to the supply bench, which in turn generates a replacement call to the
regional Naval Inventory Control Point (NAVICP), to NAVSUP and eventually to the
vendor. In a demand-based system like kanban, inventory response times are recorded,
permitting responsive (vice historical) demand-based re-supply. Since “transporting” is
one of the seven sources of “muda,” or waste, a demand-based re-supply system ensures
that expensive spares don’t pool up at the distant and most expensive end of the supply
chain. It also helps to increase the responsiveness and efficiency of the overall supply
system.
With workflow improvements on the production floor and a “just-in-time”
inventory system, CDR Jaynes was able to reshuffle her jet engine production work
force, detailing eight personnel to a night shift to pre-stage parts for the next day’s
production effort. The rest of her sailors — more than 90 — were dedicated to a single,
eight-hour production shift. The results were remarkable.
In one year’s time, average engine turnaround time was reduced from 83 to 14
days. Monthly production increased from 27 to 37.5. Bare firewalls were reduced from
30 to zero, and time on the wing (the time an engine is actually installed on an airplane)
— a quality metric — increased from 180 hours to over 460, increasing service intervals
from 5-6 months to 12-15. In an example of a virtuous cycle, increased production and
enhanced quality decreased the demand signal, further increasing production efficiency.
Significantly, CDR Jaynes had managed to do so with no increase in her budget.
In fact, having demonstrated that she could exceed local engine demand with only 61
percent of her allocated manning, she saved over $5 million per year in personnel and
personnel support costs (Cross, 2007) as manning levels were reduced to reflect the work
actually being done. Personnel retention rates increased from 50 percent to 76 percent
(Jaynes, 2004).
30
CDR Jaynes proved that great efficiencies could be harvested with no increase in
cost. Within a year, her AIMD was exporting re-worked engines to other AIMDs and
depots in Jacksonville, Florida, NAS Oceana, Virginia and Marine Corps Air Station
Miramar, California. Her efforts preceded the establishment of the Naval Aviation
Enterprise and helped to prove that more work could be done at the same cost. What
leadership had yet to realize was that as a result of demonstrated efficiencies in Lemoore,
excess capacity now existed in AIMD infrastructure around the country and in manning
at each site. By in turn harvesting those efficiencies, even more could be done at a
reduced cost.
4. Balancing Current Readiness and Future Recapitalization
The tension between current and future readiness accounts has previously been
introduced, as has the impact of the naval aviation culture’s attention — or really, lack
thereof — to the bottom line of naval aviation’s business. The rapidly rising costs of that
culture of consumption were crippling and unsustainable.
Squadron commanding officers were issued flying hour budgets in quarterly
increments with the guidance to execute each dollar in the budget. Leadership assumed
that squadrons that could not spend every dollar allotted were poorly run — either the
maintenance department was not up to the task of providing sufficient aircraft, or the
operations department wasn’t smart enough to understand and execute the budget. Money
that could not be spent by under-executing squadrons was re-programmed to squadrons
that had proven their ability to spend, rewarding consumption and in effect, penalizing
conservation. Under-performing squadrons would see their budgetary allocations
decreased with “can do” squadrons reaping the windfall. The measures of success were
flying hours and shipboard arrested landings — all consumption metrics — and more was
always better. Cost-per-flight hour statistics were gathered not to determine where costs
might be reduced, but to predict how many more hours could be flown given the
remaining amount of money in the pot. But by 2001, with naval aviation’s current

31
readiness account under-funded by over $130 million (Massenburg & Pierce, 2007) and
an aging air force increasingly more expensive to maintain, the vicious cycle had to be
interrupted.
The series of CNO Executive Boards conducted by Admiral Vern Clark in 2000
focused naval aviation readiness on the cost drivers of their business line. In the summer
of 2001, aviation operators at the senior flag officer level assembled with leaders from
the maintenance, logistics and supply communities as well as OPNAV resource sponsors
to attack the issue from a cross-functional perspective — a perspective polished by the
positive results of the NAPPI experience.
Four key events led us to Dallas that summer: 1) the Aviation Maintenance and Supply Readiness Study Group, which had meticulously tracked our maintenance and supply problems but had never had the money or top-level support to resolve them; 2) the CNO Executive Briefs established to help Admiral Clark and senior aviation stakeholders understand the shortfalls in the flight budget (and uncovered the need for an overhaul of the Fleet’s training and readiness matrices); 3) the Naval Aviation Production Process Improvement program, which taught us how to increase process speed, reduce cycle time, and control inventory; and, 4) Vice Admiral Nathman’s designation as the head of all Naval Aviation forces (single process owner) in April 2001. (Massenburg and Pierce, 2007)
As the only Chief of Naval Operations to enter the office equipped with an MBA,
Admiral Clark was perhaps uniquely postured to help aviation attack its problems from a
business perspective. Having read “The Power of Alignment,” by Boston University
professor of management and organizational behavior George Labovitz, the CNO was
also a firm believer in the idea of aligned authority and accountability. The alignment of
previously separated — and often competing — three star aviation barons on either coast
under a single “Air Boss” in VADM Jack Nathman was critical to his vision of achieving
a common metric for success driven by a “single process owner.” The outcome of the
Dallas meeting was to take the NAPPI example and export it across all of naval
aviation’s business lines. The initiative would come to be named the Naval Aviation
Readiness Integrated Improvement Program, or NAVRIIP.

32
Admiral Clark gave VADM Nathman the reins as the process owner for naval
aviation readiness. It was up to Nathman and his team to solve the second half of the
alignment puzzle, as defined by Labovitz: What is the “main thing”? 1 Put another way,
what was the common, single fleet-driven metric?
One principle focused on the use of the type model series (T/M/S) as the basis for managing process improvements, based on the recognition that types of aircraft were maintained at multiple locations and that optimizing maintenance processes required a holistic approach across those sites. The second principle was the concept of aligning processes around a core objective — a single readiness metric — that was of critical importance to the end user — the fleet.
Massenburg and other NAVRIIP flags recognized that the metrics historically used to track readiness — FMC and MC (fully mission critical and mission critical) - were inadequate because they focused on near-term solutions (i.e., fixing existing casualties) and provided no leading indicator through which to improve readiness. The important indicator was determined to be aircraft ready to fly sorties, and the team designed NAVRIIP around the key single metric — Aircraft Ready for Training. (Perkins, 2007, p. 8)
The FMC/MC metrics that had historically been used to track readiness had two
additional flaws: Mission capability for a given aircraft was always set at the high end of
the deployed/in-combat spectrum regardless of what the actual mission might have been.
Thus a squadron engaged in routine, non-tactical flying at the very beginning of a work-
up cycle was judged at the same standard as one patrolling Iraqi no-fly zones and being
shot at. This tended to once again drive a culture of consumption, as early-cycle
squadrons strove to create and maintain exotic and expensive capabilities that were not
appropriate to their training environment.
The Navy had traditionally used an 18-month readiness cycle to control flying
hour accounts (although, in the wake of Operation IRAQI FREEDOM, first a 27-month
and then a 32-month “Fleet Response Plan” cycle were soon to be proposed inside
OPNAV to reflect emerging thinking on post-deployment surge requirements for the next
1 The “main thing” is a “common and unifying concept to which every unit can contribute” which is
“clear, easy to understand, consistent with the strategy of the organization, and actionable by every group and individual.” (Labovitz & Rosansky, 1997).

33
major regional conflict). At the very beginning of a readiness cycle a squadron would
have just returned from deployment and be operating at a minimal level in order to permit
personnel to enjoy leave time with their families. After a month at a very low funding
level, the aviators would begin benign proficiency flights for veteran pilots and
indoctrination flights for new personnel. As the squadron approached its subsequent
deployment, missions would gradually ramp up in difficulty, requiring the dedication of
more flight hours to safely complete the more complex missions. Throughout this 18-
month cycle, the flying hour account was dialed up or down to support the intensity of
effort.2
VADM Nathman’s team had come upon the idea of time-phased “entitlements”
for everything a squadron would need to fly, not just aviation gas as in the past. A
squadron just emerging from the recuperation period after an extended deployment and
funded at a lower level would not need as much “stuff” — aircraft, parts, weapons, pods
and even people — as one deployed to combat operations. This allowed the supply and
inventory systems to smooth out the flow of resources to the force in a predictable way
vice responding reactively to historical FMC/MC readiness snapshots whose relation to
reality faded with each passing hour.
The NAVRIIP team was further divided into three cross-functional teams, or
CFTs. CFT 1 was the “current readiness” team, tasked with determining what the
appropriate level of readiness was across the inter-deployment training cycle for all
aircraft types, models and series. CFT 2 was responsible for aligning provider
organizations — parts, people, aircraft and support equipment — to the readiness cycle.
CFT 3 focused on the planning, programming, budgeting and execution system (PPBS) to
ensure that funding requirements were properly set to support the readiness cycle
(Perkins, 2007).
2 Although it is often convenient to think of the flying hour account as a “gas bill,” the reader will
remember from p. 14, Figure 5, that fuel is less than a quarter of the total bill. Significant portions of the total costs of the flying hour program are spent on repairable and consumable parts whose failures (and repair costs) correlate positively with usage rates. Since squadrons further downstream in the training cycle have more equipment (both aircraft and ancillary equipment such as Forward Looking Infrared pods, or “FLIRs”) that they fly at higher usage rates, costs tend to increase dramatically.

34
The Naval Aviation Pilot Production Initiative (NAPPI) permitted leadership to
explore how readiness could be produced more efficiently, servicing the demand while
saving money through reductions in cycle time. NAVRIIP added a new dimension to the
readiness numerator and cost denominator: Time. The question would no longer be,
“How much readiness at what cost?” but also, “when?” Managing this essential task
across nearly 200 squadrons and over a dozen aircraft types would not be the effort of an
ad hoc team of co-equal flag officers, each with their own vested equities to protect. It
would require a team led by a single process owner — the Commander of the newly
aligned Naval Air Forces (CNAF) as the “Air Boss,” and the identification of a single,
fleet-driven metric for success.
The operating concept of the Naval Aviation Enterprise was born, although it
would not officially be labeled as such until July 2005.
D. MISSIONS, VISIONS AND TASKS
1. Introduction
It is important to point out that the VADM Malone’s seed concept — a concept
that would come in 2005 to be called the NAE — is not a formal, hierarchical
organization in the familiar military sense. Rather, it was (and remains) a conceptual
framework of cross-competency cooperation whose mission is to reduce or eliminate
bureaucratic stovepipes, increase organizational alignment, facilitate more open
communication and operate more efficiently. The formal chains-of-command do not
currently reflect that alignment, or — explicitly at least — that vision.
When Admiral Vern Clark gave VADM Nathman the responsibility for solving
naval aviation’s readiness and recapitalization challenges after the third CNO Executive
Board, Nathman was serving not just as the Commander, Naval Air Forces Pacific Fleet
(AIRPAC), but also as the incumbent “Air Boss.” The Air Boss role had referent rather
than positional authority and had traditionally been split on a rotational basis between the
two aviation Type Commanders or TYCOMs.3
3 The Commander, Naval Air Forces Atlantic Fleet in Norfolk is known as AIRLANT and its Pacific
Fleet counterpart in San Diego is known as AIRPAC.

35
The TYCOMs are administrative commands (as contrasted to the three-star
operational fleet commanders) responsible for training, manning and equipping naval
aviation through command oversight of the various aircraft Type/Model/Series (TMS)
commodores known as TYPEWINGs.4 The TYCOMs are also responsible for the
training, manning and equipping of the Navy’s aircraft carrier fleet, although there is no
analogous intermediate level of command between the flag officers at the TYCOM level
and carrier commanding officers.
As a strong proponent of alignment, ADM Clark was weary of hearing two often-
differing points of view from naval aviation leadership at the three-star, “train, man and
equip” level. In response, CNO re-aligned AIRLANT as a two-star command reporting
directly to the VADM Nathman, the three-star commander of AIRPAC in San Diego in a
“lead/follow” arrangement. The previously honorific “Air Boss” position became
formally instituted in the role of the Commander, Naval Air Forces (CNAF), charged
with setting policy on both coasts. Having aligned the naval aviation TYCOMs, CNO
expected Nathman to suppress the culture of consumption that was “using up” future
capacity in favor of a “cost-wise” readiness culture — the right readiness, at the right
time, at the right cost (W. Massenburg, personal communication, March 5, 2008).
With real authority over the TYCOM structure on both coasts Nathman did what
he could within his own command to encourage a culture of rigorous requirements
analysis and culture change, but he faced resistance in various quarters to the notion of
extending the enterprise vision to the SYSCOMs (Perkins, 2007). When VADM
Massenburg became the NAVAIR commander (having previously been a strenuous
supporter of alignment, first as NAVAIR’s Assistant Commander for Logistics, and later
as Assistant Commander for Aviation Depots), he telephoned VADM Mike Malone
(Nathman’s relief as the CNAF Air Boss) to “report for duty.” Massenburg insisted that
there could only be one leader — one “single process owner,” or “SPO,” and that the task
4 “Type/Model/Series” (TMS) is a taxonomic means of classifying aircraft. An F/A-18C for example
would be of the Type “Fighter/Attack” (F/A), Model number “-18” and Series “C” in the production run. For the sake of maintenance, training and operational efficiency, TMS aircraft are commonly grouped geographically while shore based and under the administrative command of a wing “commodore” (hence, “TYPEWING”) who reports to the Type Commander on his respective coast (i.e., AIRLANT or AIRPAC).

36
of the SPO and his team would be to define the metrics where success would be
measured across the entire aviation enterprise. RDML Harnitchek at NAVICP joined,
completing the triad and a conceptual framework fell into place (W. Massenburg,
personal communication, March 5, 2008).
Even after having agreed among themselves that CNAF would be the SPO for the
NAE, barriers to enterprise-wide execution remained. CNAF is an Echelon II command,
meaning that the commander reports directly to the Chief of Naval Operations. But both
NAVSUP and NAVAIR are systems commands, meaning that while their flag officers
and support staffs (also Echelon II commands) report directly to CNO, their subordinate
Program Executive Offices (PEOs) and acquisition program managers are statutorily
required to report directly to the Assistant Secretary of the Navy for Research,
Development and Acquisition (ASN RD&A). Fundamentally, what this meant was that a
fortuitously congenial association of personalities propelled NAVAIRSYSCOM and
NAVICP to work under the direction of a CNAF in support of a single, fleet-driven
metric more than did any formal structure or process. This will prove important in later
discussions about the Carrier Readiness Team, or CRT.
2. Mission and Vision
The mission of the NAE is to support the fleet and unified commanders by
supplying combat ready naval aviation forces that are fully trained, properly manned,
interoperable, well maintained and supported. The formal vision of the NAE is contained
in the document “Naval Aviation Vision 2020.”
The vision of the NAE is to deliver the right force, with the right readiness, at the right cost, at the right time — today, and in the future. This vision drives the NAE toward the construct of single process ownership, vital toward establishing a culture of Cost-Wise Readiness — one with improved materiel management, more balanced logistics support, and higher availability through faster turnaround times. Essential to achieving Cost-Wise Readiness is understanding our total force cost structure, managing cost reductions, and making sound investments as a cohesive Enterprise. The efficiency and effectiveness of the NAE will be measured by the single Fleet-driven metric of aircraft ready for tasking at reduced cost.
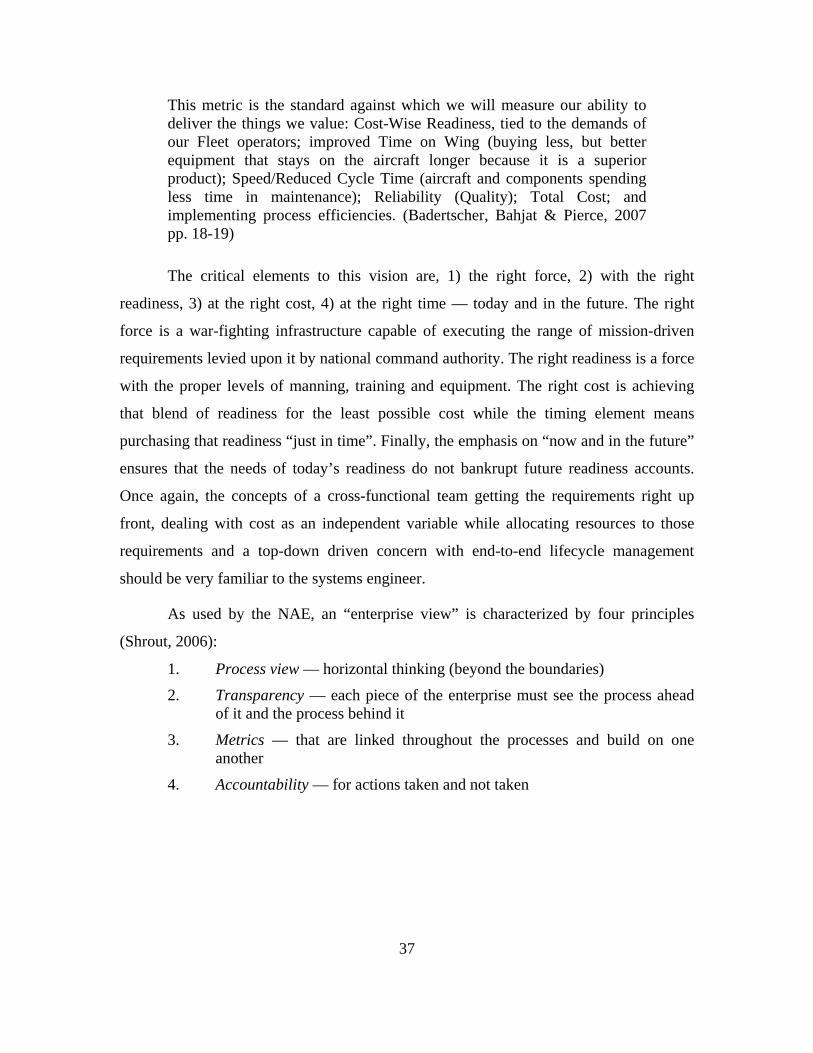
37
This metric is the standard against which we will measure our ability to deliver the things we value: Cost-Wise Readiness, tied to the demands of our Fleet operators; improved Time on Wing (buying less, but better equipment that stays on the aircraft longer because it is a superior product); Speed/Reduced Cycle Time (aircraft and components spending less time in maintenance); Reliability (Quality); Total Cost; and implementing process efficiencies. (Badertscher, Bahjat & Pierce, 2007 pp. 18-19)
The critical elements to this vision are, 1) the right force, 2) with the right
readiness, 3) at the right cost, 4) at the right time — today and in the future. The right
force is a war-fighting infrastructure capable of executing the range of mission-driven
requirements levied upon it by national command authority. The right readiness is a force
with the proper levels of manning, training and equipment. The right cost is achieving
that blend of readiness for the least possible cost while the timing element means
purchasing that readiness “just in time”. Finally, the emphasis on “now and in the future”
ensures that the needs of today’s readiness do not bankrupt future readiness accounts.
Once again, the concepts of a cross-functional team getting the requirements right up
front, dealing with cost as an independent variable while allocating resources to those
requirements and a top-down driven concern with end-to-end lifecycle management
should be very familiar to the systems engineer.
As used by the NAE, an “enterprise view” is characterized by four principles
(Shrout, 2006):
1. Process view — horizontal thinking (beyond the boundaries)
2. Transparency — each piece of the enterprise must see the process ahead of it and the process behind it
3. Metrics — that are linked throughout the processes and build on one another
4. Accountability — for actions taken and not taken

38
Figure 8 below represents a conceptual model of the NAE (from Perkins, 2007).
Figure 8. NAE Conceptual Framework
3. Tasks
The strategic goals are found in the “Naval Aviation Vision 2020” document
published in 2007:
1. Balance current and future readiness
2. Reduce the cost of doing business
3. Enhance agility
4. Improve alignment
5. Attain and maintain visibility across the enterprise
Goals number 1, 2 and 4 have been discussed in detail previously. “Enhancing
agility” refers to a process-driven effort to more quickly respond to the needs of
stakeholders up and down the chain of command, whether those are the requirements of a
combatant commander for surge forces, or whether it be an isolated requirement in a fleet
squadron or aircraft carrier. At the leadership level, attaining and maintaining visibility
across the enterprise refers to maintaining managerial insight into the various “business

39
lines” that contribute to the single, fleet-driven metric — aviation units, ready for tasking
at reduced cost, now and in the future. In practical terms, it is also a method of pushing
change down throughout the enterprise: TYPEWING commodores for example, are not
only empowered to seek efficiencies and change behaviors at the local level, they are
held accountable for doing so.
E. MAPPING STRATEGY TO TASKS — ORGANIZATION, ACTIONS, TOOLS AND METHODS
1. Organization
As an agent of top-down driven change, the NAE is comprised of the following
core stakeholders: The Commander, Naval Air Forces (CNAF), serves as the Chief
Executive Officer, the Commander, Naval Air Systems Command (NAVAIR) is the
Chief Operating Officer, and the Director, Air Warfare Division (N78) serves as the
Chief Financial Officer. Other core members include the Deputy Commandant for
Aviation at Headquarters, Marine Corps, the Chief of Naval Air Training (CNATRA) and
OPNAV Director of Fleet Readiness (N43). These five flag and general officers are
referred to collectively as the Executive Command, or EXCOM.
Other stakeholders at the Board of Directors (BOD) level include flag officers
from NAVSUP, Commander, Fleet Forces Command (CFFC), the Naval Strike and Air
Warfare Center (NSAWC), Deputy Secretaries of the Navy (DASN) for Aviation and
Logistics, Naval Network Warfare Command (NNWC), the Naval Education and
Training Command (NETC), Space and Naval Warfare Systems Command (SPAWAR),
the Naval Sea Systems Command (NAVSEA), Naval Military Personnel Command
(NMPC) and the Commander, Naval Installations Command (CNI).
Beneath this executive level are flag officer-led cross-functional teams including
the Naval Aviation Readiness Integrated Improvement Program (NAVRIIP) CFT run by
CNAL.5 In 2004, the Carrier Readiness Team sprang out as an offshoot of the NAVRIIP
5 The reader will remember that NAVRIIP was the air readiness initiative that followed closely on the
heels of the NAPPI effort to streamline pilot production, and is still the cornerstone of the NAE.
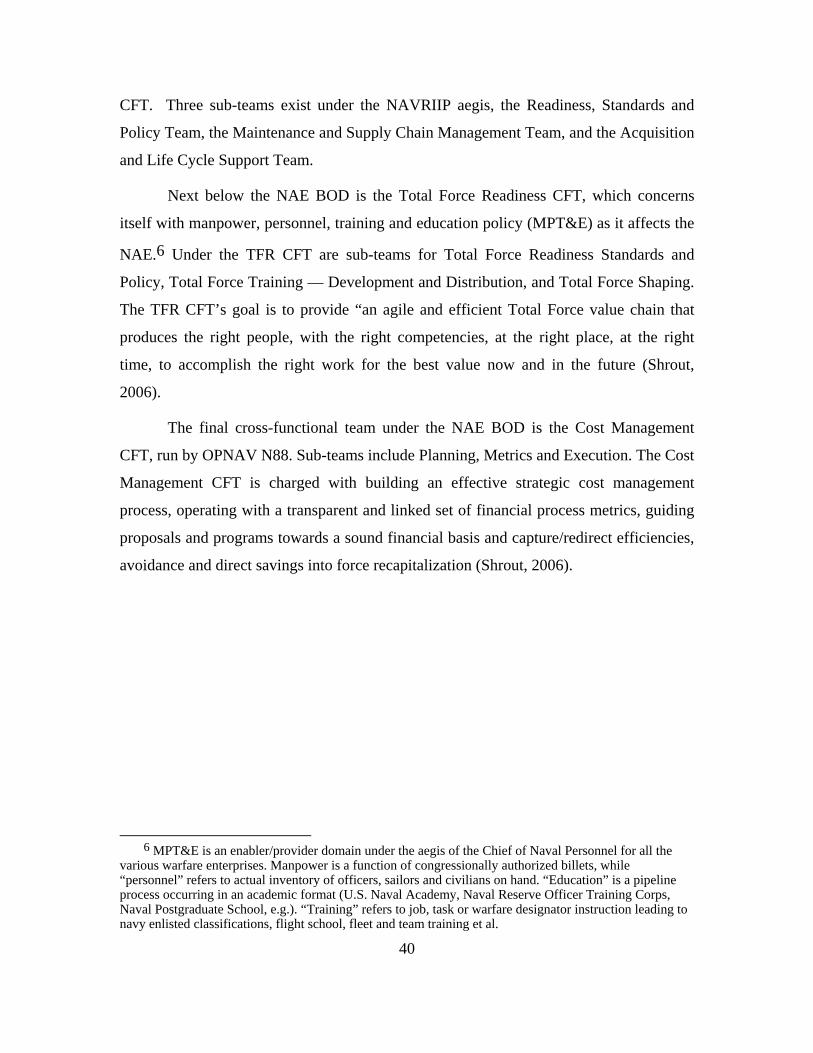
40
CFT. Three sub-teams exist under the NAVRIIP aegis, the Readiness, Standards and
Policy Team, the Maintenance and Supply Chain Management Team, and the Acquisition
and Life Cycle Support Team.
Next below the NAE BOD is the Total Force Readiness CFT, which concerns
itself with manpower, personnel, training and education policy (MPT&E) as it affects the
NAE.6 Under the TFR CFT are sub-teams for Total Force Readiness Standards and
Policy, Total Force Training — Development and Distribution, and Total Force Shaping.
The TFR CFT’s goal is to provide “an agile and efficient Total Force value chain that
produces the right people, with the right competencies, at the right place, at the right
time, to accomplish the right work for the best value now and in the future (Shrout,
2006).
The final cross-functional team under the NAE BOD is the Cost Management
CFT, run by OPNAV N88. Sub-teams include Planning, Metrics and Execution. The Cost
Management CFT is charged with building an effective strategic cost management
process, operating with a transparent and linked set of financial process metrics, guiding
proposals and programs towards a sound financial basis and capture/redirect efficiencies,
avoidance and direct savings into force recapitalization (Shrout, 2006).
6 MPT&E is an enabler/provider domain under the aegis of the Chief of Naval Personnel for all the
various warfare enterprises. Manpower is a function of congressionally authorized billets, while “personnel” refers to actual inventory of officers, sailors and civilians on hand. “Education” is a pipeline process occurring in an academic format (U.S. Naval Academy, Naval Reserve Officer Training Corps, Naval Postgraduate School, e.g.). “Training” refers to job, task or warfare designator instruction leading to navy enlisted classifications, flight school, fleet and team training et al.
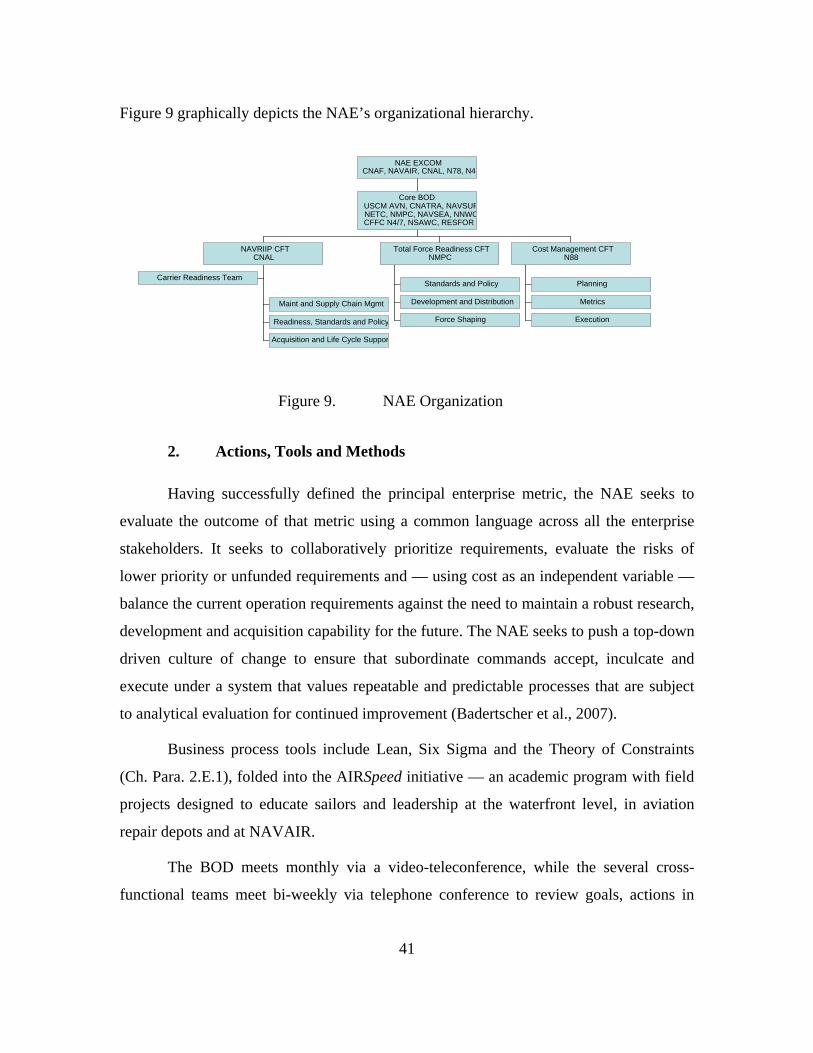
41
Figure 9 graphically depicts the NAE’s organizational hierarchy.
Figure 9. NAE Organization
2. Actions, Tools and Methods
Having successfully defined the principal enterprise metric, the NAE seeks to
evaluate the outcome of that metric using a common language across all the enterprise
stakeholders. It seeks to collaboratively prioritize requirements, evaluate the risks of
lower priority or unfunded requirements and — using cost as an independent variable —
balance the current operation requirements against the need to maintain a robust research,
development and acquisition capability for the future. The NAE seeks to push a top-down
driven culture of change to ensure that subordinate commands accept, inculcate and
execute under a system that values repeatable and predictable processes that are subject
to analytical evaluation for continued improvement (Badertscher et al., 2007).
Business process tools include Lean, Six Sigma and the Theory of Constraints
(Ch. Para. 2.E.1), folded into the AIRSpeed initiative — an academic program with field
projects designed to educate sailors and leadership at the waterfront level, in aviation
repair depots and at NAVAIR.
The BOD meets monthly via a video-teleconference, while the several cross-
functional teams meet bi-weekly via telephone conference to review goals, actions in
Carrier Readiness Team
Maint and Supply Chain Mgmt
Readiness, Standards and Policy
Acquisition and Life Cycle Suppor
NAVRIIP CFTCNAL
Standards and Policy
Development and Distribution
Force Shaping
Total Force Readiness CFTNMPC
Planning
Metrics
Execution
Cost Management CFTN88
Core BODUSCM AVN, CNATRA, NAVSUPNETC, NMPC, NAVSEA, NNWCCFFC N4/7, NSAWC, RESFOR
NAE EXCOMCNAF, NAVAIR, CNAL, N78, N43
42
progress and new work. This “drumbeat” of important leadership representatives and
execution agents is considered critical to knowledge sharing and continued process
improvement.
At the flight line execution level, Enterprise AIRSpeed is overseen at the
TYPEWING level, with local commodores striving to smooth out the demand signal for
resource entitlements across the readiness cycle through predictive management and in-
process oversight of squadron, AIMD and Naval Inventory Control Point (NAVICP)
demands and services. TYPEWING Commodores report to the NAE BOD in a rotation
of monthly video-teleconferences and the flag panel scrutinizes their performance against
the single, fleet-driven metric.
Depot AIRSpeed is deployed across all three NAE maintenance depots; Cherry
Point, NC, Jacksonville, FL and North Island, CA. Depot AIRSpeed seeks to capitalize
on the improvements generated by the use of Lean Six Sigma and Theory of Constraints
at NAS Lemoore at each of the depots, reducing cycle times, increasing throughput,
decreasing work-in-process and lowering costs.
NAVAIR AIRSpeed “extends the success already realized by Depot and
Enterprise AIRSpeed to transactional and non-production service environments”
(Badertscher et al., 2007 p. 23). In essence, NAVAIR AIRSpeed attempts to align the
culture of the SYSCOM headquarters, program executive offices, program managers and
integrated product teams under a customer support architecture driven by fleet needs —
now and in the future, adopting (or reinvigorating) a total lifecycle view.
F. CHAPTER SUMMARY
A series of fiscal shocks to the naval aviation system in the late 1990s drove
leadership to leave the comfort of the culturally, institutionally and organizationally
familiar and embark on a journey of top-down driven focus on requirements, risk and
costs. With a favorable alignment of personalities in place, stakeholders accustomed to
operating within their own stovepipes agreed to collaborating as an enterprise, starting
with the definition of a single metric for success, focused on fleet readiness at reduced
cost, now and in the future. Modern business process tools were used to reduce waste,

43
increase production, reduce cycle time and return savings to the Navy for reinvestment in
current operating accounts or future acquisitions.
As a result of this process, pilot and naval flight officer production was
streamlined, garnering the enterprise $150 million in direct savings and cost avoidance.
Jet engine rework at NAS Lemoore increased time-on-wing for F404 engines, reduced
rework cycle times, eliminated backlogs and resulted in personnel savings of $5 million
per year. Additionally, the ability of NAS Lemoore to take up the production capacity of
other intermediate maintenance departments resulted in significant savings as slack
capacity was eliminated. Nine AIMD facilities were consolidated into five in 2005 and
three in 2006, yielding a personnel and infrastructure savings of over $160 million over
six years (Massenburg & Pierce, 2007). In 2001, the Navy had been hard pressed to
deploy four fully equipped, trained and manned carrier and carrier air wing teams. By the
fall of 2002, alignment initiatives permitted CNO to deploy seven aircraft carriers and air
wings to Operation IRAQI FREEDOM with an eighth in reserve for other contingencies.
By 2005, Enterprise AIRSpeed had resulted in over $160 million in savings while
executing the Flying Hour Program and supporting Operations IRAQI FREEDOM and
ENDURING FREEDOM — money that could be spent on other operations and
maintenance accounts (OMN) or else plowed back into recapitalization accounts: While
the Navy proposed to purchase 201 aircraft in FY2000 for delivery in 2005, it only
bought 110. In FY 2004, the Navy proposed buying 303 aircraft and is on track to
purchase 249 — a 28 percent increase.
The enterprise approach to managing the business of naval aviation demonstrated
that it could bear significant fruit for the aviation business lines. Yet to be proven was
whether these processes could be adapted to the aircraft carrier force.

44
THIS PAGE INTENTIONALLY LEFT BLANK
45
III. THE CARRIER READINESS TEAM
A. INTRODUCTION
1. Background
In July 2004, the USS John F. Kennedy was conducting flight operations in the
Arabian Gulf when it collided with a small fishing boat of the type known in the region
as a dhow. Although there were no injuries aboard the aircraft carrier itself, the dhow —
which was never identified — was lost with all hands. Following an investigation in
August of that same year, the Commander of the Fifth Fleet, headquartered in Bahrain,
relieved the ship’s commanding officer “for cause,” remarking that he had lost
confidence in the captain’s ability to command the ship. The relieved CO was assigned
temporary duties at the headquarters of the Commander, Naval Air Forces Atlantic Fleet
(CNAL).
Then-Rear Admiral Denby Starling was the commander at CNAL when the
Kennedy’s former CO was re-assigned to his staff for temporary duty. As the CNAL
commander, Starling was responsible for the NAVRIIP program in the NAE architecture
as depicted in Figure 9, p. 41. That role entails maintaining insight into and improvement
of what is known as “current readiness,” i.e., the capability of ships and squadrons in
actual operation or preparing for operations to execute their mission tasking.
In private conversation with the Kennedy’s captain after the mishap Starling
learned that the ex-CO had taken command of the aircraft carrier at a customary time,
towards the end of the ship’s training cycle, during the carrier’s Joint Task Force
Exercise — the last major exercise the ship would conduct prior to deployment.
Unknown to the captain of a ship with 3000 personnel permanently attached, a number of
very experienced and well-trained officers and enlisted watch standers in the operations,
deck and navigation department rotated to shore duty in the relatively short interval
between his assumption of command and the ship’s deployment to the Arabian Gulf,
leaving behind them less capable replacements who had joined the ship later in the
46
training cycle. These gaps in his crews’ experience base lined up on a moonless night in
July 2004, placing his ship and its mission in jeopardy and costing an unknown number
of Arabian Gulf mariners their lives.
Not by way of making excuses, but rather in explanation, the former CO told
Admiral Starling that, unlike the aviation readiness reporting system, there was no system
in use across the carrier force that enabled a carrier CO to really know how well-trained
and effective his watch standers were at any given time. His readiness reports indicated
that the ship was fully trained despite significant variations in watch stander experience
and proficiency. These variations resulted in significant weakness “on the bench” that
collectively contributed to the mishap, weaknesses that were only revealed in retrospect.
Aircraft carrier training and readiness progress is reported to higher authority via
a mechanism known as the Status of Resources and Training System (SORTS). A ship
progresses towards a deployment-ready training readiness metric by executing Fleet
Exercise Publication (FXP) requirements. These FXP requirements are distributed to
each department aboard ship in varying quantities; the Medical Department has only a
handful for example, while the Operations Department is responsible for over a hundred.
An FXP contains the outline of a training event, a performance requirement for
successful execution and a periodicity for expiration. FXPs that are relatively easy to
accomplish can have periodicities as low as one month, while more complex or resource-
intensive exercises such as missile shoots expire over a longer period, often as much as
24 months. For the purposes of SORTS, a ship that is “in periodicity,” for most or all of
its assigned FXPs, is considered fully trained.
Both RADM Starling and the former CO of the Kennedy had risen through the
aviation ranks prior to their eventual selection for carrier command, and this “hull-based”
system of building, maintaining and communicating readiness contrasted to the aviation
squadron reporting system with which both were familiar. In an aviation squadron
training accrues to individual aircrew and if a particularly well-trained or experienced

47
airman rotates out of the squadron for shore duty without an equally well-trained
replacement the squadron will of necessity report a diminution in the status of their
training readiness.
The problem, as Admiral Starling realized, was that while our shipboard training
process assigned training value to the ship’s hull, we do not train machines; we train the
people who operate them (D. Starling, personal communication, February 5, 2008). This
realization prompted Starling to stand up a Carrier Readiness Team (CRT) reporting to
his Current Readiness CFT. His broader goal, apart from fixing the obvious training
reporting issue, was to leverage the techniques used by the NAE to gain control of
resource inputs and readiness outputs in the carrier system.
Much of the NAVRIIP effort that RADM Starling had overseen in his cross-
functional team had been dedicated to getting the alignment of training resources right in
the aviation business for current readiness. Fundamentally, the challenge was to get the
right resources to the right squadron at the right time (and at the right cost) in order to
generate the appropriate level of readiness based on the squadron's position in the
readiness cycle. From a systems engineering point of view, NAVRIIP was intended to get
a predictable output from the readiness generation “black box” based on a predictable
input in the form of resources. Directly applying these aviation processes to a ship-
focused readiness team proved more challenging than anyone initially realized.
There are significant variable costs to operating the air arm of the naval air force.
Each additional flying hour comes with a defined cost as measured in aviation fuel, spare
parts and maintenance man-hours. From the standpoint of financial analysis and
management, this has been both a boon and a curse. It has been a boon because costs are
relatively easy to recognize and the Lean Six Sigma RDMAICSI process is easy to
integrate, especially in such production oriented endeavors as intermediate- and depot-
level maintenance. With a sound understanding of the cost of generating readiness (the
flying hour input), it was relatively simple for the TYPEWING action officers to create
balanced output signals in the form of readiness. This system also enabled them to
enunciate mission area risks and readiness impacts linked to resource shortages. Thus, the
aircraft, support and ancillary equipment, manning and flying hour budgets were
48
regularized using an entitlement process, smoothing out the lifecycle cost of generating
readiness while reducing or eliminating many wasteful, consumption-driven behaviors.
The direct linkage between the cost of generating readiness and the result of that
readiness has been a curse partly because the size of the flying hour budget ($2.8 billion
in the FY2007 President’s Budget Submission) makes it an attractive target for fiscal
raids. Even for the military, $2.8 billion is a lot of money, and having it all “just sitting
there” at the beginning of a fiscal year can be very seductive to cash-strapped
commanders. Another source of attractiveness is the fact that flying hour “tap” is
relatively easy to close, allowing for a rapid re-programming of resources for emergent
priorities that either were not included in or did not survive the customary two-year
Planning, Programming, Budgeting System (PPBS) process.
Within certain regulatory and statutory constraints, re-programming allocated
flying hour funds in an execution year is as simple as phoning the commander of an air
wing — usually the one furthest away from deployment — and ordering him to slow or
temporarily stop flight operations. This has allowed naval aviation and indeed Navy
leadership to reprogram money from flying hour accounts into emergent, unfunded
priorities outside the normal process. Both the initial increment of the Navy Marine
Corps Intranet (NMCI) contract and the 2005 lease of the Swedish diesel submarine
Gotland for the training of Pacific Fleet surface ships were funded by execution year re-
programming of flying hour funds, just for two examples.7
While there was — and is — no simple analogue to the flying hour budget for
aircraft carrier variable costs, the initial efforts of the CRT evolved around getting better
insight on cost in order to deliver a single, fleet-driven metric of their own around which
to coalesce the efforts of multiple stakeholders: Aircraft carriers ready for tasking at
reduced cost.
7 In the case of NMCI in particular, this in-execution year reprogramming of money proved a mixed
blessing, as Congress challenged the Navy’s use of money apportioned for one purpose to what ought, in the minds of many congressmen and staffers, to have been a new acquisition program, subject to customary congressional scrutiny in the appropriations process.

49
B. ARCHITECTURE
1. Developing the Model
When then-Captain David Buss returned from a successful deployment
commanding USS John C. Stennis in the autumn of 2004, the single, fleet-driven metric
of “aircraft carriers ready for tasking at reduced cost” had not yet been arrived upon.
Upon his ship’s return to homeport, he had anticipated a short period of rest and
relaxation prior to a homeport change in preparation for a six-month maintenance period
in the dockyards. Instead VADM James Zortman, then serving as the Commander, Naval
Air Forces, summoned CAPT Buss to Coronado, California. Zortman had been in close
contact with RADM Starling (his deputy at AIRLANT) on the topic of carrier training
and readiness and asked Buss to stand up a new cross-functional sub-team under the
NAVRIIP CFT. The initial tasking that Zortman gave the captain was to develop an
integrated cost and capability model for both ships and air wings. Part of that tasking, at
least implicitly, was that Buss’s Carrier Readiness Team (CRT) would serve as an
analogue to the TYPEWING commodores for aircraft carriers. Significantly, that
authority was referent rather than positional — the CRT was envisioned as an “influence”
organization that would raise changes up to flag leadership for endorsement rather than
push them directly down. Buss was a serving carrier CO assigned to a specific task set by
naval aviation leadership — this did not make him a primus inter pares with his 10 peers
in carrier command.
Over a three-month period, and in consultation with VADM Massenburg, CAPT
Buss developed his own triangle for the fleet, providers and resources as in Figure 8 (p.
38). OPNAV remains the primary resource sponsor, both through the N1 (Personnel) and
N43 (Fleet Readiness Division) codes. Along with legacy NAE stakeholders, such as
NAVAIR and NETC (and excluding Headquarters Marine Corps), additional members in
the enabler/provider domains include:
1. The Aircraft Carrier Program Office - PMS-312, which is responsible for
lifecycle management within Program Executive Office — Carriers.

50
2. Two codes within the Naval Sea Systems Command (NAVSEA) — NAVSEA Code 04 (Logistics, Maintenance and Industrial Operations) and NAVSEA Code 08 (Naval Reactors).
3. The Space and Air Warfare Systems Command (SPAWAR).
2. Architecture
Given how fresh were the lessons of the Kennedy mishap in the minds of the NAE
Board of Directors, the first sub-pillar of the Carrier Readiness Team was chosen to be
the issue of carrier training. This team was at first labeled the Operational Readiness
Team, although later it would come to encompass the MPT&E pipeline, supporting
shipboard manning and become known as the Training and Personnel Readiness Team,
or TPRT.
Systems engineers concern themselves with the development and acquisition of a
system, and are taught to consider all aspects of the system over its entire lifecycle. Both
systems engineers and program managers are taught to manage cost as an independent
variable as a part of their acquisition strategy. In a similar way, a prime driver behind
enterprise behavior is to determine the requirement through a top-down method and link
requirements to output — in this case, to execute mission tasking at a reduced cost.
CAPT Buss realized that the first priority before going after cost drivers was
gaining an understanding of what was being measured, knowing that continuous process
improvement philosophies teach that what can be measured can be altered. He therefore
built a Metrics Team that would attempt to gain insight on those things which 1) lent
themselves to measurement, and 2) whose changes would have significant impact on
cost, efficiency and effectiveness.8 Finally, Buss created a Life-Cycle Maintenance
Team, since it was at least intuitively obvious that significant sums were spent on carrier
maintenance. Pulling CAPT Tom Moore (as of this writing a rear admiral-select) from
PMS-312 aboard to lead this team, they came to the conclusion that their focus would not
be on new construction ships or complex refueling overhauls lasting over multiple years,
8 Another important element of Lean Six Sigma is the so-called “Pareto Principle” or “80/20 rule,”
which in the business process improvement context states “80 percent of your effects are driven by 20% of your processes.”
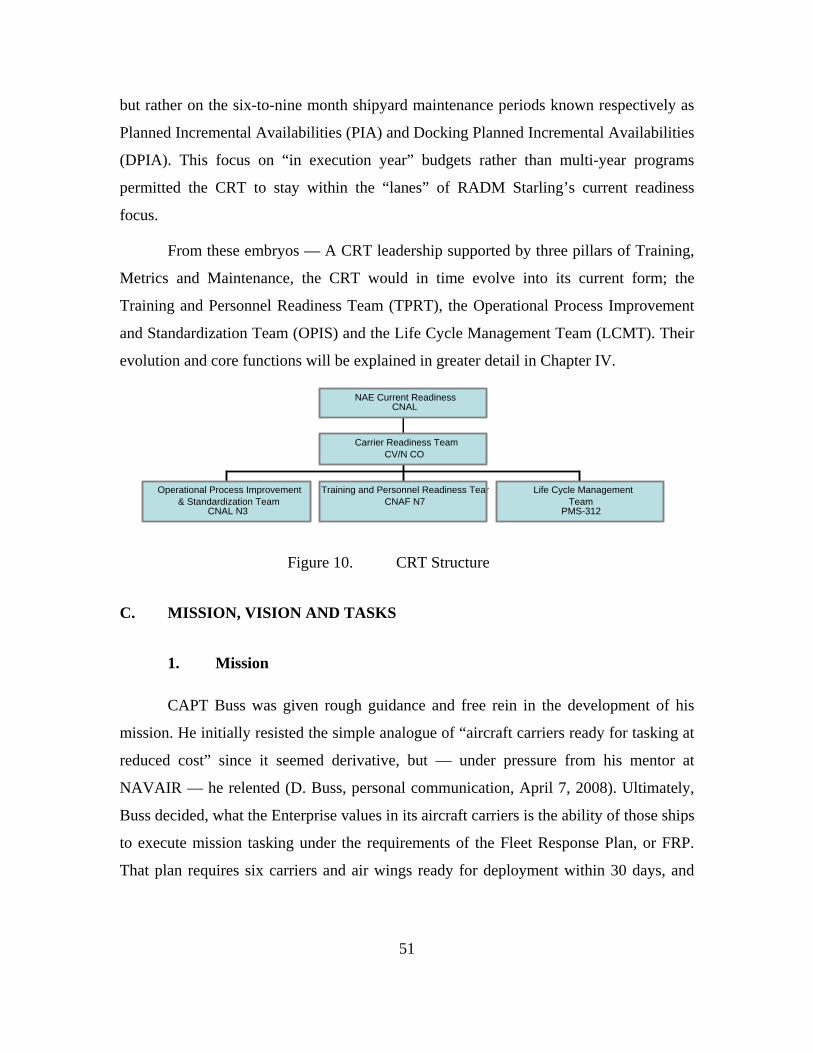
51
but rather on the six-to-nine month shipyard maintenance periods known respectively as
Planned Incremental Availabilities (PIA) and Docking Planned Incremental Availabilities
(DPIA). This focus on “in execution year” budgets rather than multi-year programs
permitted the CRT to stay within the “lanes” of RADM Starling’s current readiness
focus.
From these embryos — A CRT leadership supported by three pillars of Training,
Metrics and Maintenance, the CRT would in time evolve into its current form; the
Training and Personnel Readiness Team (TPRT), the Operational Process Improvement
and Standardization Team (OPIS) and the Life Cycle Management Team (LCMT). Their
evolution and core functions will be explained in greater detail in Chapter IV.
Operational Process Improvement& Standardization Team
CNAL N3
Training and Personnel Readiness TeamCNAF N7
Life Cycle ManagementTeam
PMS-312
Carrier Readiness TeamCV/N CO
NAE Current ReadinessCNAL
Figure 10. CRT Structure
C. MISSION, VISION AND TASKS
1. Mission
CAPT Buss was given rough guidance and free rein in the development of his
mission. He initially resisted the simple analogue of “aircraft carriers ready for tasking at
reduced cost” since it seemed derivative, but — under pressure from his mentor at
NAVAIR — he relented (D. Buss, personal communication, April 7, 2008). Ultimately,
Buss decided, what the Enterprise values in its aircraft carriers is the ability of those ships
to execute mission tasking under the requirements of the Fleet Response Plan, or FRP.
That plan requires six carriers and air wings ready for deployment within 30 days, and

52
one carrier (originally two) ready to deploy within 90 days. During 2007-2008, this
resource availability has come to be framed under the heading of Ao, or “Operational
Availability.”
The emphasis on Ao reflects the stress of a constant combatant commander
demand signal in the face of decreasing numbers of assets: Our carrier force, which stood
at 12 hulls for many years now, stands at 11 with the retirement of USS John F. Kennedy,
and will soon shrink to 10 hulls for a time when USS Kitty Hawk retires (2008), and
before the commissioning of USS George H.W. Bush (2009). By 2008, it had, to a large
degree, superseded in importance work on delivering the right readiness at the right time,
with reduced cost.
2. Vision and Tasks
In principle, the CRT vision aligns with the overall vision of the NAE: Provide
the right force, with the right readiness, for the right cost, at the right time — now and in
the future. In theory, it creates in CNAF a single-process ownership that is “vital toward
establishing a culture of Cost-Wise Readiness - one with improved materiel management,
more balanced logistics support, and higher availability through faster turnaround times”
(Badertscher et al., 2007, p. 18). In the conclusion, we will discuss how neatly reality
meshes with the theory.
CAPT Buss was clearly charged with rectifying the deficiencies of the training
process that led to the Kennedy mishap and gave birth to the CRT concept. He also knew
that he would have to get a handle on life-cycle cost of carrier ownership (also know as
“total ownership cost, or TOC), but that task was — and is — daunting. As Figure 11
below shows, manpower costs generate very nearly half of the TOC for a Nimitz-class
aircraft carrier over the course of its 50-year lifecycle. The next largest wedge is depot-
level maintenance, which — when combined with modernization — together take up a 41
percent share and which, when combined with manpower costs, generate 87 percent of
TOC.
Although efforts are ongoing to reduce both the number of personnel aboard ship
and the pay grades at which they serve in order to confront manpower costs — efforts

53
that have in fact generated significant savings in an absolute sense — it is very difficult to
make much of a mark against so large a cost center: A 25 percent reduction of TOC
based only on manpower savings would require a nearly 50 percent reduction in manning
— not likely.
Of the 13 percent left over, training accounts for only 2 percent of TOC in direct
costs, so unlike the aviation Flying Hour Program analogue, proportionately compelling
savings are harder to generate.
Allocation of VAMOSC CostsCarrier Ships FY02-06
47%
1%2%
2%2%2%2%1%
36%
5% 0%
ManpowerTAD + PCSTrainingFuelSupplies & ExpendablesPurchased ServicesRepair Parts & RepairablesI-Level MaintenanceDepot MaintenanceModernizationOther
Figure 11. Aircraft Carrier Cost Drivers9
NAE leadership asked the CRT to perform as an influence organization charged
with helping to solve three of the NAE’s five “Strategic Gaps.” Those gaps are:
1. Future carrier inventory potentially below current requirements.
2. Airframe capacity below requirement. *
9 Data drawn from the Navy Visibility and Management of Operating and Support Costs website,
“VAMOSC,” http://www.navyvamosc.com/.
* Not tasks charged to the CRT.

54
3. Today’s weapons systems must evolve to pace the threat.*
4. O&M/N will be insufficient to support legacy platforms.
5. MPN/RPN and O&M/N will be insufficient to pay for the workforce to support the current force structure.
D. MAPPING STRATEGY TO TASK
1. Driving Change
When the Commander, Naval Air Forces (the “Air Boss” in the NAE construct)
wanted to push a culture of cost-wise readiness down to his aviation squadrons, the
TYPEWING commanders were natural executive agents for his agenda. They were
senior in military rank to the squadron commanders, on scene, had direct ties to the
squadrons and support infrastructure (supply and intermediate maintenance, once the
AIMDs were re-aligned under the TYPEWING) and were well schooled in the specific
community issues of each aviation platform. The Air Boss gave them the authority to
make changes under a cost-wise readiness construct — some would argue that they had
always had it (D. Starling, personal communication, February 5, 2008) — and, crucially,
they were held accountable for doing so.
Unlike the aviation TYPEWING construct, no intermediate level of
administrative command stands between the Air Boss and his aircraft carrier
commanding officers10. VADM Zortman and RADM Starling (CNAF and CNAL,
respectively) were left to choose between carving out a new command echelon from their
existing staffs or outsourcing the work to one of the carrier COs — billet growth to form
10 The distinction between operational and administrative command is important in this context. Under
the Fleet Response Plan, all ships in an “employability window” (i.e., ships not engaged in CNO-approved maintenance availabilities) are OPCON (operationally controlled) by their immediate senior in command, typically a one- or two-star flag officer who in turn reports directly to a fleet commander. That fleet commander reports to the Commander, Fleet Forces Command (CFFC) who in turn reports to a Combatant Commander (COCOM) for the task of providing operational forces. Administrative command (ADCON) refers to a TYCOM’s enduring responsibility as an Echelon 2 command under CNO to train, man, maintain and equip the units in his domain. An aviation squadron commander reports via two chains: Administratively through his TYPEWING commander, who in turn reports to the TYCOM, that flag officer reporting to CNO; operationally through his carrier air wing commander, who in turn reports to the ISIC, thence to the fleet commander, and on to CFFC and the COCOMs. Carrier COs, as “major commanders,” report administratively directly to their TYCOM.

55
a new command element from scratch was considered a non-starter under the cost-wise
philosophy. In the event, the flag officers selected CAPT Dave Buss to lead the CRT
while his ship was engaged in a nine-month long Docking PIA. RADM Starling’s
thinking was that while Buss’s responsibility for managing the progress of the Stennis
work package while in the shipyard was non-trivial, he had excess managerial capacity to
take on workload compared to his peers making preparations for getting underway or
actually in training or deployed.
As Stennis came closer to completing her maintenance work and prepared for sea
trials, leadership of the CRT passed first to CAPT Kevin Donegan, CO of USS Carl
Vinson after he brought his ship from Everett, Washington to Newport News, Virginia for
a refueling complex overhaul (RCOH) 11 in 2006. CAPT Ted Carter, who continues in
the CRT leadership role as of this writing, relieved Donegan as both carrier CO and CRT
head at the successful conclusion of Donegan’s tour in 2007.
This process of burdening the commanding officer of the “off duty” carrier with
CRT leadership has led to some interesting consequences, significant among which is
that the CRT leader is an influence agent rather than a command element. Since he is a
peer among the cohort of carrier COs, and, for the ambitious among them — they are
uniformly ambitious — he is also a collegial competitor. Unlike the TYPEWING
commander, the CRT leader can neither grant his peers any authority to change their
behavior that they do not already have, nor hold them accountable for failing to do so.
His ability to drive change in the aircraft carrier force rests upon his ability to
successfully marshal consensus among the carrier COs. Alternatively, he might hope to
successfully influence the flag officer leadership at the TYCOM to adopt his change
recommendations and then turn them around to the carrier COs as formal guidance.
11 An RCOH is the most significant and complex maintenance period a carrier will undergo in its
planned 50-year lifecycle, encompassing reactor refueling, combat system upgrades, and overhaul of the ship’s hull, mechanical and electrical systems. An RCOH typically spans a three-year shipyard period.

56
2. Measuring Change
It is a commonplace but nevertheless accurate management aphorism that “You
can’t manage what you don’t measure.” Measurement allows management to determine
trend lines. If the goal is process improvement, measurement of contributing processes is
critical to discover whether changes are making the processes better or worse.
The Thomas Group’s philosophy of Process Value Management has at its core
two elements: First — just as in Lean Six Sigma — a change “champion” must step up to
the leadership plate committed and empowered to drive culture change from the top
down. Second — very similar to the Theory of Constraints — the Thomas Group
preaches that every contributing thread in a process can be measured, that some of them
will be important (the Pareto Principle). Finally, they teach that anything that can be
measured can be changed. This leads them to selection of the proper metrics as one of
their most critical functions.
A good “metric” has several desirable features:
It should be instinctively meaningful and difficult to manipulate. Its definition must be understandable and uniformly applied. It improves as the underlying process improves and degrades as the underlying process degrades. In addition to these attributes, the metrics must be hierarchical to allow information to roll-up to a higher level of reporting and have the capability to drill-down to individual unit level. (Perkins, 2006)
For the CRT, the first challenge was defining an output measure — that one
“main thing” about which all of the several contributing inputs revolved in order to get
the value stream map correctly charted: The single, fleet driven metric (SFDM). A “main
thing” metric may have numerous contributing results or output metrics, each of which
must have at least one input, or “driver” metric. As discussed above, that metric initially
arrived upon was “aircraft carriers ready for tasking at reduced cost.” CAPT Buss
determined that what the U.S. Navy valued in its carrier force was the ability to
efficiently operate the ships at an appropriate level of capability based on their position in
the training cycle. Little was expected of ships leaving a maintenance period for sea trials
but the ability to get underway from port safely and return uneventfully from sea. A great
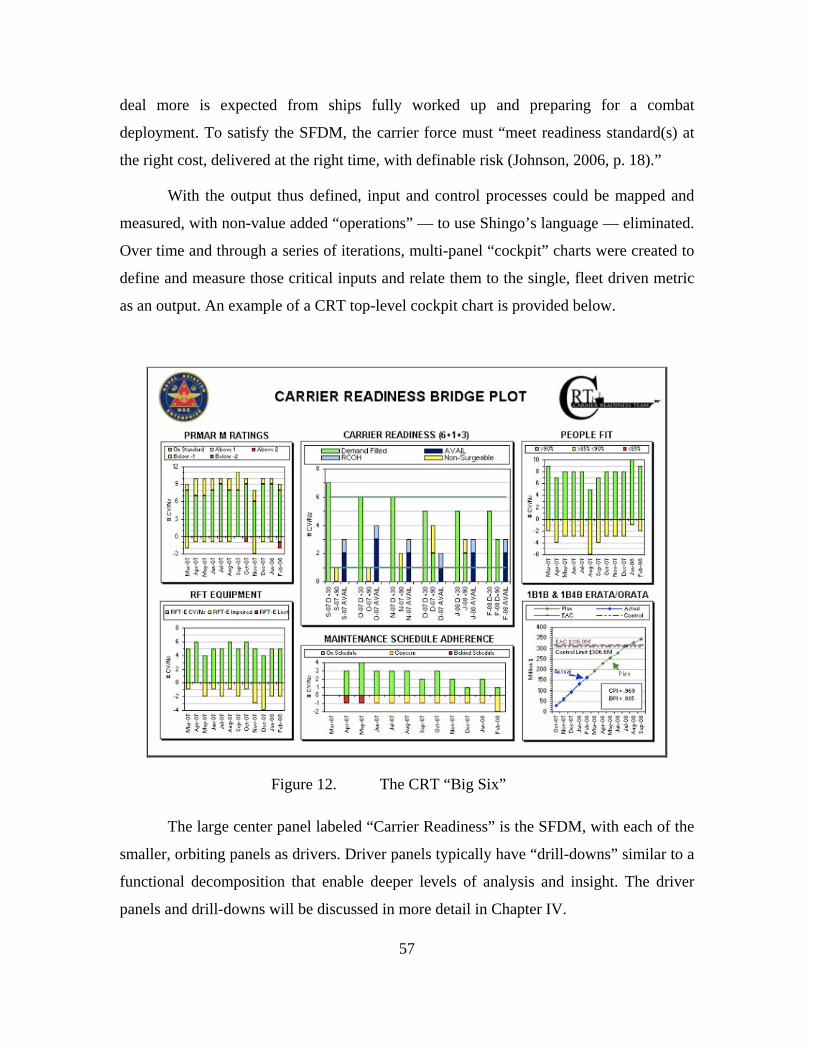
57
deal more is expected from ships fully worked up and preparing for a combat
deployment. To satisfy the SFDM, the carrier force must “meet readiness standard(s) at
the right cost, delivered at the right time, with definable risk (Johnson, 2006, p. 18).”
With the output thus defined, input and control processes could be mapped and
measured, with non-value added “operations” — to use Shingo’s language — eliminated.
Over time and through a series of iterations, multi-panel “cockpit” charts were created to
define and measure those critical inputs and relate them to the single, fleet driven metric
as an output. An example of a CRT top-level cockpit chart is provided below.
Figure 12. The CRT “Big Six”
The large center panel labeled “Carrier Readiness” is the SFDM, with each of the
smaller, orbiting panels as drivers. Driver panels typically have “drill-downs” similar to a
functional decomposition that enable deeper levels of analysis and insight. The driver
panels and drill-downs will be discussed in more detail in Chapter IV.

58
Below is an expanded view of the SFDM.
Figure 13. Carriers Ready for Tasking
Starting from the left hand side in this view, we see that in December 2007,
CNAF had 7 carriers ready to deploy within the first 30 days (as against an FRP demand
signal of 6 ready in 30 days and one in 90 days). One was non-surgeable (no air wing to
embark), two were in maintenance availabilities and one in a long term RCOH. In
February 2008, on the far right side of the slide, we note that we take on risk with respect
to the FRP demand signal, since we only have 5 ready carriers within 30 days, but two in
90-day back-up, and three in some form of maintenance.
With this kind of insight, the Air Boss could see at a glance whether or not he
would meet the COCOM demand signal and communicate mission risk up his chain of
command. He could drill-down into the drivers and inputs to re-allocate resources, if he
felt that the risk was inappropriate to the threat, and he will have been reminded of the

59
importance of ships completing their scheduled maintenance availabilities in a timely
fashion, since late deliveries from the shipyard are not only exceptionally expensive, they
have downstream effects on carrier readiness for deployment. Significantly, under the
NAE construct, all of the several contributors to the SFDM are aware that the Air Boss is
cognizant of their contributions to the SFDM, undoubtedly helping to increase
performance through the Hawthorne Effect.12
E. RISKS AND BENEFITS
1. Keeping the Horse in Front of the Cart
One of the core assumptions behind the continuous process improvement
philosophy adopted by businesses and seized upon by the NAE is that there is always
room to operate more efficiently. In the business world, efficiencies are commonly found
in certain reductions: cycle time, finished goods inventory, industrial wastage, and
defects. Efficiency increases are sought in first pass yield, quality and customer
satisfaction to name just a few. These efficiencies reduce costs and increase profit
margins, permitting enterprises to re-invest in new product lines, tailor production
capacity to demand in an agile fashion, seek new markets, reward shareholders and re-
invest in their human capital, among other choices. The important thing is that, properly
executed, efficiencies drive results.
Flag officers, like successful businessmen, tend to be highly results oriented.
Unlike businessmen, they also tend to rotate in and out of the billets they occupy over a
comparatively brief period of time. For an illustrative example, Mr. Rick Wagoner has
been the president and chief executive officer of General Motors from 2000 through
12 The Hawthorne Effect refers to the discovery that measuring processes by itself tends to improve
them. An efficiency expert increased the lighting on a factory floor and discovered that worker productivity improved. When the lighting was reduced, performance also improved. This puzzle was ultimately solved when analysts realized that the workers were reacting to the fact that their productivity was being measured rather than any effect of lighting. This anecdotal conclusion can and has been overused: Hawthorne Effect productivity improvements tend to be temporary without real improvements in process. Nevertheless, it is difficult to improve what you have not measured, and flag officer interest in a metric tends to result in senior staff officer fascination with it. In turn, subordinate action officers are often riveted.

60
today (2009). By contrast, over the same time frame there have been three functional
“CEOs” of the Naval Aviation Enterprise since its inception in 2003, even if not all of
them explicitly wore that title.
Senior flag officers have a great deal to do, and little time to do it in. Because they
need to make a significant mark on their claimancies in the short time allotted to them,
staff officers working under flags officers can feel real or imagined pressure to deliver
results rather than efficiency improvements yielding results — a subtle but crucial
distinction. Additionally, resource sponsors at the Pentagon operated under budgetary
pressures of their own and are frequently handed “marks” or funding rescissions from in-
execution year budgets that they must pass on to the enterprise in the form of so-called
“tax” — a dollar figure against either an execution year budget or a future year in the
defense spending plan that must be forfeited. In such cases the result drives the process
rather than the process yielding results, and the cost cart is placed in front of the
efficiency horse.
One such example was the so-called “Top Six Roll-down” imposed upon the
NAE by OPNAV N1 in 2006. N1’s theory was that the seniority of the “top six” enlisted
ranks had crept up over the course of the years, and that a roll-down could be
implemented to return their pay grades to a lower level. This would generate savings in
payroll accounts to pay for a bill that had been levied across the Navy. The TYCOMs
used the CRT’s influence among the results-oriented cohort of carrier COs to generate a
list of pay grade roll-downs rated as high, medium or low risk and that satisfied the fiscal
requirement. The COs and their personnel staffs duly returned a spreadsheet containing
their recommendations to the TYCOM. All of the “low” and “medium” pay grade
reductions were promptly executed, leaving only the high-risk roll-downs untouched.
But while the cost figure was almost immediately satisfied, the “price” of this
transaction is still playing out. It soon became clear that certain en route training schools

61
that delivered critical Navy Enlisted Classifications (NECs)13 were tied to pay grades:
First enlistment E-5s were ineligible for the training required by the billet they were
being sent to fill and that had previously been occupied by a second term E-6.
Additionally, because the Bureau of Personnel is free to fill a billet “one up or one down”
— one pay grade higher or lower than that called for by the ship’s manning document —
it became possible for a billet formerly occupied by a career-oriented first class petty
officer to be rolled down to a first term second class petty officer and actually filled by a
junior third class petty officer. This can represent a difference of ten years’ experience
and might ripple through the many hundreds of billets subject to the roll down aboard any
given ship with consequences that may only become clear in retrospect.
If the risks of hard charging results oriented senior officers charging off at the
sound of a budgetary gun are non-trivial, the benefits of their focus has been significant.
Under the aegis of the Training and Personnel Readiness team, a great deal of work and
several million dollars has gone into the development of a carrier training and readiness
matrix designed to give carrier COs greater insight into the training of their actual crew
members (vice their hulls), along with a state-of-the-art software tool to enable them to
manage their training. The Life-Cycle Management Team (LCMT) was assigned a goal
of $25 million per year across the future years defense plan (FYDP), but due to their
efforts the CRT projects a total of $653 million in cost savings and avoidances through
FY 2015. An Operational Process Improvement and Standardization (OPIS) Team has
achieved several “quick wins” as a way of building enthusiasm for a plan to establish a
culture of sustained, continuous process improvement.
13 The NEC system supplements the enlisted rating structure, augmenting it by identifying non-rating
wide training, skills, aptitude of qualifications an individual has earned and which may be critical to the billet he will fill aboard ship. We know little about an Aviation Ordnanceman by the fact that he wears the rate of AO1 on his sleeve, but if we know that he is NEC coded as an AO-6813, we know that is an Airborne Weapons Technical Manager. BUPERS and the manning control authority actively manage both ratings and NECs.

62
F. CHAPTER SUMMARY
1. Getting It Mostly Right
The carrier force has successfully appropriated the NAE’s cost-wise readiness
structure and approach to management. Operating under the aegis of the Current
Readiness CFT, the Carrier Readiness Team has busily set itself at the task of
determining what the drivers are that contribute to the delivery of carriers ready for
tasking at reduced cost. Their efforts have successfully aligned many contributing
streams of value from several previously stove piped organizations in support of the
single, fleet driven metric.
The CRT reports on a monthly basis to the Current Readiness CFT leadership,
and quarterly to the NAE Board of Directors, ensuring that NAE leadership maintains
visibility across the enterprise.
Challenges remain. CRT leadership remains restricted to an “advisor/influencer”
role, rather than being empowered and accountable for change. As a winged naval aviator
in command of an organization where nearly every uniformed officer wears wings,
VADM Massenburg could choose to “report for duty” under the Air Boss, but the
NAVSEASYCOM commander has a responsibility to the commanders of the submarine
and surface forces as well. Being geographically distributed, NAVSEA may have more
significant cultural barriers to overcome than did the single-sited NAVAIR to aligning
internally and externally to the culture of cost-wise readiness and a fleet-driven metric.
Finally, the rotation of leadership at the top of several organizations — CNAF, NAVAIR,
NAVSEA, NAVSUP — means that the initial enthusiasm for alignment driven by
passionate advocates for change must continue to be patiently stoked by those who
follow after, lest “inertia become the constraint” in an environment that the author
tentatively describes as “Flag Attention Deficit Disorder,” or FADD: Highly driven and
successful leaders may find it preferable to foster their own innovations rather than polish
the innovations of their predecessors.
Chapter VI will discuss recommendations to ameliorate these challenges.

63
IV. CRT COMPONENT PILLARS
A. INTRODUCTION
1. Execution
Chapter III focused on the genesis of the CRT as an outgrowth of the NAPPI
process under the aegis of the Current Readiness CFT, and in direct response to a fatal
collision at sea that revealed deficiencies in the way that the training our aircraft carrier
crews is assessed. Chapter III was upward facing, describing the guidance imposed by
NAE leadership and the response to that guidance by CRT leadership, especially in the
development of a rigorous metric that all stakeholders could align under and contribute to
in generating affordable readiness aboard operational carriers.
This chapter will be downward facing, examining the construction and work
effort of the various sub-pillars within the CRT: The Training and Personnel Readiness
Team, the Life-cycle Management Team, and the Operational Process Improvement and
Standardization Team. 14
B. TRAINING AND PERSONNEL READINESS TEAM
1. Fixing Carrier Training
Commander Steve Beck Von Peccoz, Operations Officer of USS John C. Stennis
serving under CAPT Buss, initially led the Training and Personnel Readiness Team
(TPRT). Other members of the TPRT included all of the carrier operations officers in the
aircraft carrier force and the leadership of the Carrier Training department at
Commander, Naval Air Forces on both coasts. Two Thomas Group “resultants” were
attached to the team to help them shape their efforts. The team set up bi-weekly telephone
conferences to enforce diligence on “actions in process,” generate process improvement
14 The author was very closely associated with the CRT over the course of the last three years, and
much of the following comes from his personal observations and notes.

64
proposals and staff ad hoc “process action teams” to service those proposals. “Barrier
removal teams” were stood up as needed to fully develop the contours of seemingly
insuperable problems and elevate them to a command echelon capable of dealing with
them. Semi-annual face-to-face meetings were conducted to solidify the team’s mission,
vision and values while enabling multi-stakeholder review and feedback of work actions
in process and strategy going forward.
The bi-weekly telephone conferences are an essential element of the workgroup
“drumbeat,” enforcing culture of individual and team responsibility for the execution and
out-briefing of progress on actions in process. The semi-annual face-to-face meetings are
exercises in teambuilding and cultural reinforcement. These subordinate meetings are
scheduled so as to precede the meetings of the superior Carrier Readiness Team, whose
own drumbeat is synchronized with monthly NAE Board of Director meetings. Similar
management structures and meeting drumbeats were laid in place by the TPRT’s peers at
the Life-Cycle Maintenance Team (LCMT) and Operational Process Improvement and
Standardization (OPIS) Team, thus pushing down the overall NAE emphasis on
enterprise behavior and culture change.
Based on the Kennedy mishap, the very clear guidance of the TPRT was to
develop a new readiness measurement system to augment and — eventually, it was
hoped, supplant — the legacy FXP/SORTS based system. CAPT Buss and the NAE
leadership were clearly concerned about costs and risks, but the initial guidance was to
get the training readiness metric right first, believing that a cost understanding would
soon follow afterwards. From that cost understanding, smart risk decisions could then be
made (D. Buss, personal communication, April 7, 2008).
The charter of the TPRT was to build a training and operations management tool
that defined, measured and reported carrier operational readiness tied to the individuals
assigned to the ship and the resources required to achieve that readiness. This tool would
come to be known as CV SHARP — a typically dense naval abbreviation meaning
“Carrier Sierra Hotel Readiness Reporting Program.” “In scope” work was defined as
65
readiness across the FRP, tied to an entitlement by “R-month.” Implicitly this meant the
creation of and adoption of a personnel-based training and readiness matrix construct
comparable to those used by aviation units.
An initial, homegrown attempt to generate a carrier training and readiness matrix
analogous to that used by aviation squadrons was undertaken by the leadership of USS
Teddy Roosevelt in early 2005. Approximately 600 individual training events were
generated for the 3000-member ship’s company. Lacking a software tool to manage the
load however, the effort fell apart under its own weight. The TPRT used this matrix as
the starting point for the development of a software acquisition program to track the
training matrix, winnowing it down to approximately 350 training events by choosing to
focus only on watch standers aboard the ship — roughly 1800 people. Additionally, the
team was charged with ensuring that the new readiness tool would be able to link in with
other readiness reporting initiatives both within Navy and in the Office of the Secretary
of Defense (OSD).
The OSD linkage was critical because the rest of DoD was moving towards
capability-based assessment15 of readiness vice completion-based syllabi. The OSD
readiness reporting strategy is to deploy a multi-service reporting system, known as the
Defense Readiness Reporting System (DRRS), to support this capabilities-based
assessment process. The Navy’s component of this system is known as DRRS-Navy, or
DRRS-N. Like most things in the military, this change was driven top down: From
National Security Strategy, DoD developed the National Defense and National Military
Strategies. This in turn shaped Joint Strategy and a Unified Joint Task List supported by
Joint Mission Essential Task Lists — JMETL’s.
15 “Capability-based” means that a unit has demonstrated the ability to execute a certain mission to a
defined standard with a definable degree of confidence vs. risk. A “completion based” reporting system is one that is based on a unit having performed a task sometime in the past, but without emphasis on standards and risk. In the former example a performance based assessment might ask that an FA-18 strike a target with a miss distance of no more than 6 meters in all weather conditions greater than 95% of the time, whereas the latter might only ask that an FA-18 pilot execute four bombing sorties in a training environment over a 90 day period.

66
Figure 14. Navy Mission Essential Task List Functional Flow
Underneath and supporting the Joint Strategy are the strategies of the component
services, including the Naval Strategy with its associated Navy Task List and Navy
Mission Essential Task List (NMETL). These NMETLs consist of many tasks (NMETs),
as well as associated conditions and standards for each task.
At a very high level an NMET might consist of overarching (or system-wide)
capabilities such as “execute air defense,” with that NMET containing multiple
contributing sub-categories in a hierarchical structure very similar to a systems
engineering functional decomposition. Ultimately — just as in the systems engineering
process — tasks (analogous to functional requirements) are parsed into functional
analysis for resource allocation. Thus, what begins as a top-level requirement for the
Navy to “execute air defense” for deployed forces becomes a series of component tasks
such as “Provide CAP Radio Control” (task), “In all weather and visibilities” (conditions)
“With 98 percent success rate, while in a tactical environment” (standard).

67
Plan Air DefeDefense
1.1
Sense AirspPassively
1.2.1
Sense AirspActively
1.2.2
Build ADPicture
1.2
Employ ADMissiles
1.3.1
Launch AircAircraft1.3.2.1
Provide RaControl1.3.2.2.1
Provide VoControl1.3.2.2.2
Provide DatControl1.3.2.2.3
ControlAircraft1.3.2.2
Air RefueCAP
1.3.2.3
RecoverAircraft1.3.2.4
Re-armAircraft1.3.2.5
Employ AD CAP1.3.2
Employ DefeCountermeas
1.3.3
Employ ADWeapons
1.3
Execute AiDefense
1.0
Figure 15. NMET Roll-up Example16
In this example, executing each of the three component tasks under Control
Aircraft (1.3.2.2) under the stipulated condition set and to the appropriate standard would
turn that NMET “green,” meaning that the unit had capability in that area. Two of the
five NMETs at that level of deconstruction that have not yet met standards (1.3.2.3 and
1.3.2.4) so they are color-coded “Yellow,” meaning, “mission ready with risk”. The next
level up is therefore also coded yellow (1.3.2). The “Employ Air Defense Weapons”
NMET (1.3) has two of three subordinate NMETs green and one yellow, so under the
business rules in effect, that NMET may be shown as green with an enclosed yellow
triangle marker indicating that a subordinate measure has not yet met overall standards.
Ultimately, while DRRS-N intends to capture not merely the training readiness for each
NMET, but a broader based roll-up under the so-called “PESTO” umbrella — five pillars
consisting of Personnel, Equipment, Supply, Training and Ordnance readiness. CV
SHARP only currently contributes to the “T” pillar.
16 This is a generic illustration; actual NMETs and their associated conditions and standards are
classified.
68
Satisfying the OSD reporting requirement was an emergent requirement that took
the CV SHARP government and industry integrated product team off their main task of
developing a mature training matrix and training information management system to
manipulate that matrix for several months. This diversion of effort was critical to
satisfying OSD’s vision in a timely fashion — the Air TYCOM could not afford be seen
as insensitive to the requirements of the Secretary of Defense. The main vision remained
nevertheless intact, albeit deferred by several months: Although DRRS attaches
operational capabilities to units rather than the individuals aboard each unit and the broad
capability to determine a unit’s capability in specific mission areas is important at the
joint level, a greater degree of granularity was still desired at the TYCOM level since the
Air Boss is tasked with efficiently training, manning and equipping his force throughout
its employability cycle.
With the Air Boss remaining committed to deeper insight into the training and
proficiency of watch standers actually on board his ships, the TPRT decided to satisfy
both OSD’s and CNAF’s requirements using a common training event input — the new
carrier training and readiness matrix — combined with an information management
system. In order to avoid confusion (since there can be only one “official” readiness
metric) the CNAF output was labeled “Operational Training Accomplishment,” or OTA.
A watch stander completing a training event from the new matrix generates OTA points
that contribute to both an R-month value for training — the right training at the right time
— and an absolute value compared to a fully trained, deployment ready standard. Those
same training events were then mapped to NMETs and a generic training plan established
to provide the kind of outputs needed to satisfy the DRRS-N metric. Having satisfied the
DoD requirement, further development of metric assigning training value to people
metric was not uneventful.
The initial concept mirrored the P-3 Orion community’s training matrix: There
are 14 crewmen aboard an operational P-3, a large, land-based anti-submarine and sea
control aircraft. Since the composition of P-3 crews are kept relatively stable for
standardization’s sake, the P-3 community can track the training of 4 “core” crew
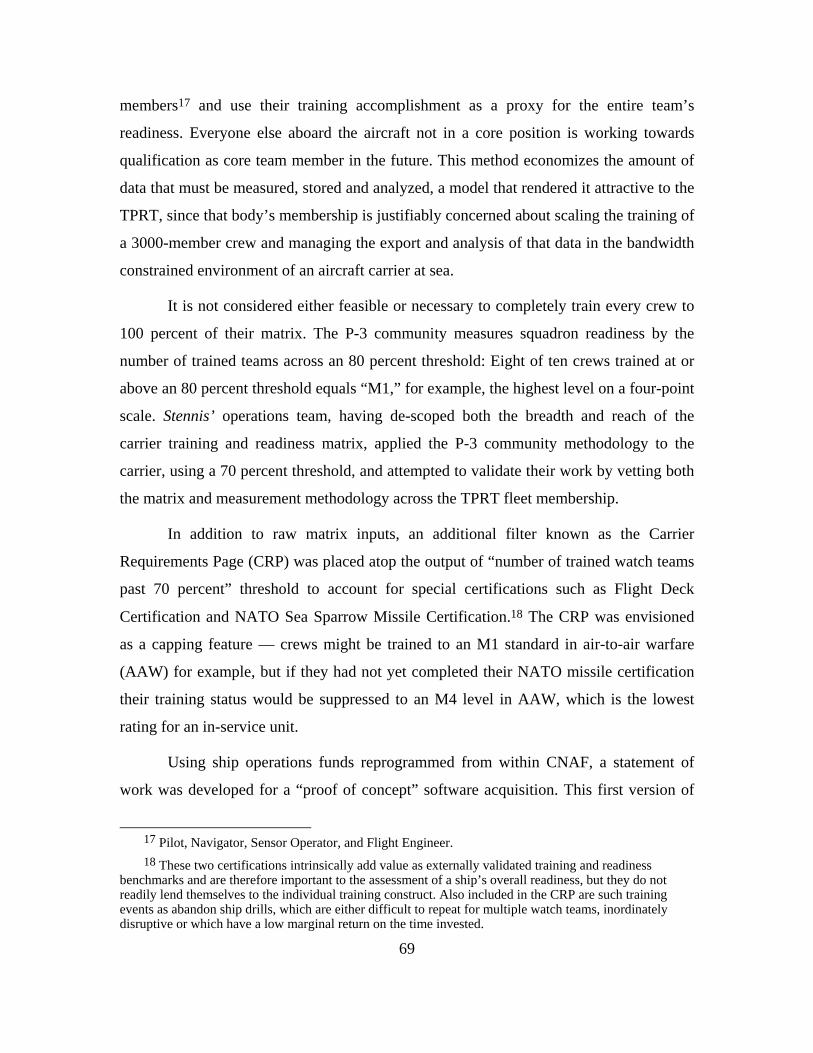
69
members17 and use their training accomplishment as a proxy for the entire team’s
readiness. Everyone else aboard the aircraft not in a core position is working towards
qualification as core team member in the future. This method economizes the amount of
data that must be measured, stored and analyzed, a model that rendered it attractive to the
TPRT, since that body’s membership is justifiably concerned about scaling the training of
a 3000-member crew and managing the export and analysis of that data in the bandwidth
constrained environment of an aircraft carrier at sea.
It is not considered either feasible or necessary to completely train every crew to
100 percent of their matrix. The P-3 community measures squadron readiness by the
number of trained teams across an 80 percent threshold: Eight of ten crews trained at or
above an 80 percent threshold equals “M1,” for example, the highest level on a four-point
scale. Stennis’ operations team, having de-scoped both the breadth and reach of the
carrier training and readiness matrix, applied the P-3 community methodology to the
carrier, using a 70 percent threshold, and attempted to validate their work by vetting both
the matrix and measurement methodology across the TPRT fleet membership.
In addition to raw matrix inputs, an additional filter known as the Carrier
Requirements Page (CRP) was placed atop the output of “number of trained watch teams
past 70 percent” threshold to account for special certifications such as Flight Deck
Certification and NATO Sea Sparrow Missile Certification.18 The CRP was envisioned
as a capping feature — crews might be trained to an M1 standard in air-to-air warfare
(AAW) for example, but if they had not yet completed their NATO missile certification
their training status would be suppressed to an M4 level in AAW, which is the lowest
rating for an in-service unit.
Using ship operations funds reprogrammed from within CNAF, a statement of
work was developed for a “proof of concept” software acquisition. This first version of
17 Pilot, Navigator, Sensor Operator, and Flight Engineer. 18 These two certifications intrinsically add value as externally validated training and readiness
benchmarks and are therefore important to the assessment of a ship’s overall readiness, but they do not readily lend themselves to the individual training construct. Also included in the CRP are such training events as abandon ship drills, which are either difficult to repeat for multiple watch teams, inordinately disruptive or which have a low marginal return on the time invested.

70
CV SHARP was labeled V1.0, and represented little more than a web-based graphical
user interface permitting users to manipulate an Excel spreadsheet. The goal was to
demonstrate that the OTA theory of readiness measurement was feasible and that the
shipboard culture would accept the change from departmentally managed training
accomplishment to one “owned” by each individual watch stander. Ultimately, VADM
Zortman set a goal that CV SHARP and SHARP (the previously existing aviation
squadron version of the software that manipulates personnel-based training data of
aviators) report one combined readiness number for all of the operational forces in his
domain.
Told by his staff that it would take approximately one year to deliberately develop
the training requirement set and applicable software, the Air Boss challenged them to
complete it in six months. His staff took up the challenge — taking on schedule,
performance and cost risks — while enunciating the intent to use an evolutionary
acquisition strategy with the potential for future blocks of capability through upgraded
releases.
The USS Stennis, exiting the shipyards at the end of her maintenance period
(December 2006), was the initial test bed for the training matrix and software
management system. As Stennis got underway for sea trials, leadership of the TPRT
shifted to the Force Training department head (N7) at CNAF, who used a “black box”
functional decomposition process to continue to develop the next generation system
requirements and architecture.
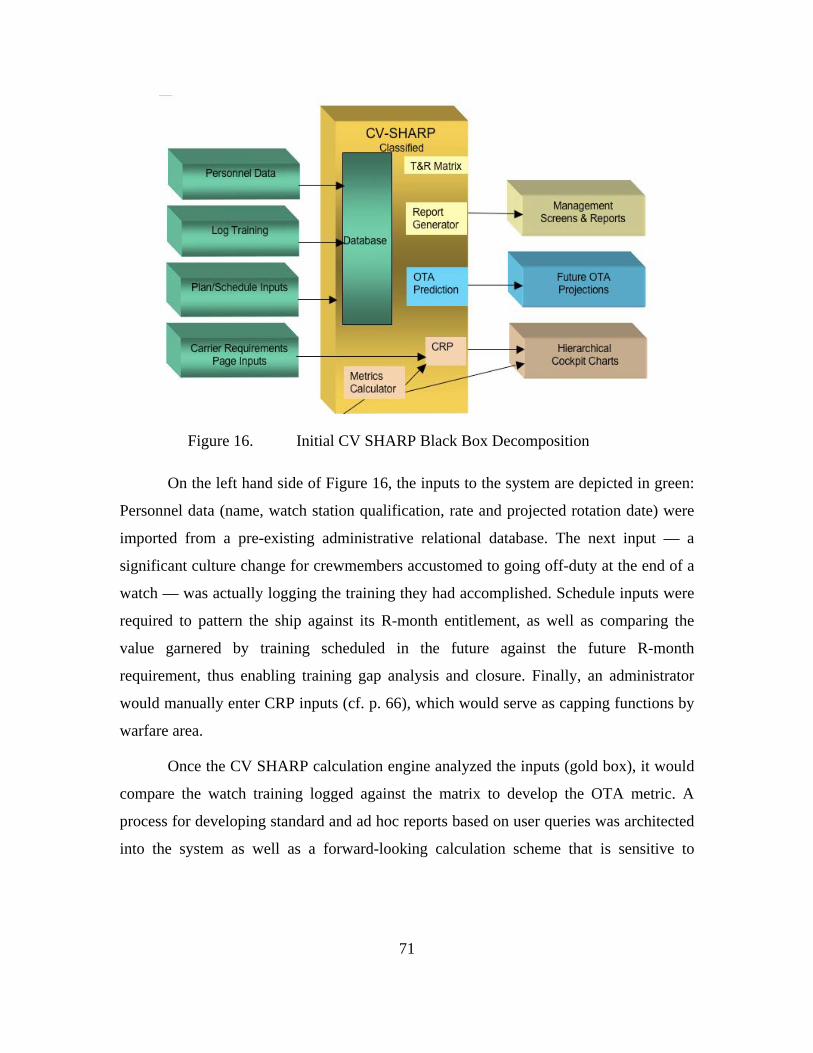
71
Figure 16. Initial CV SHARP Black Box Decomposition
On the left hand side of Figure 16, the inputs to the system are depicted in green:
Personnel data (name, watch station qualification, rate and projected rotation date) were
imported from a pre-existing administrative relational database. The next input — a
significant culture change for crewmembers accustomed to going off-duty at the end of a
watch — was actually logging the training they had accomplished. Schedule inputs were
required to pattern the ship against its R-month entitlement, as well as comparing the
value garnered by training scheduled in the future against the future R-month
requirement, thus enabling training gap analysis and closure. Finally, an administrator
would manually enter CRP inputs (cf. p. 66), which would serve as capping functions by
warfare area.
Once the CV SHARP calculation engine analyzed the inputs (gold box), it would
compare the watch training logged against the matrix to develop the OTA metric. A
process for developing standard and ad hoc reports based on user queries was architected
into the system as well as a forward-looking calculation scheme that is sensitive to
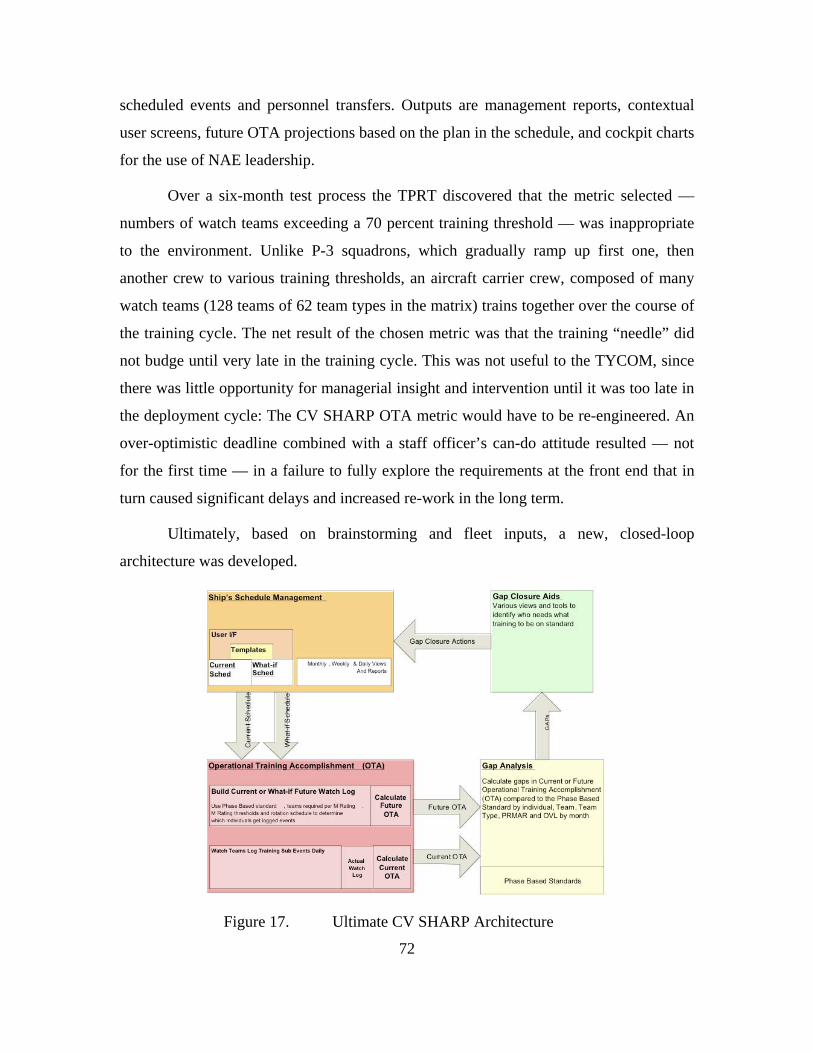
72
scheduled events and personnel transfers. Outputs are management reports, contextual
user screens, future OTA projections based on the plan in the schedule, and cockpit charts
for the use of NAE leadership.
Over a six-month test process the TPRT discovered that the metric selected —
numbers of watch teams exceeding a 70 percent training threshold — was inappropriate
to the environment. Unlike P-3 squadrons, which gradually ramp up first one, then
another crew to various training thresholds, an aircraft carrier crew, composed of many
watch teams (128 teams of 62 team types in the matrix) trains together over the course of
the training cycle. The net result of the chosen metric was that the training “needle” did
not budge until very late in the training cycle. This was not useful to the TYCOM, since
there was little opportunity for managerial insight and intervention until it was too late in
the deployment cycle: The CV SHARP OTA metric would have to be re-engineered. An
over-optimistic deadline combined with a staff officer’s can-do attitude resulted — not
for the first time — in a failure to fully explore the requirements at the front end that in
turn caused significant delays and increased re-work in the long term.
Ultimately, based on brainstorming and fleet inputs, a new, closed-loop
architecture was developed.
Figure 17. Ultimate CV SHARP Architecture
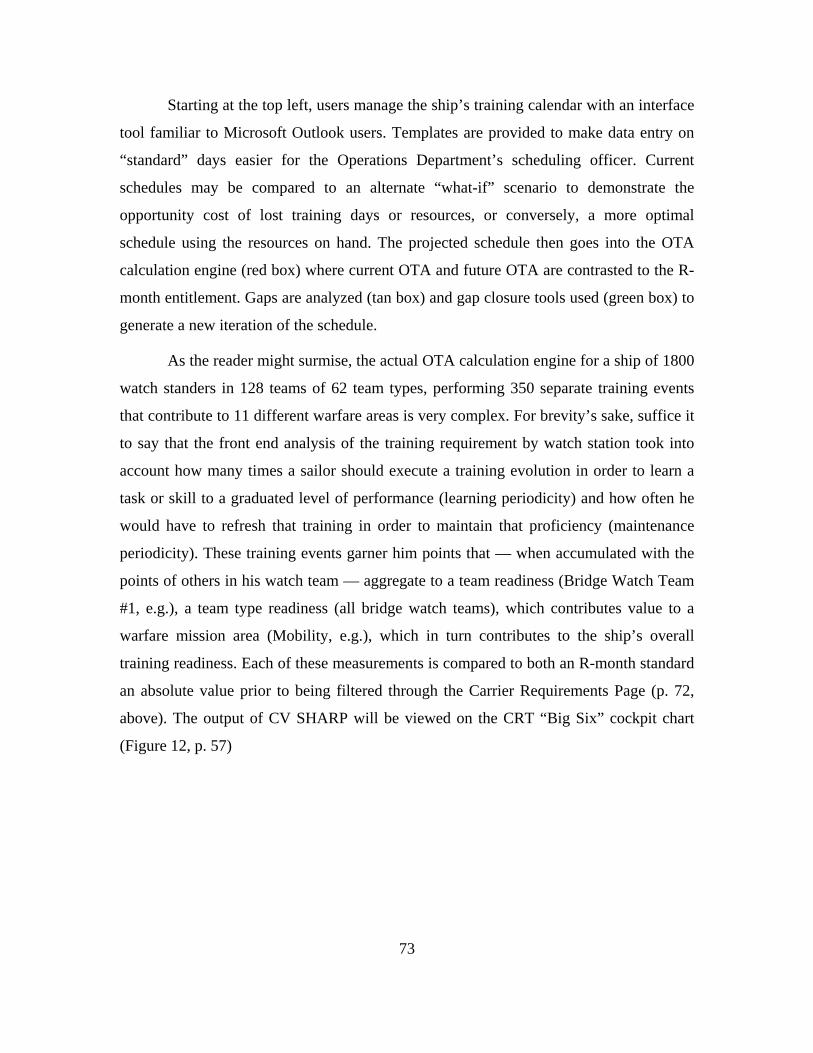
73
Starting at the top left, users manage the ship’s training calendar with an interface
tool familiar to Microsoft Outlook users. Templates are provided to make data entry on
“standard” days easier for the Operations Department’s scheduling officer. Current
schedules may be compared to an alternate “what-if” scenario to demonstrate the
opportunity cost of lost training days or resources, or conversely, a more optimal
schedule using the resources on hand. The projected schedule then goes into the OTA
calculation engine (red box) where current OTA and future OTA are contrasted to the R-
month entitlement. Gaps are analyzed (tan box) and gap closure tools used (green box) to
generate a new iteration of the schedule.
As the reader might surmise, the actual OTA calculation engine for a ship of 1800
watch standers in 128 teams of 62 team types, performing 350 separate training events
that contribute to 11 different warfare areas is very complex. For brevity’s sake, suffice it
to say that the front end analysis of the training requirement by watch station took into
account how many times a sailor should execute a training evolution in order to learn a
task or skill to a graduated level of performance (learning periodicity) and how often he
would have to refresh that training in order to maintain that proficiency (maintenance
periodicity). These training events garner him points that — when accumulated with the
points of others in his watch team — aggregate to a team readiness (Bridge Watch Team
#1, e.g.), a team type readiness (all bridge watch teams), which contributes value to a
warfare mission area (Mobility, e.g.), which in turn contributes to the ship’s overall
training readiness. Each of these measurements is compared to both an R-month standard
an absolute value prior to being filtered through the Carrier Requirements Page (p. 72,
above). The output of CV SHARP will be viewed on the CRT “Big Six” cockpit chart
(Figure 12, p. 57)

74
Figure 18. PRMAR M Ratings19
In Figure 18, we can see that in October 2006, seven carriers were on standard for
their overall readiness level, three were over-trained by one M-rating and one was over-
trained by two M-ratings. By September of the next year 8 of 11 were on standard and
three were marginally over-trained compared to their R-month entitlement.
The virtue of the application and training matrix is that it provides the
commanding officer of the carrier with a much more textured insight into the training of
the personnel under his command, and aligns that training requirement to the
requirements of the Fleet Response Plan. In the case of a resource shortfall (steaming
days, commercial air services, e.g.), the CO can accurately predict the impact of the
shortfall on his crew’s operational capacity. That capacity deals both with the numbers of
people trained and their level of training individually and in aggregate, permitting the CO
insight into how well his crew might perform at any given time as well as their
persistence, i.e., how long they can expect to execute mission tasking at a given level. It
19 Although this represents SORTS data, it is unclassified since the neither the ships nor the R-month
standards are named or enumerated at this level. Drill-down slides showing actual SORTS ratings by hull number would be classified.

75
also allows senior commanders to recognize, accept or mitigate risks, re-allocate
resources or re-direct the risk mission area. As it has evolved, CV SHARP has also
become an important ship’s schedule and training management tool, with interfaces
permitting collaborative training plan development and conflict resolution. Potential
future enhancements include the use of automated Operations Research techniques to
search within the training plan solution space for optimal ship’s schedules based on user-
defined constraints — currently, schedule development and optimization requires a
significant element of iterative user interaction.
The value of CV SHARP to the NAE is that it provides resource sponsors with
linear feedback on the consequences of resource re-allocations and shortfalls and permits
the MPT&E insight into the opportunity cost of late personnel replacement. The flag
level commander achieves actionable insight both by unit and across his domain. Future
enhancements include the potential to include pipeline training to a watch stander’s
qualifications, a built-in analysis engine for the impacts of personnel cuts and rating roll-
backs, a unified aircraft carrier and carrier air wing matrix and the addition of such non-
operational training as preparation for a maintenance availability. Significant interest in
the OTA metric and its potential to be adopted by other war fighting enterprises has been
demonstrated by the staff of the Commander, Second Fleet, who reports to Commander,
Fleet Forces Command as his Current Readiness and Training czar.
C. LIFE-CYCLE MANAGEMENT TEAM
1. Gaining Visibility on Maintenance Costs
The Life-Cycle Management Team (LCMT) is charged with identifying and
quantifying the cost of operating and maintaining the aircraft carrier force, focusing
particularly on cost effective management of all aspects of maintenance, systems and
equipment (Johnson, 2006). Led by then-Captain Tom Moore of PMS-312 since 2007,
LCMT’s first focus was on readiness standards and metrics to support them, under the
hypothesis that this was the process that had led to the success of NAVRIIP. Just as in the
TPRT, it was thought that cost control would follow understanding and achievement of

76
proper CVN readiness standards, and that risk appreciation would follow costs. Keeping
that in mind, a goal was nevertheless set for $25 million in cost savings and avoidances in
order to sharpen the team’s focus.
As elsewhere under the Thomas Group’s counsel, quick hit “action chits” were
generated to capture savings from low hanging fruit, while actions in process were
generated to develop good metrics and then methods to favorably steer them. Several of
the action chits eliminated redundancies, such as the non-controversial lay-up of a spare
Oxygen/Nitrogen generating plant aboard the Nimitz-class carriers that saved million
dollars per year over a five-year period in maintenance and manpower costs. Other
recommendations, such as lay-up of one of each carrier’s four aircraft elevators, arresting
wires and catapults were rejected for operational reasons. And some, like the elimination
of the carrier commanding officer’s gig, flag officer’s barge and associated crewman ran
into significant cultural resistance expressed — of all ways — through negative feedback
from a number of retired flag officers.
Other, similar initiatives, including a significant restructuring of the Nimitz-class
maintenance plan that essentially skipped two PIAs over the ships’ 50-year life cycle,
were swiftly proposed, rapidly vetted and expeditiously implemented for a net savings of
$280 million through 2012, and additional cost avoidances of around $150 million over
the same timeframe. Many of these savings were capitalized in budget cuts to pay for
service-wide marks nearly as soon as they could be identified, which might have
dampened the LCMT’s ardor for cost cutting had not these budgetary pressures been in
any case unavoidable.
The number of cost-wise readiness initiatives requiring further vetting in the
technical support and manpower communities continues to grow, and in March 2008
there were over 300 initiatives undergoing evaluation. So quickly has the process taken
root that the LCMT has been forced to perform a value stream analysis on the vetting and
approval process and create management metrics promoting reductions in process cycle
time — Lean on Lean. These quick wins demonstrated the value of challenging previous
assumptions, but in order to get at the costs of maintaining aircraft carriers “ready for

77
tasking (RFT) at reduced cost, now and in the future,” a new series of metrics would have
to be developed and a cross-functional enterprise team was emplaced to craft them.
At first, two general categories of maintenance cost were selected: Depot-level,
centrally managed repairs in an account known as “ORATA” and the repair of in service
carriers that have submitted casualty reports (CASREPS) of broken or damaged
equipment in an account known as “ERATA.”20 It is convenient to think of the ORATA
account as the money allocated towards a planned work package constructed for a ship
outside the CNO maintenance availability (not during a PIA or DPIA, in other words),
and ERATA as ship’s force maintenance on emergent requirements combined with
technical support teams from the several SYSCOMS as may required.
Focusing first on in-service ships, it soon became clear to the LCMT that while
CASREP data were important to understanding costs, they were not in themselves
sufficient. Partly this was because episodic failures of even important systems that can be
repaired locally within 24 hours do not require an official, off-ship report. It also
appeared anecdotally true that the data were imprecise because some carrier commanding
officers interpreted for themselves broader latitude over the terms of CASREP issuance
than a strict reading of the governing instruction — by naval standards, a model of
relatively unambiguous clarity — might otherwise support.
CASREPS come in varying categories, with a low category (CAT 2) being of
relatively minor import, and higher category (CAT 3 or 4) indicating a major degradation
in mission capability. Depending upon a particular commanding officer’s interpretation
of CASREP guidance, some ships might label a significant failure mode a mere “loss of
redundancy” and issue a lower category report. This is true especially — if perversely —
20 ORATA and ERATA are acronyms for “Other Restricted Availability/Technical Availability” and
“Emergent Restricted Availability/Technical Availability.” At times naval abbreviations seem no less impenetrable even after having been deconstructed.

78
when the ship is in a forward-deployed theater, since a significant a mission degradation
of a ship “on the line” generates instant (and often unwelcome) attention at very high
levels.21
Maintenance material management (3-M) data would also prove valuable to the
LCMT, but in 2006 the central VAMOSC website (see footnote 12, p. 53), which had for
years aggregated that data, lost its funding. One of the first efforts of the LCMT was to
ensure continued VAMOSC funding to retain access to this historical data, spending
execution year money up front to ensure life cycle savings downstream.
As a contributing sub-pillar to the CRT, the Life Cycle Management Team’s
overarching goal was perfectly aligned to the CRT’s overall goal: To resource the
requirements of the “six plus one” strategy of the Fleet Response Plan, at reduced cost
and with manageable risk, now and in the future. Although several contributing metrics
to the top level RFT (Figure 13) were eventually developed, the first LCMT task
undertaken — having successfully exploited a “quick win” strategy to gain enthusiasm -
was to develop a superior understanding of the status of important shipboard systems to
that provided by the CASREP system. Candidate systems were those whose degradation
either significantly impacted the ships’ employability, were significant cost drivers, or
both. This equipment metric was called “RFT-E” for “ready for tasking — equipment,”
and RFT-E units were measured in days of tasking availability.
In collaboration with the ships’ maintenance personnel, PMS-312 and the
TYCOM carrier maintenance staff, the LCMT developed a list of 78 systems for daily
monitoring and reporting by all ships not in a shipyard for sustained maintenance. Of
those systems, 68 line items were evaluated as critical. Each list was sorted under an R-
month entitlement scheme in recognition of the fact that different levels of capability are
required in differing phases of the FRP. RFT-E days were then measured against an in-
port standard for ships not underway, an underway standard, and an aggregate.
21 The state of practice on CASREP generation seems to vary widely, but the perception among some
commanding officers — and this is by no means unique to the carrier community — seems to be that reporting casualties that cannot be repaired locally and expeditiously somehow redounds to the ship’s discredit.

79
The number of carriers reporting (i.e., not in a CNO-sponsored maintenance
availability) was multiplied by the number of days in the calendar month to determine the
number of days in a given entitlement; seven ships in a 30-day month would yield a 210-
day entitlement, for example. Impairments to these RFT-E days were determined by the
failure of a single, very significant system, or — more usually — a threshold limit
exceeded on a number of associated systems in one of seven different functional
subcategories: Propulsion, Aircraft Intermediate Maintenance, Aircraft Launch and
Recovery Equipment, C5I22, Ship’s Self-Defense, Seamanship and Navigation, and Other
Key Sub-Systems. The subcategory scheme helped spot emergent trends and ties them to
technical warrant holders in the various NAVAIR and NAVSEA claimancies.
Figure 19. Ship RFT — Equipment
In Figure 19, the top line (blue) reflects RFT-E underway entitlement of 100
percent. The green bars are the calculated number of Carrier Ready For Tasking Days
each month versus the Carrier Ready For Tasking Days Entitlement (black line) and the
Carrier Ready For Tasking Days Impaired, either in port (yellow) or underway (red).
From the actual Carrier Ready For Tasking Days against the Carrier Ready For Tasking
Days Entitlement, a percentage RFT-E is calculated.
22 Command, control, communications, computers, combat systems and intelligence systems.

80
A separate breakout is conducted on top mission critical systems known
colloquially on the ships as “head hurters,” systems that have a high failure rate or that
are hard or expensive to repair. These are tracked as a percentage of time impaired before
being ranked against cost of repairs and mission impact. With this kind of insight,
waterfront leadership can have an informed dialogue with both in-service engineers and
acquisition professionals within the systems command as to maintenance practices and
the cost/benefit calculation of system or component re-designs.
Other shipboard process included an entitlement curve and a metric dedicated to
logistics cycle time, which is a measure of how rapidly the logistics system — parts,
maintenance personnel, technical documentation, e.g. — responds to correct materiel
deficiencies identified by a CASREP. Drill-down charts from the top-level metric are
associated with each element of the integrated logistics process to highlight which
contributor is having the greatest effect (“Pareto principle”) and therefore might provide
the most leverage. An associated metric was developed called “CASREP Aging” to
provide insight into how many casualties had gone 30, 60 or 90+ days without being
remedied. Finally, in association with OPNAV N1, a “Fit/Fill” metric is in development
to determine whether manning levels are appropriate by pay band and experience level
(Fit) and gross number of personnel required (Fill). The entitlement metrics for these
measures are still under construction and vetting with the other war fighting enterprises
and the provider/enabler domains since many of the enlisted ratings sourced to an aircraft
carrier (Operations Specialist, just for one example) fall outside of the NAE’s exclusive
claimancy.
Additionally, the AIRSpeed educational initiative has been pushed down to the
ships via a process known as “Boots on Deck,” wherein senior leadership and staff
support from NAVAIR (in particular) visits ships in the carrier force, speaking in detail
with individuals responsible for production and maintenance, evangelizing the continuous
process improvement gospel and conferring Lean Six Sigma awards (“Green and Black
Belts”) upon those who have completed both the academic portion of the AIRSpeed

81
syllabus along with associated process improvement projects in their work centers.23
Further discussion of shipboard process improvements will be found in paragraph 3
below.
2. Shipyard Maintenance Costs
Elevated shipyard maintenance costs have bedeviled mariners since the age of
sail, and full treatment of the issue here would run on for a number of pages sufficient to
pad another pair of theses and probably leave the reader less informed than he had been
before. Nevertheless, depot repairs make up 36 percent of an aircraft carrier’s 50-year
total ownership cost (Figure 11) and any serious attempt to get at these costs would have
to include the interface between the Navy and the shipyards, if not the shipyard processes
directly.
Once the LCMT began to focus on shipyard processes they learned that there was
no common costing process between the four public nuclear capable shipyards and the
two private ones. Even within the public shipyards cost accounting was not transparent,
as workshop structures were not standardized from yard to yard. Neither were work
elements nor cost estimates for the ship’s expanded work breakdown structure
standardized, and it was very difficult for the team — or for an aircraft carrier’s
leadership, for that matter — to gain real time insight into the quality and timeliness of
work in process. These are daunting issues for an ad hoc cross functional team made up
of members with full-time “day jobs” to take on, and as of this writing, the LCMT has
essentially given the major internal shipyard processes back over to NAVSEA to examine
in their enabler/provider role, turning instead to focus their attention on value streams
more suitable and accessible to a cross-functional focus.
What the operational Navy chiefly values from the shipyard — any shipyard — is
on-time completion of the scheduled work package. Late ship deliveries not only have
23 “Boots on Deck” is not a photo opportunity one of the initial “boots on the ground” visits to NAS
Lemoore in 2001 coincided with the firing of the wing maintenance officer and his counterpart in the fleet replacement squadron, as well as the relief for cause of the TYPEWING commander when poor leadership oversight and endemic maintenance malpractice were discovered. Although not directly tied into the Boots on Deck deep dive between the providers and the fleet, the resulting adverse personnel actions strongly influenced the fleet’s perception of future visits, a perception the Boots on Deck team did little to allay.

82
downstream impact on that ship’s schedule, but also have a ripple effect on the
deployment and maintenance schedule of other ships in the maintenance pipeline.
Schedule impacts aside, each additional day of maintenance past the scheduled delivery
date is hideously expensive24, typically requiring funds to be re-programmed from other
operations or maintenance accounts in the execution year. The top-level metric therefore
is a summary of how the carrier force moves through its maintenance availabilities by
month.
Figure 20. Carrier Maintenance Schedule Adherence
Figure 20’s Y-axis indicates the total number of carriers moving through
maintenance availabilities, with hull numbers given in green that are tracking on schedule
and in yellow or red below the line for ships either of concern with respect to schedule or
behind, respectively — the X-axis shows the month of the year. This metric demonstrates
both the magnitude of the problem and the trend, but does not in itself point out the
“why,” nor yet what process changes might promote on-time deliveries. In Figure 20, in
the month of September 2007, we note that two carriers were on schedule for an on-time
24 A PIA or DPIA costs roughly $1.75 million per day in shipyard costs. Adding ship’s force labor
cost to that number, the figure rises to nearly $2.7 million per day delivery is delayed.

83
delivery (CVNs-70, and 76) while one ship (CVN-71) was demonstrating schedule risk.
By October, CVN-71 had gotten back on track, and another ship, CVN-74, had joined the
maintenance queue and was already in the “schedule concern” category. A bill-paying
TYCOM might rightfully wonder why a ship just starting a six or nine-month long
availability was already “of concern.’
The LCMT, working with the shipyards and the TYCOM verified what each of
them knew from individual experience to be true: Efficient completion of shipyard work
depends to a great deal upon the timely deployment of the correct resources to
accomplish a shared understanding of the scheduled maintenance. The more a ship’s
work package changes in the months prior to her availability, the greater the risk of
cripplingly expensive schedule and performance deviation. This has come to be known as
work package “churn,” an apt if inelegant description of resources being pulled first one
way and then another as late additions to the schedule push out lower priority planned
items, leaving major, but lesser priority work to either be done by the ship’s force — if it
lies within their capabilities — or by the dockyard. This can add days and weeks to the
delivery date. The later these revisions and deletions arise, the greater the impact. New
metrics were devised to gain insight on churn.
Figure 21. Maintenance Churn

84
Figure 21’s Y-axis reflects the number of work package items approved (green, in
the embedded bars), deleted (yellow) and red (added). The X-axis represents a hull
number and the month that ship is away from commencing her maintenance availability.
In this case, the far left bar represents CVN-70, which is 21 months away from her
Selected Restricted Availability (SRA), with 113 approved jobs and a request to delete 10
in favor of adding 46. The red line passing vertically through the right half of the slide
represents “A-2;” a point where a ship would be just two-months away from commencing
her maintenance period. The LCMT set a goal at this juncture for “zero late additions” to
the ship’s maintenance and modernization plan. Visually, leadership hopes to see less and
less “red space” below the line as these ships move from left to right on the chart. Metrics
are in development aggregating an overall churn index from component planning churn
and execution churn indices, but as of summer 2008, these were not yet mature.
If the LCMT had learned only that late delivery from a maintenance availability is
expensive and disruptive that would have been dreary knowledge enough. But in mid-
2007 flag leadership at the TYCOM pondered the issue of the impending retirements of
USS John F. Kennedy and Kitty Hawk without immediate replacement. The retirement of
these two ships brought the size of the carrier force first from 12 to 11 and then soon to
10 ships for a year, with no change in the combatant commander demand signal for
carriers — six deployable within 30 days, one more within 90 days. In time this came to
be seen as more important than the NAVRIIP-style focus on force wide readiness over
cost. As previously mentioned, the TYCOMs framed the issue around the term
“operational availability,” or Ao. The CRT was tasked — and the LCMT took on the
challenge — to determine 1) if in fact the CV/N force would be able to answer the
COCOM requirement going forward, and 2) if not, what mitigation schemes could be put
in place to close the gap.
The LCMT already knew that in the near and middle term, carrier RFT would be
adversely impacted by an aggregation of previously lost RFT days due to ships coming

85
out of their maintenance availabilities after their scheduled delivery dates.25 One
temptation to “earn back” some of those RFT days would have been to reduce the length
of future maintenance availabilities. That temptation has thus far been successfully
avoided, since deferred maintenance work does not just “go away.”
Such an initiative — to shorten PIAs and DPIAs by one week — has been
explored, but the inevitable result must be that the work package volume must be reduced
commensurately. This can lead to an accumulation of lost work over the carrier life cycle.
Repair tasks dedicated to ameliorating shipboard corrosion (especially) tend to grow over
a deferral period. At some point, the accumulation of lost work cannot be regenerated by
a skilled industrial base of finite size, a situation that could potentially lead to
“operational failure,” such as occurred in the case of the USS John F. Kennedy: The ship
was allowed to fall so far behind in maintenance and modernization that recovery to a
fully operational status was not considered economically feasible.26
Finally, when the FRP employability cycles increased from 24 months first to 27
months and finally 32 months, there was a consequential avoidance of two planned
maintenance availabilities and a reduction of 527,000 shipyard maintenance man-days
over the original Nimitz-class maintenance plan. This has been labeled an “efficiency,”
and the costs thus captured across future years represent a significant portion of the
overall savings generated by the LCMT in particular, and the CRT generally. As has been
demonstrated by the Kennedy example though, the loss of over a half million
maintenance and modernization man-days over a 50-year life cycle may not be an
25 The Navy does not purposefully end carrier availabilities early, because to do so would mean
foregoing scheduled and budgeted modernization and repair work. Therefore, each day a ship is late exiting her availability aggregates across the force-wide RFT. The effect is that the Navy can never catch up by finishing early, they can only fall further behind with each day a ship is late.
26 In the early 1990s Kennedy was designated a “reserve” carrier while retaining the operational pace of the active force. During the Cold War drawdown, the Navy—facing budgetary pressures—economized on her maintenance plan by canceling an event known as a Service Life Extension Plan (SLEP). This SLEP was to have been performed in conjunction with a complex overhaul (COH) in 1993. The work thus eliminated followed the ship through subsequent maintenance periods and deployment cycles, eventually leading to a failed In Service Inspection (INSURV) in 2001. Approximately $400M was first set aside by AIRLANT for a reconstitution effort, including a new Selected Restricted Availability. Follow-on planning showed that the amount of repair work added for the SRA and an already scheduled 2005 COH was three times as large as the work originally removed as a cost-savings measure during her 1993 COH. The ship’s degraded material condition and resultant recovery costs drove the Navy to recommend decommissioning. Congress eventually approved the Navy’s recommendation. (Carter and Moore, 2007)
86
unalloyed good. If that were not enough, maintenance budget cuts loom on the horizon,
and the CRT has been asked to analyze the impact of maintenance and modernization
budget reductions of 2.5 percent, 5 percent and 7.5 percent on the Navy’ ability to meet
the “6+1” FRP demand signal.
This is not particularly good news, with the only saving grace being the fact that a
cross-functional team supported by expert staff from several organizations identified an
emerging issue in sufficient time to formulate a considered response. This can only help
the NAE avoid the kind of short-term answers that led to the eventual collapse of material
readiness on board the John F. Kennedy.
D. OPERATIONAL PROCESS IMPROVEMENT AND STANDARDIZATION TEAM
1. Introduction
The Operational Process Improvement and Standardization Team (OPIS) is the
newest cross-functional team under the CRT aegis, chartered late in 2006. The team was
asked to apply rigorous business practices (Lean Six Sigma, Theory of Constraints, e.g.)
to identify and prioritize shipboard processes that are either resource intensive or
individually significant to combat readiness. Having done that, continuous process
improvement techniques would be applied to reduce costs and increase standardization.27
Particular focus would be applied to processes that were people and inventory intensive,
since each of those cost centers represent significant life cycle cost drivers28 for the
carrier force. Candidate processes would be bounded by the ship’s hull and permanent
work force, excluding air wing efforts such as the Carrier Air Wing Manning Initiative
and the shipyard maintenance efforts captured by the LCMT.
27 The reader will recall from the business process discussion beginning at p. 16 that “mura,” or
inconsistency, is in itself one measure of overburdening in the Toyota Production System, which seeks to always get a defined output from a defined input with minimum process driven friction. Standardization is also critical to the application of any scheme to apply metrics to a process since variations make direct comparisons and improvement analysis difficult.
28 As a reminder, Figure 11 on p. 53 demonstrates that people, repair parts, spares and supplies comprise fully 85% of the total ownership cost of an aircraft carrier.

87
The overall team was led by the N3 (Force Operations) stationed at AIRLANT in
Norfolk, Virginia. Process improvement expertise was until recently29 provided by a
Thomas Group “resultant” while fleet subject matter expertise was provided by TYCOM,
fleet and OPNAV representatives in sub-teams representing the following claimancies:
Ordnance, Supply, Deck, Navigation, Aviation Intermediate Maintenance, Combat
Systems, Propulsion, and Air Department. Supporting the effort are the AIRSpeed
instructional staff and the Boots on Deck team from the NAVAIR and NAVSEA systems
commands.
2. Charter
The OPIS Team charter was approved during a Carrier Readiness Team Face-to-
Face in San Diego in February 2007.
Improve and standardize major CV/N shipboard processes that have a significant impact on readiness, costs, people, productivity, cycle time and/or inventory. Create a controlled, coordinated and sustainable continuous improvement process utilizing the overarching PVM methodology supplemented by AIRSpeed and other tools, as appropriate, in designated CV/N ship board operations. Ensure ROI project selection, control, benefits tracking and process improvement replication throughout the CV/N fleet. (Allardyce, 2007)
The team’s business goals were to reduce the cost of generating required
readiness by 2 percent year over year, yielding $7.6 million (from a 2006 figure of $380
million) in its first year. Other deliverables included the ability to enduringly manage the
carrier force as a process-driven enterprise and to push down AIRSpeed processes aboard
all of the ships, training responsible and accountable “change agents” at every level and
throughout each major department.30
29 In the spring of 2008, the Thomas Group lost the NAE contract to a consulting consortium from
Booz Allen Hamilton and SAIC. 30 The Thomas Group considers that there are three classes of “barriers” to process improvement in
any organization: Subject Matter (product requirements, component specifications, technical process parameters, e.g.); Business Process (poor process design, large batch sizes, resource bottlenecks); Culture (inadequate metrics, controls and incentives, lack of well-defined objectives). They reckon that removing the latter two classes of barriers has between 10 and 100 times (respectively) the impact of removing the first. They also insist that for any large organization, culture change is the most wrenching and therefore difficult to execute.
88
3. Methodology
The OPIS Team took a two-track approach initially, seeking to develop a parallel
strategy to gain quick wins as a way of building team enthusiasm for change, and
demonstrating their strategic value while simultaneously laying the foundation of a
sustainable, repeatable and standardized means to identify, prioritize, improve and
standardize shipboard processes.
The team’s first goal was to define key shipboard departments and functional
areas, which in turn led to the creation of the sub-teams enumerated in paragraph 1
above. Within those organizations, “high leverage” processes were identified, meaning
that the emphasis would be placed on processes that were essential part of the ship’s
function, and whose improvement might lead to improvement in other, contributing
processes. Within these processes, impacts to readiness, costs, people, cycle time, first
pass yield and safety were assessed.
After the identification of critical processes was complete, further analysis was
undertaken to understand whether the process variables were measurable, and how they
contributed to cost and performance. Each measurable process was prioritized for
importance, using a “rack and stack” methodology designed to make process selection
unemotional and analytic — a process grossly familiar to the systems engineer
performing requirements definition and trade-off analyses.

89
Figure 22. Notional Ranking Matrix (From Allardyce, 2007)
Figure 22 shows a notional ranking matrix, designed to assess the relative merits
of the process under consideration. An “as is” process could be streamlined through value
stream analysis to eliminate the workload of 51 personnel would get four points towards
an overall figure of merit (FOM), but the “to be” solution would then lose two points if it
increased cycle time by 5-10 percent.
After a FOM is assigned, process improvement candidates are filtered through an
accessibility matrix.

90
Figure 23. Notional Accessibility Matrix (From Allardyce, 2007)
Figure 23 shows a notional accessibility matrix, which allows the OPIS Team to
determine how broadly deployable the process improvement is. An improvement that
applies to all carriers across their entire employability cycle is favored since it is easier to
execute, ensures quicker standardization, greater reductions in cost and more rapid
“cycles of learning”31 across the force. Conversely, a change that affects fewer ships, or
one that can only be implemented during maintenance availabilities might have a lower
value, depending upon the figure of merit value it had upon it exiting the original ranking
process.
4. Accomplishments
The OPIS team is a relatively new addition to the CRT, and its membership was
spun-off from (or was augmented by) the LCMT. Because of that overlap, both teams
claim the previously mentioned O2/N2 plant lay-up as an efficiency (although the overall
CRT of course, counts that as one action across the force). The “hot” lay-up32 of this
31 “Cycles of learning” is a Six Sigma term of art, generally associated with the inspirational
management style of former GE chairman Jack Welch, who took his company on three major learning cycles from the mid 1980s until about 1995. Welch’s first cycle of learning had to do with shedding non-profitable business arms from the company’s portfolio. His second had to do with “simplifying and eliminating non-value added” processes within business units and his third came after his discovery of Six Sigma, focusing on the elimination of variation within his business and operations processes (Watson, 2001).
32 A “hot” lay-up means that the equipment remained preserved in place, with no funds spent for maintenance, upkeep or removal.

91
plant — enabled in part by the deployment of new aircraft on the carrier deck capable of
generating their own oxygen supplies — eliminated six billets from each ship, for a total
of 48 billets across the Nimitz-class. This would have generated a five-year savings of
roughly $2.5 million had not these billets been reprogrammed into rectifying a shortfall
of aviation antisubmarine warfare billets aboard the carrier — victims of an 2005
personnel cut that had not been well thought-through or communicated outside the
aviation enterprise.
Another “quick win” was a Lean Six Sigma process improvement program for the
Aviation Intermediate Maintenance Department’s (AIMD) jet engine repair shop, which
— through a process similar to that conceived by CDR “CJ” Jaynes at NAS Lemoore in
2000 -resulted in a reduction of Time to Reliably Replenish (TRR) from 9 days to 5 days.
Although no billet reductions were achieved, productivity increases equated to an “earned
value” of $1.43 million across a five-year span. The process improvement was validated
aboard two other carriers in the fall and winter of 2007 and is set for a force-wide rollout
in 2008 (Allardyce, 2007).
The OPIS Team identified up to 50 billets in AIMD (30 permanent ship’s
company and 20 from shore-based detachments to the ships) that were in excess due to a
reduction in workload associated with legacy engines no longer in inventory or repaired
aboard ship. Those savings were being tested aboard the USS Harry S Truman during her
winter 2007, spring 2008 training and deployment cycle, as well as being validated by the
Navy Manpower Analysis Center (NAVMAC), whose charter it is to match sailors to
workload at sea and ashore. With those savings (estimated at $2.6 million, if all are
approved) comes a $600K per year reduction in associated ground support equipment and
maintenance. Finally, a consolidation of so-called “hotel services” — laundry, cooking
and cleaning — between the officers’ and chief petty officers’ messes, additional billet
savings amounting to between $800k and $2.5 million (depending on acceptable risk)
were identified for NAVMAC validation.
In 2008, perhaps the most significant sign that the process improvement Gospel
had found an audience was the AIRSpeed and Boots on Deck-driven conferral of Lean
Six Sigma white, green and black belts across the carrier force, the force-wide sharing of
92
ten “best practices” and the nomination of 37 “process opportunity submissions.” The
battle to “work better, not harder” will be waged like all other campaigns — by the sailor
on the waterfront, not by the consultant with the stopwatch.
E. CHAPTER SUMMARY
1. Teamwork
CRT leadership developed three main supporting teams to help achieve the Air
Boss’ vision for cost-wise readiness. Over time that vision evolved to include a focus on
meeting the combatant commander’s steady-state demand signal for carrier air power in
the face of reduced asset inventory — Ao. The Training and Personnel Readiness team
was charged to rewrite the way that aircraft carrier personnel were trained using a matrix-
based system and a training management system that promises to deliver a much more
nuanced and textured understanding of a ship’s capabilities and persistence, while
identifying both the fiscal costs and operational risks of marginal increases and decreases
in training.
The Life Cycle Management Team developed a detailed list of metrics supporting
the vision of carriers ready for tasking based on their equipment status, garnered
significant life cycle savings by restructuring the Nimitz-class maintenance plan in
alignment with the Fleet Response Plan and identified looming maintenance and
operational impacts based on deferred maintenance and proposed budget cuts in a way
that offers naval aviation leadership an opportunity to dedicate intellectual and capital
resources in a considered way.
The Operational Process Improvement and Standardization Team led the fleet
through a structured process of applying such modern business techniques such as Lean
Six Sigma and Theory of Constraints to the work effort undertaken aboard our aircraft
carrier force, identifying numerous billet savings and streamlining industrial processes
that saved tens of millions of dollars across the Future Years Defense Plan
One of the main benefits of the cross-functional team process is the way that it
meshed the efforts of naval aviation leadership from the operations and maintenance

93
communities with business process consultants in a structured and rigorous way. That
process helped to cross-pollinate expertise, identify, elevate and remove barriers and
align the organization under one “main thing” — aircraft carriers ready for tasking at
reduced cost, now and in the future - moving the force out of a culture of consumption
and towards a culture of cost-wise readiness.

94
THIS PAGE INTENTIONALLY LEFT BLANK

95
V. APPLICATION OF STUDY
A. INTRODUCTION
1. Problem Solving
Most senior military officers are trained to solve problems on a continuum from
the strategic through the operational, down to the tactical, a very similar process to that
employed by the systems engineer during a functional decomposition. The issues that
naval aviation faced in the aftermath of the post-Cold War drawdown, however, — jet
engine production rates, pilot production — were at first only recognized as tactical
problems. In order to get at jet engine production, a single process owner was identified
to develop a single metric of success — bare firewalls in the fleet — out of the many
potential contributing stakeholder strands. Having determined what was the “main thing,”
business process tools, such as Lean Six Sigma and Theory of Constraints, were
employed to help visualize the “as is” system and develop a “to be” system that
optimized system resources. The results were extraordinary.
Naval aviator pilot production was a similar challenge that revealed a cultural
deficiency: An aviator inventory deficit combined with a gung-ho spirit of “get them
down here and we’ll train them (somehow)” had created a seemingly insuperable series
of production bottlenecks that increased pilot time-to-train, resulting in an ever-larger
shortfall of replacement pilots in the fleet, extended fleet tours, and a paucity of fleet-
experienced instructors to grow the new crop of replacement pilots. The concepts of a
single, fleet-driven metric and enabler/provider entitlements were created to rationalize
the fleet requirement with the enabling infrastructure. This required the teamwork and
support of several different stakeholders, each of whom had — up until adopting an
enterprise view — employed differing metrics to define their own version of success. The
decision to reduce student pilot overload in the production pipeline, which had been a
counter-intuitive solution to the problem of an inventory shortfall, eventually increased

96
fleet pilot inventory. At their core, both of these issues evolved out of a culture of
consumption coming up against new constraints that penalized previously submerged bad
behaviors.
Cultures of consumption are all about stark quantities: Inventory, resources,
arrested landings, flying hours — more is always better. Businesses that compete in the
marketplace live and die by their bottom lines. While they care deeply about quantities,
often expressed in terms such as unit sales and finished goods inventory on hand,
successful business care passionately about cost. Great companies seek to maximize their
output of saleable items “x” per cost “y.” This is often measured in terms of “marginal
cost,” which measures the change in total cost when production is changed by one unit.
Marginal costs are expressed in terms of a numerator and a denominator:
Marginal Cost = Change in Total Cost divided by Change in Quantity. Many of the
structural problems of naval aviation from a business perspective were those of a culture
driven by a habit of resource consumption rather than considerations such as quantity
cost by quantity. Bare firewalls might come and go, pilot production slow or surge:
Aviation’s real problem was strategic.
By the early 21st century, the cost of funding naval aviation’s operations in the
here and now was strangling naval aviation’s future, threatening the Navy’s contribution
to national security strategy. Aging aircraft were being flown hard to satisfy the
combatant commander demand signal without regard to future force structure. Worse,
funds to acquire future airframes were being reprogrammed to support current operations.
As replacement airframes failed to materialize on schedule, the increasingly aged
operational force consumed an ever-greater proportion of the operations budget. This
required additional execution year reprogramming from acquisition accounts — a classic
vicious cycle that was highlighted in 2001 when the Chief of Naval Operations offered up

97
a billion dollars out of the Navy’s Total Obligational Authority (TOA)33 in an attempt to
help aviation escape from that spiral, only to see his investment vanish into a gaping maw
of consumption.
Naval aviation had always been expensive. With emerging requirements in the
broader Navy, such as an aging surface force that was itself in desperate need of
recapitalization, aviation was rapidly becoming unaffordable. The development of an
enterprise view, tying together the efforts of the TYCOM, SYSCOM, Chief of Naval
Aviation Training, NAVSUP and NAVICP under a single, fleet-driven metric went a
long way towards solving the strategic and, indeed, existential issue that naval aviation
faced: The rising age and increasing total ownership cost of the Navy’s aircraft inventory.
The NAE took a relatively large risk in daring to place a cost focus on the
operational metric of aviation units ready for tasking. There are legions of “unfunded
requirements” every budget cycle, and by turning money back in at the end of the fiscal
year, the enterprise risked giving away aviation money for some other branch’s benefit as
well as a reduction to the next budget year’s “top line.” 34 Emphasizing those deeply
counter-cultural trade offs was the risk of failure to execute the cost-wise vision smartly,
which would have resulted in stagnating or even further increasing total ownership costs.
A very great deal might be lost in real terms for no tangible gain.
Execution proved critical. In the late 1990s, the average aircraft in the naval
aviation stable was more than 20-years old. By 2006, new acquisitions — enabled by an
enterprise-driven move towards cost-wise readiness and phase-based entitlements — had
33 The TOA is the dollar value of the Navy program for a given fiscal year regardless of the method of
financing. It is distinguished from the Navy’s Budget Authority, which includes the service’s ability to fund both current and future year obligations.
34 No matter how much money is appropriated for DoD execution, there is always a howling chorus for more. Every year any number of valid “requirements” nevertheless fails to survive the PPBS budgeting process and become “unfunded requirements,” or more simply, “unfundeds.” If at the end of the year a budget authority “fails to fully execute their program” — in past years a deeply pejorative characterization — hat money is quickly re-allocated in the form of “sweep up” funds that are broadly distributed for hasty obligation against highest priority unfundeds. Because a budget authority cannot legally obligate congressionally allocated money for funded programs against their own internal unfundeds, the risk that the NAE took on was non-trivial. Additionally, in years past, a budget authority that routinely failed to execute their program raised questions about competence and could easily result in that authority’s future year budgets becoming a target for inevitable raids seeking OPM — Other Peoples’ Money.
98
reduced the average age of the inventory to 18 years. The trend remains positive, as the
inventory will have an average age of 17 years in 2009 and is projected to average 14
years by 2013 (Highlights, 2008). This was a remarkable turnaround. It did not go
unnoticed.
B. APPLICABILITY TO OTHER ENTERPRISES
1. Extending the Model
Secretary Winter and I believe continued development and deployment of the Enterprise framework across our Navy is a strategic imperative if we are to afford our future. This first meeting of the [Executive Committee]…was a demonstration of our commitment to lay the foundation for a new business model based on measurable outputs, processes, the right metrics, and accountability.
Admiral Michael Mullen, Chief of Naval Operations, 2007
Faced with significant challenges in the new millennia, naval aviation adopted the
NAVRIIP model in 2001 that eventually came to be known as the Naval Aviation
Enterprise in 2005. Even before adopting their new moniker; however, the NAE received
enough attention within the Navy at very senior leadership levels to almost embarrass
their leadership. Admiral Vern Clark was so fulsome in his praises of their efforts (J.
Zortman, personal communication, February 1, 2008) that other type commanders could
not help but take notice.
Left to their own devices, the NAE would have been quite content to continue to
refine their processes and metrics, more fully developing their own system of
“organization and management.” Charged with manning, training and equipping the
entire Navy — not just the perennially expensive aviation arm — incoming CNO
Michael Mullen was not satisfied in 2005 to leave naval aviation’s leadership to their
own devices.
Naval aviators, no matter what they prefer to believe, do not go to war alone.
Each aircraft carrier is supported by surface combatants and submarine forces in a carrier
strike group, as well as depending upon significant reach-back to shore and sea-based

99
command echelons and operations support; meteorological, intelligence and logistics
supply chains, e.g. In turn these carrier strike groups may be tasked to support coalition
or joint forces ashore and especially, under the Naval Operating Concept35, the U.S.
Marine Corps. Alignment around a “main thing” had worked very well for naval aviation.
Admiral Mullen intended to see that it worked equally well for the entirety of the Navy
— the larger “system of systems.”
In the enterprise view, at least as championed by NAVAIR’s VADM
Massenburg, the first task is to determine the “main thing” — a system output — that in
turn drives inputs and ultimately (if necessary), changes to the organic structure that
delivers that output, the “black box” in a functional decomposition. Massenburg remains
a strong proponent of this output driven focus, but the enthusiasm of Admiral Mullen for
the enterprise approach caused him to place the Naval Enterprise structure in place first,
knowing that time was of the essence in the face of continued combat operations abroad
and resource challenges at home.
In 2005, Mullen directed that each of the warfighting competencies under his
command — naval aviation, surface warfare, submarine warfare, the expeditionary
command and the Naval Network Warfare Command (NETWARCOM) — develop their
own enterprise models. Atop these system elements — as often known for their
excellence in internecine warfare as their collaboration in combat — he chaired the newly
developed Naval Enterprise under the day-to-day governance of the Vice Chief of Naval
Operations. Recently promoted Rear Admiral Dave Buss, who had been the former
commanding officer of the USS Stennis, and first leader of the Carrier Readiness Team,
was appointed Naval Enterprise Chief of Staff. Mullen defined the Naval Enterprise
output metric as “Productivity,” where “productivity is equal to the readiness required to
meet the needs of the Combatant Commanders (using naval forces that are Ready For
35 The 2008 draft of the Naval Operating Concept is still in a draft form, but the document is intended
to form the core of a family of documents intended to “operationalize” the DoD’s maritime strategy by serving as a capstone document in the formulation of systems acquisitions, tactics and strategy development.

100
Tasking) divided by the cost of producing that readiness. The overall objective is to
increase the quotient of that formula by either driving readiness up or cost down.”
(Massenburg and Pierce, 2007)
Figure 24. The Naval Enterprise
The Naval Enterprise36 has — albeit in a much broader perspective — the same
responsibilities as does a TYCOM; to train, maintain, man and equip naval forces. The
36 The use of the term “Naval” vice “Navy” is deliberate, since Naval encompasses Navy personnel,
ships and aircraft, and also the entirety of the U.S. Marine Corps, which service depends upon the good offices of the Secretary of the Navy (or, as Marines tend to insist, the Secretary of the Navy and Marine Corps) for their transportation to and from their deployment areas as well as their acquisition of materiel, especially aircraft.
The Marine Corps is justifiably proud of its tradition of warfighting excellence in a lean organizational structure at reduced cost, especially as contrasted to the U.S. Army; the Marines pride themselves on maximizing the so-called “tooth-to-tail” ratio. It is the author’s perception that the Marine Corps views the Navy’s new emphasis on enterprise-style business practices as something of an enthusiasm, an innovation to be viewed with a healthy degree skepticism, if not outright suspicion.
Although the smallest of the armed forces branches by any metric, the Marine Corps has always had powerful political allies in Congress a tendency augmented rather than otherwise by their recent performance in combat operations abroad. From the perspective of senior Navy leadership (always subject to the whims of Congress) it is therefore very important that the Navy be seen in partnership with the Corps as the enterprise effort moves forward.
101
inclusion of Commander, U.S. Fleet Forces Command (CFFC) 37 as a member of the
“provider” domain at the Naval Enterprise level is something of an anomaly, however.
CFFC has a dual responsibility to CNO to train, man and equip Atlantic Fleet
forces and an operational responsibility to U.S. Joint Forces Command to provide trained
forces for the COCOMs — CFFC’s provider role is therefore outside the CNOs direct
domain, in the joint force arena, responding ultimately to the combatant commanders.
Uniquely, at the next level down in the hierarchy, CFFC becomes the lead
element (in partnership with the Commander, U.S. Pacific Fleet) of the Fleet Readiness
Enterprise, or FRE. Other, more traditional “provider” domains38 always retain their
provider roles, albeit at an ever more granular level of execution. CFFCs move from
supported to supporting recognizes the importance of the joint arena, and — it is to be
hoped — will help to modulate the COCOM demand signal for forces.39
As supported and supporting triangles multiplied, complexity increased.
2. The Surface Warfare Enterprise
As we have seen, the successes of the Naval Aviation Enterprise were quickly
adopted by the highest levels of naval leadership and turned around to the other
warfighting claimancies in terms of direction. Each of them was charged with creating an
enterprise management model that would feed into the Fleet Readiness Enterprise, thence
to the Naval Enterprise itself. Apart from the NAE, the surface warfare community’s
enterprise was the first and, as of this writing, most mature instance of enterprise
37 CFFC grew out of the staff of the former Commander, U.S. Atlantic Fleet as an Echelon II
command reporting in two chains of command: To CNO for “train, man and equip” issues, and to Commander, U.S. Joint Forces Command (JFC) for operational support to the COCOMs.
38 The so-called “Provider” domain is where the Navy’s real money is spent. They consist in aggregate of the five systems commands (NAVAIR, NAVSEA, SPAWAR, NAVSUP and the Naval Facilities Engineering Command, or NAVFAC) along with the Commander for Naval Installations (CNI), the Office of Naval Research (ONR) and the Bureau of Medicine (BUMED).
39 “Unconstrained requirements” from the combatant commanders, chiefly concerned with fighting and winning the war they are in, are the bane of the services chiefs, who are charged with manning and equipping a relevant force both now and in the future.
At every echelon of command there is a tension between operating a force and maintaining it: Ships that never sail have comparatively low Total Ownership Costs, but that’s not what ships are for. Getting CFFC and CPF “under the tent” of the Naval Enterprise helps to ensure a proper balance was struck between fighting the force and breaking it.

102
architecture. Their example is broadly illustrative, and will serve both to demonstrate the
extension of the enterprise system to another warfighting claimancy, and as a reminder
that not all good ideas come from the same gene pool.
The Surface Warfare Enterprise, or SWE, officially stood up in September 2005.
VADM Terrence Etnyre already had experience with the concept of command alignment,
having served as the two-star Commander, Naval Surface Forces Atlantic before “fleeting
up” to the three-star post of Commander, Naval Surface Forces (COMNAVSURFOR, or
CNSF for those even more pressed for time). He also had experience in enterprise
behavior with SHIPMAIN40:
It was an enterprise approach. We got everyone together involved in ship maintenance and figured out where the inefficiencies were, and threw them out. A lot of it, by the way, was in the way we planned for maintenance. We saved $700 million across the future-years defense plan. So there are some real savings that we’ve already achieved by taking an enterprise approach. (Taylor, 2006)
However familiar the enterprise approach might have been to Etnyre, enlarging
the SHIPMAIN model across the force entailed certain challenges. While the concept of
“warships ready for tasking at reduced cost now and in the future” was easy to
implement, finding the right people to develop and manage the necessary metrics proved
problematical. Etnyre’s first task was developing an output metric — Warships Ready
For Tasking (WRFT) at reduced cost. His next task was to build an equivalent to the
aviation TYPEWINGs to staff the component strands that made up that metric. The
40 SHIPMAIN was a 2002 initiative undertaken by Etnyre’s predecessor, VADM Timothy LaFleur, in
concert with VADM Phillip Balisle, who was then serving as the NAVSEA commander. Much like the aviation arm, the leadership of surface forces and their acquisition and sustainment/maintenance colleagues used modern business process models to examine the maintenance of surface ships from the moment that a need was identified up to and through the point of actual maintenance, collaborating to identify redundancies and harvest efficiencies. The focus of SHIPMAIN was synchronizing the maintenance effort with the operational schedule at reduced cost.
One of the first foci of SHIPMAIN was level-loading the maintenance effort of combatants returning from deployment duties escorting aircraft carriers - previously, the entire escort package consisting notionally of two cruisers, two destroyers and a frigate rather were thrust into immediate maintenance availabilities upon return to home port.
Staggering the work over time created some frictions, as escorts entering later availabilities were re-shuffled to other flagships than those they had previously deployed with. This increased integration training overhead somewhat, while greatly easing the burden on a finite capacity shipyard industrial base, resulting in reduced overtime costs and schedule risk for the surface force.

103
notion of developing new administrative command echelons for surface forces emerged,
as ideas sometime seem to do in the business world, during a game of golf at NAS North
Island California between Etnyre and VADM Zortman, the Air Boss (J. Zortman,
personal communication, February 1, 2008).
These new organizations came to be called Class Squadrons, or “CLASSRONS,”
and they aggregated ships of similar missions into classes (cruisers, destroyers, frigates,
coastal patrol vessels, mine warfare ships, littoral combat ships, amphibious warfare
assault ships, and amphibious dock ships). In a no/low personnel growth environment,
much of the manning for the new organizations was carved out of the existing CNSF
staff. For the sake of credibility, post-Major Command captains, officers with successful
experience in the appropriate warfare arena, commanded the CLASSRONs.
CLASSRONs are functional command organizations specific to particular ship classes. Responsible for the manning, training, equipping and maintaining processes, they execute the process of ensuring all ships within that particular class are at the right levels of combat readiness and available for tasking by combatant commanders. CLASSRONs will use metric-based analysis to assess readiness, examine class trends, establish lessons learned and provide recommendations and solutions.
Although they support the commanding officers of assigned ships and their ships’ immediate superiors in command (ISIC), they also, perhaps more importantly, align the SWE process teams with established waterfront support organizations then report directly to the CLASSRON readiness officer. (Taylor, 2006)
Most organizations are culturally resistant to change, and the Navy — an
inherently conservative service — is by no means immune to such resistance. Although
the aviation arm had for many years been accustomed to notion of an intermediate
administrative command echelon, the notion was entirely alien to the surface forces.
VADM Etnyre, who has since retired, was a nuclear-trained surface warfare
officer. The author can attest from personal knowledge that in person he is an
impressively incisive and persuasive individual. But the admiral also knew how to pick a
fight, and was willing and able to spend his energies where they might most profitably be
applied.

104
The first four CLASSRONs to stand up were in unique niches rather than the iron
guard of surface warfare’s cruiser/destroyer elite. Admiral Etnyre’s first CLASSRONs
were composed of guided missile frigates — venerable warships rapidly approaching end
of life — the patrol coastal and mine warfare vessels (usually commanded by senior
lieutenants and lieutenant commanders), and the Littoral Combat Ships, a new class
having no entrenched support base. From that solid position he rapidly enlarged his
sphere of control.
The SWE organizational hierarchy looks grossly similar to the NAE’s model
(Figure 9 on page 41).
Figure 25. SWE Organizational Diagram (From McPherson, 2007)
We will only briefly touch on the metrics and methods that the SWE has
developed in their enterprise model, and focus instead mainly on the CLASSRON
construct, since, 1) this was the most significant change for a surface warfare community
that had already partially implemented an enterprise vision in SHIPMAIN, 2) the SWE
Chief Operating Officer
Chief Financial Officer
Communications Team
CLASSRONS Strategic Financial Management Team
-
Personnel Readiness Team
Sustainment & Modernization Team
SWE Board of Directors SWE Board of Directors
*CNSF/CEO *DCNSF/CRO *OPNAVN85 *OPNAV N86/CFO
NAVSEA SPAWAR NETC CNP NETWARCOM C2F/C3F CNIC PEOs INSURV N86B N85B
PEO IWSSPAWAR 04 NAVICP
*V-NAVSEA/COO *OPNAV N43B *SEA 21 *PERS 4
OPNAV N41MSC SEA 04 RMC CDR
OPNAV N86FPEO SHIPS N821 (FMB) CNSF N00R
* EXCOMM
As required
Chief Executive Officer
Over-arching Metrics Team

105
and NAE differ more in degree than in kind, and 3) the CLASSRON concept has greatest
bearing on the topic of “the Carrier Readiness Team — Realizing the Vision of the Naval
Aviation Enterprise.”
Just as in the aviation model, the initial focus of the SWE was building a list of
“quick win” action items to generate enthusiasm and buy-in for the concept. The list of
“head hurters” differed only in type from those generated by the CRT: SPS-48 radars
aboard large deck amphibious ships, fire pump mechanical seals aboard frigates,
corrosion in cross-flooding ducts in the cruiser class and the lube oil purifiers aboard the
dock landing ships. Business processes were analyzed and were applied, and business
cases formulated. Notably, these initiatives were largely driven at the CLASSRON
command echelon level. Meanwhile, across the force, a 21 percent reduction in funded
billets in the Advanced Training Group41 cohort was executed, with a year-over-year cost
avoidance of $28 million. New distance support and remote monitoring tools and
processes promise to provide faster repair to challenged systems at a reduced cost.
The SWE abjured the aerial connotation of “cockpit charts,” settling instead on a
“bridge plot” that rolled up their focus areas. The top two categories at the bridge plot
level — again, as in the NAE construct, each panel has a drill-down to supporting metrics
— are Unit Level Training (ULT) Warships Ready For Tasking and Fleet Replacement
Plan (FRP) WRFT. In this way, the SWE attacked the issue of time- and phase-based
readiness standards with a slightly different focus than the NAE did with CV SHARP (cf.
pp. 63-75), which assesses training by R-month entitlement throughout the FRP against a
deployment standard, and attaches training values to individuals rather than ships. With
continuous assessment throughout their employability cycles and crews that are generally
an order of magnitude smaller than aircraft carriers, the SWE believes this level of
training insight will suffice.
41 The Advanced Training Group (ATG) is a cadre of experienced sea-going professionals who join
ships exiting their shipyard availabilities and shepherd them through their initial qualification process. A Lean event was applied to warfare area certifications, resulting in a move towards a “continuous training environment” that promises to reduce the training “bathtub” in the surface forces. The development of a software-driven “Training Figure of Merit” evaluation of 55 performance indicators in a Unit-Level Training Sustainment (ULTRA-S) is expected to reduce the risk that ought to ordinarily adhere to such a steep loss in schoolhouse experience. Time will tell.

106
Figure 26. The SWE “Bridge Plot”
Starting from left on the bottom of the bridge plot is an assessment of total ship
maintenance cost, a backwards-looking contrast between actual maintenance costs
against their plan. Next, a cost of training metric compares the planned cost of training in
the Fleet Training Capability Costing System (a DRRS-N component) against actual
costs incurred. Finally, an Operational Cost Delta from Plan panel shows all of the
several planned outlays of in execution year dollars against the plan. From this panel, the
SWE hopes ultimately to better understand where there money is being spent and develop
an entitlement scheme tied to the WRFT metric.
The CLASSRONs, tasked to gain insight within their own particular area of
concern rather than across the force, developed their own metrics using radar charts.
Figure 27. CLASSRON Readiness Radar Chart (From Fagnani, 2008)
-3.00
-2.00
-1.00
0.00
1.00
2.00
3.00
4.00M FO M 2
C 3
C 2
D FS
G ro ss
N et
O P T A R $
A ggr
Fit
Fill
E xp C erts
R O
T FO M
E xtensio ns
G o al C lass A V GD D G 66

107
The radar chart evaluates each ship by 14 separate metrics. The blue line
represents that ship’s performance in a given metric, while the red line shows the average
for the class and the green line states the class-wide goal. Initially each ship was
compared to each of its peers, but in 2008 they were instead measured against a standard.
This permits SWE leadership to both identify potential problem ships — a core TYCOM
responsibility — and identify class-wide trends for an enterprise view.
The CLASSRONs billets were taken “out of hide” from within the SURFOR
staffs in San Diego and Norfolk under a major reorganization, and with a goal of zero-
growth in funded personnel billets. Their commanders, unlike CRT leadership, are post-
major command captains42 hand-selected by the SWE leadership as “graybeards” —
widely respected leaders within their respective warfighting communities. The typical
CLASSRON is composed of around 20 uniformed officers, and a slightly larger number
of supporting civil servants as analysts, depending upon the size of the ship class. By
conferring “command” level responsibility upon the CLASSRON commanders — and
giving them a portion of in-execution year budgetary authority for operational and
training funds, the SWE gave their CLASSRON commanders the kind of positional
authority the CRT still lacks.
CLASSRON COs report to the SWE’s Chief Readiness Officer (CRO) — usually
the two-star commander at Naval Surface Forces, Atlantic Fleet — weekly, on a
rotational basis. This drumbeat supports the CRO’s monthly brief to the SWE Board of
Directors, and focuses on class-wide interest items of enterprise interest. The
CLASSRON COs also contribute to a bi-weekly drumbeat with “Team Ships,” a
NAVSEA cross-functional team consisting of senior leadership within NAVSEA, PEO
SHIPS and the SWE CRO.
The CLASSRONs are charged not merely with analysis and report generating, but
also with implementing changes. In order to make that new command echelon palatable
to the existing carrier strike group commanders — one- and two-star flag officers with an
42 The reader will remember that the CRT is led by a serving aircraft carrier CO, usually the
commanding officer of a ship undergoing a major modernization effort.

108
operational (fleet commander), vice administrative reporting chain (the TYCOM) — the
SWE emphasizes that the CLASSRONS are “supporting” the enterprise process for the
“supported” CSG commanders.43
Although complexity seems built-in to the enterprise construct as it more
thoroughly penetrates an organization, the alignment process works fairly well for the
Surface Warfare Enterprise: Often when CLASSRON identified an issue that cannot be
solved at the local level, the SWE BOD tackles it within a week (Fagnani, 2008) —
lightning fast by naval administrative standards.
The system needed to be effective, and generate quick, easily understood
accomplishments, since the notion of an added layer of command had to be stamped out
for the CLASSRON concept to take root. Continuous dialogue with the CSG
commanders was required at first to ensure the CLASSRON had not merely the
responsibility to make changes, but also the authority to impose them
C. CHAPTER SUMMARY
1. Replication
Many systems engineers are accustomed to thinking of “systems” from a
development, test, production and deployment mindset, but per Blanchard and
Fabrycky’s Systems Engineering and Analysis, it can also consist of “a coordinated body
of methods or complex scheme or plane of procedure, such as a system of organization
and management.”
43 The concept of “supported” and “supporting” are very familiar to amphibious warfare staffs,
wherein the pivotal command element in a group of peers is supported by the other commanders. Thus, an Amphibious Group Commander (PHIBGRU), a Navy captain, might ask for support from the Air Combat Element (ACE), a Marine Colonel, during the transit of a potentially hostile choke point at sea. During flight operations, the ACE is supported by PHIBGRU ships for refueling services. Once reaching the amphibious objective area, both the ACE and the PHIBGRU would support the Battalion Landing Team (BLT) commander, also a Marine infantry colonel.
The concept of supported and supporting is designed to harmonize the efforts of co-equals (or officers of different ranks who are not in a unified chain-of-command) around a common, shared objective, while preserving the capability of fluidly changing both missions and relationships as the tactical situation dictates. Applying the concept it in the context of the CLASSRON is a little strange from a doctrinal standpoint, since the CSG commander is unlikely to ever directly support the CLASSRON’s efforts. The alternativehaving the CLASSRON “report” directly to the either the CSG commander or the SWE would be politically unpalatable.

109
The NAE management construct was one attempt to impose a more rigorous and
requirements-driven process using modern business process models that have many
analogues to the systems engineering process. It proved sufficiently successful that the
Chief of Naval Operations imposed a top-down requirement on other warfighting
competencies to develop their own enterprise models, simultaneously developing a
governing board at the top labeled the “Naval Enterprise.” At the Naval Enterprise level,
the structure was built first, with inputs and out puts to be derived after that structure was
in place. The Surface Warfare community was one of the earlier and more aggressive
adopters of the enterprise process model.
The SWE’s leadership, already familiar with enterprise behavior in the
rationalization of ship maintenance processes, used a similar output as did the NAE:
Warfighting units — in this case, warships — ready for tasking at reduced cost. Critical
to the SWE vision was the creation of CLASSRONs from within the TYCOM staffs,
commanded — as opposed to led — by a post-major command captain with experience
in the appropriate warfighting arena.

110
THIS PAGE INTENTIONALLY LEFT BLANK

111
VI. CONCLUSION
A. KEY POINTS AND RECOMMENDATIONS
A system is an assemblage or combination of elements or parts forming a complex or unitary whole, such as a river system or a transportation system; any assemblage or set of correlated members, such as a system of currency; an ordered comprehensive assemblage of facts, principles, or doctrines in a particular field of knowledge or thought, such as a system of philosophy; a coordinated body of methods or complex scheme or plane of procedure, such as a system of organization and management; or any regular or special method of plan or procedure, such as a system of marketing, numbering or measuring. (Blanchard & Fabrycky, 2006)
1. Key Points
Business process engineering and systems engineering seem to have, at first
blush, little to do with one another. The first concerns itself with management
methodologies, strategies and processes, the second with products — systems, sub-
systems, components — and their lifecycles. But, as I hope to have demonstrated in this
thesis, there is not — nor should there be — an air gap between management at the top of
an enterprise and the products (outputs) at the production level. As Blanchard and
Fabrycky point out in the quote excerpted above, the management system of a complex
enterprise such as a principal naval warfighting domain does indeed concern itself with
inputs (resources) and outputs (readiness), simplified interactions between internally
complex components (stakeholders), rigorous requirements analysis, functional allocation
and traceability. In the ongoing competition between current and future readiness an
enterprise vision is crucial.
Alignment works. The Naval Aviation Enterprise was able to garner significant
efficiencies using modern business process tools at the production level, as demonstrated
by CAPT CJ Jaynes at the Naval Air Station Lemoore intermediate maintenance
department. When the process was expanded to include management of resources at the
type and system commander level, wasteful behaviors were identified, rectified and
112
readiness increased — all at reduced cost. This effort also generated significant savings in
the carrier force, as maintenance and modernization schedules were realigned to the
requirements of the Fleet Response Plan. The conflict between the cost of maintaining an
effective operating force and building the objective force of the future will require
continuous management, but at least for now the mechanism for doing so is in place.
2. Recommendations
Naval aviation has not yet finally and completely entered into managerial
Nirvana, however. While the top-down, enterprise view has been successfully transferred
from CAPT Jaynes’ emblematic industrial production effort to the broader goal of
generating combat readiness across the NAE, the culture remains resistant to change. It is
right to wonder, as VADM Massenburg and VADM Zortman have done, whether naval
aviation was seriously organizing itself under business principles, or merely playing at it.
Cultures are fiercely resistant to change and the presence of an inspired agent atop
an organization not merely dedicated to change but actually insisting upon it is critical to
any prospect of success. This is especially true since culture change, per the Thomas
Group, has many multiples more leverage than process improvement does at the factory
floor level. This leads us to four conclusions, the first three general, and the last specific.
First, if the Navy is serious about getting its arms around maximizing its combat
readiness, now and in the future, at reduced cost — and given current political and
economic trends, it certainly ought to be — succession planning at the flag officer ranks
is important. As the Current Ops lead of the NAE, then RADM Denby Starling would
have been a natural replacement for VADM Zortman atop the enterprise in 2007. Instead,
he was sent to command the Naval Network Warfare Command — and the Naval
Netwar/FORCEnet Enterprise (NNFE) — where his experience has been put to good use.
The gain of the NNFE may have come at the NAE’s expense, especially in light of the
much greater TOA lying within the NAE’s domain.
The combination of mutually congenial personalities atop the NAE at its
inception was unique; an auspicious intersection that permitted the free and open
exchange of information facilitating current readiness in a fashion that was “correct,

113
repeatable and predictable” (W. Massenburg, personal communication, October 13,
2008). This in turn enabled a sensible investment strategy in sustainable readiness in the
future. The author’s perception is that their successors’ relationships and passion for
continuous process improvement-driven change are attenuated by comparison: Flag
Attention Deficit Disorder.
Second, from the perception of junior, and even mid-level naval leadership, the
NAE is something that “staff captains and their admirals do,” another in a series of
ephemeral enthusiasms along the lines of the TQL/TQM innovations that blossomed and
then withered on the vine in the mid-1990s. The Navy’s Executive Business Course at the
Naval Postgraduate School in Monterey, California is a step in the right direction, but it is
targeted at flag officer-level leadership when smart management concepts must be
inculcated at every layer of consumption throughout the force to be meaningful across the
force. The employment of business process model consultants such as the Thomas Group
can help begin the process, but at the price of two dozen or more fully burdened
consultants costing several hundred thousand dollars each per man, accession level
training would be cheap by comparison and probably more effective in the long run.
Furthermore, while the Thomas Group’s emphasis on generating “quick wins” to
generate enthusiasm is good marketing for the Thomas Group, low hanging fruit is often
harvested more rapidly than the appetite for it fades. Short-sighted decisions that fit
within the fitness report cycle — the decision to eliminate anti-submarine warfare
expertise (p. 91, above) aboard the carrier probably fits that description, the jury is still
out on the decision to re-baseline the carrier maintenance plan (p. 86, footnotes) — can
generate the kind of push back that considered strategic change would not. In any case,
the easy work has been done: Inertia must not become the constraint.
Third, if the force is to accept the notion of enterprise alignment, it would be
helpful if the physical organization were modified to conform to that model. There was a
realignment of staff officer functions between the east and west coast TYCOMS in 2004,
and the streamlined organization thenceforth pretended to be “one staff on two coasts,”
with policy being set at CNAF (largely) and waterfront execution at both coasts. In the

114
author’s view, this was little more than a fig leaf for a so-called “flagpole issue,” 44 and
the source of frequent organizational friction just within the TYCOM, not to mention the
broader enterprise.
It was not uncommon, for example, for an unpopular decision at the policy level
at CNAP to be successfully protested within the opposite coast’s administrative chain of
command — staff officer collegiality often prevented the escalation of purely internal
issues to a level requiring flag officer intervention. Too, when staff officers would
complain that enterprise workload was interfering with their “day jobs,” an Air Boss
might reply that, in time, they would come to see that the enterprise “was their day job.”
And yet the day job had not gone away, and it was routine for an officer that had been
ordered to fill a funded billet in an existing staff to report through any one of four chains
of command, depending upon the issue in play: The Carrier Readiness Team, the Current
Operations cell, his own TYCOM staff or the overall NAE. The overall effect was not to
flatten the organization but to complicate it. This is not alignment.
Finally, and in the particular focus of this thesis, the Carrier Readiness Team must
move from an “influence” organization to one that is explicitly empowered and
accountable for driving change. Just as the TMS squadrons have wing commanders
reporting their results to the NAE, so must the carrier COs report to a carrier
TYPEWING equivalent prior to briefing the board of directors. The primus inter pares
construct of the CRT chairmanship is collegial, but not particularly effective. As a result,
their focus has been allowed to drift from “aircraft carriers ready for tasking at reduced
cost, now and in the future” to tinkering around the margins and special projects like the
Ao issue (p. 51, above). The Ao issue is significant — responding to the warfighter
demand signal is a core responsibility of a warfighting enterprise — but it is a project, not
a process.
Because of his successes leading the CRT as a carrier CO, RDML Dave Buss was
ordered to the staff of the Vice Chief of Naval Operations to stand up the Navy
Enterprise. Per Labovitz adherents such as VADM Massenburg, the enterprise process
44 A flagpole issue refers to an organizational reticence to reduce flag officer positions, with their
attendant administrative staffs. But if cultural change is to be real, it must be comprehensive.
115
must start with the “main thing” — an output — then process, and then organizational
change. The Navy Enterprise was a laudable attempt to rapidly export the NAE lessons
learned across the force, but it placed structure ahead of output, ahead of process.
It might or might not have been effective to place a new flag officer atop his
recent peers. In the event it was not attempted, probably because of another flagpole
issue: There was no institutional memory of a CRT-leading flag officer, and placing a hot
running officer like RDML Buss atop a stand-up organization existing outside the
understood organizational framework might have prematurely limited the arc of his
career. But at the end of the day, a freshly-minted one star officer coordinating reports
from three stars to an already fully employed four star is little more than a highly
experienced, highly capable action officer.
From the systems engineering (and business process engineering) standpoint, a
better organizational construct might consist of functional re-alignment: Aircraft carriers
comprehensively managed at CNAL, led by a carrier experienced flag officer wearing
two stars. This would be a flag officer who had successfully commanded both an aircraft
carrier and an aircraft carrier strike group and who, in so doing, had gained the benefit of
real throw weight and experiential difference from the carrier commanding officer cohort.
At CNAF, overall force management (generally) and aviation (specifically) would be led
by a three star who might have been either an airwing commander or carrier CO in his
major command tour. Support staff — now divided by mission area across the two coasts
— would be re-apportioned appropriately. In truth, however, the underlying principle of
business process engineering would require a blank slate reappraisal of roles and
missions with sacred cows sacrificed up front — a functional decomposition, in other
words, followed by a functional allocation of personnel and material assets.
B. AREAS TO CONDUCT FURTHER RESEARCH
1. Education
As previously discussed, cultures are robustly resistant to change and for many
years, naval aviation’s culture was one of consumption: More flying hours, more arrested

116
landings, more steaming days — all untied to any objective requirement. The realignment
of resources tied to a defensible requirement structure was a step in the right direction,
but it is the author’s perception that the need for such change has not thoroughly
permeated the operating forces. “Boots on Deck” and Enterprise AIRSpeed are also
positive advancements, but true cultural reform will require continued leadership focus,
time and effort. A front-end analysis of the proper mix of accession-level and recurrent
training should be researched as a way to get leadership at the junior officer and chief
petty officer level to understand the importance of maintaining a credible combat force
now and in the future in the most efficient way.
2. Organizational Realignment
A zero-baseline review of the Naval Aviation Enterprise ought to be undertaken,
with no preconceptions as to eventual structure. Flagpole issues should be set aside, and a
functional analysis and allocation of resources executed.
3. Information Sharing
The Surface Warfare Enterprise has in many ways extended the model developed
by the NAE with its use of CLASSRONs. Although the author has not had the space to
study the various warfighting enterprises in as much detail, it is entirely possible that the
Undersea Enterprise, Naval Expeditionary Combat Enterprise, and Naval
Netwar/FORCEnet Enterprise have lessons to share at the staff officer level (flag officers
already collaborate at the Fleet Readiness Enterprise level). The author is quite certain
that the CV SHARP method of tracking training readiness to individuals aboard ships
will provide superior insights into any naval unit’s capability to execute a given task,
provide persistence on task and enable smart risk decisions once the model is fully
mature. There are many good ideas on the waterfront, not all of which are “invented
here.” Keeping an open mind is crucial.

117
LIST OF REFERENCES
Allardyce, D. (2007). OPIS Team Work Plan. Dallas : TX : Thomas Group International.
Badertscher, E., Bahjat, A. & Pierce, J. (2007). Naval Aviation Vision — 2020. Patuxent River: MD: Naval Air Systems Command, Command Staff Office.
Blanchard, B. & Fabrycky, W. (2006). Systems Engineering and Analysis. Upper Saddle River: NJ: Pearson Prentice Hall.
Burton-Hole, Tracey (2001). The Theory of Constraints and its Thinking Processes. New Haven, CT: Goldratt Institute.
Carter, W and Moore, D. (2007). Naval Aviation Enterprise Carrier Readiness Team. Norfolk, VA: NAE Board of Directors PowerPoint briefing.
Cross, T. (2007). The F/A-18 Engine: Getting Lean. Case Study. Charlottesville, VA: Darden Business Publishing: University of Virginia.
Curtin, N. (2001). Military Aircraft — Cannibalizations Adversely Affect Personnel and Maintenance. Washington, DC: GAO Testimony to Congress.
Department of the Navy. (2000). 2000 Posture Statement. Graphic drawn 5 February 2008, from http://www.navy.mil/navydata/policy/fromsea/pos00/pos00-3.html
Fagnani, R. (2008). CLASSRON Brief, Dallas, TX: Thomas Group International PowerPoint briefing.
Gallardo, A. (1999). Street to Fleet: Time to Train. Wings of Gold. Pensacola, FL: Association of Naval Aviation Press.
Harry, M. & Schroeder, R. (2000). Six Sigma — The Breakthrough Management Strategy. New York: Random House: p.115.
Jaynes, “CJ.” Benefits of Lean. (2004) PowerPoint presentation to Women in Aviation Conference: Patuxent River, MD.
Johnson, M. NAE Annual Report, (2006), NAVAIR pdf: Patuxent River, MD.
Kumar, A. & Yin, C. LEAN Brings Results. (2004) Triangle Park, NC: ISA, drawn 5 February 2008 from http://www.isa.org/InTechTemplate.cfm?Section=InTech&template=/ContentManagement/ContentDisplay.cfm&ContentID=38982
Labovitz, G. and Rosansky, V. (1997). The Power of Alignment: How Great Companies Stay Centered and Accomplish Extraordinary Things. Hoboken: Wiley and Sons.

118
Laukaitis, S. (2001). BuPers Report — Detailing at a Cross-roads. Hook magazine, San Diego: Tailhook Association.
Malone, M. Naval Aviation Readiness Integrated Improvement Program (NAVRIIP). Wings of Gold - Summer 2003.
Massenburg, W. & Pierce, J. (2007). The Edge of the Envelope — Changing the Way We
Do Business in Government. Patuxent River: MD: Unpublished manuscript.
MacBride, D. The Seven Manufacturing Wastes. EMS Consulting Group, Carlsbad, CA, retrieved 5 February 2008, from http://www.emsstrategies.com/dm090203article2.html
McPherson, D (2007). SWE-101, December 2007, San Diego, CA: CNSF PowerPoint briefing.
Moore, D. (2005). Naval Aviation AIRSpeed for Lean Aerospace Initiative Plenary Conference. Patuxent River, MD: NAVAIR PowerPoint briefing.
Motorola University. (2008a). What is Six Sigma? Retrieved 22 January 2008, from http://www.motorola.com/content.jsp?globalObjectId=3088
Motorola University. (2008b). About Motorola University — The Inventors of Six Sigma. retrieved 22 January 2008, from http://www.motorola.com/content.jsp?globalObjectId=3079
Nathman, J. (2000). Fly, Fight, Lead. Naval message, retrieved 12 March 2008 from http://www.airpac.navy.mil/home/flyfightlead.doc.
Naval War College Public Affairs (2000). CNO Visits NWC & Asserts His Priorities. All Hands - Dec 2000.
Patrick, D. (2006). Current Readiness/Enterprise AIRSpeed Newsletter, Vol 5, Issue 2, from http://www.cnaf.navy.mil/navriip/content.asp?AttachmentID=226
Perkins, S. (2007). Naval Enterprise Transformation: Working for the Greater Good. Case Study. Babson Park, MD: USN and Babson Executive Education.
Pittman, G. (2002). Reducing Time to Train for Naval Aviators and Improving Warfighting Readiness Using Innovative Commercial Processes. PowerPoint briefing, Acton Burnell, Inc: Alexandria, VA.
Shingo, S. (1989). A Study of the Toyota Production System from an Industrial Engineering Standpoint. New York: Productivity Press.
Shrout, G. (2006). NAE — An Overview: Achieving aircraft and carriers ready for tasking at reduced cost. PowerPoint presentation. Patuxent River, MD.

119
Unattributed (2008). Highlights of the Department of the Navy — FY 2009 Budget, Arlington, VA: Office of Budget, Department of the Navy.
Taylor, W., (2006). Ship Class Squadrons Begin Operations Feb. 15, Norfolk, VA: CNSL Public Affairs Officer.
Warner, R., (2007). CLASSRON Metrics Training, San Diego, CA: CNSP N8A PowerPoint briefing.
Watson, G. (2001). Cycles of Learning: Observations of Jack Welch. Six Sigma Forum Magazine: Milwaukee, WI.

120
THIS PAGE INTENTIONALLY LEFT BLANK

121
INITIAL DISTRIBUTION LIST
1. Defense Technical Information Center Ft. Belvoir, Virginia
2. Dudley Knox Library Naval Postgraduate School Monterey, California
3. RDML D. Gaddis NAVAIR 4.0 NAS Patuxent River, Maryland