naval postgraduate school smt, dark networks, embeddedness, multiplex network mapping, terrorism,...
TRANSCRIPT

NAVAL POSTGRADUATE
SCHOOL
MONTEREY, CALIFORNIA
THESIS
Approved for public release; distribution is unlimited
EMBEDDED EFFICIENCY: A SOCIAL NETWORKS APPROACH TO POPULAR SUPPORT AND DARK
NETWORK STRUCTURE
by
Leopele S. Raabe Gary S. Blount
March 2016
Thesis Advisor: Sean Everton Co-Advisor: Doowan Lee

THIS PAGE INTENTIONALLY LEFT BLANK

i
REPORT DOCUMENTATION PAGE Form Approved OMB No. 0704–0188
Public reporting burden for this collection of information is estimated to average 1 hour per response, including the time for reviewing instruction, searching existing data sources, gathering and maintaining the data needed, and completing and reviewing the collection of information. Send comments regarding this burden estimate or any other aspect of this collection of information, including suggestions for reducing this burden, to Washington headquarters Services, Directorate for Information Operations and Reports, 1215 Jefferson Davis Highway, Suite 1204, Arlington, VA 22202-4302, and to the Office of Management and Budget, Paperwork Reduction Project (0704-0188) Washington, DC 20503. 1. AGENCY USE ONLY (Leave blank)
2. REPORT DATE March 2016
3. REPORT TYPE AND DATES COVERED Master’s thesis
4. TITLE AND SUBTITLE EMBEDDED EFFICIENCY: A SOCIAL NETWORKS APPROACH TO POPULAR SUPPORT AND DARK NETWORK STRUCTURE
5. FUNDING NUMBERS
6. AUTHOR(S) Leopele S. Raabe and Gary S. Blount
7. PERFORMING ORGANIZATION NAME(S) AND ADDRESS(ES) Naval Postgraduate School Monterey, CA 93943-5000
8. PERFORMING ORGANIZATION REPORT NUMBER
9. SPONSORING /MONITORING AGENCY NAME(S) AND ADDRESS(ES)
N/A
10. SPONSORING / MONITORING AGENCY REPORT NUMBER
11. SUPPLEMENTARY NOTES The views expressed in this thesis are those of the author and do not reflect the official policy or position of the Department of Defense or the U.S. Government. IRB Protocol number ____N/A____.
12a. DISTRIBUTION / AVAILABILITY STATEMENT Approved for public release; distribution is unlimited
12b. DISTRIBUTION CODE
13. ABSTRACT (maximum 200 words)
This thesis poses the question, What is the nature of the relationships between social embeddedness, structural efficiency, and organizational behavior within dark networks? The objectives of this thesis are twofold. The primary objective is to illuminate the interaction between embeddedness, structure, and activity within dark networks, the aim being to study if changes in embeddedness manifest in observable fluctuations in a network’s topography or behavior. The secondary objective is to evaluate the results of a novel, permutation-based methodology. Throughout, this thesis combines qualitative elements of social movement theory and social network analysis with quantitative statistical techniques to provide a mixed-method examination of three empirical dark network case studies (the Provisional Irish Republican Army, the Noordin Top Terrorist Network, and a Southeast Asian Foreign Fighter Facilitation network). The results of both the qualitative and quantitative methods are synthesized to highlight the strengths and limitations associated with each approach. This thesis reveals that, although embeddedness may contribute to rapid mobilization or organizational security, exogenous factors such as network shocks and endogenous variations in core membership may preclude such advantages from influencing internal network structure. Finally, this thesis recommends potential intelligence applications and areas for future social network research.
14. SUBJECT TERMS SNA, SMT, dark networks, embeddedness, multiplex network mapping, terrorism, PIRA, foreign fighter facilitation, Noordin Top, Southeast Asia, network simulation
15. NUMBER OF PAGES
131 16. PRICE CODE
17. SECURITY CLASSIFICATION OF REPORT
Unclassified
18. SECURITY CLASSIFICATION OF THIS PAGE
Unclassified
19. SECURITY CLASSIFICATION OF ABSTRACT
Unclassified
20. LIMITATION OF ABSTRACT
UU NSN 7540–01-280-5500 Standard Form 298 (Rev. 2–89) Prescribed by ANSI Std. 239–18

ii
THIS PAGE INTENTIONALLY LEFT BLANK

iii
Approved for public release; distribution is unlimited
EMBEDDED EFFICIENCY: A SOCIAL NETWORKS APPROACH TO POPULAR SUPPORT AND DARK NETWORK STRUCTURE
Leopele S. Raabe Captain, United States Army
B.A., University of Hawaii, 2006
Gary S. Blount Major, United States Army
B.A., Albany State University, 2000
Submitted in partial fulfillment of the requirements for the degree of
MASTER OF SCIENCE IN INFORMATION STRATEGY AND POLITICAL WARFARE
from the
NAVAL POSTGRADUATE SCHOOL
March 2016
Approved by: Sean Everton, Ph.D. Thesis Advisor
Doowan Lee Co-Advisor
John Arquilla, Ph.D. Chair, Department of Defense Analysis

iv
THIS PAGE INTENTIONALLY LEFT BLANK

v
ABSTRACT
This thesis poses the question, What is the nature of the relationships between
social embeddedness, structural efficiency, and organizational behavior within dark
networks? The objectives of this thesis are twofold. The primary objective is to illuminate
the interaction between embeddedness, structure, and activity within dark networks, the
aim being to study if changes in embeddedness manifest in observable fluctuations in a
network’s topography or behavior. The secondary objective is to evaluate the results of a
novel, permutation-based methodology. Throughout, this thesis combines qualitative
elements of social movement theory and social network analysis with quantitative
statistical techniques to provide a mixed-method examination of three empirical dark
network case studies (the Provisional Irish Republican Army, the Noordin Top Terrorist
Network, and a Southeast Asian Foreign Fighter Facilitation network). The results of
both the qualitative and quantitative methods are synthesized to highlight the strengths
and limitations associated with each approach. This thesis reveals that, although
embeddedness may contribute to rapid mobilization or organizational security, exogenous
factors such as network shocks and endogenous variations in core membership may
preclude such advantages from influencing internal network structure. Finally, this thesis
recommends potential intelligence applications and areas for future social network
research.

vi
THIS PAGE INTENTIONALLY LEFT BLANK

vii
TABLE OF CONTENTS
I. INTRODUCTION..................................................................................................1 A. PURPOSE AND SCOPE ...........................................................................2 B. RATIONALE .............................................................................................4 C. LIMITATIONS ..........................................................................................6 D. THESIS OUTLINE ....................................................................................7
II. THEORETICAL FRAMEWORK .......................................................................9 A. QUANTITATIVE LITERATURE ...........................................................9
1. Multiplex Network Mapping ......................................................10 2. Social Network Topography and Change Detection.................11 3. E-I Index .......................................................................................11 4. Centralization ...............................................................................12 5. Density and Average Degree .......................................................14
B. QUALITATIVE LITERATURE ............................................................16 1. SMT: Microstructures and Relational Ties in
Mobilization ..................................................................................17 2. Embeddedness ..............................................................................18
III. CASE SELECTION AND METHODOLOGY .................................................21 A. DATA CODING .......................................................................................21 B. CASE SELECTION AND DATA DESCRIPTIONS ...........................22
1. Southeast Asian FFF Network ....................................................23 2. Noordin Top Terrorist Network .................................................23 3. PIRA Network ..............................................................................24
C. RESEARCH DESIGN .............................................................................24 1. Quantitative Methods ..................................................................25
a. Measuring Embeddedness ................................................25 b. Estimating Network Efficiency .........................................26 c. Estimating Statistical Significance ...................................26 d. Network Permutations ......................................................26
2. Qualitative Methods.....................................................................27
IV. NETWORK BACKGROUNDS ..........................................................................29 1. Southeast Asian FFF Network ....................................................29 2. Noordin Top Terrorist Network .................................................33 3. PIRA Network ..............................................................................34

viii
V. QUANTITATIVE ANALYSIS ...........................................................................39 A. SOUTHEAST ASIAN FFF NETWORK ...............................................40
1. Southeast Asian FFF Network Statistics Summary ..................42 2. Southeast Asian FFF Correlational Analysis ............................43
B. NOORDIN TOP NETWORK .................................................................46 1. Noordin Top Network Statistics Summary ...............................50 2. Noordin Top Correlational Analysis ..........................................51
C. PROVISIONAL IRISH REPUBLICAN ARMY ..................................53 1. PIRA Network Statistics Summary ............................................57 2. PIRA Correlational Analysis ......................................................58
D. CONCLUSION ........................................................................................59
VI. QUALITATIVE ANALYSIS ..............................................................................61 A. SOUTHEAST ASIAN FOREIGN FIGHTERS ....................................61
1. Profiles of Foreign Fighter Facilitation: Microstructures and Relational Ties ......................................................................62 a. Integration into Networks .................................................63 b. Kinship ...............................................................................64 c. Associational Networks .....................................................64 d. History of Activism ............................................................67
2. Organizational Networks and Ties .............................................67 a. 1981 through 1990: Jihad against the Soviet
Occupation of Afghanistan ...............................................68 b. 1991 through 2000: The Rise of al Qaeda .......................69 c. 2001 through 2010: U.S. Conflict in Iraq and
Afghanistan .......................................................................71 d. 2011 through 2015: The Rise of ISIL ..............................72
B. THE NOORDIN TOP NETWORK .......................................................75 1. Noordin Top Meta-Network Analysis ........................................75
a. Family Ties ........................................................................78 b. Freindship Ties .................................................................79 c. Worship Ties ......................................................................81 d. School Ties ........................................................................82
2. Mobilization and Embedding Processes ....................................84 a. Mobilizing Existing Connections .....................................84 b. Embedded Bright Network Connections ..........................86
C. PROVISIONAL IRISH REPUBLICAN ARMY ..................................87 1. PIRA as a Social Movement: Grievances Ties and
Organization .................................................................................88 a. Movement Genesis: Period 1 (1969–1976) ......................90

ix
b. Movement Apex: Period 2 (1981–1989) ...........................90 c. Movement Culmination: Period 3 (1990–1998) ..............91
2. Longitudinal Social Network Analysis .......................................91
VII. INFERENCES FROM THE STUDY OF DARK NETWORK EMBEDDEDNESS ............................................................................................101 A. GENERAL FINDINGS .........................................................................101 B. ENABLING EFFECTS OF EMBEDDEDNESS ................................102 C. QUANTITATIVE METHODS .............................................................103 D. AREAS OF FUTURE RESEARCH .....................................................104
1. Prison Networks .........................................................................104 2. Varying Effects of Embedded Ties ...........................................105
E. OPERATIONAL AND POLICY APPLICATIONS ..........................106
LIST OF REFERENCES ..............................................................................................107
INITIAL DISTRIBUTION LIST .................................................................................113

x
THIS PAGE INTENTIONALLY LEFT BLANK

xi
LIST OF FIGURES
Figure 1. Example of Internally Focused SNA Network Graph .................................5
Figure 2. Example of Embeddedness-Focused SNA Network Graph ........................6
Figure 3. Example of Small World and Scale-Free Network Graphs .......................14
Figure 4. Southeast Asian FFF Network Statistics (Density, Average Degree, Density, and Group E-I) .............................................................................41
Figure 5. Southeast Asian FFF Network, Group E-I Index Error .............................42
Figure 6. Southeast Asian FFF Network Statistics Distribution Summary ...............43
Figure 7. Southeast Asian FFF Network Correlation Coefficient Confidence Intervals (Group E-I)..................................................................................45
Figure 8. Noordin Network Statistics (Density, Average Degree, Density, and Group EI) ...................................................................................................47
Figure 9. Noordin Network Statistics (E-I Index and Arrest Data) ...........................50
Figure 10. Noordin Network Statistics Distribution Summary ...................................51
Figure 11. Noordin Correlation Coefficient Confidence Intervals (Group E-I)..........52
Figure 12. PIRA Network Statistics ............................................................................56
Figure 13. PIRA Network Measure Distribution Summary ........................................57
Figure 14. PIRA Correlation Coefficient Confidence Intervals ..................................59
Figure 15. Conceptual FFF Network Model ...............................................................63
Figure 16. Southeast Asian FFF Network 1980–1990 ................................................69
Figure 17. FFF Network 1991 through 2000: The Rise of al Qaeda...........................71
Figure 18. 2001–2010 U.S. Entry into Iraq and Afghanistan......................................72
Figure 19. 2011 through 2015: The Rise of ISIL ........................................................74
Figure 20. Noordin Complete Network .......................................................................77
Figure 21. Noordin Top Kinship Meta-Network .........................................................79
Figure 22. Noordin Friendship Network .....................................................................80
Figure 23. Noordin Top Soulmates Network ..............................................................81
Figure 24. Noordin Top Schoolmates .........................................................................82
Figure 25. PIRA Network Period 1 (1969–1976) .......................................................93
Figure 26. PIRA Network Period 2 (1981–1989) .......................................................94
Figure 27. PIRA Network Period 3 (1990–1998) .......................................................95

xii
Figure 28. PIRA Network Brigade Affiliation ............................................................97

xiii
LIST OF TABLES
Table 1. Southeast Asian FFF Network Pearson’s Product Moment Correlation .................................................................................................45
Table 2. Noordin Top Network Pearson’s Product Moment Correlation ................53
Table 3. Empirical PIRA Network Values...............................................................56
Table 4. PIRA Network Pearson’s Product Moment Correlation ............................59
Table 5. SNA Meterics: Aggregated Noordin Top Network ...................................78
Table 6. Noordin Top Meta-Network Measure Distribution ...................................83
Table 7. Meta-Network Node and Link Distribution as Percentage of Total Network......................................................................................................86
Table 8. PIRA Network Topographical Measures ...................................................98

xiv
THIS PAGE INTENTIONALLY LEFT BLANK

xv
LIST OF ACRONYMS AND ABBREVIATIONS
AQSEA Al Qaeda in Southeast Asia
AQI Al Qaeda in Iraq
ASG Abu Sayyaf Group
BIFF Bangsamoro Freedom Fighters
DDII Indonesian Islamic Propagation Council (Dewan Dakwah Islamiyah Indonesia)
DI Darul Islam
E-I External-internal
FAKSI Forum Anak Kost Se-Indonesia
FFF Foreign fighter facilitation
HASI Hilal Ahmar Society Indonesia
ICG International Crisis Group
ICPVTR International Center for Political Violence and Terrorism Research
IED Improvised Explosive Device
IIRO International Islamic Relief Organization
IRA Irish Republican Army (Old)
ISCGP Islamic Studies Call and Guidance of the Philippines
ISIL Islamic State of Iraq and the Levant
IWM Islamic Worldwide Mission
JAS Jemaah Ansharus Syariah
JAT Jemaah Ansharut Tauhid
JI Jemaah Islamiyah
JMBPMS JMB Personnel Management Services
KMM Kumpulan Mujahidin Malaysia
KOMPAK Komite Aksi Penanggulangan Akibat Krisis or “the Crisis Management/Prevention Committee”
MAK Maktab al Khidamat lil-Mujaheddin al-Arab
MILF Moro Islamic Liberation Front
MNLF Moro National Liberation Front
NORAID Irish Northern Aid Committee

xvi
PAS Organization of Muslim Scholars of Malaysia Pan-Malaysian Islamic Party
PIRA Provisional Irish Republican Army
SMT Social Movement Theory
SNA Social Network Analysis
SNCD Social Network Change Detection
SVBIED Suicide Vehicle Born Improvised Explosive Device
UOB United Overseas Bangsamoro
WKR Wae Ka Rae (WKR)

1
I. INTRODUCTION
For an insurgency, a network is not just a description of who is in the insurgent organization; it is a picture of the population, how it is put together and how members interact with one another. For example, a tribal society already has affiliated social, economic, and military networks easily adapted to warfighting. The ways in which insurgents work within a tribal network is an expression of inherent cultural and social customs.
—Department of the Army1
Terrorist and insurgent networks present a continuing threat to the security of the
United States of America and its allies. In spite of ongoing intervention attempts, militant
groups continue to grow and operate with varying levels of efficiency across the globe.
Much of the research within the field of social network analysis (SNA) has focused on
the internal constitution (topographical structure and membership) of dark networks.2
However, limited research has been conducted on how external ties affect internal dark
network dynamics. Moreover, in instances where authors address both network structure
and external ties, they have typically approached these features as separate elements.3
Most researchers have used topographic network measures such as centralization
and size as indicators of, and contributors to, efficiency.4 In some cases, organizational
effectiveness and resilience is framed as dependent on these factors.5 These approaches
frame dark network success or failure as primarily being internally determined, thereby
downplaying the recognizable role played by external environmental factors.
1 Department of the Army, Insurgencies and Countering Insurgencies (FM 3–24) (Washington, DC,
June 2014), 4–18.
2 Within this thesis, the terms “dark” and “bright” are used within the context established by Milward and Raab in “Dark networks as problems,” (2003) where dark refers to illegal and, covert and bright refers to legal and overt. Throughout this report these terms are used to describe characteristics of both groups and individuals.
3 Carlo Morselli, Inside Criminal Networks (New York: Springer, 2009), Chapter IV and Chapter V.
4 Walter Enders, and Paan Jindapon. “Network externalities and the structure of terror networks,” Journal of Conflict Resolution 1, no. 19 (2009), doi:10.1177/0022002709355439; Brafman, Ori, and Rod A. Beckstrom. The Starfish and the Spider (New York: Portfolio/Penguin Group, 2006).
5 Brafman, Ori, and Rod A. Beckstrom. The Starfish and the Spider.

2
Specifically, these approaches do not adequately address potential implications of a
network’s external ties to the surrounding society.
U.S. Army doctrine acknowledges the propensity for insurgent networks to be
highly embedded within host societies. The Army’s counterinsurgency field manual goes
as far as describing “networked insurgencies” as adding “to the complexity of an area of
operations because they are not acting as a unified force and because of their complex set
of connections to the rest of society and each other.”6 However, even this document does
not prescribe methodologies for measuring embeddedness or for accessing and mitigating
embeddedness’s potential effects.
This thesis combines descriptive case study analyses of individuals and
organizations with quantitative SNA to advance a longitudinal study of three separate
dark networks. The networks surveyed in this thesis are the Noordin Top terrorist
network that operated in Indonesia between 2000 and 2010, elements of the Southeast
Asian Foreign Fighter Facilitation (FFF) network that operated between 1980 and 2015,
and the Provisional Irish Republican Army (PIRA) that operated in Ireland between 1969
and 1998. This thesis’s primary focus is the effect that ties between militant networks and
other existing social entities have on network structure.
A. PURPOSE AND SCOPE
This thesis proceeds along two axes of inquiry, the first is research based and the
second is methodological. The first axis answers the question: what is the nature of the
relationship between social embeddedness, organizational behavior, and structural
efficiency within dark networks? In answering the research question, this thesis examines
linkages between dark networks and society, illuminating the roles of bright entities and
associational networks within contested covert organizations. Along the second axis, the
authors of this thesis, developed a permutation-based algorithm which attempts to
normalize empirical statistical results, by comparing them to observations of randomized
6 Department of the Army, Insurgencies and Countering Insurgencies (FM 3–24) (Washington, DC,
June 2014), 4–18.

3
simulated networks. The innovative methodology introduced, ads to the objectivity and
analytical rigor of the traditional statistical and SNA methods used.
Along both axes, this thesis seeks to examine whether or not changes in the social
embeddedness of dark networks manifests in observable fluctuations, in organizational
structure or behavior (such as the number of attacks a network conducts). This thesis
hypothesizes that increased embeddedness in bright networks has a positive effect on
measures of organizational efficiency, including centralization, density, and average
degree centrality. In addition, this thesis compares the results provided by qualitative and
quantitative methods in order to reveal limitations associated with each approach. The
resulting observations provide insights which may be useful to analysts and planners
attempting to ascertain the resilience of existing and emergent dark networks. They may
also provide intelligence professionals with focus areas for data collection and analysis.
Conceptually, this thesis uses a multidisciplinary approach that merges theories
and methodologies from SNA, social movement theory (SMT), multiplex network
mapping, and of social embeddedness. Methodologically, it employs longitudinal
analyses of the growth and development of three dark networks in an attempt to observe
instances in which embeddedness may have facilitated structural efficiency or influenced
network activities.
For the purposes of this thesis, social embeddedness is defined as ties between a
dark network and bright entities within the surrounding society. Dark network efficiency
is inferred by measuring centralization, density, and average degree centrality.7 These
metrics were selected based on evidence that network density and centralization within
dark networks are correlated to organizational efficiency and on the assumption that there
is an inverse relationship between these measures and operational security.
By analyzing topographic network dynamics over time, this thesis determines that
embedding linkages play varied albeit significant roles in influencing dark network
efficiency and structure. In the course of analysis this research also illuminates sources of
7 Detailed descriptions and equations for the network measures used within this thesis are provided in
Chapter II of this thesis.

4
dark network resiliency. Analysis within the following chapters layers quantitative and
qualitative SNA techniques. Quantitative methods focus on changes in topographic
measures of dark network structure. Qualitative analysis explores the micro-level
relationships and processes at work within three empirical datasets using descriptive case
studies social network graphs and models of insurgent-population touch points.
B. RATIONALE
Dark networks are often highly embedded, maintaining ties to bright
organizations and individuals within the societies in which they operate. These ties may
be used to leverage both resources and legitimacy. Failure to fully understand the nature
of the relationship between social embeddedness and militant resiliency is likely to have
a negative impact on a security force’s capability to combat such networks effectively.
Different dark networks enjoy varying levels of support, cooperation, and resources from
their surrounding environments. This support would seem to have some effect on the
efficiency, resilience, and structure of these networks as well as their necessary levels of
covertness. At present, the precise nature of this effect remains unknown. Everton and
Cunningham point out that centralization and efficiency within dark networks are
positively correlated, whereas centralization and security are frequently negatively
correlated.8 However, dark networks that enjoy a greater degree of popular support
(embeddedness) may be able to increase their centralization without sacrificing their
security requirements. Thus, such organizations might be expected to operate with
relatively higher degrees of both efficiency and resilience.
Contemporary SNA research methodologies for evaluating dark networks focus
heavily on internal elements of network structure, typically using network boundary
conditions that preclude developing a picture of the network in the context of its
surrounding social environment. These methodologies measure dark network topography
independently from bright network entities, as depicted in Figure 1. Alternatively, those
researchers such as Morselli who have included links to bright actors/networks as part of
8 Sean F. Everton, and Dan Cunningham. “Terrorist network adaptation to a changing environment,”
in Crime and Networks, ed. Carlo Morselli (London, UK: Routledge 2013), 287–308.

5
their analysis have done so without testing the longitudinal effects of these connections
on the actual structure of the corresponding dark networks.9 This thesis expands the
understanding of the relationship between dark networks and their embeddedness by
focusing on the number and type of external ties to bright and shady entities.10 This
evaluation model is depicted in Figure 2.
Figure 1. Example of Internally Focused SNA Network Graph
This graph depicts prevailing social network analysis methodology: internally focused, emphasis on network structure and leadership “dark” nodes.
The Noordin Top terrorist network, Southeast Asian FFF networks, and the
Provincial Irish Republican Army (PIRA) are examples of resilient dark networks that
have achieved increased freedom of movement in conjunction with localized popular
support. Case selection is outlined in further detail in Chapter III. This thesis attempts to
9 Carlo Morselli, Inside Criminal Networks (2009), Chapter 5.
10 For the purpose of this thesis shady entities refer to individuals whose actions and affiliation do not meet the threshold for categorization as member of either a dark or bright network.

6
shed light on if this freedom of movement can be observed though changes in network
centralization and if these changes in internal structure correlate with changes in the
number and type of external ties (embeddedness).
Figure 2. Example of Embeddedness-Focused SNA Network Graph
Conceptual network graph depicting embeddedness focused methodology: focuses on the number and type of external ties to “bright” and “shady” entities.
C. LIMITATIONS
This thesis presents a networks approach to understanding the dynamic
relationship between dark organizations and their surrounding society. Although the tools
and methods applied within this thesis are well established, they are limited by the
availability of data and to the analytical constraints common to the methodologies
employed. This thesis acknowledges the complex nature of dark networks and that there
are likely a significant number of intervening considerations that affect organizational
efficiency and behavior within covert groups.
Although efforts have been made to ensure that the data used throughout this
report accurately reflect network membership and linkages, it is not possible to

7
independently validate the entirety of the networks depicted within this thesis. As such,
all networks depicted should be assumed to be incomplete samples of the larger
representative networks. This limitation is not unique to this analysis and is consistent
with limitations of other similar efforts to depict relationships within intentionally covert
organizations. In addition, it is necessary to acknowledge that centralization and density
are not necessarily ideal indicators of efficiency. Social science scholars such as Everton
have argued that optimal levels of centralization and density are mutually dependent and
subject to a variety of environmental and organizational factors.11 Milward and Raab,
and others have pointed out that increased centralization and density may also increase
security risks and operational tradeoffs.12 However, these considerations exceed the
scope of the analysis and are not specifically addressed within this thesis. This thesis does
attempt to mitigate potential issues arising from both of the above limitations by using
geographically and temporally diverse network samples as case studies. This sample
variation should at least partially moderate the effect of deviations in structure resultant
from incomplete data or deviations in security considerations.
D. THESIS OUTLINE
The research within this thesis is divided into seven chapters. The first three
chapters provide a theoretical and methodological background for the thesis. Chapter I
has provided a substantive research summary of the research. Chapter II offers a
foundational overview of the key theoretical concepts, and literature used throughout the
course of the research including SNA, SMT, multiplex network mapping, and
embeddedness. Chapter III provides a detailed discussion of the data and methods used in
aggregating and analyzing the information within this thesis.
Chapter IV outlines the origins and evolution of each network case study, thus
providing the historical context necessary for subsequent analysis. Chapter V provides a
correlational analysis of the relationship between External-Internal (E-I) index, network
11 Sean F. Everton, Disrupting Dark Networks, (New York: Cambridge University Press, 2012).
12 Brinton H. Milward, Jörg Raab, “Dark Networks as Organizational Problems: Elements of a Theory,” International Public Management Journal 9, no.3 ( 2006): 333–360.

8
topography, and network behavior for each of the three network cases throughout their
lifespans. Correlations are evaluated both individually and in aggregate and followed by a
summarized discussion of the findings. Chapter VI provides a set of descriptive case
study analyses. These analyses draw from historic reports on individual network
members and their interactions with surrounding societies to generate sociograms and
narrative examples of embedding processes. This work is be nested within the theoretic
constructs introduced in Chapter II by emphasizing the roles of microstructures and
relational ties in dark network mobilization.
Chapter VII compares the results of the chapters V and VI and provides a
discussion of the similarities and differences between the results of the two
complementary research methods. Additionally, Chapter VII describes the implications
of the aforementioned findings within the context of dark network disruption strategies,
intelligence collection and analysis, and future dark network research.

9
II. THEORETICAL FRAMEWORK
Doug McAdam suggests that “quantitative analysis can be used, as in the study of
social movements, to uncover certain recurrent empirical relationships, that can then be
interrogated more fully using systematic qualitative methods.”13 It is through a
combination of these two complementary methods that this thesis goes about applying
social network analysis SNA to the study of dark networks. This chapter is divided into
two sections that lay out the theories upon which the remainder of the thesis is built. The
first section introduces the theoretical paradigms that serve to inform the overall rationale
of the research and which provide the basis of both the descriptive and explanatory depth
within Chapter IV. The second section provides an overview of the measures used
prominently within Chapter V. The literature surveyed in this chapter provides an
introductory overview of the primary methods from each discipline that were applied in
the course of this research.
The foundation of the research is built using fundamental principles from SNA
enabled though multiplex network mapping, and social network change detection. These
principals are augmented using conceptual and theoretical elements from research on
SMT and embeddedness to build a novel methodology for analyzing dark networks.
A. QUANTITATIVE LITERATURE
SNA is an analytical method that uses relational ties between like entities
(sometimes referred to as “nodes” or “actors”) in conjunction with graph theory to
generate visual and mathematical representations of social networks. These
representations may be used to inform expectations of individual and network behavior.14
Sean Everton describes SNA as “a collection of theories and methods that assumes that
the behavior of actors (whether individuals, groups, or organizations) is profoundly
13 Doug McAdam, “Beyond Structural Analysis” in Social Movements and Networks: Relational
Approaches to Collective Action, eds. Mario Diani and Doug McAdam (New York: Oxford University Press, 2003).
14 Sean F. Everton, Disrupting Dark Networks, Chapter 1.

10
affected by their ties to others and the networks in which they are embedded.”15 This
thesis applies SNA methodologies to evaluate the ties which link these dark networks and
their surrounding societies and the effect those ties have on the internal network structure
of militant organizations. The SNA metrics used to evaluate this relationship are the E-I
index, network centralization, and network density (average degree centrality).16
1. Multiplex Network Mapping
Human social networks typically comprise multiple interdependent relationships,
kinship, trust, and communication. Multiplex network mapping is a process within SNA
for representing social network ties across multiple relation types in order to inform a
more robust understanding of network structure and behavior. Roger Gould’s analysis of
network mobilization in the Paris commune provides an example of the value of
multiplex mapping as a means of understanding network mobilization processes.17 In his
study, Gould evaluated the role of formal and informal networks in contributing towards
neighborhood solidarity. He found that preexisting social ties affected the organizational
behavior and cohesion of newly formed discrete networks. He also found that different
networks were interrelated to one another and contributed jointly to affecting
mobilization dynamics, thus validating the argument that the whole network must be
considered in order to understand the overlapping patterns.18 This thesis explores the
significance and implications of multiplex network ties within both the quantitative and
qualitative chapters in order to examine whether or not certain types of external
relationships are more predictive than others in informing structural change within
networks.
15 Sean F. Everton, Disrupting Dark Networks, 6.
16 Due to the inherent limitations of the density equation in providing objective measures for comparing networks of differing size, average degree centrality will be used as a stand-in metric for density to represent the provincial-cosmopolitan dimension of the networks. These limitations, as well as a description of provincial cosmopolitan aspects of networks, are discussed in detail later in this chapter.
17 Roger V. Gould, “Multiple Networks and Mobilization in the Paris Commune, 1871,” 716-729.
18 Ibid., 727.

11
2. Social Network Topography and Change Detection
Within the context of SNA, network topography refers to the macro level
measurements that characterize the structure of the network. The most basic topographic
measure is size, which simply refers to the number of nodes within a given network.
Other commonly used measurements like centralization and density attempt to
characterize the network in terms of how the nodes within a network connect to one
another. These measures and others are defined in further detail in subsequent sections
within this chapter. Social network change detection (SNCD) is essentially the process of
analyzing changes in network topography over time in order to identify potentially
significant changes within the network that may be indicative of important events.19
Multiple scholars have demonstrated the potential value of this methodology in
combatting terrorist organizations.20 This thesis employs SNCD as a means to conduct a
statistical analysis of the relationship between the topographic measures of E-I Index,
network centralization, network density and average degree centrality.
3. E-I Index
The E-I index developed by David Krackhardt describes the structural
connectedness of a network by calculating the ratio of ties within a network to those
outside of the network. Within this thesis, the E-I index is used to measure the degree in
which network linkages connect covert elements of dark networks with their surrounding
societies.21 Mathematically the E-I index of a network is expressed as:
E-I = (EL - IL) / (EL + IL)
19 Sean F. Everton & Dan Cunningham “Detecting Significant Changes in Dark Networks,”
Behavioral Sciences of Terrorism and Political Aggression 5, no.2 (2013): 94–114.
20 Ibid. McCulloh, Ian, and Kathleen M. Carley. “Detecting Change in Longitudinal Social Networks.” Military Academy West Point NY Network Science Center (NSC), 2011. Sean F. Everton, and Dan Cunningham. “Dark Network Resilience in a Hostile Environment: Optimizing Centralization and Density.” Criminology, Criminal Justice, Law and Society 16, no. 1 (2015): 1–20.
21 A detailed description of E-I index coding methodologies used within this thesis is provided in the methods chapter of this thesis (Chapter III).

12
where “EI is the E-I index of the organization, EL is the number of external links, across
divisions, and IL is the number of internal links, which does not cross divisions.”22 This
formula is useful in establishing the relative distribution of external and internal ties
within a network. The E-I index can be calculated and applied at the network, group, or
individual node level. This thesis primarily uses group E-I index as a measure of
organizational embeddedness of the dark network segment. Group level embeddedness
was selected in order to prevent high or low levels bright segment intra connectivity from
artificially skewing E-I values.
There are some limitations to using E-I index as a means of comparing the
embeddedness of network datasets of varying size as large organizations invariably
receive lower E-I ratings than small organizations with equivalent ties. As Robert
Hanneman and Mark Riddle note, “the relative sizes of sub-populations have dramatic
consequences for the degree of internal and external contacts, even when individuals may
choose contacts at random.”23 For the purpose of this thesis, these aforementioned
limitations are partially mitigated by the fact that all three of the networks being
evaluated are of similar size and that within each network the size of the potential bright
subpopulation is largely unrestricted. Additionally, this thesis attempts to mitigate this
deficit by combining the E-I index with a qualitative analysis of external ties informed by
principals of SMT.
4. Centralization
Network centralization is a topographic measure that describes the hierarchical
structure of a network. Centralized networks manifest in instances where node linkages
are distributed in a highly stratified fashion and in which a small number of nodes are
significantly more connected than the least connected nodes. Such networks are described
as being “scale free.” Albert Barabási and Eric Boneabeau describe scale free networks as
those in which a few nodes have a large number of connections. Scale free networks
22 David, Krackhardt, “Graph Theoretical Dimensions of Informal Organizations.” Computational
Organization Theory 89, no. 112 (1994): 129.
23 Hanneman, Robert A., and Mark Riddle. Introduction to social network methods, (Riverside, CA: University of California Riverside, 2005): 96.

13
differ from fully random networks, which are decentralized with nodal connections which
follow a normal distribution.24 Wasserman, Stanley and Faust give the expression for
centralization as:
[ max ( )]max [ max ( )]
i
i
C C nC
C C n−
=−
∑∑
where Cmax equals the largest centrality score for all actors and ( )iC n is the centrality
score for actor in , and max [ max ( )iC C n−∑ is the theoretical maximum possible sum of
differences in actor centrality. In other words, network centralization is the ratio of the
actual sum of differences in actor centrality over the theoretical maximum, yielding (like
density) a score somewhere between 0.0 and 1.0.25
This thesis uses changes in dark network centralization to attempt to track a
network’s tendency towards efficiency over robustness over time. Generally speaking,
centralization improves dark network efficiency26 but may also result in reduced
robsutness/resilience. Mark Sageman describes network robustness in terms of a
network’s ability to continue to operate after losing individual members.27 He states that
where hierarchical networks are vulnerable to decapitation,28 distributed small-world
network structures are relatively resiliant in the face of random node removal but are
susceptible to coordinated simultaneous attacks against hubs.29 Sageman also writes that
hubs (a dominant feature of centralized networks) are vulnerable to discovery and
24 Albert-Laszlo Barabási and Eric Bonabeau, “Scale Free Networks” Scientific American, 288, no. 5
(May 2003): 53.
25 Wasserman, Stanley, and Katherine Faust. Social Network Analysis: Methods and applications, (Cambridge, UK: Cambridge University Press, 1994), Chapter 5.
26 Everton and Cunningham have found evidence to support the argument that dark networks may increase their centralization prior to execution of attacks (Everton, Sean F., and Dan Cunningham. “Dark Network Resilience in a Hostile Environment: Optimizing Centralization and Density,” 1–20.
27 Marc Sageman, Understanding Terror Networks, (Philadelphia: University of Pennsylvania Press, 2009), 140–141.
28 Decapitation described here refers to network disruption through the targeted removal of leadership nodes.
29 Network hubs are highly connected nodes within a network. See Marc Sageman, Understanding Terror Networks, 140–141.

14
recommends them as targets for intelligence collection and law enforcement disruption
efforts.30 Figure 3 depicts examples of idealized small world and scale free networks.
Figure 3. Example of Small World and Scale-Free Network Graphs
Example graphs depicting “small world” (left) and “scale-free” (right) networks.
5. Density and Average Degree
Network density and average degree centrality measure the provincial-
cosmopolitan dimension of social networks. Conceptually, provincial networks are dense
networks comprised primarily of strong ties whereas cosmopolitan networks are
comprised of sparse or weak ties.31 Network density describes the number of actual ties
within a network compared to the total number of possible ties. Like small world
networks, networks with dense structures and those with high average degree centrality
(described in the following paragraphs) are relatively resistant to random failure and
allow for expedient communication. It is for these reasons that this thesis uses these two
measures as proxies for describing efficiency.
30 Marc Sageman, Understanding Terror Networks, 140–141.
31 Sean F. Everton, “Network Topography, Key Players and Terrorist Networks,” Connections 1, no. 32 (June 2012): 12–19.

15
In an undirected network density is expressed as:
*( 1)2
td n n=−
where t equals the number of ties within a network and n equals the number of nodes
within the same network. This metric has a possible value ranging from 0.0 to 1.0.
Everton points out that network density is a contributing factor towards network
efficiency.32
The density metric presents limitations similar to the E-I index when comparing
networks of different sizes. In this case, as networks increase in size linearly the number
of possible links in the network increases exponentially. Because the number of actual
network ties does not typically increase exponentially with the addition of new members
and because network members will themselves reach some upward limit on their number
of practical ties the density metric disproportionately punishes large networks in its
calculation of provinciality. To overcome this limitation this thesis estimates density
using average degree centrality, which is calculated as the average number of ties of a
node within a given network:
/D t n= where t equals the total number of ties within a network and n equals the number of
nodes within the same network. Unlike density, average degree centrality scores are not
sensitive to network size and are frequently used as a substitute measurement for density
when comparing networks of different dimensions.
Although maintaining a dark network with dense ties has some advantages, it also
generates a number of vulnerabilities. While dense networks are likely to be resilient to
attack they are also more vulnerable to detection and to exploitation though intelligence
collection or infiltration. The arrest or capture of individual network members is less
likely to lead to immediate network collapse but is more likely to lead to the
apprehending of remaining network participants. As a result of this inherent security
tradeoff, it follows that provincial networks require countervailing environmental or
32 Sean F. Everton, Disrupting Dark Networks, 2012.

16
operational incentives in order to make increased density an attractive strategy. Everton
and others have described the delicate balance between efficiency and security in detail.33
B. QUALITATIVE LITERATURE
Social network scholars tend to employ one of three models for approaching the
study of human interaction. These models are structural determinism, instrumentalism,
and constructionism. According to Mustafa Emirbayer and Jeff Goodwin structural
determinism “features a succession of network ‘snapshots’ of social structure, while
negating altogether the potential causal significance of symbolic and discursive
formations and offering few insights into the concrete historical mechanisms leading
from one such network configuration to another.”34 Structural determinism downplays
the role played by human agency and disregards the impact of individual actors and
evolving cultural considerations in shaping social processes and actions.35
Structural instrumentalism addresses the importance of “social action” without
particular focus on an actor’s identity.36 This approach ascribes actors’ decisions to
“rational choice instrumental action and utility maximization.”37 Instrumentalism offers
an improvement over the structuralist approach in terms of acknowledging the role of
agency but continues to overlook the full range of potential variables that influence
individual behavior.
Structural constructionism builds upon instrumentalism by attempting to take into
consideration both structural considerations as well as rational choice by acknowledging
“that [an] actor’s goals and aspirations might very well be complex, multivalent, and
33 Sean F. Everton and Dan Cunningham, “Dark Network Resilience in a Hostile Environment:
Optimizing Centralization and Density,” Criminology, Criminal Justice Law, & Society, 16, no.1 (2015), 1–20; Carlo Morselli, Inside Criminal Networks. (New York: Springer, 2009): Chapter 4.
34 Mustafa Emirbayer and Jeff Goodwin, “Network Analysis, Culture and the Problem of Agency,” American Journal of Sociology Vol. 99, No. 6 (May 1994): 1436.
35 Ibid
36 Ibid.
37 Sean F. Everton, Disrupting Dark Networks, (2012), 29.

17
historically determined.”38 The structural constructionist model expands the scope of
agency as introduced by instrumentalism by taking into account factors like social norms
and culture, or in the case of this thesis, embeddedness.
Analysis within the following chapters applies the constructionist model by
augmenting the structurally based outputs from quantitative SNA with descriptions of
actor attributes and behavior. To this end this thesis operationalizes conceptual elements
from Gould’s work as described in Section one,39 as well as the work of Granovetter on
embeddedness40 and the work of McAdam41 (and others) on recruitment and
mobilization. It layers quantitative data pertaining to preexisting multiplex relationships
between dark and bright networks over topographic metrics of dark network structure and
individual node level case studies to aid in understanding the intervening relationships
within each of the three datasets.
1. SMT: Microstructures and Relational Ties in Mobilization
SMT is a body of knowledge that seeks to address the underlying factors of
mobilization in social movements. Modern SMT as pioneered by Doug McAdam
presents a multilevel perspective on the role of network structure and resources. Within
the context of this thesis, SMT provides depth toward understanding the reasons and
ways networks shift that cannot adequately be explained through mathematical analysis
alone.
Social movement theorists have repeatedly demonstrated the importance of
microstructures in social mobilization. Doug McAdam’s study of “freedom summer”
participants found that the strongest predictors of participation in high-risk activism were
the number and strength of ties to other applicants. Applicants with more ties or with
38 Mustafa Emirbayer and Jeff Goodwin, “Network Analysis, Culture and the Problem of Agency,”
1436.
39 Roger V. Gould, “Multiple Networks and Mobilization in the Paris Commune, 1871,” American Sociological Review 56, No. 6 (December 1991): 716–729.
40 Mark Granovetter, “Economic Action and Social Structure: The Problem of Embeddedness,” American Journal of Sociology 91, no. 3 (November 1985): 481–510.
41 Doug McAdam, “High-Risk Activism: The Case of Freedom Summer,” American Journal of Sociology 92, no. 1 (July, 1986): 64–90.

18
strong ties to other participating applicants were more likely to participate themselves.
McAdam also found that a second important predictor was the number and type of pre-
existing ties to organizations. Individuals were found to be more susceptible to
recruitment to activism, the more organizations they belonged to. Ties to activist
organizations provided an even stronger predictor of recruitability.42 David Snow, Louis
Zurcher, and Sheldon Ekland Olson’s study on differential recruitment to social
movements produced complementary findings.43 Their results point to the importance of
interpersonal and kinship ties between movement members and the surrounding social
milieu in determining recruitment potential. Both findings are germane to understanding
the dark network case studies surveyed within this thesis since all three networks
incorporated elements from both high-risk activism and recruitment.
2. Embeddedness
Mark Granovetter popularized the concept of embeddedness as a sociological
approach to understanding the effects of institutional relationships on economic action.
He describes social embeddedness as “the extent to which economic action is embedded
in structures of social relations, in modern industrial society.”44 Granovetter proposes
that an organization’s actions are both enabled and constrained by relationships45 and
that these relationships impact both institutional interests and behavior.46 There are
various ways in which a dark network can attempt to increase their embeddedness within
a society. Prior to the Sunni awakening, Al Qaeda in Iraq (AQI) leveraged the
embeddedness of associated tribal leaders to coopt the preexisting authority networks in
42 McAdam Doug, “High-Risk Activism: The Case of Freedom Summer.”
43 David A. Snow., Louis A. Zurcher Jr., and Sheldon Ekland-Olson. “Social Networks and Social Movements: A Microstructural Approach to Differential Recruitment.” American Sociological Review 45, no. 5 (1980): 787–801.
44 Mark Granovetter, “Economic Action and Social Structure: The Problem of Embeddedness,” 481.
45 Embeddedness enables actions by reducing market objectivity normally associated with (in this case economic) interactions. Embeddedness constrains actions by reducing opportunism defined by Granovetter as “the rational pursuit by economic actors of their own advantage, with all means at their command, including guile and deceit.” Mark Granovetter, Economic Action and Social Structure: The Problem of Embeddedness, 494.
46 Mark Granovetter, “Economic Action and Social Structure: The Problem of Embeddedness,” 481–510.

19
order to embed their organization within Sunni society.47 As the U.S. forces increased
trust, financial, and political relationships with the Sunni tribesmen, embedded support to
AQI diminished and switched to security forces.48 Alexus Grynkewich provides an
illustrative example of how “violent non-state groups” increase social embeddedness
through manipulation of the social contract by providing social services within their host
societies.49 This thesis analyzes how dark network embeddedness enables movement
toward increased structural efficiency and how it constrains violent activity.
47 John A. McCary, “The Anbar Awakening: an Alliance of Incentives,” The Washington Quarterly
32:1 (2009) , 43–59, DOI: 10.1080/01636600802544905.
48 Ibid.
49 Alexus G. Grynkewich, “Welfare as Warfare: How Violent Non-state Groups Use Social Services to Attack the State.” Studies in Conflict & Terrorism 31, no. 4 (2008): 350–370.

20
THIS PAGE INTENTIONALLY LEFT BLANK

21
III. CASE SELECTION AND METHODOLOGY
This chapter provides an introduction to the empirical cases and methods used in
chapters IV and V. This chapter is divided into three sections. The first describes the data
coding and ontological categories used. The second introduces the three network case
studies and describes the case selection criteria and content and the third details the
thesis’s research design.
This thesis used empirical case studies of dark networks drawn from a broad
range of secondary sources to describe and investigate historically significant examples
of Dark network behavior and development. The selected empirical cases included a
Southeast Asian Foreign Fighter facilitation (FFF) network, the Noordin Top terrorist
network, and the Provincial Irish Republican Army (PIRA). Cases were subjected to a
mixed methods analysis incorporating elements of social network analysis (SNA) and
SMT in order to thoroughly examine the effect of socially embedded relationships on
dark network structure and behavior. Structural elements evaluated within this thesis
include network density, average degree centrality, centralization, and the E-I index.
Behavioral elements evaluated include violent attacks in the case of the Noordin and
PIRA networks and network growth in the case of the Southeast Asian FFF network.
A. DATA CODING
Across all categories of linkages, bright links/nodes are only included as part of
the analysis when there is also evidence that the relationship contributed in some way
directly or indirectly to a dark network’s ability to achieve its objectives. This boundary
restriction ensures that the resultant analysis does not result in a collection of spurious
tangential links.
Networks were mapped with actors categorized as bright, dark, or shady. This
thesis defines entities in the same manner as Milward and Raab describe dark networks,
understanding “dark” to refer to illegal or covert organizations or individuals.50 Entities
50 Brinton H. Milward, and Jörg Raab, “Dark Networks as Problems,” Journal of Public
Administration Research and Theory 13, no.4 (2003): 413–439.

22
are categorized as dark based on the criteria that the organization itself is illegal or
outlawed within its area of operation, the majority of the organization’s operations are
dedicated towards facilitating illegal activity, and that the organization conducts the
majority of its operations in a covert fashion.
Entities that meet all of these criteria are classified as dark. Those that do not meet
any of the above criteria are classified as bright. Those that meet some but not all of the
criteria are classified as “shady.” In cases where the category of organization changes
over time groups are classified based on the status during the interval of evaluation when
practicable.
B. CASE SELECTION AND DATA DESCRIPTIONS
The dark networks case studies chosen for evaluation within this report were
selected based on length of network existence, the presence of environmental
contestedness51 and availability of data. All three networks have operated for ten or more
years thus allowing for sufficient temporal variation to support a meaningful longitudinal
analysis.52 Each of these networks has been deliberately contested throughout their
existence by internal or external security forces; contestedness is important to consider as
it tends to affect network structure and have been found to correlate with decreased
network density and centralization.53 The specific effects of contestedness are not
considered due to the difficulty involved in consistently measuring for or normalizing
contestation across the three datasets. Additionally, all three networks have sufficient
relational data for observing linkages between dark network entities and the surrounding
society to support an in depth SNA. This thesis selected the PIRA network in part to
introduce some measure of geographic, ideological, and ethnic network diversity into the
study.
51 Environmental contestedness will be defined as the degree to which a dark network’s operational freedom is challenged by another organization (i.e., local or foreign governments, or competing networks).
52 This thesis focuses primarily on the analysis of persistent dark networks. Temporary ad-hoc networks formed specifically for executing individual attacks abroad were not considered as candidates for analysis. Such networks are likely to be isolated from the surrounding population and may have unique operational requirements and be less reliant on external support.
53 Sean F. Everton, and Dan Cunningham. “Terrorist Network Adaptation to a Changing Environment,” 287–308.

23
1. Southeast Asian FFF Network
The Southeast Asian FFF Network dataset is a one-mode network containing 281
nodes. This dataset includes 36 observation intervals. It encompasses the longest period
of time spanning 36 years. This dataset is original to this research and was derived from
multiple sources. Historic data was aggregated through the extraction and expansion of
relational data from articles published by the International Crisis Group (ICG).54
Additional background information and further relational data was drawn from the
International Centre for Political Violence and Terrorism Research (ICPVTR) database,
academic articles, books, and open source documents. Members coded as dark members
included, any individual or group that directly fought in a foreign or domestic insurgency,
or has been classified as a terrorist organization.
2. Noordin Top Terrorist Network
The Noordin Top Terrorist network dataset comprises 237 unique nodes.
Longitudinally this dataset includes 121 observation periods spanning the 10 years in
which the group was active. The Noordin Top dataset was compiled by Nancy Roberts,
Sean Everton, and Daniel Cunningham. The dataset is based largely on two International
Crisis Group Reports: “Terrorism in Indonesia: Noordin’s Networks” (International
Crisis Group, 2006) and “Indonesia: Noordin Top’s Support Base” (International Crisis
Group, 2009). Due to some geographical, temporal, and organizational overlap, the
Noordin Top Terrorist network will share some structural and membership elements with
the Southeast Asian FFF network. Dark members are individuals whose role within the
network included bomb maker, bomber, fighter, leader, suicide bomber, or those whose
logistical function involved the transportation of weapons.
54 ICG articles used include- “Indonesia Backgrounder: How the Jemaah Islamiyah Terrorist network
Operates,” Asia Report no 43, “Indonesia: Jemaah Islamiyah’s Publishing Industry,” Asia Report no. 147, “Indonesia: Jihadi Surprise in Aceh,” Asia Report no. 189, “How Indonesian Extremists Regroup,” Asia Report no. 228, “Indonesia: The Dark Side of Jama’ah Ansharut Tauhid (JAT),” Asia Briefing no. 107, “Indonesia: From Vigilantism to Terrorism in Cirebon” Asia Briefing no. 132.

24
3. PIRA Network
The PIRA dataset provides a dark network case study that is geographically,
culturally, and ideologically distinct from the previous two networks. It encompasses
nearly 30 years: 1970–1998. The data set comprises 1,113 unique nodes and recorded
during six observation periods. This dataset does not include isolates and the identity of
individual network members has been anonymized. The network includes four types of
relationships between members: (1) those who committed an act together within the
movement, (2) those who were friends prior to joining the movement, (3) blood relatives,
and (4) those related by marriage. The data used in this analysis was originally collected,
aggregated, and analyzed by Paul Gill, Jeongyoon Lee, Karl R. Rethemeyer, John
Horgan, and Victor Asal at the International Center for the Study of Terrorism,
Pennsylvania State University.55 In this thesis, agents within the dataset are broken into
groups based on their activities within the network. Dark members are any of those who
participated in violent or illicit activities such as robbery, kidnapping, improvised
explosive device (IED) construction, bombings, or shootings and assassinations. Bright
members are individuals who have not been associated with any of the aforementioned
violent activities.
C. RESEARCH DESIGN
This thesis applies complementary descriptive case study observations of
individual network members and their interactions with surrounding societies and
correlational analysis to examine the relationships between social embeddedness, dark
network organizational behavior, and structural efficiency. Each analytical method is
contained within its own chapter. The quantitative chapter evaluates if the hypothesized
relationships between social embeddedness and structural efficiency are observable using
topographic SNA measures. The qualitative chapter is primarily exploratory. Its purpose
is to provide a depth to the results of the quantitative analysis by painting a robust picture
of the intersecting roles of meta-network structure, exogenous influences and human
agency, which cannot be fully captured though quantitative approaches alone.
55 Ibid., 60.

25
1. Quantitative Methods
The foundation of the analysis in Chapter IV is based on longitudinal metric
descriptions of network snapshots. Throughout this chapter, embeddedness is used as the
independent variable and measures of network efficiency (density, centralization, average
degree centrality) are used as separate dependent variables. Analysis measures variations
within embeddedness, and centralization and average degree centrality for each network
snapshot. These values are then used to calculate the covariance and coefficient of
correlation between these two variable sets.
a. Measuring Embeddedness
Embeddedness of dark networks are be measured as a function of the number and
quality of crosscutting domain ties connecting nodes within a given dark network to its
host society. Relative embeddedness is assessed as high in instances where the
surrounding society has a high number of ties to the network or where the network has a
high number of ties to elements within society. Nodes are considered part of a dark
network if they self-identify as members or if they are known to occupy leadership
positions directly and perform operational tasks within the organization. All other
affiliated nodes are measured as elements of the surrounding society.
Quantitatively, network embeddedness is inferred from E-I index values
calculated based on links between entity categories. Internal (dark) network ties are
characterized by links between nodes directly related to planning, executing, or
supporting covert activity. In turn, links between internal network entities and external
(bright and shady entities) are used in calculating values for external ties. External ties
are characterized by facilitation linkages such as funding, promoting, or recruiting for
illegal activity. All linkages between entities are coded based on type of embedded tie.
Final analysis uses multivariate regression to examine the degree to which different types
of social embeddedness have observable impacts on network structure.

26
b. Estimating Network Efficiency
Network efficiency for each time period snapshot is inferred from measurements
of centralization and average degree centrality. Network observations with higher levels
of centralization and interconnectedness are assessed to be relatively more efficient than
those with lower levels. Calculations of these measures are derived using standard the
SNA techniques described in Chapter II after first identifying and then removing external
nodes. The removal of external nodes prior to calculating topographical metrics for
efficiency reduces the autocorrelation between the observed variables and produces
resultant values that more accurately reflect changes in the structure of dark segments of
the network.
c. Estimating Statistical Significance
The statistical significance of the relationship between embeddedness and
efficiency is estimated using a parametric model (Pearson’s product-moment
correlation).56 In order to address potential concerns related to type one errors and
autocorrelation between the evaluated topographic measures, case study correlations
between E-I index and the dependent variables of centralization, density, and average
degree centrality are compared to p-values, confidence intervals, and sample estimates
from simulated permutations of the empirical network. The difference in the empirical
results and those of the simulated networks provide indicators of the statistical
significance of the relationships tested, independent of artifacts resultant from
autocorrelation.
d. Network Permutations
In addition to traditional methods of statistical analysis introduced previously, this
thesis introduces a novel quantitative methodology by augmenting empirical observations
with simulated network data. Simulated networks used in in this thesis were generated
using a set of purpose-built algorithms. In total, the algorithm read-in the empirical
56 This model was selected based on the dominantly normal distribution of values observed in order to
provide consistency among analyses. A minority of measures surveyed manifested with a multimodal or skewed distributions these exceptions are identified as they occur.

27
network data, sampled node labels, edges, and attributes (used to calculate E-I index)
from all observation period within the empirically observed networks; these sample
variables were then permuted 5,000 times each using the Monte Carlo Method. The end
result is a set of 5,000 row arrays (one for each network observation). Each network array
was then measured for E-I index, average degree, centralization and density. The use of
simulated networks in this thesis offers a unique objective baseline from which to
evaluate observations of the empirical data. This baseline attempts to allow for a more
objective interpretation of the empirical network measures both independently and in
terms of correlation with other measures.
2. Qualitative Methods
Chapter V uses descriptive vignettes and social network graphs to examine the
development of individual mobilization, embedding processes, and bright network
connections through the lens of social movement theory.57 Conclusions from this section
exploratory section are then nested with activity analysis, which evaluates fluctuations in
different types of organizational behavior. Activity analysis of the Noordin Top and
PIRA networks examines volume and variety of violent attacks conducted within the
networks domestic area of operations. This analysis within this section serves to provide
a supporting contextual background to the statistically driven quantitative chapter.
57 Network graphs used within qualitative and quantitative chapters will be depicted using the “spring
embedded” layout unless otherwise specified.

28
THIS PAGE INTENTIONALLY LEFT BLANK

29
IV. NETWORK BACKGROUNDS
This chapter provides descriptions of each of the three network cases: The
Southeast Asian Foreign Fighter Facilitation (FFF) Network, the Noordin Top terrorist
network, and the Provisional Irish Republican Army (PIRA). The objective of this
chapter is to provide the necessary background on the origins and evolution of each
network case study to allow for an understanding of the analysis in Chapter V and
Chapter VI of this thesis. This chapter is divided into three sections, each focused on a
single empirical network case.
1. Southeast Asian FFF Network
The Southeast Asian FFF Network is an informal covert network of individuals
and organizations that have participated in the recruitment, training, funding and manning
of jihadists organizations within Afghanistan, Iraq, Syria, and various countries within
the Southeast Asian region. This network initially emerged in the 1980s in response to
the Soviet occupation of Afghanistan, during which time it provided fighters in support of
the Al Qaeda predecessor Maktab al Khidamat (MAK).58 The Southeast Asian FFF
network has since continued to provide support and training to jihadists both locally and
abroad. The network has enjoyed support from a diverse array of entities including
fundamentalist religious schools, political activist organizations, and terrorist
organizations. Network membership spans the majority of Southeast Asia and is
concentrated within Indonesia, Malaysia, and the Southern Philippines.
The presence of Islamic foreign fighters is not unique to jihadi movements or to
Southeast Asia. It is however, a relatively modern development. Thomas Hegghammer,59
defines a foreign fighter as “an agent who (1) has joined, and operates within the
confines of, an insurgency, (2) lacks citizenship of the conflict state or kinship links to its
58 Maktab al Khidamat was formed as a charity front to support bin Laden’s fight against the Soviet Union in Afghanistan. It had ties to the Pakistani government through its state security services and has been inactive since 1984 (Terrorism Resource Analysis Consortium, http://www.trackingterrorism.org/group/maktab-al-khidamat-mak).
59 Thomas Hegghammer is the director of terrorism research, at the Norwegian Defense Research Establishment.

30
warring factions, (3) lacks affiliation to an official military organization, and (4) is
unpaid.”60 According to Hegghammer, foreign fighters first appeared in significant
numbers in 1967 during the Arab Israeli War but did not become wide spread until the
1980s. The first major instance of Southeast Asian foreign fighters was during the
Afghan Soviet war between 1978 and 1992. According to Hegghammer, this conflict
drew foreign fighters from throughout the Arab world, as well as from Pakistan,
Bangladesh, Indonesia, Philippines, the United States, and Europe. Although reports
vary on the total number of Southeast Asian Mujahedeen that traveled to Afghanistan the
total number of Southeast Asian fighters likely numbered over 1,000. Maria Ressa writes
that Moro Islamic Liberation Front (MILF) founder Hashim Salamat provided over 600
foreign fighters to the MAK-led Afghan resistance in 1980 alone.61
The Southeast Asian FFF phenomenon appears rooted in the Afghan mujahedeen
experience. Across the region there are numerous examples of veteran mujahedeen who
returned from Afghanistan not only with their experiences, but with networks and with a
new brand of Wahhabi fundamentalism. Prior to the influx of returning foreign fighters
Southeast Asian insurgent networks were not very interconnected and focused primarily
on domestic issues driven more by ethno-nationalist than Salafist agendas. Major pre-
MAK insurgent Islamist groups were limited to the Moro National Liberation Front
60 Thomas Hegghammer, “The Rise of Muslim Foreign Fighters: Islam and the Globalization of
Jihad.” International Security 35, no. 3 (2010): 58.
61 Ressa, Maria. Seeds of terror: An eyewitness account of Al-Qaeda’s newest center of operations in Southeast Asia, (New York: Free Press, 2003), 126.

31
(MILF) in the Philippines,62 The Wae Ka Rae (WKR) in Thailand,63 and the associated
movements of Darul Islam (DI)64 and Dewan Dakwah Islamiyah Indonesia (DDII).65
The impact of the mujahedeen experience on radicalization had broad
implications throughout Southeast Asia. Solaiman Santo notes that “all of Jemaah
Islamiyah’s (JI) top leaders and many of its bombers trained in mujahedeen (Islamic
warrior) camps in Afghanistan from 1985 to 1995.”66 The networks and relationships
established as a result of Afghani mujahedeen may have been one of the most significant
contributors to the emergence of regional violent extremism in Southeast Asia, significant
in that they opened the door for training and lead to habitual relationships as well as the
sharing of resources and TTPs. These newly developed ties lead to mutual support, even
in instances where ideology and objectives differed significantly between groups. For
example, the MILF (who retained a primarily domestic agenda) maintained a tactical
alliance with Al Qaeda through Mohammed Jamal Khalifa (Usama Bin Laden’s brother
in law.) In fact, without the MAK mujahedeen connection, it is possible that Al Qaeda
might not have established a presence in the Philippines.
Global FFF continued during the Bosnian War, and the U.S. led occupation of
Iraq and Afghanistan. Specific figures on the number of Southeast Asians who
62 The MILF is a Filipino Islamist group that advocated for secession from the Philippines since its
inception in 1978. Over the years the organization has come in and out of political legitimacy and has used violence in pursuit of its objectives. (Mapping Militant Organizations/Stanford University, http://web.stanford.edu/group/mappingmilitants/cgi-bin/groups/view/309).
63 WKR is a Thai criminal organization that is thought to have some ties to JI and al-Qaeda (Zachary Abuza, “Al Qaeda Comes to Southeast Asia,” in Terrorism and Violence in Southeast Asia: Transnational Challenges to States and Regional Stability, ed. Paul J. Smith, (New York: Routledge, September 2004), 50.
64 Darul Islam was founded by Sekarmadji Kartosoewirjo in 1949. It is considered to be the inspiration for all violent and non-violent groups who seek an Islamic state in Southeast Asia and has spawned groups like, Jemaah Islamiyah and Ring Banten (International Crisis Group, http://www.crisisgroup.org/en/regions/asia/south-east-asia/indonesia/op-eds/jones-darul-islams-ongoing-appeal.aspx).
65 DDII, aka Indonesian Islamic Propagation Council, was founded by Agus Dwikarna. DDII was the founding organization for KOMPAK (Zachary Abuza, Militant Islam in Southeast Asia: Crucible of Terror, (Boulder CO: Lynne Rienner Publishers, 2003), 147).
66 Soliman M. Santos, Jr. and Paz Verdades M. Santos “Jemaah Islamiyah (JI) and Other Indonesian/Malaysian Jihadi Groups,” in Primed and Purposeful: Armed Groups and Human Security Efforts in the Philippines.” ed. Diana Rodriguez, Small Arms Survey Graduate Institute of International and Development Studies, (Geneva, Switzerland, 2010), 408.

32
participated in these conflicts is sparse but research indicates that Southeast Asian FFF
support was extremely limited compared to the Soviet Afghan occupation.67 During this
period members of the FFF network assumed a Southeast Asian regional focus signified
by regional transnational terrorist attacks and insurgent activity.68
Following the U.S. withdrawal from Iraq in 2010, Southeast Asian extremist
organizations began to evolve. In the middle of 2010, one of the main training camps for
fighters in Southeast Asia was broken up in Aceh. Prior to this, training was conducted in
mass hosted by one or more jihadi groups. Members from multiple organizations used
these training camps to disseminate paramilitary and theological instruction. Local imams
were invited to teach regardless of their affiliation with extremist organizations.
Following the 2010 raid, Aceh escapees began to spread their ideology while hiding with
unaffiliated sympathizers, expanding a network of grassroots based ideological hubs.69
This reflects what appears to be a trend of individuals promoting jihad without any
official organizational affiliation.70
A second major adjustment in the way the Southeast Asian FFF network operated
was in how they obtained and distribute printed recruiting material. While there is a
history of digital and print propaganda among jihadi groups—ISIL publishes Dabiq
magazine and Al Qaeda published a magazine called Inspire—extremist publishing in
Southeast Asia may be unique. The Southeast Asian FFF network tends to copy jihadi
materials from the Middle East, using a network of locally incarcerated extremists to
translate the works. Once translated, they are then published in Malaysia, Indonesia, and
the Philippines through a network of sympathetic publishing companies.71 This process
requires the dropping off and picking up of documents from prisons, apparently with the
67 Christopher Jasparro, “Geographic Perspectives on the Sociocultural, Economic, and Demographic
Aspects of Counterterrorism,” in Essentials of Counterterrorism ed. James J. F. Forest (Santa Barbara, CA, ABC-CLIO Incorporated, 2015), 53–61.
68 Christopher Jasparro, “Geographic Perspectives on the Sociocultural, Economic, and Demographic Aspects of Counterterrorism,” 60–61.
69 “Indonesia: How Indonesian Extremists Regroup,” ICG Asia Report 228 (July 2012).
70 Relational data from the Southeast Asian FFF dataset supports the notion that several individuals attending training camps in Poso after 2010 were unaffiliated.
71 “Indonesia: Jemaah Islamiyah’s Publishing Industry,” ICG Asia Report no. 147, 28 February 2008.

33
complete knowledge of government/prison officials. While the publishing companies are
not directly tied to JI, the “school and family ties of leading publishers bridge factional
and organizational divisions.”72 Throughout the evolution of Southeast Asia’s FFF
networks, bright individuals, and legitimate businesses and sociopolitical organizations
often played critical roles as silent partners in jihad.
2. Noordin Top Terrorist Network
The Noordin Top network was an Indonesia-based Salafi jihadist organization
with ties to Al Qaeda in Southeast Asia. It was active in Southeast Asia between the years
2000 and 2010 lead by Noordin Mohamed Top. The group began as a JI splinter group
and gained infamy in 2003 following a high profile bomb attack on the JW Marriot Hotel
in Jakarta, Indonesia, and became defunct following Noordin Top’s death in 2009.73 At
its peak the Noordin Top network was able to secure the support from the surrounding
population oftentimes though previously established ties to members of JI from a broad
network of returned Afghan veterans, and from a dispersed network of religious boarding
schools referred to in the regional parlance as pondoks or pesantren.74
According to the International Crisis Group, Noordin saw himself as the head of
JI’s military wing and claimed to be the head of Al Qaeda in the Malay Archipelago.75
Noordin’s introduction to the jihadi sphere was through his attendance at the Lukmanul
Hakim pesantren in Malaysia.76 Under the mentorship of Muklahs, one of the JI leaders
responsible for the first Bali bombings (hereafter referred to as Bali I), Noordin
72 Ibid., 13.
73 Jemaah Islamiyah is an Islamic activist group and one of Southeast Asia’s largest jihadist organizations. During the period in which Noordin’s network was active JI leaders disagreed on whether to provide support to Noordin’s Activities. (International Crisis Group, “Terror in Indonesia: Noordin’s Networks”).
74 International Crisis Group, “Terror in Indonesia: Noordin’s Networks.”
75 Ibid., 1.
76 The Lukmanul pesantren was essentially a Malaysian clone of the Al Mumkin pesantren described earlier in this chapter.

34
transitioned from student to Lukmanul Hakim’s director.77 Although the school closed in
2002 prior to the start of Noordin’s network mobilization, the relationships he forged
while at the school would prove a critical enabler of Noordin’s future Terrorist activity.78
As a former JI member, Noordin Top had access to a wide range of latent JI
network connections and resources. However, analysis of Noordin’s case study reveals a
few important distinctions between Noordin’s group and the larger JI organization. The
first resulted from Noordin’s continued instance on operating outside of JI control and
guidance. This limited Noordin’s access to the resources of important network hubs such
as Abdullah Sunata and Akram alias Taufikurrahman who maintained operational
loyalties to JI.79 A second notable difference between the Noordin Top and JI Networks
is that Noordin’s Network included ties to entities and groups to which JI had little or no
operational affiliation such as the Banten Ring (aka the Ring Banten Group).80 Although
Noordin was able to mobilize external support through individual elements of tangential
networks of all varieties he failed to successfully recruit bloc support from existing
organizations legitimate or otherwise.
3. PIRA Network
PIRA was a dark network composed of Irish Catholics in Northern Ireland who
violently protested their unfair treatment by the British-controlled government. It
originated from the original Irish Republican Army (old IRA), which was active from
1916 to 1920. This early insurgency successfully challenged British rule and succeeded
in establishing a free Irish State in 1921. This state’s formation split six northern Irish
counties from the rest of Ireland and set the stage for a bloody civil war that lasted from
June 1922 until May 1923. The free state government won the civil war and the six
77 The first Bali Bombings was a combined attack involving a suicide vest, and suicide vehicle borne improvised explosive device (SVBIED). The bombs detonated in October 2003 targeting patrons of a nightclub in Bali Indonesia. The attack killed 202 people. Although several members of Noordin’s Network including Umar Patek, Dulmatin, and Abu Dujana are believed to have been involved the attack, planning coordination and execution was conducted by JI. (International Crisis Group, “Terror in Indonesia: Noordin’s Networks).
78 International Crisis Group, “Terrorism in Indonesia: Noordin’s Networks.”
79 Ibid.
80 Ibid.

35
northern counties remained under British rule.81 The IRA capitulated, but never
disarmed. After the civil war, the IRA continued struggling against the free state and
Northern Ireland, eventually being outlawed by both Irish governments. It went so far as
to try and gain support from Adolph Hitler during WWII. After the World War, the
movement continued to struggle to establish equal rights for Irish Catholics.82 During the
1960’s discrimination against Irish Catholics in the “British-Ruled” predominately
protestant controlled government had begun to take a toll on the people.83 Kathryn
Gregory notes that “In the North, the Catholic minority, many of them with ‘republican’
or ‘nationalist sympathies,’ found they faced discrimination for jobs, housing, and in
their treatment before the law. On the other side, Protestant ‘unionists’ held sway,
controlled the patronage that doled out government jobs, and remained fiercely loyal to
the British crown.”84 In December of 1969, the IRA broke into two groups, the Official
and the Provisional wings. The Provisional wing believed that violence and terrorism
were the keys to forcing the British out of Ireland.85
By the 1970’s, relations between the Irish and British governments were still very
tense. As tensions rose, PIRA began to conduct terror attacks, such as shootings,
assassinations, and bombings. These tactics hurt popular support for PIRA, even from the
people they were fighting to liberate.86 Then, in January 1972, a British paratrooper
regiment open fired on a group of unarmed civil rights protestors, killing thirteen at a
Catholic rally in Londonderry.87 After this event, later dubbed Bloody Sunday, PIRA
81 Kathryn Gregory, Provisional Irish Republican Army (IRA) (aka, PIRA, “the provos,” Óglaigh na
hÉireann) (UK separatists), Council on Foreign Relations, Mar 16, 2010, 1.
82 Encyclopedia Britannica, s.v. “Irish Republican Army (IRA),” ed. Kimberly Cowell-Meyers and Paul Arthur, http://www.britannica.com/topic/Irish-Republican-Army.
83 Kathryn Gregory, Provisional Irish Republican Army (IRA) (aka, PIRA, “the provos,” Óglaigh na hÉireann) (UK separatists), 1.
84 Ibid.
85 Encyclopedia Britannica, s.v. “Irish Republican Army (IRA),” ed. Kimberly Cowell-Meyers and Paul Arthur, http://www.britannica.com/topic/Irish-Republican-Army.
86 Ibid.
87 Gill, Paul; Lee, Jeongyoon; Rethemeyer, Karl R.; Horgan, John; Asal, Victor, “Lethal Connections: The Determinants of Network Connections in the Provisional Irish Republican Army, 1970–1998,” http://dx.doi.org/10.7910/DVN/25575 V1 [Version]. 55.

36
recruitment soared.88 In July of that same year PIRA conducted a series of coordinated
attacks on what became known as Bloody Friday where “downtown Belfast was rocked
by twenty-two bombs in seventy-five minutes, leaving nine dead and 130 injured.”89
PIRA’s strategy during this period was to “quickly force British troops out of Northern
Ireland by inflicting a high death toll and substantial economic costs,”90 in order to
change British public opinion against maintaining ties with Northern Ireland.91
Over the next twenty plus years more than 3,600 individuals would be killed (on
both sides). In 1974 PIRA established a non-violent political wing, Sinn Féin, or
“Ourselves Alone” as it translates from Gaelic, which achieved a level of success in
establishing legitimacy by occupying various positions within the provincial Northern
Irish government.92 During this period, the Irish Northern Aid Committee (NORAID)
began conducting fund-raising for the families of Irish political prisoners.93 Sinn Féin
persisted as PIRA’s political arm until April 1998 when a final peace agreement was
made.94
During the three decades between 1970 and 1998, PIRA was considered one of
the most dangerous terrorist organizations in the world. It developed the use of
improvised explosive devices (IED) years before the United States would encounter them
in Iraq. It also used criminal activity “such as extortion, bank robbery, smuggling, and
counterfeiting” to help finance its operations.95 Nevertheless, PIRA managed to
transition from terrorist activities to laying down their arms and return to peaceful
88 Ibid., 55.
89 Ibid.
90 Ibid., 55.
91 Ibid., 55.
92 Sinn Féin was recognized legally in May of 1994, it has been in existence in some form since around 1918 and the old IRA.
93 NORAID is an independent, New York based charitable organization founded by Michael Flannery. It conducts fund-raising to distribute charitable relief to the families of Irish political prisoners. Often suspected of having ties to PIRA. Warren Richey, “On the trail of U.S. funds for IRA,” The Christian Science Monitor, Jan 14, 1985, http://www.csmonitor.com/1985/0114/anor1.html
94 Kathryn Gregory, Provisional Irish Republican Army (IRA) (aka, PIRA, “the provos,” Óglaigh na hÉireann) (UK separatists)
95 Ibid.

37
members of society. The movement went so far as to actually try and convey to the
population that the conflict was finally behind them; “In July 2002, on the thirtieth
anniversary of the 1972 Bloody Friday bombings, the IRA (aka PIRA) startled its
sympathizers and enemies alike by offering ‘sincere apologies and condolences’ to the
families of its civilian victims.”96
This chapter has provided an overview of three unique dark networks that have
drawn support from their surrounding societies. The following two chapters (Chapter V
and VI) build upon this framework to evaluate the effect of this support on measures of
network efficiency.
96 Ibid., 2.

38
THIS PAGE INTENTIONALLY LEFT BLANK

39
V. QUANTITATIVE ANALYSIS
This chapter provides a quantitative network level social network analysis (SNA)
based on metric descriptions of network snapshots over time. The objective of this
analysis is to assess the statistical relationship between embeddedness, as measured by E-
I index, and structural efficiency, as measured by density, centralization, and average
degree centrality. This chapter is divided into four sections, each focused on a different
empirical network case study.97 Sections are further divided into three subsections,
comprising longitudinal descriptions of network change, statistical descriptions of the
network, and a correlational analysis of network level measures. Within this analysis
actual empirical network data is contrasted with the results from simulated networks.
The simulated networks used throughout this chapter were generated by sampling
the network data (nodes, edges, and attributes) from each observation period. The sample
variables were then permuted 5,000 times using the Monte Carlo method, producing a set
of 5,000 row arrays (one for each network observation). In instances in which simulated
metrics for data are represented as scalar values the analysis uses the mean value for each
simulated observation interval. This process produces data that provides a benchmark for
network statistics and topography and provides a context for interpreting the empirical
network values. That is to say that simulated results are used to assess the extent that
changes in the empirical network are being influenced by sociological phenomenon or
external events. It should be noted that the simulated networks enjoy significantly higher
degrees of endogenous freedom than is available within the empirical datasets. This will
produce narrower confidence intervals during correlational analysis.
In order to measure the effects of external linkages on dark network structure it is
necessary to isolate dark nodes from the remainder of the network while calculating
relevant topographic measures. As such, all measurements within this chapter, with the
exception of E-I index, are based exclusively on dark entities and relationships. Bright
entities and their associated linkages are used to calculate embeddedness by means of
97 As in the previous chapter, networks surveyed in this chapter include the Noordin Top Terrorist Network, the Southeast Asian FFF Network and the PIRA network.

40
group E-I index but are subsequently removed prior to calculating centralization, density,
and average degree centrality. As a result of this intentional methodological variance,
graphs and figures will likely differ from previous publications evaluating similar
metrics.
A. SOUTHEAST ASIAN FFF NETWORK
Figure 4 provides a graph depicting the density, average degree centrality,
centralization, and group E-I index for the dark components of the Southeast Asian FFF
Network. Simulated scores are the mean of the permuted values. In order to improve
graph readability, density scores have been multiplied by 10, and average degree values
have been divided by 100. Observations span from the year 1980 to 2015 with significant
events marked by dotted vertical lines. Based on data availability network membership
studied is limited to high profile network members and individuals with links to them.
Significant events are indicated with brown dotted lines and include the Soviet invasion
of Afghanistan (1980), Sungkar begins sending fighters to Afghanistan (1986), the Soviet
departure from Afghanistan (1989), the September 11th World trade center attacks and the
Malaysian terrorism crackdown (2001), the Indonesian terrorism crackdown (2003), and
the rise of ISIS (2012).
Over the 36-year period studied, centralization remains relatively stable, density
follows a slight decline due to increases in network size. Both average degree and E-I
index trend slightly upward. Empirical measures manifest less variation than is observed
across simulated data. The most noticeable variations observed of any individual year
occur in 2001. During this period the E-I index peaked while measures of the provincial
cosmopolitan dimensions as well as centralization sharply decreased. Available data is
insufficient to suggest any specific case for this phenomenon; however, increased focus
on Islamic extremism in Malaysia, and the southern Philippines in the months leading up
to and following the September 11th terrorist attacks may play a role. Although
provincial-cosmopolitan scores quickly rebound, centralization remains low until 2005
where it begins to converge with density and average degree.

41
Figure 4. Southeast Asian FFF Network Statistics (Density, Average Degree, Density, and Group E-I)
From left to right significant years are: the Soviet invasion of Afghanistan (1980), Sungkar begins sending fighters to Afghanistan (1986) the Soviet departure from Afghanistan (1989), September 11th attacks and the Malaysian crackdown on terrorism (2001), the Indonesian Crackdown in Terrorism (2003) the rise of ISIL 2012.
Figure 5 depicts the error between empirical and simulated measures of
centralization and the E-I index. Error scores are calculated by subtracting the simulated
values from the empirical values. The E-I Index values greater than one indicate periods
in which the empirical E-I scores are lower than simulated and values less than one
indicate periods where empirical scores were higher than simulated. Periods of greater
deviation are further from the x-axis (0). The same relationship is true for positive and
negative centralization error scores. Figure 5 indicates that over time the error between
empirical and simulated network measures generally trended upwards, with values in the
final observation periods displaying a tendency for the network to manifest as slightly
more centralized and embedded than the simulated networks.

42
Figure 5. Southeast Asian FFF Network, Group E-I Index Error
From left to right, significant years are: the Soviet invasion of Afghanistan (1980), Sungkar begins sending fighters to Afghanistan (1986) the Soviet departure from Afghanistan (1989), September 11th attacks and the Malaysian crackdown on terrorism (2001), the Indonesian Crackdown in Terrorism (2003) the rise of ISIL 2012.
1. Southeast Asian FFF Network Statistics Summary
Figure 6 depicts four histograms representing the distribution of the permuted
network measurements for the FFF network across all 36 observation periods. Vertical
lines represent the frequency with which a simulated network values were observed.
Mean empirical and simulated scores for each network measure are depicted with dotted
vertical lines. Visual analysis of the graphs suggests that permuted results for
centralization, density, and E-I index skew to the left. The distribution of permuted
network values suggests that on average a network sharing the same number of ties,
nodes and attributes as the FFF Network would tend to be relatively decentralized,
cosmopolitan, and insulated with more internal than external ties. Across all measures,
the mean scores for embeddedness and efficiency within the empirical network fell close
to mean permuted values.

43
Figure 6. Southeast Asian FFF Network Statistics Distribution Summary
Southeast Asian FFF Network, 90,000 permutations.
2. Southeast Asian FFF Correlational Analysis
Figure 7 and Table 1 provide graphic and metric descriptions of the sample
estimates and confidence intervals for correlation between E-I index and efficiency
measures. E-I index correlates negatively with density and centralization and positively
with average degree centrality.98 Within the empirical network, sample estimates for
centralization correlate more negatively with embeddedness than those of the permuted
98 The unexpected disparity between correlations for density and average degree can be explained by a visual analysis of Figure 4. As the network grew over time the average number of connections remained relatively stable with just over two. Meanwhile the total number of nodes in the network steadily increased resulting in lower density values over time. This disparity highlights the limitation associated with comparing density between networks of differing size. Given the discrepancy between the two measures of the FFF network’s provincial cosmopolitan dimension analysis of the FFF network will rely on average degree centrality as a measure of the provincial cosmopolitan dimension and ignore density scores. (Average degree centrality is less sensitive to variations in network size and is a more reliable measurement of the provincial cosmopolitan dimension of network structure in instances when deviations in the size of compared networks is a factor.)

44
network with coefficient difference of -0.50. This finding runs counter to the
hypothesized relationship between embeddedness and efficiency as defined by network
centralization. The initial theory behind this research as informed by Milward and Raab,
Everton and Cunningham, and others was that dark networks trade security for efficiency
by maintaining sparse decentralized network structures, and that popular support
(external ties) would reduce security requirements thereby leading to increases in
centralization and network density.99
In contrast to centralization, group E-I index correlates positively with
connectedness (as estimated by average degree centrality). This relationship is supportive
of the initial hypothesis especially considering the nonconformity between the empirical
and simulated results. In the case of average degree centrality the absolute value of the
difference between sample estimates was 1.05. The implications of these observations are
that bright connections within the FFF network contributed simultaneously to
decentralization and interconnectivity. It remains unclear whether these effects resulted in
a network that was overall more or less structurally efficient.
99 Brinton H. Milward, Jörg Raab, “Dark Networks as Organizational Problems: Elements of A
Theory,” 333–360. Sean F. Everton, and Dan Cunningham. “Terrorist network adaptation to a changing environment,” 287–308.

45
Figure 7. Southeast Asian FFF Network Correlation Coefficient Confidence Intervals (Group E-I)
Correlation Coefficient
Table 1. Southeast Asian FFF Network Pearson’s Product Moment Correlation
**p-Value < 0.0001, *p-Value <.05

46
B. NOORDIN TOP NETWORK
Figure 8 provides a graph depicting longitudinal variation within dark
components of the Noordin Top Terrorist Network, using the same measures evaluated in
the Southeast Asian FFF network.100 Simulated scores are the mean of the permuted
values. As before in order to improve graph readability, density scores have been
multiplied by 10, and average degree values have been divided by 100. Observations
span from the year 2000 to 2010 with significant events marked by dotted vertical lines,
Noordin lead attacks are indicated in brown and important arrests and deaths are
indicated in purple.101 The topographic measures of both the empirically observed and
simulated networks appear to manifest stochastically across the observation period.
E-I index values are generally negative with sporadic peaks. The peaks in E-I
index occur in the months preceding and following attacks, with a tendency for post
attack peaks to be slightly higher than pre-attack peaks. The attacks themselves tend to
occur during periods in which the organization’s group embeddedness is close to neutral,
i.e., the number of external (bright or shady) ties are similar to the total number of ties to
internal (dark) ties. Given the Noordin network’s tendency towards an insulated structure,
these neutral values represent points of relative embeddedness. As was observed with the
group E-I index, centralization and density within the dark components of the network
also increase in the periods preceding and following a successful attack. Compared to the
E-I index observations these increases are more subtle and tend to fall temporally closer
to the point of attack.
100 Measures represented include density, average degree centrality, centralization and group E-I
index.
101 Significant events include the Marriott Hotel bombing (August 2003), the Australian Embassy bombing (September 2004), the second Bali bombings (October 2005), Arrest of Jabir and other key operatives (September 2006) the Jakarta Hotel bombings (July 2009), and the death of Noordin top (August 2009).

47
Figure 8. Noordin Network Statistics (Density, Average Degree, Density, and Group EI)
Significant events include the Marriott Hotel bombing (August 2003), the Australian Embassy bombing (September 2004), the second Bali bombings (October 2005), Arrest of Jabir and other key operatives (September 2006) the Jakarta Hotel bombings (July 2009), and the death of Noordin top (August 2009).

48
As indicated by Figure 8, there are multiple periods where the empirically
observed E-I index deviates substantially from the simulated mean. Contextual analysis
of the larger deviations suggests a combination of both exogenous and endogenous forces
may be responsible. Figure 9 provides a less cluttered depiction of the deviation (error
between empirical and simulated group E-I index values). As before, positive values
indicate periods where the empirical network was more embedded than the simulated
network and negative values represent periods where the empirical network was less
embedded than the simulated network. Figure 9 also depicts periods in which Noordin
network members were either killed or arrested by law enforcement entities. Arrest
statistics provide an objective external variable for contentedness, which may help to
explain significant deviations between the two E-I variables and is depicted by a solid
purple line. For the purposes of analysis, Figure 9 also highlights four instances where the
deviations in E-I index were statistically significant at the 95 percent confidence level.
These instances are depicted by red circles and are numbered from one to four in order of
magnitude.
The largest statistically significant deviation in E-I index occurs on September
2006. In this period, Noordin’s network is considerably more embedded than the
simulation. This deviation comes on the heels of the arrest of five members of Noordin’s
Network and the deaths of Jabir: a well-connected bomb maker and close confidant of
Noordin and Baharudin Soleh: one of Noordin’s recruiters.102 This police action appears
to have had significant effect on Noordin’s organization as the group does not conduct
another high profile attack for three years following the action.
The second largest deviation occurs in November 2009. As with the first spike, it
represents a period of heightened embeddedness. This spike occurs following the death of
Noordin Top, Urwah, and Mistam Husmudin, which ultimately lead to the dissolution of
the network. Increases in embeddedness in the periods following the law enforcement
actions in September 2006 and November 2009 may be indicative of dark network
102 Those arrested or killed included: Baharudin Soleh, Hence Malewa, Iqbal Huseini, Jabir,
Mustagfirin, Purnama Purta, and Solahudin. “Terrorism in Indonesia: Noordin’s Networks,” International Crisis Group, Asia Report 114, (May 2006).

49
members reaching out to bright members in the community for information, resources or
safe haven.
The third significant deviation occurs in October 2003 when 22 members of
Noordin’s network were arrested in a single month. In this case, Noordin’s network is
significantly less embedded than the simulation. Variation in this period is the direct
result of the removal of a large number of previously connected nodes from the network
rather than a post hoc response. Such a response does occur and can be observed in the
periods following the arrests as a series of spikes in embeddedness.103
The fourth significant deviation occurs in March 2002 and does not coincide with
high level arrests or with heightened police activity. As this deviation occurs prior to the
first Bali bombing during a period where Noordin’s network was still in its infancy and
was relatively unknown among law enforcement. It is possible that this dip simply
represents a period of internal organization, which would account for the low group E-I
score. According to the International Crisis Group, “There is little indication that
Noordin’s band of diehard followers had any particular structure at this stage.”104
103 Although the spikes following the October arrests are observable they are not statistically
significant.
104 International Crisis Group, “Terrorism in Indonesia: Noordin’s Networks,” 11.

50
Figure 9. Noordin Network Statistics (E-I Index and Arrest Data)
From left to right significant events and arrests are August 2003, July 2004, and October 2005, July and September 2006, and September 2009. Significant E-I index error is numbered by decreasing magnitude.
1. Noordin Top Network Statistics Summary
Figure 10 provides four histograms representing the distribution of the permuted
network measurements for the Noordin Top network across all 120 observation periods.
Vertical bars represent the frequency with which simulated network values were
observed. Mean empirical and simulated scores for each network measure are depicted
with dotted vertical lines. Visual analysis of the graphs shows that permuted results are
normally distributed for all four measures. The distribution of permuted network values
suggests that on average a structurally similar random network would tend to be
relatively decentralized, cosmopolitan, and insulated with more internal than external
ties. The graphs in Figure 10 also suggests that across all measures the mean scores for
embeddedness and efficiency within the empirical network fell close to mean permuted

51
values. When compared to the simulated network Noordin’s network was on average
slightly more centralized, and more sparsely and outwardly connected.
Figure 10. Noordin Network Statistics Distribution Summary
Noordin Network 605,000 Permutations
2. Noordin Top Correlational Analysis
Figure 11 and Table 2 provide graphic and metric descriptions of the sample
estimates and confidence intervals for the correlation between E-I index and efficiency
measures. E-I index correlates negatively with all three sets of measures. Sample
estimates for the empirical network measures correlate more negatively with
embeddedness than those of the permuted network. As with the Southeast Asian FFF
network these findings run counter to the original hypothesis. Again, higher group E-I
index values corresponded with lower centralization and density scores; and in the case

52
of the Noordin network specifically, also corresponded to lower average degree
centrality.
On average, sample estimates for correlation between simulated network data fell
within 20 percent of those between empirical values. The statistical significance of the
difference in sample estimates is most pronounced for centralization and density. In the
case of centralization there is no overlap between the empirical and permuted sample
estimate ranges, and in the case of density the empirical confidence interval fall outside
the sample estimate range for the permuted networks. The implications of these findings
are twofold. The first is that the underlying network parameters within Noordin’s
network create a tendency for a negative correlation between embeddedness and
efficiency, which supersedes social behavior. The second is that some combination of
actual internal or external factors may have served to amplify this disposed negative
relationship within the social behavior of the Noordin Top Network.
Figure 11. Noordin Correlation Coefficient Confidence Intervals (Group E-I)
Correlation Coefficient

53
Table 2. Noordin Top Network Pearson’s Product Moment Correlation
**p-Value < 0.0001
C. PROVISIONAL IRISH REPUBLICAN ARMY
Limitations inherent to the PIRA network dataset posed a number of significant
challenges to applying the quantitative analysis methods used throughout the previous
sections to the PIRA.105 The most prominent challenges arose from the lengths of the
recorded observation intervals and from the limited total number of longitudinal network
observations. The network data used in this section aggregates 30 years of relational
change in to six four-to five-year interval snapshots. The limited number of observation
intervals restricted the statistical rigor that we were able to apply to the data, and the
length of the observation interval precluded our ability to capture sub-interval level
changes in network structural changes resulting from micro-level network shocks and
individual historic events.
Figure 12 and Table 3 depict the same measures evaluated in previous
networks106 for the dark components of the PIRA network. In addition the graph has an
added line indicating the mean number of violent attacks conducted by the organization
105 These limitations are not reflective of any shortcoming in the research methods or data
aggregation techniques used by the original researches. Rather they are the byproduct of a dataset not specifically designed for some of the novel analytical approaches employed within this thesis.
106 Network measures include density, average degree centrality, centralization and group E-I index.
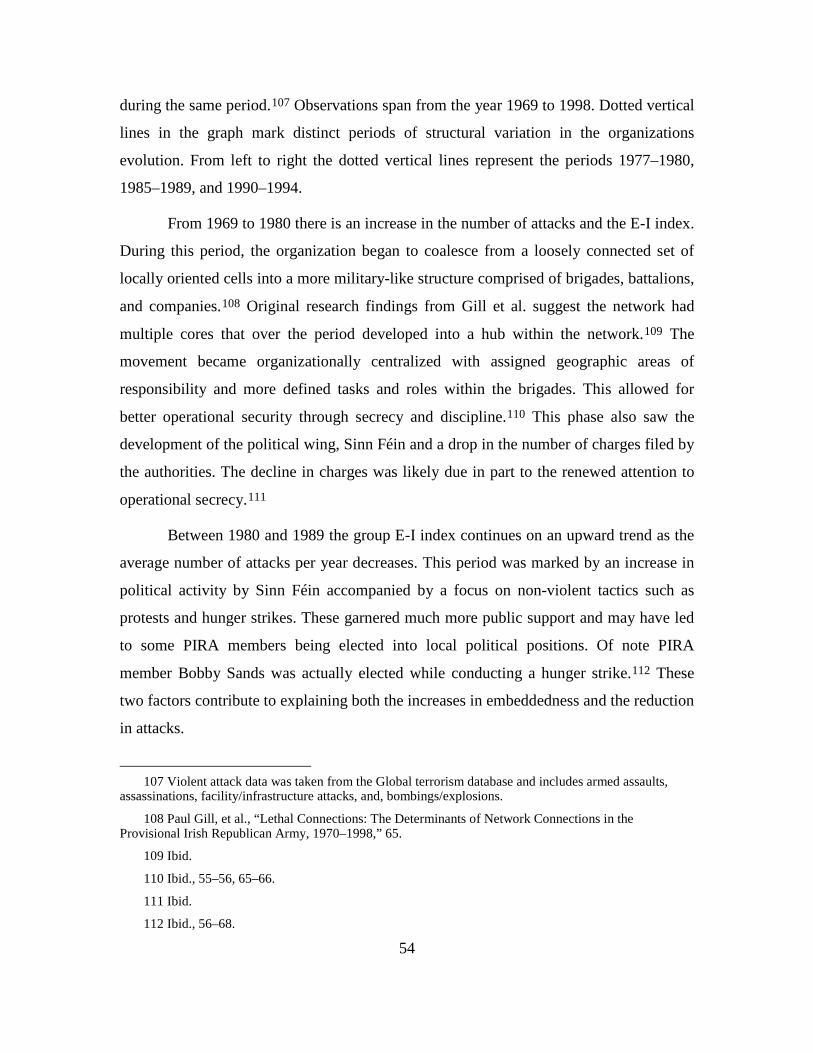
54
during the same period.107 Observations span from the year 1969 to 1998. Dotted vertical
lines in the graph mark distinct periods of structural variation in the organizations
evolution. From left to right the dotted vertical lines represent the periods 1977–1980,
1985–1989, and 1990–1994.
From 1969 to 1980 there is an increase in the number of attacks and the E-I index.
During this period, the organization began to coalesce from a loosely connected set of
locally oriented cells into a more military-like structure comprised of brigades, battalions,
and companies.108 Original research findings from Gill et al. suggest the network had
multiple cores that over the period developed into a hub within the network.109 The
movement became organizationally centralized with assigned geographic areas of
responsibility and more defined tasks and roles within the brigades. This allowed for
better operational security through secrecy and discipline.110 This phase also saw the
development of the political wing, Sinn Féin and a drop in the number of charges filed by
the authorities. The decline in charges was likely due in part to the renewed attention to
operational secrecy.111
Between 1980 and 1989 the group E-I index continues on an upward trend as the
average number of attacks per year decreases. This period was marked by an increase in
political activity by Sinn Féin accompanied by a focus on non-violent tactics such as
protests and hunger strikes. These garnered much more public support and may have led
to some PIRA members being elected into local political positions. Of note PIRA
member Bobby Sands was actually elected while conducting a hunger strike.112 These
two factors contribute to explaining both the increases in embeddedness and the reduction
in attacks.
107 Violent attack data was taken from the Global terrorism database and includes armed assaults,
assassinations, facility/infrastructure attacks, and, bombings/explosions.
108 Paul Gill, et al., “Lethal Connections: The Determinants of Network Connections in the Provisional Irish Republican Army, 1970–1998,” 65.
109 Ibid.
110 Ibid., 55–56, 65–66.
111 Ibid.
112 Ibid., 56–68.

55
From 1989 to 1994 attacks increase sharply accompanied by a sharp increase in
the E-I index. During this period negotiations were ongoing between the violent arm of
PIRA and the government, with Sinn Féin gaining more credibility in the political
realm.113 From 1994 through 1998 a sharp drop in attacks was accompanied by a slight
decrease in E-I index. During this period the movement tended to be more inclined to
make connections outside of the brigade in which a member belonged. Negotiations lead
to an official cease-fire and finally the Good Friday agreement, the 1998 accord between
the British government and PIRA.114
Throughout the network lifecycle, centralization remained relatively stable
throughout with the exception of a slight increase in the last period. Simulated
centralization scores are nearly indistinguishable from empirical values across all periods.
Additionally, there were no notable fluctuations in the provincial cosmopolitan measures
for the network, with the possible exception of a dip leading into the 1990s. Visual
analysis of the PIRA network suggests that both the empirical and simulated E-I index
are generally positively correlated with the number of attacks. While the number of data
points is insufficient to allow any firm conclusions, it is possible that higher levels of
popular support and participation in the movement allowed the organization to conduct
more attacks with a relative degree of impunity. However, this theory by itself is
insufficient to explain the drop in attacks between 1980 and 1990 (periods three and five
in Figure 12).
113 Paul Gill, et al., “Lethal Connections: The Determinants of Network Connections in the
Provisional Irish Republican Army, 1970–1998, “ 70.
114 Kathryn Gregory, Provisional Irish Republican Army (IRA) (aka, PIRA, “the provos,” Óglaigh na hÉireann) (UK separatists), Council on Foreign Relations, Mar 16, 2010, http://www.cfr.org/separatist-terrorism/provisional-irish-republican-army-ira-aka-pira-provos-oglaigh-na-heireann-uk-separatists/p9240.

56
Figure 12. PIRA Network Statistics
Table 3. Empirical PIRA Network Values
*Average number of annual attacks

57
1. PIRA Network Statistics Summary
Figure 13 depicts the simulated distribution and empirical mean of each of the
evaluated network measures. The distribution of permuted network scores suggests that
on average, a random network sharing the same number of ties, nodes and attributes as
the PIRA network would tend to manifest as relatively positively embedded, more
densely connected, and centralized albeit only slightly. As in previous networks, the
mean empirical value for centralization falls near the average and peak distribution value
observed within the permuted networks. From a provincial-cosmopolitan perspective the
dark components of the empirical network manifests as being slightly more connected
than their permuted counterparts averaging 0.4 fewer ties.115 From an embeddedness
perspective, the PIRA network is significantly less embedded and is much more insulated
(internally connected) than a randomly generated network. Of note, substantial changes
in network structure in the later periods result in skewed distributions for centralization
and density as well as a bi-modal distribution for average degree.
Figure 13. PIRA Network Measure Distribution Summary
PIRA Dark Network Partition (35,000 Permutations)
115 The multimodal degree distribution depicted in the graph is most likely the result of the significant
variation in PIRA network size across the observation intervals.

58
2. PIRA Correlational Analysis
As depicted in Figure 14 and Table 4 empirical PIRA data found no statistically
significant correlation between E-I index and the empirical measures of density, average
degree, and centralization. In the case of average degree and centralization, the lack of
statistical significance almost certainly reflects the limited number of empirical
observations.116 The magnitude of the negative correlation observed between E-I and
average degree shows that embeddedness had a particularly negative effect on PIRA’s
structural efficiency. However, this observation should be tempered by the fact that the
correlation is actual less negative than that of the simulated network. In contrast, the
sample estimate for empirical centralization exceeds that of the permuted network in
support of the original hypothesis.
In all instances, empirical sample estimates fell to the right of the simulated ones.
This is the opposite direction as was observed in the Noordin case, and may suggest that
corollary values could be sensitive to underlying differences in network structure. The
simulated coefficients for these measures had similar significance as those observed
within the FFF and Noordin Top Networks.
116 The P-values for the coefficient of correlation for empirical average degree and centralization
were 0.134 and 0.412 respectively. With only six degrees of freedom within the observed data, observing a statistically significant relationship is would have been unlikely in any case. By simply doubling the existing data it is possible to generate p-values of 0.017 and 0.191.

59
Figure 14. PIRA Correlation Coefficient Confidence Intervals
Coefficient of Correlation
Table 4. PIRA Network Pearson’s Product Moment Correlation
**p-Value < 0.0001.
D. CONCLUSION
This chapter applied a unique statistical approach to rigorously test the structural
effects of embeddedness across three dark networks. The results of this analysis do not
appear to support the initial hypothesis (that embeddedness leads to structural efficiency)
and render varied and inconclusive results. For example, E-I index correlated negatively

60
with average degree with both the PIRA and Noordin top networks, and positively with
average degree in the case of Southeast Asian FFF. In contrast, centralization correlated
negatively with both the Noordin and FFF networks and positively in the case of PIRA.
In most instances, coefficients of observed empirical co-relationships were
statistically significant, and exceeded those produced by simulated networks. Contextual
evaluation of these results suggests that unevaluated endogenous and exogenous factors
may have exerted prevailing influences on network structure. Chapter VI will combine
social movement theory (SMT) with standard SNA graphs and measures to attempt to
illuminate and unpack the relevant meta-networks and micro level processes in play.

61
VI. QUALITATIVE ANALYSIS
This chapter will layer social movement theory (SMT) and activity analysis to
provide a qualitative social network analysis (SNA) of the Southeast Asian Foreign
Fighter Facilitation (FFF) network, the Noordin Top Terrorist network, and the
Provisional Irish Republican Army (PIRA) network. This chapter is divided into three
sections, each focused on one of the three empirical networks respectively. Each section
will include contextual network overview followed by analysis. Analysis will use
temporal and social network graphs, in addition to narrative descriptions in order to
examine the evolution of meta-network membership and structure, individual
mobilization, and embedding processes, as they relate to bright external network
connections.
A. SOUTHEAST ASIAN FOREIGN FIGHTERS
The current Syrian and Iraqi crisis have created a beacon for foreign fighters and
facilitators with a desire to fight against the Assad regime or to fight alongside the self-
styled Islamic State known as Islamic State of Iraq and the Levant (ISIL). These fighters
pose a threat not only to the long-term stability of Iraq and Syria, but also to the stability
of their home counties. History has demonstrated that foreign fighters often return home
radicalized and go on to lead or participate in domestic terrorism campaigns. The
founding members of Indonesian based Jemaah Islamiyah (JI) the Abu Sayyaf Group
(ASG)117 the Kumpulan Mujahidin Malaysia (KMM)118 and Lashkar Jihad 119 all fought
as mujahidin in Afghanistan before establishing their own violent extremist
117 The ASG is a violent extremist group founded in 1991 by Filipino, Abdurajak Janjalani. Its
primary goal is creating an independent Islamic state in areas of Mindanao (Australian National Security, https://www.nationalsecurity.gov.au/Listedterroristorganisations/Pages/AbuSayyafGroup.aspx).
118 The KMM founded by an Afghan mujahid in 1995. Its goals are to topple the Mahathir government and create an Islamic state that includes Malaysia, Indonesia, and the southern Philippines (FAS Intelligence Resource Program, http://fas.org/irp/world/para/kmm.htm).
119 Lashkar Jihad or Laskar Jihad was founded by Jafar Umar Thalib in 2000. It is an Islamist, anti-Christian, militia based in Indonesia that grew out of clashes between Christians and Muslims in 1999 (Terrorism Resource Analysis Consortium, http://www.trackingterrorism.org/group/lashkar-jihad-indonesia).

62
organizations.120 This section will explore the multiplex network structures with
Southeast Asian foreign fighter networks with an emphasis on the role of bright ties,
centralization, and embeddedness.
Analysis of the Southeast Asian FFF network is dived into three parts. Each part
approaches the network from a different perspective. Part one provides an historical
overview of FFF and jihad’s roots in Southeast Asia. Part two builds upon part one by
using SMT to describe organizational networks and established embedded ties which
have enabled foreign fighter mobilization; it also provides narrative examples
highlighting the evolving role of Southeast Asia as a hub for itinerant mujahedeen. Part
three uses longitudinal SNA graphs to describe the evolution of Southeast Asian FFF
networks between 1980 and 2015 at both organizational and individual levels using cross
organizational relationships divided into five to eleven year snapshots highlighting
noteworthy periods of mobilization.121
1. Profiles of Foreign Fighter Facilitation: Microstructures and Relational Ties
The following analysis examines the implications of embeddedness on foreign
fighter recruitment and mobilization through the lens of social movement theory. It
studies individuals within, and relationships between, three prominent network varieties:
latent and vestigial FFF networks, sociopolitical networks, and criminal and prison
networks. Links between individuals, the Maktab al Khidmat lil-Mujaheddin al-Arab
(MAK), Al Qaeda, and various jihadi groups currently operating in Syria and Iraq are
examined as examples or proofs of how dark, bright, and shady networks can contribute
towards radicalization, foreign fighter recruitment and facilitation.
Research by McAdam and Snow et al. demonstrates that among individuals
profiled, integration into multiple organizational networks, links to activists, and a history
120 Zachary Abuza, “Tentacles of Terror: Al Qaeda’s Southeast Asian Network.” Contemporary
Southeast Asia 24, no. 3 (2002): 428.
121 The periods surveyed throughout this section include: Jihad against the Soviet occupation of Afghanistan (1981 - 1990), the rise of al Qaeda (1991 -2000), U.S. entry into Iraq and Afghanistan (2001- 2010), and the rise of DAESH (2011 – 2015).

63
of activism served as the strongest predictors of participation in high-risk activist activity.
Their results point to the importance of interpersonal ties and kinship ties between
movement members in determining recruitment potential.122 This subsection will provide
a qualitative examination of McAdam’s and Snow et al.’s theories. Figure 15 represents a
graphical depiction of the relational network linkages previously described.
Figure 15. Conceptual FFF Network Model
a. Integration into Networks
FFF participation is influenced through a variety of sources. The following
paragraphs provide examples of how kinship, associational networks, and personal
histories of activism have contributed to and may serve as predictors for FFF
participation.
122 Doug McAdam, “High-Risk Activism: The Case of Freedom Summer,” 64–90; David A. Snow.,
Louis A. Zurcher Jr., and Sheldon Ekland-Olson, “Social Networks and Social Movements: A Microstructural Approach to Differential Recruitment,” 787–801.

64
b. Kinship
The families of JI members Muklahs and Samudra provide an exceptional
example of extremists whose participation in violent activity was heavily linked through
kinship ties. The primary conspirators of the 2002 Bali bomb attack, which killed 202
people, were Imam Samudra, Muklahs, Ali Imron, and Amrozi. Of these four individuals,
three were brothers (Muklahs, Imron, and Amrozi).123 Now, 13 years later media reports
indicate that the sons of both Muklahs (Zaid) and Samudra (Umar Jundul Haq) have
traveled to Syria to join Jabhat al-Nusrah.124 In this particular case close kinship ties to
extremists appears to have played a significant role in motivating all four associated
family members to extremist activity. Similar scenarios are common among Southeast
Asian extremists. Abdulrajak Janjalani, who founded the ASG, was replaced after his
death by his brother, Khadaffy Janjalani. This list of extremists whose family members
also participated in activist or violent behavior goes on and on.
c. Associational Networks
Not all ties to radicalism in Southeast Asia are familial. There are numerous
examples in which associational networks have been important in recruitment to
participation in FFF. McAdam describes two ways in which associational networks can
facilitate recruitment namely individual and “bloc recruitment.” McAdam references
Anthony Oberschall in describing bloc recruitment a mechanism in which groups of
individuals are recruited at once though the cooption of established associations or
organizations.125 Of the extremist organizations currently operating in Syria and Iraq,
ISIS has been the most successful in gaining pledges of support from existing Southeast
Asian groups. Currently at least three major groups have pledged their support including
123 Maria Ressa, Seeds of Terror: An Eyewitness Account of Al-Qaeda’s Newest Center of Operations
in Southeast Asia.
124 Deborah Cassrels, “Bali Bombers’ Sons among Next Generation of Indonesia Terrorists,” The Australian, 30 May 2015, http://www.theaustralian.com.au/news/inquirer/bali-bombers-sons-among-next-generation-of-indonesia-terrorists/story-e6frg6z6-1227375132500.
125 McAdam Doug, “High-Risk Activism: The Case of Freedom Summer,” (July, 1986).

65
the ASG, Jemaah Ansharut Tauhid (JAT), Bangsamoro Freedom Fighters (BIFF).126
Current ISIS block recruitment in Southeast Asia has been limited to dark organizations,
though bright and shady networks such as Forum Anak Kost Se-Indonesia (FAKSI) an
activist Islamic advocacy group have made open pledges of support. However, at this
point it remains unclear how many members from these groups have or will actually
travel to fight in Syria.
Associational network affiliation also facilitates individual recruitment. While this
method is not nearly as efficient as bloc recruitment, it remains an effective source of
mobilization. Among the network varieties described earlier sociopolitical organizations
and prison networks appear to be two common recruitment avenues for aspiring foreign
fighters in Southeast Asia.
Pondoks and Pesantrens (Southeast Asian religious boarding schools similar to
madrasas) have long played an important role in FFF recruitment. The notorious Al
Mumkin Pesantren in Ngruki provided fighters to the MAK dating back as long ago as
the early 1980s. This same organization also produced many leaders within JI and the
Noordin Top terrorist network. Organizations like the Al Mumkin Pesantren have proved
difficult to regulate in part because they are viewed as important institutions within the
community and in part because of their ability to maintain a certain plausible deniability.
The Al Mumkin Pesantren continues to operate within Indonesia and has recently been
linked to foreign fighters in Syria.127
The International Crisis Group (ICG) provides an example of a contemporary Al
Mumkin nexus in Ari Budi Santoso. This Al Mumkin alumnus and associate of ex-
Noordin group member Joko Pitono provided shelter to Ali Miftah (an escapee of the
2010 Aceh camp raid) and facilitated the transportation of material for a series of failed
bombing attempts in Sirebon. Prior to his arrest in 2011, Ari Budi Santoso occupied an
126 James Brandon, “Syrian Recruitment and Iraqi Jihads Prompt Increased Recruitment and Activism
in Southeast Asia,” Combating Terrorism Center Sentinel, 7 no. 10, (October 2014), 17–20.
127 Solahudin, “Syria as Armageddon,” Inside Indonesia, Accessed on 15 September 2015. http://www.insideindonesia.org/syria-as-armageddon.

66
ostensibly bright position in Indonesian society working as a kindergarten teacher, herbal
treatments salesman, and mosque youth group advisor.128
Prison networks provide a unique environment for foreign fighter recruitment.
While serving their sentences hard-core jihadists and terrorists mix with petty criminals
and thugs. Individuals form tactical alliances for survival and better treatment. According
to an IPAC report, terrorist organizations routinely send care packages to imprisoned
members, which allow them to gain significant influence over the prisoners.129 Due to
inadequate security measures, prisons also provide a venue for individuals across all three
entity categories (dark, bright, and shady) to freely associate and propagate extremist
ideology.
Julie Hwang describes an incident involving an inmate by the name of Rois a
staunch ISIS supporter who was sentenced to death row for his participation in the
Australian embassy bombing and Sam, a Ring Banten member who had been convicted
for robbery in support of the Bali bombing. After serving his initial sentence, Sam visited
Rois in prison and shortly afterward left to fight in Syria.130 In a separate incident
described in an IPAC report Rois recruited another Bali bomber (Abdul Rauf) to fight for
ISIS.
Abdul Rauf, released in 2011 after serving more than eight years for his role in
the Bali bombing, was a model prisoner and by all accounts remorseful and convinced
that violence against civilians in Indonesia was wrong. When he was brought into the
Bali bombing by Imam Samudra, he believed he was going to be sent to Ambon to fight.
When he was released, he was a regular visitor to Nusakambangan to visit Rois and on
one occasion expressed a desire to fight in Myanmar to avenge violence against Muslims
128 “Indonesia: How Extremists Regroup,” ICG Asia Report 228 (July 2012), i.
129 Institute for Policy Analysis of Conflict, “Support for “Islamic State” in Indonesian Prisons,” IPAC Report no. 15, 19 January 2015.
130 Julie C. Hwang, and Noor Huda Ismail, “There and Back Again: Indonesian Fighters in Syria,” Middle East Institute, 27 January 2015.

67
there. Rois told him how he could get to Syria instead. Abdul Rauf left in early 2014 and
was killed in May 2014 in Ramadi, Iraq.131
d. History of Activism
As noted above McAdam’s third predictor of high-risk activism is a history of
activism. This characteristic appears to hold true for each of the foundational leaders of
the original Participation in the Afghan jihad proved to be an important predictor of
future participation in domestic extremist activity.”132 The importance of past activism as
a mechanism is evident in the backgrounds of the founding members of JI, ASG, as well
as in the cases of more recent Southeast Asian Mujahedeen. Abu Bakar Bashir, and
Abdullah Sungkar, the two founding members of JI, got their start in activism though
their affiliation with the activist missionary group Dewan Dakwah Islamiyah Indonesia
(DDII).133 And Abdulrajak Janjalani, founder of ASG, got his start as a member of Moro
National Liberation Front (MNLF) before traveling to Afghanistan, and then setting up
his own violent extremist organization.134 More recently, individuals such as Salim
Mubarok an Islamic activist from FAKSI also transitioned from domestic activism to
foreign jihad.135
2. Organizational Networks and Ties
This section will incorporate Gould’s methodology to dark network analysis by
including both “bright” and dark nodes and relationships to explore the historic pathways
to radicalization which has facilitated foreign fighter mobilization in Southeast Asia over
131 Institute for Policy Analysis of Conflict, “Support for “Islamic State” in Indonesian Prisons,”
IPAC Report no. 15, 19 January 2015, 17.
132 Max, Gross, “A Muslim Archipelago,” (Washington, DC: National Defense Intelligence College, 2007), 52.
133 Martin van Bruinessen, “Genealogies of Islamic radicalism in post-Suharto Indonesia,” Southeast Asia Research, 10, no.2 (2002) 117–154.
134 Zachary “Abuza, Balik-Terroism: the Return of Abu Sayyaf.” The Strategic Studies Institute, September 2005.
135 Institute for Policy Analysis of Conflict, “Evolution of ISIS,” IPAC Report no. 13, 24 September 2014.

68
the past 35 years emphasizing the role played by bright entities and embeddedness.136
The following graphs evaluate links across five relationships including alliances,
collaboration, overlapping membership, finance, training, foreign fighter transfer, and
miscellaneous. This report will divide FFF into four distinct operational periods in order
to illustrate the growth and evolution of the networks involved. Periods were selected in
an attempt to capture network evolution in conjunction with relevant and significant
world events. The periods evaluated are as follows: Southeast Asian mujahedeen fight the
Soviet occupation of Afghanistan (1981–1990), the rise of al Qaeda (1991–2000), U.S.
entry into Iraq and Afghanistan (2001–2010), and the rise of Islamic State of Iraq and the
Levant (ISIL) (2011–015).
a. 1981 through 1990: Jihad against the Soviet Occupation of Afghanistan
The MAK network foreign fighter recruiter network represents Southeast Asia’s
first foray into the foreign Arena. Initial coordination to send participants to Afghanistan
came from individuals who were already participating in domestic activism. A key
regional contact, Hashim Salamat was an ex-MNLF member and founder of the Moro
Islamic Liberation Front (MILF). The MAK also received support from Abu Bakar
Bashir and Abdullah Sungkar (Darul Islam Activists from Indonesia).137 Through those
initial contacts, the MAK established a foothold in Southeast Asia that would grow over
time. Figure 16 depicts the initial Southeast Asian FFF network as it appeared between
1980 and 1991. During this period Pondok Ngruki, a religious boarding school in
Indonesia, is the only observed bright node within the MAK network.
136 In the context of this essay the term bright is used to refer to entities, organizations, or linkages
that are overt or legal: essentially the opposite of the term dark as coined by Milward and Raab.
137 Maria Ressa, Seeds of terror: An eyewitness account of Al-Qaeda’s newest center of operations in Southeast Asia, (New York: Free Press, 2003); Zachary Abuza, Militant Islam in Southeast Asia: crucible of terror, (Boulder, CO, USA, Lynne Rienner Publishers, 2003).

69
Figure 16. Southeast Asian FFF Network 1980–1990
6 nodes (1 bright/shady) 7 links
b. 1991 through 2000: The Rise of al Qaeda
Figure 17 depicts the Southeast Asian FFF networks between the Soviet
occupation of Afghanistan in the 1980s and the American occupation of Afghanistan
beginning in 2001. During this period, they remained active. Motivated by Usama Bin
Laden’s far enemy paradigm, members of the Southeast Asian network continued to
target occidental symbols within the region. Although the scale of violence during this
period are generally more consistent with domestic terrorism or low scale insurgency,138
an international cadre of trainers, coordinators, and fighters allow these networks in
aggregate to continue to meet the definition of foreign fighters. This is especially true in
cases where targets crossed territorial boundaries. Returned fighters formed ASG, JI, and
KMM. These groups along with the MAK (now rebranded as al-Qaeda) begin to expand
connections to bright entities. JI and the newly founded KMM establish connections with
the Pan-Malaysian Islamic Party (PAS). Al-Qaeda and ASG work together though
Mohammed Jamal Khalifa to establish a branch of the International Islamic Relief
138 Unlike the foreign fighters who participated in the conflicts in Afghanistan, Bosnia, Syria and Iraq, by and large violence in Southeast Asia did not rise to the level of an active war zone.

70
Organization in the Philippines.139 According to Ressa the Philippine IIRO branch served
as an important source of funding and recruitment for both ASG and the MILF.140 The
ASG, al Qaeda association, is one of the explanations provided for the increase in
Philippine141 terror activities between 1994 and 2001.
Ressa cites a classified Philippine intelligence document, which asserts that the
International Islamic Relief Organization (IIRO) was able to garner funds from a network
of other “innocent-sounding groups,” including the Islamic Worldwide Mission, Inc.
(IWM); Islamic Studies Call and Guidance of the Philippines (ISCGP), Inc.; United
Overseas Bangsamoro (UOB); and JMB Personnel Management Services, Inc.
(JMBPMS).142 Meanwhile, JI and Al-Qaeda worked to set up a second pondok in
Malaysia (the Lukmanul Hakim).143 During this period, off-shoot groups continued to
grow and new groups began to establish formalized ties through the coordination of the al
Qaeda in Southeast Asia (AQSEA) umbrella.144 Groups and geographic areas and within
the AQSEA network began to provide specialized capabilities for other group members.
For example, the MILF, the ASG, and the Philippines served largely as a training and
staging area, where Malaysia served as a “back office” and Singapore as a financial
hub.145 Figure 17 depicts the evolution of these relationships.
139 Maria Ressa, Seeds of terror: An eyewitness account of Al-Qaeda’s newest center of operations in
Southeast Asia.
140 Ibid., 108, 131.
141 Ibid., 108.
142 Khalifa selected management of the IWM, and at least one stockholder maintained constant communication with the MILF. The ISCGP worked to recruit fighters and was also connected to the MILF. The UOB served as an international fundraising arm to the MILF with offices Saudi Arabia and Malaysia. JMBPMS was a manpower company which recruited Filipino overseas workers for Saudi Arabia and is linked through a shareholder to a suspect in a 1977 terrorist plot in Manila (Ibid., 131.)
143 Ibid.
144 Zachary Abuza, Militant Islam in Southeast Asia: Crucible of Terror. Lynne Rienner Publishers, 2003.
145 Ibid. 10.
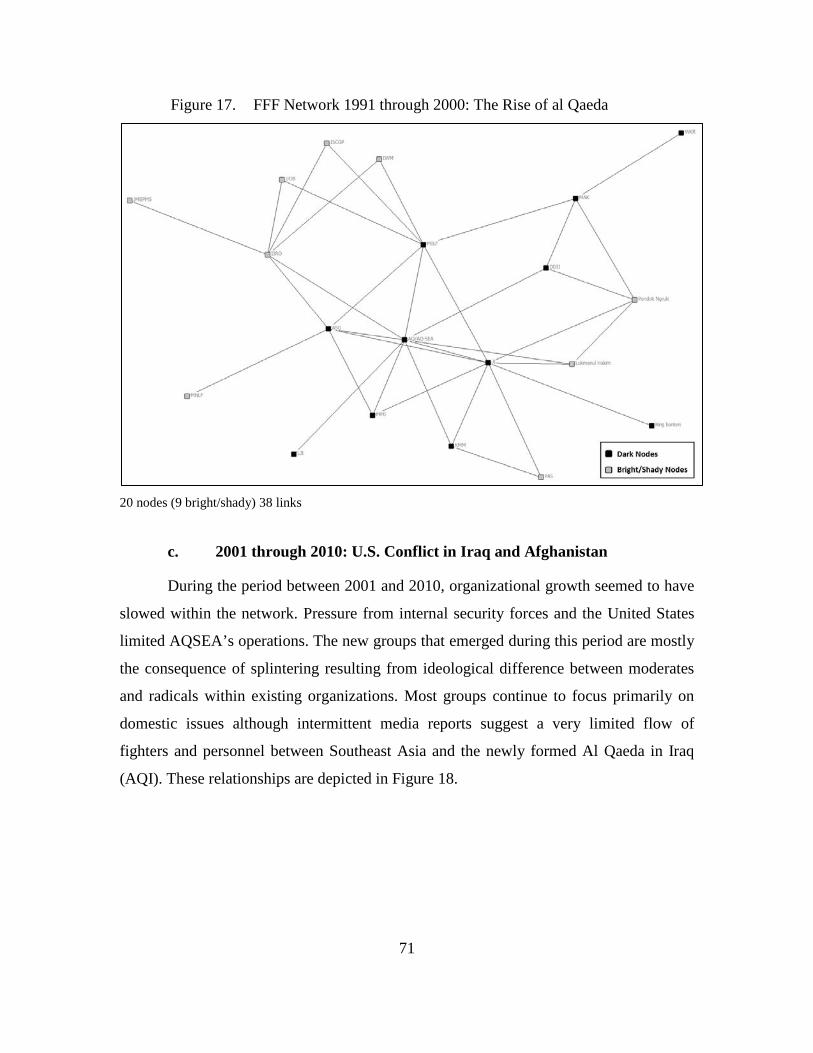
71
Figure 17. FFF Network 1991 through 2000: The Rise of al Qaeda
20 nodes (9 bright/shady) 38 links
c. 2001 through 2010: U.S. Conflict in Iraq and Afghanistan
During the period between 2001 and 2010, organizational growth seemed to have
slowed within the network. Pressure from internal security forces and the United States
limited AQSEA’s operations. The new groups that emerged during this period are mostly
the consequence of splintering resulting from ideological difference between moderates
and radicals within existing organizations. Most groups continue to focus primarily on
domestic issues although intermittent media reports suggest a very limited flow of
fighters and personnel between Southeast Asia and the newly formed Al Qaeda in Iraq
(AQI). These relationships are depicted in Figure 18.

72
Figure 18. 2001–2010 U.S. Entry into Iraq and Afghanistan
21 nodes (17 bright/shady) 38 links
d. 2011 through 2015: The Rise of ISIL
During the period following the U.S. withdrawal from Iraq, the networks began to
show signs of significant growth.146 The total number of nodes in the network has more
than doubled growing from 18 to 40. While some of these nodes broke off from existing
organizations such as Jemaah Ansharus Syariah (JAS), which is a breakaway group from
JAT, many groups have only recently emerged and do not appear to have significant ties
back to the older AQSEA network. Several bright organizations stand out within this
network: the Hilal Ahmar Society Indonesia (HASI) and FAKSI. Both organizations are
relative new comers to the network.
146 Some of the statistics pertaining to individual membership growth may be attributed to increases
in the availability of data. However, data availability alone does not account for the sheer number of organizations involved in FFF.

73
HASI was recently listed as an Al Qaeda associated entity by the United Nations
Al Qaeda Sanctions Committee.147 Huang describes HASI as one of four primary jihadi
routes used between Indonesia and Syria. HASI presents itself as a humanitarian
organization and has used its presence in Syria to facilitate the movement of fighters and
support personnel who have gone on to participate in and facilitate foreign fighter activity
in Syria and Iraq.148 HASI is closely linked to JI. Wiji Joko Santoso a HASI leader is
also known to be the Head of JI’s foreign affairs division.149 FAKSI, the activist Islamic
advocacy group, actively encourages Indonesians to support ISIS and has ties to JAT.
The 2011 to 2015 network is depicted in Figure 19.
147 United Nations Security Council, QDe.147. Hilal Ahmar Society Indonesia (HASI), 13, March
2015, http://www.un.org/sc/committees/1267/NSQDe147E.shtml.
148 Julie C. Hwang, and Noor Huda Ismail, “There and Back Again: Indonesian Fighters in Syria,” Middle East Institute, 27 January 2015.
149 U.S. Department of the Treasury, “Treasury Designates Twelve Foreign Terrorist Fighter Facilitators,” 24 September 2014, https://www.treasury.gov/press-center/press-releases/Pages/jl2651.aspx.

74
Figure 19. 2011 through 2015: The Rise of ISIL
46 nodes (10 bright/shady) 71 links
Analysis of individual relational ties within the current Southeast Asia FFF
network suggests that the historic AQSEA ties remain the strongest and appear to
facilitate the widest variety of resources (finance, training, and co-membership). These
reinforcing relationships also appear to position the vestigial AQSEA FFF network closer
to the Al Nusrah front and on the periphery of current FFF support to ISIS. This section
highlights the fluid nature of Southeast Asian FFF networks over the past 36 years. It also
demonstrates that existing theories on social movement and activism are highly
applicable to understanding the paths that lead to participation in both domestic
extremism and foreign jihad.

75
B. THE NOORDIN TOP NETWORK
This section uses multiplex SNA and SMT to examine the sources of
embeddedness and efficiency within the Noordin Top Terrorist Network. Analysis
examines the roles played by kinship and associational networks in shaping network
structure. Analysis is divided into three parts and covers the origins of the Noordin Top
network, meta-network analysis, mobilizing and embedding processes.
1. Noordin Top Meta-Network Analysis
Meta-network contrasts variations in structure and embeddedness between the
complete Noordin Top Network and four component meta-networks namely, friendship,
kinship, soulmates, and schoolmates. Due to some geographical, temporal and
organizational overlap, the Noordin Top Terrorist network will share some structural and
membership elements with the Southeast Asian FFF network.
Figure 20 presents a sociogram of the complete Noordin Top network. Dark
nodes are depicted as red while bright and shady nodes are depicted as blue. An initial
visual analysis of this network reveals that bright nodes are distributed throughout the
entire network generally occupying peripheral positions relative to dark nodes. Bright
nodes also appear less connected than their dark counterparts. This observation parallels
Morselli’s analysis of non-traffickers (bright and shady entities) in an illicit Canadian
hashish and cocaine trafficking network.150 Morselli describes legitimate actors within
criminal networks as providing “complementary resources,” as well as expertise.151 For
the Noordin Top network, bright elements contributed to network efficiency by allowing
certain network operations to take place in the public sphere without scrutiny from law
enforcement. In one example, Sardona Siliwangi, an Ngruki alumnus, was used to open a
bank account to support Noordin’s financial transactions. In other instances, bright
150 Carlo Morselli, “Legitimate Strengths in Criminal Networks,” Inside Criminal Networks, ed. (New
York, Springer, 2009).
151 Ibid.

76
members facilitated the transportation of material and provided shelter to fugitive
members of the group.152
From an embeddedness perspective, Noordin’s network enjoyed considerable
support from bright and shady entities in total 109 of the 237 member network
participated in roles that ostensibly preserved there status as law abiding members of the
community. The overall network level E-I index value for the network was -0.109. The
dark segment of the Noordin Network represents an organization dominated by internal
connections with a group E-I index score of -0.311. Conversely, the bright and shady
segments of Noordin’s network are connected predominantly through external ties with a
group E-I score of 0.259. The disparity in connectedness between dark and bright/shady
nodes within the network suggests that on average bright nodes occupied structurally less
important positions than there dark counterparts and likely wielded less informal power
within the network.
152 International Crisis Group, “Terror in Indonesia: Noordin’s Networks.”

77
Figure 20. Noordin Complete Network
237 Nodes (108 bright/shady) and 1,301 links (isolates removed)
Table 5 provides additional network statisitics charcterizing the statistical
variations between dark and bright nodes within the Noordin network. As depicted in
Figure 20, a summary of individual node level measures demostrates that the Noordin’s
dark members were more than 50 percent more connected than their bright and shady
counterparts with an average of 12.4 connections each compared to 8.1 for bright nodes.
Dark nodes also had higher clique counts indicating a greater potential for cross cluster
meembership.

78
Table 5. SNA Meterics: Aggregated Noordin Top Network
Centralization Betweenness Clique Count Clustering Coefficient
Dark Bright Dark Bright Dark Bright Dark Bright
Mean 12.4 8.1 0.0045 0.0017 5.3 3.0 0.5030 0.4605
Std Dev 14.3 10.4 0.0166 0.0047 11.0 6.1 0.3942 0.4279
Range 92 47 0.0315 0.0315 74 31 1 1
Minimum 0 0 0 0 0 0 0 0
Maximum 92 47 0.1678 0.0315 74 31 1 1
a. Family Ties
Figure 21 depicts Noordin Top Kinship meta-network. It includes ties of blood
relation and marriage. Overall, this network is characterized by disparate two to five node
familial clusters-most containing both bright and dark entities. Compared to the other
networks evaluated, the kinship network has the highest percentage of bright/shady
membership (55 percent). This meta-network is highly fragmented, decentralized, and
cosmopolitan. These characteristics may be common among familial networks, given that
individual kinship groups tend to be linked internally and that such linkages do not
automatically imply intergroup association with the larger network. This phenomenon
would be sensitive to variations in cultural marriage norms, or in cases of small isolated
populations.
Within the larger Noordin Top network, familial ties provided a network whose
members were bound by implicit trust and redundant connections to the local community.
Family members and their internetwork relationships constitute a minority within the
Noordin network’s composition. Members of Noordin’s kinship meta-network account
for 34 percent (80 of the 237 nodes), and 15 percent of the total relationships (192 of
1301 ties). In spite of occupying minority a position, Members of Noordin’s kinship
network contributed disproportionately to the ranks of facilitators and sympathizers
providing 92 percent of known sympathizers (11 of 12) and 25 percent of facilitators
(11of 44). In many cases, family members provided subtle, albeit essential enabling roles.

79
Figure 21. Noordin Top Kinship Meta-Network
80 nodes (44 bright/shady) 192 links (isolates removed)
b. Freindship Ties
Friendship ties within the Noordin Network represent affective relationships
between members exclusive of kinship ties. Figure 22 depicts the friendship meta-
network. Independently this network accounts for 41 percent (98 of 237) of total nodes
and 27 percent of the total relationships (354 of 1301 ties) within the complete network.
In spite of being the largest meta-network studied in this section it is also the most
cohesive network with the lowest fragmentation score. Unlike familial ties, Noordin’s
friendship ties follow a power law distribution suggesting that link formation may be
influenced by a preferential attachment process.
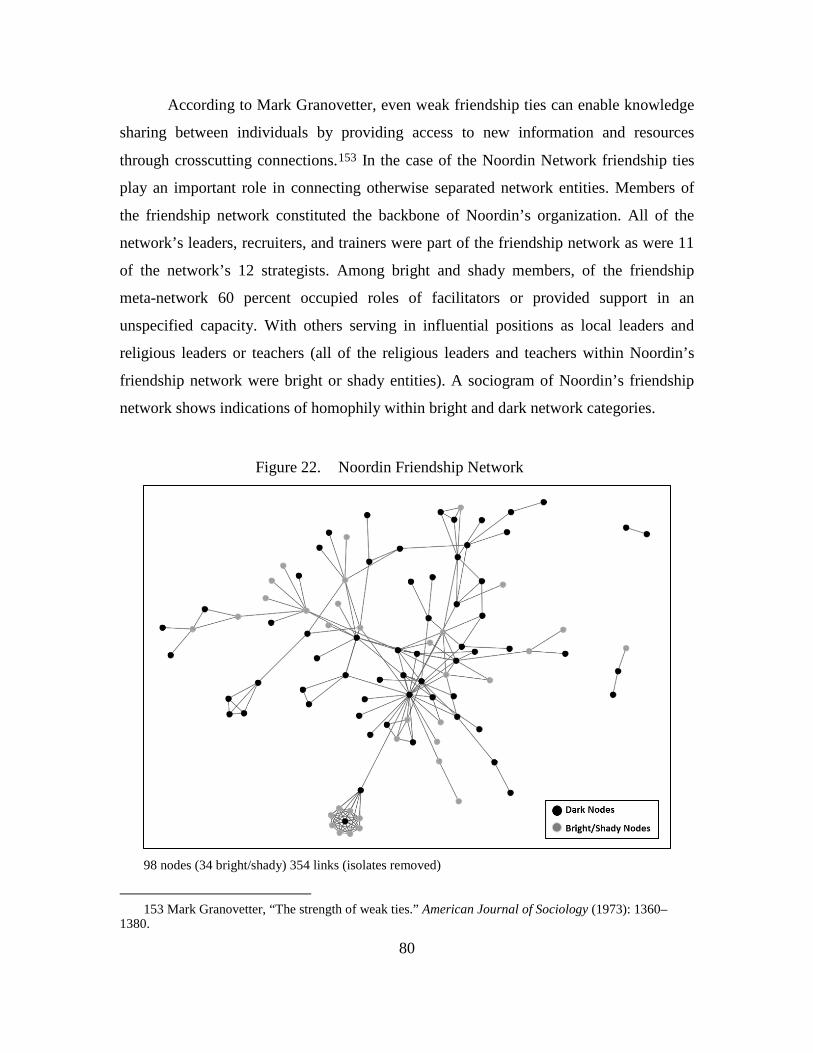
80
According to Mark Granovetter, even weak friendship ties can enable knowledge
sharing between individuals by providing access to new information and resources
through crosscutting connections.153 In the case of the Noordin Network friendship ties
play an important role in connecting otherwise separated network entities. Members of
the friendship network constituted the backbone of Noordin’s organization. All of the
network’s leaders, recruiters, and trainers were part of the friendship network as were 11
of the network’s 12 strategists. Among bright and shady members, of the friendship
meta-network 60 percent occupied roles of facilitators or provided support in an
unspecified capacity. With others serving in influential positions as local leaders and
religious leaders or teachers (all of the religious leaders and teachers within Noordin’s
friendship network were bright or shady entities). A sociogram of Noordin’s friendship
network shows indications of homophily within bright and dark network categories.
Figure 22. Noordin Friendship Network
98 nodes (34 bright/shady) 354 links (isolates removed)
153 Mark Granovetter, “The strength of weak ties.” American Journal of Sociology (1973): 1360–
1380.

81
c. Worship Ties
Figure 23 depicts the Noordin Top soulmates network, which includes
connections between network members based on attendance at the same religious
institution at the same time. Worship ties do not account for religious ties through
religious boarding schools; those ties are captured in the schoolmate’s meta-network. The
soulmates network is the smallest of those examined and comprises only 26 nodes (11
percent) of the overall network. In spite of small relative size, the soulmate members
make up a disproportionality high percentage of the network’s bomb makers (45%).
Bright and shady members of the soulmate meta-network were limited to sympathizer,
facilitators or unknown. Structurally the soulmate network is most similar to the kinship
network in terms of fragmentation centralization and connectivity.
Figure 23. Noordin Top Soulmates Network
26 nodes (11 bright/shady) 27 links (isolates removed)

82
d. School Ties
Figure 24 depicts schoolmate ties within the Noordin network. Connections are
based on members shared attendance at a particular school during the same time period.
Connections within this network are primarily formed by alumni of the Al Mumkin and
Lukmanul Hakim pesantrens. Bright and shady nodes make up approximately 40 percent
of the membership and occupy relatively central positions within this meta-network. Of
the meta-networks evaluated in this section, the schoolmates network is the most
centralized and the most connected, with a degree centralization score of 0.42 and an
average degree centrality score of 7.9. These scores suggest the potential for
embeddedness through certain varieties of sociocultural institutions to aid in contributing
towards structural efficiency. This is in contrast to the relationship observed between
efficiency and worship ties.
Figure 24. Noordin Top Schoolmates
55 nodes (22 bright) 436 links (isolates removed)

83
Analysis of the Noordin Top Network demonstrates that the effects of embedded
connections vary considerably depending upon the source of embeddedness. In this case,
embeddedness based on kinship or simultaneous membership within religious institutions
manifests in a network of decentralized cells. In contrast, schoolmate and friendship
networks are much more provincial and centralized. Additionally, those networks with
larger percentage of bright nodes tended to fall into the two less efficient network
structures. This trend highlights a potential constraint on the potential for embeddedness
to increase centralization or the provincial-cosmopolitan nature of network structure.
Table 6 provides measurements of network centralization, fragmentation, and density as
represented by average degree. It also provides values for the percentage of bright/shady
nodes as a percentage of total nodes.154 The contrast in structure observed between
schoolmates and soulmates meta-networks may provide an avenue for future research
into the varied roles played by embeddedness in sociocultural institutions in shaping
network structure.
Table 6. Noordin Top Meta-Network Measure Distribution
Note: Meta-network membership is not exclusive and calculations are discrete. Values do not sum to complete network.
154 Fragmentation scores represent the percentage of nodes within a network that are disconnected
from one another. Possible fragmentation scores range between 0 and 1 with 1 representing a network in which all nodes are disconnected and 0 representing a network in which all nodes are connected. (Sean Everton, Disrupting Dark Networks, 400). Due to their disconnected nature, highly fragmented networks are structurally disadvantaged in terms of communication, coordination, and efficiency.
Size Centralization Fragmentation Avg Degree Pct BrightKinship 80 0.07 0.93 1.2 55Friendship 98 0.22 0.14 3.9 34Schoolmates 55 0.42 0.24 7.9 40Soulmates 26 0.08 0.85 1.0 42Complete 237 0.35 0.50 5.5 46

84
2. Mobilization and Embedding Processes
During the lifespan of the network, Noordin Top and his organization were
directly responsible for a total of four high profile bombing attacks targeting the Marriott
Hotel in August 2003, the Australian Embassy in July 2004, the second Bali bombings
October 2005 (hereafter also referred to Bali II), and the Jakarta Hotel bombings in July
2009. In addition, Noordin also provided resources and inspirational guidance to at least
one other small terror group dubbed the “Palembang Group” based on their location in
Palembang South Sumatra.155 As the network evolved, so did its support base. Between
2003 and 2009 Noordin’s operational cells shifted from relying almost exclusively on
school ties to drawing increasing from friendship and later kinship networks for support.
a. Mobilizing Existing Connections
The Marriot Hotel bombing was the first large scale operation conducted by
Noordin’s fledgling organization and relied heavily on Noordin’s existing associational
networks. All of the attack’s participants were JI members, and JI contacts and provided
generalized logistic support. Al Mumkin alumni played important roles in planning,
coordination, and transportation of the explosives.156 All but one of the participants in the
Marriot Bombing were members of Noordin’s schoolmates network with the exception of
Azhari the bomb maker, who had multiple connections within Noordin’s friendship
network.
Noordin’s second attack suggests an effort to expand recruiting outside of the
network of JI and school alumni. Conspirators in the September 2004 Australian
Embassy Bombing included not only members of JI’s East Division, but also DI and its
Banten-based splinter group. Suicide bombers were recruited from among the ranks of DI
and the Banten group. Only 75 percent (15 of 20) of the individuals involved as
conspirators in the Embassy attacks were linked through Noordin’s networks of
155 International Crisis Group, “Indonesia: Radicalization of the “Palembang Group” International
Crisis Group, Asia Report, no. 92 (May 2009).
156 Roberts, Nancy, Sean F. Everton, and Daniel Cunningham. “The Noordin Top Network,” [Machine-readable data file]

85
schoolmates.157 Those who were not linked by school were connected via overlapping
friendship and kinship relationships. By the time of Bali II in 2005 friendship
relationships dominated, nearly 90 percent of those involved were part of the friendship
network in contrast to only 22 percent who shared school ties and just over 10 percent
who had kinship ties to the network.158
The final act of terror conducted by Noordin’s network was the Jakarta Hotel
bombing in July 2009. Coordination for this attack marked a third shift in the
participation paradigm. In the lead up to this attack the majority of participants were
linked though Kinship ties (57 percent), while just over a third (36 percent) were
members of the friendship network and fewer still were schoolmates (14 percent).159 It is
possible that this final shift may have been spurred by the increased security forces
presence, which followed Bali II in 2005 and the arrests of bomb maker Jabir in April
2006 and Noordin’s associate and JI leader Abu Dujana in June 2007. Noordin Top was
eventually killed in August 2009 in a raid that closely followed the Jakarta bombing,
which led to the rapid disintegration of his organization.
Meta-network membership differed considerably across the four high profile
attacks attributed to Noordin Top’s group. With each attack, membership shifted away
from the original school network and relied increasingly on affective ties and kinship.
Some of these changes may be attributed to membership losses inflicted by Indonesian
security forces or to waning support from the core JI movement who disapproved of
Noordin’s attacks. However neither of these explanations alone are sufficient to fully
account for the changes. Noordin’s school network consisted of hundreds of members
that could have been drawn upon to replace any losses due to arrests, and JI members
accounted for a larger percentage of participants in the final attack than they did during
the second attack before JI had distanced itself from Noordin. This suggests that other
factors may have played a role in the differential recruitment observed between attacks.
157 Ibid.
158 Ibid.
159 Ibid.

86
Whatever the explanation for the shift in Noordin’s recruitment base, the end
effect was that participants were increasingly drawn from decentralized networks. These
networks in turn were increasingly connected to bright and shady nodes as depicted in
Table 7. One explanation for this is the cumulative effect of arrests and increases in
Indonesian security posture that occurred across the span of attacks. This increased
pressure may have prompted individuals to turn to networks with higher presumed levels
of trust or those that required less conspicuous communication (i.e., family and friends).
The speed at which the Noordin network dissolved following Noordin’s death composite
cliques from which he recruited lacked the will or self-organizing capacity necessary to
continue in his absence. These outcomes point to the conclusion that in the case of the
Noordin network, embedded ties increased indicators for resilience (decentralization),
while simultaneously reducing measure of efficiency.
Table 7. Meta-Network Node and Link Distribution as Percentage of Total Network
Meta-Network Source Summary All Nodes Bright/Shady Nodes Total Relationships Kinship 34 40 15 School 23 20 34 Friendship 41 31 27 Religious 11 10 2
Values Represented as Percentage of Total Network and Bright/Shady network partition. Due to overlapping network membership and exclusion of operational ties values do not sum to 100.
b. Embedded Bright Network Connections
Embedded linkages may be primary factors contributing to rapid mobilization and
sustaining operations. Recruitment into Noordin’s dark network occurred through face-
to-face activation of preexisting associational ties. However, these ties would likely not
have been as extensive had they not been formed through bright organizations. Both the
Lukmanul Hakim and Al Mumkin pesantrens operated publicly and required relatively
limited commitment and risk.
87
Within the Noordin Top network, religious leaders occupy key positions lending
legitimacy to facilitating embeddedness. The International Crisis Group (ICG) describes
youth radicalization as occurring through religious study groups and through the
recruitment of individuals who had previously been radicalized through “exposure to
jihadi preachers.”160 Noordin directly and indirectly leverage social symbols of
legitimacy to facilitate their embeddedness, such as holding meetings at universities,
religious schools and even local kindergarten classrooms.161
The mobilization process used by the Noordin Top network demonstrates the
value both of both vertical and crosscutting ties. Initial mobilization was facilitated by
preexisting JI connections. JI links also provided initial activity with the benefit of ties
from sympathetic Muslim schools and organizations. As time went on the Noordin
Network grew in size recruiting support from other extremist organizations as well as
from sympathetic members of the surrounding community.
C. PROVISIONAL IRISH REPUBLICAN ARMY
This section investigates the impact social embeddedness may have played on the
effectiveness of the PIRA from its inception in 1969 to its culminating cease-fire
agreement in 1998. The PIRA dataset provides an empirical case/example that is
geographically, culturally, and ideologically distinct from the two previous networks
examined in this thesis. As with preceding sections, this section’s analysis is divided into
three parts, each emphasizing embeddedness and its effect on organizational efficiency
and behavior.162 Analysis will focus on three noteworthy periods within PIRA’s thirty-
year active span that represent key moments in PIRA’s evolution: (1) The movement’s
160 International Crisis Group, “Indonesia: Noordin Top’s Support Base,” International Crisis Group
Asia Briefing, no. 95 (August 2009): 1.
161 Ibid., 5.
162 The parts within this section include historical background on the PIRA organization, SNA, and SMT.

88
genesis (1969–1976), (2) the movement’s apex (1981–1989), and (3) the movement’s
culmination (1990–1998).163
1. PIRA as a Social Movement: Grievances Ties and Organization
PIRA began as a social movement. It grew out of grievances stemming from
perceived and real discrimination toward Northern Ireland’s Irish Catholic population.
PIRA’s members were able to use established church organizational ties, in particular
family and friendship ties, as a built in social network. Scholars have theorized that,
“people engage in collective action because they share certain norms and values related
to a specific area of political contention.”164 The norms and values that existed within the
social network of Irish Catholic churches allowed for the free socialization of shared
frustrations with the implications of British rule. Catholic neighborhoods, where
unemployment averaged 40% or higher during much of the 30 years covered in this
study, also helped to foster membership.165 In the early stages of the movement, this
socialization function facilitated initial participation and identification without the
risk/commitment of total participation in collective action through civil disobedience or
other activities.
The decision to participate in collective action is often influenced by the activities
of other members of the social network.166 Embeddedness in a social network, whether
formal or informal, may help to foster identification with a cause and ease the decision to
participate. Passy proposes that individuals who identify with a movement and are
strongly socialized within the network tend to be more intensely involved with the
movement’s activities.167 It was because of this that PIRA transitioned from
163 For ease of discussion within this chapter, some periods from Chapter V have been consolidated.
Period 1 in this chapter corresponds to Chapter V periods 1–2, Period 2 Corresponds to Chapter V periods 4–5 and period 3 corresponds to Chapter V period 6.
164 Florence Passy, “Social Networks Matter. But how?,” in Social Movements and Networks: Relational Approaches to Collective Action (Comparative Politics), ed. Mario Diani and Doug McAdam (Oxford and New York, Oxford University Press, 2003) 23.
165 John W. Soule, “Problems in Applying Counterterrorism to Prevent Terrorism: Two Decades of Violence in Northern Ireland Reconsidered,” Terrorism Vol. 12, (1989), 35.
166 Florence Passy, “Social Networks Matter. But how?,” 25.
167 Ibid., 30.

89
conversations among like-minded individuals into a social movement. Relational data
collected by Gill et al. also point to the importance of embedded affective ties in
mobilization.168 They found that core PIRA network members had strong familial and
friendship ties to others within the organization.169 “Entire families rather than
individuals become involved in the rebellion, and the propensity for violence seems to be
a subcultural trait which is transmitted from generation to generation in the same manner
as other cultural traits.”170 Relationship type may also affect levels of participation.
According to Passy, “When recruiters are close friends (as opposed to acquaintances),
potential participants tend to trust them and to be convinced that a particular organization
is the one most appropriate for conversion of their political interests into a strong degree
of commitment.”171 Embedded ties within the PIRA network may have provided the trust
necessary for higher levels of participation. Passy also writes that the more an individual
(recruiter) is involved with the movement the more likely it is for new members to be
convinced to join and participate fully.172 This effect is even more pronounced, as it
pertains to mobilization of members to act, if the members are centrally organized
geographically, which was also the case with PIRA organization.173 Gill et al. also found
that most brigades usually grew and maintained ties within the same brigade, with some
variation throughout the organization as a whole. They also discovered that actors that
conducted violent operations had the tendency to connect with other violent actors.174
168 Gill, Paul; Lee, Jeongyoon; Rethemeyer, Karl R.; Horgan, John; Asal, Victor, “Lethal
Connections: The Determinants of Network Connections in the Provisional Irish Republican Army, 1970–1998.”
169 Ibid., 60.
170 John W. Soule, “Problems in Applying Counterterrorism to Prevent Terrorism: Two Decades of Violence in Northern Ireland Reconsidered,” 37.
171 Florence Passy, “Social Networks Matter. But how?,” 33.
172 Florence Passy, “Social Networks Matter. But how?,” 33.
173 Ibid.
174 Gill, Paul; Lee, Jeongyoon; Rethemeyer, Karl R.; Horgan, John; Asal, Victor, “Lethal Connections: The Determinants of Network Connections in the Provisional Irish Republican Army, 1970–1998,” 52.

90
a. Movement Genesis: Period 1 (1969–1976)
The early years of PIRA consisted of primarily of structural changes in the
organization itself. During this period of development and initial growth, the movement
consolidated from a loosely grouped collection of splinter cells into a more military like
structure with companies, battalions, and brigades.175 The structural changes that took
place during PIRA’s early years contributed to a relative increase in organizational
centralization when compared to its informal beginnings. A centralized command and
control structure likely increased efficiency allowing for successful coordinated and
attacks like “Bloody Friday.”176 These same brigades/battalions are also given
geographic areas of responsibility, which allowed for better command and control as
well.
b. Movement Apex: Period 2 (1981–1989)
The structural change that began in the first period continued through to the
second (1981). This time period emphasized secrecy and discipline by utilizing a cell
structure: “Each cell, in theory, has three or four members known to each other by a
pseudonym and directed by an anonymous controller.”177 It was during the transition
from the first period to the second period that the political arm of PIRA became active.
Sinn Féin began its slow campaign for equal rights for Irish Catholics.178 Gill et al.
describe the period between 1981 and 1989 as marked by an increase in political activity
from Sinn Féin on the behalf of PIRA supporters. One of the tactics that proved effective
was non-violent hunger strikes. These tactics generated more public sympathy and
support for the movement from the surrounding milieu. The tactics were also credited
175 The brigades are named for the six Northern Irish counties that were excluded from the 1921 Free Irish State treaty and included Armagh, Antrim, Derry, Down, Fermanagh, and Tyrone. Paul Gill & John Horgan (2013) Who Were the Volunteers? The Shifting Sociological and Operational Profile of 1240 Provisional Irish Republican Army Members, Terrorism and Political Violence, 25:3, 435–456.
176 Gill, Paul; Lee, Jeongyoon; Rethemeyer, Karl R.; Horgan, John; Asal, Victor, “Lethal Connections: The Determinants of Network Connections in the Provisional Irish Republican Army, 1970–1998,” 55.
177 John W. Soule, “Problems in Applying Counterterrorism to Prevent Terrorism: Two Decades of Violence in Northern Ireland Reconsidered,” 35.
178 Kathryn Gregory, Provisional Irish Republican Army (IRA) (aka, PIRA, “the provos,” Óglaigh na hÉireann) (UK separatists), Council on Foreign Relations, Mar 16, 2010.

91
with having had a positive effect on the election of Sinn Féin (PIRA) members into local
political positions.179 This period had the highest levels of PIRA membership of any
other time during the movement. It is arguable that Sinn Féin’s legitimizing influence and
non-violent tactics may have contributed both to mutual increase in both embeddedness
and centralization observed during this time.
c. Movement Culmination: Period 3 (1990–1998)
Period three marks the beginning of the end of violence in the region although it
would take more than eight years of negotiations to yield any lasting results. Those
results became evident with a cease-fire agreement in 1997 and finally a peace accord in
April of 1998. The political arm was largely responsible for the positive outcome that
represents the culmination of the movement during this final period. It was through the
shared social wrongs that generated sympathy for the movement, along with focused
targeting of catholic members of the community that helped maintain recruitment and
generate a deep seeded hatred for the authorities. One out of every four Catholics had
been arrested since 1970, and the number was higher in the blue-collar communities.
Like other dark networks, prisons were an ideal place to recruit; Sinn Féin even
organized daily bus trips to the prisons, free to the communities that helped gain even
more sympathy.180 Incarcerations served as a common experience among Irish Catholics
and acted as an additional associational network to mobilize popular support. It was in
this way the PIRA prison networks mirrored those observed in the Southeast Asian FFF
and the Noordin Top case studies.
2. Longitudinal Social Network Analysis
This subsection analyzes PIRA from the perspective of bright and dark players.
Agents within the dataset are broken into groups based on their activities within the
179 Ibid.
180 John W. Soule, “Problems in Applying Counterterrorism to Prevent Terrorism: Two Decades of Violence in Northern Ireland Reconsidered,” 36.

92
network.181 The following sociograms provide visualizations of how the network
changed over the course of the movement. The snapshots are derived from data from
periods one, two, and three. As Figure 25 indicates, from 1969-1976 PIRA was a network
of multiple cores and cells working loosely together. Visual analysis quickly reveals that
the distribution of dark and bright nodes within the PIRA network differs considerably
from the previous networks. Namely, over 50% of its senior leadership are non-violent
(bright), and were therefore not pursued or targeted due to lacking operational ties. The
bright partition of the network appears considerably both more central and more
centralized than the total overall.
Visual analysis also reveals a considerable degree of homophily or the tendency
to connect with individuals who are characteristically similar between actor categories
(dark and bright). According to Gill et al., this tendency may have played a part in
explaining who connected and interacted with whom. Homophily, which is a common
trait among social networks, would have allowed for more operational security (OPSEC)
specifically in the more illicit activities like IED construction and kidnapping.182
181 Dark networkmembers are any of those who participated in violent or illicit activities such as
robbery, kidnapping, improvised explosive device (IED) construction, bombings, or shootings/assassinations. Bright members are individuals who have not been associated with any of the aforementioned violent activities. This dichotomy is first illustrated in Figure 25.
182 Paul Gill; Jeongyoon Lee,; Karl Rethemeyer, R.; John Horgan; Asal, Victor, “Lethal Connections: The Determinants of Network Connections in the Provisional Irish Republican Army, 1970–1998,” 54.
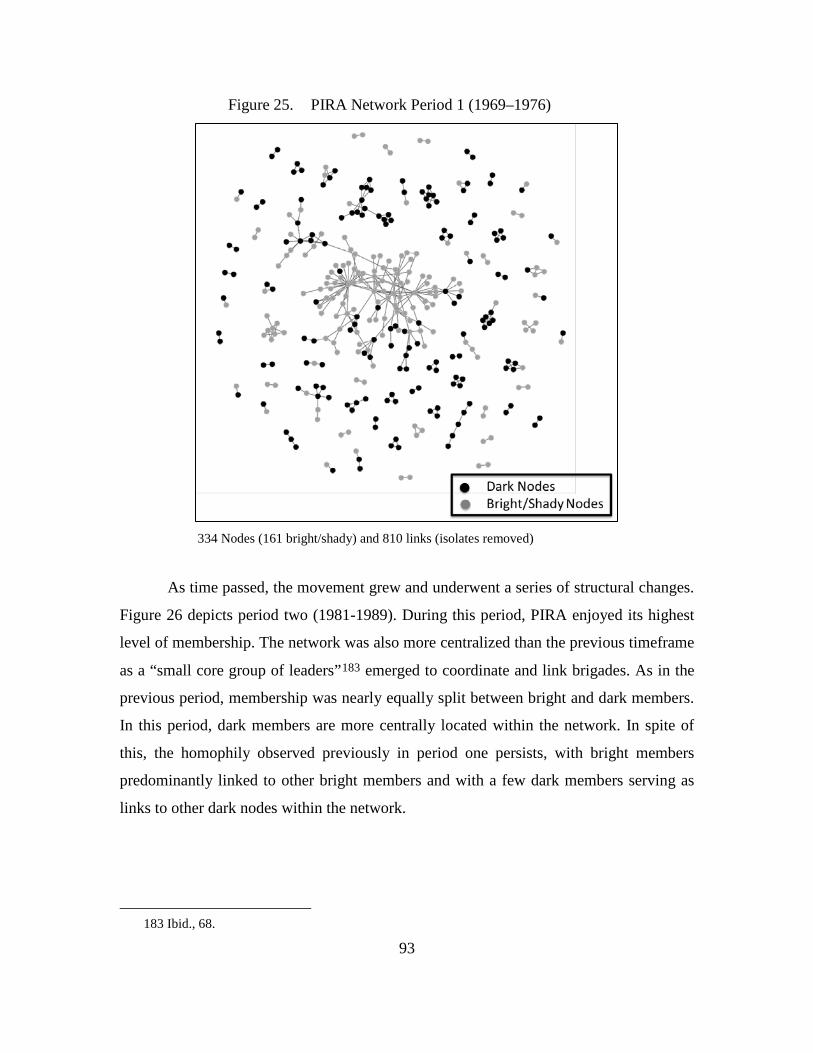
93
Figure 25. PIRA Network Period 1 (1969–1976)
334 Nodes (161 bright/shady) and 810 links (isolates removed)
As time passed, the movement grew and underwent a series of structural changes.
Figure 26 depicts period two (1981-1989). During this period, PIRA enjoyed its highest
level of membership. The network was also more centralized than the previous timeframe
as a “small core group of leaders”183 emerged to coordinate and link brigades. As in the
previous period, membership was nearly equally split between bright and dark members.
In this period, dark members are more centrally located within the network. In spite of
this, the homophily observed previously in period one persists, with bright members
predominantly linked to other bright members and with a few dark members serving as
links to other dark nodes within the network.
183 Ibid., 68.

94
Figure 26. PIRA Network Period 2 (1981–1989)
526 Nodes (268 bright/shady) and 2050 links (isolates removed)
Figure 27 depicts the network as it existed between 1990 and 1998. During this
final period, membership was concentrated within a central cluster. In this period the
percentage of dark nodes increased to replace bright entities as the majority percentage of
membership. In spite of this increase, dark nodes in period three were less centrally
located and less connected than they were during period two. The majority of dark nodes
in this period are linked to the network through connections with bright entities.
In period three the movement began a trend of decreasing membership. This
trend, coupled with a shift in focus towards the political arena, may have led to the
decrease in the number of attacks conducted during this time. In this case, the shift away
from violence may actually be reflective of Sinn Féin’s success; according to Audrey
Cronin, “sometimes terrorist attacks are seen as an effort to nudge the flow of history
further in one’s direction. If history is moving along the right way (and at the right pace),

95
then the incentives for violent behavior decrease.”184 In the case of PIRA, the attacks of
the early 1990s may have provided the “nudge.” Cronin’s theory may help to explain
why in the early 1990’s violent attacks increased, even as negotiations gained traction.
By the latter half of the 1990’s, as political goals were met the incentive for violence
went away, resulting in a sharp decline in attacks observed in the final period, as depicted
in Figure 12 in Chapter V.
Figure 27. PIRA Network Period 3 (1990–1998)
83 nodes (46 bright/shady) 184 links (isolates removed)
Figure 28 depicts the brigade affiliation for all three periods observed. The figure
helps demonstrate the ties within brigades as well as their connection to the rest of the
movement. They also help to reveal how the changes in organizational structure were
represented within the brigades. Data supports the fact that the Antrim brigade had the
majority of the senior leadership w/in the movement, but individuals without brigade
184 Audrey Kunth Cronin, How Terrorism Ends: Understanding The Decline and Demise of Terrorist
Campaigns (Princeton and Oxford, Princeton University Press, 2009), 105.

96
affiliation maintained high levels of activity and responsibility within the network. Fifty
percent of senior leaders within non-violent groups were not affiliated with any brigade.
This result was unexpected. It is plausible that the percentage of unaffiliated leadership
was driven by external factors within the environment. Specifically, in order to protect
those leaders from being targeted by law enforcement. These non-affiliated (bright)
leaders avoided official membership while maintaining central roles within the
organization. Figure 28 provides a visualization of brigade affiliation within the network
for all three periods.

97
Figure 28. PIRA Network Brigade Affiliation
Table 8 presents the basic topographical measures of the PIRA network for all
three time periods. Centralization and violence do not appear to be correlated, based on
the data presented in the table. With the resolution of the violence occurring during this
period one might expect the statistics to be reversed, with more bright members and less
dark actors. Almost 2/3 of the actors in the last period were dark network members. In
period 1 there were almost twice as many attacks as there were members, but during the
second period when the movement was the largest, the number of attacks was higher per

98
year, but not as it related to membership, and by the last period the number of attacks
were half that of membership. Centralization scores increase consistently through the
lifecycle of the network.
Although family ties are constant during all three periods, the other ties that are
attached to the network may have affected the higher centralization scores. Based on
observations of the Noordin Top network discussed earlier in this chapter, analysis
determined that embeddedness through family ties tends to introduce network subsets,
which are more cosmopolitan and decentralized in nature. PIRA history suggests that
while family ties provided a backbone for the network, through the course of its existence
and as time progressed, places of socialization such as churches, public houses and
shared incarceration experiences (prison) gave access to sub-networks that are more
prone to centralization, provincialization, and cross-cutting ties. The reliance on drinking
clubs by the social movement as a major source of finance is one indicator of their
importance. These may provide cross sectional linkages or interconnectivity that the
kinship ties do not, resulting in the increased centralization within the network as it
progresses through its history as depicted in Table 8.
Table 8. PIRA Network Topographical Measures

99
Throughout the movement British authorities treated PIRA sympathizers,
members, and Catholics in general, differently than other citizens of Ireland. Although
86% of the Catholics did not support violence as a means to produce political change,
British tactics such as 4am home searches, stop and frisk, internment, special
interrogation techniques, and convictions based on one witness, only served to foster
hatred for the authorities and more sympathy for the movement,.185 The fact is that
because of the close-knit communities, everyone encountered PIRA in some way, even if
they were not members. According to John Soule, PIRA was often used as a
neighborhood police force to settle disputes and punish crimes within the Catholic
community; drinking clubs were often owned and operated by PIRA sympathizers or
financiers; and PIRA financially supported the families of jailed Catholics.186 With
authorities alienating the populace and PIRA generating sympathy for its cause, it is no
wonder the movement lasted for 30 years.
The preceding sections have explored the differential effects of embeddedness on
network structure and behavior. As was observed in chapter IV, the outcomes of
embeddedness do not appear to be structurally determinate. Analysis within this chapter
suggests that embeddedness may be an early contributor to organizational growth, and
that some of the structural effects observed in Chapter V may be associated with dark
networks mirroring the structure of constituent parts. The following chapter will discuss
the implications of these findings as well as those of Chapter V.
185 John W. Soule, “Problems in Applying Counterterrorism to Prevent Terrorism: Two Decades of
Violence in Northern Ireland Reconsidered,” 31–32.
186 Ibid., 38–40.

100
THIS PAGE INTENTIONALLY LEFT BLANK

101
VII. INFERENCES FROM THE STUDY OF DARK NETWORK EMBEDDEDNESS
This chapter synthesizes the findings of the two previous analytic chapters and
offers insights and recommendations based on noteworthy research observations. This
chapter is divided in to four sections encompassing general findings, methodological
implications, areas for future research, and operational applications.
A. GENERAL FINDINGS
This thesis sought to answer the question the question, what is the nature of the
relationship between social embeddedness, organizational behavior, and structural
efficiency within dark networks? Overall, the analysis does not appear to confirm the
initial hypothesis that embeddedness is positively correlated with structural efficiency
within dark networks. This thesis used group E-I index as a measurement of
embeddedness and centralization and density as a factor of efficiency.187 In examining
the linkages between dark networks and society this thesis found no consistent
relationship between social embeddedness and structural efficiency within contested
covert organizations. Its findings were also inconclusive in terms of embeddedness’s
effect on organizational behavior or activities, though embedded relationships do appear
to impact recruitment and mobilization.
In regards to comparing qualitative and quantitative methods, this thesis observed
that combined, the approaches used provide superior diagnostic capability than either
approach used alone. In one example, combining measurements of deviations in
topographic measures between real and simulated network observations over time with
contextual clues, contributed to understanding observed E-I index variations by linking
spikes in embeddedness to periods immediately following actions by security forces. In
another example meta-network analysis provided a potential explanation for the observed
negative correlation between E-I index and centralization. Simulation results also helped
187 Due to variations in network size, average degree centrality is used as a proxy measurement for
density for the majority of this thesis.

102
distinguish endogenous network dynamics from exogenous shocks that affect network
evolution.
After comparing the results and efficacy of the individual analytic methods used,
this thesis found that qualitative and quantitative approaches produced varied, though,
complimentary results. The statistical approach tended to be more effective in identifying
the differential relationship between embeddedness and structural efficiency but less
effective in explaining it. This limitation was amplified in instances where inter-case
study results differed. In contrast, qualitative social movement theory (SMT), and social
network analysis (SNA) consistently provided nuanced descriptions and explanations for
changes in organizational structure and behavior although they were highly reliant on
statistical means in terms of quantifying those changes and their effects.
B. ENABLING EFFECTS OF EMBEDDEDNESS
Embeddedness does not appear to be unconditionally related to structure or
behavior; however, the analysis did reveal a number of areas where embedded ties appear
to contribute towards operational rather than structural efficiency: initial mobilization,
and finance. Across all three cases embedded linkages formed through preexisting
associational networks or kinship groups and played important roles in early recruitment
and mobilization. Ties to shady organizations and prison networks served in a similar
capacity. In the case of the Southeast Asian Foreign Fighter Facilitation (FFF) network
and the Provisional Irish Republican Army (PIRA), embedded linkages played an
ongoing role in contributing to finance and movement growth. Financial support from
bright ties varied across datasets and included religious charities, humanitarian
organizations, and public donations.188 Although these associational networks and
organizations sometimes fell under the management of “dark” members, there are
multiple examples such as NORAID in which bright financiers operated autonomously
from their supported networks.189
188 John W. Soule, “Problems in applying counterterrorism to prevent terrorism: Two decades of
violence in Northern Ireland reconsidered,” 38, 39.
189 Ibid.

103
In addition to the broad contributions towards operational efficiency discussed
previously, links to bright entities also appear to have contributed towards the operational
efficiency of dark networks by allowing them the ability to conduct business through the
convenience of public channels. In other instances, these connections appear to have
contributed to security in the way of members providing shelter to fugitives or
performing low risk tasks; however, available data was insufficient to allow for a
conclusive determination on the magnitude and consistency of these contributions.
C. QUANTITATIVE METHODS
This thesis combined correlational analysis and permutation testing in an attempt
validate existing social network paradigms. Many of the conceptual theories used in SNA
have not been tested beyond the theoretical level. Although the methodology utilized in
this study did not support the initial hypothesis, it allowed for the rigorous testing of a
relationship that has not been fully examined from a practitioner’s perspective. Output
measures from the permuted networks illustrate that empirically observed relationships
vary from those of permuted networks. This suggests that sociological or environmental
factors likely do play a role in shaping network structure.
Contextual analysis suggests that exogenous factors such as the security
environment or intra-network conflict introduce a number of variables that significantly
limit objective evaluation of the relationship between structure and dark network
performance. Without the simulation results, this observation would not be substantiated.
It also suggests that structural efficiency may be both situationally dependent and
sensitive to external forces. For example, actions conducted by security forces may
introduce countervailing influences on network efficacy when members of an
organization are arrested or have positive effects on efficiency when their actions alienate
said forces from the population as was observed in the case of the PIRA. These factors
impact the ability to normalize a movement to a degree in which predictive analysis is
practicable.

104
D. AREAS OF FUTURE RESEARCH
This thesis has illuminated several interesting similarities among all three case
studies and in doing so revealed two areas in which further research may be warranted.
Those areas are the roles of associational prison networks in dark network operations and
the varying effects of embedded ties.
1. Prison Networks
As described previously, associational networks appear to provide a framework
which dark networks can exploit for recruitment and to mobilize support. Findings from
Chapter VI suggest that prison networks may play a role in insurgent mobilization. All
three networks used prison networks to support organizational objectives. According to
the International Crisis Group, prisons provide forums for intergroup association and
recruitment.”190 The Southeast Asian FFF, as well as the Noordin network, used state
controlled prisons to recruit, to translate and produce literature, and even create new
organizations through radicalization among unaffiliated inmates. ICG reports have gone
so far as to describe scenarios where, visitation has been allowed between inmates and
violent extremist affiliated individuals, some even while authorities were actively seeking
them. This was a common occurrence, and came up many times during our analysis. The
FFF network also used religious education as a pretense for meeting with other followers
within the prisons. Local imams were often brought in to provide religious instruction
that bordered on incitement to radicalization, all while inside the walls of these
facilities.191
The Irish prison network contributed to mobilization somewhat differently than
the Southeast Asian Network. For PIRA, prisons served not only as a forum for
recruitment, but also as a means to mobilize broader support. Sinn Féin, PIRA’s political
arm, used the appearance of unjust incarceration to garner public sympathy. By bussing
in the families of the interned and jailed, PIRA was able to generate propaganda and
proliferate hatred toward their British oppressors. In this way, family members of
190 “Indonesia: How Indonesian Extremists Regroup,” ICG Asia Report, no. 228 (July 2012), 1.
191 Ibid., 15.

105
detained individuals might also be motivated to join the movement. Additionally, due to
British detention standards, many arrests did not require proof of a crime. Incarceration
served as a galvanizing experience shared both by members of the movement and the
Irish Catholic community at large. Among PIRA’s members, imprisonment became a
badge of pride.192
In light of the extensive evidence linking associational prison networks with dark
networks operations, this thesis recommends further research into the dark network
prison network nexus. Future research in this vein may aid in illuminating associational
networks, which governments are in a unique position to monitor, disrupt, or influence.
2. Varying Effects of Embedded Ties
Quantitative analysis demonstrated that in some cases increased embeddedness
may have a negative effect on structural measures of efficiency. Factors revealed during
the course of analysis provide three possible explanations for these seemingly unexpected
results that may warrant future inquiry. The first hypothesis is that, to the degree a dark
network is embedded within a particular component of society, the structure of the dark
network will begin to mirror aspects of said component. In short, the negative correlation
observed may reflect endogenous structural characteristics of the bright supporting
network. In the example provided by Noordin case, the kinship network was markedly
more decentralized than the associational friendship or schoolmates networks, and over
time it was increasingly drawn upon as a source of membership, thus reducing the net
centralization of the larger group. A second hypothesis is that the extreme levels of
contestedness faced by each of the dark networks limited the organizations from
capitalizing on embedded security gains by way of improving structural efficiency. A
third possibility is that existing theoretical assumptions about the roles that network
centralization and density may overstate the importance of structure in determining
organization performance. Much of the SNA research in security studies to date the topic
of structure and performance has been theoretical and has not rigorously tested for causal
192 John W. Soule, Problems in applying counterterrorism to prevent terrorism: Two decades of
violence in Northern Ireland reconsidered, Terrorism, Volume 12:1, Taylor and Francis, UK, 1989, 39.

106
linkages between the two variables nor has it normalized for the effect of endogenous and
exogenous factors.
E. OPERATIONAL AND POLICY APPLICATIONS
This thesis notes that the most observable effects of embeddedness on dark
network performance were in the areas of mobilization and recruitment. In light of this
observation this thesis recommends that intelligence and security professionals faced with
the prospect of combatting an emergent dark organizations, look to identifying and
monitoring relevant preexisting associational bright networks. Developing a working
understanding of where dark networks emerge from can aid in stemming the growth of
said networks and contribute to the development of strategies to disrupt dark network
operations. This could have significant implications on fighting the foreign fighter
networks active in South East Asia. Instead of focusing only on fighters themselves,
network illumination should also shed light on bright facilitator nodes and ties.
This thesis also observes that embedded associational linkages contribute most
directly to mobilization and recruitment early on, and that over time connections based on
public forms of interaction may be surpassed by relationships that may be more difficult
to observe or influence, such as friendship or kinship networks. It follows, that the most
effective moment to intervene against preexisting networks is early on. Failure to do so in
a network’s formative period may result in lost opportunities later on.
107
LIST OF REFERENCES
Abuza, Zachary. “Al Qaeda Comes to Southeast Asia.” In Terrorism and Violence in Southeast Asia: Transnational Challenges to States and Regional Stability, edited by Paul J. Smith, New York: Routledge, September 2004.
———. Balik-Terroism: the Return of Abu Sayyaf. The Strategic Studies Institute, 2005.
———.Militant Islam in Southeast Asia: Crucible of Terror. Boulder: Lynne Rienner Publishers, 2003.
———. “Tentacles of Terror: Al Qaeda’s Southeast Asian Network.” Contemporary Southeast Asia 24, no. 3 (12, 2002): 427–465.
Barabási, Albert-Laszlo and Eric Bonabeau. “Scale-Free Networks.” Scientific American, May 2003: 60–69.
Brafman, Ori, and Rod A. Beckstrom. The Starfish and the Spider. New York: Portfolio/Penguin Group, 2006.
Brandon, James. “Syrian Recruitment and Iraqi Jihads Prompt Increased Recruitment and Activism in Southeast Asia,” Combating Terrorism Center Sentinel, 7 no. 10, October 2014.
Cronin, Audrey. How Terrorism Ends: Understanding The Decline and Demise of Terrorist Campaigns. Princeton and Oxford: Princeton University Press, 2009.
Department of the Army. Insurgencies and Countering Insurgencies (FM 3–24). Washington, DC: Department of the Army, June 2014.
Emirbayer, Mustafa, and Jeff Goodwin. “Network Analysis, Culture and the Problem of Agency.” American Journal of Sociology 99, no. 6 (May 1994): 1411–1454.
Enders, Walter, and Paan Jindapon. "Network externalities and the structure of terror networks," Journal of Conflict Resolution 1, no. 19 (2009), doi: 10.1177/0022002709355439
Everton, Sean F., Disrupting dark networks. Cambridge University Press, New York: 2012.
———."Network Topography, Key Players and Terrorist Networks." Connections 1, no. 32 (June 2012): 12-19.
Everton, Sean F., and Dan Cunningham. “Detecting Significant Changes in Dark Networks.” Behavioral Sciences of Terrorism and Political Aggression 5, no. 2: 94–114.

108
———. “Terrorist Network Adaptation to a Changing Environment,” in Crime and Networks, edited by Carlo Morselli (New York: Routledge, 2014, 287–308.
———. “Dark Network Resilience in a Hostile Environment: Optimizing Centralization and Density” Criminology, Criminal Justice Law, & Society 16, no. 1 (2015): 1-20.
Gill, Paul, Jeongyoon Lee, Karl R. Rethemeyer, John Horgan, and Victor Asal. “Lethal Connections: The Determinants of Network Connections in the Provisional Irish Republican Army, 1970–1998.” International Interactions 40, no. 1 (2014): 52–78.
Gill, Paul, and John Horgan. “Who Were the Volunteers? The Shifting Sociological and Operational Profile of 1240 Provisional Irish Republican Army Members.” Terrorism and Political Violence 25:3, (2013): 435-456. doi: 10.1080/09546553.2012.664587
Gould, Roger V., “Multiple Networks and Mobilization in the Paris Commune, 1871.” American Sociological Review Vol. 56, No. 6 (December 1991): 716–729.
Granovetter, Mark. “Economic Action and Social Structure: The Problem of Embeddedness.” American Journal of Sociology Vol. 91, (November 1985): 481.
———. “The Strength of Weak Ties”. American Journal of Sociology, (1973):1360-1380.
Gregory, Kathryn. Provisional Irish Republican Army (IRA) (aka, PIRA, “the provos,” Óglaigh na hÉireann) (UK separatists). Council on Foreign Relations, March 16, 2010.
Gross, Max. A Muslim Archipelago. National Defense Intelligence College, Washington, DC (2007).
Grynkewich, Alexus G. “Welfare as Warfare: How Violent Non-state Groups Use Social Services to Attack the State.” Studies in Conflict & Terrorism 31, no. 4 (2008): 350–370.
Hanneman, Robert A., and Mark Riddle. Introduction to social network methods. Riverside, CA: University of California Riverside, 2005.
Hegghammer, Thomas. “The Rise of Muslim Foreign Fighters: Islam and the Globalization of Jihad.” International Security 35, no. 3 (2010): 53–94.
Hwang, Julie C., and Noor Huda Ismail. “There and Back Again: Indonesian Fighters in Syria.” Middle East Institute, 27 January 2015.

109
Institute for Policy Analysis of Conflict. “Evolution of ISIL,” IPAC Report no. 13, (24 September 2014).
———. “Support for ‘Islamic State’ in Indonesian Prisons,” IPAC Report No. 15, (19 January 2015).
“Indonesia Backgrounder: How the Jemaah Islamiyah Terrorist network Operates.” ICG Asia Report 43(December 2002).
———. “Indonesia: Al-Qaeda in Southeast Asia: The case of the “Ngruki Network” in Indonesia.” ICG Indonesia Briefing (8 August 2002 /Corrected 10 January 2003).
———. “Indonesia: Darul Islam's Ongoing Appeal.” ICG Asia Briefing (Aug 2010).
———. “Indonesia: From Vigilantism to Terrorism in Cirebon.” ICG Asia Briefing 132 (January 2012).
———. “Indonesia: How Indonesian Extremists Regroup.” ICG Asia Report 228(July 2012).
———. “Indonesia: Jemaah Islamiyah in South East Asia: Damaged But Still Dangerous.” ICG Asia Report 63(August 2003/ Corrected March 2015).
———. “Indonesia: Jemaah Islamiyah’s Publishing Industry.” Asia Report 147 (February 2008).
———. “Indonesia: Jihadi Surprise in Aceh.” ICG Asia Report 189 (April 2010).
———. “Indonesia: Noordin Top’s Support Base.” ICG Asia Briefing 95 (August 2009).
———. “Indonesia: Radicalization of the “Palembang Group.” ICG Asia Report 92 (May 2009).
———. “Indonesia: The Dark Side of Jama’ah Ansharut Tauhid (JAT).” ICG Asia Briefing 107(July 2010).
———. “Terrorism in Indonesia: Noordin’s Networks.” ICG Asia Report 114 (May 2006).
Jasparro, Christopher. “Geographic Perspectives on the Sociocultural, Economic, and Demographic Aspects of Counterterrorism.” In Essentials of Counterterrorism edited by James J. F. Forest, Santa Barbara, CA: ABC-CLIO Incorporated, 2015.
Krackhardt, David. “Graph Theoretical Dimensions of Informal Organizations.” Computational Organization Theory 89, no. 112 (1994): 123-140.

110
McAdam, Doug. “Beyond Structural Analysis.” In Social Movements and Networks: Relational Approaches to Collective Action, edited by Mario Diani and Doug McAdam, 281. New York: Oxford University Press, 2003.
———. “High-Risk Activism: The Case of Freedom Summer.” American Journal of Sociology Vol. 92, No. 1 (Jul., 1986): 64–90.
McCary, John A. “The Anbar Awakening: An Alliance of Incentives.” Washington Quarterly, 32, no.1 (2009): 43–59, DOI: 10.1080/01636600802544905.
McCulloh, Ian, and Kathleen M. Carley. “Detecting Change in Longitudinal Social Networks”. Military Academy West Point NY Network Science Center (NSC), 2011.
McMillan, Joseph. Mark Tessler, Steven N. Simon, C. C. Fair, Caroline F. Ziemke, Kumar Ramakrishna, Scott Atran, Peter W. Singer, and Hady Amr. “In the same light as slavery: Building a global antiterrorist consensus.” National Defense University Washington, DC Institution for National Strategic Studies, 2006.
Milward, Brinton H., and Jörg Raab. “Dark Networks as Problems.” Journal of Public Administration Research and Theory 13, no. 4 (2003): 413–439.
———. “Dark Networks as Organizational Problems: Elements of a Theory.” International Public Management Journal (2006): 333–360.
Morselli, Carlo, and Cynthia Giguere. “Legitimate strengths in criminal networks.” Inside Criminal Networks: Crime, Law and Social Change 45, no. 3 (2006): 185–200.
Passy, Florence. “Social Networks Matter. But how?.” In Social Movements and Networks: Relational Approaches to Collective Action (Comparative Politics), Edited by Mario Diani and Doug McAdam, 23. Oxford and New York: Oxford University Press, 2003.
Raab, Jörg, and H. Brinton Milward. “Dark networks as problems.” Journal of Public Administration Research and Theory 13, no. 4 (2003): 413–439.
Ressa, Maria. Seeds of terror: An eyewitness account of Al-Qaeda’s newest center of operations in Southeast Asia. New York: Free Press, 2003.
Richey, Warren. “On the trail of US funds for IRA.” The Christian Science Monitor, Jan 14, 1985. http://www.csmonitor.com/1985/0114/anor1.html
Sageman, Marc. Understanding Terror Networks. Philadelphia: University of Pennsylvania Press, 2009.
Santos, Soliman M., Jr. and Paz Verdades M. Santos “Jemaah Islamiyah (JI) and Other Indonesian/Malaysian Jihadi Groups.” In Primed and Purposeful: Armed Groups

111
and Human Security Efforts in the Philippines.” Edited by Diana Rodriguez, Small Arms Survey Graduate Institute of International and Development Studies, Geneva, Switzerland, 2010.
Snow, David A., Louis A. Zurcher Jr., and Sheldon Ekland-Olson. “Social networks and Social Movements: A Microstructural Approach to Differential Recruitment.” American Sociological Review (1980): 787–801.
Soule, John W.. “Problems in Applying Counterterrorism to Prevent Terrorism: Two Decades of Violence in Northern Ireland Reconsidered,” Terrorism Vol. 12, (1989).
Van Bruinessen, Martin. “Genealogies of Islamic radicalism in post-Suharto Indonesia.” Southeast Asia Research, 10, no.2, 2002.
Wasserman, Stanley, and Katherine Faust. Social Network Analysis: Methods and Applications. Cambridge, UK: Cambridge University Press, 1994.
United Nations Security Council. Hilal Ahmar Society Indonesia (HASI). (QDe.14). March 2015. http://www.un.org/sc/committees/1267/NSQDe147E.shtml
U.S. Department of the Treasury. Treasury Designates Twelve Foreign Terrorist Fighter Facilitators.” 24 September 2014. https://www.treasury.gov/press-center/press-releases/Pages/jl2651.aspx.

112
THIS PAGE INTENTIONALLY LEFT BLANK

113
INITIAL DISTRIBUTION LIST
1. Defense Technical Information Center Ft. Belvoir, Virginia 2. Dudley Knox Library Naval Postgraduate School Monterey, California