neighbourhood financial health index -...
TRANSCRIPT

TORONTO 2014
Neighbourhood Financial Health Index
PROFILE OF
Canadian Council on Social DevelopmentConseil canadien de développement social
Canadian Council on Social DevelopmentConseil canadien de développement social
2 Neighbourhood Financial Health Index Prosper Canada | CCSD
Liquid Assets
Real Estate
Neighbourhood Poverty
Neighbourhood Financial Health Index
1
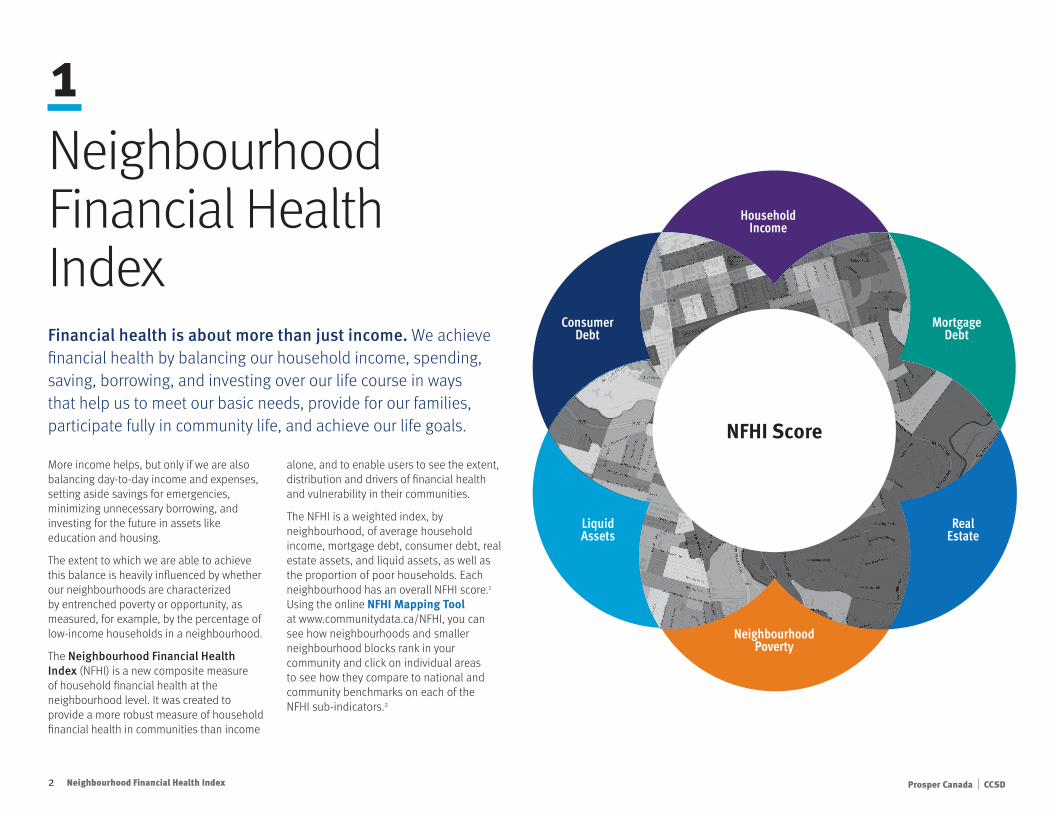
Financial health is about more than just income. We achieve financial health by balancing our household income, spending, saving, borrowing, and investing over our life course in ways that help us to meet our basic needs, provide for our families, participate fully in community life, and achieve our life goals.
More income helps, but only if we are also balancing day-to-day income and expenses, setting aside savings for emergencies, minimizing unnecessary borrowing, and investing for the future in assets like education and housing.
The extent to which we are able to achieve this balance is heavily influenced by whether our neighbourhoods are characterized by entrenched poverty or opportunity, as measured, for example, by the percentage of low-income households in a neighbourhood.
The Neighbourhood Financial Health Index (NFHI) is a new composite measure of household financial health at the neighbourhood level. It was created to provide a more robust measure of household financial health in communities than income
alone, and to enable users to see the extent, distribution and drivers of financial health and vulnerability in their communities.
The NFHI is a weighted index, by neighbourhood, of average household income, mortgage debt, consumer debt, real estate assets, and liquid assets, as well as the proportion of poor households. Each neighbourhood has an overall NFHI score.1 Using the online NFHI Mapping Tool at www.communitydata.ca/NFHI, you can see how neighbourhoods and smaller neighbourhood blocks rank in your community and click on individual areas to see how they compare to national and community benchmarks on each of the NFHI sub-indicators.2
Mortgage Debt
Consumer Debt
Household Income
NFHI Score
3 Neighbourhood Financial Health Index Prosper Canada | CCSD
23%29%
9%
58% 9%10%ABOVE NATIONAL BENCHMARK
BELOW NATIONAL BENCHMARK
Toronto’s Financial Health
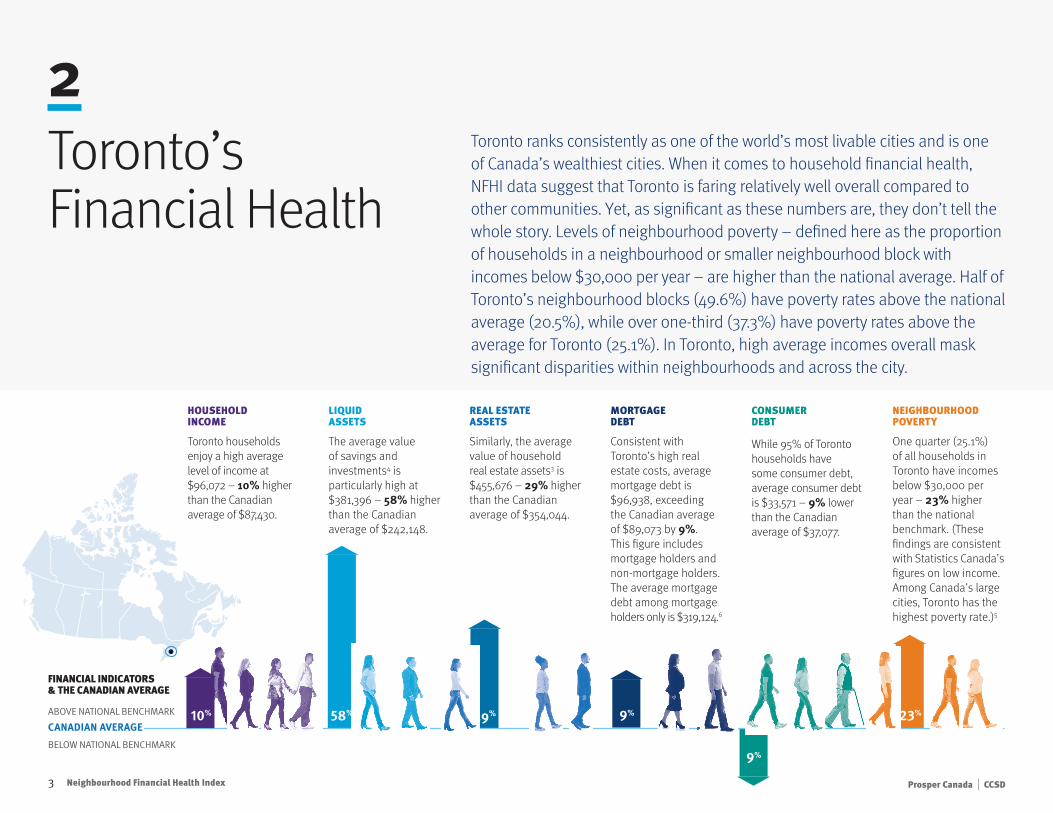
2Toronto ranks consistently as one of the world’s most livable cities and is one of Canada’s wealthiest cities. When it comes to household financial health, NFHI data suggest that Toronto is faring relatively well overall compared to other communities. Yet, as significant as these numbers are, they don’t tell the whole story. Levels of neighbourhood poverty – defined here as the proportion of households in a neighbourhood or smaller neighbourhood block with incomes below $30,000 per year – are higher than the national average. Half of Toronto’s neighbourhood blocks (49.6%) have poverty rates above the national average (20.5%), while over one-third (37.3%) have poverty rates above the average for Toronto (25.1%). In Toronto, high average incomes overall mask significant disparities within neighbourhoods and across the city.
CANADIAN AVERAGE
FINANCIAL INDICATORS & THE CANADIAN AVERAGE
HOUSEHOLD INCOME
Toronto households enjoy a high average level of income at $96,072 – 10% higher than the Canadian average of $87,430.
LIQUID ASSETS
The average value of savings and investments4 is particularly high at $381,396 – 58% higher than the Canadian average of $242,148.
REAL ESTATE ASSETS
Similarly, the average value of household real estate assets3 is $455,676 – 29% higher than the Canadian average of $354,044.
MORTGAGE DEBT
Consistent with Toronto’s high real estate costs, average mortgage debt is $96,938, exceeding the Canadian average of $89,073 by 9%. This figure includes mortgage holders and non-mortgage holders. The average mortgage debt among mortgage holders only is $319,124.6
CONSUMER DEBT
While 95% of Toronto households have some consumer debt, average consumer debt is $33,571 – 9% lower than the Canadian average of $37,077.
NEIGHBOURHOOD POVERTY
One quarter (25.1%) of all households in Toronto have incomes below $30,000 per year – 23% higher than the national benchmark. (These findings are consistent with Statistics Canada’s figures on low income. Among Canada’s large cities, Toronto has the highest poverty rate.)5
4 Neighbourhood Financial Health Index Prosper Canada | CCSD
26% 58%15%$381,396$242,148
32% 57%11%$37,077$33,571
NATIONALBENCHMARK
BELOWBENCHMARK
BETWEENBENCHMARKS
ABOVEBENCHMARK
COMMUNITYAVERAGE
52% 32%16%$455,676$354,044
38% 52%10%$96,072$87,430
53% 42%6%$96,978$89,073
37% 50%12%25%21%
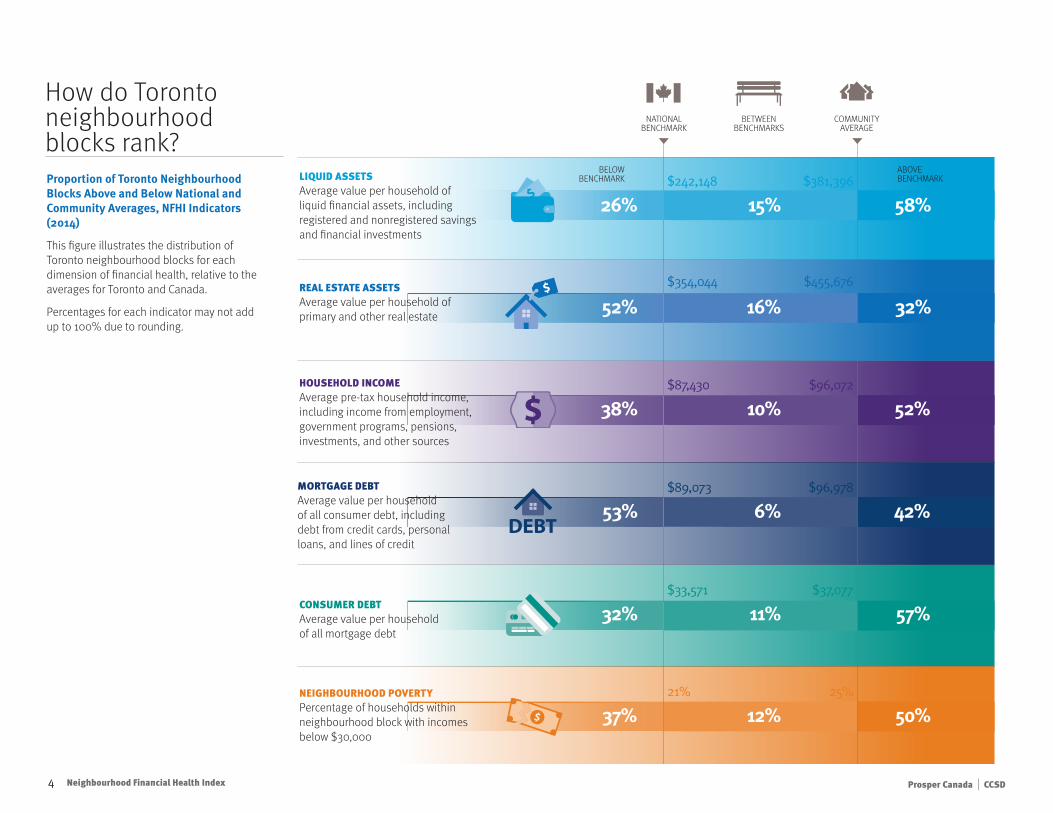
Proportion of Toronto Neighbourhood Blocks Above and Below National and Community Averages, NFHI Indicators (2014)
This figure illustrates the distribution of Toronto neighbourhood blocks for each dimension of financial health, relative to the averages for Toronto and Canada.
Percentages for each indicator may not add up to 100% due to rounding.
How do Toronto neighbourhood blocks rank?
LIQUID ASSETS Average value per household of liquid financial assets, including registered and nonregistered savings and financial investments
REAL ESTATE ASSETS Average value per household of primary and other real estate
MORTGAGE DEBT Average value per household of all consumer debt, including debt from credit cards, personal loans, and lines of credit
CONSUMER DEBT Average value per household of all mortgage debt
HOUSEHOLD INCOME Average pre-tax household income, including income from employment, government programs, pensions, investments, and other sources
NEIGHBOURHOOD POVERTY Percentage of households within neighbourhood block with incomes below $30,000

5 Neighbourhood Financial Health Index Prosper Canada | CCSD
Profiles of neighbourhood financial health and vulnerability7
3
Living large
Neighbourhood blocks with high income, high wealth and high debt
• Five per cent of Toronto neighbourhood blocks (189 of 3,780) have high levels of income and of wealth (real estate assets and liquid assets).
• Thirteen per cent (480) report high income and above average levels of wealth for Toronto.
• These areas tend to carry sizeable mortgages and credit card balances – but they have the financial resources to manage their debt loads.8 Examples: Areas in Banbury-Don Mills; Rosedale-Moore Park; Princess-Rosethorn.
Constrained
Neighbourhood blocks with low income, low wealth and (in most cases) low debt
• Toronto’s lower income areas, by contrast, report low levels of wealth and relatively low levels of mortgage and consumer debt compared to higher income areas.
• Overall, 34% of Toronto neighbourhood blocks (1,238) have low incomes, low real estate assets, and below average liquid assets.
• Fifteen percent of this group (187) also struggle with above average consumer debt and 15% (179) labour under above average mortgage debt.
• Five per cent of this group (62% neighbourhood blocks) have above average consumer and mortgage debt. Examples: Areas in Englewood-Lawrence; York University Heights; and Clairlea-Birchmount.
Living precariously
Neighbourhood blocks with low saving and high debt
• Household debt is a key risk factor for poor financial health.
• Forty-three per cent of Toronto neighbourhood blocks (1,579) carry above average consumer debt, while 53% (1,930) report above average mortgage debt.
• One-third (1,193) fall into both of these groups.
• The combination of low assets and high debt place households – and neighbourhoods – at particular risk.
• Of the areas with below average real estate and liquid assets, 1,106 (30% of all) have above average mortgage debt and 543 (or 15% of all) also carry above average consumer debt.
OK but vulnerable
Neighbourhood blocks with adequate incomes, limited assets, and mortgage debt
• Like areas that score in the bottom 20% of the NFHI, the vast majority of neighbourhood blocks in the middle 60% (83% or 1,833) report liquid assets below the Toronto community average.
• Ninety-four per cent (2,079) report below average real estate holdings.
• These areas have higher average household incomes than lower income areas, but are two and a half times more likely to experience above average mortgage debt (53% vs. 21%) and over 200 neighbourhood blocks carry very high mortgage debt.
• These are the communities that will be especially vulnerable if and when interest rates rise.Examples: Areas in Malvern and Rouge.
Limited assets
Neighbourhood blocks with below average liquid and real estate assets
• Toronto has a large population of renters,9 so many areas in the low to middle NFHI quintiles have comparatively low or negligible real estate holdings.
• A majority (54%) of neighbourhood blocks in the bottom 60% of the NFHI (almost 1,200) have low real estate holdings.
• As well, almost three-quarters (72% or 2,657) of all neighbourhood blocks have below average liquid assets. For two-thirds of this group (66% or 1,780), the value of their savings and investments is less than 50% of the Toronto average of $381,396.
• These areas have fewer assets to help offset unexpected expenses and interruptions to their income, or to invest for their future.

6 Neighbourhood Financial Health Index Prosper Canada | CCSD
Neighbourhood blocks by income quintile and how they score on NFHI indicators
REAL ESTATE ASSETS BY INCOME QUINTILES
LIQUID ASSETS BY INCOME QUINTILES
CONSUMER DEBT BY INCOME QUINTILES
MORTGAGE DEBT BY INCOME QUINTILES
LOW LOW LOW LOWMEIDUM/LOW MEIDUM/LOW MEIDUM/LOW MEIDUM/LOWMEDIUM/HIGH MEDIUM/HIGH MEDIUM/HIGH MEDIUM/HIGHHIGH HIGH HIGH HIGH
MIDDLE 60% BY INCOME
MIDDLE 60% BY INCOME
MIDDLE 60% BY INCOME
MIDDLE 60% BY INCOME
53.5% 0% 1.7% 3.2%40.9% 83.2% 56.3% 44%4.4% 15.5% 33.1% 42.7%1.2% 1.2% 8.9% 10%
TOP 20% BY INCOME
TOP 20% BY INCOME
TOP 20% BY INCOME
TOP 20% BY INCOME
8.7% 0% 0.3% 0.5%34.7% 24.1% 31.7% 15.9%23.4% 42.3% 35.5% 37.7%33.2% 33.6% 32.5% 45.9%
BOTTOM 20% BY INCOME
BOTTOM 20% BY INCOME
BOTTOM 20% BY INCOME
BOTTOM 20% BY INCOME
VULNERABLE POPULATION
VULNERABLE POPULATION VULNERABLE
POPULATIONVULNERABLE POPULATION
90.6% 0% 14.6% 23%8.6% 94.8% 64.6% 56.1%0.8% 4.9% 15.4% 16.7%0% 0.3% 5.4% 4.2%

7 Neighbourhood Financial Health Index Prosper Canada | CCSD
Measuring neighbourhood disparities
4The Neighbourhood Financial Health Index brings a new lens to the conversation about financial well-being and prosperity in Toronto – providing an opportunity to assess and compare average household income, wealth, debt and poverty levels across diverse neighbourhoods and smaller areas. NFHI findings confirm that significant disparities in financial health exist between neighbourhood blocks at the top and the bottom of the NFHI scale – disparities that are not immediately evident in the overall averages for the city.
HIGHLIGHTS
There are large disparities in asset levels when you compare Toronto’s wealthiest and poorest areas – highlighting the need to pay attention to growing disparities in wealth, not just income. The average value of real estate assets in the top 10% of neighbourhood blocks by NFHI score is eight times greater than the value of real estate in neighbourhood blocks in the bottom 10% –$1,449,675 versus $178,989. At the same time, the average value of liquid assets is almost 18 times higher among the top 10% compared to the lowest – $2,006,492 versus $110,030.
Neighbourhood blocks with the highest NFHI scores carry higher levels of mortgage debt than those with the lowest scores, as wealthier households tend to purchase more costly real estate. That said, the mortgage debt gap between areas at the top and the bottom of the NFHI is much smaller than the gap in real estate assets, as the high cost of real estate has driven up mortgage debt across all of Toronto.
The difference between the top and the bottom deciles with respect to consumer debt is also smaller. On average, neighbourhood blocks in the bottom 10% by NFHI score – the most financially vulnerable group – report $23,462 of consumer debt compared to $58,057 among the areas in the top 10%.
Financial Health
Comparison of top 10% of Toronto neighbourhood blocks by NFHI score to the bottom 10%
BOTTOM 10% OF TORONTO NEIGHBOURHOOD BLOCKS
TOP 10% OF TORONTO NEIGHBOURHOOD BLOCKS
8xReal Estate
Assets
5xMortgage
Debt
2xConsumer
Debt
6xHousehold
Income
18xLiquid Assets

8 Neighbourhood Financial Health Index Prosper Canada | CCSD
1.5+
Dealing with debt
5Aided by record-low interest rates, growth in household debt has been outpacing income for many years.11 For all of Toronto, the average debt-to-income ratio is 140%. In other words, for every $1 of total income, households owe $1.40 of mortgage and consumer debt. Four in ten Toronto neighbourhood blocks – more than 1,500 – have ratios of 150% or higher and, in 12% of all neighbourhood blocks, the total debt-to-income ratio is greater than 200%. The consumer debt-to-income ratio clearly shows the burden of debt on vulnerable households.
DISTRIBUTION OF NEIGHBOURHOOD BLOCKS
BY TOTAL DEBT TO TOTAL INCOME RATIO 2014
+ ÷
55% OWN
45% RENT
56% WITH MORTGAGE
44% WITHOUT MORTGAGE
Consumer debt represents over half of average household income in neighbourhood blocks in the bottom 10% of the NFHI, but only 21% of average incomes in the top 10%.
Mortgage debt, by contrast, weighs more heavily on the middle 60% of neighbourhood blocks. Average mortgage debt in these blocks exceeds average annual income – reflecting the very high costs of housing in Toronto today.
Overall, Toronto households (including non-mortgage holders) owe $1.40 in mortgage debt for every dollar of household income. Average mortgage debt among mortgage holders is considerably higher at $319,124 and represents an even higher proportion of average household income.
39% 41%
DEBT RATIO 1.0-1.50-1.0
20%NEIGHBOURHOOD DISTRIBUTION

9 Neighbourhood Financial Health Index Prosper Canada | CCSD
Visit our interactive NFHI mapping tool online
6Communities around the world are using mapping tools to help them understand their community, clearly communicate their strengths and challenges, plan for the future, and mobilize action. The Neighbourhood Financial Health Index has been created to help community organizations, municipalities, and residents to explore the different dimensions and distribution of financial health in their community.
TORONTO NEIGHBOURHOOD BLOCKS (DAs) BY NFHI SCORE
Areas with high real estate and liquid assets
5.1%(189)
Areas with high mortgage and consumer debt
7.5%
(275)
Areas with high poverty
10.8%
(395)
To learn more about the extent and distribution of neighbourhood financial health and vulnerability in Toronto, please visit our interactive NFHI Mapping Tool at:
communitydata.ca/NFHI
This will enable you to take a closer look at each neighbourhood block to see how well it scores against national and community benchmarks on all of the sub-indicators of financial health. You can also see mapped data for each sub-indicator, in addition to the NFHI.

10 Neighbourhood Financial Health Index Prosper Canada | CCSD
Project Team
7The NFHI was developed by the Canadian Council on Social Development and Prosper Canada with the generous assistance of the City of Toronto, United Way Toronto & York Region, Region of Peel, Region of York, Vibrant Communities Calgary, United Way Calgary, City of Calgary, FuseSocial Wood Buffalo, Environics Analytics, TD Bank Group, Community Foundations of Canada, Open Policy Ontario, and West Neighbourhood House.
More information about the development of the NFHI project and the Index methodology can be found in the NFHI Final Project Paper.
For more information: 1 NFHI indicators represent the weighted household average for the geographic units that make up the larger community. In this case, these are the Toronto Census Division which describes the municipality of the City of Toronto and smaller Dissemination Areas (areas of 400 to 700 residents defined by Statistics Canada). This profile uses the term “neighbourhood blocks” or “small areas” to refer to Dissemination Areas. This should not be confused with Toronto’s 140 social planning neighbourhoods that are comprised of several DAs, with populations ranging from 7,000 to 10,000. In total, there are 3,672 Dissemination Areas in the Toronto Census Division.
2 All data for the NFHI is based on Wealthscapes (vintage 2014), a database of financial statistics produced by Environics Analytics.
3 This figure includes households that own real estate and those that do not. According to Environics Analytics figures, 62.4% of Toronto households reported real estate assets. The average value of holdings among households reporting real estate was $729,800.
4 This figure includes households that report liquid assets and those that do not. According to Environics Analytics figures, 98.1% of Toronto households reported liquid assets of some type. The average value of holdings among households reporting liquid assets was $388,742.
5 Statistics Canada, CANSIM Table 111-0015.
6 According to Environics Analytics, one in three Toronto households (30.4%) carry mortgage debt.
7 The profile and types presented here are based on an analysis of the NFHI scores for each neighbourhood block sub-indicator, as compared to the average for the City of Toronto as a whole. Each score is categorized as “low” (more than one standard deviation below the community mean); “low-medium” (between one standard deviation below the community mean and the mean); “medium-high” (between one standard deviation above the community mean and the mean); and “high” (more than one standard deviation about the community mean). “Above-
average” includes all neighbourhood blocks above the Toronto average. “Below-average” includes all of those below the Toronto average. Neighbourhood blocks have also been divided into three income groups: Lower or modest income defined as neighbourhood blocks with average total incomes below $80,000/year; Middle income neighbourhood blocks with average incomes between $80,000 and $100,000/year; and High income neighbourhood blocks with average incomes above $100,000/year.
8 Of all high income neighbourhood blocks, 38.8% (488 DAs) report high mortgage debt, and 30.6% (385 DAs) report high consumer debt.
9 Like other large cities, Toronto has a large tenant population. According to the 2011 National Household Survey, 45.4% of Toronto households rented their accommodation – compared to the national benchmark of 30.6%.
10Neighbourhood blocks (DAs) are sorted according to their average NFHI score and then divided into 10 equal groups each containing 10% of all neighbourhood blocks.
11Hurst, Matt (2011). “Debt and family type in Canada.” Canadian Social Trends. No. 91. Summer. Statistics Canada Catalogue no. 11-008-X. p. 38-47.; Parliamentary Budget Office (2016), Household Indebtedness and Financial Vulnerability.
LEAD, COMMUNITY DATA PROGRAM
Canadian Council on Social Development [email protected] www.ccsd.ca www.communitydata.ca
MICHEL FROJMOVIC