nestlé 1998 management report
TRANSCRIPT

Nestlé 1998
Manag
ement R
eport
Brought to you by Global Reports

1
2 Letter to the shareholders5 Directors and Officers6 Key figures (consolidated)8 Key figures by management responsibilities
and geographic area9 Key figures by product group
Business review 10 General comments13 Sales14 Trading profit15 Net profit16 Capital expenditure16 Acquisitions and divestitures17 Financial position17 Shares, stock exchange18 Environment19 Nestlé and the Year 2000 problem20 Human Resources
Table of contents
Brought to you by Global Reports

Ladies and Gentlemen,
1998 was a difficult year for those areasof the world that were hit hard by eco-nomic and financial crises. These had anoticeable impact on certain emergingcountries in which our Company is pres-ent, and quite a few currencies depreci-ated substantially. Only the United Statescontinued to experience solid economicgrowth, while Western Europe saw aslight economic upturn.
For decades, Nestlé has had a unique global presence, and it was inevitable thatthe Company would be touched by the consequences of these crises. While the situ-ation in Asia was obvious, which allowed us to begin taking the necessary measuresin Autumn 1997, the collapse of the monetary system in Russia toward mid-1998, andthe effect felt in other countries, came as a surprise.
Our Company quickly took the necessary action and adapted its strategy to thenew circumstances. In contrast to other companies, we did not withdraw from theaffected countries, but instead intensified our efforts to broaden the appeal of ourbrands and to increase market share.
In this context, a real internal growth of 3.3% is a good performance. It shows thatour competitiveness continues to improve. As for the 2.5% growth of our consoli-dated sales, it was obtained despite the unfavourable evolution of foreign currenciesagainst the Swiss franc, which penalized our sales by 5.6%. The trading profit marginshows a slight decline of 0.2%, due to efforts made to maintain and increase our mar-ket share, as well as to the increase in some costs in markets affected by devaluation.This was the reason for the prudent profit forecast made in November 1998.
Our financial situation remains very healthy despite expenditure on acquisitions.Net profit shows a slight increase and remains at 6% of sales. It reflects a favourablebusiness development in spite of the often difficult economic environment and
2
Letter to the shareholders
Brought to you by Global Reports

also encompasses some one-time profits from the sales of various non-strategicbusinesses. Profit per share rose proportionately with net profit. Overall, we believethese results to be very satisfactory.
The growth of our business came mainly from the dynamism shown by the indus-trialized countries, especially the USA. This development proves that permanent inno-vation in all areas and an appropriate strategy can successfully overcome the prob-lems of mature markets and the intense competition associated with them. While ouroperations in Africa, in the Middle East and in some Latin American countries showedgood sales progress, we nevertheless had to face a number of dips in consumption inSouth-East Asia and in Eastern Europe. Our local management reacted decisively:adapting cost structures, changing the emphasis in our product range in order to takethe fall in purchasing power into account and maintaining presence on the market notonly allowed us to counter the slow-down in sales, but also to gain market share.These measures helped us to position ourselves so that we will fully benefit from theeconomic upswing that, in some countries at least, is becoming noticeable.
Virtually all of our activities contributed to our growth, with particularly goodresults in prepared dishes under the Stouffer’s brand, in mineral water, in pharmaceu-tical activities and in the breakfast cereals of our joint venture “Cereal Partners World-wide”. In the area of acquisitions, we continued to reinforce strategic businesses,such as mineral water and pet food. We also seized the opportunity to increase ourshareholding or to become sole owners of some of our operational units in Asia. Thisis consistent with our wish to be solely responsible for our businesses and will in thefuture simplify decision-making.
Our outlook for the current year is one of prudent optimism and we remain con-vinced that the Nestlé Group will continue seeing a favorable overall development inthe years to come.
At the close of a difficult business year which required much hard work and com-mitment from our management and our staff, we would like to thank them for theircontribution.
Vevey, March 25, 1999
Helmut O. Maucher Peter Brabeck-LetmatheChairman of the Board Chief Executive Officer
3
Brought to you by Global Reports

General Managers
From left to right: Francisco Castañer, Michael W.O. Garrett, Robert Raeber, Rupert Gasser,
Peter Brabeck-Letmathe, Philippe Véron, Mario A. Corti, Carlos E. Represas
4
Brought to you by Global Reports

Board of Directors of Nestlé S.A. Term expires1
� Helmut O. Maucher Chairman 2000� Rainer E. Gut Vice-Chairman 2001� Fritz Gerber Vice-Chairman 2001� Peter Brabeck-Letmathe Chief Executive Officer 2002� Vreni Spoerry 2002
Paul A. Volcker 2000Stephan Schmidheiny 2003Jean-Pierre Meyers 2001Robert Studer 2002Peter Böckli 2003David de Pury 2003Arthur Dunkel 1999Reto F. Domeniconi 2001
Secretary to the BoardBernard Daniel Secretary general
Auditors of the annual financial statementsof Nestlé S.A. and of the consolidated financialstatements of the Group
1999London and Zurich
1 On the date of the General Meeting of the Shareholders� Members of the Committee to the Board
Group Managementas of 31st December 1998
Peter Brabeck-LetmatheChief Executive OfficerDirect responsibilities:Nutrition Strategic Business Division
General Managers
Francisco CastañerPharmaceutical and Cosmetic Products,Liaison with L’Oréal, Human Resources,Corporate Affairs
Mario A. CortiFinance, Control, Legal, Tax, InformationSystems & Logistics, Purchasing, Export
Michael W. O. GarrettAsia, Oceania, Africa, Middle East
Rupert GasserTechnical, Production, Environment,Research & Development
Robert RaeberEurope
Carlos E. RepresasUnited States of America, Canada,Latin America
Philippe VéronStrategic Business Units, Mineral Water,Marketing
5
Directors and Officers
Klynveld Peat Marwick Goerdeler SA
Brought to you by Global Reports

In millions of Swiss francs (except for per share data) 1998 1997
Sales 71 747 69 998
Trading profit 7 100 7 057as % of sales 9.9% 10.1%
Net profit 4 291 4 182as % of sales 6.0% 6.0%as % of average equity 19.7% 21.9%
Expenditure on tangible fixed assets 3 061 3 261as % of sales 4.3% 4.7%
Equity (a) 23 024 20 606Market capitalisation, end December 117 328 86 124
Per shareNet profit Fr. 109.2 106.3Equity (a) Fr. 586 524Dividend Fr. 38.0 (b) 35.0
Personnel Number at year end 231 881 225 808Factories Number at year end 522 495
Principal key figures in US$ (c)
In millions of US$ (except for per share data) 1998 1997
Sales 51 991 48 274
Net profit 3 109 2 884
Equity (a) 16 684 14 211
Market capitalisation, end December 85 020 59 396
Per shareNet profit US$ 79.1 73.3Equity (a) US$ 425 361
6
Key figures (consolidated)
(a) Before proposed appropria-tion of profit of Nestlé S.A.(b) As proposed by the Board ofDirectors of Nestlé S.A.(c) Figures translated at the yearend rate.
Brought to you by Global Reports

Principal key figures in ECU(c)
In millions of ECU (except for per share data) 1998 1997
Sales 44 842 43 749
Net profit 2 682 2 614
Equity (a) 14 390 12 879
Market capitalisation, end December 73 330 53 828
Per shareNet profit ECU 68.3 66.4Equity (a) ECU 366 328
7
SalesIn millions of Swiss francs
Capital expenditureIn millions of Swiss francs
Trading profitIn millions of Swiss francs
Market capitalisationIn millions of Swiss francs
Net profitIn millions of Swiss francs
Dividends paidIn millions of Swiss francs
50000
55000
60000
65000
70000
75000
94 95 96 97 98
56894
5648460490
69998
71747
2900
3000
3100
3200
3300
3400
94 95 96 97 98
3029
3056
3054
3261
3061
5000
5500
6000
6500
7000
7500
94 95 96 97 98
5628
56586053
7057 7100
30000
50000
70000
90000
110000
130000
94 95 96 97 98
48786
50303
56518
86124
117328
2500
3000
3500
4000
4500
5000
94 95 96 97 98
3250
3078
3592
4182 4291
1000
1125
1250
1375
1500
1625
94 95 96 97 98
1040 1043
1180
1376
1498 (b)
Brought to you by Global Reports

SalesIn millions of Swiss francs 1998 1997 1996
FoodEurope 26 798 25 706 23 897Americas 22 563 22 262 18 046Africa, Asia and Oceania 12 429 13 493 11 458
Other activities 9 957 8 537 7 08971 747 69 998 60 490
ResultsIn millions of Swiss francs 1998 1997 1996
FoodEurope 2 452 2 348 2 101Americas 2 963 2 716 2 520Africa, Asia and Oceania 1 618 2 039 1 708
Other activities 1 343 1 091 7548 376 8 194 7 083
Unallocated items (a) (1 276) (1 137) (1 030)Trading profit 7 100 7 057 6 053
Capital expenditureIn millions of Swiss francs 1998 1997 1996
FoodEurope 1 026 1 041 1 046Americas 827 823 795Africa, Asia and Oceania 457 736 650
Other activities 629 572 4842 939 3 172 2 975
Unallocated items (b) 122 89 793 061 3 261 3 054
(a) Mainly corporate expenses, research and development costsas well as amortisation of intangible assets.
(b) Corporate and research and development fixed assets.
8
Key figures by management responsibilities and geographic area
Sales
37.4% 31.4%
17.3% 13.9%
Results
29.3% 35.4%19.3% 16.0%
Capital expenditure
34.9% 28.1%15.6% 21.4%
Brought to you by Global Reports

SalesIn millions of Swiss francs 1998 1997 1996
Beverages 19 879 19 142 16 348Milk products, nutrition and ice cream 19 175 19 334 16 697Prepared dishes and cooking aids(and miscellaneous activities) 18 765 17 660 15 960Chocolate and confectionery 10 485 10 663 9 034Pharmaceuticals 3 443 3 199 2 451
71 747 69 998 60 490
ResultsIn millions of Swiss francs 1998 1997 1996
Beverages 3 253 3 243 2 759Milk products, nutrition and ice cream 1 837 1 932 1 688Prepared dishes and cooking aids(and miscellaneous activities) 1 617 1 525 1 344Chocolate and confectionery 976 1 054 1 015Pharmaceuticals 915 825 573
8 598 8 579 7 379Unallocated items (a) (1 498) (1 522) (1 326)Trading profit 7 100 7 057 6 053
Capital expenditureIn millions of Swiss francs 1998 1997 1996
Beverages 593 629 586Milk products, nutrition and ice cream 576 745 732Prepared dishes and cooking aids(and miscellaneous activities) 442 445 450Chocolate and confectionery 388 435 433Pharmaceuticals 81 66 84
2 080 2 320 2 285Administration, distribution, researchand development 981 941 769
3 061 3 261 3 054
(a) Mainly corporate expenses, research and development costs,amortisation of intangible assets as well as restructuring costs.
9
Key figures by product group
Sales
27.7% 26.7%26.2% 14.6%4.8%
Results
37.8% 21.4%18.8% 11.4%10.6%
Capital expenditure
19.5% 18.8%14.4% 12.7%2.6% 32.0%
Brought to you by Global Reports

In 1998, Nestlé continued to make solidprogress despite an unfavourable eco-nomic environment in several regions ofthe world. Sales rose by 2.5%; at com-parable structure (excluding net acqui-sitions) and at constant exchange rates,the increase would have been 5.2%. Inspite of a slight erosion of the tradingprofit margin, net profit rose by 2.6%,giving an unchanged net margin of 6%.These profit margins are stated after achange in accounting method. TheGroup has abandoned replacement costaccounting for fixed assets in favour ofhistoric cost accounting. The changereflects the generally low levels of infla-tion in most major markets, and bringsgreater simplicity and transparency tothe published results. The figures forprevious years have been restated ac-cordingly.
1998 was an unusual year in that fi-nancial and economic turmoil hit severalemerging market zones simultaneously.Under these circumstances, the 3.3%rate of real internal growth achieved canbe considered as good. Traditionally, theemerging markets as a whole make asignificant contribution to the growth inthe Group’s earnings; a downturn in aparticular region tends to be offset bystrong performance elsewhere. How-
ever, with crisis situations in South-EastAsia, Latin America and Eastern Europe,this was clearly not the case in 1998. Theslowdown in activity in the countriesconcerned was accompanied by sharpdevaluations of their local currencies.This, combined with the depreciationof most major developed market cur-rencies against the Swiss franc, meantthat exchange rates had a marked nega-tive impact of –5.6% on Group salesexpressed in Swiss francs.
Dynamic operationsin the developed marketsMany of the developed markets regis-tered a very strong performance interms of both sales and profits, whichhelped to counterbalance the pressureon margins elsewhere. The progressachieved in these markets reflectsNestlé’s dynamic approach and its abil-ity to confront a very competitive envi-ronment. In the United States, for exam-ple, real internal growth was well aheadof the industry average. Nearly all prod-uct categories contributed to this per-formance, thanks to the launch of inno-vative new products and the renovationof existing lines, accompanied by mar-keting initiatives targeting the endconsumer.
Continuing commitmentto the emerging marketsAlthough the situation was generallymore difficult in the emerging markets, itvaried from country to country. Foodsales continued to show good growth inAfrica and in the Middle East, and theyheld up well in Latin America despite theeconomic problems of Brazil. Sales suf-fered most in South-East Asia and inEastern Europe.
10
Business review
General comments
Accounting change bringsgreater transparency
The business policieswhich the Nestlé Groupapplies in its home countryand abroad are largelyin line with the OECDguidelines for multinationalenterprises. In this man-agement report theguidelines concerning thedisclosure of informationhave been observedwherever possible.
Brought to you by Global Reports

The sharp depreciation of South-EastAsian currencies in the last quarter of1997 brought about a drop in demand inthe countries concerned in 1998. Thisdrop, combined with an increase in pro-duction costs, had an impact on prof-itability. However, with its long experi-ence of these markets, Nestlé was ableto react quickly to the new environment.The product offer, which is alreadyadapted to local tastes and habits, wasshifted in favour of more economicallines and formats. Marketing effortswere reinforced in order to gain marketshare, while fixed costs were reducedwherever possible. As a result of themeasures taken, Nestlé is well posi-tioned to benefit from the expected up-turn in demand in the region.
In Eastern Europe, real internalgrowth was very strong in the first halfof the year, but the situation deteriorateddramatically during the second halffollowing the devaluation of the Russianrouble. This caused sales to plummetin Russia, which in 1997 representedaround one third of Nestlé’s turnover inEastern Europe. Prior to the crisis, 1998sales in Russia had been expected toreach Fr. 1 billion. The structure of theRussian market is atypical of Nestlé inthat around half of its sales consist ofimported products, notably soluble cof-fee. The selling prices of these productsobviously increased significantly be-cause of the rouble devaluation and, ina very depressed economic environ-ment, consumption was badly affected.On the other hand, the impact was lesssevere for locally manufactured prod-
ucts (chocolate and ice cream). Nestléis benefiting from its strategic decisionto concentrate on the local chocolateand confectionery brands acquired inrecent years. Russian consumers havereverted to these products, which havea clear identity and are more affordablethan imports.
Although Nestlé has taken appropri-ate measures to respond to the slow-down in the emerging markets, the com-pany has not changed its fundamentalstrategy. The Group will continue toinvest in these countries in order to sat-isfy the needs of their growing popula-tions, whose purchasing power shouldresume a growth pattern in the future.The purchase of the totality of the mi-nority interests in Nestlé Philippines inmid-1998, as well as the acquisition ofadditional shares held by minority share-holders in companies operating inBangladesh and Malaysia, is a confirma-tion of confidence in the future of Asianmarkets.
The Group continues to adapt its pro-duction and distribution structures totake account of the liberalisation of tradeflows. The creation of regional structuresin Latin America has been followed bythe regionalisation of management inAsia, with effect from the beginning of1999. The primary objective of the initia-tives taken at a regional or continentallevel is to achieve better capacity utilisa-tion on a world scale.
11
Confidence in the futureof Asian markets
Brought to you by Global Reports

Strong performanceof the other activitiesThe sales of the other activities werehighly satisfactory in 1998. Perrier VittelS.A. strengthened its leadership positionin the world market for mineral andspring waters, with a high real internalgrowth rate and the successful integra-tion of the San Pellegrino group. Thesales progression was again accompa-nied by a noticeable improvement inprofitability. At the end of the year,Perrier Vittel launched Nestlé Pure Life, apurified water with added minerals. Thisproduct will play a major role in thedevelopment of the bottled water mar-ket in emerging countries.
Cereal Partners Worldwide, the jointventure with General Mills in breakfastcereals outside North America, contin-ued its strong growth, with gains in mar-ket share in most of the countries whereit is present. This joint venture, whichsince its creation in 1990 has succeededin an ambitious programme of geo-graphic expansion, registered its firsttrading profit in 1998.
The pharmaceutical activities (Alconand Galderma) also saw strong growthin sales and profits.
Brand and product strategyExternal growth was relatively signifi-cant in 1998 thanks to three major oper-ations – the increase of Nestlé’s interestin the mineral water group San Pelle-grino to 100%, and the acquisition ofKlim/Cremora for milk products andSpillers for pet food. These operationsare consistent with the thrust of expan-sion in key product categories whichoffer high growth potential for thefuture.
1998 was a decisive year for theGroup’s ice cream strategy. The IceCream Strategic Business Unit, createdin 1997, worked extensively on the con-solidation of ice cream operations fol-lowing a period of intense acquisitionactivity. The Nestlé brand was extendedwith a new visual identity; its presence inthe impulse sector was expanded thanksto an increase in the number of pointsof sale; and a new freezer cabinet stimu-lated sales of both ice cream and choco-late. Nestlé is now well placed to takeadvantage of global growth in the mar-ket for ice cream, a product which hasproved popular in virtually every countryin the world.
12
Expansion in key product categorieswith high growth potential
Brought to you by Global Reports

In 1998, Nestlé’s sales rose to Fr. 71.7billion, up 2.5% compared with the pre-vious year. At comparable structure (ex-cluding net acquisitions) and at constantexchange rates, sales would have risenby 5.2%.
Real internal growth was 3.3%against 3.2% in 1997. A weaker per-formance in some emerging market re-gions was offset by particularly stronggrowth in North American food salesand in the other activities.
Selling prices and residual itemscontributed 1.9% to sales growth. Theirimpact was less than in 1997, whenhigher selling prices reflected an in-crease in raw material costs.
External growth (the contribution ofacquisitions net of divestitures) amount-ed to 2.9%. Acquisitions contributed3.9% to sales growth while divestituresled to a –1% reduction.
In 1998, all the major billing curren-cies depreciated against the Swiss francwith the exception of the pound sterling,which rose very slightly. Moreover,currencies in South-East Asia and inOceania registered sharp declines. As aresult, exchange rates had a negativeimpact of –5.6% on sales.
FoodSales in Western Europe generally pro-gressed well, despite a disappointingyear end in some markets, particularlyGermany and Italy, which were affectedby blackmailing episodes. In EasternEurope, the first half showed spectacu-lar growth, but there was a significantdownturn starting in August, followingthe devaluation of the Russian rouble.
In North America, growth was abovethe Group average thanks to a good per-formance by most product categories. InLatin America, sales held up well in theface of the economic difficulties inBrazil, and they were particularly strongin Mexico.
The developed markets of Asia andOceania saw a recovery in growth in1998. Sales progression was good inAfrica and in the Middle East. On theother hand, the emerging markets ofSouth-East Asia suffered from the eco-nomic and financial crisis in the region,although in varying degrees dependingon the country.
Other activitiesWater sales again made very goodprogress in the United States, as well asin Latin America and in Asia. In Europe,growth was more moderate. Sales ofpharmaceuticals – notably Alcon’s oph-thalmic drugs and Galderma’s dermato-logical products – also made stronggains in the United States, and theirgrowth in the other regions of the worldwas very encouraging.
13
Sales
1998 Sales (a)
in principal marketsIn millions of Swiss francs
Differences 1998/1997in francs in local currency
USA 14 871+ 2.9% + 3.6%
France 7 078+ 3.0% + 4.4%
Germany 6 789+ 1.5% + 3.2%
United Kingdom 4 547+16.8% +16.3%
Brazil 4 323– 2.2% + 5.7%
Italy 4 114+21.8% +23.3%
Japan 2 929– 2.3% + 4.7%
Spain 2 316+ 2.7% + 4.7%
Mexico 2 103+ 4.8% +22.2%
Australia 1 564– 5.3% +12.4%
Canada 1 493– 2.1% + 6.0%
Philippines 1 262–19.7% +13.3%
Switzerland 1 065+ 1.5% + 1.5%
Other markets 17 293+ 0.3% (b)
(a) Sales by markets includefood and other activities.
(b) Not comparable.
Brought to you by Global Reports

Trading profit rose slightly in 1998 toFr. 7100 million. The trading profit mar-gin was 9.9% compared with 10.1% in1997. The slight decline reflects the diffi-cult operating conditions in South-EastAsia and in Eastern Europe.
The decline in trading profit marginwas basically due to increases in market-ing and administration expenses and inthe amortisation of intangible assets.The latter reflects the major acquisitionsand increases in participations carriedout during the year. Marketing costs, ex-pressed as a percentage of sales, rose asa result of initiatives to strengthen theglobal position of major brands and toincrease market share in the emergingcountries.
On the other hand, the cost of goodssold expressed as a percentage of salesagain showed a marked reduction. Afavourable trend in raw material andpackaging costs was accompanied bycontinuing improvements in industrialperformance.
FoodThe trading margin again increased inWestern Europe, with an improvementin most markets thanks to the cost sav-ings realised. However, this improve-ment was offset by a sharp deteriorationin Eastern Europe following the devalu-ation of the Russian rouble.
In the Americas, the margin in-creased thanks to a very good per-formance in the United States, which
benefited from strong volume growth.The margin showed only a very slightdecline in Latin America despite theBrazilian crisis.
In Africa, Asia and Oceania, the de-veloped countries were able to improvetheir margin even though the economicclimate remains difficult. However, theemerging markets of South-East Asiaregistered a reduction in trading margin.This reflected a decline in sales volumeand an increase in production costs,which could only partially be passed onin selling prices.
Other activitiesWater benefited from good volumegrowth and from a reduction in variableproduction costs and in administrationexpenses. The improvement in prof-itability was particularly marked inEurope. In pharmaceuticals, Alconwas able to maintain its very high mar-gin while Galderma showed strongprogress. CPW, the joint venture withGeneral Mills for breakfast cereals, regis-tered its first trading profit.
14
Trading profit
Breakdown of tradingexpenses by categoryIn percent
1998 1997
Rawmaterials 28.0 28.7Packaging 9.5 9.6
Salaries and wel-fare expenses 16.2 16.6Depreciation 3.6 3.8Other tradingexpenses 32.8 31.2
Total tradingexpenses 90.1 89.9
Tradingprofit 9.9 10.1
Continuing improvementsin industrial performance
Brought to you by Global Reports

Group net profit rose by 2.6% in 1998 toFr. 4291 million. The net margin wasmaintained at 6% despite the slight de-cline in trading margin.
Net financing costs amounted toFr. 1168 million compared with Fr. 1056million in 1997. The increase is due tothe impact on interest expense of therise in Latin American interest rates,which was not offset by a correspondingdepreciation of the currencies concerned,and also to the significant amounts spenton acquisitions during the year. On theother hand, the income generated bythe Group’s liquid assets increasedsignificantly.
Net non-trading items showed apositive balance of Fr. 189 million, com-pared with a net charge of Fr. 63 millionin 1997. The main element was the reali-sation of gains on divestitures and onthe sale of assets.
The tax charge as a percentage ofprofit before taxation increased from31% in 1997 to 32.7%. The increase re-flected several factors, including: thenon-recurrence of tax adjustments in theUnited States which had a favourableimpact on profit before taxation in 1997;the decline in earnings in certain Asianmarkets; and the increase in the amorti-sation of intangible assets which, for themost part, is not tax deductible.
The share of profit attributable to out-side interests declined significantlyfollowing the Group’s purchase of theminority interests in Nestlé Philippineswith effect from 1st July 1998. More-over, some of the companies with out-side shareholders registered lower re-sults, partly because of the depreciationof local currencies.
Earnings per shareEarnings per share rose by 2.7% toFr. 109.2. The increase is slightly greaterthan that of the Group’s global profit be-cause of a reduction in the number ofshares in circulation.
15
Net profit
Net profit per shareIn Swiss francs
70
80
90
100
110
120
94 95 96 97 98
83.7
78.5
91.3
106.3
109.2
Net margin maintained at 6%
Brought to you by Global Reports

In 1998, capital expenditure declined toFr. 3061 million compared with Fr. 3261million in 1997. Expressed as a percent-age of sales, it fell from 4.7% in 1997 to4.3%, the lowest level since 1986. Thedownward trend reflects the efforts un-dertaken to increase utilisation of exist-ing capacities.
Capital spending was virtually stablein Europe and in the Americas. On theother hand, it declined in the Africa,Asia and Oceania region, whereas inprevious years it had tended to increasein these countries. The decline is attrib-utable to the depreciation of local cur-rencies and to the postponement ofcertain projects in Asia because of theeconomic situation.
The increase in capital expenditurefor the other activities reflects the stronggrowth in water.
522 factories in 81 countriesThe total number of Nestlé factoriesworldwide increased by 27 in 1998owing to the consolidation of new oper-ations, in particular San Pellegrino andSpillers. However, the Group continuedto rationalise industrial capacity with thesale or closure of 16 factories.
The total of 522 factories includes66 water bottling plants and 17 factoriesfor pharmaceutical or dermatologicalproducts.
External growth opportunities were larg-er in 1998 than in recent years, butNestlé’s strategy remains the same: tofocus on the strengthening of its pres-ence in key product categories. Spend-ing on acquisitions and participationsrose from Fr. 938 million in 1997 toFr. 4283 million. Proceeds from divesti-tures totalled Fr. 236 million. Net expendi-ture thus amounted to Fr. 4047 million,compared with Fr. 566 million in 1997.
The increase in Nestlé’s participationin the mineral water group San Pelle-grino was announced in November1997, and San Pellegrino was consoli-dated from 1st January 1998. The SanPellegrino brand is an excellent fit withinNestlé’s portfolio of international min-eral water brands and offers strong po-tential for sales growth outside Italy. Itsprogress in 1998 was very satisfactory.
In February, Nestlé acquired twomajor brands from Borden Brands Inter-national: Klim for milk powder world-wide and Cremora for non-dairy coffeecreamer in Africa and the Middle East.Klim has a particularly strong position inColombia and Taiwan, where Nestlé’spresence in milk powder was relativelyweak.
The acquisition of Spillers, effectivefrom 1st May 1998, allowed Nestlé tobecome the number two producer inthe European pet food market. Boththe Spillers brands and its geographicalspread are highly complementary toNestlé’s existing Friskies business. Al-though this acquisition had a slight dilu-tive effect during 1998, the integrationof Spillers with Friskies should bringsignificant synergies in the coming year.
16
Capital expenditure Acquisitions and divestitures
Capital expenditureIn billions of Swiss francs
Capitalexpenditure
Depreciationof fixed assets
1.5
2.0
2.5
3.0
3.5
4.0
94 95 96 97 98
2.32.1
2.3
2.72.6
3.03.1 3.1
3.33.1
Brought to you by Global Reports

In the second half of the year, Nestléwas able to raise its participation inNestlé Philippines from 55% to 100%.Nestlé Philippines is the country’s num-ber one food producer. As Nestlé Philip-pines was already fully consolidated, theincrease in participation did not directlyaffect sales or trading profit but it did, onthe other hand, reduce the share of prof-it attributable to outside interests.
Nestlé has continued to dispose ofactivities with limited potential foradding value. Following the 1997 sale
of Contadina canned tomato productsin the United States, Libby’s cannedmeats were divested in 1998. In Italy, theGroup has now sold the entire Locatellicheese business. Fruit-based drinks inthe United Kingdom and Ireland havealso been divested.
More detailed information about ac-quisitions and increases in participationscan be found in the sections on the vari-ous product groups on pages 22 to 51.
The Group’s net financial debt (short,medium and long term financial debt,net of liquid assets) rose from Fr. 4.8 bil-lion at the end of 1997 to Fr. 6.6 billion.The increase reflects the financing ofacquisitions and increases in participa-tions already mentioned. The level of netdebt declined significantly during thesecond half of the year, thanks to strongcash flow generation by Nestlé markets.
The ratio of net debt to equity (includ-ing outside interests) was 28.1%, com-pared with 22.4% in December 1997.The figures for equity have been adjust-ed downward to take account of theapplication of historic cost accountingfor fixed assets.
Shares, stock exchange
In 1998, the price of the Nestlé share roseby 37%. It clearly outperformed the SwissPerformance Index, which gained 15%.Over the last two years, the Nestlé shareprice has thus more than doubled.
The share price development waspositive over the year despite some tem-porary setbacks, the most noticeable ofwhich occurred after the devaluationof the Russian rouble in August. TheRussian crisis gave rise to fears of a con-tagion effect in other markets whereNestlé is present. Nevertheless, theshare price recovered in the final quarterof the year. The announcement of thefirst half results was accompanied by areturn of positive sentiment based onthe Group’s ability to manage emergingmarket crises and to achieve long termgrowth.
17
Financial position
Disposal of activitieswith limited potentialfor adding value
Evolution of theNestlé registered sharein 1998(compared with the Swissstock market index)
Registered share
Swiss Performance Index
2000
1800
2200
2400
2600
2800
3000
3200
3400
Swissfrancs
J F M A M J J A S O N D
3500
4000
4500
5000
5500
Index
Share price more thandoubled over two years
Brought to you by Global Reports

During 1998, Nestlé continued its broad-based efforts for protection of the envi-ronment within its spheres of activity.
Utilising the framework of the NestléEnvironmental Management System,Nestlé carried out a comprehensiveworldwide factory environmental audit.This audit allowed a thorough evaluationof its key environmental accomplish-ments since the last such audit, as wellas an inventory of its global environmen-tal projects.
Results of the audit confirmed thatwater management, the reduction of airemissions and improvements in solidwaste recovery continue to be the topenvironmental priorities. Activities inthese areas included diminished waterconsumption, the construction and ex-pansion of waste-water treatment facili-ties, specific projects targeted at protec-tion of the ozone layer, measures toreduce the greenhouse effect and solidwaste management programmes thatinvolved recycling and energy recovery.The audit clearly demonstrated Nestlé’s
continuous pattern of investment in spe-cific environmental measures in its fac-tories, an investment that has averagedFr. 100 million annually. In addition, sub-stantial amounts were expended as partof regular capital investment projectsand factory environmental operatingcosts. Examples of these additional
expenditures included environmentalaspects related to factory constructionand renovation, environmental trainingof personnel and maintenance costs forwaste-water treatment facilities.
During 1998, Nestlé continued itspackaging source reduction efforts. Fig-ures for 1991 to 1998 show that theCompany, without compromising prod-uct quality, saved, on a worldwide basis,close to 150 000 tons of packaging ma-terial, representing Fr. 250 million.
The achievements realised by Nestléstand as clear evidence of its commit-ment to environmentally sound businesspractices. Furthermore, Nestlé partici-pates actively in the work of severalorganisations dealing with this subject;for example, Nestlé is a founding mem-ber of the World Business Council forSustainable Development (WBCSD), inGeneva, and contributes to the WorkingGroup “Sustainable Development” inthe town of Vevey.
18
Environment
Commitment to environmentallysound business practices
Brought to you by Global Reports

19
Nestlé has been aware of the Year 2000problem and its possible effects for sev-eral years, and has taken continuoussteps since then to address the issue.
Most of Nestlé’s corporate informa-tion systems have been made Y2K com-pliant, and are undergoing testing. Thisis also true for many of the local systemsdeveloped by subsidiary companies.There are no reports of any major sys-tems that will not be ready on time, andNestlé is convinced that its state of pre-paredness is reasonable, given the factthat the problem is unique and its effectswill not be fully known until 1.1.2000.This work is under constant review andappropriate contingency plans are beingput in place.
Nestlé is giving the non-IS sectors of thebusiness, such as warehousing andmanufacturing, the proper attention. TheGroup is also investigating, on a continu-ous basis, the readiness of key suppliersand customers, and will take appropriatemeasures to support smaller companieson which it relies.
It is not possible to put a figure on thecosts of protecting the corporationagainst the effects of the Year 2000problem. Some of the work has beencarried out in the framework of sched-uled maintenance, and some has un-doubtedly delayed low priority up-grades, but all has been undertaken inthe context of the company’s globalIS/IT budget.
Group Management as well as allNestlé Group external auditors are keento obtain continuous assurance that theYear 2000 issue is being appropriatelydealt with in all Nestlé subsidiaries. TheYear 2000 issue has been one of the topareas of focus in the Nestlé Group auditsince 1997.
Nestlé andthe Year 2000 problem
Brought to you by Global Reports

20
The number of people employed by theGroup rose from 225 808 at the end of1997 to 231 881 at 31st December 1998,an increase of 2.7%. The increase, whichwas mainly due to the acquisitions madein 1998, was partially offset by divesti-tures and by the restructuring carriedout in certain countries. The overall im-pact of the rationalisation measures un-dertaken meant that the increase in em-ployees was considerably less than thesum of internal sales growth and the netacquisition effect, signifying an improve-ment in productivity.
Development of human resourcesThe increasingly competitive environ-ment in which Nestlé operates demandsa very high quality of work from everyemployee. For this reason Nestlé de-votes particular attention to the selectionof those recruited and to their trainingand development. It is thanks to thisemphasis on quality that Nestlé hasbeen able to maintain its traditional poli-cy of favouring internal promotions andlong term career prospects, withoutneglecting opportunities of outside en-gagements when the skills or profilesrequired are not available.
Remuneration policy must be a factor instimulating employees to strive towardsthe Group’s main objectives, whilst re-maining competitive with comparablecompanies in each country. Policy in thisarea is moving towards a more directlinkage between an employee’s qualityof work and his fixed salary. At the sametime, the number of employees whosetotal remuneration varies according tothe achievement of individual or Grouptargets is increasing. The fixing of tar-gets makes it possible to focus the em-ployee’s activities on the company’s pri-orities and establishes an objective basisfor the subsequent appraisal of his per-formance.
Human Resources
Remuneration policylinked to performance
Brought to you by Global Reports

21
In the development of human resources,training has always played a vital roleat Nestlé. To a very large extent, trainingtakes place directly in the different oper-ating companies in each country, withpriority given to on the job training. Inaddition, longer term training is con-ducted through courses and seminarsorganised by the various training centresthroughout the world, which are tailoredto the needs of the headquarters, facto-ries and marketing and logistics func-tions. At the international level, in 1998the Rive-Reine International Training andConference Centre, near Vevey, organ-ised a total of 80 seminars with 1705participants. Rive-Reine continues toplay a fundamental role in the creationand perpetuation of the Nestlé culture,as well as in the constant updatingof professional knowledge amongmanagers.
“The Basic Nestlé Managementand Leadership Principles”Published in the spring of 1997, this doc-ument, which summarises the basicprinciples of business management andexplains the essence of the Nestlé cul-ture, has been very widely circulated.The aim now is to bring these Principlesto life in the daily activity of the Compa-ny, and to this end a whole series of ini-tiatives has been undertaken at the Cen-tre and in the markets. The assessmentof the performance of employees, andparticularly of managers, henceforthtakes account of the degree to which thePrinciples are applied.
“Nestlé Corporate BusinessPrinciples”A major new document was publishedrecently, entitled “Nestlé Corporate Busi-ness Principles”. It explains the Group’spolicy with regard to its global socialresponsibilities. The document deals witha wide range of crucial subjects such ascompliance with legislation and interna-tional recommendations, policy towardsconsumers and business partners, pro-tection of the environment, the purchaseof agricultural raw materials, marketingof infant formula products, child labour,etc.
Nestlé compliance with its corporatebusiness principles is regularly moni-tored by its internal auditors on the basisof clear auditing instructions, whichare certified by its external auditing firm.Findings and recommendations arereported to the Nestlé S.A. Board ofDirectors.
Geographic distribution
1998 1997
Europe* 42.2% 40.9%
Americas 33.8% 34.9%
Africa, Asia and Oceania 24.0% 24.2%
* 6216 employeesin Switzerland in 1998.
Distribution by activity
1998 1997
Factories139 675 136 320
Administration and selling92 206 89 488
231 881 225 808
Brought to you by Global Reports

Nestlé 1998
Manag
ement R
eport
Brought to you by Global Reports

1
Table of contents
Product group development 22 Beverages28 Milk products, nutrition and ice cream35 Chocolate and confectionery40 Prepared dishes and cooking aids
(and miscellaneous activities)46 Foodservice48 Pharmaceutical products52 Associated companies
General information 54 Manufacture and sale of products56 History
Brought to you by Global Reports

Product group development
Beverages
1998 1997 1996
Sales 19 879 19 142 16 348
Trading profit 3 253 3 243 2 759
Capital expenditure 593 629 586
Millions of Swiss francs
Brought to you by Global Reports

Green coffeeThe prospect of a sharp increase in sup-ply – as a result of Brazil’s largest harvestfor 11 years – dominated the market formuch of the year. After firming up inFebruary, prices of arabicas followed adownward trend until the end of Octo-ber. The damage inflicted by HurricaneMitch on the infrastructure of the coffee-producing countries in Central Americacaused prices to rise in November andDecember. Nevertheless, despite certain
losses in production and delays in rout-ing coffee to the ports, the market trendremained generally depressed.
Robusta prices displayed greater sta-bility, owing to a smaller crop in Indone-sia, a conservative sales policy on thepart of Vietnam – where production hadinitially been affected by a prolongeddrought – and brisk demand from roast-ers for this kind of coffee.
23
Nestlé invented soluble coffee in Switzerland in 1938, and salesof Nescafé have been growing steadily ever since. With over3000 cups drunk every second, Nescafé is by far the world’s mostpopular brand of coffee. Ready-to-drink coffees are sold under thesame brand. Nestlé is also the worldwide leader in chocolate- andmalt-based drinks, for which the best known brands are Nesquik/Nestlé Quik, Milo and Nescau. In addition, the Group is present inroasted coffees, including Hills Bros. and MJB in the United Statesand Dallmayr Prodomo in Germany, as well as Nespresso, anespresso coffee in capsules; in fruit juices, where its most impor-tant brand is Libby’s in the United States; and tea-based drinks,particularly soluble and ready-to-drink Nestea. Nestlé is also theworld market leader in mineral and spring waters. Its presenceis strongest in Europe, with such brands as Vittel, Contrex, Perrier,San Pellegrino, Levissima, Vera and Fürst Bismarck, and in theUnited States, with Arrowhead, Poland Spring, Zephyrhills, DeerPark and Ozarka.
Two innovative top-of-the-range Nescaféproducts with the new logo,launched in the United Kingdom and Canada.
Green coffee pricesAverage monthly pricesexpressed in USc/ per lb
75
125
175
225
199819971996
The terms in italics on pages22 to 51 of this report areregistered trademarks ofthe Nestlé Group.
Brought to you by Global Reports

SalesSoluble coffee performed well duringthe year, although sales were somewhataffected by the crises in Russia andSouth-East Asia. Nescafé consolidatedits leading position in soluble coffee in allmarkets, assisted by the launch of newproducts and an intensified presence inout-of-home distribution channels.
Nescafé’s communications strategyhas been totally reviewed with, for ex-ample, a rejuvenation of the brand logoto strengthen its image with consumers.A new advertising campaign begun inthe course of the year will transform
Nescafé, already a leading brand of solu-ble coffee in every country, into a univer-sal brand. It is designed to give thebrand a more open image and to createa stronger emotional bond between theconsumer and the brand throughout theworld. Already launched in several majorEuropean and Asian markets, the basiccampaign is being supplemented bylocal ones emphasising the specificcharacteristics of the products in eachcountry.
This new Nescafé communicationspolicy addresses young people, with theaim of convincing them that Nescafébelongs to their generation and that cof-fee is an up-to-the-minute product. Forthis purpose, the campaign encompass-es numerous peripheral activities, rang-ing from a website to Nescafé’s widerpresence at musical and sporting eventsand in non-traditional sales channels.
24
Successfullylaunched in Thailand,ready-to-drinkNescafé is bothstimulatingand refreshing.
Nescafé liquid concentrate in individualportions for making iced coffeehas been well received in Japan.
Nescafé’s newpresentation forthe Thai market.
Brought to you by Global Reports

As part of a major strategic evolution,the Nespresso coffee preparation sys-tem has reinforced its marketing planwith a pan-European advertising cam-paign to extend awareness of the brandand product to a still larger audience ofespresso connoisseurs. At the sametime, the introduction of the Alessi-Nespresso machine, with its innovativedesign, is opening up good prospects ofadditional sales for this brand in new dis-tribution channels. These various ele-ments have helped to generate stronggrowth, while emphasising both theItalian roots of the concept and its imageof quality.
In a difficult economic environment,chocolate- and malt-based drinks main-tained their leadership around the globe.Nesquik/Nestlé Quik and Nescau madegood progress in Europe and America.Milo posted high growth rates in LatinAmerica and significantly increased itsmarket shares in Asia.
Sales of mineral and spring waterscontinued to grow vigorously in 1998.The Group improved its positions inEurope, thanks both to the further devel-opment of its existing brands and to theacquisition of the San Pellegrino group,the leader in the Italian mineral watermarket with a good position in sweet-ened beverages and alcohol-free apéri-tifs (San Bitter). In France, a new planhas been implemented for the restruc-turing of the Vergèze industrial site,which will improve the profitability of thePerrier brand.
In the United States, where the mar-ket for water in PET bottles continues toexpand rapidly, the Group gained furthermarket shares, reinforcing its numberone position.
26
Perrier refreshesits label.
The world leader in chocolate-baseddrinks for children, Nesquik isavailable in several practical formats,including syrup and ready-to-drink.
A delicious, malt-flavouredsource of energy,very popular with teenagers.
An exclusive sealedcapsule filled witha measure of freshly-ground roasted coffee.
Brought to you by Global Reports

The Group also continued its develop-ment in the emerging markets, estab-lishing a presence in China and achiev-ing strong growth in Vietnam, Thailand,Brazil and Mexico. Water under theNestlé brand – Nestlé Pure Life – waslaunched in Pakistan at the end of 1998and is scheduled for introduction inother emerging markets.
ProfitTrading profit showed a slight increase.There was a marked improvement in theprofitability of water thanks to goodvolume growth and to cost reductions.However, this was offset by a lower trad-ing margin for chocolate- and malt-based beverages, reflecting the difficultsituation in South-East Asia.
Capital expenditureCapital expenditure declined to Fr. 593million from Fr. 629 million in 1997. Theinvestment effort was concentrated inthe water sector, where capacity was ex-panded to meet growing demand in theUnited States and in Poland. A bottlingline for Nestlé Pure Life was installedin Pakistan. In addition, further invest-ments were made in several countriesrelating to the switch to PET bottles.
San Pellegrinosparkling watergraces the world’smost elegant tables.
Levissima, a lightwater fromthe Italian Alps.
Vittel in a 75-cl PETbottle with a sports caphas been successfullylaunched in Europe.
Nestlé PureLife, purity andsafety for allthe family.
Brought to you by Global Reports

Milk products, nutrition and ice cream
1998 1997 1996
Sales 19 175 19 334 16 697
Trading profit 1 837 1 932 1 688
Capital expenditure 576 745 732
Millions of Swiss francs
Brought to you by Global Reports

Milk1998 was the third consecutive yearof rising worldwide milk production, al-though the growth rate was slower thanin 1996 and 1997. Growth in a numberof Asian and Latin American countriesand an increase (somewhat less thanhad been expected) in the United Statesand Oceania more than made up forthe continued sharp decline in Russiaand certain other Eastern Europeancountries.
Following a gain in 1997, the worldmarket contracted, reflecting the eco-nomic problems in South-East Asia andthe crisis in Russia. As a result, priceswere under pressure throughout 1998,with the exception of milk fat, wherequotations fluctuated in response to
sustained demand in the United Statesand limited supplies.
The implementation of the UruguayRound agreements began its fourth yearin July 1998, but the actual subsidisedexports – particularly from Europe –were considerably below the limitsset by the GATT/WTO, reflecting adepressed world market.
SalesDespite the economic crises in South-East Asia and Russia, sales volume ofshelf stable milk products continued toadvance, thanks notably to innovationefforts. Now that the acceptance ofcalcium-enriched powdered milks hasbeen confirmed, the Group has extend-ed their distribution to Latin America
29
A pioneer in the manufacture of foods for infants and youngchildren, Nestlé offers a complete range, comprising start-up andfollow-up formulas, growing-up milks, cereals and a varietyof ready-to-eat and dehydrated foods, as well as infant dieteticspecialities. Clinical and performance nutrition are opening up newfields of action. Nestlé is also the world leader in shelf stable milksand is continuing to build up its range of chilled dairy products.Cereal Partners Worldwide, the joint venture with General Millsfor breakfast cereals outside North America, is now activein 70 countries.
The Group continues to strengthen its globalpresence in ice cream.
Nido Extra Calcium,specially formulatedfor childrenof school age.
Brought to you by Global Reports
and Asia, and has launched a liquid formin Thailand, as well as Sveltesse BioCalcio, a powdered version with bifidus,in Spain.
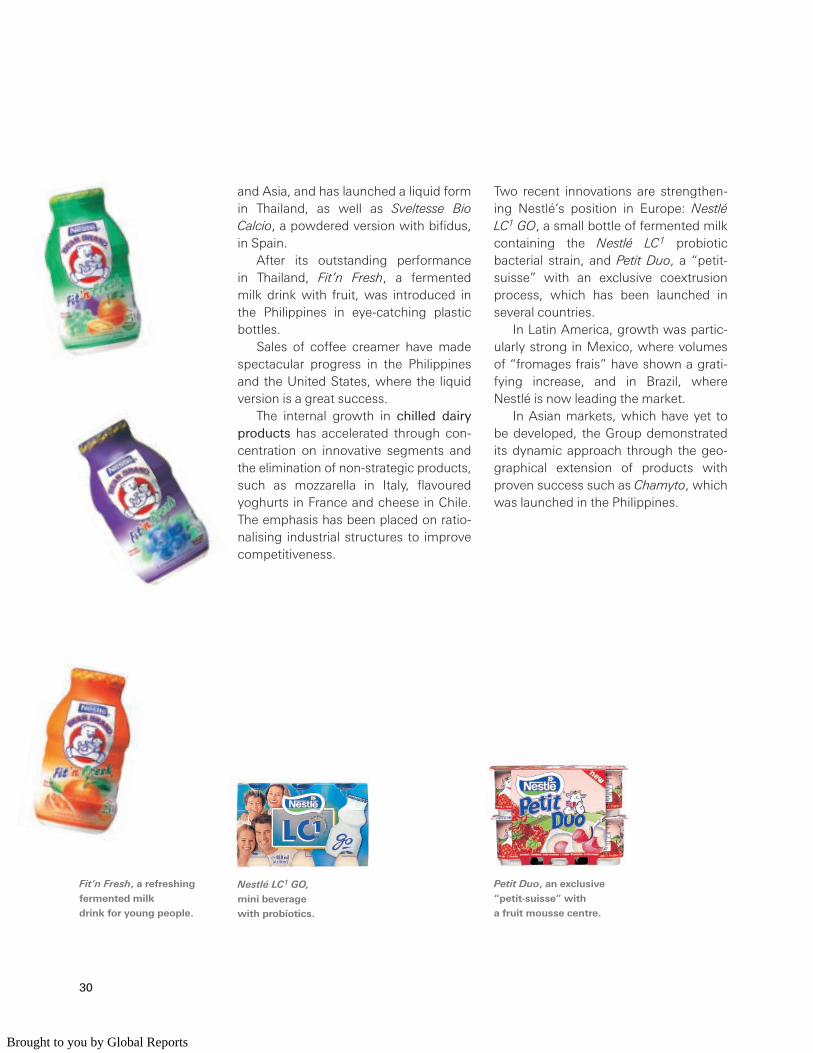
After its outstanding performancein Thailand, Fit’n Fresh, a fermentedmilk drink with fruit, was introduced inthe Philippines in eye-catching plasticbottles.
Sales of coffee creamer have madespectacular progress in the Philippinesand the United States, where the liquidversion is a great success.
The internal growth in chilled dairyproducts has accelerated through con-centration on innovative segments andthe elimination of non-strategic products,such as mozzarella in Italy, flavouredyoghurts in France and cheese in Chile.The emphasis has been placed on ratio-nalising industrial structures to improvecompetitiveness.
Two recent innovations are strengthen-ing Nestlé’s position in Europe: NestléLC1 GO, a small bottle of fermented milkcontaining the Nestlé LC1 probioticbacterial strain, and Petit Duo, a “petit-suisse” with an exclusive coextrusionprocess, which has been launched inseveral countries.
In Latin America, growth was partic-ularly strong in Mexico, where volumesof “fromages frais” have shown a grati-fying increase, and in Brazil, whereNestlé is now leading the market.
In Asian markets, which have yet tobe developed, the Group demonstratedits dynamic approach through the geo-graphical extension of products withproven success such as Chamyto, whichwas launched in the Philippines.
30
Nestlé LC1 GO,mini beveragewith probiotics.
Petit Duo, an exclusive“petit-suisse” witha fruit mousse centre.
Fit’n Fresh, a refreshingfermented milkdrink for young people.
Brought to you by Global Reports

Infant nutrition made further progressalthough the growth rate was affectedby the Asian crisis, which slowed salesin several countries, especially Indone-sia. On the other hand, strong gainswere recorded in Eastern Europe andNorth America. Generally, infant cerealsperformed the best, while baby foods injars were more stable. Two families ofnew products are noteworthy: mealsfor young children in trays with oneor two compartments, launched inFrance under the name of P’tit Menu,and an extremely varied range of prod-ucts for “Juniors” from one to threeyears old, introduced in Germany. Thefollow-up milks with bifidus launchedthe previous year continued their geo-graphic expansion.
Clinical nutrition continued to grow,thanks in particular to the Clinutren oralnutrition range in Europe. The Peptamenline of specific products also contributedto the higher sales. In addition, the firstpowdered formulas, intended for tubefeeding and oral supplementation, werelaunched at the year end in a number ofAsian countries under the Nutren brand.
In ice cream, the Group’s principalobjective in 1998 was to enlarge its pres-ence in the impulse sector by multiply-ing its points of sale, an essential factorfor growth.
Nestlé has created a new visual iden-tity with a “fond piscine”, designed togive an attractive and distinctive brandimage. It consists of an intense light-blue background with a graphic effectsuggesting the movement of water,
31
A complete mealfor young childrenin a tray with two com-partments, heatedin the microwave.
Growing-up milkenriched with bifidusfor small children.
A fruit and cereal barfor young children agedfrom one to three.
The Pirulo conceptfrom Spainhas been launchedin North America.
Brought to you by Global Reports

Nestlé has also developed an exclusiveand original display case for the com-bined presentation of ice cream andconfectionery, which gives a real com-petitive advantage.
The 70 countries covered by CerealPartners Worldwide (CPW) account forabout three quarters of breakfast cerealconsumption outside the United Statesand Canada. CPW’s market share inthese countries is estimated at 19%, astrong number two position.
In 1998, further vigorous volumegrowth was achieved, with market shareincreasing in most countries. The Foot-ball World Cup, of which CPW was asponsor, the introduction of new prod-ucts like Fitness & Fruits and Banana NutClusters, and the excellent performanceof Nesquik, the leading product, allcontributed to these good results.
32
Mega Truffle,a delicious treaton a stick.
Extrême Duo Cône,a new addition tothe Extrême range,in Europe.
producing a feeling of freshness. Thisvisual identity was extended to newmarkets in 1998.
Innovations added to the productrange enabled Nestlé to distinguish itselfsignificantly from the competition.
Extrême Duo Cône, a new productlaunched in Europe last summer, offersconsumers the first industrial two-scoopice cream cone. The Mega line wasenhanced by the introduction of MegaTruffle, a stick with a delicious chocolatetruffle inside.
The geographical extension of Maxi-bon and Pirulo was a great success, aswas the After Eight ice cream gâteau inEurope.
Brought to you by Global Reports

ProfitThe decline in trading profit reflectsvolume losses and pressure on marginsfor the shelf stable milk products soldin South-East Asia. On the other hand,results improved for the product cate-gories where Nestlé has recentlyexpanded its presence – ice cream,breakfast cereals, and clinical and per-formance nutrition. Refrigerated dairyproducts also showed an increase inmargin following the streamlining of theportfolio.
Capital expenditureCapital expenditure declined significant-ly from Fr. 745 million in 1997 to Fr. 576million. With the streamlining of therefrigerated dairy portfolio, the emphasishas been on rationalising the manufac-turing base, particularly in Europe. In thearea of shelf stable milk products, selec-tive investments have been made in theAsia-Oceania region.
AcquisitionsNestlé reinforced its worldwide leader-ship in shelf stable milk products byacquiring the Klim brand, which is verysignificant in Colombia, Taiwan and theMiddle East. At the same time, theacquisition of the Cremora brandstrengthened Nestlé’s solid position innon-dairy coffee creamers in SouthAfrica. In Turkey, the Group took controlof Mis Süt, one of the largest local com-panies in liquid milks and chilled dairyproducts.
In ice cream, Nestlé acquired busi-nesses in Puerto Rico, Panama andCosta Rica. These acquisitions are partof a strategy of consolidation in theCaribbean area and Central America. InEurope, Nestlé acquired Drammen Is, aNorwegian company without a manu-facturing structure but with a good dis-tribution system, offering the opportu-nity for expansion in this region.
34
The first cerealwith fruitfor keeping trim!
Mis Süt, one ofthe leading Turkishcompaniesin liquid milk.
Klim is a majorbrand inpowdered milk.
Cremora, the leaderfor non-dairy coffeecreamer in South Africa.
Brought to you by Global Reports

Chocolate and confectionery
1998 1997 1996
Sales 10 485 10 663 9 034
Trading profit 976 1 054 1 015
Capital expenditure 388 435 433
Millions of Swiss francs
Brought to you by Global Reports

CocoaThe expectation of a significant shortfallin supply for the 1997/98 cocoa season,and the resulting seasonal reduction ofstocks, caused prices to remain buoyantat first, while awaiting more reliable in-formation about the development of thenext harvest. This information, whichproved ultimately to be contradictory,had only a limited impact on the market,which had turned its attention from pro-duction forecasts to trends in consump-tion as a result of the Russian crisis in
mid-August. The pessimism with regardto demand extended to the Europeancountries that supply Russia, particularlyGermany, and prices fell accordingly.The influence exerted on the market byinvestment funds and speculators re-sulted in an acceleration of the decline.
36
Nestlé is the world’s leading manufacturer of chocolate andconfectionery. The Nestlé range of chocolate tablets and bars,specialities and boxed chocolates includes both strategicinternational brands, like Nestlé, Crunch, KitKat, Smarties, Lion,After Eight, Quality Street and Baci, and brands such asButterfinger, Baby Ruth, Charge, Femina or Perugina that arespecific to a geographic region or country. The principal brandsin sugar confectionery are Polo and Frutips. In sweetenedand unsweetened biscuits, the business is concentrated inLatin America, where the Group owns several brands, includingSão Luiz, McKay and La Rosa.
The American range of Flipz featuresa new variety with peanuts.After its success in the United States,this product has been introducedin the United Kingdom.
Milky Bar and Jelly Tots:two children’s favouritesin a single product.
Cocoa pricesAverage monthly pricesexpressed in USc/ per lb
55
65
75
85
199819971996
Brought to you by Global Reports

Even though the supply deficit will inev-itably continue through 1998/99 – forthe third year in a row – the price trendhas not changed, as chocolate manufac-turers have reduced their cover.
SalesChocolate and confectionery sales werehampered by the effects of the eco-nomic problems in Asia and Russia, butoverall tonnage volume reached thesame level as in the previous year.
Sales in Europe recovered in 1998with the launch of several new products.These included in the United KingdomFlipz, a chocolate-covered pretzel, andwhite chocolate After Eight; in Germany,Mini Smarties – small sweets filled withmilk chocolate, to appeal to youngSmarties consumers – and Yes PetitsFours, triangular Yes cakes in a presen-tation box for serving at the table; andin Hungary, Boci bars. Two successful
Smarties concepts – Smarties Giant andSmarties Mini Eggs – were introduced ina number of additional markets.
In the United States a new choco-late ball concept, tied in with the Disneyfilm “A Bug’s Life”, was successfullylaunched.
In Japan, KitKat sales benefited fromnew packaging, and sales hit a recordhigh.
In China, some economic slowdownand excess capacity in the confectioneryindustry demand maximum flexibility.Nestlé successfully launched a new,low-priced wafer and total sales rosesharply, albeit from a low base.
Sugar confectionery under the Fru-tips brand has been developing well inthe ASEAN (Association of South-EastAsian Nations) countries. In Malaysia, anew factory came onstream to supplythe ASEAN markets and growth, espe-cially in this country, has been highlysatisfactory.
37
A new, attractivepresentation:Yes Petits Fours.
Two new packageshave boostedKitKat sales in Japan.
A fresh approach for After Eight,the best-selling chocolatemint, has been launched in theUnited Kingdom.
Brought to you by Global Reports

Several Milky Bar novelties have provedpopular in South Africa, as have newjelly sweets made without gelatine.In Latin America a biscuit was launchedfor the first time under the Prestigioconfectionery brand. In North America,Treasures, a new seasonal range, wasintroduced. The Canadian businesscontinues to make good progress, witha gratifying increase in market shares.
ProfitDifficult conditions in Eastern Europe,particularly Russia, had a negative impacton trading profit. On the other hand,results improved in Latin America and,to a lesser extent, in Western Europe.
Capital expenditureCapital expenditure declined from Fr.435 million in 1997 to Fr. 388 million.Capacity increases related to the intro-duction of new products and to the re-organisation of production facilities inLatin America. In addition, a new pro-duction centre for sugar confectionerywas established in Malaysia.
AcquisitionsIn Russia, two new acquisitions in Perm(Kamskaya) and Barnaul (Altai) havebeen added to the existing businesses ofRossiya and Konditer in Samara.
38
Mini Smarties, for small children,launched in the German market.
Frigor, the chocolatesensation, is one of Nestlé’sgreat Swiss specialities.
Brought to you by Global Reports

Prepared dishes and cooking aids (and miscellaneous activities)
1998 1997 1996
Sales 18 765 17 660 15 960
Trading profit 1 617 1 525 1 344
Capital expenditure 442 445 450
Millions of Swiss francs
Brought to you by Global Reports

SalesThe development of prepared dishesand cooking aids is the Group’s priorityin the culinary sector. Sales continuedto increase at a satisfactory rate in 1998,thanks to the good results achievedby traditional dehydrated bouillons,soups and sauces and to the outstand-ing performance of frozen and refriger-ated products in the United States and
Europe. The Herta range of meat-basedrefrigerated products had a good yearin both France and Germany. Sales ofauthentic Italian products under theBuitoni brand also advanced in mostcategories; refrigerated sauces andpastas in Italy did particularly well.
These successes reflected an inten-sive programme of innovation and reno-vation in every sector, as well as the
41
The frozen prepared dishes produced by the Group are sold underthree main brands: Stouffer’s in the United States and Findus orMaggi in the other regions of the world. A diversified range ofsoups, bouillons, sauces and culinary preparations, sold primarilyunder the Maggi brand, is adapted in each country to local tastes,recipes and ingredients. Maggi instant noodles are sold in the FarEast-Pacific area, as well as in Europe, Africa and Latin America.Nestlé is present in Italian cuisine with Buitoni pastas and sauces,both refrigerated and shelf stable. The Buitoni range also includesa wide choice of pizzas and frozen dishes. In Europe, a full rangeof delicatessen products and cold meats is available under theHerta brand. The Group also manufactures cold sauces and condi-ments under various brands such as Thomy, Crosse & Blackwelland Winiary.
Miscellaneous activities include products for pets,sold essentially under the Friskies brand.
An exclusive Buitoniproduct whichstrengthens the rangeof refrigerated pastas.
A traditional productof Herta France:tasty ham cookedin its own juice.
A tasty dish from MaggiGermany’s very successfulPastaria range:fusilli with cheese sauce.
Brought to you by Global Reports

increased penetration of cooking aids,especially in Eastern Europe. On theother hand, growth in sales of Asiannoodles suffered from the effects of thecrisis in South-East Asia.
Maggi Grand Velouté, a new genera-tion of instant soups in the form of apaste to be diluted with water, has beenlaunched in France. A litre of homemadesoup can be prepared from a small jarwith a flick of the wrist, offering con-venience and excellent value for money.
In line with a policy of offering localproducts accessible to people at all in-come levels, several new bouillons wereintroduced in Africa. For young adoles-cents in Germany, Maggi Nudelspassoffers an economical prepared dish ofseasoned noodles.
In the Philippines, Maggi haslaunched an instant rice-based porridgewhich can be eaten for breakfast or as asnack during the day.
For the Chilean market, Maggi Sofritois a paste made of garlic, onion andaromatic herbs to facilitate the everydaycooking of fried dishes.
Skillet Sensations, a new range of frozendishes in bags, was launched in theUnited States under the Stouffer’s brand.Stouffer’s thus strengthens its leadingposition with these easy-to-prepareproducts, offering a unique variety offlavours for both American “home-made” recipes and the Lean Cuisine lineof low-calorie meals.
New prepared dishes and frozensnacks have also been launched inEurope to meet consumer demand forquick, economical and practical meals.These included, in France, the FindusPlat du Jour range in a two portion con-tainer for microwave preparation; in Ger-many, Maggi Rührei auf’s Brot, a crustyroll that is also heated in a microwave;and, in the United Kingdom, New YorkTake Out, light modern dishes to beeaten directly from the package, underthe Crosse & Blackwell brand.
42
A new product of Stouffer’sin the United States:heat-and-serve dishesfor the skillet.
A range of frozen dishesfor the microwave,launched by Findusin France.
An economicalpasta snack, introducedby Maggi in Germany.
In France, Maggi haslaunched a new formof instant soups.
Brought to you by Global Reports

The new Findus pizza, with a self-raisingcrust that gives it an authentic pizzeriaquality, has expanded its presence inEurope, enabling the Group to improveits strong position in this sector.
Pet foodSales increased sharply in Europe whereNestlé has a particularly strong positionin dry pet food, especially for cats.Sales also progressed well in Japan,while volumes remained stable in theUnited States.
The year was marked by the launchof new products and the developmentof the Group’s brands in new marketsand in specialised sales channels.
Friskies Europe introduced Diges-tion +, the first prebiotic dry dog foodsold in supermarkets, while strengthen-ing its position in dry cat food.
In the United States, Friskies has createdDental Diet, the first non-prescription drycat food to reduce the accumulation ofdental plaque and tartar by 25%.
The Alpo brand made a successfulstart in Japan. Mighty Dog, a balanceddiet that meets the specific nutritionaland energy needs of small dogs, waslaunched in Australia.
A new line of dry and wet productsfor dogs and cats, continuing the tra-dition of authentic veterinary recipes, isnow being sold through specialisedchannels in the United States under theDr. Ballard brand.
44
Digestion+, the firstprebiotic dry dog food forsale in supermarkets.
Dental Diet reducesdental plaque andtartar in cats by 25%.
Friskies Ocean FishFlavor is a classic drycat food for sale inthe United States withan irresistible taste.
Dr. Ballard products,made using a uniqueoven-baking process,are sold exclusivelythrough specialisedshops in theUnited States.
Brought to you by Global Reports

ProfitTrading profit increased and the tradingmargin was stable, despite the shortterm dilution arising from the integrationof Spillers pet food in Europe. The under-lying improvement in profitability re-flects continuing progress in the culinarysector and the disposal of lower valueadded products.
Capital expenditureCapital expenditure was flat at Fr. 442million. In the United States, capacitywas increased for foodservice productsand for pet food, and an additionalproduction line was set up for frozenprepared meals. In Brazil, a recently ac-quired pet food factory was modernised.
45
Alpo dog foods arenow available in Japan.
Felix and Fido – two resounding successesin the European cat and dog food markets.
AcquisitionsIn 1998 Nestlé continued to strengthenits position in the world pet food market.In Europe, the acquisition of Spillersgives Friskies Europe a portfolio of well-known brands (in particular Felix andFido), strong positions in the UnitedKingdom and Northern Europe, andproducts which are adapted to therapidly growing specialised sales cir-cuits.
The acquisition of Jupiter in Hungaryand the Darling brand enables the Groupto establish a foothold in Hungary andthe Czech Republic, as a good base forexpansion into the CEFTA (Central Euro-pean Free Trade Agreement) countriesand Eastern Europe.
In South Africa, a market with greatpotential, Nestlé has enlarged the basefor its pet food activities through the for-mation of a joint venture.
Brought to you by Global Reports

The end consumer is hardly aware ofthe products of Nestlé FoodServices.They nevertheless constitute an impor-tant part of the company’s business,since more and more people are eatingmeals away from home.
In addition to products developedspecifically for industry professionals,Nestlé FoodServices supplies the Group’sstrategic brands to the out-of-homesector. However, to meet the specialrequirements of such diverse segmentsas catering companies, fast-food chainsand airlines, the products must beadapted to the customers’ respectiveoperational constraints.
Nestlé FoodServices is one of thepillars of growth for the Group’s activi-ties. Its top priorities are to satisfy theoperating needs of its customers and toexpand its business geographically.
Automatic vending machinesand beverage systemsIn 1998 efforts were focused on imple-menting a worldwide growth plan forbeverages, designed to increase thepenetration of the Nescafé brand (withits new visual image for vendingmachines and beverage systems) andof other types of hot or cold drinks,
including Milo and Nestea, so that theyare available to consumers anywhere,any time. For this purpose, drawing onthe Group’s expertise in automated dis-tribution, significant investments weremade in the pool of vending machinesbearing the Nescafé brand.
Commercial andinstitutional restaurantsThe product range is constantly beingrenewed and adapted in accordancewith the specific requirements of eachsector. In addition to traditional culinaryingredients like the dehydrated productssold under the Chef, Maggi and Minor’sbrands, Nestlé FoodServices providesoperators with meal components, as wellas frozen foods under the Stouffer’s,Davigel and Findus brands. In Europe, aline of frozen products for professionalshas been successfully introduced in theNetherlands and Germany.
Food Ingredients Specialities (FIS)This company manages the develop-ment, manufacture and sale of flavoursand flavouring ingredients for use withinthe Group and by third parties. FIS hasdeveloped considerable technical exper-tise and is recognised as the leader insavoury flavours.
FIS is ranked among the foremostFlavour Houses thanks to its strongfundamental knowledge of flavours andflavouring systems and to its compre-hensive understanding of their use infood products – an understanding de-rived from the extensive product for-mulation expertise available within theNestlé group, covering an extremelywide range of product categories.
46
Foodservice
Although the sales ofNestlé’s foodserviceactivities are dividedamong the four majorcategories of foodproducts discussedon the previouspages, it is worthdevoting a separatesection to them, asthey are designedfor a special groupof customers:professionals in therestaurant and hotelindustries.
Launch of a rangeof frozen foodsin the Netherlands.
Brought to you by Global Reports

Pharmaceutical products
1998 1997 1996
Sales 3 443 3 199 2 451
Trading profit 915 825 573
Capital expenditure 81 66 84
Millions of Swiss francs
Pharmaceutical productsalso include the infantcosmetics soldthrough pharmaciesin several countries.
Brought to you by Global Reports

AlconAlcon continued to report strong growthand excellent performance in 1998. Salesset a new record of Fr. 3.1 billion, an in-crease of 7%, despite economic uncer-tainties and monetary upheavals in vari-ous markets resulting in unfavourableexchange rate trends. Real internalgrowth was stimulated by the introduc-tion of new products and the selectiveacquisitions of the past few years.
The use of new technologies – oftenexpensive – to improve the quality of life,the increase in the average age of thepopulation and the struggle against newdiseases have caused health care coststo rise over the past decade. The govern-ment policies that have been imple-mented in this area have put pressure onprices everywhere. In this challengingenvironment, Alcon has become themost successful company in the eye
49
In 1977, Nestlé diversified into pharmaceuticals by acquiring AlconLaboratories, which has become the worldwide leader in ophthal-mology. Alcon’s activities are divided into three segments: instru-ments and equipment for eye surgery, as well as intraocular lensesand products used during operations, such as AcrySof, Legacy,Accurus, BSS, Viscoat and Custom Packs; ophthalmic drugs,including Tobradex, Betoptic, Patanol and Ciloxan, with the recentaddition of an otic drug, Cipro HC Otic; and solutions for cleaningcontact lenses – Opti-Free, Opti-One and Supra Clens.In 1989, Nestlé and L’Oréal formed Galderma, a joint venture indermatology. This company offers dermatologists a range for thetreatment of skin complaints, including Différine, which hasbecome the retinoid of choice for the topical treatment of acne,Metrogel/Rozex, which is indicated for rosacea, and most recentlyLocéryl for the treatment of nail fungus. Galderma also hasproducts to accompany these treatments, such as Cetaphil, a rangeof cleansers and moisturisers, and Helioblock sunscreens.
MonarcH provides surgeonswith a unique instrumentfor implanting the AcrySofacrylic intraocular lensin the eye of the patient.
Azopt, a topical anhydraseinhibitor, is highly effective inreducing the intraocular pressureassociated with glaucoma.
Brought to you by Global Reports

care business by concentrating effortson the needs of ophthalmologists and byoffering them a comprehensive rangeof products. At the same time, the com-pany has continued to develop new in-novative products, to maximise itsglobal presence, to increase productivityin order to lower production costs, toreduce administrative and operatingexpenses and to maintain a positive,steadily improving workplace environ-ment.
The highlights of 1998 included theintroduction in the United States ofAzopt, a carbonic anhydrase inhibitorprescribed for glaucoma. Particularlynoteworthy was the vigorous growth ofPatanol, which expanded the U.S. ocularallergy market by more than 30% in theyear following its introduction, thanks toits therapeutic efficacy and to creativepromotion. The AcrySof intraocular lenshas again made spectacular progress onthe world market. At the same time,global sales of Alcon’s flagship productsfor cleaning contact lenses, Opti-Freeand Supra Clens, have continued to reg-ister increases in market share.
1998 was also marked by the acquisitionof a worldwide licence for Cipro HC Otic,a combination anti-infective/anti-inflam-matory product for ear infections. Whilemaintaining and strengthening its strongposition in ophthalmology, Alcon madea strategic decision to enter the oticmarket. The ear, like the eye, is subject toinflammations and infections that aretreated with forms of medication verysimilar to those used in eye care, whichare prescribed by specialists, pediatri-cians and general practitioners who arealready the target group for the market-ing of ophthalmic products. Nestlé’sentry into the otic market, based onAlcon’s expertise, will expand its pres-ence in the field of specialised medicine.
With increasing market sharesthroughout the world, close attention tothe research and development of newproducts, the selective acquisition ofnew technologies and the intensifiedtraining, motivation and development ofits personnel, Alcon is ideally positionedfor the future.
GaldermaThis joint subsidiary of Nestlé and L’Oréalin the field of dermatology again record-ed rapid growth in 1998. Sales increasedby 25% to almost Fr. 490 million.
50
The contact lens cleanersOpti-Free and Supra Clenshave been successfullylaunched in Japan.
Brought to you by Global Reports

Setting new sales records during theyear, Différine gel has become Galder-ma’s leading product. It continues to bethe world’s most popular topical treat-ment for acne. The new markets openedup in 1998 included China, Mexico andIsrael. Further additions to the Différinerange are being successfully introduced,including Différine solution in the UnitedStates and Différine cream in Canada.Many launches of these new forms arescheduled for 1999.
The Metrogel/Rozex products, whichare used to treat rosacea, made furthervery satisfactory progress.
The Cetaphil range of cleansers andmoisturisers to accompany dermatologi-cal treatments continues to meet withan excellent reception from dermatolo-gists throughout the world.
ProfitTrading profit rose by more than 10%and there was once again a significantimprovement in trading margin. Alconmaintained the high level of profitabilityachieved through its previous cost cut-ting programmes. There was a signifi-cant increase in the trading margin atGalderma, reflecting the strong growthof major products.
51
Différine solution and cream,two additions to Galderma’smost popular lineof acne medications.
Mistamine, the newantihistamine tablet for thetreatment of urticaria.
Capital expenditureCapital expenditure increased to Fr. 81million from Fr. 66 million in 1997. Theincrease related to the expansion ofAlcon’s research and development facilityat Fort Worth (United States). Galdermahas been investing in a new factory inMontreal (Canada), which is due to openin 1999.
AcquisitionsAs mentioned above, Alcon succeededin obtaining a worldwide licence forCipro HC Otic, a prescription drug tocombat infections of the outer ear. It alsomade minor acquisitions to add to itsproduct offer in the area of vitro-retinaloperations.
Following the purchase of the derma-tological range of Darrow in Brazil,Galderma became one of the leaders inits field in that country.
In addition, at the end of the yearGalderma acquired the dermatologicalproducts of Nycomed-Amersham in theNordic countries, which will enable it toestablish a presence in that region. Final-ly, a purchase agreement was signedwith Roche for Locéryl, an anti-fungalproduct indicated for mycoses of thenails, which will be added to Galderma’sdermatological range starting in 1999.
Brought to you by Global Reports

L’OréalNestlé owns 49% of Gesparal, theholding company that controls L’Oréal,with the Bettencourt family holding51%. The world’s leading cosmeticscompany has continued its rapid devel-opment. L’Oréal’s annual report and itswebsite (www.loreal-finance.com) pro-vide detailed information about its activi-ties and results. Consolidated sales roseby 9% in 1998, to 75.4 billion Frenchfrancs. Net profit showed a furtherhealthy increase compared with 1997.
The group’s progress in WesternEurope and North America produced adouble-digit increase in profit before tax-ation for the fourteenth consecutiveyear. In 1998, L’Oréal continued itspolicy of investing in developing coun-tries, which should be a basis for me-
dium-term growth, despite the difficul-ties that some of them are currentlyexperiencing.
On July 1, 1998, the Group boughtSoft-Sheen, which leads the North Amer-ican market for ethnic hair products.
In December, L’Oréal announced aplan for the merger of its pharmaceuticalsubsidiary Synthélabo with Sanofi, asubsidiary of Elf Aquitaine. This plan,which should be finalised in the springof 1999, will create a new French phar-maceutical entity, with impressive world-wide growth potential stemming fromthe combination of the companies’respective research capabilities.
52
Associated companies
In these companies,Nestlé holds aninterest of at least20% but does notexercise manage-ment control.These companies areincluded in thefinancial statementsby the equity method.Their net resultsappear, in proportionto Nestlé’s participa-tion, in the Group’sconsolidated incomestatement under“Share of results ofassociated compa-nies”. The Group’sshare of their netassets is shown inthe consolidatedbalance sheet under“Financial assets”.
1998 1997 1996
Nestlé’s share in the salesof associated companies 5 156 5 248 4 523
Nestlé’s share in the resultsof associated companies 300 256 233
Millions of Swiss francs
Noa, the new perfumefrom Cacharel.
Féria, the world’s leading brandin hair colouring for young people,by L’Oréal Paris.
Lancôme has inventedVitabolic, daily skin careand a new source ofluminosity and radiance.
Brought to you by Global Reports

54
General information
Manufacture and sale of productsPosition in 1998 in markets manufacturing and selling productsunder Nestlé processes and trademarks.
Canada 11 �����
United States 59 �����
Mexico 16 �����
Guatemala 1 ����
Nicaragua 1 ���
El Salvador 1 �����
Costa Rica 3 �����
Panama 3 �����
Puerto Rico 1 �����
Cuba 2 ����
Dominican Republic 3 ����
Jamaica 2 ����
Trinidad and Tobago 1 ����
Venezuela 4 �����
Colombia 3 �����
Ecuador 4 �����
Peru 2 �����
Chile 7 �����
Brazil 25 �����
Uruguay 1 �����
Argentina 7 �����
Number of factories
1998 1997
Europe 233 210
Americas 157 156
Africa, Asia
and Oceania 132 129
Total 522 495
The figure in bold after the country
denotes the number of factories.
Beverages
Milk products, nutrition
and ice cream
Prepared dishes and
cooking aids
Chocolate and confectionery
Pharmaceuticals
� Local production (may
represent production in
several factories)
� Local production and imports
� Imports (may, in a few
particular cases, represent
purchases from third parties
in the market concerned)
Brought to you by Global Reports

55
Greece 5 �����
Turkey 5 �����
Germany 30 �����
Austria 2 �����
Hungary 2 �����
Romania 1 ��
Poland 5 �����
Czech Republic 10 �����
Slovakia 1 �����
Morocco 1 �����
Tunisia 1 �����
Syria 1 ����
Israel 10 �����
Egypt 4 �����
Lebanon 1 �����
United Arab Emirates 1 ���
Saudi Arabia 1 �����
People’s Rep. of China 10 �����
Hong Kong 1 �����
Russia 6 �����
Pakistan 2 �����
Bangladesh 1 ���
Cambodia 1 �����
India 6 �����
Sri Lanka 2 ����
Thailand 8 �����
Vietnam 3 ���
Malaysia 9 �����
Singapore 1 �����
Indonesia 5 �����
Australia 15 �����
Pacific Islands 4 �����
New Zealand 4 �����
Taiwan 2 �����
Republic of Korea 1 �����
Japan 4 �����
Zimbabwe 1 �����
South Africa 14 �����
Senegal 1 ����
Guinea 1 ����
Ivory Coast 2 ����
Ghana 1 ����� Nigeria 2 ����
Cameroon 1 ����
Republic of Ireland 3 �����
United Kingdom 26 �����
Netherlands 8 �����
Belgium 4 �����
France 40 �����
Switzerland 9 �����
Italy 30 �����
Portugal 6 �����
Norway 4 �����
Sweden 7 �����
Finland 3 �����
Denmark 2 �����
Brought to you by Global Reports

Nestlé can trace its origins back to 1866, when the first Europeancondensed milk factory was opened in Cham, Switzerland. Thefounder of this factory, Anglo-Swiss Condensed Milk Company,was merged in 1905 with Farine lactée Henri Nestlé.The very high child mortality rate which made itself felt in the19th century was in particular due to the fact that there was noproduct to meet the nutritional needs of nursing infants. In orderto improve this state of affairs, Henri Nestlé had devoted severalyears to the development of his Milk Food which was based onthe scientific insights of the time as well as on his own findings.He had also developed a specific production process, thus ensuringconstant product composition and quality. In 1867 he marketedhis Milk Food and created the symbol of the “Nest” (in German,Nestlé means “little nest”) which has remained the focal elementof the Company’s identity.
56
History
Henri NestléFounder of Farine lactéeHenri Nestlé
1867Farine lactéeHenri Nestlé
1929Peter-Cailler-KohlerChocolats Suisses S.A.(Merger with Nestlé)
1905Anglo-SwissCondensed Milk Co.(Merger with Nestlé)
1938Developmentof Nescafé
Brought to you by Global Reports

Although milk and infant nutrition goback to the firm’s origin, many otherfood products came to widen its rangeover the years: chocolate, instant drinks(the Nescafé process was developed in1938), culinary, refrigerated and frozenproducts, ice cream, mineral water andpetfoods.
Today, Nestlé is the world’s largestfood firm. Its products which are madein 522 factories distributed over 81 coun-tries, are being sold all over the world.
Right from its beginnings, the Nestlégroup has devoted itself not only to foodin general, but has also implementedsolutions to the nutritional problemsbeing faced by mankind. These prob-lems may be specific to certain agegroups (babies, elderly people), to given
situations (hospitalized patients) or theymay be due to economic phenomena(undernutrition, mal-nutrition) or socialdata (longer life expectation, obesity).For a long time, Nestlé has built upknow-how and knowledge which – to-gether with its potential and its researchand development activities – have giventhe Group an excellent position in allfields of nutrition.
57
1947Nestlé Alimentana S.A.(new name after themerger with Maggi)
Principalacquisitions
1977Nestlé S.A.
1970Libby
1960Crosse & Blackwell
1973Stouffer
1971Ursina-Franck
1985Hills BrothersCoffee
1988Rowntree
1992Perrier
1978Chambourcy
1985Friskies
1998San Pellegrino
1986Herta
1998Spillers Petfoods
1962Findus
1969Vittel
1974L’Oréal(minority interest)
1977Alcon
1985Carnation
1988Buitoni-Perugina
1993Finitalgel
1994Alpo
Brought to you by Global Reports

Nestlé 1998
Manag
ement R
eport
Brought to you by Global Reports

1
Consolidated accountsof the Nestlé Group 59
Annual report of Nestlé S.A. 93
Table of contents
Brought to you by Global Reports

Consolidated accounts of the Nestlé Group
61 Consolidated income statementfor the year ended 31st December 1998
62 Consolidated balance sheet as at 31st December 199864 Consolidated cash flow statement
for the year ended 31st December 199865 Consolidated statement of changes in equity66 Annex66 Accounting policies 67 Valuation methods and definitions70 Changes in accounting policies and modification
of the scope of consolidation71 Notes86 Principal exchange rates87 Report of the Group auditors88 Financial information – ten year review90 Companies of the Nestlé Group
Brought to you by Global Reports

In millions of Swiss francs Notes 1998 1997
Sales to customers 1 71 747 69 998Cost of goods sold (35 963) (35 816)Distribution expenses (4 887) (4 713)Marketing and administration expenses (22 465) (21 142)Research and development costs (807) (770)Restructuring costs (224) (360)Amortisation of intangible assets (301) (140)
Trading profit 1 7 100 7 057Net financing costs 2 (1 168) (1 056)Net non-trading items 3 189 (63)
Profit before taxation 4 6 121 5 938Taxation 5 (2 002) (1 842)
Net profit of consolidated companies 4 119 4 096Share of profit attributable to minority interests (128) (170)Share of results of associated companies 6 300 256
Net profit for the year 4 291 4 182
As percentages of salesTrading profit 9.9% 10.1%Net profit for the year 6.0% 6.0%
Earnings per share(in Swiss francs)Basic earnings per share 7 109.2 106.3Fully diluted earnings per share 7 108.1 104.4
Consolidated accounts of the Nestlé Group 61
Consolidated income statementfor the year ended 31st December 1998
Brought to you by Global Reports

In millions of Swiss francs Notes 1998 1997
Assets
Current assetsLiquid assets 8– Cash and cash equivalents 4 984 3 412– Other liquid assets 2 979 4 690
7 963 8 102Trade and other receivables 9 10 991 9 852Inventories 10 6 948 6 968Prepayments and accrued income 777 749
Total current assets 26 679 25 671
Fixed assetsTangible fixed assets 11– Gross value 40 321 39 169– Accumulated depreciation (21 895) (20 984)
18 426 18 185Financial assets– Investments in associated companies 12 1 525 1 404– Deferred tax assets 19 2 040 1 836– Other financial assets 13 1 697 1 930
5 262 5 170Intangible assets 14 6 074 2 555
Total fixed assets 29 762 25 910
Total assets 56 441 51 581
62 Consolidated accounts of the Nestlé Group
Consolidated balance sheet as at 31st December 1998before appropriations
Brought to you by Global Reports

In millions of Swiss francs Notes 1998 1997
Liabilities and equity
Current liabilitiesTrade and other payables 15 8 511 8 179Financial liabilities 16 10 545 9 713Tax payable 826 841Accrued liabilities and deferred income 2 709 2 252
Total current liabilities 22 591 20 985
Medium and long term liabilitiesFinancial liabilities 17 4 047 3 193Employee benefit liabilities 18 2 121 2 011Deferred tax liabilities 19 1 395 1 131Tax payable 97 63Provisions 2 594 2 775
Total medium and long term liabilities 10 254 9 173
Total liabilities 32 845 30 158
Minority interests 572 817
EquityShare capital 20 404 404Share premium and reserves– Share premium 5 926 5 926– Reserve for treasury shares 588 282– Translation reserve 226 417– Retained earnings 16 468 13 859
23 208 20 48423 612 20 888
Less:Treasury shares 21 588 282
Total equity before appropriations 23 024 20 606
Total liabilities and equity 56 441 51 581
Consolidated accounts of the Nestlé Group 63
Brought to you by Global Reports

In millions of Swiss francs Notes 1998 1997
Operating activitiesNet profit of consolidated companies 4 119 4 096Depreciation of tangible fixed assets 11 2 609 2 677Amortisation of intangible assets 14 301 140Increase/(decrease) in provisions and deferred taxes (41) 84Decrease/(increase) in working capital 22 (506) 328Other movements (110) 76Operating cash flow (a) 6 372 7 401
Investing activitiesExpenditure on tangible fixed assets (3 061) (3 261)Sale of tangible fixed assets 487 289Acquisitions 23 (4 031) (903)Disposals 24 236 332Income from associated companies 75 68Other movements 117 (168)Cash flow from investing activities (6 177) (3 643)
Financing activitiesDividend for the previous year (1 376) (1 180)Purchase of treasury shares (net) (306) (14)Movements with minority interests (167) (107)Bonds issued 1 009 738Bonds repaid (1 238) (1 404)Increase/(decrease) in other medium/
long term financial liabilities 230 (22)Increase/(decrease) in short term financial liabilities 1 659 501Decrease/(increase) in marketable securities 1 258 (677)Decrease/(increase) in short term investments 418 (918)Cash flow from financing activities 1 487 (3 083)
Translation differences on flows (23) (14)Increase/(decrease) in cash and cash equivalents 1 659 661Cash and cash equivalents at beginning of year 3 412 2 786Effects of exchange rate changes on opening balance (87) (35)Cash and cash equivalents retranslated at beginning of year 3 325 2 751
Cash and cash equivalents at end of year 8 4 984 3 412
(a) Taxes paid amount to Fr. 1932million (1997: Fr. 1893 million).Interest received/paid does notdiffer materially from interestshown under note 2 “Net financ-ing costs”.
64 Consolidated accounts of the Nestlé Group
Consolidated cash flow statementfor the year ended 31st December 1998
Brought to you by Global Reports

Reserve Less:Share for treasury Translation Retained Total Share Treasury Total
In millions of Swiss francs premium shares reserve earnings reserves capital shares equity
Equity as published as at31st December 1996 5 926 268 245 15 363 21 802 404 (268) 21 938
Adjustment for the returnto historical cost of tangiblefixed assets 131 (4 568) (4 437) (4 437)
Adjustment for theintroduction of IAS 12 revdeferred taxes 76 76 76
Equity restated as at31st December 1996 5 926 268 376 10 871 17 441 404 (268) 17 577
Currency retranslation 41 41 41Net profit 4 182 4 182 4 182Movement of treasury shares (net) 14 (14) — (14) (14)Dividend for the previous year (1 180) (1 180) (1 180)
Equity as at31st December 1997 5 926 282 417 13 859 20 484 404 (282) 20 606
Currency retranslation (191) (191) (191)Net profit 4 291 4 291 4 291Movement of treasury shares (net) 306 (306) — (306) (306)Dividend for the previous year (1 376) (1 376) (1 376)
Equity as at31st December 1998 5 926 588 226 16 468 23 208 404 (588) 23 024
Consolidated accounts of the Nestlé Group 65
Consolidated statement of changes in equity
Brought to you by Global Reports

Accounting policies
Accounting convention and accounting standardsThe Group accounts comply with International AccountingStandards (IAS) issued by the International AccountingStandards Committee (IASC) and with the Standing Interpre-tations issued by the Standing Interpretation Committee ofthe IASC (SIC).
The accounts have been prepared under the historicalcost convention and on an accrual basis. All significant con-solidated companies have a 31st December accounting yearend. All disclosures required by the 4th and 7th EuropeanUnion company law directives are provided.
Scope of consolidationThe Group accounts comprise those of Nestlé S.A. and of itsaffiliated companies, including joint ventures, and associatedcompanies (the Group). Details of Nestlé Group companiesare given on page 90.
Consolidated companiesCompanies in which the Group has a participation, usually amajority, and where it is responsible for the management, arefully consolidated. This applies irrespective of the percentageof the participation in the share capital. Minority interests inequity, as well as in the net results, are shown separately inthe Group accounts.
Proportional consolidation is applied for companiesowned, controlled and managed jointly with partners. Theindividual assets, liabilities, income and expenditure areconsolidated in proportion to the Nestlé participation in theequity (usually 50%).
Newly acquired companies are consolidated from theeffective date of acquisition, using the purchase method.
Associated companiesCompanies where the Group has a participation of 20%or more but does not exercise management control areaccounted for by the equity method. The net assets andresults are recognised on the basis of the associates’ ownaccounting policies, which may differ from those of theGroup.
Foreign currenciesIn individual companies, transactions in foreign currenciesare recorded at the rate of exchange at the date of the trans-action or, if hedged forward, at the rate of exchange underthe related hedge instrument. Assets and liabilities in foreigncurrencies are translated at year end rates. Any resultingexchange differences are taken to the income statement.
On consolidation, assets and liabilities of Group compa-nies denominated in foreign currencies are translated intoSwiss francs at year end rates. Income and expense items aretranslated into Swiss francs at the annual average rates ofexchange or, where known or determinable, at the rate on thedate of the transaction for significant items.
Differences arising from the retranslation of opening netassets of Group companies, together with differences arisingfrom the restatement of the net results for the year of Groupcompanies from average or actual rates to year end rates, aretaken to reserves.
The balance sheet and net results of Group companiesoperating in hyper inflationary economies are restated for thechanges in the general purchasing power of the local cur-rency, using official indices at the balance sheet date, beforetranslation into Swiss francs at year end rates.
HedgingDerivatives are used to manage operational exposures toforeign exchange, interest rate and commodity price risks.They are entered into with high credit quality financial institu-tions, consistent with specific approval, limit and monitoringprocedures. The instruments used to hedge foreign currencyflows and positions mainly include forward foreign exchangecontracts, options, currency futures and currency swaps.Foreign exchange gains and losses on hedging instrumentsare matched with foreign exchange gains and losses on theunderlying asset or liability. When an anticipated future trans-action has been hedged and the underlying position has notbeen recognised in the financial statements any change in thefair value of the hedging instrument is not recognised in theincome statement for the period.
Where derivatives are held for the long-term and are usedto manage interest rate risks, they are accounted for on thecost basis (where the underlying asset or liability is accountedfor on the cost basis) and payments and receipts relating tothe instruments are recognised under net financing costs asthey accrue. In other cases the instruments are carried at fairvalue and changes in the market value are taken to income.
66 Consolidated accounts of the Nestlé Group
Annex
Brought to you by Global Reports

Commodity instruments are used to ensure the Group’saccess to raw materials at an appropriate price. Outright pur-chase transactions are recorded at the contracted rates.Changes in the fair value of open commodity instruments arenot recognised until the actual purchase transactions arerecognised in the financial statements.
Segmental informationSegmental information is based on two segment formats: theprimary format reflects the Group’s management structure,whereas the secondary format is product oriented.
The primary segment format – by management responsi-bilities and geographic area – represents the Group’s man-agement structure. The principal activity of the Group is thefood business, which is managed along three geographiczones. The other activities, mainly pharmaceutical productsand water, are managed on a global basis. The secondarysegment format representing products is divided into fivecategories (segments).
Segment results represent the contribution of the differ-ent segments to central overheads, research and develop-ment costs and the profit of the Group. Unallocated itemscomprise mainly corporate expenses, research and develop-ment costs, amortisation of intangible assets and, for theproduct segments, restructuring and other costs. Specificcorporate and research and development expenses are allo-cated to the corresponding segments.
Segment assets comprise tangible fixed assets, trade andother debtors, inventories and prepayments and accruedincome. Unallocated items represent mainly corporate andresearch and development assets, including intangible as-sets. Liabilities comprise trade and other creditors, accruedliabilities and deferred income. Eliminations represent inter-company balances between the different segments.
Segment assets and liabilities by management responsi-bilities and geographic area represent the situation at the endof the year. Assets by product group represent the annualaverage as this provides a better indication of the level ofinvested capital.
Valuation methods and definitions
Sales to customersSales to customers represent the sales of products andservices rendered to third parties, net of sales rebates andsales taxes.
Research and development costsResearch and development costs are charged to the incomestatement in the year in which they are incurred.
Net financing costsThis item includes the interest expense on borrowings fromthird parties as well as the interest income earned on fundsinvested outside the Group. Exchange differences and theresults of foreign exchange and interest hedge operationslinked to external loans, intra-Group short term loans anddeposits in foreign currencies are also included under thisheading.
For hyper-inflationary economies, only the real net financ-ing costs appear under this heading. The inflationary portionrelating to the financing of the net working capital, whichrepresents a trading expense, is included under “Marketingand administration expenses”. The balance of the inflationaryportion, relating to the financing of fixed assets, is treatedas an exchange difference and shown under “Net non-tradingitems” since it is offset by a devaluation in the exchange rateof the domestic currency.
TaxationThis includes current taxes on profit and other taxes such astaxes on capital. Also included are actual or potential with-holding taxes on current and expected transfers of incomefrom Group companies and tax adjustments relating to prioryears.
Deferred taxation is the tax attributable to the temporarydifferences that appear when taxation authorities recogniseand measure assets and liabilities with rules that differ fromthose of the Group accounts.
Deferred taxes are calculated under the liability methodat the rates of tax expected to prevail when the temporarydifferences reverse. Any changes of the tax rates are recog-nised to the income statement. Deferred tax liabilities arerecognised on all taxable temporary differences with theexception of non deductible goodwill. Deferred tax assets arerecognised on all deductible temporary differences providedthat it is probable that future taxable income will be available.
Consolidated accounts of the Nestlé Group 67
Brought to you by Global Reports

Liquid assetsLiquid assets include cash at banks and in hand, cash equiva-lents, marketable securities and other liquid funds and shortterm investments. Cash equivalents consist of bank depositsand fixed term investments whose maturities are threemonths or less from the date of acquisition. Short term invest-ments consist of bank deposits and fixed term investmentswhose maturities are higher than three months from the dateof acquisition.
Marketable securities, which are held to maturity, arevalued at the lower of cost or market value, while those heldfor trading purposes are carried at market value. Any resultinggains or losses are recognised in the income statement.
InventoriesRaw materials and purchased finished goods are valued atpurchase cost. Work in progress and manufactured finishedgoods are valued at production cost. Production cost includesdirect production costs and an appropriate proportion ofproduction overheads and factory depreciation.
Movements in the most important raw materials inven-tories and purchased finished goods are accounted for usingthe FIFO (first in, first out) method. The weighted average costmethod is used for other inventories.
A provision is established when the net realisable value ofany inventory item is lower than the values calculated above.
Prepayments and accrued incomePrepayments and accrued income comprise payments madein advance relating to the following year, and income relatingto the current year which will not be received until after thebalance sheet date.
Accrued liabilities and deferred incomeAccrued liabilities and deferred income comprise expensesrelating to the current year which will not be paid until afterthe balance sheet date and income received in advance, relat-ing to the following year.
68 Consolidated accounts of the Nestlé Group
Tangible fixed assetsTangible fixed assets are shown in the balance sheet at theirhistorical costs. Depreciation is provided on the straight linemethod so as to amortise the initial cost over the estimateduseful lives, which are as follows:
Buildings. . . . . . . . . . . . . . . . . . . . . . . . . . . . . . . . . 25-50 yearsMachinery and equipment . . . . . . . . . . . . . . . . . . 10-15 yearsTools, furniture, information technology
and sundry equipment . . . . . . . . . . . . . . . . . . . . 3-8 yearsVehicles . . . . . . . . . . . . . . . . . . . . . . . . . . . . . . . . . . . . . 5 years
Financing costs incurred during the course of construc-tion are expensed. Land is not depreciated. Premiums capi-talised for leasehold land or buildings are amortised over thelength of the lease.
Depreciation of tangible fixed assets is allocated to theappropriate expense headings in the income statement.
Leased assetsAssets acquired under long term finance leases are capi-talised and depreciated in accordance with the Group’s policyon tangible fixed assets. The associated obligations areincluded in financial liabilities.
Rentals payable under operating leases are charged to theincome statement as incurred.
Other financial assetsLong term receivables included under this heading arediscounted to their net present value at the date of inception.Net recoveries are included under “Non-trading income”.
Other investments primarily comprise unquoted participa-tions of minor importance in various companies where theNestlé Group does not exercise management control as wellas some securities. They are carried at cost less provisions forany permanent impairment in value.
Brought to you by Global Reports

Intangible assetsAs from 1st January 1995, the excess of the cost of an acqui-sition over the fair value of the net tangible assets is capi-talised. Previously these amounts had been written offthrough reserves. This value comprises intangible assets ac-quired, in particular trademarks and industrial property rights,as well as business goodwill. The different components arenot separately identified and valued.
Gains on the disposal of intangible assets acquired priorto 1st January 1995 are taken to reserves to the extent ofamounts previously written off. Any excess is taken to theincome statement. The gain or loss on disposals of intangibleassets acquired after that date is also taken to the incomestatement.
Intangible assets are amortised on a straight line basisover their anticipated useful life but not exceeding 20 years.However, the Group considers that the useful life of intangibleassets will in many cases exceed this period.
The unamortised balance is reviewed annually. Where thebalance exceeds the value of expected future benefits, thedifference is charged to the income statement.
Intangible assets are usually recorded in the currency ofthe acquiring entity.
Current liabilitiesThese include current or renewable liabilities due within amaximum period of one year. Tax payable also includesthe withholding tax on expected transfers from Group com-panies.
ProvisionsThis item includes provisions for restructuring and contin-gencies which may arise and which have been prudentlyprovided.
Employee benefitsPensions and retirement benefitsThe majority of Group employees are eligible for retirementbenefits under defined benefit and defined contributionplans provided through separate funds, insurance plans orunfunded arrangements.
For defined benefit plans the amount charged to theincome statement consists of current service cost whichincludes the normal cost of financing benefits in respect offuture years of service and net interest on the net assetsor obligations. If the case arises, variations from the currentservice cost are spread over the expected working lives ofemployees or recognised immediately in the case of retirees.Contributions to defined contribution pension schemes arecharged to the income statement as incurred.
Liabilities arising under defined benefit schemes are eitherexternally funded, with the assets of the scheme held sepa-rately from those of the Group in independently administeredfunds, or are unfunded but with provisions maintained in theGroup balance sheet. Any difference between the charge tothe income statement in respect of funded schemes and thecontributions payable to each scheme is recorded in thebalance sheet as a prepayment or a liability.
Post retirement health care and other employee benefitsGroup companies, principally in the United States andCanada, maintain health care and life assurance benefit planswhich cover eligible retired employees. Based on actuarialassumptions these obligations are charged to the incomestatement so as to spread the estimated cost over the expect-ed working lives of the employees. An interest charge onaccumulated liabilities is also made.
The obligations for other employee benefits are recog-nised on the basis of local legislation. They consist mainly ofend of service indemnities, which do not have the characterof pensions.
Consolidated accounts of the Nestlé Group 69
Brought to you by Global Reports

DividendsIn accordance with Swiss law and the Company’s Articlesof Association, dividends are treated as an appropriation ofprofit in the year in which they are ratified at the AnnualGeneral Meeting and subsequently paid, rather than as anappropriation of the profit in the year to which they relate.
Changes in accounting policies and modificationof the scope of consolidation
Changes in accounting policiesThe Group has abandoned the practice of using the net re-placement values of tangible fixed assets and has returned tohistorical cost accounting. The effect of the change is dis-closed on the statement of changes in equity. The comparativefigures have been restated in the balance sheet and the in-come statement.
The Group has implemented the following InternationalAccounting Standards in 1998:– IAS 1 (revised 1997) “Presentation of financial statements”has been applied. The format of the balance sheet, the incomestatement and of the notes has been adapted to complywith this standard. A statement of changes in equity is nowincluded. Comparative figures have been restated.– IAS 12 (revised 1996) “Income taxes”. This standardrequires basically the recognition of deferred taxes on all tem-porary differences. The Group was previously recognising de-ferred taxes in accordance with the allowed alternative treat-ment of the previous IAS 12, that is only to the extent thatdeferred taxes would crystallise in the near future. The effectof the change is disclosed on the statement of changes inequity. Comparative figures have been restated in the balancesheet. The impact on the income statement is not material.– IAS 33 “Earnings per share”. The Group complies with themeasurement requirements of this standard and disclosesearnings per share on the face of the income statement whilethe bases for the calculation are shown in the notes.
Modification of the scope of consolidationThe scope of consolidation has been affected by the acquisi-tions and disposals made in 1998. The principal businessesare detailed below.
Fully consolidated
Newly included:Spillers Petfoods, 100% (May)Borden Brands International activities, mainly Klim andCremora brands, 100% (February)
Increase in participation:San Pellegrino, Italy, from 50% to 100% (January)Nestlé Philippines Inc., Philippines, from 55% to 100% (July)
Disposal:Libby’s canned meats & fish, USA (January)
70 Consolidated accounts of the Nestlé Group
Brought to you by Global Reports

1. Segmental informationBy management responsibilities and geographic area
Sales ResultsIn millions of Swiss francs 1998 1997 1998 1997
FoodEurope 26 798 25 706 2 452 2 348Americas 22 563 22 262 2 963 2 716Africa, Asia and Oceania 12 429 13 493 1 618 2 039
Other activities 9 957 8 537 1 343 1 09171 747 69 998 8 376 8 194
Unallocated items (a) (1 276) (1 137)Trading profit 7 100 7 057
The analysis of sales by geographic areas is stated by customer destination. Inter-segment salesare not significant.
Assets LiabilitiesIn millions of Swiss francs 1998 1997 1998 1997
FoodEurope 14 354 13 080 5 083 4 704Americas 9 971 10 618 2 748 2 753Africa, Asia and Oceania 6 526 6 809 1 588 1 663
Other activities 6 124 4 934 2 350 1 97936 975 35 441 11 769 11 099
Unallocated items (b) 6 828 3 619 38 83Eliminations (587) (751) (587) (751)
43 216 38 309 11 220 10 431
Capital Depreciation ofexpenditure tangible fixed assets
In millions of Swiss francs 1998 1997 1998 1997
FoodEurope 1 026 1 041 997 1 023Americas 827 823 728 756Africa, Asia and Oceania 457 736 378 414
Other activities 629 572 434 4132 939 3 172 2 537 2 606
Unallocated items (c) 122 89 72 713 061 3 261 2 609 2 677
(a) Mainly corporate expenses,research and development costsas well as amortisation of intan-gible assets.
(b) Corporate and research anddevelopment assets/liabilities, in-cluding intangible assets.
(c) Corporate and research anddevelopment tangible fixed as-sets.
Consolidated accounts of the Nestlé Group 71
Notes
Brought to you by Global Reports

By major product groupSales Results
In millions of Swiss francs 1998 1997 1998 1997
Beverages 19 879 19 142 3 253 3243Milk products, nutrition and ice cream 19 175 19 334 1 837 1 932Prepared dishes and cooking aids
(and miscellaneous activities) 18 765 17 660 1 617 1 525Chocolate and confectionery 10 485 10 663 976 1 054Pharmaceutical products 3 443 3 199 915 825
71 747 69 998 8 598 8 579Unallocated items (a) (1 498) (1 522)Trading profit 7 100 7 057
AssetsIn millions of Swiss francs 1998 1997
Beverages 9 685 9 529Milk products, nutrition and ice cream 10 759 11 109Prepared dishes and cooking aids
(and miscellaneous activities) 9 316 8 624Chocolate and confectionery 6 343 6 423Pharmaceutical products 1 095 910
37 198 36 595
Capitalexpenditure
In millions of Swiss francs 1998 1997
Beverages 593 629Milk products, nutrition and ice cream 576 745Prepared dishes and cooking aids
(and miscellaneous activities) 442 445Chocolate and confectionery 388 435Pharmaceutical products 81 66
2 080 2 320Administration, distribution, research
and development 981 9413 061 3 261
(a) Mainly corporate expenses,research and development costs,amortisation of intangible assetsas well as restructuring costs.
72 Consolidated accounts of the Nestlé Group
Brought to you by Global Reports

2. Net financing costsIn millions of Swiss francs 1998 1997
Interest income 498 428Interest expense (1 666) (1 484)
(1 168) (1 056)
Interest income includes Fr. 109 million (1997: Fr. 87 million) of gains arising on securities held fortrading purposes.
3. Net non-trading itemsIn millions of Swiss francs 1998 1997
Non-trading expensesLoss on disposal of fixed assets (4) (20)Loss on disposal of activities (2) (29)Provisions for risks (77) (207)Other (331) (266)
(414) (522)Non-trading income
Profit on disposal of fixed assets 91 32Profit on disposal of activities 158 22Release of provisions for risks 160 54Other 194 351
603 459
189 (63)
4. Profit before taxationProfit is stated after charging the following items:In millions of Swiss francs 1998 1997
Depreciation of tangible fixed assets 2 609 2 677Salaries and welfare expenses 11 589 11 597Defined benefit pensions 403 359Defined contribution pensions 110 108Remuneration of the executive management
and of the Directors 16 18Auditors’ remuneration 27 25Rental charges 487 478Exchange differences (18) 5
Consolidated accounts of the Nestlé Group 73
Brought to you by Global Reports

5. TaxationIn millions of Swiss francs 1998 1997
Components of tax expenseCurrent tax 1 595 (a) 1 566Deferred tax 49 (192)Changes in deferred tax rates (6) (b)
Prior years’ tax (1) 5Others (c) 365 463
2 002 1 842
Deferred tax by typesTangible fixed assets (12) (b)
Intangible assets 34Employee benefits (62)Inventories, receivables, payables and provisions 87Unused tax losses and tax credits (11)Other 13
49 (192)
Reconciliation of tax expenseTax at the theoretical domestic rates applicable to profits
of taxable entities in the countries concerned 1 664 (b)
Tax effect on non-deductible amortisation of intangible assets 96Tax effect on non-allowable items 7Benefits obtained on compensation of current year capital gains
with prior year’s capital losses for which no tax credits were recognised (72)Difference of tax rates (57)Other tax (c) 364
2 002 1 842
6. Share of results of associated companiesIn millions of Swiss francs 1998 1997
Share of profit before taxation 499 430Less share of taxation (199) (174)Share of profit after taxation 300 256
7. Earnings per share 1998 1997
Basic earnings in Swiss francs per share 109.2 106.3Net profit per income statement (in millions of Swiss francs) 4 291 4 182Weighted average number of shares outstanding 39 293 665 39 331 126
(a) After deduction of previouslyunrecognised tax credits oncapital losses of Fr. 72 million.(b) Not available.(c) Includes withholding tax leviedon transfer of income.
74 Consolidated accounts of the Nestlé Group
Brought to you by Global Reports

1998 1997
Fully diluted earnings in Swiss francs per share 108.1 104.4Theoretical net profit assuming the exercise of all outstanding options
and sale of all treasury shares (in millions of Swiss francs) 4 362 4 211Number of shares 40 352 000 40 352 000
8. Liquid assetsIn millions of Swiss francs 1998 1997
Cash and cash equivalentsCash at bank and in hand 1 913 1 067Cash equivalents 3 071 2 345
4 984 3 412
Other liquid assetsShort term investments 1 784 2 215Marketable securities and other 1 195 2 475
2 979 4 6907 963 8 102
Liquid assets are mainly denominated in Swiss francs (65%), in Pound sterlings (13%), in USdollars (8%) and in European Monetary Union currencies (7%). Marketable securities held for trad-ing purposes amount to Fr. 90 million (1997: Fr. 352 million). The fair value of other liquidassets is not materially different from their carrying amounts. Rates of annual interest on interestbearing instruments range from 1.5% on Swiss francs to 6% on Pound sterlings.
9. Trade and other receivablesIn millions of Swiss francs 1998 1997
Trade receivables 8 857 8 011Other receivables 2 134 1 841
10 991 9 852
Amounts included above which are due after more than one year 117 85
10. InventoriesIn millions of Swiss francs 1998 1997
Raw materials, work in progress and sundry supplies 2 792 2 980Manufactured goods 4 319 4 132Provisions (163) (144)
6 948 6 968
Inventories amounting to Fr. 165 million (1997: Fr. 119 million) are pledged as security for financialliabilities.
Consolidated accounts of the Nestlé Group 75
Brought to you by Global Reports

11. Tangible fixed assetsMachinery Tools, furniture
Land and and and other Total TotalIn millions of Swiss francs buildings equipment equipment Vehicles 1998 1997
Gross value:At 1st January 11 235 21 964 5 066 904 39 169 37 478Currency retranslation and
inflation adjustment (312) (819) (201) (49) (1 381) (89)Expenditure 476 1 766 675 144 3 061 3 261Disposals (348) (829) (347) (160) (1 684) (1 317)Modification of the scope
of consolidation 410 887 99 20 1 416 (148)Other (182) (85) 12 (5) (260) (16)At 31st December 11 279 22 884 5 304 854 40 321 39 169
Accumulated depreciation:At 1st January (3 760) (13 241) (3 406) (577) (20 984) (19 761)Currency retranslation and
inflation adjustment 267 688 128 34 1 117 234Depreciation (341) (1 584) (564) (120) (2 609) (2 677)Disposals 123 658 319 123 1 223 999Modification of the scope
of consolidation (112) (457) (79) (13) (661) 198Other (18) 6 25 6 19 23At 31st December (3 841) (13 930) (3 577) (547) (21 895) (20 984)
Net at 31st December 7 438 8 954 1 727 307 18 426 18 185
At 31st December 1998, net tangible fixed assets include Fr. 400 million (1997: Fr. 482 million)of assets under construction. Net tangible fixed assets held under finance leases at 31st Decem-ber 1998 amount to Fr. 115 million (1997: Fr. 150 million). Net tangible fixed assets of Fr. 379 mil-lion (1997: Fr. 368 million) are pledged as security for financial creditors.The fire risks have been reasonably estimated and consequently insured, depending on the localspecific rules.
12. Investments in associated companiesThis item includes substantially our share of the equity of the indirect participation in L’Oréal, Parisfor Fr. 1367 million (1997: Fr. 1206 million). Its market value at 31st December 1998 amounts toFr. 17 609 million (1997: Fr. 10 224 million).
13. Other financial assetsIn millions of Swiss francs 1998 1997
Medium and long term receivables 1 552 1 759Other investments 145 171
1 697 1 930
76 Consolidated accounts of the Nestlé Group
Brought to you by Global Reports

14. Intangible assetsIn millions of Swiss francs 1998 1997
Gross value:At 1st January 2 831 2 150Currency retranslation (116) (76)On acquisitions 3 848 651Other 75 106At 31st December 6 638 2 831
Amortisation:At 1st January (276) (133)Currency retranslation 16 6Amortisation (301) (140)Other (3) (9)At 31st December (564) (276)
Net at 31st December 6 074 2 555
15. Trade and other payablesIn millions of Swiss francs 1998 1997
Trade payables 5 121 4 746Other payables 3 390 3 433
8 511 8 179
16. Current financial liabilitiesIn millions of Swiss francs 1998 1997
Commercial Paper 2 145 2 377Line of credit facilities 2 089 1 046Other short term financial liabilities 5 736 4 913
9 970 8 336Current portion of medium and long term financial liabilities 575 1 377
10 545 9 713
Short term financial liabilities are mainly denominated in European Monetary Union currencies(25%), in Pound sterlings (22%) and in US dollars (15%). Rates of annual interest range from3.25% on French francs to 28.5% on Mexican pesos.
Consolidated accounts of the Nestlé Group 77
Brought to you by Global Reports

17. Medium and long term financial liabilitiesIn millions of Swiss francs 1998 1997
Loans from financial institutions 1 029 548Bonds 3 529 3 950Obligations under finance leases 64 72
4 622 4 570Current portion of medium and long term financial liabilities (575) (1 377)
4 047 3 193
Loans from financial institutions are mainly denominated in European Monetary Union currencies(32%) and in US dollars (23%). Annual interest rates range from 3.25% on German marks to 29%on Brazilian reais. The majority of the loans are at fixed rates. Currencies and interest rates onbonds are disclosed below.
The above medium and long term financial creditors are repayable as follows:In millions of Swiss francs 1998 1997
in the second year 1 211 588in the third to fifth year inclusive 2 462 2 069after the fifth year 374 536
4 047 3 193
Bonds in issue which are carried at face value, adjusted for any related currency hedge, are asfollows:In millions of Swiss francs 1998 1997
Face value Interest Year of issue/and currency rate maturity
Bond Issues of Nestlé Holdings, Inc., USAUSD 200 mio 6% 1991-1998 Warrants attached, expired. — 290USD 200 mio 57/8% 1991-1998 Warrants attached, expired. — 290USD 250 mio 35/8% 1992-1999 Warrants attached, expired. 345 363CHF 300 mio 63/4% 1992-2002 Subject to interest rate
and currency swaps thatcreate a US dollar liabilityat variable rates. 315 331
CAD 300 mio 61/4% 1993-1998 Subject to interest rate andcurrency swaps that create aUS dollar liability at variable rates. — 329
USD 250 mio 73/8% 1995-2005 345 363DEM 500 mio 51/8% 1996-2001 Subject to interest rate
and currency swaps thatcreate a US dollar liabilityat variable rates. 457 480
78 Consolidated accounts of the Nestlé Group
Brought to you by Global Reports

In millions of Swiss francs 1998 1997
Face value Interest Year of issue/and currency rate maturity
USD 300 mio 3% 1997-2002 Convertible into Nestlé S.A.shares, but subject to an equityand interest rate swap that hedgesthe issuer against its equityexposure and creates a straightUS dollar liability at variable rate. 414 435
USD 250 mio 55/8% 1998-2003 Subject to an interest rate swap thatcreates a liability at variable rate. 345 —
Bond Issue of Nestlé Entreprises S.A., FranceFRF 1500 mio 61/2% 1993-1998 — 364
Bond Issue of Nestlé Finance-France S.A., FranceZAR 200 mio 143/4% 1997-2000 ZAR (rand) 100 mio are subject
to an interest rate and currencyswap that creates a FRF liabilityat variable rate. ZAR 100 mio aresubject to an interest rate swap thatcreates a liability at variable rate. 63 62
Bond Issues of Nestlé (UK) Ltd., United KingdomGBP 100 mio 63/4% 1997-2000 Subject to an interest rate
swap that creates a liability at variable rate. 229 241
USD 250 mio 5% 1998-2003 Subject to an interest rate and currency swap that createsa Pound sterling liabilityat variable rate. 345 —
Bond Issues of Nestlé Australia Ltd., AustraliaCHF 300 mio 3% 1996-2000 Subject to interest rate and
currency swaps that createan Australian dollar liabilityat variable rate. 285 321
USD 250 mio 11/4% 1998-2005 Convertible into Nestlé S.A. shares,but subject to an equity and interestrate and currency swap that hedgesthe issuer against its equity andcurrency exposures and createsa straight Australian dollar loanat variable rate. 320 —
Other bonds 66 81Total 3 529 3 950Due within one year (379) (1 286)Due after one year 3 150 2 664
Consolidated accounts of the Nestlé Group 79
Brought to you by Global Reports

The market value of the above bonds amounts to Fr. 3525 million as at 31st December 1998(1997: Fr. 3896 million). This amount represents the quotation of the bonds of Fr. 3814 million lessunrealised gains of Fr. 289 million on the hedge instruments (see note 28).
18. Employee benefitsIn millions of Swiss francs 1998 1997
Pensions and retirement benefits 948 889Post retirement health care and other employee benefits 1 173 1 122
2 121 2 011At the beginning of the year the assets and liabilities
of defined benefit plans were as follows:Actuarial present values of retirement benefits:
Funded plans 12 008 10 905Unfunded plans 927 721
Fair value of amount set aside for retirement benefits:Plan assets of funded plans 12 897 11 401Provisions for pensions and retirement benefits 889 911
Actuarial assumptions used for the main benefit plans:Interest rate less rate of salary increase 1% to 5%Interest rate less rate of pension increase 3% to 8%
Actuarial valuations of the individual pension arrangements of the Group are performed at notmore than three-yearly intervals. The actuaries use either the projected unit credit or attained agemethod of valuation in accordance with local practice and statutory requirements. Contributionsto funded schemes are determined for each plan separately based on actuarial advice in accord-ance with local practice and legislation. Any surpluses or deficits are absorbed by prospectivemodification of contributions over a period of years.
19. Deferred taxesIn millions of Swiss francs 1998 1997
Tax assets by types of temporary differencesTangible fixed assets 31 (a)
Intangible assets 237Employee benefits 505Inventories, receivables, payables and provisions 637Unused tax losses and unused tax credits 394Other 334
2 138
(a) Not available.
80 Consolidated accounts of the Nestlé Group
Brought to you by Global Reports

In millions of Swiss francs 1998 1997
Tax liabilities by types of temporary differencesTangible fixed assets 1 002 (a)
Intangible assets 7Employee benefits 9Inventories, receivables, payables and provisions 111Other 364
1 493Total net 645 705
Reflected in the balance sheet as follows:Deferred tax assets 2 040 1 836Deferred tax liabilities 1 395 1 131Total net as above 645 705
Temporary differences for which no deferred tax is recognised:– On investments in affiliated companies (taxable temporary difference) 2 649– On unused tax losses and tax credits and other 483
20. Share capital of Nestlé S.A. 1998 1997
Number of registered shares of nominal value Fr. 10 each 40 352 000 40 352 000In millions of Swiss francs 404 404
Additional information is given in the annex to the Annual report of Nestlé S.A., note 18 onpage 103.The share capital includes the nominal value of treasury shares (see note 21).
21. Treasury sharesThis item includes the book value of treasury shares (of Nestlé S.A.) held by:– an affiliated company: 928 940 freely available shares;– Nestlé S.A.: 71 210 shares in order to allow the exercise of option rights by members of the
Group’s management;– an affiliated company: 111 855 shares held for trading purposes.
The movement of these shares is described in the annex to the Annual report of Nestlé S.A.,note 20 on page 104.
Consolidated accounts of the Nestlé Group 81
(a) Not available.
Brought to you by Global Reports

22. Decrease/(increase) in working capitalIn millions of Swiss francs 1998 1997
Inventories (67) (331)Trade receivables (725) (273)Trade payables 100 331Other payables (50) 359Net accruals and deferrals 367 84Other (131) 158
(506) 328
23. AcquisitionsIn millions of Swiss francs 1998 1997
Fair value of net assets acquired:Tangible fixed assets 800 235Financial assets (45) 7Provisions (219) (29)Deferred tax assets 213 —Minority interests (23) (8)Purchase of minority interests in existing participations 144 98Net working capital 211 64Financial liabilities (731) (115)Liquid assets 85 35
435 287Intangible assets 3 848 651
Total acquisition cost 4 283 938less:
Cash and cash equivalents acquired (85) (35)Consideration payable (167) —
Cash outflow on acquisitions 4 031 903
24. DisposalsIn millions of Swiss francs 1998 1997
Net assets disposed of:Tangible fixed assets 45 185Net working capital 35 193Liquid assets — 1
80 379Profit/(loss) on disposals 156 (7)
Total sale consideration 236 372less:
Cash and cash equivalents disposed of — (1)Consideration receivable — (39)
Cash inflow on disposals 236 332
82 Consolidated accounts of the Nestlé Group
Brought to you by Global Reports

25. DividendsDividends payable are not accounted for until they have been ratified at the Annual General Meet-ing. At the meeting on 3rd June 1999, the following dividend in respect of 1998 will be proposed:
Dividend per share . . . . . . . . . . . . . . . . . . . . . . . . . . . . . . . . . . . . . . . . . . . . . Fr. 38.–resulting in a total dividend of (a) . . . . . . . . . . . . . . . . . . . . . . . . . . . . . . . . . . Fr. 1 497 612 566.–
The accounts for the year ended 31st December 1998 do not reflect this proposed distribution,which will be treated as an appropriation of profit in the year ending 31st December 1999.
26. Foreign exchange hedge instrumentsForward foreign currency sales
Recognised Anticipated future transactions transactions
In millions of Swiss francs 1998 1997 1998 1997
Contractual values 4 688 (b) 5 746 472 283Fair values 4 744 5 770 500 293Unrealised gains 34 32 — —Unrealised losses 90 56 28 10
The hedge instruments consist essentially of forward foreign exchange contracts and of options.Recognised transactions relate to balance sheet positions resulting from liquid assets in foreigncurrencies and, to a lesser extent, from export receivables, while anticipated future transactionsrefer to expected export sales.Due to the nature of the Group’s operations, most of the transactions have maturities of less thanone year. They are denominated mainly in US dollars and in European Monetary Union currencies.
Forward foreign currency purchases Recognised Anticipated future transactions transactions
In millions of Swiss francs 1998 1997 1998 1997
Contractual values 1 988 (c) 2 348 582 383Fair values 2 011 2 387 582 384Unrealised gains 50 46 9 9Unrealised losses 27 7 9 8
The hedge instruments consist mainly of forward foreign exchange contracts and of options.Recognised transactions are related to balance sheet positions such as suppliers and financialliabilities while anticipated future transactions refer to commitments for commodity and machineryimports.Due to the nature of the Group’s operations, most of the transactions have maturities of less thanone year. They are denominated mainly in US dollars and in European Monetary Union currencies.
(a) Number of shares with rightto dividend: see Annual report ofNestlé S.A. page 105.
(b) Contractual values includepremiums for purchased optionsof Fr. 18 mio and for written op-tions of Fr. 8 mio. The notionalamounts of these instrumentsare respectively Fr. 1936 mio andFr. 1857 mio.
(c) Contractual values includepremiums for purchased optionsof Fr. 11 mio and for written op-tions of Fr. 10 mio. The notionalamounts of these instrumentsare respectively Fr. 1219 mio andFr. 632 mio.
Consolidated accounts of the Nestlé Group 83
Brought to you by Global Reports

27. Commodity hedge instrumentsIn millions of Swiss francs 1998 1997
Contractual values 478 452Fair values 402 474Unrealised gains 2 27Unrealised losses 78 5
Commodity instruments consist essentially of futures and options on terminal markets related tothe supply of coffee and cocoa used for the manufacture of finished goods.
28. Interest rate instrumentsInterest exposures on liquid assets are hedged by using instruments which have the effect ofaltering the average maturities and the interest rates on the underlying positions. The notionalamounts of these instruments and the unrealised gains and losses on revaluation at market ratesare given below:
1998 1997
Notional Unrealised Unrealised Notional Unrealised UnrealisedIn millions of Swiss francs amounts gains losses amounts gains losses
Interest rate swaps 4 458 42 29 1 759 9 5Interest rate and currency swaps 55 — — 298 3 4Interest rate futures 545 — — 4 659 1 2
These instruments have maturity dates of three months to five years. The instruments are mainlydenominated in Swiss francs and in European Monetary Union currencies with annual interestrates ranging from 2.15% on Swiss francs to 4.5% on German marks.
For the financial liabilities the following interest instruments are used. The majority of interest rateswaps as well as interest rate and currency swaps modify the maturities and the interest rates oflong term bonds thus creating obligations in the reporting currency of the issuer (see note 17),while other interest rate and currency swaps, forward rate agreements, interest rate futures andoptions hedge interest rate exposures of the affiliated companies. The notional amounts of theseinstruments and the unrealised gains and losses on revaluation at market rates are given below:
1998 1997
Notional Unrealised Unrealised Notional Unrealised UnrealisedIn millions of Swiss francs amounts gains losses amounts gains losses
Interest rate swaps (a) 2 215 243 1 1 697 61 12Interest rate and currency swaps 2 591 97 23 1 195 4 39Forward rate agreements 1 433 — 9 649 — 2Interest rate futures 43 9 — 207 8 —Options purchased 437 — — 193 — —Options written 586 — — 145 — —
(a) Include equity swaps.
84 Consolidated accounts of the Nestlé Group
Brought to you by Global Reports
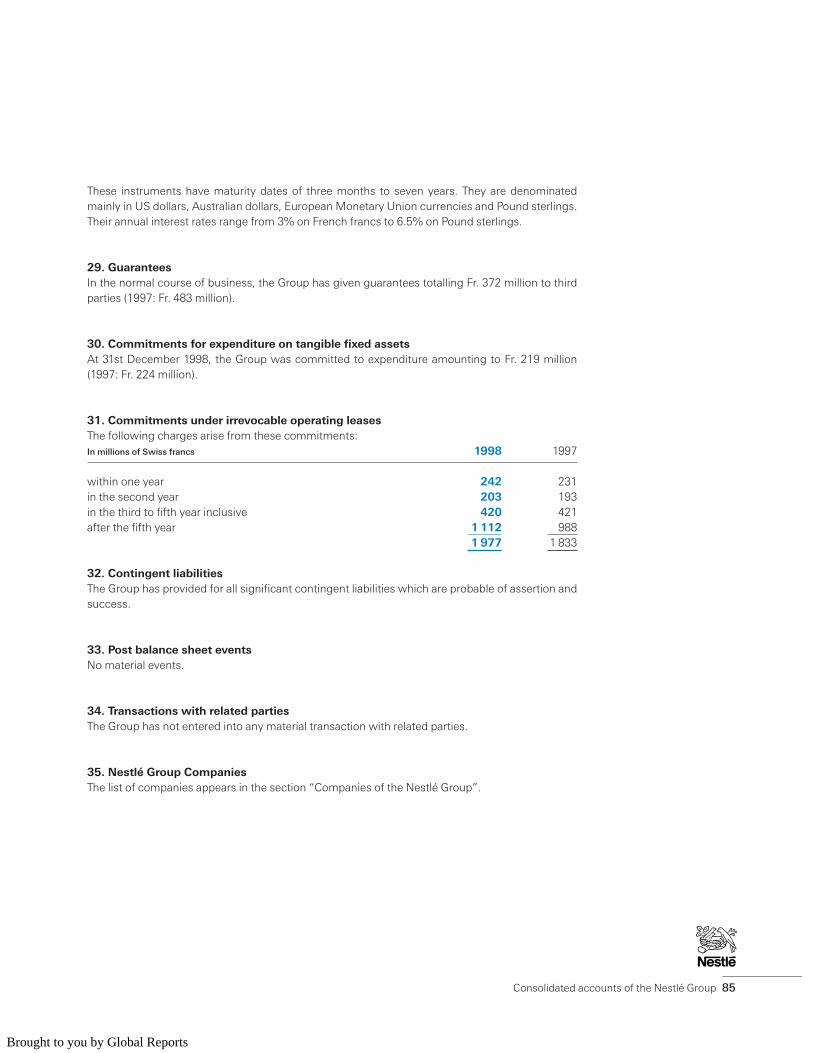
These instruments have maturity dates of three months to seven years. They are denominatedmainly in US dollars, Australian dollars, European Monetary Union currencies and Pound sterlings.Their annual interest rates range from 3% on French francs to 6.5% on Pound sterlings.
29. GuaranteesIn the normal course of business, the Group has given guarantees totalling Fr. 372 million to thirdparties (1997: Fr. 483 million).
30. Commitments for expenditure on tangible fixed assetsAt 31st December 1998, the Group was committed to expenditure amounting to Fr. 219 million(1997: Fr. 224 million).
31. Commitments under irrevocable operating leasesThe following charges arise from these commitments:In millions of Swiss francs 1998 1997
within one year 242 231in the second year 203 193in the third to fifth year inclusive 420 421after the fifth year 1 112 988
1 977 1 833
32. Contingent liabilitiesThe Group has provided for all significant contingent liabilities which are probable of assertion andsuccess.
33. Post balance sheet eventsNo material events.
34. Transactions with related partiesThe Group has not entered into any material transaction with related parties.
35. Nestlé Group CompaniesThe list of companies appears in the section “Companies of the Nestlé Group”.
Consolidated accounts of the Nestlé Group 85
Brought to you by Global Reports

Principal exchange ratesYear end rates Average annual rates
Swiss francs per 1998 1997 1998 1997
1 US Dollar USD 1.38 1.45 1.44 1.45100 French Francs FRF 24.50 24.30 24.60 24.90100 Deutsche Marks DEM 82.30 81.20 82.40 83.801 Pound Sterling GBP 2.29 2.41 2.39 2.38100 Italian Lira ITL 0.083 0.083 0.084 0.085100 Brazilian Reais BRL 114.— 130.– 125.— 135.–100 Spanish Pesetas ESP 0.968 0.96 0.972 0.991100 Japanese Yen JPY 1.21 1.12 1.11 1.19100 Mexican Pesos MXN 13.90 18.– 15.70 18.301 Canadian Dollar CAD 0.89 1.01 0.97 1.051 Australian Dollar AUD 0.847 0.951 0.91 1.08
86 Consolidated accounts of the Nestlé Group
Brought to you by Global Reports
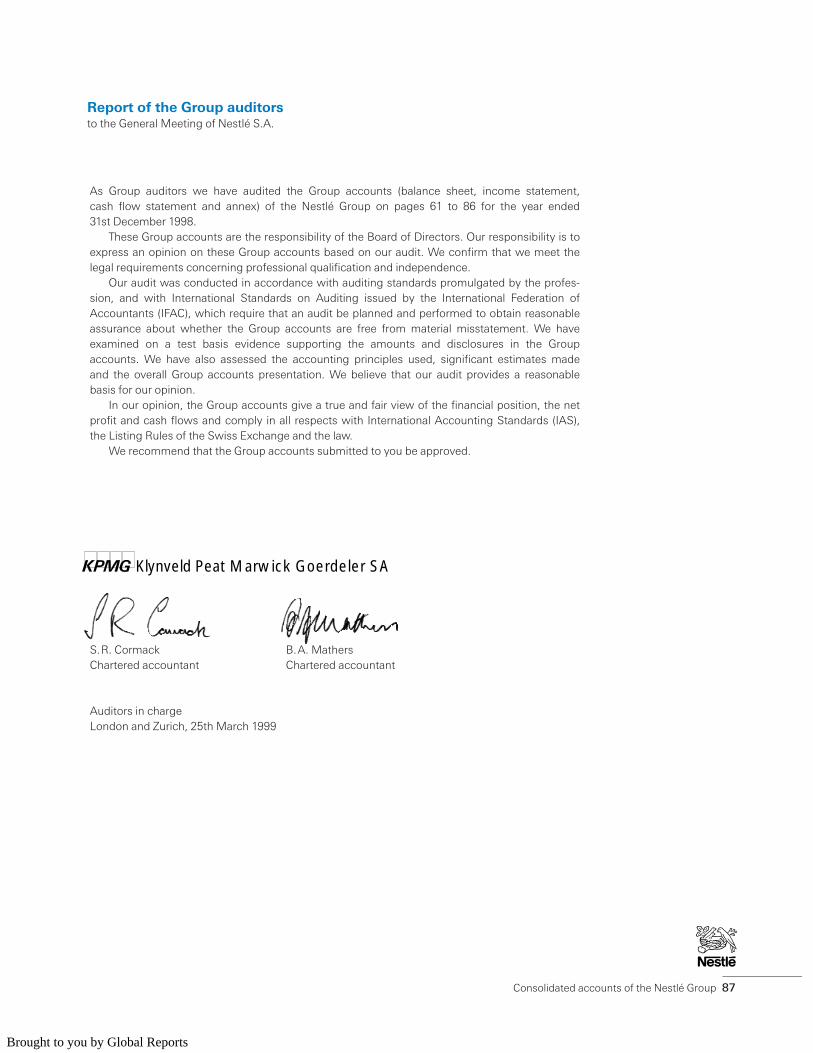
As Group auditors we have audited the Group accounts (balance sheet, income statement,cash flow statement and annex) of the Nestlé Group on pages 61 to 86 for the year ended31st December 1998.
These Group accounts are the responsibility of the Board of Directors. Our responsibility is toexpress an opinion on these Group accounts based on our audit. We confirm that we meet thelegal requirements concerning professional qualification and independence.
Our audit was conducted in accordance with auditing standards promulgated by the profes-sion, and with International Standards on Auditing issued by the International Federation ofAccountants (IFAC), which require that an audit be planned and performed to obtain reasonableassurance about whether the Group accounts are free from material misstatement. We haveexamined on a test basis evidence supporting the amounts and disclosures in the Groupaccounts. We have also assessed the accounting principles used, significant estimates madeand the overall Group accounts presentation. We believe that our audit provides a reasonablebasis for our opinion.
In our opinion, the Group accounts give a true and fair view of the financial position, the netprofit and cash flows and comply in all respects with International Accounting Standards (IAS),the Listing Rules of the Swiss Exchange and the law.
We recommend that the Group accounts submitted to you be approved.
S.R. Cormack B.A. MathersChartered accountant Chartered accountant
Auditors in chargeLondon and Zurich, 25th March 1999
Consolidated accounts of the Nestlé Group 87
Report of the Group auditorsto the General Meeting of Nestlé S.A.
Klynveld Peat Marwick Goerdeler SA
Brought to you by Global Reports

In millions of Swiss francs (except for per share data) 1998 1997
ResultsConsolidated sales . . . . . . . . . . . . . . . . . . . . . . . . . . . . . . . . . . . . . . . . . . . . . . . . . . . . . . 71 747 69 998 . . . . . . . . . .Trading profit . . . . . . . . . . . . . . . . . . . . . . . . . . . . . . . . . . . . . . . . . . . . . . . . . . . . . . . . . . 7 100 7 057 . . . . . . . . . .as % of sales. . . . . . . . . . . . . . . . . . . . . . . . . . . . . . . . . . . . . . . . . . . . . . . . . . . . . . . . . . . 9.9% 10.1% . . . . . . . . . .Taxation . . . . . . . . . . . . . . . . . . . . . . . . . . . . . . . . . . . . . . . . . . . . . . . . . . . . . . . . . . . . . . 2 002 1 842 . . . . . . . . . .Consolidated net profit . . . . . . . . . . . . . . . . . . . . . . . . . . . . . . . . . . . . . . . . . . . . . . . . . . . 4 291 4 182 . . . . . . . . . .as % of sales. . . . . . . . . . . . . . . . . . . . . . . . . . . . . . . . . . . . . . . . . . . . . . . . . . . . . . . . . . . 6.0% 6.0% . . . . . . . . . .as % of average equity . . . . . . . . . . . . . . . . . . . . . . . . . . . . . . . . . . . . . . . . . . . . . . . . . . . 19.7% 21.9% . . . . . . . . . .Total amount of dividend. . . . . . . . . . . . . . . . . . . . . . . . . . . . . . . . . . . . . . . . . . . . . . . . . . 1 498 (a) 1 376 . . . . . . . . . .Depreciation of tangible fixed assets . . . . . . . . . . . . . . . . . . . . . . . . . . . . . . . . . . . . . . . . . 2 609 2 677 . . . . . . . . . .as % of sales. . . . . . . . . . . . . . . . . . . . . . . . . . . . . . . . . . . . . . . . . . . . . . . . . . . . . . . . . . . 3.6% 3.8% . . . . . . . . . .Amortisation of intangible assets . . . . . . . . . . . . . . . . . . . . . . . . . . . . . . . . . . . . . . . . . . . 301 140 . . . . . . . . . .
Balance sheetCurrent assets . . . . . . . . . . . . . . . . . . . . . . . . . . . . . . . . . . . . . . . . . . . . . . . . . . . . . . . . . 26 679 25 671 . . . . . . . . . .
of which liquid assets . . . . . . . . . . . . . . . . . . . . . . . . . . . . . . . . . . . . . . . . . . . . . . . . . . 7 963 8 102 . . . . . . . . . .Fixed assets . . . . . . . . . . . . . . . . . . . . . . . . . . . . . . . . . . . . . . . . . . . . . . . . . . . . . . . . . . . 29 762 25 910 . . . . . . . . . .Total assets. . . . . . . . . . . . . . . . . . . . . . . . . . . . . . . . . . . . . . . . . . . . . . . . . . . . . . . . . . . . 56 441 51 581 . . . . . . . . . .Current liabilities . . . . . . . . . . . . . . . . . . . . . . . . . . . . . . . . . . . . . . . . . . . . . . . . . . . . . . . . 22 591 20 985 . . . . . . . . . .Medium and long term liabilities and minority interests . . . . . . . . . . . . . . . . . . . . . . . . . . . 10 826 9 990 . . . . . . . . . .Equity. . . . . . . . . . . . . . . . . . . . . . . . . . . . . . . . . . . . . . . . . . . . . . . . . . . . . . . . . . . . . . . . 23 024 20 606 . . . . . . . . . .Expenditure on tangible fixed assets . . . . . . . . . . . . . . . . . . . . . . . . . . . . . . . . . . . . . . . . . 3 061 3 261 . . . . . . . . . .as % of sales. . . . . . . . . . . . . . . . . . . . . . . . . . . . . . . . . . . . . . . . . . . . . . . . . . . . . . . . . . . 4.3% 4.7% . . . . . . . . . .
Data per shareWeighted average number of shares outstanding (b) 39 293 665 39 331 126 . . . . . . . . . .Consolidated net profit (c) . . . . . . . . . . . . . . . . . . . . . . . . . . . . . . . . . . . . . . . . . . . . . . . Fr. 109.2 106.3 . . . . . . . . . .Equity (c) . . . . . . . . . . . . . . . . . . . . . . . . . . . . . . . . . . . . . . . . . . . . . . . . . . . . . . . . . . . . Fr. 586 524 . . . . . . . . . .Dividend (c) . . . . . . . . . . . . . . . . . . . . . . . . . . . . . . . . . . . . . . . . . . . . . . . . . . . . . . . . . . Fr. 38.0(e) 35.0 . . . . . . . . . .Pay-out ratio . . . . . . . . . . . . . . . . . . . . . . . . . . . . . . . . . . . . . . . . . . . . . . . . . . . . . . . . . % 34.8% (e) 32.9% . . . . . . . . . .Stock exchange prices (high/low) (c) . . . . . . . . . . . . . . . . . . . . . . . . . . . . . . . . . . . . . . . Fr. 3498/2122 2192/1421 . . . . . . . . . .Yield (d) . . . . . . . . . . . . . . . . . . . . . . . . . . . . . . . . . . . . . . . . . . . . . . . . . . . . . . . . . . . . . % 1.1/1.8 (e) 1.6/2.5 . . . . . . . . . .
Number of personnel . . . . . . . . . . . . . . . . . . . . . . . . . . . . . . . . . . . . . . . . . . . . . . . . . . . . 231 881 225 808 . . . . . . . . . .
88 Consolidated accounts of the Nestlé Group
Financial information – ten year review
(a) As proposed by the Board of Directors ofNestlé S.A. This amount includes dividendspayable in respect of shares with right to divi-dend at the balance sheet date (Fr. 1491 mil-lion) as well as those potentially payable on theshares covering options and shares held fortrading purposes (Fr. 7 million).
(b) The figures prior to 1990 represent the num-ber of shares with right to dividend.(c) Figures prior to 1993 adjusted in order tomake comparable the data per share, followingrights issues in June 1993 and in June 1989.
(d) Calculated on the basis of the dividend forthe year concerned but which is paid out in thefollowing year.(e) As proposed by the Board of Directors ofNestlé S.A.
Brought to you by Global Reports

Consolidated accounts of the Nestlé Group 89
1996(f) 1995 1994(g) 1993 1992 1991 1990 1989
. . . . . . . . . 60 490 56 484 56 894 57 486 54 500 50 486 46 369 48 036
. . . . . . . . . 6 053 5 658 5 628 5 591 5 384 4 783 4 484 4 660
. . . . . . . . . 10.0% 10.0% 9.9% 9.7% 9.9% 9.5% 9.7% 9.7%
. . . . . . . . . 1 552 1 561 1 647 1 669 1 745 1 605 1 404 1 538
. . . . . . . . . 3 592 3 078 3 250 2 887 2 698 2 470 2 272 2 412
. . . . . . . . . 5.9% 5.4% 5.7% 5.0% 5.0% 4.9% 4.9% 5.0%
. . . . . . . . . 22.9% 23.3% 19.9% 19.5% 18.4% 17.2% 16.6% 19.1%
. . . . . . . . . 1 180 1 043 1 040 972 870 793 736 735
. . . . . . . . . 2 305 2 103 2 321 2 283 2 038 1 863 1 688 1 667
. . . . . . . . . 3.8% 3.7% 4.1% 4.0% 3.7% 3.7% 3.6% 3.5%
. . . . . . . . . 102 42 — — — — — —
. . . . . . . . . 23 070 20 927 21 420 20 982 20 670 19 195 18 460 17 985
. . . . . . . . . 5 860 5 124 5 132 5 084 4 688 4 888 5 528 4 231
. . . . . . . . . 23 605 19 189 23 807 24 178 23 803 19 795 17 116 17 421
. . . . . . . . . 46 675 40 116 45 227 45 160 44 473 38 990 35 576 35 406
. . . . . . . . . 19 859 17 410 17 297 18 166 20 019 14 889 14 381 13 981
. . . . . . . . . 9 239 8 862 10 986 11 334 10 524 8 731 7 781 7 486
. . . . . . . . . 17 577 13 844 16 944 15 660 13 930 15 370 13 414 13 939
. . . . . . . . . 3 054 3 056 3 029 3 093 3 191 2 815 2 538 2 446
. . . . . . . . . 5.0% 5.4% 5.3% 5.4% 5.9% 5.6% 5.5% 5.1%
. . . . . . . . . 39 363 637 39 220 756 38 838 376 37 759 826 36 938 374 36 800 050 36 750 000 36 750 000
. . . . . . . . . 91.3 78.5 83.7 76.5 72.2 66.4 61.1 64.9
. . . . . . . . . 557 459 436 415 373 413 361 375
. . . . . . . . . 30.0 26.5 26.5 25.0 23.2 21.3 19.8 19.8
. . . . . . . . . 32.9% 33.8% 31.7% 32.7% 32.2% 32.0% 32.4% 30.5%
. . . . . . . . . 1487/1250 1298/1090 1437/1063 1294/1015 1162/857 876/651 913/650 867/623
. . . . . . . . . 2.0/2.4 2.0/2.4 1.8/2.5 1.9/2.5 2.0/2.7 2.4/3.3 2.2/3.0 2.3/3.2
. . . . . . . . . 221 144 220 172 212 687 209 755 218 005 201 139 199 021 196 940
(f) Figures prior to 1997 have not been restatedfollowing the first application of IAS 12 (revised1996) “Income tax”.(g) Figures prior to 1995 have not been restatedto reflect the change from net replacementvalues of tangible fixed assets to historical costaccounting.
Brought to you by Global Reports
Operating companiesPrincipal affiliated companies which operate in the foodand water sectors, with the exception of those markedwith an asterisk which are engaged in the pharmaceuticalsector.Countries within the continents are listed according to the alphabetical order ofthe French names.
1. Affiliated companies for which full consolidation treatmentis applied (see page 66, “Scope of consolidation”).
EuropeGermany Nestlé Deutschland AG Frankfurt 97.2% • Blaue Quellen
Mineral- und Heilbrunnen AG Rhens am Rhein 90.6% • Trinks GmbH
Goslar 90.6% • Alcon Pharma GmbH* Freiburg/Breisgau 100% • Alois
Dallmayr Kaffee OHG München 48.6% • Heimbs & Sohn GmbH &
Co. KG Braunschweig 48.6% • Azul Kaffee GmbH & Co. KG Bremen
48.6% • Nähr-Engel GmbH Darmstadt 97.22% • Austria Nestlé Öster-
reich GmbH Wien 100% • Belgium Nestlé Belgilux S.A. Bruxelles
100% • Perrier Vittel Belgilux S.A. Etalle 100% • Alcon-Couvreur S.A.*
Puurs 100% • S.A. Friskies Belgilux N.V. Bruxelles 100% • Bulgaria
Nestlé Sofia A.D. Sofia 99.9% • Denmark Nestlé Danmark A/S
København 100% • Premier Is A/S Odense 100% • Friskies Petcare
A/S København 100% • Spain Nestlé España S.A. Barcelona 100% •
Productos del Café S.A. Reus 100% • Davigel España S.A. Palma de
Mallorca 100% • EYCAM Perrier S.A. Barcelona 100% • Alcon-Cusi
S.A.* Barcelona 100% • Helados y Congelados S.A. Araya 100% •
Compañia del Frio Alimentario S.A. Araya 100% • Compañia Avidesa
S.A. Alzira 100% • Alimentos Congelados S.A. Marcilla 100% •
Friskies España S.A. Esplugues de Llobregat 100% • Finland
Suomen Nestlé Oy Helsinki 100% • Friskies Finland Oy Helsinki 100%• France Nestlé France S.A. Noisiel 100% • France Glaces-Findus
S.A. Noisiel 100% • Nestlé Produits Laitiers Frais Noisiel 99.9% •
Herta S.A. Noisiel 100% • Davigel S.A. Martin-Eglise 100% • Perrier
Vittel France Paris 100% • S.A. des Eaux Minérales de Ribeauvillé
Ribeauvillé 98.3% • Société Conditionnement et Industrie S.A. Bernay
77.9% • Eau Minérale Naturelle de Plancoët «Source Sassay» S.A.
Plancoët 100% • Nestlé Coffee Specialties France S.A. Levallois-
Perret 100% • Nestlé Clinical Nutrition S.A. Sèvres 100% • Labora-
toires Alcon S.A.* Rueil-Malmaison 100% • Friskies France, Rueil-
Malmaison 100% • Greece Nestlé Hellas S.A. Maroussi 100% • Alcon
Laboratories Hellas E.P.E.* Alimos Attikis 100% • Italy Nestlé ltaliana
S.p.A. Milano 99.9% • San Pellegrino S.p.A. Milano 100% • Acqua
Vera S.p.A. Padova 100% • Alcon Italia S.p.A.* Milano 100% • Friskies
Italia S.p.A. Castiglione delle Stiviere 100% • Hungary Nestlé Hun-
garia Kft Budapest 100% • Norway A/S Nestlé Norge Asker-Oslo
100% • Drammen Is A/S Oslo 100% • Netherlands Nestlé Nederland
B.V. Amsterdam 100% • Alcon Nederland B.V.* Gorinchem 100% •
Spillers Petfoods Benelux B.V. Amsterdam 100% • Poland Goplana
S.A. Poznan 81.97% • Nestlé Polska Sp. zo.o. Warsaw 100% • Nale-
czowianka Spolka zo.o. Naleczov 33.3% • Winiary S.A. Kalisz 94.76%• Portugal Nestlé Portugal S.A. Linda-a-Velha 100% • Longa Vida
S.A. Matosinho 100% • Sociedade das Aguas de Pisoes Moura S.A.
Lisboa 100% • Republic of Ireland Nestlé (lreland) Ltd Tallaght-
Dublin 100% • Friskies Petcare (Ireland) Ltd Dublin 100% • Czech
Republic Nestlé Food S.r.o. Praha 100% • United Kingdom Nestlé
UK Ltd Croydon 100% • Perrier Vittel UK Ltd Rickmansworth 100% •
Buxton Mineral Water Company Ltd Rickmansworth 100% • Alcon
Laboratories (UK) Ltd* Herts 100% • Friskies Petcare (UK) Ltd New
Malden 100% • Russia JSC Confectionery Union Rossiya Samara
93.21% • Nestlé Zhukovsky Ice Cream LLC Zhukovsky 88.54% •
Nestlé Food LLC Moscow 100% • OJSC Confectionery Firm Altai
Barnaul 84.49% • OJSC Kamskaya Perm 84.71% • JSC Khlado-
product Timashevsk 82.02% • Slovakia Nestlé Food S.r.o. Prievidza
99.9% • Sweden Svenska Nestlé AB Bjuv 100% • Jede AB Mariestad
100% • Alcon Sverige AB* Bromma 100% • Friskies Sverige AB
Malmö 100% • Switzerland Société des Produits Nestlé S.A. Vevey
100% • Nestlé Suisse S.A. Vevey 100% • Perrier Vittel Suisse S.A.
Mies 100% • Alcon Pharmaceuticals Ltd* Hünenberg 100% • Nestlé
World Trade Corporation La Tour-de-Peilz 100% • Food Ingredients
Specialities S.A. Villars-sur-Glâne 100% • Nestlé Coffee Specialities
S.A. Pully 100% • Turkey Nestlé Türkiye Gida Sanayi A.S. Istanbul
100% • Mis Süt Sanayii A.S. Istanbul 60% • Alcon Labaratuariani
A.S.* Istanbul 100%.
AfricaSouth Africa Nestlé (South Africa) (Pty) Ltd Randburg-Johannesburg
100% • Friskies Petcare (Pty) Ltd Pretoria 60% • Alcon Laboratories
Pty Ltd* Randburg 100% • Cameroon Nestlé Cameroun Douala
99.6% • Ivory Coast Nestlé Côte d’Ivoire Abidjan 80.9% • Egypt
Nestlé Egypt S.A.E. Cairo 100% • Dolce S.A.E. Cairo 100% • Industrie
du Froid S.A.E. Kaliub-Cairo 100% • Société des eaux minérales
Vittor S.A.E. Cairo 90.2% • Gabon Nestlé Gabon Libreville 90% •
Ghana Nestlé Ghana Ltd Tema-Accra 51% • Guinea Nestlé Guinée
Conakry 99% • Kenya Nestlé Foods Kenya Ltd Nairobi 100% •
Mauritius Nestlé’s Products (Mauritius) Ltd Port Louis 100% •
Morocco Nestlé Maroc S.A. El Jadida 93.4% • Nigeria Nestlé Foods
Nigeria PLC Ilupeju-Lagos 57% • Senegal Nestlé Sénégal Dakar
100% • Tunisia Nestlé Tunisie Tunis 59.2% • Zimbabwe Nestlé
Zimbabwe (Pvt) Ltd Harare 100%.
90 Consolidated accounts of the Nestlé Group
Companies of the Nestlé Group
Brought to you by Global Reports

AmericasArgentina Nestlé Argentina S.A. Buenos Aires 100% • Alcon Labora-
torios Argentina S.A.* Buenos Aires 100% • Bolivia Nestlé Bolivia
S.r.l. La Paz 100% • Brazil Nestlé Brasil Ltda. São Paulo 100% • Indus-
trias Alimenticias Itacolomy S/A Montes Claros 100% • Companhia
Produtora de Alimentos Itabuna 100% • Tostines Industrial e Comer-
cial Ltda. São Paulo 100% • Perrier Vittel de Brasil Ltda. Rio de
Janeiro 100% • Alcon Laboratorios do Brasil S.A.* São Paulo 100% •
Canada Nestlé Canada, Inc. North York-Toronto (Ontario) 100% •
Midwest Food Products, Inc. Toronto (Ontario) 50% • Laura Secord,
Inc. Scarborough (Ontario) 100% • The Perrier Group of Canada Ltd
Toronto (Ontario) 100% • Alcon Canada, Inc.* Mississauga (Ontario)
100% • Chile Nestlé Chile S.A. Santiago de Chile 99.5% • Alcon
Laboratorios Chile Limitada* Santiago 100% • Colombia Nestlé de
Colombia S.A. Bogotá 100% • Cicolac Ltda. Bogotá 100% • Laborato-
rios Alcon de Colombia S.A.* Santafé de Bogotá 100% • Costa Rica
Nestlé Costa Rica S.A. San José 100% • Cuba Los Portales S.A.
Guane 49% • El Salvador Nestlé El Salvador S.A. San Salvador 100%• Ecuador Nestlé Ecuador S.A. Quito 74.7% • Neslandina S.A. Quito
74.7% • United States Nestlé USA, Inc. Los Angeles (California)
100% • Nestlé USA - Food Group, Inc. Solon (Ohio) 100% • Nestlé
USA - Beverage Division, Inc. Los Angeles (California) 100% • Perrier
Group of America Greenwich (Connecticut) 100% • Nestlé Puerto
Rico, Inc. San Juan (Puerto Rico) 100% • Alcon Laboratories, Inc.*
Fort Worth (Texas) 100% • Alcon (Puerto Rico), Inc.* San Juan (Puerto
Rico) 100% • Guatemala Nestlé Guatemala S.A. Guatemala 100% •
Honduras Nestlé Hondureña S.A. Tegucigalpa 100% • Jamaica
Nestlé-JMP Jamaica Ltd Kingston 100% • Cremo Ltd Kingston 100%• Mexico Nestlé Mexico S.A. de C.V. México 100% • Alimentos
Findus S.A. de C.V. México 100% • Industrias Alimenticias Club S.A.
de C.V. México 100% • Manantiales La Asuncion, S.A. de C.V. México
100% • Alcon Laboratorios S.A. de C.V.* México 100% • Nicaragua
Productos Nestlé (Nicaragua) S.A. Managua 100% • Panama Nestlé
Panamá S.A. Panamá City 100% • Nestlé Caribbean, Inc. Panamá City
100% • Paraguay Nestlé Paraguay S.A. Asunción 100% • Peru Nestlé
Perú S.A. Lima 93.1% • D’Onofrio S.A. Lima 80.6% • Dominican
Republic Sociedad Dominicana de Conservas y Alimentos S.A.
Santo Domingo 81.7% • Compañía Dominicana de Alimentos
Lacteos S.A. Santo Domingo 100% • Helados Nestlé S.A. Santo
Domingo 100% • Trinidad and Tobago Nestlé Trinidad and Tobago
Ltd Port of Spain 100% • Uruguay Nestlé del Uruguay S.A. Monte-
video 100% • Venezuela Nestlé Venezuela S.A. Caracas 100% •
Chocolates Nestlé S.A. Caracas 100% • Caramelos Royal C.A. Barqui-
simeto 100%.
AsiaSaudi Arabia Saudi Food Industries Co. Ltd Jeddah 51% •
Bangladesh Nestlé Bangladesh Ltd Dhaka 100% • United Arab
Emirates Nestlé Ice Cream L.L.C. Dubai 49% • Hong Kong Nestlé
Hong Kong Ltd Hong Kong 100% • Nestlé Dairy Farm Hong Kong Ltd
Hong Kong 100% • India Nestlé India Ltd New Delhi 51% •
Indonesia P.T. Nestlé Indonesia Jakarta 57.6% • P.T. Nestlé Confec-
tionery Indonesia Jakarta 100% • P.T. Nestlé Asean (Indonesia)
Jakarta 60% • P.T. Supmi Sakti Jakarta 100% • P.T. Nestlé Beverages
Indonesia Jakarta 70% • Israel OSEM Investments Ltd Petach-Tikva
47.1% • Japan Nestlé Japan Ltd Kobe 100% • Nestlé-Mackintosh
K.K. Tokyo 66% • Perrier Japon K.K. Tokyo 100% • Alcon Japan Ltd*
Tokyo 100% • Jordan Nestlé Jordan Trading Co. Ltd Amman 49% •
Kuwait Nestlé Kuwait General Trading Co. W.L.L. Kuwait 49% •
Lebanon Société pour l’Exportation des Produits Nestlé S.A. Bey-
routh 100% • SOHAT Distribution SAL Hazmieh 49% • Malaysia
Nestlé (Malaysia) Bhd. Petaling Jaya 55.7% • Nestlé Foods (Malaysia)
Sdn. Bhd. Petaling Jaya 55.7% • Nestlé Products Sdn. Bhd. Petaling
Jaya 55.7% • Malaysia Cocoa Manufacturing Sdn. Bhd. Petaling Jaya
49% • Nestlé Asean (Malaysia) Sdn. Bhd. Petaling Jaya 60% • Nestlé
Cold Storage (Malaysia) Sdn. Bhd. Petaling Jaya 51% • Pakistan
Milkpak Ltd Lahore 57.2% • Philippines Nestlé Philippines, Inc.
Cabuyao 100% • Republic of Korea Nestlé Korea Ltd Cheongju
100% • People’s Republic of China Nestlé Shuangcheng Ltd
Shuangcheng 93% • Nestlé Dongguan Ltd Dongguan 100% • Maggi
Dongguan Ltd Dongguan 100% • Nestlé Tianjin Ltd Tianjin 100% •
Nestlé Qingdao Ltd Qingdao 100% • Nestlé Shanghai Ltd Shanghai
95% • Nestlé Dairy Farm Tianjin Ltd Tianjin 75% • Nestlé Dairy Farm
Qingdao Ltd Qingdao 100% • Nestlé Dairy Farm Guangzhou Ltd
Guangzhou 60% • Shanghai Fuller Foods Co. Ltd Shanghai 100% •
Singapore Nestlé Singapore (Pte) Ltd Singapore 100% • Nestlé
Asean Singapore (Pte) Ltd Singapore 100% • Sri Lanka Nestlé Lanka
Ltd Colombo 90.8% • Taiwan Nestlé Taiwan Ltd Taipei 100% • Nestlé
Distributors Ltd Taipei 100% • Alcon Pharmaceuticals Ltd* Taipei
100% • Thailand Nestlé Products (Thailand), Inc. Bangkok 100% •
Nestlé Asean (Thailand) Ltd Bangkok 60% • Quality Coffee Products
Ltd Bangkok 49% • Nestlé Foods (Thailand) Ltd Bangkok 100% •
Nestlé Trading (Thailand) Ltd Bangkok 49% • Nestlé Manufacturing
(Thailand) Ltd Bangkok 100% • Nestlé Ice Cream (Thailand) Ltd
Bangkok 46.3% • Vietnam Nestlé Vietnam Ltd Bien Hoa 100% • Long
An Mineral Water Joint Venture Company Tan An 65%.
OceaniaAustralia Nestlé Australia Ltd Sydney 100% • Petersville Australia
Ltd Melbourne 100% • Nestlé Echuca Pty Ltd Melbourne 100% •
Alcon Laboratories (Australia) Pty Ltd* Frenchs Forests (NSW) 100% •
Fiji Nestlé (Fiji) Ltd Ba 67% • New Caledonia Nestlé Nouvelle-Calé-
donie S.A. Nouméa 100% • New Zealand Nestlé New Zealand Ltd
Auckland 100% • Papua-New Guinea Nestlé (PNG) Ltd Lae 100% •
French Polynesia Nestlé Polynesia S.A. Papeete 100%.
Consolidated accounts of the Nestlé Group 91
Brought to you by Global Reports

2. Affiliated companies for which the method of proportionateconsolidation is used (see page 66, “Scope of consolidation”).
EuropeGermany C.P.D. Cereal Partners Deutschland GmbH & Co. OHG
Frankfurt 50% • Galderma Laboratorium GmbH* Freiburg/Breisgau
50% • Spain Cereal Partners España AEIE Esplugas de Llobregat 50%• France Cereal Partners France SNC Noisiel 50% • Laboratoires
Galderma S.A.* Levallois-Perret 50% • Poland Torun-Pacific Cereal
Partners Poland Sp. zo.o. Torun 50% • Portugal Cereal Associados
Portugal AEIE Oeiras 50% • Czech Republic Nestlé Cokoladovny a.s.
Praha 49.2% • United Kingdom Cereal Partners UK Welwyn Garden
City 50% • Switzerland CCNR Europe S.A. Lausanne 50%.
AfricaSouth Africa Dairymaid-Nestlé (Pty) Ltd Johannesburg 50%.
AmericasArgentina Galderma Argentina S.A.* Buenos Aires 50% • Brazil
Galderma Brasil Ltda* São Paulo 50% • Canada Galderma Canada
Inc.* Markham 50% • Chile Cereales CPW Chile Ltda Santiago de
Chile 50% • United States Coca-Cola Nestlé Refreshments Com-
pany, USA Atlanta (Georgia) 50% • Galderma Laboratories, Inc.* Fort
Worth (Texas) 50% • Mexico CPW México S.A. de C.V. México 50%.
AsiaHong Kong Coca-Cola Nestlé Refreshments Pacific Hong Kong 50%• Republic of Korea Coca-Cola Nestlé Refreshments Korea Seoul
50% • Thailand Coca-Cola Nestlé Beverages Thailand Ltd Bangkok
50% .
Principal associated companies which operate in the foodand water sectors, with the exception of those markedwith an asterisk which are engaged in the cosmetics anddermatology sectors.For which the equity method is used – see page 66, “Scope of consolidation”.
EuropeGermany Mineralbrunnen Überkingen-Teinach AG Bad Überkingen
37.6% • France L’Oréal S.A.* Paris 26.3% • Houdebine S.A. Noyal-
Pontivy 50% • S.B.E.C.M. Société de Bouchages Emballages Condi-
tionnement Moderne S.à.r.l. Lavardac 50%.
AsiaMalaysia Premier Milk (Malaysia) Sdn. Bhd. Kuala Lumpur 25% •
People’s Republic of China Guangzhou Refrigerated Foods Ltd
Guangzhou 50%.
Sub-holding, financial and property companiesBahamas Nestlé’s Holdings Ltd Nassau 100% • Food Products
(Holdings) Ltd Nassau 100% • United States Nestlé Holdings, Inc.
Stamford (Connecticut) 100% • Nestlé Capital Corporation Stamford
(Connecticut) 100% • France Nestlé Entreprises S.A. Noisiel 100% •
Nestlé Finance France S.A. Noisiel 100% • Perrier Vittel S.A. Paris
100% • Société Immobilière de Noisiel Noisiel 100% • Panama
Unilac, Inc. Panamá City 100% • Poland Nestlé Polska Holding
Sp. zo.o. Warszawa 100% • Portugal Nestlé Portugal SGPS, Lda.
Linda-a-Velha 100% • United Kingdom Nestlé Holdings (U.K.) PLC
Croydon 100% • Friskies Holding (UK) Ltd Croydon 100% • Switzer-
land Entreprises Maggi S.A. Kemptthal 100% • Nestlé Finance S.A.
Cham 100% • Rive-Reine S.A. La Tour-de-Peilz 100% • S.I. En Bergère
Vevey S.A. Vevey 100%.
Technical assistance, researchand development companiesNestec Ltd., Vevey (Switzerland)Technical assistance company for Nestlé products whoseunits, specialised in all areas of the business, supply per-manent support to companies in the Group within the frame-work of technical assistance contracts. It is also responsiblefor all scientific research and technological development,which it undertakes itself or has done on its behalf by affili-ated companies. The units involved are:
Scientific research centreSwitzerland Nestlé Research Center Lausanne.
Technical development centresGermany Nestlé R&D Center Lebensmittelforschung GmbH
Weiding • Ivory Coast Centre R&D Nestlé Abidjan • Ecuador Nestlé
R&D Center S.A. Quito • Spain Nestlé R&D Center S.A. Badajoz •
United States Nestlé R&D Center, Inc. Connecticut • Ohio • Friskies
R&D Center, Inc. Missouri • France Centre R&D Nestlé Beauvais •
Lisieux • Tours • Creully • Centre R&D Friskies S.A. Amiens •
Italy Ricerca & Gelati S.r.l. Parma • Malaysia Nestlé R&D Center Sdn.
Bhd. Petaling Jaya • United Kingdom Nestlé R&D Center York •
Singapore Nestlé R&D Center (Pte) Ltd Singapore • Sweden Nestlé
R&D Center Bjuv A.B. Bjuv • Switzerland Nestlé R&D Center Broc •
Kemptthal • Konolfingen • Orbe.
92 Consolidated accounts of the Nestlé Group
Brought to you by Global Reports

132nd Annual report of Nestlé S.A.
94 Administration95 Income statement for the year 199896 Balance sheet at 31st December 199897 Annex to the annual accounts of Nestlé S.A.97 Accounting policies99 Notes to the annual accounts
105 Proposed appropriation of profit106 Report of the statutory auditors107 Agenda for the 132nd General Meeting of Nestlé S.A.108 Important dates
Brought to you by Global Reports

The General Meeting held on 28th May 1998 re-elected Messrs. Stephan Schmidheiny, PeterBöckli and David de Pury for an additional term of five years, and Mr. Paul A. Volcker for a term oftwo years, pursuant to the provisions of the Board’s regulations concerning the age limit. TheChairman expressed his gratitude to Mr. Georges Blum, whose term as director was expiring andwho was not standing for re-election.
At its next meeting, the Board of Directors appointed Mr. Helmut O. Maucher as Chairman,Messrs. Rainer E. Gut and Fritz Gerber as Vice-Chairmen, Mr. Peter Brabeck-Letmathe as ChiefExecutive Officer and Mrs. Vreni Spoerry as a member of the Board Committee.
At the General Meeting on 3rd June 1999, Mr. Arthur Dunkel’s term as director will expire.Mr. Dunkel is eligible for re-election and is standing for a new term of five years. Mr. Robert Studer,whose term will expire in 2002, has decided to resign at this General Meeting.
In addition, the Board of Directors is recommending that the General Meeting elect LordSimpson of Dunkeld as a new director for a term of five years. Mr. George Simpson, a British citi-zen, is Chief Executive Officer of General Electric Company plc. He is a prominent businessmanand a member of the European Round Table of Industrialists. Upon his election, the number ofdirectors will be unchanged at 13.
Throughout 1998, no director had a personal interest in any transaction of significance for thebusiness of the Group.
94 132nd Annual report of Nestlé S.A.
Administration
Brought to you by Global Reports

In millions of Swiss francs Notes 1998 1997
IncomeIncome from Group companies 1 3 559 2 756Interest income 2 497 240Profit on disposal of fixed assets 3 332 56Other income 52 23Total income 4 440 3 075
ExpensesInvestment write downs 4 1 170 1 039Administration and other expenses 5 122 121Interest expense 6 27 19Provision for uninsured risks 15 15Total expenses before taxation 1 334 1 194
Profit before taxation 3 106 1 881Taxation 7 284 286Profit for the year 19 2 822 1 595
The appropriation of profit proposed by the Board is set out on page 105.
132nd Annual report of Nestlé S.A. 95
Income statement for the year 1998
Brought to you by Global Reports

In millions of Swiss francs Notes 1998 1997
Assets
Current assetsLiquid assets 8 3 906 2 987Debtors 9 2 508 1 608Prepayments and accrued income 47 36Total current assets 6 461 4 631
Fixed assetsFinancial assets 10 10 353 10 746Intangible assets 13 — —Tangible fixed assets 14 — —Total fixed assets 10 353 10 746
Total assets 16 814 15 377
Liabilities and shareholders’ funds
LiabilitiesShort term creditors 15 431 165Accrued liabilities and deferred income 3 23Long term creditors 16 264 283Provisions 17 670 906Total liabilities 1 368 1 377
Shareholders’ fundsShare capital 18/19 404 404Legal reserves 19 6 392 6 392Special reserve 19 5 827 5 609Retained earnings 19 2 823 1 595Total shareholders’ funds 19 15 446 14 000
Total liabilities and shareholders’ funds 16 814 15 377
96 132nd Annual report of Nestlé S.A.
Balance sheet at 31st December 1998before appropriations
Brought to you by Global Reports

Accounting policies
GeneralNestlé S.A. (the Company) is the ultimate holding company ofthe Nestlé Group which comprises subsidiaries, associatedcompanies and joint ventures throughout the world. Theaccounts are prepared in accordance with accounting princi-ples required by Swiss law. They are also prepared under thehistorical cost convention and on the accruals basis. Therehave been no changes in accounting policies during the year.
Foreign currency translationTransactions in foreign currencies are recorded at the rate ofexchange at the date of the transaction or, if hedged forward,at the rate of exchange under the related forward contract.Assets and liabilities in foreign currencies are translated atyear end rates. Any resulting exchange differences are includ-ed in the respective income statement captions dependingupon the nature of the underlying transactions. The aggregateunrealised exchange difference is calculated by reference tooriginal transaction date exchange rates and includes hedg-ing transactions. Where this gives rise to a net loss, it ischarged to the income statement whilst a net gain is deferred.
HedgingThe Company uses forward foreign exchange contracts,options, financial futures and currency swaps to hedge for-eign currency flows and positions. Unrealised foreign ex-change differences on hedging instruments are matched andaccounted for with those on the underlying asset or liability.Long term loans, in foreign currencies, used to finance invest-ments in participations are generally not hedged.
The Company also uses interest rate swaps to manageinterest rate risk. The swaps are accounted for at fair value ateach balance sheet date and changes in the market value arerecorded in the income statement.
Income statementIncome due at the balance sheet date, but not currently trans-ferable is recognised only upon receipt. Dividends paid out ofpre-acquisition profits are not included under income fromGroup companies; instead they are credited against the carry-ing value of the participation, with any remaining balancecredited to reserves.
In accordance with Swiss law and the Company’s articlesof association, dividends are treated as an appropriation ofprofit in the year in which they are ratified at the Annual Gen-eral Meeting and subsequently paid, rather than as an appro-priation of profit in the year to which they relate.
TaxationThis caption includes taxes on profit, capital and withholdingtaxes on transfers from Group companies.
Financial assetsThe carrying value of participations and loans comprises thecost of investment, excluding the incidental costs of acquisi-tion, less any write downs.
Participations located in countries where the political,economic or monetary situation might be considered to carrya greater than normal level of risk are carried at a nominalvalue of one franc.
Participations and loans are written down on a conserva-tive basis, taking into account the profitability of the companyconcerned.
Marketable securities are valued at the lower of cost andmarket value.
Intangible assetsTrademarks and other industrial property rights are writtenoff on acquisition or exceptionally over a longer period. Inthe Group accounts this item has a different treatment (seepage 69).
Tangible fixed assetsThe Company owns land and buildings which have beendepreciated in the past to one franc. Office furniture andequipment is fully depreciated on acquisition.
132nd Annual report of Nestlé S.A. 97
Annex to the annual accounts of Nestlé S.A.
Brought to you by Global Reports

ProvisionsProvisions recognise contingencies which may arise andwhich have been prudently provided. A provision for unin-sured risks is constituted on a Group-wide basis to covergeneral risks not insured with third parties, such as conse-quential loss. Provision for Swiss taxes is made on the basisof the Company’s taxable capital, reserves and profit for theyear. A general provision is maintained to cover possibleforeign taxation liabilities.
PensionsEmployees are eligible for retirement benefits under a definedbenefit plan provided through separate funds.
For the defined benefit plan the amount charged to theincome statement consists of current service cost which in-cludes the normal cost of financing benefits in respect offuture years of service. If the case arises, variations from thecurrent service cost are spread over the expected workinglives of employees or recognised immediately in the case ofretirees.
Liabilities arising under the defined benefit scheme areexternally funded, with the assets of the scheme held sepa-rately from the Company in independently administeredfunds.
Prepayments and accrued incomePrepayments and accrued income comprise payments madein advance relating to the following year, and income relatingto the current year which will not be received until after thebalance sheet date (such as interest receivable on loans ordeposits). Revaluation gains on open forward exchange con-tracts at year end rates are also included in this caption.
Accrued liabilities and deferred incomeAccruals and deferred income comprise expenses relating tothe current year which will not be paid until after the balancesheet date and income received in advance, relating to thefollowing year. Revaluation losses on open forward exchangecontracts at year end rates are also included in this caption.
98 132nd Annual report of Nestlé S.A.
Brought to you by Global Reports

1. Income from Group companiesThis represents dividends of the current and prior years and other net income from Groupcompanies.
2. Interest incomeIn millions of Swiss francs 1998 1997
Net result on loans to Group companies 413 185Other 84 55
497 240
The improvement is mainly due to realised exchange gains on loans reimbursed during the year,as well as positive results recorded on foreign exchange hedge instruments. Interest received in1998, both on these loans and on deposits with financial institutions, have also increased.
3. Profit on disposal of fixed assetsThis represents mainly the net gains realised on the sale of participations to Group companies aspart of reorganisation programmes, as well as on the sale of some trademarks and other industrialproperty rights previously written down.
4. Investment write downsIn millions of Swiss francs 1998 1997
Participations and loans 513 931Trademarks and other industrial property rights 657 108
1 170 1 039
The write downs of participations and loans in 1998 derive from a conservative policy of valuation,based on the political, economic and monetary situation of the countries where the participationsare located, as well as on the profitability of the companies concerned. The write downs of trade-marks and other industrial property rights in 1998 refer mainly to the trademarks acquired fromBorden and Spillers as well as Stouffer’s (acquired from a Group company).
5. Administration and other expensesIn millions of Swiss francs 1998 1997
Salaries and welfare expenses 48 56Other expenses 74 65
122 121
132nd Annual report of Nestlé S.A. 99
Notes to the annual accounts
Brought to you by Global Reports

6. Interest expenseIn millions of Swiss francs 1998 1997
Interest on long term debenture 20 18Other interest 7 1
27 19
7. TaxationIncludes withholding taxes on income from foreign sources, as well as Swiss taxes for whichadequate provisions have been established.
8. Liquid assetsIn millions of Swiss francs 1998 1997
Cash and cash equivalents 2 363 2 356Short term investments 1 250 616Marketable securities 293 15
3 906 2 987
9. DebtorsIn millions of Swiss francs 1998 1997
Amounts owed by Group companiesShort-term treasury loans 2 246 1 316Current accounts 231 249Provision for amounts not currently transferable — —
2 477 1 565Other debtors (including withholding tax) 31 43
2 508 1 608
Short-term treasury loans are advanced to Group companies with the intention of investing liquidfunds at competitive rates, thus replacing external borrowings. The amount owed to the Companyin respect of Swiss withholding tax was received after the year-end.
10. Financial assetsIn millions of Swiss francs 1998 1997
Participations in Group companies (see note 11) 7 112 7 054Finance loans to Group companies (see note 12) 3 112 3 566Own shares 97 120Other investments 32 6
10 353 10 746
Own shares of the Company are held in order to allow the exercise of option rights by membersof the Group’s Management (71 210 options were outstanding at the close of 1998, of which59 007 may be exercised as from 1st January 1999).
100 132nd Annual report of Nestlé S.A.
Brought to you by Global Reports

11. Participations in Group companiesIn millions of Swiss francs 1998 1997
At 1st January 7 054 7 869Increase 570 297Write downs (512) (1 112)At 31st December 7 112 7 054
The increase in participations represents in particular:– additional funding, through capital increases, of a number of Group companies mainly in
People’s Republic of China and Eastern Europe;– the purchase, on the stock exchange or from third parties, of shares of some of our affiliated
companies, to increase the participations already held, mainly in Asia and Eastern Europe.
The carrying value of participations continues to represent a conservative valuation having regardto both the income received by the Company and the net assets of the Group companies con-cerned.A list of the most important companies held, either directly by Nestlé S.A. or indirectly throughother Group companies, with the percentage of the capital controlled, is given on pages 90 to 92in the section “Consolidated accounts of the Nestlé Group”.A Canadian affiliate has been granted options to purchase shares in certain Group companiessituated outside Continental Europe.
12. Finance loans to Group companiesIn millions of Swiss francs 1998 1997
At 1st January 3 566 3 497New loans 308 228Repayments and write downs (678) (247)Realised exchange differences 46 19Unrealised exchange differences (130) 69At 31st December 3 112 3 566
Finance loans are usually for the long term and finance investments in participations.
13. Intangible assetsAll intangible assets have been fully written off.
132nd Annual report of Nestlé S.A. 101
Brought to you by Global Reports
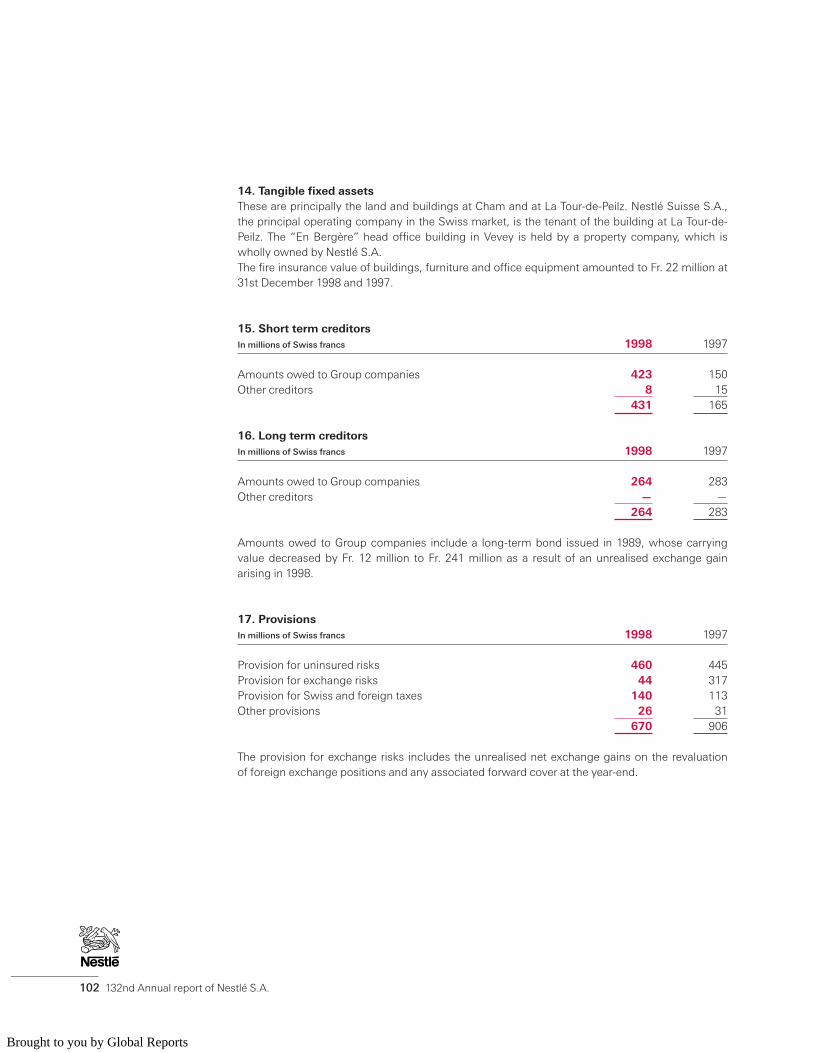
14. Tangible fixed assetsThese are principally the land and buildings at Cham and at La Tour-de-Peilz. Nestlé Suisse S.A.,the principal operating company in the Swiss market, is the tenant of the building at La Tour-de-Peilz. The “En Bergère” head office building in Vevey is held by a property company, which iswholly owned by Nestlé S.A.The fire insurance value of buildings, furniture and office equipment amounted to Fr. 22 million at31st December 1998 and 1997.
15. Short term creditorsIn millions of Swiss francs 1998 1997
Amounts owed to Group companies 423 150Other creditors 8 15
431 165
16. Long term creditorsIn millions of Swiss francs 1998 1997
Amounts owed to Group companies 264 283Other creditors — —
264 283
Amounts owed to Group companies include a long-term bond issued in 1989, whose carryingvalue decreased by Fr. 12 million to Fr. 241 million as a result of an unrealised exchange gainarising in 1998.
17. ProvisionsIn millions of Swiss francs 1998 1997
Provision for uninsured risks 460 445Provision for exchange risks 44 317Provision for Swiss and foreign taxes 140 113Other provisions 26 31
670 906
The provision for exchange risks includes the unrealised net exchange gains on the revaluationof foreign exchange positions and any associated forward cover at the year-end.
102 132nd Annual report of Nestlé S.A.
Brought to you by Global Reports

18. Share capital 1998 1997
Number of registered shares of nominal value Fr. 10 each 40 352 000 40 352 000In millions of Swiss francs 404 404
According to article 6 of the Company’s articles of association, no natural person or legal entitycan be registered as a shareholder with voting rights for shares held directly or indirectly for morethan 3% of the share capital. In addition, article 14 provides that, on exercising the voting rights,no shareholder, through shares owned or represented, may aggregate, directly or indirectly, morethan 3% of the total share capital.At 31st December 1998, the Share Register showed 161 652 registered shareholders. If un-processed applications for registration and the indirect holders of shares under American deposi-tary receipts are also taken into account, the total number of shareholders is well in excess of200 000. The Company was not aware of any shareholder holding, directly or indirectly, 3% ormore of the share capital.
Conditional increase in share capitalAccording to the articles of association, the share capital can be increased, by the exercise ofconversion or option rights, by a maximum of Fr. 10 000 000 through the issue of a maximumof 1 000 000 registered shares with a nominal value of Fr. 10.– each, fully paid-up. Thus theBoard of Directors has at its disposal a flexible instrument enabling it, if necessary, to finance theactivities of the Company through convertible or option loans.
19. Movements in shareholders’ fundsShare General Reserve for Special Retained
In millions of Swiss francs capital reserve (a) own shares (a) (b) reserve earnings Total
At 1st January 1998 404 6 115 277 5 609 1 595 14 000Appropriation of profit
to special reserve 215 (215)Profit for the year 2 822 2 822Dividend for 1997 (1 376) (1 376)Own shares acquired/sold (311) 311Dividend on own shares
acquired beforepayment dateof dividend 1997 2 (2)
Dividend on shares in respectof which the correspondingoption rights were notexercised by the paymentdate of 1997 dividend 1 (1)
At 31st December 1998 404 5 804 588 5 827 2 823 15 446
132nd Annual report of Nestlé S.A. 103
(a) The general reserve and thereserve for own shares consti-tute the legal reserves.(b) See note 20.
Brought to you by Global Reports

20. Reserve for own sharesAt 31st December 1997, the reserve for own shares amounting to Fr. 276.6 million, representedthe cost of 928 940 shares issued by Nestlé S.A. and acquired by a Group company, as well as79 095 shares reserved to cover option rights in favour of members of the Group’s Managementand 14 351 shares held for trading purposes.At 31st December 1998, the shareholding of the Group company was unchanged (928 940 sharesat an acquisition cost of Fr. 156.7 million). These shares are available to be used in any way which,in the opinion of the Board of Directors, would be in the best interests of the Company and itsshareholders. As long as these shares are held by the Group company, they will be recorded in theShare Register as being without voting rights and will not rank for dividends.In 1998, the Company acquired, at a cost of Fr. 28.8 million, 12 203 shares reserved to coveroption rights in favour of members of the Group’s Management. 20 088 options have been exer-cised during the year. A total of 71 210 shares are held to cover outstanding option rights at thebalance sheet date. The 14 351 shares held by the Company for trading purposes at 31st Decem-ber 1997 have been sold. Furthermore, 111 855 shares held for trading purposes appear in thebooks of a Group company for Fr. 334.4 million at 31st December 1998. As long as the options arenot exercised, or the shares sold, these shares are also recorded in the Share Register as beingwithout voting rights and do not rank for dividends.The total of 1 112 005 own shares held at 31st December 1998 represents 2.8% of Nestlé S.A.share capital.
21. ContingenciesAt 31st December 1998 and 1997, the total of the guarantees for credit facilities granted toGroup companies, together with the buy-back agreements relating to notes issued, amounted toFr. 5864 million and Fr. 6022 million, respectively.
104 132nd Annual report of Nestlé S.A.
Brought to you by Global Reports

In Swiss francs 1998 1997
Retained earningsBalance brought forward 1 582 712 709 060Profit for the year 2 821 688 195 1 595 030 172
2 823 270 907 1 595 739 232
We propose the following appropriations:
Allocation to the special reserve 1 325 000 000 215 000 000
Dividend for 1998, Fr. 38.—per share on 39 239 995 shares(1997: Fr. 35.— on 39 329 614 shares) 1 491 119 810 1 376 536 490
Dividend for 1998, Fr. 38.—per share on 59 007 shares reservedfor the option rights which may beexercised as from 1st January 1999and on 111 855 shares heldfor trading purposes (a)
(1997: Fr. 35.— on 74 858 shares) 6 492 756 2 620 030 (b)
2 822 612 566 1 594 156 520
Balance to be carried forward 658 341 1 582 712
If you accept this proposal, the gross dividend will amount to Fr. 38.– per share. After deductionof the federal withholding tax of 35%, a net amount of Fr. 24.70 per share will be payable as fromWednesday, 9th June 1999 by bank transfer to the shareholder’s account or by cheque, inaccordance with instructions received from the shareholder.
Cham and Vevey, 25th March 1999The Board of Directors
132nd Annual report of Nestlé S.A. 105
Proposed appropriation of profit
(a) The dividends on those sharesfor which the option rights willnot have been exercised by thedate of the dividend paymentwill be transferred to the specialreserve. Dividends on shareswhich are held for trading pur-poses and are still held at thedate of the dividend paymentwill also be transferred to thespecial reserve.(b) Of the total of Fr. 2 620 030,Fr. 991 795 were actually paid asdividends, whilst the balance ofFr. 1 628 235 has been trans-ferred to the special reserve.
Brought to you by Global Reports

As statutory auditors, we have audited the accounting records and the financial statements(balance sheet, income statement and annex) of Nestlé S.A. on pages 95 to 104 for the year ended31st December 1998.
These financial statements are the responsibility of the Board of Directors. Our responsibilityis to express an opinion on these financial statements based on our audit. We confirm that wemeet the legal requirements concerning professional qualification and independence.
Our audit was conducted in accordance with auditing standards promulgated by the profes-sion, which require that an audit be planned and performed to obtain reasonable assurance aboutwhether the financial statements are free from material misstatement. We have examined on atest basis evidence supporting the amounts and disclosures in the financial statements. We havealso assessed the accounting principles used, significant estimates made and the overall financialstatement presentation. We believe that our audit provides a reasonable basis for our opinion.
In our opinion, the accounting records, financial statements and the proposed appropriationof retained earnings comply with the law and the company’s articles of incorporation.
We recommend that the financial statements submitted to you be approved.
S.R. Cormack B.A. MathersChartered accountant Chartered accountant
Auditors in chargeLondon and Zurich, 25th March 1999
106 132nd Annual report of Nestlé S.A.
Report of the statutory auditorsto the General Meeting of Nestlé S.A.
Klynveld Peat Marwick Goerdeler SA
Brought to you by Global Reports

Thursday 3rd June 1999at 3.00 p.m. at the “Palais de Beaulieu”, Lausanne
Agenda
1a Annual report 1998, annual financial statementsof the Company and report of the auditors
1b 1998 Consolidated financial statements of the Groupand report of the Group auditors
2 Release of the Board of Directors and of the Management
3 Decision on the appropriation of profits resultingfrom the balance sheet of the Company
4 Elections to the Board of Directors:Arthur Dunkel (terms of office for 5 years)George Simpson (terms of office for 5 years)
5 Election of the auditors (annual financial statements of Nestlé S.A.and the Group accounts):KPMG Klynveld Peat Marwick Goerdeler SA, London/Zurich
Next Ordinary General Meeting:Thursday 25th May 2000 at the “Palais de Beaulieu”, Lausanne
132nd Annual report of Nestlé S.A. 107
132nd Ordinary General Meetingof the Nestlé S.A.
Brought to you by Global Reports

108 132nd Annual report of Nestlé S.A.
Important dates:
9th June 1999 Payment of the dividendSeptember 1999 Publication of the half-yearly report January/June 199924th November 1999 Autumn meeting with the press (Vevey)25th February 2000 Announcement of 1999 sales figures and results15th March 2000 Press conference (Zurich)25th May 2000 133rd Ordinary General Meeting,
“Palais de Beaulieu”, Lausanne
Stock exchange listings of registered shares of Nestlé S.A.
Switzerland: Swiss ExchangeAbroad: Amsterdam, Brussels, Frankfurt, London, Paris, Tokyo, Vienna
Registered Offices: Nestlé S.A. Nestlé S.A.Avenue Nestlé 55 (Share Transfer Office)CH-1800 Vevey (Switzerland) Zugerstrasse 8Telephone (021) 924 21 11 CH-6330 Cham (Switzerland)
Telephone (041) 780 20 22
For any additional information about the management report, please contactNestlé S.A., Investor Relations, Avenue Nestlé 55, CH-1800 Vevey (Switzerland),telephone (021) 924 27 42, telefax (021) 924 28 13.E-mail: [email protected]
As to information concerning the share register (registrations, transfers, addresschanges, dividends, etc.), please contact Nestlé S.A., Share Transfer Office,Zugerstrasse 8, CH-6330 Cham (Switzerland), telephone (041) 780 20 22, telefax(041) 780 20 58.
Nestlé URL: http://www.nestle.com
Brought to you by Global Reports

© 1999, Nestlé S.A., Cham and Vevey (Switzerland)Concept and design: Nestec Ltd., Vevey (Switzerland)Printed by Genoud, Entreprise d’arts graphiques S.A., Le Mont-sur-Lausanne (Switzerland)
Brought to you by Global Reports