nestlé management report 1999
TRANSCRIPT

Nestlé Management Report 1999
http://www.nestle.com/investor_relations/mr1999/index.htm [4/27/2001 10:46:32 AM]
Nestlé Management Report 1999 | Overview
http://www.nestle.com/investor_relations/mr1999/overview/index.htm [4/27/2001 10:46:38 AM]

Ladies and Gentlemen,
1999 was a good year for your Company. With an increase in net profit of 12.3%to Fr. 4724 million and a significant improvement in all performance indicators,the Group in 1999 produced its best results ever. Consolidated sales rose to Fr. 74660 million, up 4.1%, and the net profit margin reached 6.3%. Trading profitincreased by nearly 12% to 10.6% of sales. Our Company thus showed thatgrowth and performance need not be mutually exclusive, even in an environmentthat was far from favorable everywhere.
The year in review was indeed not easy. It is true that the strength of the dollarand the yen have almost entirely offset the depreciation of the Brazilian real,sharply reducing the negative impact of exchange rates that we experienced inrecent years. Nevertheless, the depreciation of the real, the currency of a keymarket in the Nestlé Group, pushed our consolidated sales down by nearly Fr. 1.5billion. All the more reason then to be pleased that real internal growth once againimproved, to 3.6%. This shows that the Company can adapt and seize marketopportunities even in difficult times. Nestlé made excellent progress in NorthAmerica and in some Asian countries. In Western Europe, consumers have at lastregained confidence; and perspectives look good in general. Finally, toward theend of the year, the countries of Eastern Europe also started showing signs ofgrowth, while only some South American countries seem to be climbing out of therecession. Among our activities, Alcon, the water business, the joint ventures,nutrition and products for out-of-home consumption saw a particularly gooddevelopment.
However, we would like to draw your attention to the improvement in results. Ourtrading profit margin grew by 11.8% and the trading profit now stands at Fr. 7914million. That corresponds to 10.6% of sales. We achieved Fr. 4724 million in netprofit, the highest ever. Moreover, the improvement in trading margins is in linewith our policy in recent years and our explicit intention to do whatever isnecessary to sustainably raise the Group's overall performance levels. Due to thegood development of the operating cash flow, up 28.5%, the ratio of net debt toequity today stands at 24.7%, showing a very healthy financial situation.
These results stem from a broad range of measures taken in recent years with aview to optimizing asset utilization in all areas and to encourage innovation. Wehave thus paid great attention to reducing working capital and keeping an eye onproduction costs. We keep looking for long-term relationships with our commercialpartners and international suppliers who can frequently offer goods and servicesat lower prices while fully respecting our quality requirements. Wherever possible,we are improving our capacity utilization in our factories. We have thus been ableto meet additional demand without increasing our spending on fixed assets.Indeed, such expenditures, both as a percentage of sales and in absolute terms,show a slight decrease after some years of stability. We keep on reducing the
Nestlé Management Report 1998 | Overview
http://www.nestle.com/investor_relations/mr1999/overview/01/index.htm (1 of 2) [4/27/2001 10:46:42 AM]

number of individual products and packaging sizes and pay special attention to ourproduct range. All of these optimization measures are part of a long-term processand require a permanent openness to change. The results obtained in 1999 areencouraging; and we are convinced that in the years to come, the processcurrently under way will produce noticeable improvements. Finally, thecompetitiveness of the Group — and its perspective for the future — depends onits ability to deliver, year after year, a satisfactory performance without in anyway compromising its long-term potential for growth. We continue to provide forthe future by investing in new products by constantly reinforcing our key brandsand by increasing our market share in all parts of the world.
We did not make any very large-scale acquisitions in 1999. However, we seizedthe opportunity to reinforce our culinary activities in China and in Mexico. In theUSA, a joint venture with Pillsbury will allow us to strengthen our position in thepremium ice-cream market. We also divested some activities in the frozen foodand in the roast and ground coffee areas, so that these sectors are also focusedon product ranges that are closer to our strategic goals.
For the current year, we are moderately optimistic. Our efforts aimed at furtheringgrowth and at improving performance will continue. We are far from having fullyexploited our potential in those two areas. Economic indicators are positiveoverall, even though Eastern Europe is just getting back to normal and there is adegree of uncertainty over developments in South America.
At the turn of the century, the Nestlé Group finds itself in an enviable position: itis the undisputed leader in its sector, it owns strong brands and it has a solidposition in all the categories that it believes to be strategically important.Furthermore, Nestlé can count on unmatched know-how and technology, as wellas long experience in the markets of the future. Finally, it can rely on skilled andmotivated employees. All this is the result of two decades of hard work carried outwith an eye on the long term; the Company was fundamentally re-oriented andbrought into a truly global dimension. As a consequence, Nestlé is well prepared toface the future. Our industrial sector is still far from having finished restructuring,but thanks to the decisions made in recent years, which to a large extentanticipated what is happening today, Nestlé is well positioned to be among themain beneficiaries of the process. This alone justifies our confidence in thelong-term future of the Group. We, for our part, shall do whatever is needed toenhance our leadership position in our business.
We are well aware that success largely depends on the commitment and the hardwork of our management and our staff around the world and we want to thankthem warmly for their contribution.
Vevey, February 24, 2000
Helmut O. Maucher Peter Brabeck-LetmatheChairman of the Board Chief Executive Officer
Nestlé Management Report 1998 | Overview
http://www.nestle.com/investor_relations/mr1999/overview/01/index.htm (2 of 2) [4/27/2001 10:46:42 AM]

General ManagersFrom left to right: Francisco Castañer,Michael W.O. Garrett, Robert Raeber,Rupert Gasser, Peter Brabeck-Letmathe,Philippe Véron, Mario A. Corti, Carlos E.Represas
Board of Directors of Nestlé S.A. Term Expires1
Helmut O. Maucher Chairman2, 4 2000 Rainer E. Gut Vice-Chairman2, 4 2001 Fritz Gerber Vice-Chairman2, 3, 4 2001 Peter Brabeck-Letmathe Chief Executive Officer2 2002 Vreni Spoerry2 2002Paul A. Volcker 2000Stephan Schmidheiny 2003Jean-Pierre Meyers 2001Peter Böckli3 2003David de Pury3 2003Arthur Dunkel 2004Reto F. Domeniconi 2001George Simpson 2004 Secretary to the BoardBernard Daniel Secretary general Group Managementas of 31st December 1999 Peter Brabeck-Letmathe Chief Executive OfficerDirect Responsibilities: Nutrition Strategic Business Division General Managers
Nestlé Management Report 1999 | Overview
http://www.nestle.com/investor_relations/mr1999/overview/02/index.htm (1 of 2) [4/27/2001 10:46:53 AM]

1 On the date of the GeneralMeeting of Shareholders
2 Member of the Committee to theBoard
3 Member of the Audit Committee
4 Member of the RemunerationCommittee
Francisco CastañerPharmaceutical and Cosmetic Products, Liaison with L'Oréal, HumanResources, Corporate Affairs
Mario A. CortiFinance, Control, Legal, Tax, Information Systems & Logistics,Purchasing, Export
Michael W.O. GarrettAsia, Oceania, Africa, Middle East Rupert GasserTechnical, Production, Environment, Research & Development Robert RaeberEurope Carlos E. RepresasUnited States of America, Canada, Latin America Philippe VéronStrategic Business Units, Mineral Water, Marketing Auditors of the annual financial statementsof Nestlé S.A. and of the consolidated financial statements ofthe Group
Klynveld Peat Marwick Goerdeler SALondon and Zurich 2002
Nestlé Management Report 1999 | Overview
http://www.nestle.com/investor_relations/mr1999/overview/02/index.htm (2 of 2) [4/27/2001 10:46:53 AM]

In millions of Swiss francs (except for per share data) 1999 1998
Sales 74 660 71 747
EBITDA(a) 10 987 9 991
as % of sales 14.7% 13.9%
EBITA(b) 8 298 7 382
as % of sales 11.1% 10.3%
Trading profit 7 914 7 081
as % of sales 10.6% 9.9%
Net profit 4 724 4 205
as % of sales 6.3% 5.9%
as % of average equity 20.0% 19.5%
Expenditure on tangible fixed assets 2 806 3 061
as % of sales 3.8% 4.3%
Equity(c) 24 453 22 815
Market capitalisation, end December 112 032 117 328
Per share
Net Profit Fr. 122.1 107.0
Equity(c) Fr. 632 581
Dividend Fr. 43.0(d) 38.0
Personnel Number at year end 230 929 231 881
Factories Number at year end 509 522
Principal key figures in US$(e)
In millions of US$ (Except for per share data) 1999 1998
Sales 46 663 51 991
EBITDA 6 867 7 240
EBITA 5 186 5 349
Trading Profit 4 946 5 131
Net Profit 2 953 3 047
Equity(c) 15 283 16 533
Market capitalisation, end December 70 020 85 020
Per share
Net profit US$ 76.3 77.5
Equity(c) US$ 395 421
Principal key figures in Euro(e)
In millions of Euro (except for per share data) 1999 1998
Sales 46 373 44 563
EBITDA 6 824 6 206
EBITA 5 154 4 585
Trading Profit 4 916 4 398
Net Profit 2 934 2 612
Equity(c) 15 188 14 171
Market capitalisation, end December 69 585 72 875
Per share
Nestlé Management Report 1999 | Overview
http://www.nestle.com/investor_relations/mr1999/overview/03/index.htm (1 of 2) [4/27/2001 10:47:04 AM]

(a) Earnings Before Interest,Taxes, Depreciation andAmortisation.
(b) Earnings Before Interest,Taxes and Amortisation.
(c) Before proposed appropriationof profit of Nestlé S.A.
(d) As proposed by the Board ofDirectors of Nestlé S.A.
(e) Figures translated at the yearend rate.
Net Profit Euro 75.9 66.5
Equity(c) Euro 393 361
SalesIn millions of Swiss francs Trading profit
In millions of Swiss francs Net profitIn millions of Swiss francs
Capital expenditureIn millions of Swiss francs Market capitalisation
In millions of Swiss francs Dividends paidIn millions of Swiss francs
Nestlé Management Report 1999 | Overview
http://www.nestle.com/investor_relations/mr1999/overview/03/index.htm (2 of 2) [4/27/2001 10:47:04 AM]

Sales
36.3% 29.5%18.2% 16.0%
Sales
In millions of Swiss francs 1999 1998 1997
Food
Europe 27 098 26 798 25 706
Americas 22 045 22 563 22 262
Africa, Asia and Oceania 13 611 12 429 13 493
Other activities 11 906 9 957 8 537
74 660 71 747 69 998
Results
28.6% 30.0%23.4% 18.0%
Results
In millions of Swiss francs 1999 1998 1997
Food
Europe 2 671 2 452 2 348
Americas 2 799 2 963 2 716
Africa, Asia and Oceania 2 185 1 618 2 039
Other activities 1 675 1 343 1 091
9 330 8 376 8 194
Unallocated items (a) (1 416) (1 295) (1 137)
Trading profit 7 914 7 081 7 057
Capital expenditure
34.4% 26.7%14.2% 24.7%
Capital expenditure
In millions of Swiss francs 1999 1998 1997
Food
Europe 923 1 026 1 041
Americas 718 827 823
Africa, Asia and Oceania 381 457 736
Other activities 665 629 572
2 687 2 939 3 172
Unallocated items (b) 119 122 89
2 806 3 061 3 261
(a) Mainly corporate expenses,research and developmentcosts as well as amortisation ofintangible assets.
(b) Corporate and research anddevelopment fixed assets.
Nestlé Management Report 1999 | Overview
http://www.nestle.com/investor_relations/mr1999/overview/04/index.htm [4/27/2001 10:47:10 AM]

Sales
27.9% 26.0%27.0% 13.7%5.4%
Sales
In millions of Swiss francs 1999 1998 1997
Beverages 20 859 19 879 19 142
Milk products, nutrition and ice cream 19 411 19 175 19 334
Prepared dishes, cooking aidsand miscellaneous activities 20 185 18 765 17 660
Chocolate and confectionery 10 195 10 485 10 663
Pharmaceuticals 4 010 3 443 3 199
74 660 71 747 69 998
Results
38.6% 22.3%19.0% 9.0%11.1%
Results
In millions of Swiss francs 1999 1998 1997
Beverages 3 764 3 253 3 243
Milk products, nutrition and ice cream 2 168 1 837 1 932
Prepared dishes, cooking aidsand miscellaneous activities 1 850 1 617 1 525
Chocolate and confectionery 882 976 1 054
Pharmaceuticals 1 077 915 825
9 741 8 598 8 579
Unallocated items (a) (1 827) (1 517) (1 522)
Trading profit 7 914 7 081 7 057
Capital expenditure
22.0% 13.0%16.5% 10.0%3.3% 35.2%
Capital expenditure
In millions of Swiss francs 1999 1998 1997
Beverages 618 593 629
Milk products, nutrition and ice cream 366 576 745
Prepared dishes, cooking aidsand miscellaneous activities 464 442 445
Chocolate and confectionery 280 388 435
Pharmaceuticals 91 81 66
1 819 2 080 2 320
Administration, distribution, researchand development 987 981 941
2 806 3 061 3 261
(a) Mainly corporate expenses,
research and developmentcosts, amortisation ofintangible assets, as well asrestructuring costs.
Nestlé Management Report 1999 | Overview
http://www.nestle.com/investor_relations/mr1999/overview/05/index.htm [4/27/2001 10:47:18 AM]

1999 was a year of record profitability for the Nestlé Group, with improvements in the food business inmany geographic areas as well as in the other activities. Operating cash flow advanced strongly and netfinancial debt declined. A key feature of our sales performance was the steady acceleration of the rate ofreal internal growth during the year, reflecting progress in both developed and emerging markets.
Nestlé Management Report 1999 | Business Review
http://www.nestle.com/investor_relations/mr1999/businessreview/index.htm [4/27/2001 10:47:30 AM]
1999 was a year of record profitability for the Nestlé Group. Both trading and netprofit advanced strongly in absolute terms and as a percentage of sales. Sales alsoshowed good progress, with real internal growth reaching its strongest rate since1991.
The publication of the Group’s results took place one month earlier than inprevious years, reflecting the desire to accelerate our financial reporting and toprovide greater transparency towards the investment community.
A key feature of our sales performance was the steady acceleration of the rate ofreal internal growth during the year. While this was partly due to the unwinding ofthe economic crises which affected many emerging markets in 1998 and early1999, growth rates also improved in a number of developed markets. Indeed,Nestlé’s performance in North America, Oceania and some key European marketsdoes much to allay frequently expressed concerns over the lack of growthpotential in the food industry. It shows that a product portfolio which is adapted tothe needs of today’s consumers can sustain and create demand.
Nestlé has traditionally benefited from its wide geographic spread, which tends tomitigate the impact of a downturn in one particular area. This balancing effectcharacterised our emerging market operations in 1999. In Asia, while conditionsremained difficult in certain markets, overall the Group achieved good growth forthe year. In Eastern Europe, sales recovered sharply in the second half. Therecovery was supported by Nestlé’s product strategy in the region, which hasfavoured the development of affordable products sold under popular local brands.In most of Latin America, on the other hand, the economic climate had an adverseimpact on consumer spending throughout the year. The decline in our sales was,however, relatively modest, thanks to the particular strength of the Mexicanmarket.
While growth in our food business in many parts of the world was encouraging,the most impressive advances were made by the other activities. In 1999, theGroup sold over 10 billion litres of bottled water and continued to gain marketshare. Whereas, until recently, we have concentrated on marketing mineral waterin developed countries, we are now actively extending our presence in source andtreated waters worldwide. Our aim is to serve the enormous demand for safe,good tasting and affordable water, especially in emerging markets. Nestlé PureLife, a purified water with added minerals, was launched in Pakistan at the end of1998 and in Brazil in mid 1999. It met with immediate success and will be rolledout in other countries during the year 2000. Meanwhile sales in developed marketsare also growing strongly, thanks in particular to initiatives aimed at makingbottled water available through all distribution channels and in a wide variety offormats.
Sales of Cereal Partners Worldwide (CPW), our joint venture with General Mills inbreakfast cereals outside North America, also advanced rapidly in 1999. CPWcontinues to enter new countries, but the main driver of growth is the successfullaunch of new cereal varieties in existing markets.
The Group’s other activities also include its fast growing pharmaceuticals business.Alcon continues to generate strong growth in ophthalmic products, in which it isthe world leader, and is also expanding into the otic area. Galderma, the jointventure with L’Oréal, is enjoying similar success in dermatology.
Nestlé has announced the creation of a major new joint venture in ice cream, withPillsbury in the United States. As is the case with the Group’s other joint ventures,Ice Cream Partners USA will draw on the respective strengths of the twoparticipating companies. Nestlé brings expertise in the impulse segment and anexcellent record in innovation, while Pillsbury’s Häagen Dazs has a strongreputation in luxury bulk products and highly efficient distribution. This will enablethe joint venture to take full advantage of the continuing growth opportunities inthe US ice cream market, the largest market in the world.
Nestlé Management Report 1999 | Business Review
http://www.nestle.com/investor_relations/mr1999/businessreview/01/index.htm (1 of 2) [4/27/2001 10:47:33 AM]

The pace of acquisitions decreased markedly in 1999 following the majoroperations carried out in the previous year. The emphasis was rather ondivestitures, where the Group has stepped up the ongoing rationalisation of itsproduct portfolio. The activities sold were non–strategic or were considered ashaving inadequate profitability in the long term. The divestitures reduce Nestlé’sexposure to commodity–linked areas and allow us to concentrate on themanufacture and marketing of high quality branded products.
The divestiture of certain assets forms part of our far–reaching efforts to improvemanufacturing efficiency and capacity utilisation. An ambitious cost reductionprogramme has been in place since 1997 and has already yielded substantialsavings, as evidenced by the improvement in gross margin over recent years. Theprogramme makes full use of internal benchmarking procedures and, through animproved flow of ideas and information, facilitates the transfer of best practicesthroughout the Group.
The goal of improving capacity utilisation has involved extensive restructuring inboth developed and emerging countries. The measures implemented take accountof the liberalisation of trade flows, which allows us to organise our operations on aregional rather than a national basis. The adaptation of our structures will enableus to achieve optimum flexibility in the manufacture and distribution of goods.
In today’s highly competitive environment, cost control measures cannot applyonly to the manufacturing process. The Group is paying close attention to supplychain management and to administration costs, which should also contribute to afavourable evolution of profitability.
Nestlé will never allow improvements in profitability to be achieved at the expenseof product quality and safety nor of its brands, in which the Group continues toinvest heavily. We do so within a carefully designed brand structure which hasbeen in place for some years. This structure ensures that our consumercommunication is coherent on a global basis and that expenditure on marketingachieves maximum efficiency. At the heart of the structure are six worldwidecorporate brands — Nestlé, Nescafé, Nestea, Maggi, Buitoni and Friskies — each ofwhich has a clear significance for the consumer. A description of the worldwideapproach to Nescafé branding and communication can be found on the Beveragespage of the Product Group Development section.
The worldwide corporate brands relate to broad product categories, within whichare found a wide variety of individual products and technologies. Our productcategories also encompass strong local brands, generally accompanied by one ofthe worldwide corporate brands, which maintain an important emotional link withconsumers in every part of the world.
The largest of the worldwide corporate brands is Nestlé, which accounts for almost40% of Group sales. Nestlé has traditionally been associated with milk and relatedproducts as well as chocolate, and it has clearly defined attributes of taste,pleasure and security. The extension of the brand for the launch of Nestlé PureLife was therefore entirely logical. In addition, a wide range of nutrition products isnow sold under the Nestlé brand. This range reflects Nestlé’s commitment toresearch and development and to the production of genuinely new products,catering for the varying nutritional needs of different sections of the population.
Nestlé Management Report 1999 | Business Review
http://www.nestle.com/investor_relations/mr1999/businessreview/01/index.htm (2 of 2) [4/27/2001 10:47:33 AM]

1999 Sales (a)
in principal marketsIn millions of Swiss francs
Differences 1999/1998in francs in local currency
USA 16 464+ 10.7% + 5.6%
France 7 300+ 3.1% + 4.0%
Germany 6 847+ 0.9% + 1.7%
United Kingdom 4 941+ 8.7% + 6.9%
Italy 4 016- 2.4% - 1.2%
Japan 3 383+ 15.5% - 4.3%
Brazil 2 802- 35.2% - 2.4%
Mexico 2 600+ 23.7% + 22.1%
Spain 2 393+ 3.3% + 4.5%
Australia 1 762+ 12.7% + 5.5%
Canada 1 570+ 5.1% 0.0%
Philippines 1 463+ 15.9% + 6.3%
Switzerland 1 161+ 9.0% + 9.0%
Other markets 17 958+ 3.9% (b)
(a) Sales by markets include food
and other activities.
(b) Not comparable.
In 1999, Nestlé’s sales rose to Fr. 74.7 billion, up 4.1% compared with theprevious year. At comparable structure (excluding net acquisitions) and atconstant exchange rates, sales would have risen by 3.8%.
Real internal growth accelerated during 1999 and reached 3.6% for the fullyear, compared with 3.3% in 1998. The improvement came primarily from foodsales in Asia and Oceania and from the other activities (water, pharmaceuticalsand breakfast cereals).
Selling prices and residual items contributed 0.2% to sales growth. Priceincreases occur mainly in emerging market regions, where they reflect higherrates of inflation.
External growth (the contribution of acquisitions net of divestitures) amountedto 0.9%. Sales increased by 1.4% as a result of acquisitions — mainly Spillers petfood, consolidated for the full year in 1999 — while divestitures led to a 0.5%reduction.
Although their impact was negative, at –0.6%, exchange rates becameprogressively more favourable during the course of the year. This was mainly dueto the appreciation of the US dollar against the Swiss franc, which began in thesecond quarter, and to the marked strengthening of the Japanese yen.
FoodSales in Western Europe progressed well, with all the major markets showingpositive real internal growth. Sales were particularly dynamic in the UnitedKingdom and in Spain. In Eastern Europe, the first half of the year was affectedby the economic downturn which followed the devaluation of the Russian rouble in1998; however, in the second half, sales staged a strong recovery.
North America showed good growth throughout the year, reflecting anexceptional performance by the United States, where real internal growthexceeded 5%. In Latin America, many countries suffered from the difficulteconomic and financial conditions in the region; the notable exception was Mexico,where sales were very buoyant.
The developed markets of Asia and Oceania saw an acceleration of the recoverywhich began in 1998. The decline in local currency sales in Japan reflects a changeof net sales value in line with new commercial practice. There was a markedupturn in many of the emerging markets of South–East Asia.
Other activitiesWater sales continued to show excellent growth, particularly in the Americas andin Asia. In pharmaceuticals, Alcon achieved good growth in the areas ofpharmaceutical drugs and surgical equipment, while Galderma’s dermatologicalproducts also expanded rapidly. CPW, the joint venture with General Mills inbreakfast cereals outside North America, registered strong volume growth, thanksto gains in market share and its entry into new markets.
Nestlé Management Report 1999 | Business Review
http://www.nestle.com/investor_relations/mr1999/businessreview/02/index.htm (1 of 2) [4/27/2001 10:47:40 AM]

Nestlé Management Report 1999 | Business Review
http://www.nestle.com/investor_relations/mr1999/businessreview/02/index.htm (2 of 2) [4/27/2001 10:47:40 AM]

Breakdown of tradingexpenses by categoryin percent
1999 1998
Raw Materials 26.7 28.0
Packaging 9.9 9.5
Salaries & wel-fare expenses 16.4 16.2
Depreciation 3.5 3.6
Other trading expenses 33.0 32.8
Total trading expenses 89.4 90.1
Trading profit 10.6 9.9
Trading profit rose by 11.8% in 1999 to Fr. 7 914 million. This represented asharp improvement in trading profit margin to 10.6%, compared with 9.9% in1998.
The EBITDA (earnings before interest, taxes, depreciation and amortisation)margin rose from 13.9% to 14.7%, while the EBITA margin increased from 10.3%to 11.1%. These figures show the impact of the higher charge for the amortisationof goodwill in 1999, following the major acquisitions carried out in 1998.
This increase in margins reflects the significant progress made in reducing the costof goods sold expressed as a percentage of sales. Lower world commodity priceshave been accompanied by intensive and wideranging efforts to improvemanufacturing and supply chain efficiency. On the other hand, marketing andadministration costs rose as a percentage of sales, as the Group stepped upinvestment in its brands. Distribution costs also increased, reflecting rapidexpansion in areas such as water and pet food, where these costs are relativelyhigh.
The higher level of restructuring costs compared with 1998 is an inevitableconsequence of the drive for greater efficiency. It should enable the Group toachieve further improvements in profitability in the future. Restructuring measuresare being undertaken in all geographic areas as well as in the other activities.
FoodIn Europe, the trading profit margin increased significantly, from 9.1% to 9.9%.Streamlining of the product portfolio and industrial restructuring contributed toimprovements in profitability in most Western European markets. In EasternEurope, the trading profit margin improved dramatically in the second half of theyear, exceeding the levels reached before the Russian crisis.
The trading profit margin declined slightly in the Americas because of theeconomic problems experienced in many Latin American countries. In NorthAmerica, margins were helped by the strong volume growth achieved.
In the Africa, Asia and Oceania region, margins improved sharply in bothdeveloped and emerging markets. The improvement reflected the upturn ineconomic activity and the easing of pressures on consumer purchasing power, aswell as measures undertaken by the Group to optimise industrial efficiency in theregion.
Other activitiesWater continued its steady improvement in profitability, with lower packagingcosts and improved efficiency enhancing the favourable impact of higher volumes.In pharmaceuticals, margins advanced further from already high levels, thankslargely to savings in the cost of goods sold at Alcon. CPW, which registered its firsttrading profit in 1998, showed a significant increase in margin in 1999.
Nestlé Management Report 1999 | Business Review
http://www.nestle.com/investor_relations/mr1999/businessreview/03/index.htm [4/27/2001 10:47:43 AM]

Net profit per shareIn Swiss francs
Group net profit rose by 12.3% in 1999 to Fr. 4 724 million. The net marginincreased to 6.3%, compared with 5.9% in 1998.
Net financing costs decreased significantly to Fr. 998 million from Fr. 1 237million in 1998. The Group benefited from a lower average interest rate onborrowings and from improved liquidity and debt management.
Net non-trading items represented a negative contribution of Fr. 57 million,compared with income of Fr. 189 million in 1998. The main negative elementswere charges for the impairment of certain fixed assets in China and of goodwill inAustralia. These charges were partially offset by exceptional tax credits in theUnited States.
The tax charge as a percentage of profit before taxation was 33.7%, comparedwith 33.2% in 1998. This slight increase was due to the increase in theamortisation of intangible assets and to the impairments of fixed assets. Thesecosts reduce the profit before taxation but they are not, for the most part, taxdeductible.
The share of profit attributable to minority interests increased, reflecting theimprovement in profitability at several companies in Asia, Africa and Oceania. Therecovery of local currencies in the region also contributed to the increase, whichoccured even though Nestlé now owns 100% of Nestlé Philippines.
Earnings per shareEarnings per share rose by 14.1% to Fr. 122.1. The increase was greater thanthat of net profit because of a reduction in the number of shares outstanding,reflecting the Company’s purchases of its own shares.
Nestlé Management Report 1999 | Business Review
http://www.nestle.com/investor_relations/mr1999/businessreview/04/index.htm [4/27/2001 10:47:46 AM]

Capital expenditureIn billions of Swiss francs
Capital expenditure
Depreciation of fixedassets
Capital expenditure reached a new low in 1999, declining to Fr. 2806million compared with Fr. 3061 million in 1998. Expressed as apercentage of sales, it fell from 4.3% in 1998 to 3.8%. This reflectsstrict controls on new capital spending projects, accompanied byrigorous efforts to increase utilization of existing capacities.
Capital spending on our food activities declined in all geographicareas. The decline was most marked in the Africa, Asia and Oceaniaregion. This is due to the postponement of some projects during therecent economic crisis, and to an ongoing initiative to streamlineproduction capacity on a regional basis.
The increase in capital expenditure for the other activities is primarilya consequence of the strong growth in water.
509 factories in 83 countriesThe total number of Nestlé factories decreased by 13 in 1999 as aresult of disposals or closures in all geographic regions. Europe wasparticularly affected, with a net reduction of ten in the number offactories. This figure does not include the 14 factories included in thesale of the Findus business, transferred in early 2000.
The total of 509 factories includes 68 water bottling plants and 17factories for pharmaceutical or dermatological products.
Nestlé Management Report 1999 | Business Review
http://www.nestle.com/investor_relations/mr1999/businessreview/05/index.htm [4/27/2001 10:47:49 AM]

The pace of acquisitions slowed considerably in 1999 after the major transactionscarried out in the previous year. On the other hand, the scale of divestituresincreased slightly. Spending on acquisitions and participations thus declined fromFr. 4 283 million in 1998 to Fr. 483 million. Proceeds from divestitures totalled Fr.266 million, compared with Fr. 236 million in 1998.
The proceeds from divestitures in 1999 did not include those from the sale of theFindus brand and related frozen food assets, which have been received in 2000.This disposal represents around Fr. 900 million in sales and covers the parts ofNestlé’s European frozen food activity which were not regarded as strategic.
In the United States, we sold our roast and ground coffee business in order toconcentrate fully on the development of soluble coffee in this market. Our cocoatransformation plant in Malaysia was sold and the sale of another plant in Italywas agreed, demonstrating the Group’s policy of progressively sourcing necessarysemi-finished raw materials from specialised industry suppliers. Also in thechocolate area, we sold the Laura Secord retail chain in Canada.
In addition, we continued to divest smaller companies present in productcategories such as cheese and meat, where there is limited potential for Nestlé foradding value.
As in previous years, the acquisitions made in 1999 reinforced Nestlé’s globalpresence in key product categories. In Europe, the acquisition of La Cocinera givesus a strong position in the Spanish market for frozen prepared dishes, pizzas andsnacks. The purchase of Svitoch in Ukraine further extends our strong presence inEastern European confectionery markets. In Asia, we have acquired Totole, theleader in chicken bouillon in China. In Latin America, we purchased the remainingbiscuit interests of La Universal in Ecuador to add to our significant biscuitbusiness in the region. We widened our mineral water interests through a jointventure with Quilmes in Argentina, which covers the Eco de los Andes brand.
More detailed information about acquisitions and divestitures can be found in thesections on the various product groups.
Nestlé Management Report 1999 | Business Review
http://www.nestle.com/investor_relations/mr1999/businessreview/06/index.htm [4/27/2001 10:47:52 AM]

Evolution of the Nestléregistered share in 1999(compared with the Swiss stockmarket index)
Registered share
Swiss Performance Index
Operating cash flow rose by 28% in 1999 to Fr. 8.2 billion. The increase wasgreater than that of net profit mainly because of a decrease in working capital,reflecting the Group’s ongoing supply chain management efforts, and thenon–cash charges taken for the impairment of fixed assets and goodwill.
The Group’s net financial debt (short, medium and long term financial debt, net ofliquid assets) declined from Fr. 6.6 billion at the end of 1998 to Fr. 6.2 billion. Thisdecline occurred despite expenditure of Fr. 2.3 billion to finance purchases of theCompany’s own shares — a demonstration of the Group’s strong cash flowgeneration.
The ratio of net debt to equity (including minority interests) fell to 24.7%,compared with 28.4% in December 1998.
Shares, stock exchangeEquity markets in 1999 were characterised by a marked investor preference forcyclical and technology stocks. As a result, the more defensive sectors — such asfood manufacturing — generally showed a more subdued share price performance.In this context, the Nestlé share held up relatively well, declining by only 2% overthe year. The Swiss Performance Index meanwhile rose by 12% .
Within the global food manufacturing sector, Nestlé outperformed its majorcompetitors in share price terms. This outperformance reflected a favourablemarket reaction to the results published in the course of the year and to theannouncement of various divestitures, which are seen as further enhancing theGroup’s focus on core areas.
Over two years the Nestlé share continues to outperform the Swiss PerformanceIndex, having risen by 33%, compared with a 29% gain in the SPI.
Nestlé Management Report 1999 | Business Review
http://www.nestle.com/investor_relations/mr1999/businessreview/07/index.htm [4/27/2001 10:47:55 AM]

Nestlé respects the environment, supports sustainable development and iscommitted to environmentally sound business practices throughout the world. Tofulfill this commitment, Nestlé:
integrates environmental principles, programmes and practices into eachbusiness;
●
strives for the continuous improvement of its environmental performancethrough application of the Nestlé Environmental Management System(NEMS);
●
complies with applicable environmental legislation. Where none exists,Nestlé 's own internal rules are applied; and
●
provides appropriate information, communication and training to buildinternal and external understanding concerning the Company'senvironmental commitment.
●
Extract from The Nestlé Policy on the Environment, 1999*.
In 1999, Nestlé continued its worldwide approach of integrating environmentalawareness and actions into its operations.
The 1999 update of The Nestlé Policy on the Environment reiterates the Group'sstrong environmental commitment and reflects key priorities moving into the newmillennium. The Policy also recognises developments in the internationalenvironmental arena.
The application of The Nestlé Policy on the Environment at every level of operationforms an essential part of the Nestlé Corporate Business Principles*. It enablesNestlé to contribute to sustainable development — satisfying the demands of thepresent, without compromising the ability of future generations to meet their ownneeds. The policy has been translated into several languages to ensurecomprehensive distribution and understanding.
During 1999, Nestlé launched a significantly expanded environment section on itsInternet site (www.nestle.com), designed to build internal and externalunderstanding of Nestlé's environmental commitment. The site provides in–depthinformation on the Group's environmental policy, activities, and achievements.
Based on the results of the worldwide factory environmental audit completedpreviously, the Group has acted to further improve environmental performance inidentified priority areas. This is part of the normal continuous improvementprocess of Nestlé factories worldwide as foreseen by the Nestlé EnvironmentalManagement System — establishing environmental targets and plans, monitoringprogress against those plans, checking results and defining corrective andpreventive actions.
Nestlé Management Report 1999 | Business Review
http://www.nestle.com/investor_relations/mr1999/businessreview/09/index.htm (1 of 2) [4/27/2001 10:47:57 AM]

While maintaining product quality, efforts in packaging source reduction werecontinued in 1999. Packaging material savings now amount to close to 165 000tons and Fr. 300 million for the period 1991 to 1999.
Nestlé continued to communicate on environmental issues with local communities,authorities, industry, consumers and other interested stakeholders. As anexample, Nestlé participated with the Confederation of the Food and DrinkIndustries of the EU in the organisation of the first Environment Day of the Foodand Drink Industry. At this event food industry representatives, including Nestlé,presented to a large audience many successful examples of how the industry isapplying environmental protection throughout the food chain.
*available on www.nestle.com and in printed form on request.
Nestlé Management Report 1999 | Business Review
http://www.nestle.com/investor_relations/mr1999/businessreview/09/index.htm (2 of 2) [4/27/2001 10:47:57 AM]

In addition to the direct investment and employment provided by the Companythroughout the world, Nestlé contributes to the well–being of local communities inother ways. The personal commitment of Nestlé people, together with financialassistance and sharing of know–how, helps to develop long–term skills, incomeand productivity. Community projects exist in countries all over the world; thefollowing are just a few examples:
In Morocco, Nestlé cooperates with the Zakoura Foundation in poor rural areas.Established in 1995, the Foundation initially provided employment opportunities bygranting micro–credit loans. Its success led to an agreement with the Ministry ofEducation to develop an informal educational programme for children in ruralareas where illiteracy is high and where, for social, economic or geographicreasons, public schooling is unavailable.
Celebrating its 100 years in Thailand, Nestlé focused its attention on care for theenvironment with a major reforestation project in Nam Nao National Park. Overthree years, 300 000 trees were planted and Nestlé is continuing its commitmentwith a tree maintenance programme lasting until 2001. This was the first projectof such magnitude in Thailand to be supported by a private company. In the areaof educational promotion, Nestlé Thailand is sole sponsor of a radio programme"What you should know about Food and Drugs". The content of the programme —broadcast three times a day, seven days a week — is prepared by the government's Food and Drug Administration.
Nestlé Brazil has traditionally played a leading role in the community. Numerouslongstanding as well as new projects illustrate this commitment, in the fields ofenvironmental protection, education, literacy, and in humanitarian initiatives, suchas the crèche in Montes Claros for children from deprived areas. Contributing toBrazil's diverse cultural life, the Company offers the Nestlé Literature Award, themost important literary prize in Brazil.
In 1989, Nestlé Canada was one of four founding sponsors who united to establishKids Help Phone, a 24–hour, bilingual, national counselling service for troubledchildren and young people. Today, Kids Help Phone is a voice of hope, help andcomfort for the more than 800 Canadian children who call each day looking foranswers to life's toughest challenges. Over the past decade, Nestlé Canada and itsemployees have helped to sustain this vital service through donations as well asthe initiation of fundraising events. To increase awareness of Kids Help Phone,Nestlé Canada prints the toll-free telephone number on the packaging of morethan 1.5 million products annually.
In Canada, Nestlé prints the toll–free telephone number of this counselling service on the packaging of morethan 1.5 million products annually.
Nestlé Management Report 1999 | Business Review
http://www.nestle.com/investor_relations/mr1999/businessreview/10/index.htm (1 of 2) [4/27/2001 10:48:01 AM]

Nestlé Management Report 1999 | Business Review
http://www.nestle.com/investor_relations/mr1999/businessreview/10/index.htm (2 of 2) [4/27/2001 10:48:01 AM]

Geographic distribution
1999 1998
Europe* 41.8% 42.2%
Americas 33.0% 33.8%
Africa, Asiaand Oceania 25.2% 24.0%
* 6375 employees in Switzerland in1999.
Distribution by activity
1999 1998
Factories
138 191 139 675
Adminstrationand selling
92 738 92 206
230 929 231 881
Staff EvolutionThe number of staff employed by the Group was slightly reduced from 231 881 atthe end of 1998 to 230 929 at December 31st 1999, which represents a decreaseof 0.4%.
This evolution is the combined result of a decrease produced by disinvestmentsand by a permanent effort to rationalise our structures, partially offset by theimpact of acquisitions and the internally generated sales volume growth. In viewof the Group sales growth this reduction reflects a considerable gain inproductivity.
Development of Human ResourcesNestlé continues to practice a development policy based on the long-term needs ofthe Group. The traditional policy of favouring internal promotions and long-termcareer prospects remains valid. However, it is being strengthened by a moreaggressive hiring policy reflecting the need to benchmark continuouslyprofessional skills and competencies with those offered by external candidates.Flat hierarchical structures are being put in place, creating room for more initiativeat the lowest possible level in the organisation. The goal is to enhance motivationand to foster a working atmosphere that is attractive to the best professionals andmanagers.
Today's competitive environment requires a speed of action which can only beachieved by well trained and capable employees, who are able to contributeeffectively to Nestlé's goals. Consequently, training continues to play a decisiverole at Nestlé through the numerous and intensive efforts deployed throughout theworld, which are heavily weighted towards on–the–job training. Training coursesare organised to provide pertinent and state–of–the–art education to carefullyselected participants. These courses are subject to assessment and are constantlybeing improved. They also aim to strengthen the Nestlé culture, especially at theRive-Reine International Training Centre where, in 1999, 1718 participantsattended a total of 81 seminars and courses.
LeadershipThe "Basic Management and Leadership Principles", issued in 1997, are nowwidely known by management and staff. The leadership style which they requiredemands significant efforts to review and modernise management practices.Performance assessment now underlines the set of values included in thisdocument. Progressively, remuneration will take more into account leadershipquality, which is perceived to be an important pillar for the development ofNestlé's business.
RemunerationNestlé endeavors to provide competitive employment conditions as compared withsimilar companies in each country. Considering that remuneration should properlyreflect individual efforts to achieve company goals, the variable part of theexecutives 'remuneration has been increased. Traditional remuneration structuresand practices are reviewed to take into account the flexibility needed for theorganisation to meet high quality standards in the fast moving modern economy.
Remuneration policies increasingly concentrate on ensuring a level ofcompetitiveness allowing Nestlé to attract and retain professionals who arecapable of building the Group's future.
Nestlé Management Report 1999 | Business Review
http://www.nestle.com/investor_relations/mr1999/businessreview/11/index.htm [4/27/2001 10:48:07 AM]

Nestlé enjoys an unparalleled position across a wide range of product categories thanks to the strengthof its brands and its global presence.To ensure future growth, the brands must continue to be relevantto today’s consumers, while appealing to each new generation. This requires a constant process ofinnovation and renovation, developing products, pack formats, distribution channels andcommunications which are adapted to changing lifestyles, reaching consumers of all ages wherever theyare throughout the day.
Nestlé Management Report 1999 | Product Group Development
http://www.nestle.com/investor_relations/mr1999/productgroup/index.htm [4/27/2001 10:48:23 AM]

Nestlé introduced the first commercially successful soluble coffee in Switzerland in1938, and sales of Nescafé have been growing steadily ever since. With over 3000cups drunk every second, Nescafé is by far the world's most popular brand ofcoffee. Ready-to-drink coffees are sold under the same brand. Nestlé is also theworldwide leader in chocolate/malt beverages, for which the best known brandsare Nesquik, Milo and Nescau. In addition, the Group is present in traditionalroasted coffees in several European countries, as well as in espresso coffee incapsules with Nespresso; in fruit juices, where its most important brand is Libby'sin the United States; and in tea-based drinks, particularly soluble andready-to-drink Nestea. Nestlé is also the world market leader in mineral andspring waters. Its presence is strongest in Europe — with such brands as Vittel,Contrex, Perrier, San Pellegrino, Levissima, Vera, Panna, Fürst Bismarck andNaleczowianka — and in the United States, with Arrowhead, Poland Spring,Zephyrhills, Deer Park and Ozarka. Water under the Nestlé Pure Life brand,successfully launched in Pakistan at the end of 1998 and in Brazil in 1999, will beintroduced rapidly in other emerging markets.
1999 1998 1997
Sales 20 859 19 879 19 142
Trading profit 3 764 3 253 3 243
Capital expenditure 618 593 629
Millions of Swiss francs
For refreshment, relaxation, energy or just pure enjoyment, ourwell-known brands offer the right beverage for every occasion.
Green coffee pricesAverage monthly prices expressedin US¢ per lb.
Green coffeeArabicas were steady for much of the first half. Successive high monthly Braziliancoffee shipments and a build-up of green coffee stocks in consuming countriesresulted in prices weakening in the third quarter. However, insufficient rainfall inBrazil during October and November negatively affected the 2000 cropdevelopment and prices moved sharply upwards.
Robusta prices declined steadily until early October and then reacted upwards inline with the arabica market, but by the end of 1999 robusta values were againquoted close to the year's lows.
Nestlé Management Report 1999 | Product Group Development
http://www.nestle.com/investor_relations/mr1999/productgroup/01/index.htm (1 of 3) [4/27/2001 10:48:28 AM]

Nescafé top of therange coffee with thenew logotype.
Recruiting youngerconsumers withattractive products.
SalesNescafé sales continue to be very satisfactory; in Russia however they havesuffered from the local economic situation.
1999 was marked by the spread around the world of the new global Nescafécommunication. "Open Up" has been seen on television and at the cinema, and atyouth-orientated public events. Linked with this has been a change in the Nescafélogotype and rejuvenated Nescafé labels.
Several new convenience coffees were launched, for example Nescafé com Leite inBrazil and Nescafé Coffee Stick Mix in Korea. These are complete coffee mixescontaining ready-to-use blends of Nescafé, creamer and often sugar.
The launch of a range of coffee specialities in the United States — includingNescafé Frothé — as well as Nescafé NES in France and Nescafé Café Libre inAustria illustrates our strategy to recruit younger consumers with attractiveproducts and very focused communication. As part of this strategy, a dedicatedpublic Nescafé Internet site (www.connect.nescafe.com) has been opened,covering different aspects of young people's lives treated within a Nescaféenvironment.
The availability and affordability of chocolate/malt beverages has improvedworldwide, developing the overall competitiveness of these major Nestlé brands.Focused marketing activities supporting Nesquik, Milo and Nescau generatedincreased consumer preference and brand loyalty in Europe, the Americas and theFar East.
In the iced tea category, Nestea in ready-to-drink form continues its stronggrowth in North America through the joint venture Coca-Cola NestléRefreshments, USA, and has been successfully rolled out in Venezuela.
Nespresso's appealing newmachines bring added innovationto consumers.
The availability of chocolate/malt beverages has
improved worldwide. Nestea in ready-to-drink formcontinues its strong growth.
Nespresso sustained solid growth by increasing household penetration in existingmarkets while launching its fully integrated portioned coffee system in Europe'slargest espresso market, Italy. Key to its continued expansion is the positiveword-of-mouth publicity Nespresso enjoys from satisfied customers, who continueto promote the quality of the espresso, the convenience of the system and theexpanded personalized services provided by its unique Club distribution channel.Nespresso is now available online (www.nespresso.com). Nespresso reinforced itsreputation for quality and innovation through advertising evoking coffeeconsumers' aspirations and through a range of 13 redesigned machine models,including distinctively novel colors for the Alessi-Nespresso line.
Nestlé Management Report 1999 | Product Group Development
http://www.nestle.com/investor_relations/mr1999/productgroup/01/index.htm (2 of 3) [4/27/2001 10:48:28 AM]
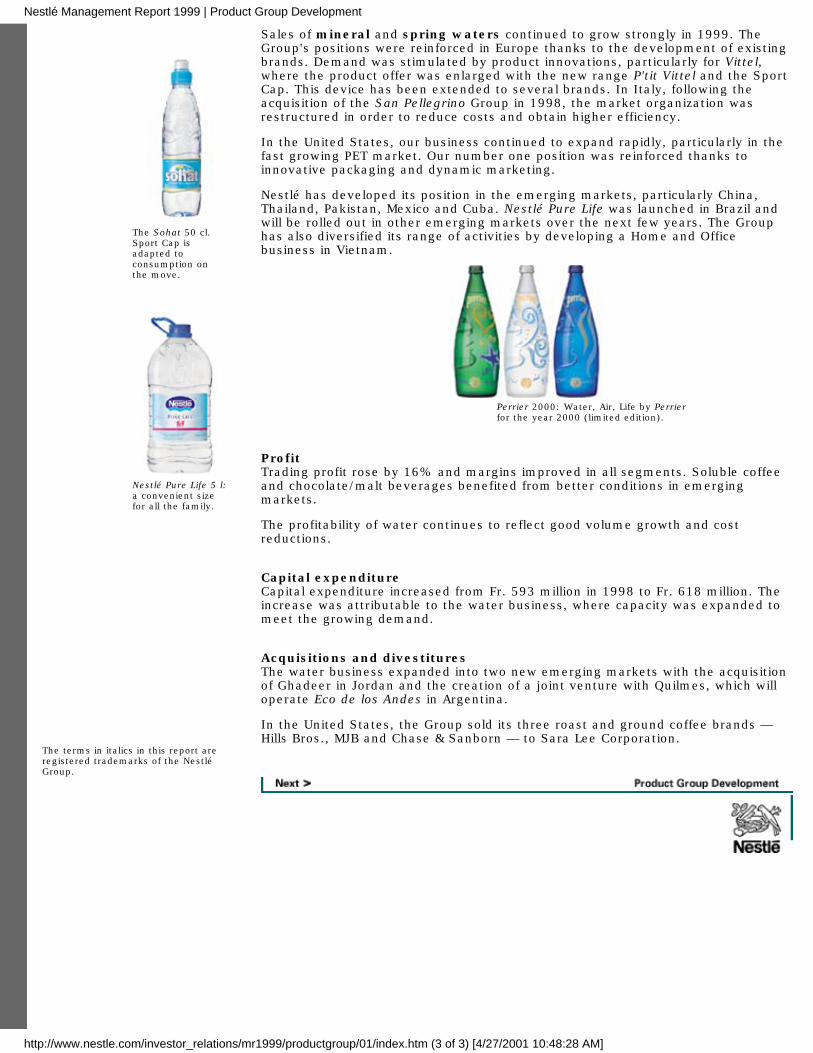
The Sohat 50 cl.Sport Cap isadapted toconsumption onthe move.
Nestlé Pure Life 5 l:a convenient sizefor all the family.
Sales of mineral and spring waters continued to grow strongly in 1999. TheGroup's positions were reinforced in Europe thanks to the development of existingbrands. Demand was stimulated by product innovations, particularly for Vittel,where the product offer was enlarged with the new range P'tit Vittel and the SportCap. This device has been extended to several brands. In Italy, following theacquisition of the San Pellegrino Group in 1998, the market organization wasrestructured in order to reduce costs and obtain higher efficiency.
In the United States, our business continued to expand rapidly, particularly in thefast growing PET market. Our number one position was reinforced thanks toinnovative packaging and dynamic marketing.
Nestlé has developed its position in the emerging markets, particularly China,Thailand, Pakistan, Mexico and Cuba. Nestlé Pure Life was launched in Brazil andwill be rolled out in other emerging markets over the next few years. The Grouphas also diversified its range of activities by developing a Home and Officebusiness in Vietnam.
Perrier 2000: Water, Air, Life by Perrierfor the year 2000 (limited edition).
ProfitTrading profit rose by 16% and margins improved in all segments. Soluble coffeeand chocolate/malt beverages benefited from better conditions in emergingmarkets.
The profitability of water continues to reflect good volume growth and costreductions.
Capital expenditureCapital expenditure increased from Fr. 593 million in 1998 to Fr. 618 million. Theincrease was attributable to the water business, where capacity was expanded tomeet the growing demand.
Acquisitions and divestituresThe water business expanded into two new emerging markets with the acquisitionof Ghadeer in Jordan and the creation of a joint venture with Quilmes, which willoperate Eco de los Andes in Argentina.
In the United States, the Group sold its three roast and ground coffee brands —Hills Bros., MJB and Chase & Sanborn — to Sara Lee Corporation.
The terms in italics in this report areregistered trademarks of the NestléGroup.
Nestlé Management Report 1999 | Product Group Development
http://www.nestle.com/investor_relations/mr1999/productgroup/01/index.htm (3 of 3) [4/27/2001 10:48:28 AM]

The impact of nutrition on health and well–being makes it an important factor —together with taste and pleasure — in the development of a large range of valueadded foods. These include start–up and follow–up formulas for babies,growing–up milks, infant cereals and a variety of ready–to–eat foods as well asenteral diets and oral supplements, and products offering health and performancebenefits. In the dairy business, Nestlé is strengthening its leader position in shelfstable milks and is building a major presence in the chilled dairy category. CerealPartners Worldwide, the joint venture with General Mills for breakfast cerealsoutside North America, is now active in 75 countries. The Group continues tostrengthen its global presence in ice cream.
1999 1998 1997
Sales 19 411 19 175 19 334
Trading profit 2 168 1 837 1 932
Capital expenditure 366 576 745
Millions of Swiss francs
Nestlé's wide range of infant, dairy and clinical foods providesconsumers with both nutrition and pleasure throughout theirlives.
MilkWorld milk production grew in 1999, the fourth consecutive year of increase. Thefastest growth was seen in Oceania, Asia, South America and North America.However, in the European Union, milk availability was almost unchanged and iteven decreased in Central and Eastern Europe, including the Community ofIndependent States (CIS), where falling prices discouraged farmers fromincreasing production.
The decline in the international trade in dairy products, which started in 1998,continued during the first half of the year, mainly due to the economic crises insome major importing countries, notably Brazil, Russia and several Asian markets.Consequently, prices continued to fall. However, as a result of an improvedeconomic environment leading to higher demand in the second half of 1999, pricesfirmed for all dairy products with the exception of butterfat. This improvement wasparticularly visible through the level of export licenses requested by EU exporters,which exceeded the permitted subsidized exports by the WTO. It was one of thereasons for the EU Commission's decision to reduce export refunds during the lastquarter.
Nestlé Management Report 1999 | Product Group Development
http://www.nestle.com/investor_relations/mr1999/productgroup/02/index.htm (1 of 4) [4/27/2001 10:48:54 AM]

Bear Brand in Thailand: apreschool milk with Prebio1 toensure the health of thedigestive system.
SalesSales volume of shelf stable dairy products remained fairly steady in 1999,despite the economic crisis which affected our main market, Brazil, at the start ofthe year, yet with clear improvement as from mid–year. In the other markets,particularly in South East Asia, milk powders and other shelf stable products haveenjoyed a good performance.
The Group has accelerated its innovation and renovation policy in the shelf stablesector with major launches of new value added products enriched with activeingredients: milk powder with Prebio1 for preschool and schoolchildren to maintaingood intestinal health (launched in Thailand and Taiwan), and adult milks —powder and UHT — with a proprietary engineered fat blend, Omega 3:6,contributing to the maintenance of a healthy blood cholesterol level (launched inBrazil, Mexico and Chile). These new products are already showing very positiveresults and will be rapidly extended.
Coffee creamers, a very profitable activity, are doing well and the liquid version inthe United States is showing substantial growth.
The chilled dairy category has continued a steady growth trend thanks toinnovation. In Mexico and Chile, an Omega 3:6 yoghurt has been launched. InEuropean countries the exciting, very indulgent Extrême version of the traditionalliégeois has won over many gourmets. In the United Kingdom, the combination ofan aerated dessert cream with mini Smarties is a success. We have alsointroduced the first meal replacement with a yoghurt base.
Nestlé Omega: adult milk and yoghurt with a balanced fatblend contributing to the maintenance of a healthy bloodcholesterol level.
Extrême: a combination of dessertcreme and cream whipped andspiralled together.
Dairy drink with the proprietaryLC1 strain.
Breakfast cereal for youngchildren up to the age of three.
The LC1 range has been extended with a fresh cheese for children in Switzerland,a low fat range in Germany and a creamy yoghurt in Thailand. The growing trendin chilled dairy drinks has been fostered by the development of LC1 drinks inGermany and Spain and by the geographical extension of LC1 GO to the UnitedKingdom and Chamyto to Malaysia.Infant nutrition progressed at an accelerated pace, thanks to strong gains inWestern Europe as well as in North America. High medical and consumeracceptance of more advanced contemporary weaning food concepts as well as ofhypoallergenic formulas and growing–up milks were the main contributors.
The geographical rollout of the clinically proven follow–up and growing–up milkswith probiotics was successfully pursued. Also noteworthy is the development andintroduction in France of the Group's first breakfast cereal specifically conceivedfor the nutritional requirements of young children up to the age of three.
The Group further strengthened its position in the growing clinical nutritionmarket worldwide. Internal growth has accelerated especially in North Americawhere Peptamen continues to lead the speciality market.
The range of powder products, which offer added versatility in usage, has beenenlarged with Nutren Fibre, Peptamen and Modulen IBD. The latter is a specificdiet adapted to the nutritional support of Crohn's disease (affecting the digestivetract) patients, and is marketed in several European markets.
Nestlé Management Report 1999 | Product Group Development
http://www.nestle.com/investor_relations/mr1999/productgroup/02/index.htm (2 of 4) [4/27/2001 10:48:54 AM]

Nutren powder, Nutren fibre andPeptamen powder — new clinicalnutrition products in powder form.
Geographical expansion remains a key objective which has been activelyimplemented, with launches in a number of countries in Asia and Latin America.
The objective of performance nutrition is to create value added foods that, inaddition to taste and pleasure, have a positive impact on consumers' health andwell-being. This is achieved by using natural active ingredients which have beenscientifically shown to be useful in improving physical or mental performance or inreducing the risk of disease. Nestlé is uniquely positioned to satisfy this increasingconsumer demand with its superior R & D in nutrition and leadership in a broadrange of food categories which can serve as carriers.
The first of these new products have been recently introduced and include: LC1
GO, Bear Brand milk with Prebio1, Omega milk with Omega 3:6 fatty acids, NestléGrowing Up Milk with Bifidus BL.
Nestlé LC1 GO,mini beveragewith probiotics.
Nestlé Ice Cream: a strong visual identity.
Nestlé continued to reinforce its presence in ice cream, with growth being drivenby strong product innovation and the expansion of distribution through our freezerplacement program. We extended our new visual identity worldwide with a verypositive impact on our visibility in the street.
In Europe, our sales progressed well in Russia. In Italy, a new range of bulkproducts, presented in an innovative transparent container, boosted sales.
In Asia and Oceania the geographical extension and development of our strategicbrands continued, notably in Australia with the launch of Maxibon and DrumstickBaci.
In the United States, the world's largest ice cream market, we strongly reinforcedour position by entering into a joint venture with Pillsbury, a subsidiary of Diageo,owners of the Häagen-Dazs brand. Ice Cream Partners USA will sell both theNestlé and Häagen-Dazs brands and offers considerable growth opportunities inthis large market.
Also in the United States, the launch of a new children's range, Ice Screamers,was very successful, as was the introduction of the Toll House ice cream sandwichin the impulse channel.
Häagen-Dazs — theleader in the superpremium segment in theUnited States. Toll House sandwich
— a successfulextension of the TollHouse brand in theUnited States.
Nestlé Management Report 1999 | Product Group Development
http://www.nestle.com/investor_relations/mr1999/productgroup/02/index.htm (3 of 4) [4/27/2001 10:48:54 AM]

Drumstick Baci — aninnovative newproduct andpresentation inAustralia.
Cereal Partners Worldwide (CPW) now operates in 75 countries whichtogether account for three quarters of world breakfast cereal consumption outsidethe United States and Canada.
1999 marked another successful year for CPW as strong volume growth supportedmarket share increases in most countries. CPW's consolidated market share in thecountries where it operates is estimated at 20%, a strong number two position.
Over the course of the year CPW expanded geographically by entering Denmark,Finland, Hungary and Turkey. Additionally, CPW launched Crunch, a chocolatecereal using the well known Nestlé chocolate brand equity, Frutina and GoldenNuggets, all of which contributed to the positive overall result.
Crunch — new chocolatecereal using well-knownbrand equity.
Frutina — recently launchedin Poland and targetingadult consumers.
ProfitTrading profit rose by 18%. Shelf stable milk products, which in 1998 sufferedfrom the economic difficulties in South-East Asia, saw a recovery in margins.Results also improved for nutrition products and for ice cream, as the Groupconsolidates its performance in these areas. Refrigerated dairy products continueto benefit from the streamlining of the portfolio carried out over the last twoyears.
Capital expenditureCapital expenditure fell sharply for the second successive year, from Fr. 576million in 1998 to Fr. 366 million. The declines reflect the efforts being made toimprove utilization of existing capacities, particularly in the area of milk products.However, the Group continues to invest in key areas: CPW opened new lines inEurope in response to the strong growth in breakfast cereal sales.
Acquisitions and participationsIn China, we increased to 90% our shareholding in Guangzhou Refrigerated Foods,the leader in the ice cream market in the South of China.
The terms in italics in the ProductGroup Development section of thisreport are registered trademarks ofthe Nestlé Group.
Nestlé Management Report 1999 | Product Group Development
http://www.nestle.com/investor_relations/mr1999/productgroup/02/index.htm (4 of 4) [4/27/2001 10:48:54 AM]

Nestlé has a wide range of chocolate and confectionery products which cater for allconsumer tastes and occasions; chocolate tablets, gift–boxed assortments, childand adult specialities, eat–on–the–go bars for younger people and sweet snacksfor the family. The range includes international brands such as Nestlé, KitKat,Smarties, Lion, Crunch, After Eight and many famous local brands such as VioletCrumble, Coffee Crisp, Munchies, Lanvin Escargots, Choco Crossies and Rossiyaassortments. The complementary sugar confectionery range includes sweets forrefreshment — Polo, Frutips, Fox's — and those for functional purposes such asAnticol and Soothers throat sweets and Quick–eze. Biscuits are still predominantlya regional Latin American business (São Luiz, McKay, La Rosa) but are now alsodeveloping in Eastern Europe and Russia.
1999 1998 1997
Sales 10 195 10 485 10 663
Trading profit 882 976 1 054
Capital expenditure 280 388 435
Millions of Swiss francs
Share the delight of Nestlé chocolate.
Cocoa pricesAverage monthly pricesexpressed in US¢ per lb.
CocoaIn 1999, the cocoa market was influenced by three factors which resulted in pricesmoving continuously lower throughout the year. Firstly, global demand forchocolate products, especially from Russia and Eastern Europe, was hesitant.Secondly, the long awaited liberalization of the Ivory Coast's external cocoa salesactivity, previously controlled by the Caisse de stabilization, resulted in manymarket participants redefining both their selling and buying strategies inanticipation of more concentrated marketing activity by this producer. Finally,after several deficit seasons, there was an improvement in the supply/demandbalance, which was reinforced during the second half of the year by the prospectof a very good 1999/2000 crop season in West Africa, particularly the Ivory Coast.
Nestlé Management Report 1999 | Product Group Development
http://www.nestle.com/investor_relations/mr1999/productgroup/03/index.htm (1 of 3) [4/27/2001 10:49:10 AM]

Toffee and crunchypieces in deliciousmilk chocolatecups.
SalesChocolate and confectionery sales worldwide were close to 1998 levels despitelower cocoa grindings due to the lingering effects of the economic problems inAsia, Russia and Brazil. Confectionery innovation at Nestlé continued at a vigorouspace with several new product launches.
In Europe, the star of the year was the successful KitKat Chunky in the UnitedKingdom. The product is a single finger bar of KitKat with a big bite for youngerpeople eating on the go. Mini Smarties continued to do well and sales wereextended to the United Kingdom, where they were introduced in a newchild-friendly and child-proof dispenser. Further launches included Rolo containinga cookie piece and new Polo varieties Citrus and Butter-ups.
The star of the year.
New child-friendly dispenserfor Mini Smarties.
In France and Spain, a range of high quality chocolates from specialised uniquecocoa beans was launched in response to a resurgent consumer interest inconnoisseur chocolate. In Switzerland, a new range of truffles and bite sizepralines was launched and sold well as individual nibbles and small gifts. Anticolwas launched in the Czech Republic with strong sales during the winter season.
A stylish chocolate for connoisseurs of differentcocoa bean varieties.
Throat soothing sweets filled withfruit flavoured menthol.
Two new biscuit launches in Brazil.
In the United States, several new introductions to the Willy Wonka range weremade to maintain pre-teenage child interest in this fun-based sugar confectioneryrange; an interactive website has been created for the brand (www.wonka.com).In order to take advantage of sweet snack opportunities on the biscuit shelf, twonew biscuits were launched in Brazil, taking the visual and organoleptic propertiesof two well-known and popular brands, Nescau and Prestigio. Another new biscuitin Brazil was fully-coated Negresco. Chomp, already well-known as an ice creambrand, was launched as a monotype individual praline piece in the indulgencemarket.
Nestlé Management Report 1999 | Product Group Development
http://www.nestle.com/investor_relations/mr1999/productgroup/03/index.htm (2 of 3) [4/27/2001 10:49:10 AM]

Enter the Wild World of Wonka on-line. Pralines celebrating theFête des Vignerons, Vevey.
The chocolate wafer sweet snack introduced in China last year continued to dowell and a similar product, Munch, was launched in India. In Japan, KitKat againhad record sales, and a new half-bitter chocolate stick was launched. In theASEAN region, the sugar business also achieved record sales and is now wellestablished.
A high quality "value for money"product in China.
ProfitOver the last two years trading profit has been negatively affected by difficultconditions in emerging markets. The devaluation of the Russian rouble, whichoccurred in August 1998, had repercussions for the chocolate business in EasternEurope for much of 1999. In addition, the economic crisis in Latin America had anunfavorable impact, particularly for biscuits.
Capital expenditureCapital expenditure declined significantly from Fr. 388 million in 1998 to Fr. 280million. Selective investments were made in all zones, mainly relating to chocolateproduction.
Acquisitions and divestituresTwo biscuit businesses were acquired — La Universal in Ecuador and Excelcia FoodLimited in India. The Group also acquired Svitoch, a confectionery business inUkraine.
A significant rationalization of the chocolate business was undertaken in 1999.Firstly, the divestment of two cocoa processing operations — Intra in Italy andMalaysia Cocoa Manufacturing — was announced. Secondly, the Laura Secordchocolate retailing business in Canada was sold. Both moves demonstrate Nestlé'sstrategy of concentrating on the manufacture and marketing of branded chocolateproducts.
The terms in italics in the ProductGroup Development section of thisreport are registered trademarks ofthe Nestlé Group.
Nestlé Management Report 1999 | Product Group Development
http://www.nestle.com/investor_relations/mr1999/productgroup/03/index.htm (3 of 3) [4/27/2001 10:49:10 AM]

A diversified range of soups, bouillons, sauces and culinary preparations, soldprimarily under the Maggi brand, is adapted to local tastes, recipes andingredients in each country. Maggi instant noodles are sold in the Far East-Pacificarea, as well as in Europe, Africa and Latin America. Nestlé's frozen prepareddishes are sold under three main brands: Stouffer's in the United States andFindus or Maggi in the other regions of the world. Nestlé is present in Italiancuisine with Buitoni pastas and sauces, both refrigerated and shelf stable. TheBuitoni range also includes a wide choice of pizzas and frozen dishes. In Europe, afull range of delicatessen products and cold meats is available under the Hertabrand. The Group also manufactures cold sauces and condiments under variousbrands such as Thomy, Crosse & Blackwell and Winiary.
Miscellaneous activities include Nestlé's very important participation in thepetfood/care market, essentially under the Friskies brand.
1999 1998 1997
Sales 20 185 18 765 17 660
Trading profit 1 850 1 617 1 525
Capital expenditure 464 442 445
Millions of Swiss francs
The Maggi, Stouffer's and Buitoni brands deliver "meal solutions"with a variety of products from cooking aids and dehydratedsoups through to ready-prepared homestyle meals and authenticItalian dishes.
SalesSales in the major culinary categories of cooking aids and prepared dishesagain increased in 1999. This reflects higher consumption of traditional productsas well as the constant and successful efforts to renovate and innovate in order tokeep our products relevant for today's consumers.
Among the dehydrated culinary products, traditional bouillons are well adaptedto the cooking and eating habits of developing countries. Over the years they haveattained high consumer acceptance on all continents. A major launch of newlocally adapted bouillons took place in Indonesia and several new flavours havebeen launched in Latin America and Africa, where Maggi already enjoys leadingmarket positions. New products — such as the successful Maggi stir-fry range inAustria — also helped sales in Europe, and we are expanding our distribution inRussia.
Nestlé Management Report 1999 | Product Group Development
http://www.nestle.com/investor_relations/mr1999/productgroup/04/index.htm (1 of 4) [4/27/2001 10:49:22 AM]

Maggi Brat&Würz: innovative olive oil based
stir-fry bouillon. Maggi — Vegetable Sensations: a
successful sauce concept adapted toyoung consumer trends.
In industrialised countries, people have less time for cooking but neverthelesswant to be involved in food preparation. Responding to this "high conveniencehome cooking" trend, in New Zealand Nestlé was the first company to launchdehydrated sauces for Asian and vegetarian cooking under the Maggi brand.
Maggi oriental noodles had a good year. We strengthened our already leadingposition in Australia where we launched a new range of Maggi bowl noodles underthe Taste of Asia brand. Market penetration and sales have also increased in India,mainly thanks to a well received improvement in our local noodle quality.
A hot snack wherever andwhenever.
Dehydrated prepared dishes performed well in Europe, especially thesuccessful range of cup products under the Crosse & Blackwell brand in the UnitedKingdom.
Increased pasta consumption helped to grow sales of traditional Buitoni pasta inGermany, where Buitoni is now leader in the Italian pasta segment.
Buitoni: great Italian taste. In accordance withconsumer trends: healthydurum wheat pasta.
Pizza — Stone Oven.
Great tasting cookies on thespur of the moment.
Frozen food achieved an outstanding performance in the United States, whereStouffer's Skillet Sensations established themselves as the leader in this young,highly convenient category of frozen prepared dishes. We strengthened ourpresence in pizza in several European countries, helped by the innovative "StoneOven "pizza launched in France.
A very successful innovation was the launch of the Nestlé Toll House chilledcookie dough bar in the United States. This new product offers a convenient wayof preparing high quality, typical American home baked cookies based on Nestlé'sdough and chocolate know-how. Significant gains in market share have beenachieved.
Chilled pasta under the Buitoni brand had another year of steady growth both inEurope and in the United States, where Buitoni leads this product category.
In Europe, sales of chilled meat products under the Herta brand have beenstable, but specialities like the high quality Finesse range in Germany showedsatisfactory gains.
Nestlé Management Report 1999 | Product Group Development
http://www.nestle.com/investor_relations/mr1999/productgroup/04/index.htm (2 of 4) [4/27/2001 10:49:22 AM]

Innovative, high qualitycold cuts.
Acquisitions and divestituresNestlé acquired 80% of Totole, the leader in the rapidly growing chicken bouillonmarket in China. This acquisition is a further milestone in the development ofNestlé's culinary business in Asia.
Totole chicken powder:a new member ofNestlé's culinary family.
In 1999 negotiations with EQT Scandinavia B.V. concerning the sale of the Findusbrand and parts of Nestlé's frozen food business in Europe were successfullyconcluded. The transaction includes all of Nestlé's frozen food activities in GreatBritain and in Scandinavia, as well as parts of the business — mainly vegetablesand fish — in five other countries in Europe. The Findus brand worldwide, with theexception of Switzerland and Italy, has become the property of EQT ScandinaviaB. V.
Nestlé's objective is now to focus its European frozen food activities on theprepared dishes, snack and pizza segments. To this end we acquired the companyPreparados y Congelados Alimenticios S. A. in Spain. This company producesfrozen prepared dishes, pizzas, snacks and refrigerated products under the LaCocinera and Fricongel brands.
Dry dog food with patentedchicory prebiotic.
The pet care business has achieved good sales growth through geographicalexpansion as well as innovation and renovation in products, packaging andtechnology across all regions.
A strong performance in the United States reflects the success of dry dog food,with the launch of Alpo Complete formulated with chicory as a patented prebiotic.Progress was also made in premium wet cat food under the Fancy Feast brandthrough the renovation of multi-variety special packs and new sliced items.
In Latin America and the Caribbean, the pet food market continues to expandrapidly, with sales growing particularly in the area of dry dog food. We are now astrong number one in dog food in Venezuela with the Perrarina brand.
Progress continues in Japan with gains in dog food following the launch of Alpo drydog food with chicory, and in dry cat food with the Friskies Gourmet innovativesingle serve (55 g) pack. Oceania has seen positive volume growth in wet dogfood. In Australia, the Lucky Dog range has been reformulated with chicory andsales results have shown significant acceptance by consumers. In South Africa, wehave integrated the Epol and Olympic ranges acquired in 1998.
Friskies first single serve dry catfood, sold in Japan.
In Europe, in a very competitive environment, our first priority was the integrationof the Spillers business — acquired in 1998 — which explains why overall salesgrowth has been modest. All Spillers brands are now grouped under the Friskiescorporate brand. Good performances were achieved in the United Kingdom andItaly. In dry dog food, after the successful launch of Friskies Digestion+, similar
Nestlé Management Report 1999 | Product Group Development
http://www.nestle.com/investor_relations/mr1999/productgroup/04/index.htm (3 of 4) [4/27/2001 10:49:22 AM]

innovations have been introduced across other dog food brands. In cat food,innovative products were launched in the Gourmet wet food range, as well assingle serve portions in aluminium trays and pouches under the Felix and Friskiesbrands.
Eastern European sales under the Friskies and Darling brands continue to grow.The Darling dog and cat foods acquired last year are now available in 13 countriesin the region.
Darling mainstream dry andwet food for dogs and cats,sold in Eastern Europe.
Our pet treats business continues to expand with a strong contribution from newproducts such as the Felix snack range.
The terms in italics in the ProductGroup Development section of thisreport are registered trademarks ofthe Nestlé Group.
ProfitThe improving trend in profitability continued with a 14% increase in tradingprofit. Results in the culinary sector have benefited from the disposal of lowervalue added products. The trading profit margin for frozen foods has shown amoderate increase. In pet food, the strengthening of the Group's global positionshas led to a notable improvement in profitability.
Capital expenditureAfter declining in each of the six years to 1998, capital expenditure rose veryslightly in 1999 to Fr. 464 million. The principal projects included a capacityincrease for frozen food in the United States, where the prepared dishes categoryis enjoying dynamic growth.
Nestlé Management Report 1999 | Product Group Development
http://www.nestle.com/investor_relations/mr1999/productgroup/04/index.htm (4 of 4) [4/27/2001 10:49:22 AM]

Consumer behavior shows a trend towards increasing out-of-home consumption.Today's lifestyle is defined as being "on the go", with consumers shopping andconsuming anywhere and at any time, creating an enormous potential forcustomers responding to new consumption patterns. Nestlé FoodServices adds itsexpertise in the out-of-home business to Nestlé's famous and high quality brandssuch as Nescafé, Nestea, Nesquik, Maggi or Buitoni to enhance the competitiveadvantage of professional customers. Specific Nestlé FoodServices brands, forinstance Davigel, Minor's and Chef, are developed to meet the requirements ofsuch diverse segments as catering companies, fast-food chains, hotels,restaurants and airlines.Nestlé FoodServices is one of the pillars of growth for the Group's activities, andour success in adapting our products to the specific requirements of customers inthe foodservice industry is ever increasing.
Although the sales of Nestlé's foodservice activities are dividedamong the four major categories of food products mentioned onthe previous pages, it is essential to devote a separate section tothis important and fast-growing activity, as products offered byNestlé FoodServices are designed for a special group ofprofessional customers throughout the out-of-home industry.
Nesté FoodServices exploits specific opportunities of differentchannels, by offering the appropriate brand, product and system.
BeveragesThe successful result of the investments made in FoodServices' priority sector —Beverages — has been two-fold: a remarkable growth in sales and in the numberof vending machines and beverage systems placed on the market, and increasedloyalty to Nestlé's global beverage brand, Nescafé. Nescafé and the other famousbeverage brands — Milo, Nesquik and Nestea — have achieved greater exposurethrough the creative and unique development of points of sale for impulseconsumers: Nescafé trucks, tricycles, kiosks, motor bikes and the "Café Nescafé"are some examples of this new approach. Nestlé's major beverage brands havealso established a presence with key customers: co-branded vending machinesand coffee corners are increasingly found in impulse channels such as gas stationsand convenience stores and in fast food restaurants. The product portfolio ofcoffee-, tea-and cocoa-based beverages has been extended to a new range of coldconsumption products (slush-type), targeted at youth and expanding consumers'loyalty to the brands. These are particularly successful in Oceania, North andSouth America and the Far East.
FoodNew product developments include frozen pellets for sauces, new dessert moussesand sauce concentrates such as The World of Tastes range in the United Kingdom.
Nestlé Management Report 1999 | Product Group Development
http://www.nestle.com/investor_relations/mr1999/productgroup/05/index.htm (1 of 2) [4/27/2001 10:49:37 AM]

1999 also saw the introduction of a unique culinary product range which enhancesthe results of steam-cooking white meat. Marquage Vapeur, first launched inFrance, retains the moisture level of the meat, adding flavour and an appetizingcolour.
FIS
FIS (Food Ingredients Specialities) is a flavour house specialised in savoury flavours and flavouringingredients used in food industry.
The terms in italics in the ProductGroup Development section of thisreport are registered trademarks ofthe Nestlé Group.
FIS is a global organisation, developing, producing and marketing its products inover 60 countries. As a result of a clear and ongoing emphasis on quality, FIS hasbecome a partner of choice for major food manufacturers across the globe and isrecognised as one of the world 's leading companies in savoury flavours. Tofurther improve its service to clients, FIS is reinforcing its flavour development,production and marketing processes, putting into place regional competencecenters. FIS combines Nestlé know-how in food application and food productionwith its own fundamental understanding of flavours and flavouring systems toprovide flexible, cost-effective and competitive solutions to its business partnersworldwide. FIS customers are benefiting from its reinforced focus on flavours andfrom its speed in both product development and delivery.
Nestlé Management Report 1999 | Product Group Development
http://www.nestle.com/investor_relations/mr1999/productgroup/05/index.htm (2 of 2) [4/27/2001 10:49:37 AM]
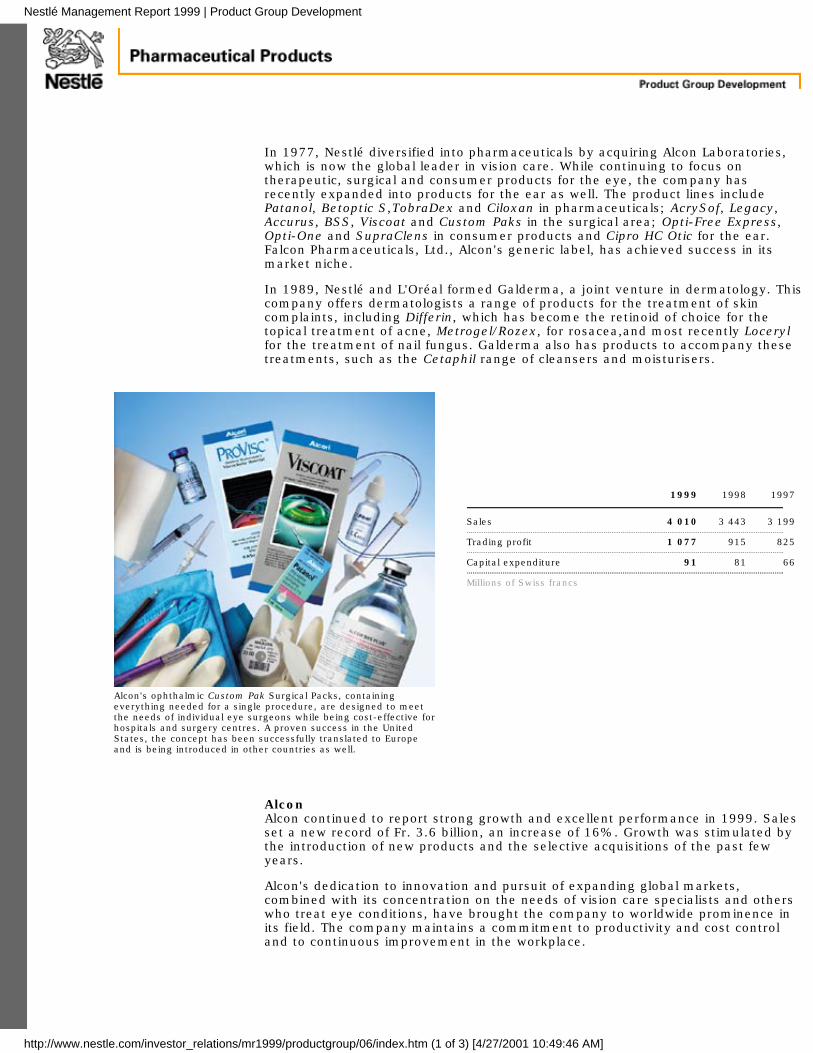
In 1977, Nestlé diversified into pharmaceuticals by acquiring Alcon Laboratories,which is now the global leader in vision care. While continuing to focus ontherapeutic, surgical and consumer products for the eye, the company hasrecently expanded into products for the ear as well. The product lines includePatanol, Betoptic S,TobraDex and Ciloxan in pharmaceuticals; AcrySof, Legacy,Accurus, BSS, Viscoat and Custom Paks in the surgical area; Opti-Free Express,Opti-One and SupraClens in consumer products and Cipro HC Otic for the ear.Falcon Pharmaceuticals, Ltd., Alcon's generic label, has achieved success in itsmarket niche.
In 1989, Nestlé and L'Oréal formed Galderma, a joint venture in dermatology. Thiscompany offers dermatologists a range of products for the treatment of skincomplaints, including Differin, which has become the retinoid of choice for thetopical treatment of acne, Metrogel/Rozex, for rosacea,and most recently Locerylfor the treatment of nail fungus. Galderma also has products to accompany thesetreatments, such as the Cetaphil range of cleansers and moisturisers.
1999 1998 1997
Sales 4 010 3 443 3 199
Trading profit 1 077 915 825
Capital expenditure 91 81 66
Millions of Swiss francs
Alcon's ophthalmic Custom Pak Surgical Packs, containingeverything needed for a single procedure, are designed to meetthe needs of individual eye surgeons while being cost-effective forhospitals and surgery centres. A proven success in the UnitedStates, the concept has been successfully translated to Europeand is being introduced in other countries as well.
AlconAlcon continued to report strong growth and excellent performance in 1999. Salesset a new record of Fr. 3.6 billion, an increase of 16%. Growth was stimulated bythe introduction of new products and the selective acquisitions of the past fewyears.
Alcon's dedication to innovation and pursuit of expanding global markets,combined with its concentration on the needs of vision care specialists and otherswho treat eye conditions, have brought the company to worldwide prominence inits field. The company maintains a commitment to productivity and cost controland to continuous improvement in the workplace.
Nestlé Management Report 1999 | Product Group Development
http://www.nestle.com/investor_relations/mr1999/productgroup/06/index.htm (1 of 3) [4/27/2001 10:49:46 AM]

Opti-Free Expressmulti-purpose disinfectingsolution.
The highlights of 1999 included the vigorous growth of Patanol which, thanks to itstherapeutic efficacy and to creative promotion, expanded the U.S. ocular allergymarket by more than 30% for the second consecutive year. Global launchescontinued of Opti-Free Express multi-purpose disinfecting solution for contactlenses, which is effective against the difficult acanthamoeba fungus. At the sametime, Opti-Free multi-purpose solution became the number one brand in the coldlens care solution segment in Japan. The AcrySof intraocular lens, the first foldableacrylic IOL with unique biocompatibility and excellent visual results, has againmade spectacular progress on the world market.
The unique dual-actionformula in Patanolophthalmic solution relieveseye allergies.
Cipro HC Otic, Alcon's first entry intothe underserved otic market, sawstrong U.S. sales in its first year.
1999 was also marked by the introduction in the United States of Cipro HC Otic, acombination anti-infective/anti-inflammatory product for ear infections. Whilemaintaining and strengthening its strong position in ophthalmology, Alcon made astrategic decision to enter the otic market. The ear, like the eye, is subject toinflammations and infections; these complaints are treated with forms ofmedication very similar to those used in eye care, which are prescribed byspecialists, pediatricians and general practitioners who are already the targetgroup for similar ophthalmic products.
With continued close attention to the research and development of new products,selective acquisition of new technologies, intensified training, motivation anddevelopment of personnel, and the strength that comes from a global presenceand scientific offices in many countries, Alcon is well positioned for future growth.
Loceryl nail lacquer, the leadinganti-fungal for the treatment ofmycoses of the nail.
GaldermaGalderma, the joint subsidiary of Nestlé and L'Oréal in the field of dermatology,ended the year with sales growth of 30% to Fr. 635 million.
Loceryl lacquer, acquired at the beginning of the year, is an antifungal drugspecifically developed for the treatment of nail mycoses. Significantlystrengthening Galderma's presence in one of the largest dermatology segments, itwas relaunched in most markets around the world and has received an excellentfeedback from dermatologists.
Differin, Galderma's best-selling product, indicated for the topical treatment ofacne, continued to enjoy a strong performance. Growth continued in the UnitedStates, and a cream formulation was launched in new markets (United Kingdom,Argentina, Brazil, Chile, Colombia, and Australia).
Differin Gel, the preferred topical retinoid for acne treatment,on the Chinese market since the beginning of 1999.
The Metrogel/Rozex products, indicated for the treatment of rosacea, and theCetaphil range of very mild cleansers and moisturisers continued to progress well.Mistamine, a new antihistamine tablet for the treatment of urticaria, licenced fromSanofi-Synthélabo, was launched in several markets.
Galderma extended its geographic coverage in Asia by establishing a newoperation in India, and reinforced its presence in Scandinavia following theacquisition of the dermatological product range of Nycomed-Amersham.
Registration of Silkis, a new topical vitamin D ointment for the treatment ofpsoriasis, was obtained in several European countries, paving the way for theentry of Galderma into the market of this important dermatological condition.
Nestlé Management Report 1999 | Product Group Development
http://www.nestle.com/investor_relations/mr1999/productgroup/06/index.htm (2 of 3) [4/27/2001 10:49:46 AM]

The terms in italics in the ProductGroup Development section of thisreport are registered trademarks ofthe Nestlé Group.
ProfitTrading profit rose by 18% and there was once again a significant improvement intrading margin. The improvement reflected strong volume growth at both Alconand Galderma, accompanied by a favourable evolution of the cost structure.
Capital expenditureCapital expenditure rose from Fr. 81 million in 1998 to Fr. 91 million. Alconexpanded production facilities in Europe and the United States and renovated itsBrazilian plant. Galderma opened a new factory in Montreal (Canada) to supplythe North American markets.
Nestlé Management Report 1999 | Product Group Development
http://www.nestle.com/investor_relations/mr1999/productgroup/06/index.htm (3 of 3) [4/27/2001 10:49:46 AM]

In these companies, Nestlé holds an interest of at least 20% but does not exercisemanagement control. These companies are included in the financial statements bythe equity method. Their net results appear, in proportion to Nestlé's participation,in the Group's consolidated income statement under "Share of results ofassociated companies". The Group's share of their net assets is shown in theconsolidated balance sheet under "Financial assets".
The most important associated company is L'Oréal, the world leader in thecosmetics market. Nestlé's involvement with L'Oréal started in 1974.
1999 1998 1997
Nestlé's share in the salesof associated companies 4 831 5 156 5 248
Nestlé's share in the resultsof associated companies 339 300 256
Millions of Swiss francs
L'Oréal markets over 500 brands and more than 2000 products inall sectors of the beauty business: hair colour, permanents,styling aids, body and skincare, cleansers and fragrances. Itsproducts are found in all distribution channels.
L'OréalL'Oréal is controlled by the Gesparal holding company, of which Nestlé owns 49%and the Bettencourt family 51%. The world's leading cosmetics company hascontinued its rapid development. L'Oreal's annual report and its website(www.loreal-finance.com) provide detailed information about its activities andresults. Consolidated sales rose by 12% in pro forma terms in 1999, to 70.5 billionFrench francs.
The group's progress in Western Europe and in North America led to a rapidprogression in comparable terms of consolidated turnover and of profit beforetaxes, for the 15th year running. In 1999, L'Oréal continued its policy of investingin numerous developing countries despite the difficulties some of these countriesare facing at present. These countries should be a basis for medium term growth.
In December 1998, L'Oréal announced the alliance of its pharmaceutical subsidiarySynthélabo with Sanofi, subsidiary of Elf Aquitaine. Synthélabo merged withSanofi in May 1999. The pro forma results mentioned above take account of theconsolidation by the equity method of Synthélabo only for the periodJanuary—June 1999, and of the new group Sanofi-Synthélabo as from 1st July1999. The merger gave birth to the sixth-largest European pharmaceutical groupwith very significant worldwide growth potential stemming from thecomplementary nature of the companies' respective research capabilities. Theshareholders' pact between Elf Aquitaine and L'Oréal assures the joint control ofSanofi-Synthélabo for at least another five years. L'Oréal's participation inSanofi-Synthélabo is a strategic investment for the group.
Nestlé Management Report 1999 | Product Group Development
http://www.nestle.com/investor_relations/mr1999/productgroup/07/index.htm (1 of 2) [4/27/2001 10:50:08 AM]

Aromatonic: acomplete rangeto enhance,tone andfreshen.
Natéa: nutricolour masque with nourishingfruit concentrate.
Elsève Color-Vive: a line of capillarytreatments for coloured hair.
Nestlé Management Report 1999 | Product Group Development
http://www.nestle.com/investor_relations/mr1999/productgroup/07/index.htm (2 of 2) [4/27/2001 10:50:08 AM]

Nestlé Management Report 1999 | General Information
http://www.nestle.com/investor_relations/mr1999/generalinfo/index.htm [4/27/2001 10:50:29 AM]

Number of factories
1999 1998
Europe 220 233
Americas 153 157
Africa, Asia and Oceania 136 132
Total 509 522
The figure in bold after the countrydenotes the number of factories.
Beverages
Milk products, nutrition and icecream.
Prepared dishes and cookingaids
Chocolate and Confectionery
Pharmaceuticals
Local production (mayrepresent production in severalfactories)
Local production and imports
Imports (may, in a fewparticular cases, representpurchases from third parties inthe market concerned)
Position in 1999 in markets manufacturing and selling products under Nestléprocesses and trademarks.
Europe
Austria 1 Belgium 3Bulgaria 1 Czech Republic 5Denmark 2 France 39Finland 3 Germany 29Greece 5 Hungary 2Italy 28 Netherlands 8Norway 4 Poland 5Portugal 6 Republic of Ireland 3Romania 1 Russia 6Slovakia 1 Spain 23Sweden 6 Switzerland 9Turkey 3 Ukraine 1United Kingdom 26
AmericasArgentina 6 Brazil 23Canada 11 Chile 7Colombia 3 Costa Rica 2Cuba 2 Dominican Republic 3Ecuador 4 El Salvador 1Guatemala 1 Jamaica 2Mexico 16 Nicaragua 1Panama 3 Peru 2Puerto Rico 1 Trinidad and Tobago 1United States 59 Uruguay 1Venezuela 4
AfricaCameroon 1 Egypt 4Ghana 1 Guinea 1Ivory Coast 2 Kenya 1Morocco 1 Nigeria 1Senegal 1 South Africa 14Tunisia 1 Zimbabwe 1
AsiaBangladesh 1 Cambodia 1People's Republic of China 18 India 7Indonesia 5 Israel 12Japan 4 Jordan 1Republic of Korea 1 Lebanon 1Malaysia 7 Pakistan 2Phillippines 8 Saudi Arabia 1Singapore 1 Sri Lanka 2Syria 1 Taiwan 1
Nestlé Management Report 1999 | General Information
http://www.nestle.com/investor_relations/mr1999/generalinfo/01/index.htm (1 of 2) [4/27/2001 10:50:34 AM]
Thailand 8 United Arab Emirates 1Vietnam 3
OceaniaAustralia 13 New Zealand 4Pacific Islands 4
Nestlé Management Report 1999 | General Information
http://www.nestle.com/investor_relations/mr1999/generalinfo/01/index.htm (2 of 2) [4/27/2001 10:50:34 AM]

Henri NestléFounder of the Henri Nestlé company.
Nestlé can trace its origins back to 1866, when the first European condensed milkfactory was built in Cham, Switzerland, by the Anglo-Swiss Condensed MilkCompany, which merged in 1905 with S.A. Henri Nestlé, Vevey. The very highchild mortality rate in the 19th century was particularly due to the fact that therewas no substitute product to meet the nutritional needs of nursing infants. In orderto improve this state of affairs, Henri Nestlé had devoted several years to thedevelopment of his Milk Food which was based on the scientific insights of the timeas well as on his own findings. He had also developed a specific productionprocess, thus ensuring constant product composition and quality. In 1867 hemarketed his Milk Food and created the symbol of the "Nest" (in German, Nestlémeans "little nest") which has remained the focal element of the Company'sidentity.
Although milk and infant nutrition go back to the firm's origin, many other foodproducts came to widen its range over the years: chocolate, instant drinks (theNescafé process was developed in 1938), culinary, refrigerated and frozenproducts, ice cream, mineral water and petfoods.
Today, Nestlé is the world's largest food firm. Its products which are made in 509factories distributed over 83 countries, are being sold all over the world.
Right from its beginnings, the Nestlé group has devoted itself not only to food ingeneral, but has also implemented solutions to the nutritional problems beingfaced by mankind. These problems may be specific to certain age groups (babies,elderly people), to given situations (hospitalized patients) or to social data (longerlife expectation, obesity). For a long time, Nestlé has built up know-how andknowledge which — together with its potential and its research and developmentactivities — have given the Group an excellent position in all fields of nutrition.
1867Henri Nestlé's Milk Food
1905
Anglo-Swiss Condensed Milk Co.(Merger with Nestlé)
1929Peter, Cailler, Kohler Chocolats
Suisses S.A.(Merger with Nestlé)
1938Development Nescafé
1947
Nestlé Alimentana Company (Sté An) (Newname after
the merger with Maggi) 1947Alimentana Company
1960Crosse & Blackwell
1962Findus
1969Vittel
Nestlé Management Report 1999 | General Information
http://www.nestle.com/investor_relations/mr1999/generalinfo/02/index.htm (1 of 2) [4/27/2001 10:51:21 AM]

1970Libby's
1971Ursina-Franck
1973Stouffer's
1974L'Oréal (minority interest)
1977Nestlé S.A.
1977Alcon
1978Chambourcy
1985Carnation
1985Friskies
1986Herta
1988Buitoni Perugina
1988Rowntree
1992Perrier
1993Finitalgel
1994Alpo
1998Pellegrino
1998Spillers Petfoods
Nestlé Management Report 1999 | General Information
http://www.nestle.com/investor_relations/mr1999/generalinfo/02/index.htm (2 of 2) [4/27/2001 10:51:21 AM]

14th April 2000 Announcement of first quarter 2000 sales figures25th May 2000 133rd Ordinary General Meeting, "Palais de Beaulieu",
Lausanne31st May 2000 Payment of the dividend23rd August 2000 Publication of the half-yearly report January/June
200020th October 2000 Announcement of first nine months 2000 sales
figures;
Autumn meeting with the press (Vevey)23rd February 2001 Announcement of 2000 sales figures and results14th March 2001 Press conference (Zurich) 5th April 2001 134th Ordinary General Meeting, "Palais de Beaulieu",
Lausanne
Stock exchange listings of registered shares of Nestlé S.A.
Switzerland: Swiss ExchangeAbroad: Amsterdam, Brussels, Frankfurt, London, Paris, Tokyo,
Vienna
Registered Offices: Nestlé S.A. Nestlé S.A.(Share Transfer Office)
Avenue Nestlé 55 Zugerstrasse 8
CH-1800 Vevey(Switzerland)
CH-6330 Cham(Switzerland)
Telephone(021) 924 21 11
Telephone(041) 785 20 20
For any additional information about the managementreport, please contact:
Nestlé S.A., Investor RelationsAvenue Nestlé 55CH-1800 Vevey (Switzerland)Telephone (021) 924 27 42Telefax (021) 924 28 13E–mail [email protected]
As to information concerning the share register(registrations, transfers, address changes, dividends,etc.), please contact:
Nestlé S.A., Share Transfer OfficeZugerstrasse 8CH-6330 Cham (Switzerland)Telephone (041) 785 20 20Telefax (041) 785 20 24
Nestlé URL: http://www.nestle.com
Nestlé Management Report 1999 | General Information
http://www.nestle.com/investor_relations/mr1999/generalinfo/03/index.htm (1 of 2) [4/27/2001 10:51:29 AM]

Nestlé Management Report 1999 | General Information
http://www.nestle.com/investor_relations/mr1999/generalinfo/03/index.htm (2 of 2) [4/27/2001 10:51:29 AM]

Nestlé Management Report 1999 | Group Accounts
http://www.nestle.com/investor_relations/mr1999/consolaccts/index.htm [4/27/2001 10:51:43 AM]

In millions of Swiss francs Notes 1999 1998
Sales to customers 1 74 660) 71 747)
Cost of goods sold (35 912) (35 963)
Distribution expenses (5 268) (4 887)
Marketing and administration expenses (23 887) (22 484)
Research and development costs (893) (807)
Restructuring costs (402) (224)
Amortisation of goodwill (384) (301)
Trading profit 1 7 914) 7 081)
Net financing costs 2 (998) (1 237)
Net non-trading items 3 (57) 189)
Profit before taxation 4 6 859) 6 033)
Taxation 5 (2 314) (2 000)
Net profit of consolidated companies 4 545) 4 033)
Share of profit attributable to minority interests (160) (128)
Share of results of associated companies 6 339) 300)
Net profit for the year 4 724) 4 205)
As percentages of sales
Trading profit 10.6% 9.9%
Net profit for the year 6.3% 5.9%
Earnings per share(in Swiss francs)
Basic earnings per share 7 122.1 107.0
Fully diluted earnings per share 7 120.7 106.0
Nestlé Management Report 1999 | Consolidated Accounts of the Nestlé Group
http://www.nestle.com/investor_relations/mr1999/consolaccts/01/index.htm [4/27/2001 10:51:46 AM]

In millions of Swiss francs Notes 1999 1998
Assets
Current assets
Liquid assets 8
- Cash and cash equivalents 3 322) 4 984)
- Other liquid assets 3 348) 2 979)
6 670 7 963
Trade and other receivables 9 12 443 10 991
Inventories 10 7 383 6 948
Prepayments and accrued income 673 565
Total current assets 27 169 26 467
Fixed assets
Tangible fixed assets 11
- Gross value 44 014) 40 321)
- Accumulated depreciation (24 796) (21 895)
19 218 18 426
Financial assets
– Investments in associated companies 12 1 828) 1 525)
- Deferred tax assets 20 2 293) 2 233)
- Other financial assets 13 2 431) 1 978)
6 552 5 736
Intangible assets 14 6 000 6 074
Total fixed assets 31 770 30 236
Total assets 58 939 56 703
Liabilities and equity
Current liabilities
Trade and other payables 15 9 635 8 487
Financial liabilities 16 7 967 10 545
Tax payable 985 826
Accrued liabilities and deferred income 3 595 2 709
Total current liabilities 22 182 22 567
Medium and long term liabilities Financial liabilities 17 4 905 4 047
Employee benefit liabilities 18 2 822 2 624
Deferred tax liabilities 20 1 327 1 395
Nestlé Management Report 1999 | Consolidated Accounts of the Nestlé Group
http://www.nestle.com/investor_relations/mr1999/consolaccts/02/index.htm (1 of 2) [4/27/2001 10:51:50 AM]

Tax payable 72 97
Other payables 264 179
Provisions 21 2 289 2 415
Total medium and long term liabilities 11 679 10 757
Total liabilities 33 861 33 324
Minority interests 625 564
Equity Share capital 22 404 404
Share premium and reserves
- Share premium 5 926) 5 926)
- Reserve for treasury share 2 873) 562)
- Translation reserve 839) 226)
- Retained earnings 17 439) 16 285)
27 077 22 999
27 481 23 403
Less:
Treasury shares 23 3 028 588
Total equity before appropriations 24 453 22 815
Total liabilities and equity 58 939 56 703
Nestlé Management Report 1999 | Consolidated Accounts of the Nestlé Group
http://www.nestle.com/investor_relations/mr1999/consolaccts/02/index.htm (2 of 2) [4/27/2001 10:51:50 AM]

In millions of Swiss francs Notes 1999 1998
Operating activities
Net profit of consolidated companies 4 545) 4 033)
Depreciation oftangible fixed assets 11 2 597) 2 609)
Impairment oftangible fixed assets 11 373) 127)
Amortisation of goodwill 14 384) 301)
Depreciation of otherintangible assets 14 92 ) — )
Impairment of goodwill 14 212) — )
Increase/(decrease) inprovisions and deferred taxes 101) (43)
Decrease/(increase) inworking capital 24 235) (506)
Other movements (352) (149)
Operating cash flow(a) 8 187) 6 372)
Investing activities
Expenditure ontangible fixed assets 11 (2 806) (3 061)
Expenditure onother intangible assets 14 (139) (72)
Sale of tangible fixed assets 363) 487)
Acquisitions 25 (440) (4 031)
Disposals 26 253) 236)
Income fromassociated companies 86) 75)
Other movements (76) 189)
Cash flow from investing activities (2 759) (6 177)
Financing activities
Dividend for the previous year (1 469) (1 376)
Purchase of treasury shares (net) (2 311) (280)
Movements with minority interests (190) (167)
Bonds issued 328) 1 009)
Bonds repaid (400) (1 238)
Increase/(decrease) in other medium/long term financialliabilities 500) 230)
Increase/(decrease) inshort term financial liabilities (3 488) 1 659)
Nestlé Management Report 1999 | Consolidated Accounts of the Nestlé Group
http://www.nestle.com/investor_relations/mr1999/consolaccts/03/index.htm (1 of 2) [4/27/2001 10:51:55 AM]

(a) Taxes paid amount to Fr. 2304million (1998: Fr. 1932 million).Interest received/paid does notdiffer materially from interestshown under note 2 "Net financingcosts"
Decrease/(increase) inmarketable securities and other (355) 1258)
Decrease/(increase) inshort term investments 12) 418)
Cash flow from financing activities (7 373) 1 513
Translation differences on flows 49) (49)
Increase/(decrease) in cash andcash equivalents (1 896) 1 659)
Cash and cashequivalents at beginning of year 4 984) 3 412)
Effects of exchangerate changes on opening balance 234) (87)
Cash and cash equivalents retranslated at beginning ofyear 5 218) 3 325)
Cash and cashequivalents at end of year 8 3 322 ) 4 984)
Nestlé Management Report 1999 | Consolidated Accounts of the Nestlé Group
http://www.nestle.com/investor_relations/mr1999/consolaccts/03/index.htm (2 of 2) [4/27/2001 10:51:55 AM]

In millions of Swiss francsShare
premiumReserve
for treasury sharesTranslation
reserveRetainedearnings Total reserves
Sharecapital
Less:Treasury shares Total equity
Equity as at 31st December 1997 5 926) 282) 417) 13 859) 20 484) 404) (282) 20 606)
Adjustment for the introductionof IAS 19 (revised 1998)Employee benefits (192)) (192) (192)
Equity restated as at 31st December 1997 5 926) 282) 417) 13 667) 20 292) 404) (282) 20 414)
Currency retranslation (191) (191) (191)
Net profit 4 205) 4 205) 4 205)
Movement of treasury shares (net) 280) (280) —) (280) (280)
Result on options and treasuryshares held for trading purposes 69) 69) (26) 43)
Dividend for the previous year (1 376) (1 376) (1 376)
Equity as at 31st December 1998 5 926) 562 ) 226) 16 285) 22 999) 404) (588) 22 815)
Currency retranslation 613) 613) 613)
Net profit 4 724) 4 724) 4 724)
Movement of treasury shares (net) 2 311 ) (2 311) —) (2 311) (2 311)
Result on options and treasuryshares held for trading purposes 139) 139) (129) 10)
Dividend for the previous year (1 469) (1 469) (1 469)
Recovery of intangible assets ondisposals charged on equityprior to 1st January 1995 71) 71) 71)
Equity as at 31st December 1999 5 926) 2 873) 839) 17 439) 27 077) 404) (3 028) 24 453)
Nestlé Management Report 1999 | Consolidated Accounts of the Nestlé Group
http://www.nestle.com/investor_relations/mr1999/consolaccts/04/index.htm [4/27/2001 10:52:00 AM]

Accounting policies
Accounting convention and accounting standardsThe Consolidated accounts comply with International Accounting Standards (IAS)issued by the International Accounting Standards Committee (IASC) and with theStanding Interpretations issued by the Standing Interpretation Committee of theIASC (SIC).
The accounts have been prepared under the historical cost convention and on anaccrual basis. All significant consolidated companies have a 31st Decemberaccounting year end. All disclosures required by the 4th and 7th European Unioncompany law directives are provided.
Scope of consolidationThe Consolidated accounts comprise those of Nestlé S. A. and of its affiliatedcompanies, including joint ventures, and associated companies (the Group). Thelist of the principal companies is given in section "Companies of the Nestlé Group".
Consolidated companiesCompanies in which the Group has a participation, usually a majority, and where itis responsible for the management, are fully consolidated. This applies irrespectiveof the percentage of the participation in the share capital. Minority interests inequity, as well as in the net results, are shown separately in the Consolidatedaccounts.
Proportional consolidation is applied for companies owned, controlled andmanaged jointly with partners. The individual assets, liabilities, income andexpenditure are consolidated in proportion to the Nestlé participation in the equity(usually 50%).
Newly acquired companies are consolidated from the effective date of acquisition,using the purchase method.
Associated companiesCompanies where the Group has a participation of 20% or more and a significantinfluence but does not exercise management control are accounted for by theequity method. The net assets and results are recognised on the basis of theassociates' own accounting policies, which may differ from those of the Group.
Foreign currenciesIn individual companies, transactions in foreign currencies are recorded at the rateof exchange at the date of the transaction or, if hedged forward, at the rate ofexchange under the related hedge instrument. Assets and liabilities in foreigncurrencies are translated at year end rates. Any resulting exchange differences aretaken to the income statement.
On consolidation, assets and liabilities of Group companies denominated in foreigncurrencies are translated into Swiss francs at year end rates. Income and expenseitems are translated into Swiss francs at the annual average rates of exchange or,where known or determinable, at the rate on the date of the transaction forsignificant items.
Differences arising from the retranslation of opening net assets of Groupcompanies, together with differences arising from the restatement of the netresults for the year of Group companies from average or actual rates to year endrates, are taken to reserves.
The balance sheet and net results of Group companies operating inhyperinflationary economies are restated for the changes in the generalpurchasing power of the local currency, using official indices at the balance sheetdate, before translation into Swiss francs at year end rates.
Nestlé Management Report 1999 | Consolidated Accounts of the Nestlé Group
http://www.nestle.com/investor_relations/mr1999/consolaccts/06/index.htm (1 of 2) [4/27/2001 10:52:04 AM]

HedgingDerivative financial instruments are used to manage operational exposures toforeign exchange, interest rate and commodity price risks. They are entered intowith high credit quality financial institutions, consistent with specific approval, limitand monitoring procedures. The instruments used to hedge foreign currency flowsand positions mainly include forward foreign exchange contracts, options, currencyfutures and currency swaps. Foreign exchange gains and losses on hedginginstruments are matched with foreign exchange gains and losses on theunderlying asset or liability. When an anticipated future transaction has beenhedged and the underlying position has not been recognised in the financialstatements any change in the fair value of the hedging instrument is notrecognised in the income statement for the period.
Where derivatives are held for the long-term and are used to manage interest raterisks, they are accounted for on the cost basis (where the underlying asset orliability is accounted for on the cost basis) and payments and receipts relating tothe instruments are recognised under net financing costs as they accrue. In othercases the instruments are carried at fair value and changes in the market valueare taken to income.
Commodity instruments are used to ensure the Group's access to raw materials atan appropriate price. Outright purchase transactions are recorded at thecontracted rates. Changes in the fair value of open commodity instruments are notrecognised until the actual purchase transactions are recognised in the financialstatements.
Segmental informationSegmental information is based on two segment formats: the primary formatreflects the Group's management structure, whereas the secondary format isproduct oriented.
The primary segment format — by management responsibilities and geographicarea — represents the Group's management structure. The principal activity of theGroup is the food business, which is managed through three geographic zones.The other activities, mainly pharmaceutical products and water, are managed on aworldwide basis. The secondary segment format representing products is dividedinto five categories (segments).
Segment results represent the contribution of the different segments to centraloverheads, research and development costs and the profit of the Group.Unallocated items comprise mainly corporate expenses, research and developmentcosts, amortisation of intangible assets and, for the product segments,restructuring and other costs. Specific corporate and research and developmentexpenses are allocated to the corresponding segments.
Segment assets comprise tangible fixed assets, trade and other debtors,inventories and prepayments and accrued income. Unallocated items representmainly corporate and research and development assets, including intangibleassets. Liabilities comprise trade and other creditors, accrued liabilities anddeferred income. Eliminations represent inter-company balances between thedifferent segments.
Segment assets and liabilities by management responsibilities and geographicarea represent the situation at the end of the year. Assets by product grouprepresent the annual average as this provides a better indication of the level ofinvested capital.
Nestlé Management Report 1999 | Consolidated Accounts of the Nestlé Group
http://www.nestle.com/investor_relations/mr1999/consolaccts/06/index.htm (2 of 2) [4/27/2001 10:52:04 AM]

Valuation methods and definitions
Sales to customersSales to customers represent the sales of products and services rendered to thirdparties, net of sales rebates and sales taxes.
Research and development costsResearch and development costs are charged to the income statement in the year inwhich they are incurred.
Net financing costsThis item includes the interest expense on borrowings from third parties as well asthe interest income earned on funds invested outside the Group. Exchangedifferences and the results of foreign exchange and interest hedge operations linkedto external loans, intra-Group short term loans and deposits in foreign currencies arealso included under this heading.
For hyper-inflationary economies, only the real net financing costs appear under thisheading. The inflationary portion relating to the financing of the net working capital,which represents a trading expense, is included under “Marketing and administrationexpenses”. The balance of the inflationary portion, relating to the financing of fixedassets, is treated as an exchange difference and shown under “Net non-tradingitems” since it is offset by a devaluation in the exchange rate of the domesticcurrency.
TaxationThis includes current taxes on profit and other taxes such as taxes on capital. Alsoincluded are actual or potential withholding taxes on current and expected transfersof income from Group companies and tax adjustments relating to prior years.
Deferred taxation is the tax attributable to the temporary differences that appearwhen taxation authorities recognise and measure assets and liabilities with rules thatdiffer from those of the Consolidated accounts.
Deferred taxes are calculated under the liability method at the rates of tax expectedto prevail when the temporary differences reverse. Any changes of the tax rates arerecognised to the income statement. Deferred tax liabilities are recognised on alltaxable temporary differences excluding non deductible goodwill. Deferred tax assetsare recognised on all deductible temporary differences provided that it is probablethat future taxable income will be available.
Liquid assetsLiquid assets include cash at banks and in hand, cash equivalents, marketablesecurities and other liquid funds and short term investments. Cash equivalentsconsist of bank deposits and fixed term investments whose maturities are threemonths or less from the date of acquisition. Short term investments consist of bankdeposits and fixed term investments whose maturities are higher than three monthsfrom the date of acquisition.
Marketable securities, which are held to maturity, are valued at the lower of cost ormarket value, while those held for trading purposes are carried at market value. Anyresulting gains or losses are recognised in the income statement.
InventoriesRaw materials and purchased finished goods are valued at purchase cost. Work inprogress and manufactured finished goods are valued at production cost. Productioncost includes direct production costs and an appropriate proportion of productionoverheads and factory depreciation.
Movements in the most important raw materials inventories and purchased finishedgoods are accounted for using the FIFO (first in, first out) method. The weightedaverage cost method is used for other inventories.
A provision is established when the net realisable value of any inventory item is lower
Nestlé Management Report 1999 | Consolidated Accounts of the Nestlé Group
http://www.nestle.com/investor_relations/mr1999/consolaccts/07/index.htm (1 of 4) [4/27/2001 10:52:08 AM]
than the values calculated above.
Prepayments and accrued incomePrepayments and accrued income comprise payments made in advance relating tothe following year, and income relating to the current year which will not be receiveduntil after the balance sheet date.
Accrued liabilities and deferred incomeAccrued liabilities and deferred income comprise expenses relating to the currentyear which will not be paid until after the balance sheet date and income received inadvance, relating to the following year.
Tangible fixed assetsTangible fixed assets are shown in the balance sheet at their historical costs.Depreciation is provided on the straight line method so as to amortise the initial costover the estimated useful lives, which are as follows:
Buildings 25-50 years
Machinery and equipment 10-15 years
Tools, furniture, information technologyand sundry equipment 3-8 years
Vehicles 5 years
Financing costs incurred during the course of construction are expensed. Land is notdepreciated. Premiums capitalised for leasehold land or buildings are amortised overthe length of the lease.
Depreciation of tangible fixed assets is allocated to the appropriate headings ofexpenses by function in the income statement.
The carrying amounts of tangible assets are reviewed periodically to assess whetherthey are recoverable in the form of future economic benefits. If the recoverableamount of an asset has declined below its carrying amount, an impairment loss isrecognised to reduce the value of the asset to its recoverable amount.
Leased assetsAssets acquired under long term finance leases are capitalised and depreciated inaccordance with the Group's policy on tangible fixed assets. The associatedobligations are included in financial liabilities.
Rentals payable under operating leases are charged to the income statement asincurred. Other financial assets Long term receivables are discounted to their netpresent value at the date of inception.
Other financial assetsLong term receivables are discounted to their net present value at the date ofinception.
Other financial assets also include excess of assets of funded defined benefit plans.
Other investments primarily comprise unquoted participations of minor importance invarious companies where the Nestlé Group does not exercise management control aswell as some securities.
Other financial assets are carried at cost or valuation less any provisions forimpairment in value.
Intangible assetsAs from 1st January 1995, the excess of the cost of an acquisition over the fair valueof the net tangible assets is capitalised. Previously these amounts had been writtenoff through reserves. This value comprises intangible assets acquired, in particulartrademarks and industrial property rights, as well as business goodwill. The differentcomponents are not separately identified and valued.
Gains on the disposal of intangible assets acquired prior to 1st January 1995 aretaken to reserves to the extent of amounts previously written off. Any excess is takento the income statement. The gain or loss on disposals of intangible assets acquiredafter that date is also taken to the income statement.
Intangible assets are amortised on a straight line basis over their anticipated usefullife but not exceeding 20 years. However, the Group considers that the useful life ofintangible assets will in many cases exceed this period.
Nestlé Management Report 1999 | Consolidated Accounts of the Nestlé Group
http://www.nestle.com/investor_relations/mr1999/consolaccts/07/index.htm (2 of 4) [4/27/2001 10:52:08 AM]

The unamortised balance is reviewed annually. Where the balance exceeds the valueof expected future benefits, the difference is charged to the income statement.Intangible assets are usually recorded in the currency of the acquiring entity.
This heading also includes separately purchased intangible assets such as software,intellectual property rights and rights to carry on an activity. They are amortised overtheir useful life, the depreciation being allocated to the relevant headings in theincome statement.
Current liabilitiesThese include current or renewable liabilities due within a maximum period of oneyear.
ProvisionsThis item includes provisions for restructuring and contingencies which may arise andwhich have been prudently provided.
Employee benefitsPost employment benefitsThe liabilities of the Group arising from defined benefit obligations, and the relatedcurrent service cost, are determined using the projected unit credit method.Valuations are carried out annually for the largest plans and on a regular basis forother plans. Actuarial advice is provided both by external consultants and byactuaries employed by the Group. The actuarial assumptions used to calculate thebenefit obligations vary according to the economic conditions of the country in whichthe plan is located.
Such plans are either externally funded, with the assets of the schemes heldseparately from those of the Group in independently administered funds, or unfundedwith the related liabilities carried in the balance sheet.
For the funded defined benefit plans, the deficit or excess of the fair value of planassets over the present value of the defined benefit obligation is recognised as aliability or an asset in the balance sheet, taking into account any unrecognisedactuarial gains or losses and past service cost. However, an excess of assets isrecognised only to the extent that it represents a future economic benefit which isactually available to the Group, for example in the form of refunds from the plan orreductions in future contributions to the plan. When such an excess is not available ordoes not represent a future economic benefit, it is not recognised but is disclosed inthe notes.
Actuarial gains and losses arise mainly from changes in actuarial assumptions anddifferences between actuarial assumptions and what has actually occurred. They arerecognised in the income statement, over the remaining working lives of theemployees, only to the extent that their net cumulative amount exceeds 10% of thegreater of the present value of the obligation or of the fair value of plan assets.Unrecognised actuarial gains and losses are reflected in the balance sheet.
For defined benefit plans the actuarial cost charged to the income statement consistsof current service cost, interest cost, expected return on plan assets and past servicecost as well as actuarial gains or losses to the extent that they are recognised. Thepast service cost for the enhancement of pension benefits is accounted for when suchbenefits vest or become a constructive obligation.
Some benefits are also provided by defined contribution plans; contributions to suchplans are charged to the income statement as incurred.
Pensions and retirement benefitsThe majority of Group employees are eligible for retirement benefits under definedbenefit schemes based on pensionable remuneration and length of service, consistingmainly of final salary plans.
Post retirement health care and other employee benefitsGroup companies, principally in North America, maintain health care benefit planswhich cover eligible retired employees.
The obligations for other employee benefits consist mainly of end of serviceindemnities, which do not have the character of pensions.
Equity compensation plansMembers of the Group’s ManagementMembers of the Group’s Management are entitled to participate each year in a shareoption plan without payment. The benefits consist of the rights to buy Nestlé sharesat a predetermined fixed price.
Nestlé Management Report 1999 | Consolidated Accounts of the Nestlé Group
http://www.nestle.com/investor_relations/mr1999/consolaccts/07/index.htm (3 of 4) [4/27/2001 10:52:08 AM]

As from 1st January 1999, this plan has a rolling seven year duration and the rightsare vested after three years (previously five years and two years respectively).
In order to hedge the related exposure, the Group buys the number of sharesnecessary to satisfy all potential outstanding obligations under the plan when thebenefit is awarded and holds them until the maturity of the plan or the exercise ofthe rights. No additional shares are issued as a result of the equity compensationplan.
The Group is not exposed to any additional cost and there is no dilution of the rightsof the shareholders.
Board of DirectorsThe annual remuneration of the Members of the Board of Directors is partly paid inkind through the delivery to them of warrants purchased in the market. The warrantshave a duration of five years and vest after two years.
They are issued by a financial institution and are quoted on the Stock Exchange.
The Group is not exposed to any additional cost and there is no dilution of the rightsof the shareholders.
DividendsIn accordance with Swiss law and the Company's Articles of Association, dividendsare treated as an appropriation of profit in the year in which they are ratified at theAnnual General Meeting and subsequently paid, rather than as an appropriation ofthe profit in the year to which they relate.
Nestlé Management Report 1999 | Consolidated Accounts of the Nestlé Group
http://www.nestle.com/investor_relations/mr1999/consolaccts/07/index.htm (4 of 4) [4/27/2001 10:52:08 AM]

Changes in accounting policies and modification of the scope ofconsolidation
Changes in accounting policiesThe Group has implemented IAS 19 (revised 1998) Employee Benefits as from 1stJanuary 1999.
The Group has implemented SIC 16 on own equity instruments as from 1stJanuary 1999. Treasury shares are presented as a reduction of equity and allgains and losses on such shares are recognised in equity.
IAS 17 (revised 1997) on leases is first applicable in 1999. The Group alreadycomplies with the accounting requirements of this standard and consequentlythere is no change of accounting policy. The disclosure requirements of thestandard are new and have been implemented.
The 1998 comparative figures have been restated in the balance sheet, theincome statement and the cash flow statement.
The Group has enhanced the disclosures regarding foreign currency andcommodity instruments in order to disclose forwards, futures and swapsseparately from options.
Modification of the scope of consolidationThe scope of consolidation has been affected by the acquisitions and disposalsmade in 1999. The principal businesses are detailed below.
Fully consolidatedNewly included:La Cocinera, Spain, 100% (June)Svitoch, Ukraine, 89% (April)Totole, China, 80% (October)
Disposals:Malaysia Cocoa MFG, Malaysia (April)Laura Secord, Canada (June)Hills Bros., USA (December)
Nestlé Management Report 1999 | Consolidated Accounts of the Nestlé Group
http://www.nestle.com/investor_relations/mr1999/consolaccts/08/index.htm [4/27/2001 10:52:16 AM]
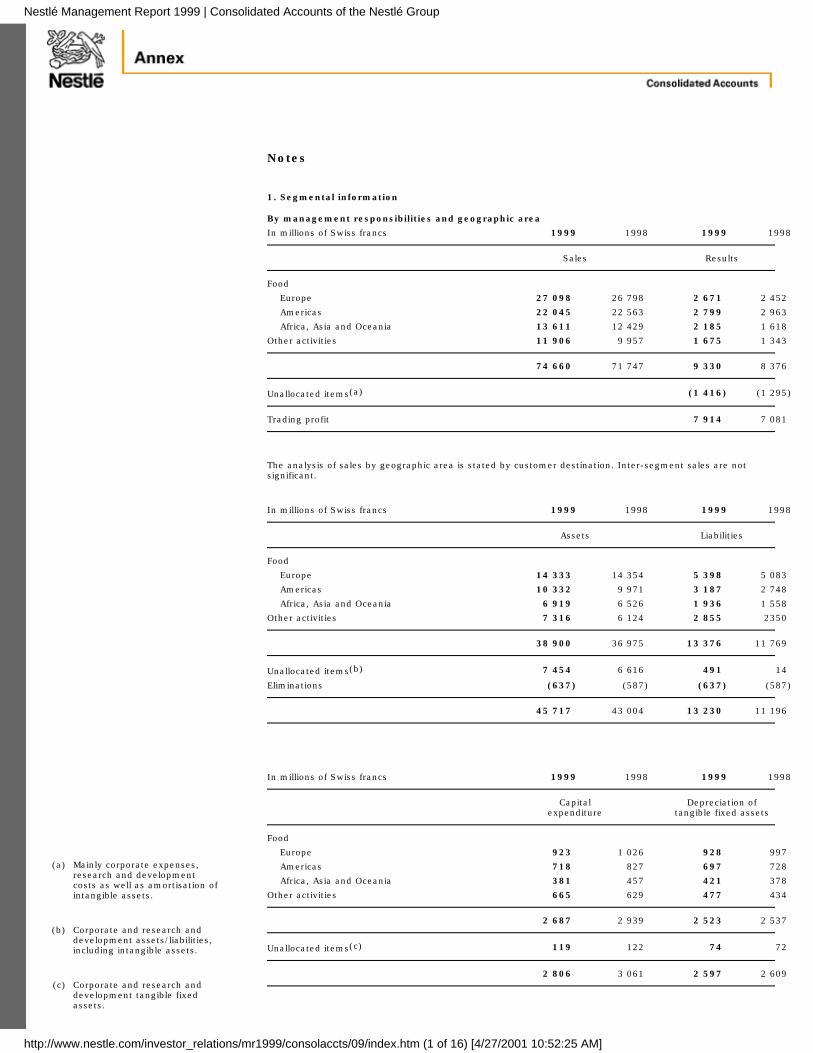
(a) Mainly corporate expenses,research and developmentcosts as well as amortisation ofintangible assets.
(b) Corporate and research and
development assets/liabilities,including intangible assets.
(c) Corporate and research and
development tangible fixedassets.
Notes
1. Segmental information
By management responsibilities and geographic area
In millions of Swiss francs 1999 1998 1999 1998
Sales Results
Food
Europe 27 098) 26 798) 2 671) 2 452)
Americas 22 045) 22 563) 2 799) 2 963)
Africa, Asia and Oceania 13 611) 12 429) 2 185) 1 618)
Other activities 11 906) 9 957) 1 675) 1 343)
74 660) 71 747) 9 330) 8 376)
Unallocated items(a) (1 416) (1 295)
Trading profit 7 914) 7 081)
The analysis of sales by geographic area is stated by customer destination. Inter-segment sales are notsignificant.
In millions of Swiss francs 1999 1998 1999 1998
Assets Liabilities
Food
Europe 14 333) 14 354) 5 398) 5 083)
Americas 10 332) 9 971) 3 187) 2 748)
Africa, Asia and Oceania 6 919) 6 526) 1 936) 1 558)
Other activities 7 316) 6 124) 2 855) 2350)
38 900) 36 975) 13 376) 11 769)
Unallocated items(b) 7 454) 6 616) 491) 14)
Eliminations (637) (587) (637) (587)
45 717) 43 004) 13 230) 11 196)
In millions of Swiss francs 1999 1998 1999 1998
Capitalexpenditure
Depreciation oftangible fixed assets
Food
Europe 923) 1 026) 928) 997)
Americas 718) 827) 697) 728)
Africa, Asia and Oceania 381) 457) 421) 378)
Other activities 665) 629) 477) 434)
2 687) 2 939) 2 523) 2 537)
Unallocated items(c) 119) 122) 74) 72)
2 806) 3 061) 2 597) 2 609)
Nestlé Management Report 1999 | Consolidated Accounts of the Nestlé Group
http://www.nestle.com/investor_relations/mr1999/consolaccts/09/index.htm (1 of 16) [4/27/2001 10:52:25 AM]

(a) Mainly corporate expenses,research and developmentcosts, amortisation ofintangible assets as well asrestructuring costs.
By major product group
In millions of Swiss francs 1999 1998 1999 1998
Sales Results
Beverages 20 859) 19 879) 3 764) 3 253)
Milk products, nutrition and ice cream 19 411) 19 175) 2 168) 1 837)
Prepared dishes and cooking aids(and miscellaneous activities) 21 185) 18 765) 1 850) 1 617)
Chocolate and confectionery 10 195) 10 485) 882) 976)
Pharmaceutical products 4 010) 3 443) 1 077) 915)
74 660) 71 747) 9 741) 8 598)
Unallocated items(a) (1 827) (1 517)
Trading profit 7 914) 7 081
In millions of Swiss francs 1999 1998
Assets
Beverages 10 104) 9 685)
Milk products, nutrition and ice cream 10 722) 10 759)
Prepared dishes and cooking aids (and miscellaneous activities) 9 940) 9 316)
Chocolate and confectionery 6 007) 6 343)
Pharmaceutical products 2 198) 1 977)
38 971) 38 080)
In millions of Swiss francs 1999 1998
Capital expenditure
Beverages 618) 593)
Milk products, nutrition and ice cream 366) 576)
Prepared dishes and cooking aids (and miscellaneous activities) 464) 442)
Chocolate and confectionery 280) 388)
Pharmaceutical products 91) 81)
1 819) 2 080)
Administration, distribution, research and development 987) 981)
2 806) 3 061)
2. Net financing costs
In millions of Swiss francs 1999 1998
Interest income 474) 429)
Interest expense (1 472) (1 666)
(998) (1 237)
Interest income includes Fr. 22 million (1998: Fr. 40 million) of gains arising on securities held for tradingpurposes.
Nestlé Management Report 1999 | Consolidated Accounts of the Nestlé Group
http://www.nestle.com/investor_relations/mr1999/consolaccts/09/index.htm (2 of 16) [4/27/2001 10:52:25 AM]
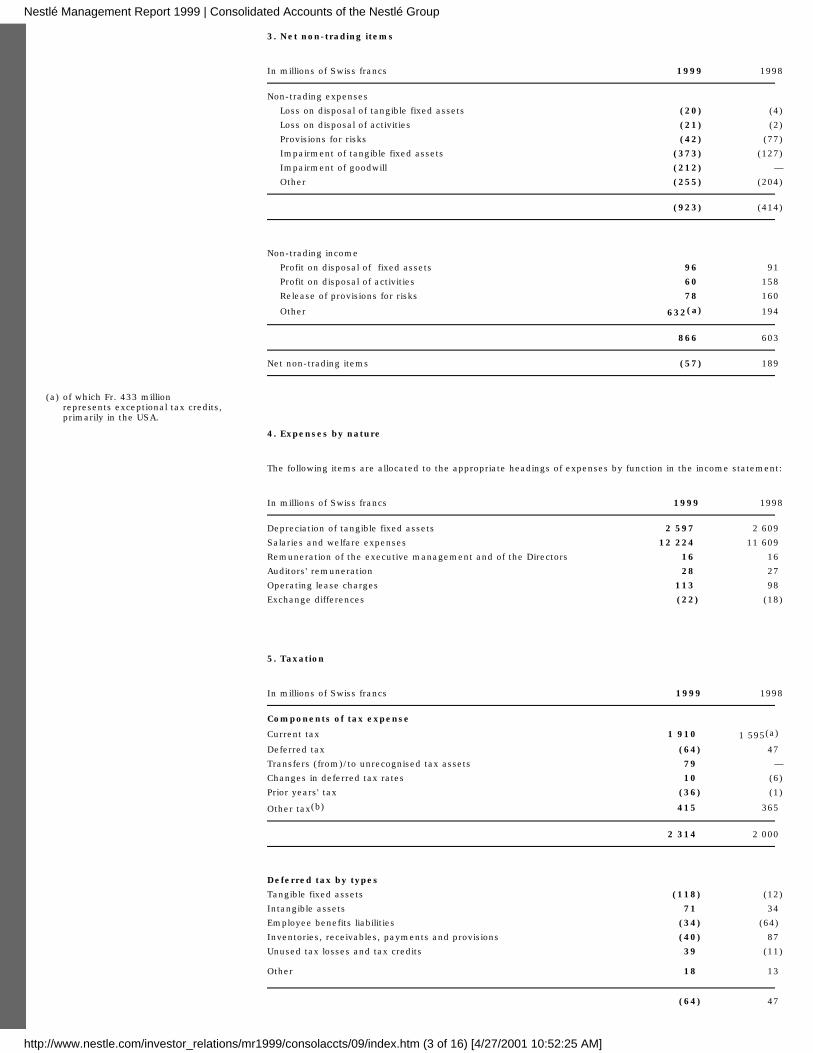
(a) of which Fr. 433 millionrepresents exceptional tax credits,primarily in the USA.
3. Net non-trading items
In millions of Swiss francs 1999 1998
Non-trading expenses
Loss on disposal of tangible fixed assets (20) (4)
Loss on disposal of activities (21) (2)
Provisions for risks (42) (77)
Impairment of tangible fixed assets (373) (127)
Impairment of goodwill (212) —
Other (255) (204)
(923) (414)
Non-trading income
Profit on disposal of fixed assets 96) 91)
Profit on disposal of activities 60) 158)
Release of provisions for risks 78) 160)
Other 632(a) 194)
866) 603)
Net non-trading items (57) 189)
4. Expenses by nature
The following items are allocated to the appropriate headings of expenses by function in the income statement:
In millions of Swiss francs 1999 1998
Depreciation of tangible fixed assets 2 597) 2 609)
Salaries and welfare expenses 12 224) 11 609)
Remuneration of the executive management and of the Directors 16) 16)
Auditors' remuneration 28) 27)
Operating lease charges 113) 98)
Exchange differences (22) (18)
5. Taxation
In millions of Swiss francs 1999 1998
Components of tax expense
Current tax 1 910) 1 595(a))
Deferred tax (64) 47)
Transfers (from)/to unrecognised tax assets 79) —
Changes in deferred tax rates 10) (6)
Prior years' tax (36) (1)
Other tax(b) 415) 365)
2 314) 2 000)
Deferred tax by types
Tangible fixed assets (118) (12)
Intangible assets 71) 34)
Employee benefits liabilities (34) (64))
Inventories, receivables, payments and provisions (40) 87)
Unused tax losses and tax credits 39) (11)
Other 18) 13)
(64) 47)
Nestlé Management Report 1999 | Consolidated Accounts of the Nestlé Group
http://www.nestle.com/investor_relations/mr1999/consolaccts/09/index.htm (3 of 16) [4/27/2001 10:52:25 AM]
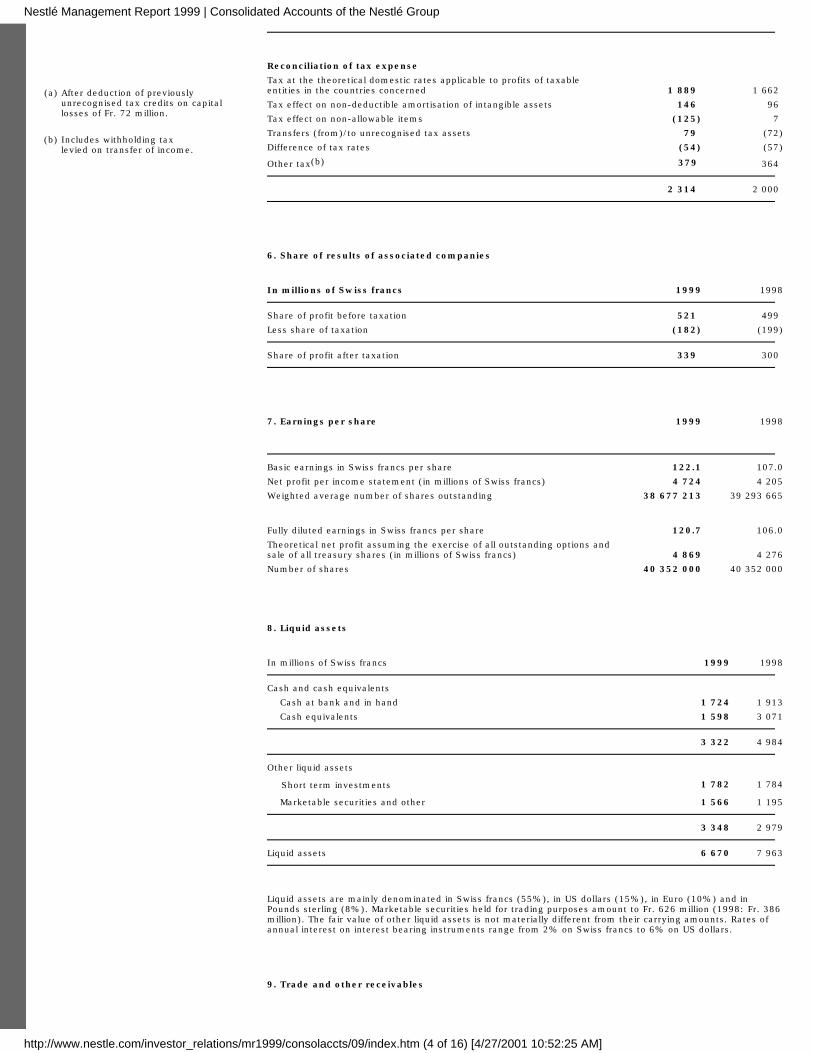
(a) After deduction of previouslyunrecognised tax credits on capitallosses of Fr. 72 million.
(b) Includes withholding tax
levied on transfer of income.
Reconciliation of tax expense
Tax at the theoretical domestic rates applicable to profits of taxableentities in the countries concerned 1 889) 1 662)
Tax effect on non-deductible amortisation of intangible assets 146) 96)
Tax effect on non-allowable items (125) 7)
Transfers (from)/to unrecognised tax assets 79) (72)
Difference of tax rates (54) (57)
Other tax(b) 379) 364)
2 314) 2 000)
6. Share of results of associated companies
In millions of Swiss francs 1999 1998
Share of profit before taxation 521) 499)
Less share of taxation (182) (199)
Share of profit after taxation 339) 300)
7. Earnings per share 1999 1998
Basic earnings in Swiss francs per share 122.1 107.0
Net profit per income statement (in millions of Swiss francs) 4 724 4 205
Weighted average number of shares outstanding 38 677 213 39 293 665
Fully diluted earnings in Swiss francs per share 120.7 106.0
Theoretical net profit assuming the exercise of all outstanding options andsale of all treasury shares (in millions of Swiss francs) 4 869 4 276
Number of shares 40 352 000 40 352 000
8. Liquid assets
In millions of Swiss francs 1999 1998
Cash and cash equivalents
Cash at bank and in hand 1 724 1 913
Cash equivalents 1 598 3 071
3 322 4 984
Other liquid assets
Short term investments 1 782 1 784
Marketable securities and other 1 566 1 195
3 348 2 979
Liquid assets 6 670 7 963
Liquid assets are mainly denominated in Swiss francs (55%), in US dollars (15%), in Euro (10%) and inPounds sterling (8%). Marketable securities held for trading purposes amount to Fr. 626 million (1998: Fr. 386million). The fair value of other liquid assets is not materially different from their carrying amounts. Rates ofannual interest on interest bearing instruments range from 2% on Swiss francs to 6% on US dollars.
9. Trade and other receivables
Nestlé Management Report 1999 | Consolidated Accounts of the Nestlé Group
http://www.nestle.com/investor_relations/mr1999/consolaccts/09/index.htm (4 of 16) [4/27/2001 10:52:25 AM]

In millions of Swiss francs 1999 1998
Trade receivables 10 148) 8 857)
Other receivables 2 295) 2 134)
12 443) 10 991)
After deduction of allowance for doubtful debtors of 503) 479)
Amounts included above which are due after more than one year 89) 117)
10. Inventories
In millions of Swiss francs 1999 1998
Raw materials, work in progress and sundry supplies 2 893) 2 792)
Manufactured goods 4 667) 4 319)
Provisions (117) (163)
7 383) 6 948)
Inventories amounting to Fr. 65 million (1998: Fr. 165 million) are pledged as security for financial liabilities.
11. Tangible fixed assets
In millions of Swiss francs 1999 1998
Land andbuildings
Machinery andequipment
Tools, furnitureand other
equipment Vehicles Total Total
Gross value:
As 1st January 11 279) 22 884) 5 304) 854) 40 321) 39 169)
Currency retranslationand inflation adjustment 759) 1 746) 381) 56) 2 942) (1 381)
Expenditure 523) 1 498) 669) 116) 2 806) 3 061)
Disposals (379) (949) (445) (153) (1 926) (1 684)
Modification of thescope of consideration — (33) (12) 9) (36) 1 416)
Other 50) (114) (28) (1) (93) (260))
At 31st December 12 232) 25 032) 5 869) 881) 44 014) 40 321)
Accumulated depreciation:
At 1st January (3 841) (13 930) (3 577) (547) (21 895) (20 984)
Currency retranslation and inflationadjustment (282) (996) (267) (34) (1 579) 1 117)
Depreciation (341) (1 551) (592) (113) (2 597) (2 609)
Impairment (159) (237) (16) (1) (413)(a) (127)
Disposals 194) 826) 389) 117) 1 526) 1 223)
Modification of the scope ofconsideration 16) 30) 9) (5) 50) (661)
Other 38) 60) 13) 1) 112) 146)
At 31st December (4 375) (15 798) (4 041) (582) (24 796) (21 895)
Nestlé Management Report 1999 | Consolidated Accounts of the Nestlé Group
http://www.nestle.com/investor_relations/mr1999/consolaccts/09/index.htm (5 of 16) [4/27/2001 10:52:25 AM]

(a) of which Fr. 373 millionrecognised in the incomestatement and Fr. 40 million byreclassification of the relatedprovision (note 21).
Net at 31st December 7 857) 9 234) 1 828) 299) 19 218) 18 426)
At 31st December 1999, net tangible fixed assets include Fr. 123 million (1998: Fr. 400 million) of assets underconstruction. Net tangible fixed assets held under finance leases at 31st December 1999 amount to Fr. 80 million(1998: Fr. 115 million). Net tangible fixed assets of Fr. 192 million (1998: Fr. 379 million) are pledged as securityfor financial creditors. The fire risks, reasonably estimated, are insured in accordance with domestic requirements.
(a) of which Fr. 212 millionrecognised in the incomestatement and Fr. 122 millionby reclassification of the relatedprovision (note 21).
12. Investments in associated companies
This item primarily includes the Group's indirect (26.3%) participation in the equity of L'Oréal, Paris for Fr.1 683 million (1998: Fr. 1 367 million). Its market value at 31st December 1999 amounts to Fr. 22 814 million(1998: Fr. 17 609 million).
13. Other financial assets
In millions of Swiss francs 1999 1998
Medium and long term receivables 2 006 1 552
Excess of assets of defined benefit plans 272 281
Other investments 153 145
2 431 1 978
14. Intangible assets
In millions of Swiss francs 1999 1998
Gross value
At 1st January 6 638) 2 831)
Currency retranslation 271) (116)
Goodwill from acquisitions 374) 3 848)
Expenditure on other intangibles 139) 72)
Disposals (8) —
Other 124) 3)
At 31st December 7 538) 6 638)
Accumulated amortisation
At 1st January (564) (276)
Currency retranslation (42) 16)
Amortisation of goodwill (384) (301)
Depreciation of other intangibles (92) —
Disposals 2) —
Impairment (334)(a) —
Other (124) (3)
At 31st December (1 538) (564)
Net at 31st December 6 000) 6 074)
Nestlé Management Report 1999 | Consolidated Accounts of the Nestlé Group
http://www.nestle.com/investor_relations/mr1999/consolaccts/09/index.htm (6 of 16) [4/27/2001 10:52:25 AM]

15. Trade and other payables
In millions of Swiss francs 1999 1998
Trade payables 5 815) 5 121)
Other payables 3 820) 3 366)
9 635) 8 487)
16. Current financial liabilities
In millions of Swiss francs 1999 1998
Commercial Paper 1 830) 2 145)
Line of credit facilities 1 263) 2 089)
Other short term financial liabilities 4 043) 5 736)
7 136) 9 970)
Current portion of medium and long term financial liabilities 831) 575)
7 967) 10 545)
Short term financial liabilities are mainly denominated in Euro (24%), in US dollars (17%), in Pounds sterling(14%) and in Yen (4%). Rates of annual interest range from 3.0% on Euro to 25% on Brazilian Reais.
17. Medium and long term financial liabilities
In millions of Swiss francs 1999 1998
Loans from financial institutions 1 661 1 029
Bonds 3 994 3 529
Obligations under finance leases 81 64
5 736 4 622
Current portion of medium and long term financial liabilities (831) (575)
4 905 4 047
Loans from financial institutions are mainly denominated in US dollars (51%) and in Euro (25%). Annualinterest rates range from 3.2% on Euro to 14.75% on Brazilian Reais. The majority of the loans are at variablerates. Currencies and interest rates on bonds are disclosed below.
The above medium and long term financial creditors are repayable as follows:
In millions of Swiss francs 1999 1998
in the second year 657 1 211
in the third to fifth year inclusive 3 370 2 462
after the fifth year 878 374
4 905 4 047
Bonds in issue which are carried at face value, adjusted for any related currency hedge, are as follows:
In millions of Swiss francs 1999 1998
Nestlé Management Report 1999 | Consolidated Accounts of the Nestlé Group
http://www.nestle.com/investor_relations/mr1999/consolaccts/09/index.htm (7 of 16) [4/27/2001 10:52:26 AM]

Face value and currency Interest rate Year of issue/maturity
Bond issues of Nestlé Holdings, Inc., USA
USD 250 mio 3 5/8% 1992–1999 Warrants attached, expired. — 345
CHF 300 mio 6¾% 1992–2002 Subject to interest rate andcurrency swaps that createa US dollar liability atfloating rates. 365 315
USD 250 mio 7 3/8% 1995–2005 400 345
DEM 500 mio 5 1/8% 1996–2001 Subject to interest rate andcurrency swaps that createa US dollar liability atfloating rates. 530 457
USD 300 mio 3% 1997–2002 Convertible into Nestlé S.A.shares, but subject to anequity and interest rateswap that hedges the issueragainst its equity exposureand creates a straight USdollar liability at floatingrates. 480 414
USD 250 mio 5 5/8% 1998–2003 Subject to an interest rateswap that creates a floatingat variable rates. 400 345
Bond issue of Nestlé-Finance S.A., France
ZAR 200 mio 14¾% 1997–2000 ZAR 100 mio are subject toan interest rate andcurrency swap that createsa FRF liability at floatingrates.ZAR 100 mio are swappedat a rand floating rate andare re-lent to a SouthAfrican affiliated company. 55 63
Bond issue of Nestlé (UK) Ltd., United Kingdom
GBP 100 mio 6¾% 1997–2000 Subject to an interest rateswap that creates a liabilityat floating rates. 258 229
USD 250 mio 5% 1998–2003 Subject to an interest rateand currency swap thatcreates a Pound sterlingliability at floating rates. 388 345
Bond issue of Nestlé Australia Ltd., Australia
CHF 300 mio 3% 1996-2000 Subject to an interest rateand currency swaps thatcreates an Australian dollarliability at floating rates. 350 285
USD 250 mio 1¼% 1998–2005 Convertible into Nestlé S.A.shares, but subject to anequity and interest rate andcurrency swap that hedgesthe issuer against its equityand currency exposures andcreates a straight Australiandollar liability at floatingrates. 393) 320)
Bond issue of Nestlé Capital Canada, Ltd, Canada
USD 200 mio 5½% 1999-2004 Subject to an interest rateand currency swap thatcreates a Canadian dollarliability at floating rates. 328 —
Other bonds 47) 66)
Total 3 994) 3 529)
Due within one year (682) (379)
Due after one year 3 312) 3 150)
The market value of the above bonds amounts to Fr. 3 999 million as at 31st December 1999 (1998: Fr. 3 525million). This amount represents the market price of the bonds of Fr. 3 780 million plus unrealised losses of Fr.219 million on the hedge instruments (see note 30).
Nestlé Management Report 1999 | Consolidated Accounts of the Nestlé Group
http://www.nestle.com/investor_relations/mr1999/consolaccts/09/index.htm (8 of 16) [4/27/2001 10:52:26 AM]
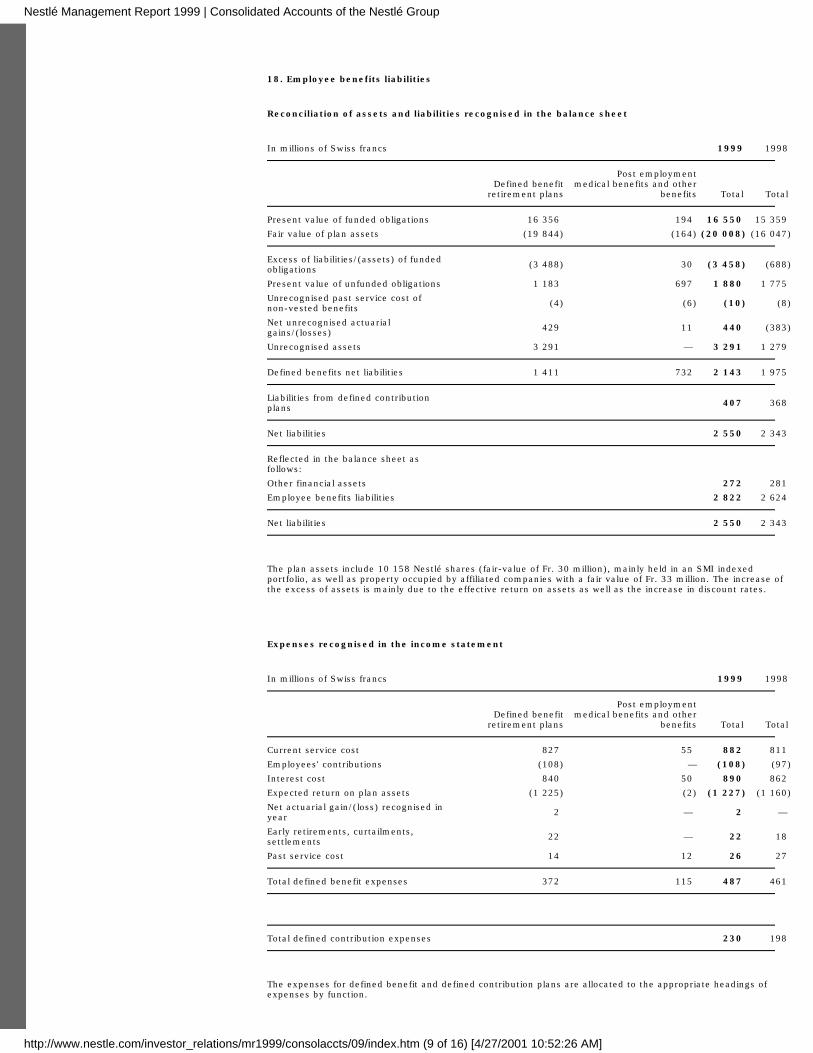
18. Employee benefits liabilities
Reconciliation of assets and liabilities recognised in the balance sheet
In millions of Swiss francs 1999 1998
Defined benefitretirement plans
Post employmentmedical benefits and other
benefits Total Total
Present value of funded obligations 16 356) 194) 16 550) 15 359)
Fair value of plan assets (19 844) (164) (20 008) (16 047)
Excess of liabilities/(assets) of fundedobligations (3 488) 30) (3 458) (688)
Present value of unfunded obligations 1 183) 697) 1 880) 1 775)
Unrecognised past service cost ofnon-vested benefits (4) (6) (10) (8)
Net unrecognised actuarialgains/(losses) 429) 11) 440) (383)
Unrecognised assets 3 291) —) 3 291) 1 279)
Defined benefits net liabilities 1 411) 732) 2 143) 1 975)
Liabilities from defined contributionplans 407) 368)
Net liabilities 2 550) 2 343)
Reflected in the balance sheet asfollows:
Other financial assets 272) 281)
Employee benefits liabilities 2 822) 2 624)
Net liabilities 2 550) 2 343)
The plan assets include 10 158 Nestlé shares (fair-value of Fr. 30 million), mainly held in an SMI indexedportfolio, as well as property occupied by affiliated companies with a fair value of Fr. 33 million. The increase ofthe excess of assets is mainly due to the effective return on assets as well as the increase in discount rates.
Expenses recognised in the income statement
In millions of Swiss francs 1999 1998
Defined benefitretirement plans
Post employmentmedical benefits and other
benefits Total Total
Current service cost 827) 55) 882) 811)
Employees' contributions (108) — (108) (97)
Interest cost 840) 50) 890) 862)
Expected return on plan assets (1 225) (2) (1 227) (1 160)
Net actuarial gain/(loss) recognised inyear 2) —) 2) —)
Early retirements, curtailments,settlements 22) —) 22) 18)
Past service cost 14) 12) 26) 27)
Total defined benefit expenses 372) 115) 487) 461)
Total defined contribution expenses 230) 198)
The expenses for defined benefit and defined contribution plans are allocated to the appropriate headings ofexpenses by function.
Nestlé Management Report 1999 | Consolidated Accounts of the Nestlé Group
http://www.nestle.com/investor_relations/mr1999/consolaccts/09/index.htm (9 of 16) [4/27/2001 10:52:26 AM]
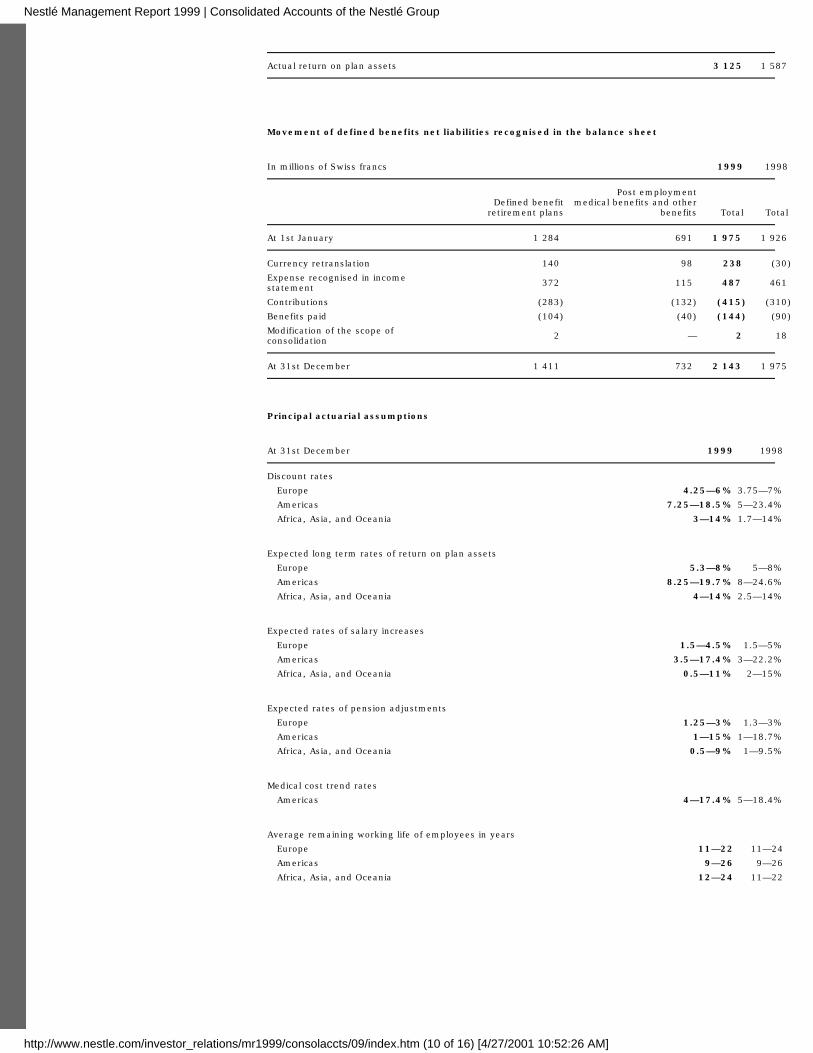
Actual return on plan assets 3 125) 1 587)
Movement of defined benefits net liabilities recognised in the balance sheet
In millions of Swiss francs 1999 1998
Defined benefitretirement plans
Post employmentmedical benefits and other
benefits Total Total
At 1st January 1 284) 691) 1 975) 1 926)
Currency retranslation 140) 98) 238) (30)
Expense recognised in incomestatement 372) 115) 487) 461)
Contributions (283) (132) (415) (310)
Benefits paid (104) (40) (144) (90)
Modification of the scope ofconsolidation 2) — 2) 18)
At 31st December 1 411) 732) 2 143) 1 975)
Principal actuarial assumptions
At 31st December 1999 1998
Discount rates
Europe 4.25—6% 3.75—7%
Americas 7.25—18.5% 5—23.4%
Africa, Asia, and Oceania 3—14% 1.7—14%
Expected long term rates of return on plan assets
Europe 5.3—8% 5—8%
Americas 8.25—19.7% 8—24.6%
Africa, Asia, and Oceania 4—14% 2.5—14%
Expected rates of salary increases
Europe 1.5—4.5% 1.5—5%
Americas 3.5—17.4% 3—22.2%
Africa, Asia, and Oceania 0.5—11% 2—15%
Expected rates of pension adjustments
Europe 1.25—3% 1.3—3%
Americas 1—15% 1—18.7%
Africa, Asia, and Oceania 0.5—9% 1—9.5%
Medical cost trend rates
Americas 4—17.4% 5—18.4%
Average remaining working life of employees in years
Europe 11—22 11—24
Americas 9—26 9—26
Africa, Asia, and Oceania 12—24 11—22
Nestlé Management Report 1999 | Consolidated Accounts of the Nestlé Group
http://www.nestle.com/investor_relations/mr1999/consolaccts/09/index.htm (10 of 16) [4/27/2001 10:52:26 AM]

(a) of which 164 related to prioryears.
(b) Average exercise price Fr.1 237.—(1998 Fr. 1 235.—).
19. Equity compensation plan
Following are the movements and expiry dates of the options held by members of the Group's Management:
Movement of the options
In millions of Swiss francs 1999 1998
Number of options Value of shares Number of options Value of shares
Outstanding at 1st January 71 210) 105) 79 095) 102)
of which vested 40 419) ) 38 641) )
New rights 33 492(a)) 87) 12 203) 28)
Rights exercised(b) (11 693) 14) (20 088) (25)
Rights expired —) —) —) —)
Outstanding at 31st December 93 009) 178) 71 210) 105)
of which vested 47 478) ) 40 419) )
The rights are exercised throughout the year in accordance with the rules of the plan.
Expiry dates of options
1999 1998
within: NumberExercise
Price NumberExercise
Price
one year 17 327 Fr. 1 182 — —
two years 13 031 Fr. 1 261 25 266 Fr. 1 182
three years 17 120 Fr. 1 498 15 153 Fr. 1 261
four years 12 203 Fr. 2 303 18 752 Fr. 1 498
five years — — 12 203 Fr. 2 303
six years — — — —
seven years 33 328 Fr. 2 609 — —
Total 93 009 71 374
20. Deferred taxes
In millions of Swiss francs 1999 1998
Tax assets by types of temporary differences
Tangible fixed assets 41 31
Intangible assets 230 237
Employee benefits 900 698
Inventories, receivables, payables and provisions 739 637
Unused tax losses and unused tax credits 120 394
Other 394 334
2 424 2 331
Tax liabilities by types of temporary differences
Tangible fixed assets 941 1 002
Intangible assets 52 7
Employee benefits 94 9
Inventories, receivables, payables and provisions 126 111
Other 245 364
Nestlé Management Report 1999 | Consolidated Accounts of the Nestlé Group
http://www.nestle.com/investor_relations/mr1999/consolaccts/09/index.htm (11 of 16) [4/27/2001 10:52:26 AM]

1 458 1 493
Net assets 966 838
Reflected in the balance sheet as follows:
Deferred tax assets 2 293 2 233
Deferred tax liabilities 1 327 1 395
Net assets 966 838
Temporary differences for which no deferred tax is recognised:
On investments in affiliated companies (taxable temporary difference) 4 776 2 649
On unused tax losses and tax credits and other 820 483
Unused tax losses expire mainly within 2 to 5 years.
21. Provisions
In 1998 and previous years, this caption included provisions for impairment of assets as well as certain otherliabilities. In 1999, a total of Fr. 491 million has been reclassified as a reduction of the carrying value of therelated assets or shown as accrued liabilities.
22. Share capital of Nestlé S.A
1999 1998
Number of registered shares of nominal value Fr. 10 each 40 352 000 40 352 000
In millions of Swiss francs 404 404
Additional information is given in the annex to the Annual report of Nestlé S.A., note 18. The share capitalincludes the nominal value of treasury shares (see note 23).
23. Treasury shares
This item includes the book value of treasury shares (of Nestlé S.A.) held by:– an affiliated company: 928 940 freely available shares;– Nestlé S.A.: 93 009 shares in order to allow the exercise of option rights by members of the Group'smanagement (see note 19);– an affiliated company: 923 345 shares held for trading purposes.
The movement of these shares is described in the annex to the Annual report of Nestlé S.A., note 20.
24. Decrease/(increase) in working capital
Disregarding exchange differences and effect of acquisitions and disposals.
In millions of Swiss francs 1999 1998
Inventories (15) (67)
Trade receivables (622) (725)
Trade payables 364) 100)
Other payables 231) (50)
Net accruals and deferrals 475) 367)
Other (198) (131)
235) (506)
Nestlé Management Report 1999 | Consolidated Accounts of the Nestlé Group
http://www.nestle.com/investor_relations/mr1999/consolaccts/09/index.htm (12 of 16) [4/27/2001 10:52:26 AM]

25. Acquisitions
In millions of Swiss francs 1999 1998
Fair value of net assets acquired
Tangible fixed assets 137) 800)
Financial assets 29) (45)
Provisions (8) (219)
Deferred taxes (13) 213)
Minority interests (68) (23)
Purchase of minority interests in existing participations 7) 144)
Net working capital 13) 211)
Financial liabilities (27) (731)
Liquid assets 39) 85)
109) 435)
Goodwill 374) 3 848)
Total acquisition cost 483) 4 283)
less:
Cash and cash equivalents acquired (39) (85)
Consideration payable (4) (167)
Cash outflow on acquisitions 440) 4 031)
26. Disposals
In millions of Swiss francs 1999 1998
Net assets disposed of:
Tangible fixed assets 123) 45
Intangible fixed assets 6) —
Minority Interest (11) —
Net working capital 76) 35
Financial Liabilities (38) —
Liquid assets —) —
156) 80
Recovery of intangible assets on disposals charged to equity prior to 1st January 1995 71) —
Profit/(loss) on disposals 39) 156
Total sale consideration 266) 236
less:
Cash and cash equivalents disposed of —) —
Consideration receivable (13) —
Cash inflow on disposals 253) 236
27. Dividends
Dividends payable are not accounted for until they have been ratified at the Annual General Meeting. At themeeting on 25th May 2000, the following dividend in respect of 1999 will be proposed:
Dividend per share Fr. 43.-
resulting in a total dividend of (a) Fr. 1 693 758 476.-
Nestlé Management Report 1999 | Consolidated Accounts of the Nestlé Group
http://www.nestle.com/investor_relations/mr1999/consolaccts/09/index.htm (13 of 16) [4/27/2001 10:52:26 AM]

(a) Number of shares with right to
dividend: see Annual report of NestléS.A.
The accounts for the year ended 31st December 1999 do not reflect this proposed distribution, which will betreated as an appropriation of profit in the year ending 31st December 2000.
28. Foreign exchange hedge instruments
Forward foreign currency sales
In millions of Swiss francs 1999 1998
Contractualor notional
amounts
Unrealisedgains
Unrealisedlosses
Contractualor notional
amounts
Unrealisedgains
Unrealisedlosses
Recognised transactions
Forward contracts 7 869 — 292 4 698 28 74
Options purchased 1 675 — 6 1 936 — 15
Options written 1 610 — 2 1 857 6 1
Anticipated future transactions
Forward contracts 647 5 13 472 — 28
Options written 80 — — — — —
Recognised transactions relate to balance sheet positions resulting from liquid assets in foreign currencies and, toa lesser extent, from export receivables, while anticipated future transactions refer to expected export sales.Due to the nature of the Group's operations, most of the transactions have maturities of less than one year. Theyare denominated mainly in US dollars and in Euro.
Forward foreign currency purchases
In millions of Swiss francs 1999 1998
Contractualor notional
amounts
Unrealisedgains
Unrealisedlosses
Contractualor notional
amounts
Unrealisedgains
Unrealisedlosses
Recognised transactions
Forward contracts 2 564 51 7 1 986 45 13
Options purchased — — — 1 219 — 12
Options written 65 — — 632 5 2
Anticipated future transactions
Forward contracts 1 026 — 20 585 4 6
Options purchased 127 2 1 62 — 2
Options written 372 1 — 238 5 1
Recognised transactions are related to balance sheet positions such as suppliers and financial liabilities whileanticipated future transactions refer to commitments for commodity and machinery imports.Due to the nature of the Group's operations, most of the transactions have maturities of less than one year. Theyare denominated mainly in US dollars, in Euro and in Yen.
29. Commodity hedge instruments
In millions of Swiss francs 1999 1998
Contractualor notional
amounts
Unrealisedgains
Unrealisedlosses
Contractualor notional
amounts
Unrealisedgains
Unrealisedlosses
Futures 245 9 24 479 1 77
Options purchased 38 — 1 32 — —
Options written 26 — 1 70 1 1
Commodity hedge instruments are designed to hedge the price risks on the anticipated purchases of coffee, cocoaand other commodities used for the manufacture of finished goods.
Nestlé Management Report 1999 | Consolidated Accounts of the Nestlé Group
http://www.nestle.com/investor_relations/mr1999/consolaccts/09/index.htm (14 of 16) [4/27/2001 10:52:26 AM]

(a) Include equity swaps.
30. Interest rate instruments
Liquid assets
Interest exposures on liquid assets are hedged by using instruments which have the effect of altering the averagematurities and the interest rates on the underlying positions. The notional amounts of these instruments and theunrealised gains and losses on revaluation at market rates are given below:
In millions of Swiss francs 1999 1998
Contractualor notional
amounts
Unrealisedgains
Unrealisedlosses
Contractualor notional
amounts
Unrealisedgains
Unrealisedlosses
Interest rate swaps 5 116 2 188 4 458 42 29
Interest rate and currency swaps — — — 55 — —
Interest rate futures — — — 545 — —
These instruments have maturity dates of three months to five years. The instruments are denominated in Swissfrancs and in Euro with annual interest rates ranging from 1.5% to 3.0%.
Financial Liabilities
The majority of interest rate swaps and interest rate and currency swaps modify the maturities and the interestrates of long term bonds thus creating obligations in the reporting currency of the issuer (see note 17), whileother interest rate and currency swaps, forward rate agreements, interest rate futures and options hedge interestrate exposures of the affiliated companies. The notional amounts of these instruments and the unrealised gainsand losses on revaluation at market rates are given below:
In millions of Swiss francs 1999 1998
Contractualor notional
amounts
Unrealisedgains
Unrealisedlosses
Contractualor notional
amounts
Unrealisedgains
Unrealisedlosses
Interest rate swaps(a) 2 510 110 15 2 215 243 1
Interest rate and currency swaps 3 527 36 300 2 591 97 23
Forward rate agreements 1 892 57 41 1 433 — 9
Interest rate futures — — — 43 9 —
Options purchased 341 — — 437 — —
Options written 1 003 1 1 586 — —
These instruments have maturity dates of three months to six years. They are denominated mainly in US dollars,Canadian dollars, Australian dollars, Euro and Pound sterling. Their annual interest rates range from 3.1% on Euroto 5.75% on Pound sterling.
31. Guarantees
In the normal course of business, the Group has given guarantees totalling Fr. 385 million to third parties(1998: Fr. 372 million).
32. Commitments for expenditure on tangible fixed assets
At 31st December 1999, the Group was committed to expenditure amounting to Fr. 137 million (1998: Fr.219 million).
33. Lease commitments
The following charges arise from these commitments:
Operating leases
In millions of Swiss francs 1999 1998
Nestlé Management Report 1999 | Consolidated Accounts of the Nestlé Group
http://www.nestle.com/investor_relations/mr1999/consolaccts/09/index.htm (15 of 16) [4/27/2001 10:52:26 AM]

(a) Information not available.
Minimum lease
paymentsFuture value
within one year 280 (a)
in the second year 246
in the third to fifth year inclusive 521
after the fifth year 1 215
2 262
Finance leases
In millions of Swiss francs 1999 1998
Minimum lease payments
Present value Future value Present value Future value
within one year 33 35 (a) (a)
in the second year 14 17
in the third to fifth year inclusive 11 13
after the fifth year 23 29
81 94
The difference between the future value of the minimum lease payments and their present value represents thediscount on the lease obligations.
34. Contingent liabilities
The Group has provided for all significant contingent liabilities which are probable of assertion and success.
35. Post balance sheet events
Disposal of certain frozen food operations in 2000The negotiations with EQT Scandinavia B.V. concerning the sale of the Findus brand and a substantial part ofthe frozen food activity in Europe were successfully concluded in October 1999. Completion of this sale tookplace on 31st January 2000 in respect of all markets, other than France, which is expected to be finalised atthe end of February 2000. The transaction includes all of Nestlé's frozen food activities in Great Britain and inScandinavia, as well as parts of the business — mainly vegetables and fish — in five other countries inEurope. Approximately 3500 full-time employees and 14 factories in seven European countries are affected.The Findus brand worldwide, with the exception of Switzerland and Italy, is included in the transaction. Thebusiness had annual sales to third party customers of approximately Fr. 900 million in 1999.
Sales and results for the year 1999 have not been affected by this transaction and the respective assets andliabilities are still included in the balance sheet at 31st December 1999.
36. Transactions with related parties
The Group has not entered into any material transaction with related parties
37. Nestlé Group Companies
The list of companies appears in the section "Companies of the Nestlé Group".
Nestlé Management Report 1999 | Consolidated Accounts of the Nestlé Group
http://www.nestle.com/investor_relations/mr1999/consolaccts/09/index.htm (16 of 16) [4/27/2001 10:52:26 AM]

Principal exchange rates Swiss francs per 1999 1998 1999 1998
Year end rates Average annual rates
1 US Dollar USD 1.60 1.38 1.51 1.44
1 Euro EUR 1.61 1.61 1.60 —
100 French Francs FRF 24.50 24.50 24.40 24.60
100 Deutsche Marks DEM 82.30 82.30 81.70 82.40
1 Pound Sterling GBP 2.58 2.29 2.43 2.39
100 Italian Lira ITL 0.083 0.083 0.083 0.084
100 Brazilian Reais BRL 88.40 114.– 83.– 125.–
100 Spanish Pesetas ESP 0.97 0.97 0.96 0.97
100 Japanese Yen JPY 1.56 1.21 1.34 1.11
100 Mexican Pesos MXN 16.80 13.90 15.90 15.70
1 Canadian Dollar CAD 1.10 0.89 1.02 0.97
1 Australian Dollar AUD 1.04 0.847 0.97 0.91
\
Nestlé Management Report 1999 | Consolidated Accounts of the Nestlé Group
http://www.nestle.com/investor_relations/mr1999/consolaccts/10/index.htm [4/27/2001 10:52:38 AM]

As Group auditors we have audited the Consolidated accounts (balance sheet,income statement, cash flow statement and annex) of the Nestlé Group for theyear ended 31st December 1999.
These Consolidated accounts are the responsibility of the Board of Directors. Ourresponsibility is to express an opinion on these Consolidated accounts based onour audit. We confirm that we meet the legal requirements concerningprofessional qualification and independence.
Our audit was conducted in accordance with auditing standards promulgated bythe profession, and with International Standards on Auditing issued by theInternational Federation of Accountants (IFAC), which require that an audit beplanned and performed to obtain reasonable assurance about whether theConsolidated accounts are free from material misstatement. We have examined ona test basis evidence supporting the amounts and disclosures in the Consolidatedaccounts. We have also assessed the accounting principles used, significantestimates made and the overall Consolidated accounts presentation. We believethat our audit provides a reasonable basis for our opinion. In our opinion, theConsolidated accounts give a true and fair view of the financial position, the netprofit and cash flows and comply in all respects with International AccountingStandards (IAS), the Listing Rules of the Swiss Exchange and the law.
In our opinion, the Consolidated accounts give a true and fair view of the financialposition, the net profit and cash flows and comply in all respects with InternationalAccounting Standards (IAS), the Listing Rules of the Swiss Exchange and the law.
We recommend that the Consolidated accounts submitted to you be approved.
Klynveld Peat Marwick Goerdeler SA
S.R. CormackChartered accountant
B.A. MathersChartered accountant
Auditors in chargeLondon and Zurich, 24th February 2000
Nestlé Management Report 1999 | Consolidated Accounts of the Nestlé Group
http://www.nestle.com/investor_relations/mr1999/consolaccts/11/index.htm [4/27/2001 10:52:41 AM]

In millions of Swiss francs(except for per share data) 1999 1998 1997(e) 1996(f) 1995 1994(g) 1993 1992 1991 1990
ResultsConsolidating sales 74 660 71 747 69 998 60 490 56 484 56 894 57 486 54 500 50 486 46 369Trading profit 7 914 7 081 7 057 6 053 5 658 5 628 5 591 5 384 4 783 4 484as % of sales 10 .6% 9 .9% 10 .1% 10 .0% 10 .0% 9 .9% 9 .7% 9 .9% 9 .5% 9 .7%Taxation 2 314 2 000 1 842 1 552 1 561 1 647 1 669 1 745 1 605 1 404Consolidated net profit 4 724 4 205 4 182 3 592 3 078 3 250 2 887 2 698 2 470 2 272as % of sales 6 .3% 5 .9% 6 .0% 5 .9% 5 .4% 5 .7% 5 .0% 5 .0% 4 .9% 4 .9%as % of average equity 20 .0% 19 .5% 21 .9% 22 .9% 23 .3% 19 .9% 19 .5% 18 .4% 17 .2% 16 .6%Total amount of dividend 1 694 (a) 1 469 1 376 1 180 1 043 1 040 972 870 793 736Depreciation of tangible fixed assets 2 597 2 609 2 677 2 305 2 103 2 321 2 283 2 038 1 863 1 688as % of sales 3 .5% 3 .6% 3 .8% 3 .8% 3 .7% 4 .1% 4 .0% 3 .7% 3 .7% 3 .6%Amortisation of goodwill 384 301 140 102 42 - - - - -
Balance sheetCurrent assets 27 169 26 467 25 671 23 070 20 927 21 420 20 982 20 670 19 195 18 460 of which liquid assets 6 670 7 963 8 102 5 860 5 124 5 132 5 084 4 688 4 888 5 528Fixed assets 31 770 30 236 25 910 23 605 19 189 23 807 24 178 23 803 19 795 17 116Total assets 58 939 56 703 51 581 46 675 40 116 45 227 45 160 44 473 38 990 35 576Current liabilities 22 182 22 567 20 985 19 859 17 410 17 297 18 166 20 019 14 889 14 381Medium and long term liabilities and minority interests 12 304 11 321 9 990 9 239 8 862 10 986 11 334 10 524 8 731 7 781Equity 24 453 22 815 20 606 17 577 13 844 16 944 15 660 13 930 15 370 13 414Expenditure on tangible fixed assets 2 806 3 061 3 261 3 054 3 056 3 029 3 093 3 191 2 815 2 538as % of sales 3 .8% 4 .3% 4 .7% 5 .0% 5 .4% 5 .3% 5 .4% 5 .9% 5 .6% 5 .5%
Data per shareWeighted average number of shares outstanding 38 677 213 39 293 665 39 331 126 39 363 637 39 220 756 38 838 376 37 759 826 36 938 374 36 800 050 36 750 000
Consolidated net profit(b) 122 .1 107 .0 106 .3 91 .3 78 .5 83 .7 76 .5 72 .2 66 .4 61 .1
Equity(b) 632 581 524 557 459 436 415 373 413 361
Dividend(b) 43 .0(d) 38 .0 35 .0 30 .0 26 .5 26 .5 25 .0 23 .2 21 .3 19 .8
Pay-out ratio 35 .2%(d) 35 .5% 32 .9% 32 .9% 33 .8% 31 .7% 32 .7% 32 .2% 32 .0% 32 .4%
Stock exchange prices (high/low)(b) 3 107/ 2 508 3 498/ 2 122 2 192 /1 421 1 487/ 1 250 1 298/ 1 090 1 437/ 1 063 1 294/ 1 015 1 162/ 857 876/ 651 913/ 650
Yield(c) 1.2/ 1.7(d) 1.1/ 1.8 1.6/2 .5 2.0/ 2.4 2.0/ 2.4 1.8/ 2.5 1.9/ 2.5 2.0/ 2.7 2.4/ 3.3 2.2/ 3.0
Number of Personnel 230 929 231 881 225 808 221 144 220 172 212 687 209 755 218 005 201 139 199 021
(a) As proposed by the Board ofDirectors of Nestlé S.A. Thisamount includes dividends payablein respect of shares with right todividend at the balance sheet date(Fr. 1652 million) as well as thosepotentially payable on the sharescovering options and shares held fortrading purposes (Fr. 42 million).
(b) Figures prior to 1993 adjusted inorder to make comparable the dataper share, following rights issues inJune 1993.
(c) Calculated on the basis of thedividend for the year concerned butwhich is paid out in the followingyear.
(d) As proposed by the Board ofDirectors of Nestlé S.A.
(e) Figures prior to 1998 have notbeen restated following the firstapplication of IAS 19 (revised1998) "Employee Benefits".
(f) Figures prior to 1997 have not been restatedfollowing the first application of IAS 12 (revised1996) "Income tax".
(g) Figures prior to 1995 have not been restatedto reflect the change from net replacement valuesof tangible fixed assets to historical costaccounting.
Nestlé Management Report 1999 | Consolidated Accounts of the Nestlé Group
http://www.nestle.com/investor_relations/mr1999/consolaccts/12/index.htm [4/27/2001 10:52:45 AM]

Operating companies
Principal affiliated companies which operate in the food and watersectors, with the exception of those marked with an asterisk which areengaged in the pharmaceutical sector.
Countries within the continents are listed according to the alphabetical order of the French names.
1. Affiliated companies for which full consolidation treatment is applied (see"Scope of Consolidation".
EuropeGermany Nestlé Deutschland AG Frankfurt 97.34% · Blaue Quellen Mineral- undHeilbrunnen AG Rhens am Rhein 90.6% · Trinks GmbH Goslar 90.6% · SanPelligrino Deutschland GmbH Mainz 100% · Alcon Pharma GmbH*Freiburg/Breisgau 100% · Austria Nestlé Österreich GmbH Wien 100% · BelgiumNestlé Belgilux S.A. Bruxelles 100% · Perrier Vittel Belgilux S.A. Etalle 100% ·Alcon-Couvreur S.A.* Puurs 100% · S.A. Friskies Belgilux N.V. Bruxelles 100% ·Bulgaria Nestlé Sofia A.D. Sofia 99.9% · Denmark Nestlé Danmark A/SKøbenhavn 100% · Friskies Danmark A/S København 100% ·Alcon Danmark ApS*København 100% ·Spain Nestlé España S.A. Barcelona 100% · Productos del CaféS.A. Reus 100% · Davigel España S.A. Palma de Mallorca 100% · Pycasa — LaCocinera Torrejon de Ardoz 100% · EYCAM Perrier S.A. Barcelona 100% ·Alcon-Cusi S.A.* Barcelona 100% · Helados Miko S.A. Vitoria 100% · CompañiaAvidesa S.A. Alzira 100% · Alimentos Congelados S.A. Marcilla 100% · FriskiesEspaña S.A. Esplugues de Llobregat 100% · Finland Suomen Nestlé Oy Helsinki100% · Friskies Finland Oy Helsinki 100% · France Nestlé France S.A. Noisiel100% · France GlacesFindus S.A. Noisiel 100% · Nestlé Produits Laitiers FraisNoisiel 99.9% · Herta S.A. Noisiel 100% · Davigel S.A. Martin-Eglise 100% · FoodIngredients Specialties France S.A. Noisiel 100% · Perrier Vittel France Paris 100%· S.A. des Eaux Minérales de Ribeauvillé Ribeauvillé 99.3% · SociétéConditionnement et Industrie S.A. Bernay 77.9% · Eau Minérale Naturelle dePlancoët «Source Sassay» S.A. Plancoët 100% · Nestlé Coffee Specialties FranceS.A. Levallois– Perret 100% · Nestlé Clinical Nutrition S.A. Sèvres 100% ·Laboratoires Alcon S.A.* Rueil-Malmaison 100% · Friskies France,Rueil–Malmaison 100% · Greece Nestlé Hellas S.A. Maroussi 100% · AlconLaboratories Hellas E.P.E.* Alimos Attikis 100% · Italy Nestlé ltaliana S.p.A.Milano 99.9% · San Pellegrino S.p.A. Milano 100% · Alcon Italia S.p.A.* Milano100% · Friskies Italia S.p.A. Castiglione delle Stiviere 100% · Hungary NestléHungaria Kft Budapest 100% · Jupiter Kft Bük 100% · Norway A/S Nestlé NorgeAsker–Oslo 100% · Netherlands Nestlé Nederland B.V. Amsterdam 100% · AlconNederland B.V.* Gorinchem 100% · Friskies Netherlands B.V. Amsterdam 100% ·Poland Goplana S.A. Poznan 84.92% · Nestlé Polska Sp. zo.o. Warsaw 100% ·Naleczowianka Spolka zo.o. Naleczov 33.3% · Winiary S.A. Kalisz 95.22% ·Portugal Nestlé Portugal S.A. Linda-a-Velha 100% · Longa Vida S.A. Matosinho100% · Sociedade das Aguas de Pisoes Moura S.A. Lisboa 100% · Republic ofIreland Nestlé (lreland) Ltd Tallaght-Dublin 100% · Friskies Petcare (Ireland) LtdDublin 100% · Czech Republic Nestlé Food S.r.o. Praha 100% · NestléCokoladovny a.s. Praha 98.5% · United Kingdom Nestlé UK Ltd Croydon 100% ·Perrier Vittel UK Ltd Rickmansworth 100% · Buxton Mineral Water Company LtdRickmansworth 100% · Alcon Laboratories (UK) Ltd* Herts 100% · FriskiesPetcare (UK) Ltd New Malden 100% · Russia JSC Confectionery Union RossiyaSamara 99.7% · Nestlé Zhukovsky Ice Cream LLC Zhukovsky 87.8% · Nestlé FoodLLC Moscow 100% · OJSC Confectionery Firm Altai Barnaul 85.7% · OJSCKamskaya Perm 84.8% · JSC Khladoproduct Timashevsk 89.4% · Slovakia NestléFood S.r.o. Prievidza 99.9% · Sweden Svenska Nestlé AB Bjuv 100% · Jede ABMariestad 100% · Alcon Sverige AB* Bromma 100% · Friskies Sverige AB Malmö100% · Switzerland Société des Produits Nestlé S.A. Vevey 100% · Nestlé SuisseS.A. Vevey 100% · Perrier Vittel Suisse S.A. Mies 100% · Alcon PharmaceuticalsLtd* Hünenberg 100% · Nestlé World Trade Corporation La Tour–de–Peilz 100% ·Food Ingredients Specialities S.A. Villars–sur–Glâne 100% · Nestlé Nespresso S.A.Pully 100% · Turkey Nestlé Türkiye Gida Sanayi A.S. Istanbul 100% · Mis Süt
Nestlé Management Report 1999 | Consolidated Accounts of the Nestlé Group
http://www.nestle.com/investor_relations/mr1999/consolaccts/13/index.htm (1 of 4) [4/27/2001 10:52:49 AM]
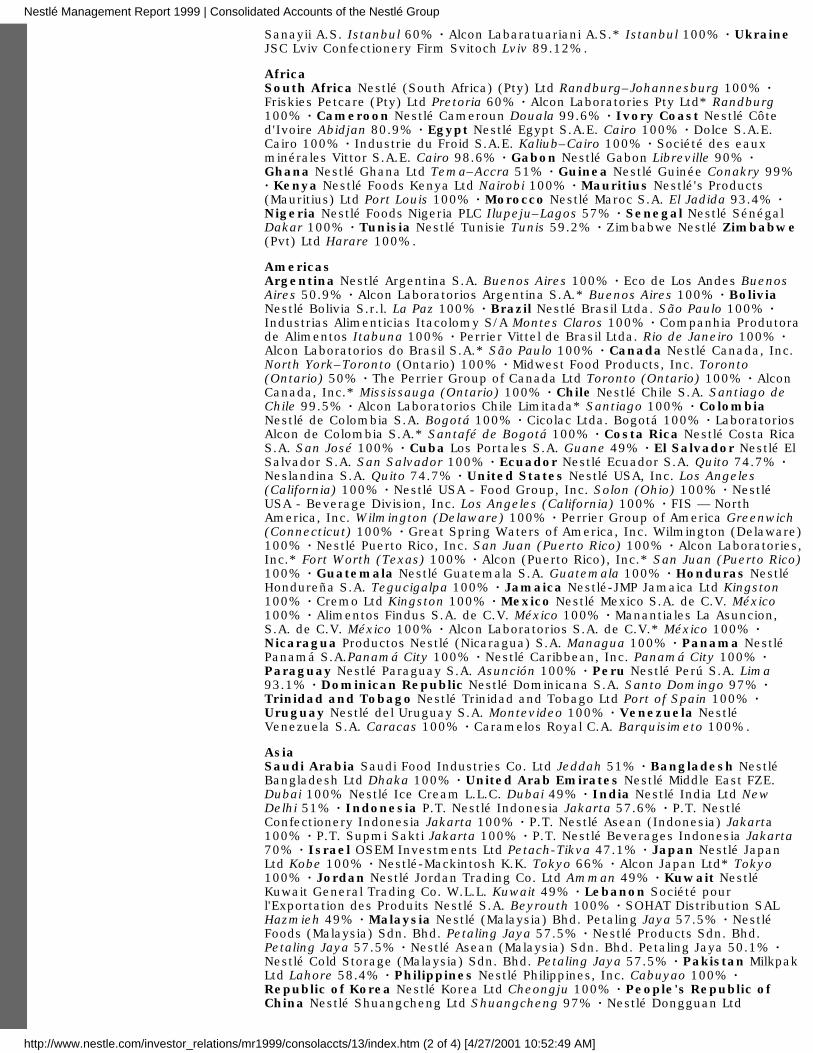
Sanayii A.S. Istanbul 60% · Alcon Labaratuariani A.S.* Istanbul 100% · UkraineJSC Lviv Confectionery Firm Svitoch Lviv 89.12%.
AfricaSouth Africa Nestlé (South Africa) (Pty) Ltd Randburg–Johannesburg 100% ·Friskies Petcare (Pty) Ltd Pretoria 60% · Alcon Laboratories Pty Ltd* Randburg100% · Cameroon Nestlé Cameroun Douala 99.6% · Ivory Coast Nestlé Côted'Ivoire Abidjan 80.9% · Egypt Nestlé Egypt S.A.E. Cairo 100% · Dolce S.A.E.Cairo 100% · Industrie du Froid S.A.E. Kaliub–Cairo 100% · Société des eauxminérales Vittor S.A.E. Cairo 98.6% · Gabon Nestlé Gabon Libreville 90% ·Ghana Nestlé Ghana Ltd Tema–Accra 51% · Guinea Nestlé Guinée Conakry 99%· Kenya Nestlé Foods Kenya Ltd Nairobi 100% · Mauritius Nestlé's Products(Mauritius) Ltd Port Louis 100% · Morocco Nestlé Maroc S.A. El Jadida 93.4% ·Nigeria Nestlé Foods Nigeria PLC Ilupeju–Lagos 57% · Senegal Nestlé SénégalDakar 100% · Tunisia Nestlé Tunisie Tunis 59.2% · Zimbabwe Nestlé Zimbabwe(Pvt) Ltd Harare 100%.
AmericasArgentina Nestlé Argentina S.A. Buenos Aires 100% · Eco de Los Andes BuenosAires 50.9% · Alcon Laboratorios Argentina S.A.* Buenos Aires 100% · BoliviaNestlé Bolivia S.r.l. La Paz 100% · Brazil Nestlé Brasil Ltda. São Paulo 100% ·Industrias Alimenticias Itacolomy S/A Montes Claros 100% · Companhia Produtorade Alimentos Itabuna 100% · Perrier Vittel de Brasil Ltda. Rio de Janeiro 100% ·Alcon Laboratorios do Brasil S.A.* São Paulo 100% · Canada Nestlé Canada, Inc.North York–Toronto (Ontario) 100% · Midwest Food Products, Inc. Toronto(Ontario) 50% · The Perrier Group of Canada Ltd Toronto (Ontario) 100% · AlconCanada, Inc.* Mississauga (Ontario) 100% · Chile Nestlé Chile S.A. Santiago deChile 99.5% · Alcon Laboratorios Chile Limitada* Santiago 100% · ColombiaNestlé de Colombia S.A. Bogotá 100% · Cicolac Ltda. Bogotá 100% · LaboratoriosAlcon de Colombia S.A.* Santafé de Bogotá 100% · Costa Rica Nestlé Costa RicaS.A. San José 100% · Cuba Los Portales S.A. Guane 49% · El Salvador Nestlé ElSalvador S.A. San Salvador 100% · Ecuador Nestlé Ecuador S.A. Quito 74.7% ·Neslandina S.A. Quito 74.7% · United States Nestlé USA, Inc. Los Angeles(California) 100% · Nestlé USA - Food Group, Inc. Solon (Ohio) 100% · NestléUSA - Beverage Division, Inc. Los Angeles (California) 100% · FIS — NorthAmerica, Inc. Wilmington (Delaware) 100% · Perrier Group of America Greenwich(Connecticut) 100% · Great Spring Waters of America, Inc. Wilmington (Delaware)100% · Nestlé Puerto Rico, Inc. San Juan (Puerto Rico) 100% · Alcon Laboratories,Inc.* Fort Worth (Texas) 100% · Alcon (Puerto Rico), Inc.* San Juan (Puerto Rico)100% · Guatemala Nestlé Guatemala S.A. Guatemala 100% · Honduras NestléHondureña S.A. Tegucigalpa 100% · Jamaica Nestlé-JMP Jamaica Ltd Kingston100% · Cremo Ltd Kingston 100% · Mexico Nestlé Mexico S.A. de C.V. México100% · Alimentos Findus S.A. de C.V. México 100% · Manantiales La Asuncion,S.A. de C.V. México 100% · Alcon Laboratorios S.A. de C.V.* México 100% ·Nicaragua Productos Nestlé (Nicaragua) S.A. Managua 100% · Panama NestléPanamá S.A.Panamá City 100% · Nestlé Caribbean, Inc. Panamá City 100% ·Paraguay Nestlé Paraguay S.A. Asunción 100% · Peru Nestlé Perú S.A. Lima93.1% · Dominican Republic Nestlé Dominicana S.A. Santo Domingo 97% ·Trinidad and Tobago Nestlé Trinidad and Tobago Ltd Port of Spain 100% ·Uruguay Nestlé del Uruguay S.A. Montevideo 100% · Venezuela NestléVenezuela S.A. Caracas 100% · Caramelos Royal C.A. Barquisimeto 100%.
AsiaSaudi Arabia Saudi Food Industries Co. Ltd Jeddah 51% · Bangladesh NestléBangladesh Ltd Dhaka 100% · United Arab Emirates Nestlé Middle East FZE.Dubai 100% Nestlé Ice Cream L.L.C. Dubai 49% · India Nestlé India Ltd NewDelhi 51% · Indonesia P.T. Nestlé Indonesia Jakarta 57.6% · P.T. NestléConfectionery Indonesia Jakarta 100% · P.T. Nestlé Asean (Indonesia) Jakarta100% · P.T. Supmi Sakti Jakarta 100% · P.T. Nestlé Beverages Indonesia Jakarta70% · Israel OSEM Investments Ltd Petach-Tikva 47.1% · Japan Nestlé JapanLtd Kobe 100% · Nestlé-Mackintosh K.K. Tokyo 66% · Alcon Japan Ltd* Tokyo100% · Jordan Nestlé Jordan Trading Co. Ltd Amman 49% · Kuwait NestléKuwait General Trading Co. W.L.L. Kuwait 49% · Lebanon Société pourl'Exportation des Produits Nestlé S.A. Beyrouth 100% · SOHAT Distribution SALHazmieh 49% · Malaysia Nestlé (Malaysia) Bhd. Petaling Jaya 57.5% · NestléFoods (Malaysia) Sdn. Bhd. Petaling Jaya 57.5% · Nestlé Products Sdn. Bhd.Petaling Jaya 57.5% · Nestlé Asean (Malaysia) Sdn. Bhd. Petaling Jaya 50.1% ·Nestlé Cold Storage (Malaysia) Sdn. Bhd. Petaling Jaya 57.5% · Pakistan MilkpakLtd Lahore 58.4% · Philippines Nestlé Philippines, Inc. Cabuyao 100% ·Republic of Korea Nestlé Korea Ltd Cheongju 100% · People's Republic ofChina Nestlé Shuangcheng Ltd Shuangcheng 97% · Nestlé Dongguan Ltd
Nestlé Management Report 1999 | Consolidated Accounts of the Nestlé Group
http://www.nestle.com/investor_relations/mr1999/consolaccts/13/index.htm (2 of 4) [4/27/2001 10:52:49 AM]

Dongguan 100% · Maggi Dongguan Ltd Dongguan 100% · Nestlé Tianjin LtdTianjin 100% · Nestlé Qingdao Ltd Qingdao 100% · Nestlé Shanghai Ltd Shanghai95% · Nestlé Dairy Farm Tianjin Ltd Tianjin 100% · Nestlé Dairy Farm Qingdao LtdQingdao 100% · Nestlé Dairy Farm Guangzhou Ltd Guangzhou 90% · ShanghaiFuller Foods Co. Ltd Shanghai 100% · Shanghai Nestlé Product Services LtdShanghai 97% · Shanghai Totole Flavouring Food Co. Ltd. Shanghai 80% ·Shanghai Jiale Flavouring Food Sales Co. Ltd Shanghai 80% · Nestlé Hong KongLtd Hong Kong 100% · Nestlé Dairy Farm Hong Kong Ltd Hong Kong 100% · Alcon(China) Ophtalmic Product Co., Ltd* Beijing 100% · Singapore Nestlé Singapore(Pte) Ltd Singapore 100% · Sri Lanka Nestlé Lanka Ltd Colombo 90.8% · TaiwanNestlé Taiwan Ltd Taipei 100% · Alcon Pharmaceuticals Ltd* Taipei 100% ·Thailand Nestlé Products (Thailand), Inc. Bangkok 100% · Nestlé Asean(Thailand) Ltd Bangkok 80.1% · Quality Coffee Products Ltd Bangkok 49% · NestléFoods (Thailand) Ltd Bangkok 100% · Nestlé Trading (Thailand) Ltd Bangkok 49%· Nestlé Manufacturing (Thailand) Ltd Bangkok 100% · Nestlé Ice Cream(Thailand) Ltd Bangkok 69% · Nestlé Dairy (Thailand) Ltd* Bangkok 100% · AlconLaboratories (Thailand) Ltd* Bangkok 100% ·Vietnam Nestlé Vietnam Ltd BienHoa 100% · Long An Mineral Water Joint Venture Company Tan An 65%.
OceaniaAustralia Nestlé Australia Ltd Sydney 100% · Petersville Australia Ltd Melbourne100% · Nestlé Echuca Pty Ltd Melbourne 100% · FIS Australia Pty Ltd Sydney100% · Alcon Laboratories (Australia) Pty Ltd* Frenchs Forests (NSW) 100% · FijiNestlé (Fiji) Ltd Ba 67% · New Caledonia Nestlé Nouvelle-Calédonie S.A.Nouméa 100% · New Zealand Nestlé New Zealand Ltd Auckland 100% ·Papua-New Guinea Nestlé (PNG) Ltd Lae 100% · French Polynesia NestléPolynesia S.A. Papeete 100%.
2. Affiliated companies for which the method of proportionate consolidation is used(see "Scope of Consolidation").
EuropeGermany C.P.D. Cereal Partners Deutschland GmbH & Co. OHG Frankfurt 50% ·Galderma Laboratorium GmbH* Freiburg/Breisgau 50% · Spain Cereal PartnersEspaña AEIE Esplugas de Llobregat 50% · Laboratorios Galderma S.A.* Madrid50% · France Cereal Partners France SNC Noisiel 50% · Laboratoires GaldermaS.A.* Levallois–Perret 50% · Poland Torun-Pacific Cereal Partners Poland Sp.zo.o. Torun 50% · Portugal Cereal Associados Portugal AEIE Oeiras 50% ·Sweden Galderma Svenska AB* Bromma 50% · United Kingdom CerealPartners UK Welwyn Garden City 50% · Galderma (U.K.) Ltd* Amersham 50% ·Switzerland CCNR Europe S.A. Lausanne 50%.
AfricaSouth Africa Dairymaid-Nestlé (Pty) Ltd Johannesburg 50%.
AmericasArgentina Galderma Argentina S.A.* Buenos Aires 50% · Brazil Galderma BrasilLtda* São Paulo 50% · Canada Galderma Canada Inc.* Markham 50% · ChileCereales CPW Chile Ltda Santiago de Chile 50% · United States Coca-Cola NestléRefreshments Company, USA Atlanta (Georgia) 50% · Galderma Laboratories,Inc.* Fort Worth (Texas) 50% · Mexico CPW México S.A. de C.V. México 50% ·Galderma Mexico S.A. de C.V.* México 50%.
AsiaPeople's Republic of China Coca-Cola Nestlé Refreshments Pacific Hong Kong50% · Republic of Korea Coca-Cola Nestlé Refreshments Korea Seoul 50% ·Thailand Coca-Cola Nestlé Beverages Thailand Ltd Bangkok 33.7%.
Principal associated companies which operate in the food and water sectors, withthe exception of those marked with an asterisk which are engaged in thecosmetics and dermatology sectors. For which the equity method is used (see"Scope of Consolidation").
EuropeGermany Mineralbrunnen Überkingen-Teinach AG Bad Überkingen 30.11% ·France L'Oréal S.A.* Paris 26.3% · Houdebine S.A. Noyal–Pontivy 50% ·S.B.E.C.M. Société de Bouchages Emballages Conditionnement Moderne S.à.r.l.Lavardac 50%.
Nestlé Management Report 1999 | Consolidated Accounts of the Nestlé Group
http://www.nestle.com/investor_relations/mr1999/consolaccts/13/index.htm (3 of 4) [4/27/2001 10:52:49 AM]

AmericasUnited States Flordian Groves, Inc. Tampa (Florida) 40%.
AsiaMalaysia Premier Milk (Malaysia) Sdn. Bhd. Kuala Lumpur 25%.
Sub-holding, financial and property companiesBahamas Nestlé's Holdings Ltd Nassau 100% · Food Products (Holdings) LtdNassau 100% · United States Nestlé Holdings, Inc. Stamford (Connecticut) 100%· Nestlé Capital Corporation Stamford (Connecticut) 100% · France NestléEntreprises S.A. Noisiel 100% · Nestlé Finance France S.A. Noisiel 100% · PerrierVittel S.A. Paris 100% · Société Immobilière de Noisiel Noisiel 100% · PanamaUnilac, Inc. Panamá City 100% · Poland Nestlé Polska Holding Sp. zo.o.Warszawa 100% · Portugal Nestlé Portugal SGPS, Lda. Linda–a–Velha 100% ·United Kingdom Nestlé Holdings (U.K.) PLC Croydon 100% · Friskies Holding(UK) Ltd Croydon 100% · Switzerland Entreprises Maggi S.A. Kemptthal 100% ·Nestlé Finance S.A. Cham 100% · Rive-Reine S.A. La Tour–de–Peilz 100% · S.I.En Bergère Vevey S.A. Vevey 100% · Alcon Universal S.A.* Hünenberg 100% ·Galderma Pharma S.A.* Lausanne 50%.
Technical assistance, research and development companiesNestec Ltd., Vevey (Switzerland)Technical, scientifc, commercial and business assistance company whose units,specialised in all areas of the business, supply permanent know-how andassistance to operating companies in the Group within the framework of licenceand equivalent contracts. It is also responsible for all scientific research andtechnological development, which it undertakes itself or has done on its behalf byits subsidiary companies. The companies and units involved are:
Research centresFrance Nestlé Research Centre Plant Science Tours · Switzerland NestléResearch Centre Lausanne.
Product Technology Centres and Research & Development centresGermany Nestlé R&D Center Lebensmittelforschung GmbH Weiding · Ivory CoastCentre R&D Nestlé Abidjan · Spain Nestlé R&D Center S.A. Badajoz · UnitedStates Nestlé R&D Center, Inc. Connecticut · Ohio · Friskies Product TechnologyCenter St. Joseph (Missouri) · France Centre R&D Nestlé Beauvais · NestléProduct Technology Centre Lisieux · Centre R&D Friskies S.A. Amiens · GaldermaR&D S.n.c.* Sophia Antipolis · Italy Ricerca & Gelati S.r.l. Parma · MalaysiaNestlé R&D Center Sdn. Bhd. Petaling Jaya · United Kingdom Nestlé ProductTechnology Centre York · Singapore Nestlé R&D Center (Pte) Ltd Singapore ·Sweden Nestlé R&D Center Bjuv A.B. Bjuv · Switzerland Nestlé R&D Center Broc· Kemptthal · Konolfingen · Orbe.
Nestlé Management Report 1999 | Consolidated Accounts of the Nestlé Group
http://www.nestle.com/investor_relations/mr1999/consolaccts/13/index.htm (4 of 4) [4/27/2001 10:52:49 AM]

Nestlé Management Report 1999 | Annual Report of Nestlé S.A.
http://www.nestle.com/investor_relations/mr1999/ar1999/index.htm [4/27/2001 10:53:14 AM]

The General Meeting held on June 3rd 1999 re-elected Mr. Arthur Dunkel for anadditional term of five years. Upon the recommendation of the Board of Directors,Lord Simpson was elected as a new director, also for a term of five years. TheChairman expressed his gratitude to Mr. Robert Studer, who decided to resign as adirector although his term was due to last until 2002.
At its next meeting, the Board of Directors appointed Mr. Helmut O. Maucher asChairman, Messrs. Rainer E. Gut and Fritz Gerber as Vice-Chairmen, Mr. PeterBrabeck-Letmathe as Chief Executive Officer and Mrs. Vreni Spoerry as a memberof the Committee to the Board.
At the General Meeting on May 25th 2000, Mr. Helmut O. Maucher's and Mr. PaulA. Volcker's terms as directors will expire. Pursuant to the provisions of theBoard's regulations concerning the age limit, Messrs. Maucher and Volcker will notbe standing for re-election.
Mr. Maucher was elected to the Board in 1981 as Chief Executive Officer. He wasappointed Chairman in 1990, and held the office of both Chairman and ChiefExecutive Officer until 1997. During his long career of more than 40 years with theGroup, Mr. Maucher devoted his leadership and entrepreneurial qualities to thebenefit of the whole Group which, thanks to these qualities, has become theworld's leading international food company. As well as the economic developmentof the Group, Mr. Maucher enhanced, through his human qualities, its socialcommitment and the development and motivation of its employees. The Boardwishes to express its deepest gratitude to him at the end of this brilliant career.
Mr. Volcker was elected as a member of the Board in 1988. During the last 11years the Board has greatly benefited from Mr. Volcker's pertinent opinions, forwhich they thank him sincerely. On January 1st 2000, Mr. Frank Cella, who hasbeen appointed as a General Manager by the Board of Directors, assumedresponsibility for the Strategic Business Units and Marketing following theretirement of Mr. Philippe Véron, who had been a General Manager since January1st 1993. Throughout 1999, no director had a personal interest in any transactionof significance for the business of the Group.
Nestlé Management Report 1999 | Annual Report
http://www.nestle.com/investor_relations/mr1999/ar1999/01/index.htm [4/27/2001 10:53:24 AM]

In millions of Swiss francs Notes 1999 1998
Income Income from Group companies 1 3 771 3 559Interest income 2 123 497Profit on disposal of fixed assets 3 97 332Other income 16 52
Total Income 4 007 4 440
ExpensesInvestment write downs 4 558 1 170Administration and other expenses 5 126 122Interest expense 6 22 27Provision for uninsured risks 15 15
Total expenses before taxation 721 1 334
Profit before taxation 3 286 3 106Taxation 7 294 284
Profit for the year 19 2 992 2 822
The appropriation of profit proposed by the Board is set out here.
Nestlé Management Report 1999 | Annual Report
http://www.nestle.com/investor_relations/mr1999/ar1999/02/index.htm [4/27/2001 10:53:27 AM]

before appropriations
In millions of Swiss francs Notes 1999 1998
Assets
Current Assets Liquid assets 8 2 845 3 906Debtors 9 3 988 2 508Prepayments and accrued income 44 47
Total Current Assets 6 877 6 461
Fixed assetsFinancial assets 10 11 798 10 353Intangible assets 13 — —Tangible fixed assets 14 — —
Total fixed assets 11 798 10 353
Total assets 18 675 16 814
Liabilities and shareholders' funds
Liabilities Short term creditors 15 196 431Accrued liabilities and deferred income 249 3Long term creditors 16 271 264Provisions 17 990 670
Total liabilities 1 706 1 368
Shareholders' fundsShare capital 18/19 404 404Legal reserves 19 6 392 6 392Special reserve 19 7 180 5 827Retained earnings 19 2 993 2 823
Total shareholders' funds 19 16 969 15 446
Total liabilities and shareholders' funds 18 675 16 814
Nestlé Management Report 1999 | Annual Report
http://www.nestle.com/investor_relations/mr1999/ar1999/03/index.htm [4/27/2001 10:53:30 AM]

Accounting policies
GeneralNestlé S.A. (the Company) is the ultimate holding company of the Nestlé Groupwhich comprises subsidiaries, associated companies and joint ventures throughoutthe world. The accounts are prepared in accordance with accounting principlesrequired by Swiss law. They are also prepared under the historical cost conventionand on the accruals basis. There have been no changes in accounting policiesduring the year.
Foreign currency translationTransactions in foreign currencies are recorded at the rate of exchange at the dateof the transaction or, if hedged forward, at the rate of exchange under the relatedforward contract. Assets and liabilities in foreign currencies are translated at yearend rates. Any resulting exchange differences are included in the respectiveincome statement captions depending upon the nature of the underlyingtransactions. The aggregate unrealised exchange difference is calculated byreference to original transaction date exchange rates and includes hedgingtransactions. Where this gives rise to a net loss, it is charged to the incomestatement whilst a net gain is deferred.
HedgingThe Company uses forward foreign exchange contracts, options, financial futuresand currency swaps to hedge foreign currency flows and positions. Unrealisedforeign exchange differences on hedging instruments are matched and accountedfor with those on the underlying asset or liability. Long term loans, in foreigncurrencies, used to finance investments in participations are generally not hedged.
The Company also uses interest rate swaps to manage interest rate risk. Theswaps are accounted for at fair value at each balance sheet date and changes inthe market value are recorded in the income statement.
Income statementIncome due at the balance sheet date, but not currently transferable is recognisedonly upon receipt. Dividends paid out of pre-acquisition profits are not includedunder income from Group companies; instead they are credited against thecarrying value of the participation, with any remaining balance credited toreserves.
In accordance with Swiss law and the Company's articles of association, dividendsare treated as an appropriation of profit in the year in which they are ratified atthe Annual General Meeting and subsequently paid, rather than as anappropriation of profit in the year to which they relate.
TaxationThis caption includes taxes on profit, capital and withholding taxes on transfersfrom Group companies
Financial assetsThe carrying value of participations and loans comprises the cost of investment,excluding the incidental costs of acquisition, less any write downs.
Participations located in countries where the political, economic or monetarysituation might be considered to carry a greater than normal level of risk arecarried at a nominal value of one franc.
Participations and loans are written down on a conservative basis, taking intoaccount the profitability of the company concerned.
Marketable securities are valued at the lower of cost and market value.
Intangible assets
Nestlé Management Report 1999 | Annual Report
http://www.nestle.com/investor_relations/mr1999/ar1999/05/index.htm (1 of 2) [4/27/2001 10:53:33 AM]

Trademarks and other industrial property rights are written off on acquisition orexceptionally over a longer period. In the Group accounts this item has a differenttreatment (see "Intangible assets" in Consolidated Accounts).
Tangible fixed assetsThe Company owns land and buildings which have been depreciated in the past toone franc. Office furniture and equipment is fully depreciated on acquisition.
ProvisionsProvisions recognise contingencies which may arise and which have beenprudently provided. A provision for uninsured risks is constituted on a Group-widebasis to cover general risks not insured with third parties, such as consequentialloss. Provision for Swiss taxes is made on the basis of the Company's taxablecapital, reserves and profit for the year. A general provision is maintained to coverpossible foreign taxation liabilities.
PensionsEmployees are eligible for retirement benefits under a defined benefit planprovided through separate funds.
For the defined benefit plan the amount charged to the income statement consistsof current service cost which includes the normal cost of financing benefits inrespect of future years of service. If the case arises, variations from the currentservice cost are spread over the expected working lives of employees orrecognised immediately in the case of retirees.
Liabilities arising under the defined benefit scheme are externally funded, with theassets of the scheme held separately from the Company in independentlyadministered funds.
Prepayments and accrued incomePrepayments and accrued income comprise payments made in advance relating tothe following year, and income relating to the current year which will not bereceived until after the balance sheet date (such as interest receivable on loans ordeposits). Revaluation gains on open forward exchange contracts at year endrates are also included in this caption.
Accrued liabilities and deferred incomeAccruals and deferred income comprise expenses relating to the current yearwhich will not be paid until after the balance sheet date and income received inadvance, relating to the following year. Revaluation losses on open forwardexchange contracts at year end rates are also included in this caption.
Nestlé Management Report 1999 | Annual Report
http://www.nestle.com/investor_relations/mr1999/ar1999/05/index.htm (2 of 2) [4/27/2001 10:53:33 AM]
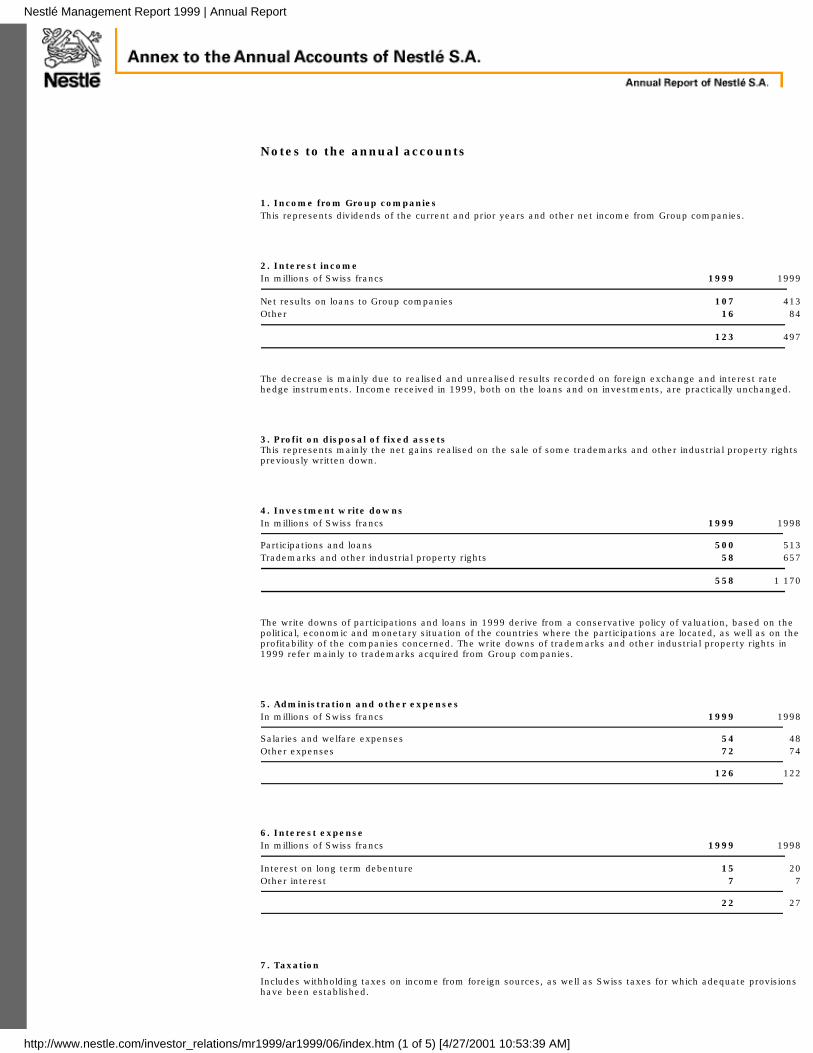
Notes to the annual accounts 1. Income from Group companiesThis represents dividends of the current and prior years and other net income from Group companies.
2. Interest incomeIn millions of Swiss francs 1999 1999
Net results on loans to Group companies 107 413Other 16 84
123 497
The decrease is mainly due to realised and unrealised results recorded on foreign exchange and interest ratehedge instruments. Income received in 1999, both on the loans and on investments, are practically unchanged.
3. Profit on disposal of fixed assetsThis represents mainly the net gains realised on the sale of some trademarks and other industrial property rightspreviously written down.
4. Investment write downsIn millions of Swiss francs 1999 1998
Participations and loans 500 513Trademarks and other industrial property rights 58 657
558 1 170
The write downs of participations and loans in 1999 derive from a conservative policy of valuation, based on thepolitical, economic and monetary situation of the countries where the participations are located, as well as on theprofitability of the companies concerned. The write downs of trademarks and other industrial property rights in1999 refer mainly to trademarks acquired from Group companies.
5. Administration and other expensesIn millions of Swiss francs 1999 1998
Salaries and welfare expenses 54 48Other expenses 72 74
126 122
6. Interest expenseIn millions of Swiss francs 1999 1998
Interest on long term debenture 15 20Other interest 7 7
22 27
7. Taxation Includes withholding taxes on income from foreign sources, as well as Swiss taxes for which adequate provisionshave been established.
Nestlé Management Report 1999 | Annual Report
http://www.nestle.com/investor_relations/mr1999/ar1999/06/index.htm (1 of 5) [4/27/2001 10:53:39 AM]

8. Liquid assetsIn millions of Swiss francs 1999 1998
Cash and cash equivalents 751 2 363Short term investments 1 511 1 250Marketable securities 583 293
2 845 3 906
9. DebtorsIn millions of Swiss francs 1999 1998
Amounts owed by Group companies Short-term treasury loans 3 607 2 246 Current accounts 370 231 Provision for amounts not currently transferable — —
3 977 2 477Other debtors (including withholding tax) 11 31
3 988 2 508
Short-term treasury loans are advanced to Group companies with the intention of investing liquid funds atcompetitive rates, thus replacing external borrowings. The amount owed to the Company in respect of Swisswithholding tax was received after the year-end.
10. Financial assetsIn millions of Swiss francs 1999 1998
Participations in Group companies (see note 11) 7 373 7 112Finance loans to Group companies (see note 12) 4 247 3 112Own shares 178 97Other investments 0 32
11 798 10 353
Own shares of the Company are held in order to allow the exercise of option rights by members of the Group'sManagement (93 009 options were outstanding at the close of 1999, of which 47 478 may be exercised as from1st January 2000 and 12 203 as from 1st February 2000).
11. Participations in Group companiesIn millions of Swiss francs 1999 1998
At 1st January 7 112 7 054)Increase 761 570)Write downs (500) (512)
7 373) 7 112)
The increase in participations represents in particular:— additional funding, through capital increases, of a number of Group companies mainly in People's Republic ofChina and Russia;— the purchase, on the stock exchange or from third parties, of shares of some of our affiliated companies, toincrease the participations already held, mainly in Malaysia;— acquisition of participations in various companies, mainly in People's Republic of China;— the purchase from affiliated companies of certain existing participations.
The carrying value of participations continues to represent a conservative valuation having regard to both theincome received by the Company and the net assets of the Group companies concerned.
A list of the most important companies held, either directly by Nestlé S.A. or indirectly through other Groupcompanies, with the percentage of the capital controlled, is given in the section "Consolidated accounts of theNestlé Group".
A Canadian affiliate has been granted options to purchase shares in certain Group companies situated outsideContinental Europe.
Nestlé Management Report 1999 | Annual Report
http://www.nestle.com/investor_relations/mr1999/ar1999/06/index.htm (2 of 5) [4/27/2001 10:53:39 AM]

12. Finance loans to Group companiesIn millions of Swiss francs 1999 1998
At 1st January 3 112 3 566New loans 1 405 308Repayments and write downs (543) (678)Realised exchange differences 22 46Unrealised exchange differences 251 (130)
At 31st December 4 247 3 112
Finance loans are usually for the long term and finance investments in participations.
13. Intangible assetsAll intangible assets have been fully written off.
14. Tangible fixed assetsThese are principally the land and buildings at Cham and at La Tour-de-Peilz. Nestlé Suisse S.A., the principaloperating company in the Swiss market, is the tenant of the building at La Tour-de-Peilz. The "En Bergère" headoffice building in Vevey is held by a property company, which is wholly owned by Nestlé S.A.
The fire insurance value of buildings, furniture and office equipment amounted to Fr. 22 million at 31st December1999 and 1999.
15. Short term creditorsIn millions of Swiss francs 1999 1998
Amounts owed to Group companies 188 423Other creditors 8 8
196 431
16. Long term creditorsIn millions of Swiss francs 1999 1998
Amounts owed to Group companies 271 264Other creditors — —
271 264
Amounts owed to Group companies include a long-term bond issued in 1989, whose carrying value increased byFr. 30 million to Fr. 271 million as a result of an unrealised exchange difference arising in 1999.
17. ProvisionsIn millions of Swiss francs 1999 1998
Provision for uninsured risks 475 460Provision for exchange risks 327 44Provision for Swiss and foreign taxes 156 140Other provisions 32 26
990 670
The provision for exchange risks includes the unrealised net exchange gains on the revaluation of foreignexchange positions and any associated forward cover at the year-end.
18. Share capital 1999 1998
Number of registered shares of nominal value Fr.10 each 40 352 000 40 352 000In millions of Swiss francs 404 404
Nestlé Management Report 1999 | Annual Report
http://www.nestle.com/investor_relations/mr1999/ar1999/06/index.htm (3 of 5) [4/27/2001 10:53:39 AM]

(a) The general reserve and thereserve for own sharesconstitute the legal reserves.
(b) See note 20
According to article 6 of the Company's articles of association, no natural person or legal entity can be registeredas a shareholder with voting rights for shares held directly or indirectly for more than 3% of the share capital. Inaddition, article 14 provides that, on exercising the voting rights, no shareholder, through shares owned orrepresented, may aggregate, directly or indirectly, more than 3% of the total share capital.
At 31st December 1999, the Share Register showed 174 916 registered shareholders. If unprocessed applicationsfor registration and the indirect holders of shares under American depositary receipts are also taken into account,the total number of shareholders probably exceeds 250 000. The Company was not aware of any shareholderholding, directly or indirectly, 3% or more of the share capital.
Conditional increase in share capital According to the articles of association, the share capital can be increased, by the exercise of conversion oroption rights, by a maximum of Fr. 10 000 000 through the issue of a maximum of 1 000 000 registered shareswith a nominal value of Fr. 10.- each, fully paid-up. Thus the Board of Directors has at its disposal a flexibleinstrument enabling it, if necessary, to finance the activities of the Company through convertible or option loans. 19. Movements in shareholders' funds
In millions of Swiss francsSharecapital
Generalreserve(a)
Reserve for ownshares(a)(b)
Specialreserve
Retainedearnings Total
At 1st January 1999 404) 5 830) 562) 5 827) 2 823) 15 446)Appropriation of profit to special reserve 1 325 ) (1 325)Profit for the year 2 992) 2 992)Dividend for 1998 (1 469) (1 469)Movement of own shares (2 311) 2 311)Dividend on own shares held on the payment date of dividend 1998 26) (26)Dividend on own shares in respect of which the corresponding option rights were not exercised by the payment date of 1998 dividend 2) (2)
404) 3 519) 2 873 ) 7 180) 2 993) 16 969)
20. Reserve for own shares
At 1st January 1999, the reserve for own shares amounting to Fr. 562 million, represented the cost of 928940 shares issued by Nestlé S.A. and acquired by a Group company, as well as 71 210 shares reserved tocover option rights in favor of members of the Group's Management and 111 855 shares held for tradingpurposes.
At 31st December 1999, the shareholding of the Group company was unchanged (928 940 shares at anacquisition cost of Fr. 156.7 million). These shares are available to be used in any way which, in the opinionof the Board of Directors, would be in the best interests of the Company and its shareholders. As long asthese shares are held by the Group company, they will be recorded in the Share Register as being withoutvoting rights and will not rank for dividends.
In 1999, the Company acquired, at a cost of Fr. 96.8 million, 33 492 shares reserved to cover option rights infavor of members of the Group's Management. 11 693 options have been exercised during the year. A totalof 93 009 shares are held to cover outstanding option rights at the balance sheet date. Furthermore, theGroup company that was holding 111 855 shares for trading purposes at 31st December 1999, acquired anadditional 811 490 shares at a cost of Fr. 2 230.2 million. A total of 923 345 shares are held for tradingpurposes by the Group company at the balance sheet date. As long as the options are not exercised, or theshares sold, these shares are also recorded in the Share Register as being without voting rights and do notrank for dividends.
The total of 1 945 294 own shares held at 31st December 1999 represents 4.8% of Nestlé S.A. share capital.
21. Contingencies
At 31st December 1999 and 1999, the total of the guarantees for credit facilities granted to Groupcompanies, together with the buy-back agreements relating to notes issued, amounted to Fr. 3 835 millionand Fr. 5 864 million, respectively.
Nestlé Management Report 1999 | Annual Report
http://www.nestle.com/investor_relations/mr1999/ar1999/06/index.htm (4 of 5) [4/27/2001 10:53:39 AM]

Nestlé Management Report 1999 | Annual Report
http://www.nestle.com/investor_relations/mr1999/ar1999/06/index.htm (5 of 5) [4/27/2001 10:53:39 AM]

(a) The dividends on those sharesfor which the option rights willnot have been exercised by thedate of the dividend paymentwill be transferred to the specialreserve. Dividends on shareswhich are held for tradingpurposes and are still held atthe date of the dividendpayment will also be transferredto the special reserve.
(b) Of the total of Fr. 6 492 756, Fr.142 766 were actually paid asdividends, whilst the balance ofFr. 6 349 990 has beentransferred to the specialreserve.
In Swiss francs 1999 1998
Retained earnings
Balance brought forward 658 341 1 582 712
Profit for the year 2 992 288 841 2 821 688 195
2 992 947 182 2 823 270 907
We propose the following appropriations:
Allocation to the special reserve 1 295 000 000 1 325 000 000
Dividend for 1999, Fr.43.– per share on38 406 706 shares(1998: Fr. 38.– on 39 239 995 shares) 1 651 488 358 1 491 119 810
Dividend for 1999, Fr. 43.– per share on 59 681 shares reserved for the option rights which may be exercised in the year 2000 and on 923 345 shares held for trading purposes(a) (1998: Fr. 38.– on 170 862 shares) 42 270 118 6 492 756(b)
2 988 758 476 2 822 612 566
Balance to be carried forward 4 188 706 658 341
If you accept this proposal, the gross dividend will amount to Fr. 43.- per share. After deduction of the federalwithholding tax of 35%, a net amount of Fr. 27.95 per share will be payable as from Wednesday, 31st May2000 by bank transfer to the shareholder's account or by check, in accordance with instructions received fromthe shareholder.
Cham and Vevey, 24th February 2000The Board of Directors
Nestlé Management Report 1999 | Annual Report
http://www.nestle.com/investor_relations/mr1999/ar1999/07/index.htm [4/27/2001 10:53:48 AM]
to the General Meeting of Nestlé S.A.:
As statutory auditors, we have audited the accounting records and the financialstatements (balance sheet, income statement and annex) of Nestlé S.A. for theyear ended 31st December 1999.
These financial statements are the responsibility of the Board of Directors. Ourresponsibility is to express an opinion on these financial statements based on ouraudit. We confirm that we meet the legal requirements concerning professionalqualification and independence.
Our audit was conducted in accordance with auditing standards promulgated bythe profession, which require that an audit be planned and performed to obtainreasonable assurance about whether the financial statements are free frommaterial misstatement. We have examined on a test basis evidence supporting theamounts and disclosures in the financial statements. We have also assessed theaccounting principles used, significant estimates made and the overall financialstatement presentation. We believe that our audit provides a reasonable basis forour opinion.
In our opinion, the accounting records, financial statements and the proposedappropriation of retained earnings comply with the law and the company's articlesof incorporation.
We recommend that the financial statements submitted to you be approved.
Klynveld Peat Marwick Goerdeler SA
S.R CormackChartered accountant
B. A. MathersChartered accountant
Auditors in chargeLondon and Zurich, 24th February 2000
Nestlé Management Report 1999 | Annual Report
http://www.nestle.com/investor_relations/mr1999/ar1999/08/index.htm [4/27/2001 10:53:51 AM]

Thursday 25th May 2000at 3.00 p.m. at the "Palais de Beaulieu", Lausanne
Agenda 1a Annual report 1999, annual financial statements of the Company and report
of the auditors1b 1999 Consolidated financial statements of the Group and report of the Group
auditors
2 Release of the Board of Directors and of the Management
3 Decision on the appropriation of profits resulting from the balance sheet ofthe Company
Next Ordinary General Meeting:Thursday 5th April 2001 at the "Palais de Beaulieu", Lausanne
Nestlé Management Report 1999 | Annual Report
http://www.nestle.com/investor_relations/mr1999/ar1999/09/index.htm [4/27/2001 10:53:54 AM]

14th April 2000 Announcement of first quarter 2000 sales figures25th May 2000 133rd Ordinary General Meeting, "Palais de Beaulieu",
Lausanne31st May 2000 Payment of the dividend23rd August 2000 Publication of the half-yearly report January/June
200020th October 2000 Announcement of first nine months 2000 sales
figures;
Autumn meeting with the press (Vevey)23rd February 2001 Announcement of 2000 sales figures and results14th March 2001 Press conference (Zurich) 5th April 2001 134th Ordinary General Meeting, "Palais de Beaulieu",
Lausanne
Stock exchange listings of registered shares of Nestlé S.A.
Switzerland: Swiss ExchangeAbroad: Amsterdam, Brussels, Frankfurt, London, Paris, Tokyo,
Vienna
Registered Offices: Nestlé S.A. Nestlé S.A.(Share Transfer Office)
Avenue Nestlé 55 Zugerstrasse 8
CH-1800 Vevey(Switzerland)
CH-6330 Cham(Switzerland)
Telephone(021) 924 21 11
Telephone(041) 785 20 20
For any additional information about the managementreport, please contact:
Nestlé S.A., Investor RelationsAvenue Nestlé 55CH-1800 Vevey (Switzerland)Telephone (021) 924 27 42Telefax (021) 924 28 13E–mail [email protected]
As to information concerning the share register(registrations, transfers, address changes, dividends,etc.), please contact:
Nestlé S.A., Share Transfer OfficeZugerstrasse 8CH-6330 Cham (Switzerland)Telephone (041) 780 20 22Telefax (041) 785 20 24
Nestlé URL: http://www.nestle.com
Nestlé Management Report 1999 | Annual Report
http://www.nestle.com/investor_relations/mr1999/ar1999/10/index.htm (1 of 2) [4/27/2001 10:53:56 AM]

Nestlé Management Report 1999 | Annual Report
http://www.nestle.com/investor_relations/mr1999/ar1999/10/index.htm (2 of 2) [4/27/2001 10:53:56 AM]