netscaler insight center 10 - citrix.com netscaler insight center release notes is now included as a...
TRANSCRIPT

© 1999-2017 Citrix Systems, Inc. All rights reserved. p.1https://docs.citrix.com
Release Notes
FAQs
Supported Software
Overview
Installing NetScaler Insight Center on XenServer
Installing NetScaler Insight Center on VMware ESX
Upgrading NetScaler Insight Center
Accessing NetScaler Insight Center
Adding NetScaler Devices
Enabling Data Collection
Enabling Web Insight Data Collection
Enabling HDX Insight Data Collection
Disabling and Clearing Data Collection
Viewing the Reports
Web Insight Reports
HDX Insight Reports
Managing NetScaler Insight Center
Working with SSL Files
Managing Threshold
Configuring Clock Synchronization
Diagnostics
Troubleshooting Tips
NITRO API
NetScaler Insight Center 10.1
Feb 04 , 2016

© 1999-2017 Citrix Systems, Inc. All rights reserved. p.2https://docs.citrix.com
Obtaining the NITRO Package
How NITRO Works
Java SDK
.NET SDK
REST Web Service

© 1999-2017 Citrix Systems, Inc. All rights reserved. p.3https://docs.citrix.com
Release Notes
May 22, 2015
NetScaler Insight Center is a virtual appliance, running on XenServer or on VMWare ESX that analyses the traff ic f lowingthrough the NetScaler appliances at your site and generates performance reports. It has two main components:
Web Insight delivers data analytics for web applications.
HDX Insight delivers data analytics for XenApp and XenDesktop applications.
Release notes describe the enhancements, changes, bug f ixes, and known issues for a particular release or build of theNetScaler Insight Center software. The release notes are categorized into:
Build 127.10
Build 126.12
Build 125.9
Build 124.13
Build 123.11
Build 122.17
Build 121.10
Build 120.13
Build 119.7
Build 118.7
Main Release 112.15
Note: For release 10.1 build 128.8 onwards, see Maintenance ReleasesThis release provides support for the following major features:
Monitoring CloudBridge 2000, 3000, 4000, and 5000 appliances.
Monitoring NetScaler Gateway appliances deployed in double-hop mode.
Adaptive Threshold Functionality.
Installing NetScaler Insight Center on Microsoft Hyper-V.
Configuring the ICA session timeout value for inactive sessions.
Note: This release does not support monitoring NetScaler Gateway appliances deployed in multi-hop mode.
Build 127.10
Updated: 2014-07-14
The NetScaler Insight Center release notes is now included as a part of NetScaler release notes. See Build 127.10.
Build 126.12
Updated: 2014-06-17
This release notes covers the following fixes and known issues identified in this release.
Bug Fixes
Issue ID 0401514: On an HTTP virtual server, after you enable AppFlow by selecting the expression TRUE and the HTML
Injection box, if you change the policy expression and disable HTML injection, the rewrite and responder policies are still
bound to the load balancing virtual server.
Issue ID 0409885: The report for desktop session count also includes the count of XenApp sessions, which are launched

© 1999-2017 Citrix Systems, Inc. All rights reserved. p.4https://docs.citrix.com
by the user.
Issue ID 0451609: If a NetScaler ADC is deployed in transparent mode for HDX Insight, Citrix Receiver fails to launch the
applications or desktops if use source IP (USIP) is enabled and use subnet IP (USNIP) is disabled.
Issue ID 0452989: If a NetScaler ADC is deployed in transparent mode for HDX Insight, Citrix Receiver fails to launch the
applications or desktops if the appflow policy is not bound to a global bind point.
Issue ID 0456449: On the Dashboard > Web Insight > Applications page, the report for a specif ic application does not
display the client type and client version details.
Issue ID 0453764: On the dashboard, HDX Insight reports do not display the active sessions and also displays an
incorrect value for session launch count.
Known Issues
Issue ID 0368967: In a graph that displays a very low number of data points, the time value displayed on the x-axis
includes milliseconds. The value displayed for milliseconds has no signif icance.
Issue ID 0446120: In some instances, the bar line on a graph appears outside the time points on the x-axis.
Issue IDs 0379876, 0424686, 0437964: The time values on the graphs display overlapping values, mostly in the 5-minute-
interval view.
Issue ID 0385821: When an ICA session is initiated by launching XenDesktop, the user name is displayed along with the
domain name (user-id@domain-name).Issue ID 0386911: When launching n instances of an application, the NetScaler appliance sends n-1 termination records
for the application. Consequently, the HDX Insight node displays only a single instance of this application as active.
Issue ID 0394526: On the Dashboard > Web Insight > Applications page, the values shown when you select Response
Time from the drop-down list can be incorrect.
issue ID 0397236: On the Dashboard > HDX Insight > Users page, the report for user sessions displays incorrect values.
The left pane displays the average values for the entire session, but, the right pane displays the values for the period
selected from the drop-down list.
Issue ID 0399626: In transparent mode, after you initiate a session and launch an application through Citrix Receiver
(Enterprise edition) from a Windows 8 client, the session terminates and resumes when you launch subsequent
applications. Consequently, HDX Insight reports include session termination records.
Issue ID 0409634: All the metrics except bandwidth and hits display the average values.
Issue ID 414160: The following error message appears when NetScaler Insight Center installed on VMware ESX is
powered on or off : The VMware Tools power-on script did not run successfully in this virtual machine. If you have
configured a custom power-on script in this virtual machine, make sure that it contains no errors. You can also submit a
support request to report this issue.
Issue ID 414214: On the HDX Insight reports, a Y-axis value of 0 is sometimes shown at a location higher than the x axis.
Issue ID 0424673: Upgrading NetScaler Insight Center on a VMware ESX server from build 118.7 or 119.7 to build 120.13
or later is not supported. However, upgrading from build 120.13 to later builds is supported.
Workaround: To upgrade to build 120.13 or later build, perform a fresh installation. To retain your existing configurations,
make sure that the IP address of the NetScaler appliance and the IP address of NetScaler Insight Center remain the
same .
Issue ID 0324010: A higher than normal load on NetScaler Insight Center or on the database can cause the afdecoder
subsystem to stop functioning. As a result, NetScaler Insight Center is unable to connect to the database.
Workaround: Restart the appliance by running the following command on the command line interface:
#/etc/rc.d/analyticsd restart
Issue ID 0331944: If no devices have been added to the inventory, the Getting Started wizard is displayed. You cannot

© 1999-2017 Citrix Systems, Inc. All rights reserved. p.5https://docs.citrix.com
access the Configuration tab.
Issue IDs 0333555 and 346171: After you enable appflow on some virtual servers, even though no error message
appears, the Insight column does not display a check box indicating that the feature is enabled.
Workaround: Refresh the screen. If appflow is enabled, the check box in the Insight column is selected.
Issue ID 0350977: When you enable Appflow from NetScaler Insight Center, complex policy expressions are not
accepted. This issue occurs when you directly type the complex expression in the text box.
Workaround: Copy and paste the expression from a Notepad.
Issue IDs 0388096 and 0423109: When you launch XenApp through Citrix Receiver (standard edition), the app launch
duration is not calculated and is shown as zero.
Issue IDs 0388563 and 0438710: The following behavior is seen during a high availability failover on a NetScaler appliance
that has active ICA session applications launched:
--- The applications stop functioning, but are visible on the browser.
--- The Citrix Receiver displays a dialog box, with a message stating that the connection is disconnected.
--- When you click OK on the dialog box, the applications are not displayed anymore.
--- If you launch any fresh applications without re-login, all the previously launched applications will resume with the
previous status.
Issue ID 0388875: When you navigate to Configuration > Inventory and click on a NetScaler IP address, only one page of
load balancing virtual servers is displayed. For example, if you have selected a page size of 25, and the number of load
balancing virtual servers (including those associated with content switching virtual servers) exceeds 25, n-25 load
balancing virtual servers are not displayed.
Issue ID 0402105: The following error can occur when you use an IE8 browser to access NetScaler Insight Center from
XenDesktop 5.6 or XenApp 6.5:
" Object does not support this property or method."
Issue IDs 0404100 and 0404822: The VPN option on the View drop- down list is available for NetScaler 10.0 appliances.
Issue ID 0404204: NetScaler 10 appliances do not support clearing AppFlow configurations from a virtual server.
Issue ID 0404477: If you use Internet Explorer to open Desktop Director on an RDP machine, the graph displays extra
dotted lines even though everything works f ine functionally.
Issue ID 0405853: If AppFlow is enabled for a virtual server on more than one NetScaler Insight Center virtual appliance,
then the clear AppFlow configurations (select Configuration > Inventory > <ipaddress> > Application List > <ipaddress>
>Action > Clear AppFlow Configuration) does not work on the virtual server that has the lowest priority.
Issue ID 0405951: The count of embedded objects displayed in the waterfall chart can be wrong for recurrent page
requests if the NetScaler integrated cache or browser cache is enabled.
Issue ID 0405953: The waterfall chart displays a blank tooltip when you hover over the blank space between the x-axis
and the y-axis.
Issue ID 421657: If the ICMP port used to verify the network reachability of a NetScaler appliance from NetScaler
Insight Center is blocked, the internal routing in NetScaler Insight Center is disrupted and the HDX Insight node is not
displayed on the dashboard.
Build 125.9
Updated: 2014-05-22
This release notes covers the following fixes and known issues identified in this release.

© 1999-2017 Citrix Systems, Inc. All rights reserved. p.6https://docs.citrix.com
Known Issues
Issue ID 0324010: A higher than normal load on NetScaler Insight Center or on the database can cause the afdecoder
subsystem to stop functioning. As a result, NetScaler Insight Center is unable to connect to the database.
Workaround: Restart the appliance by running the following command on the command line interface:
#/etc/rc.d/analyticsd restartIssue ID 0331944: If no devices have been added to the inventory, the Getting Started wizard is displayed. You cannot
access the Configuration tab.
Issue ID 0333555 and 346171: After you enable AppFlow on some virtual servers, even though no error message appears,
the Insight column does not display a check box indicating that the feature is enabled.
Workaround: Refresh the screen. If AppFlow is enabled, the check box in the Insight column is selected.
Issue ID 0350977: When you enable AppFlow from NetScaler Insight Center, complex policy expressions are not
accepted. This issue occurs when you directly type the complex expression in the text box.
Workaround: Copy and paste the expression from a Notepad.
Issue ID 0368967: In a graph that displays a very low number of data points, the time value displayed on the x-axis
includes milliseconds. The value displayed for milliseconds has no signif icance.
Issue ID 0379876: The graphs display overlapping time values, mostly in the 5-minute-interval view.
Issue ID 0385821: When an ICA session is initiated by launching XenDesktop, the user name is displayed along with the
domain name (user-id@domain-name).
Issue ID 0386911: While launching n instances of an application, the NetScaler appliance sends n-1 termination records
for the application. Consequently, the HDX Insight node displays only a single instance of this application as active.
Issue ID 0388096: When you launch XenApp through Citrix Receiver (standard edition), the app launch duration is not
calculated and is shown as zero.
Issue ID 0388875: Only one page of load balancing virtual servers is displayed. For example, if you have selected a page
size of 25, and the number of load balancing virtual servers (including those associated with content switching virtual
servers) exceeds 25, n-25 load balancing virtual servers are not displayed.
Issue ID 0394526: On the Dashboard > Web Insight > Applications page, the values shown when you select ResponseTime from the drop-down list can be incorrect.
Issue ID 0399626: In transparent mode, after you initiate a session and launch an application through Citrix Receiver
(Enterprise edition) from a Windows 8 client, the session terminates and resumes when you launch subsequent
applications. Consequently, HDX Insight reports include session termination records.
Issue ID 0401514: On an HTTP virtual server, after you enable AppFlow by selecting the expression TRUE and the HTML
Injection box, if you change the policy expression and disable HTML injection, the rewrite and responder policies are still
bound to the load balancing virtual server.
Issue ID 0402105: The following error can occur when you use an IE8 browser to access NetScaler Insight Center from
XenDesktop 5.6 or XenApp 6.5:
Object does not support this property or method.
Issue ID 0404100: The VPN option on the View drop-down list is available for NetScaler 10.0 appliances.
Issue ID 0404204: NetScaler 10 appliances do not support clearing AppFlow configurations from a virtual server.
Issue ID 0404477: If you use Internet Explorer to open Desktop Director on an RDP machine, the graph displays extra
dotted lines even though everything works f ine functionally.
Issue ID 0405853: If AppFlow is enabled for a virtual server on more than one NetScaler Insight Center virtual appliance,
the clear AppFlow configurations (Configuration > Inventory > <ipaddress> > Application List > <ipaddress> >Action >
Clear AppFlow Configuration) does not work on the virtual server that has the lowest priority.

© 1999-2017 Citrix Systems, Inc. All rights reserved. p.7https://docs.citrix.com
Issue ID 0405951: The count of embedded objects displayed in the waterfall chart can be wrong for recurrent page
requests if the NetScaler integrated cache or browser cache is enabled.
Issue ID 0405953: The waterfall chart displays a blank tooltip when you hover over the blank space between the x-axis
and the y-axis.
Issue ID 0409885: The report for desktop session count also includes the count of XenApp sessions, which are launched
by the user.
Issue ID 0414214: On the HDX Insight reports, a Y-axis value of 0 is sometimes shown at a location higher than the x
axis.
Issue ID 0414160: The following error message appears when NetScaler Insight Center installed on VMware ESX is
powered on or off : The VMware Tools power-on script did not run successfully in this virtual machine. If you have
configured a custom power-on script in this virtual machine, make sure that it contains no errors.
Issue ID 0424673: Upgrading NetScaler Insight Center on a VMware ESX server from build 118.7 or 119.7 to build 120.13
or later is not supported. However, upgrading from build 120.13 to later builds is supported.
Workaround: To upgrade to 120.13 or later builds, perform a fresh installation. To retain your existing configurations,
make sure that the IP address of the NetScaler appliance and the IP address of NetScaler Insight Center remain the
same.
Issue ID 0421657: If the ICMP port used to verify the network reachability of a NetScaler appliance from NetScaler
Insight Center is blocked, the internal routing in NetScaler Insight Center is disrupted and the HDX Insight node is not
displayed on the dashboard.
Issue ID 0446120: On the HDX Insight reports, the bar in the chart is sometimes shown at a location higher than the X
axis.
Issue ID 0456449: On the Dashboard > Web Insight > Applications page, the report for a specif ic application does not
display the client type and client version details.
Issue ID 0456440: On the Dashboard > HDX Insight > Desktops page, the report for a specif ic user displays the desktop
record for that user, but it does not include the desktop records for all users.
Build 124.13
Updated: 2014-03-19
This release notes covers the following bug fixes and known issues identified in this release.
Bug Fixes
Issue ID 0414155: If you move columns and refresh the page, the column ordering is sometimes reset to default.
Issue ID 0424610: On the dashboard, the table that appears when you navigate toHDX Insight > Gateways might
display a blank desktop name.
Issue ID 0439992: The HDX Insight dashboard displays the host delay as server-side NetScaler delay.
Known Issues
Issue ID 0324010: A higher than normal load on NetScaler Insight Center or on the database can cause the afdecoder
subsystem to stop functioning. As a result, NetScaler Insight Center is unable to connect to the database.
Workaround: Restart the appliance by running the following command on the command line interface:
#/etc/rc.d/analyticsd restartIssue ID 0331944: If no devices have been added to the inventory, the Getting Started wizard is displayed. You cannot
access the Configuration tab.

© 1999-2017 Citrix Systems, Inc. All rights reserved. p.8https://docs.citrix.com
Issue ID 0333555 and 346171: After you enable appflow on some virtual servers, even though no error message appears,
the Insight column does not display a check box indicating that the feature is enabled.
Workaround: Refresh the screen. If appflow is enabled, the check box in the Insight column is selected.
Issue ID 0350977: When you enable Appflow from NetScaler Insight Center, complex policy expressions are not
accepted. This issue occurs when you directly type the complex expression in the text box.
Workaround: Copy and paste the expression from a notepad.
Issue ID 0368967: In a graph that displays a very low number of data points, the time value displayed on the x-axis
includes milliseconds. The value displayed for milliseconds has no signif icance.
Issue ID 0379876: The time values on the graphs display overlapping values, mostly in the 5-minute-interval view.
Issue ID 0385821: When an ICA session is initiated by launching XenDesktop, the user name is displayed along with the
domain name (user-id@domain-name).
Issue ID 0386911: While launching n instances of an application, the NetScaler appliance sends n-1 termination records
for the application. Consequently, the HDX Insight node displays only a single instance of this application as active.
Issue ID 0388096: When you launch XenApp through Citrix Receiver (standard edition), the app launch duration is not
calculated and is shown as zero.
Issue ID 0388875: Only one page of load balancing virtual servers is displayed. For example, if you have selected a page
size of 25, and the number of load balancing virtual servers (including those associated with content switching virtual
servers) exceeds 25, n-25 load balancing virtual servers are not displayed.
Issue ID 0394526: On the Dashboard > Web Insight > Applications page, the values shown when you select ResponseTime from the drop-down list can be incorrect.
Issue ID 0399626: In transparent mode, after you initiate a session and launch an application through Citrix Receiver
(Enterprise edition) from a Windows 8 client, the session terminates and resumes when you launch subsequent
applications. Consequently, HDX Insight reports include session termination records.
Issue ID 0401514: On an HTTP virtual server, after you enable AppFlow by selecting the expression TRUE and the HTML
Injection box, if you change the policy expression and disable HTML injection, the rewrite and responder policies are still
bound to the load balancing virtual server.
Issue ID 0402105: The following error may occur when you access NetScaler Insight Center appliance from XenDexktop
5.6 or XenApp 6.5 using IE8 browser:
Object does not support this property or method.
Issue ID 0404100: The VPN option on the View drop-down list is available for NetScaler 10.0 appliances.
Issue ID 0404204: NetScaler 10 appliances do not support clearing AppFlow configurations from a virtual server.
Issue ID 0404477: If you use Internet Explorer to open Desktop Director on an RDP machine, the graph displays extra
dotted lines even though everything works f ine functionally.
Issue ID 0405853: If AppFlow is enabled for a virtual server on more than one NetScaler Insight Center virtual appliance,
then the clear AppFlow configurations (select Configuration > Inventory > <ipaddress> > Application List > <ipaddress>
>Action > Clear AppFlow Configuration) does not work on the virtual server having the least priority.
Issue ID 0405951: The count of embedded objects displayed in the waterfall chart can be wrong for recurrent page
requests if the NetScaler integrated cache or browser cache is enabled.
Issue ID 0405953: The waterfall chart displays a blank tooltip when you hover over the blank space between the x-axis
and the y-axis.
Issue ID 0409885: The report for desktop session count also includes the count of XenApp sessions, which are launched
by the user.
Issue ID 0414214: On the HDX Insight reports, a Y-axis value of 0 is sometimes shown at a location higher than the x
axis.
© 1999-2017 Citrix Systems, Inc. All rights reserved. p.9https://docs.citrix.com
Issue ID 0414160: The following error message appears when NetScaler Insight Center installed on VMware ESX is
powered on or off : The VMware Tools power-on script did not run successfully in this virtual machine. If you have
configured a custom power-on script in this virtual machine, make sure that it contains no errors.
Issue ID 0424673: Upgrading NetScaler Insight Center on VMware ESX server from build 118.7 or 119.7 to 120.13 or later
builds is not supported. However, upgrade from build 120.13 to later builds is supported.
Workaround: To upgrade to 120.13 or later builds, perform a fresh installation. To retain your existing configurations,
make sure that the IP address of the NetScaler appliance and the IP address of NetScaler Insight Center remain the
same .
Issue ID 0421657: If the ICMP port used to verify the network reachability of a NetScaler appliance from NetScaler
Insight Center is blocked, the internal routing in NetScaler Insight Center is disrupted and the HDX Insight node is not
displayed on the dashboard.
Issue ID 0446120: On the HDX Insight reports, the bar in the chart is sometimes shown at a location higher than the X
axis.
Build 123.11
Updated: 2014-03-19
This release notes covers the following bug fixes and known issues identified in this release.
Enhancements
Issue ID 0431957: On the configuration tab, you can now configure the ICA session timeout value for inactive sessions.
Issue ID 0432702: HDX Insight reports now include details about CloudBridge in an ICA session path.
Bug Fixes
Issue ID 0405849: NetScaler entity names are case insensitive, but NetScaler Insight Center expects the virtual server
names or policy names to be case sensitive.
Issue ID 0412129: The WAN jitter and DC jitter values are not displayed in the NetScaler Insight Center reports.
Issue ID 0424610: On the dashboard, the table that appears when you navigate to HDX Insight > Gateways might
display a blank desktop name.
Issue IDs 0437475 and 0439088: In certain scenarios, if data sent from the XenApp server to the client receiver is
delayed because of network congestion or increased network latency, the client re-transmits the ICA magic string, which
causes the Netscaler Gateway to fail. This failure happens because the NetScaler Gateway was not expecting two
packets containing the magic string.
Issue ID 0439992: The HDX Insight dashboard displays the host delay as server side server-side NetScaler delay.
Known Issues
Issue ID 0324010: A higher than normal load on NetScaler Insight Center or on the database can cause the afdecoder
subsystem to stop functioning. As a result, NetScaler Insight Center is unable to connect to the database.
Workaround: Restart the appliance by running the following command on the command line interface:
#/etc/rc.d/analyticsd restartIssue ID 0331944: If no devices have been added to the inventory, the Getting Started wizard is displayed. You cannot
access the Configuration tab.
Issue ID 0333555 and 346171: After you enable appflow on some virtual servers, even though no error message appears,
the Insight column does not display a check box indicating that the feature is enabled.
© 1999-2017 Citrix Systems, Inc. All rights reserved. p.10https://docs.citrix.com
Workaround: Refresh the screen. If appflow is enabled, the check box in the Insight column is selected.
Issue ID 0350977: When you enable Appflow from NetScaler Insight Center, complex policy expressions are not
accepted. This issue occurs when you directly type the complex expression in the text box.
Workaround: Copy and paste the expression from a notepad.
Issue ID 0368967: In a graph that displays a very low number of data points, the time value displayed on the x-axis
includes milliseconds. The value displayed for milliseconds has no signif icance.
Issue ID 0379876: The time values on the graphs display overlapping values, mostly in the 5-minute-interval view.
Issue ID 0385821: When an ICA session is initiated by launching XenDesktop, the user name is displayed along with the
domain name (user-id@domain-name).
Issue ID 0386911: While launching n instances of an application, the NetScaler appliance sends n-1 termination records
for the application. Consequently, the HDX Insight node displays only a single instance of this application as active.
Issue ID 0388096: When you launch XenApp through Citrix Receiver (standard edition), the app launch duration is not
calculated and is shown as zero.
Issue ID 0388875: Only one page of load balancing virtual servers is displayed. For example, if you have selected a page
size of 25, and the number of load balancing virtual servers (including those associated with content switching virtual
servers) exceeds 25, n-25 load balancing virtual servers are not displayed.
Issue ID 0394526: On the Dashboard > Web Insight > Applications page, the values shown when you select ResponseTime from the drop-down list can be incorrect.
Issue ID 0399626: In transparent mode, after you initiate a session and launch an application through Citrix Receiver
(Enterprise edition) from a Windows 8 client, the session terminates and resumes when you launch subsequent
applications. Consequently, HDX Insight reports include session termination records.
Issue ID 0401514: On an HTTP virtual server, after you enable AppFlow by selecting the expression TRUE and the HTML
Injection box, if you change the policy expression and disable HTML injection, the rewrite and responder policies are still
bound to the load balancing virtual server.
Issue ID 0402105: The following error may occur when you access NetScaler Insight Center appliance from XenDexktop
5.6 or XenApp 6.5 using IE8 browser:
Object does not support this property or method.
Issue ID 0404100: The VPN option on the View drop-down list is available for NetScaler 10.0 appliances.
Issue ID 0404204: NetScaler 10 appliances do not support clearing AppFlow configurations from a virtual server.
Issue ID 0404477: If you use Internet Explorer to open Desktop Director on an RDP machine, the graph displays extra
dotted lines even though everything works f ine functionally.
Issue ID 0405853: If AppFlow is enabled for a virtual server on more than one NetScaler Insight Center virtual appliance,
then the clear AppFlow configurations (select Configuration > Inventory > <ipaddress> > Application List > <ipaddress>
>Action > Clear AppFlow Configuration) does not work on the virtual server having the least priority.
Issue ID 0405951: The count of embedded objects displayed in the waterfall chart can be wrong for recurrent page
requests if the NetScaler integrated cache or browser cache is enabled.
Issue ID 0405953: The waterfall chart displays a blank tooltip when you hover over the blank space between the x-axis
and the y-axis.
Issue ID 0409885: The report for desktop session count also includes the count of XenApp sessions, which are launched
by the user.
Issue ID 0414155: If you move columns and refresh the page, the column ordering is sometimes reset to default.
Issue ID 0414214: On the HDX Insight reports, a Y-axis value of 0 is sometimes shown at a location higher than the x
axis.
Issue ID 0414160: The following error message appears when NetScaler Insight Center installed on VMware ESX is

© 1999-2017 Citrix Systems, Inc. All rights reserved. p.11https://docs.citrix.com
powered on or off : The VMware Tools power-on script did not run successfully in this virtual machine. If you have
configured a custom power-on script in this virtual machine, make sure that it contains no errors.
Issue ID 0424673: Upgrading NetScaler Insight Center on VMware ESX server from build 118.7 or 119.7 to 120.13 or later
builds is not supported. However, upgrade from build 120.13 to later builds is supported.
Workaround: To upgrade to 120.13 or later builds, perform a fresh installation. To retain your existing configurations,
make sure that the IP address of the NetScaler appliance and the IP address of NetScaler Insight Center remain the
same .
Issue ID 0421657: If the ICMP port used to verify the network reachability of a NetScaler appliance from NetScaler
Insight Center is blocked, the internal routing in NetScaler Insight Center is disrupted and the HDX Insight node is not
displayed on the dashboard.
Build 122.17
Updated: 2014-03-19
This release notes covers the following bug fixes and known issues identified in this release.
Enhancements
Issue ID 0392016: HDX Insight reports now include details about session reconnects, client-side retransmissions, and
server-side retransmissions.
Issue ID 0398322: HDX Insight now provides a report about active sessions, grouped by server IP and gateway IP.
Issue ID 0418196: The top-right corner of the page now displays a percentile icon, which you can click to display
percentile values and the highest and lowest values for a selected metric.
Issue ID 0423207: You can now select which columns to show in the tables in the NetScaler Insight Center graphical
user interface (GUI), and you can rearrange the columns. Each user can make his or her changes persistent across his or
her sessions.
Changes
Issue ID 0409634: All the metrics except bandwidth and hits display the average values.
Bug Fixes
Issue ID 0394613: The Total App Launch Count is not displayed when you navigate to Dashboard > HDX Insight >
Gateways and view the summary for a particular user.
Issue ID 0398844: On the Dashboard > HDX Insight > Users page, the report for a specif ic user does not display data for
the Total Application Launch count.
Issue ID 0399329: Even when Appflow is disabled for a virtual server, you can still clear the configurations on the
NetScaler Insight Center by selecting the Clear AppFlow Configurations from the Action list.
Issue ID 0403665: If the values for certain metrics are zero, the graphs display these values incorrectly.
Known Issues
Issue ID 0324010: A higher than normal load on NetScaler Insight Center or on the database can cause the afdecoder
subsystem to stop functioning. As a result, NetScaler Insight Center is unable to connect to the database.
Workaround: Restart the appliance by running the following command on the command line interface:
#/etc/rc.d/analyticsd restart

© 1999-2017 Citrix Systems, Inc. All rights reserved. p.12https://docs.citrix.com
Issue ID 0331944: If no devices have been added to the inventory, the Getting Started wizard is displayed. You cannot
access the Configuration tab.
Issue ID 0333555 and 346171: After you enable appflow on some virtual servers, even though no error message appears,
the Insight column does not display a check box indicating that the feature is enabled.
Workaround: Refresh the screen. If appflow is enabled, the check box in the Insight column is selected.
Issue ID 0350977: When you enable Appflow from NetScaler Insight Center, complex policy expressions are not
accepted. This issue occurs when you directly type the complex expression in the text box.
Workaround: Copy and paste the expression from a notepad.
Issue ID 0368967: In a graph that displays a very low number of data points, the time value displayed on the x-axis
includes milliseconds. The value displayed for milliseconds has no signif icance.
Issue ID 0379876: The time values on the graphs display overlapping values, mostly in the 5-minute-interval view.
Issue ID 0385821: When an ICA session is initiated by launching XenDesktop, the user name is displayed along with the
domain name (user-id@domain-name).
Issue ID 0386911: While launching n instances of an application, the NetScaler appliance sends n-1 termination records
for the application. Consequently, the HDX Insight node displays only a single instance of this application as active.
Issue ID 0388096: When you launch XenApp through Citrix Receiver (standard edition), the app launch duration is not
calculated and is shown as zero.
Issue ID 0388875: Only one page of load balancing virtual servers is displayed. For example, if you have selected a page
size of 25, and the number of load balancing virtual servers (including those associated with content switching virtual
servers) exceeds 25, n-25 load balancing virtual servers are not displayed.
Issue ID 0394526: On the Dashboard > Web Insight > Applications page, the values shown when you select ResponseTime from the drop-down list can be incorrect.
Issue ID 0397258: On the Dashboard > HDX Insight > Users page, the line graph plots might not add up to the summary
shown to the left of the line graph for average bandwidth.
Issue ID 0399626: In transparent mode, after you initiate a session and launch an application through Citrix Receiver
(Enterprise edition) from a Windows 8 client, the session terminates and resumes when you launch subsequent
applications. Consequently, HDX Insight reports include session termination records.
Issue ID 0401514: On an HTTP virtual server, after you enable AppFlow by selecting the expression TRUE and the HTML
Injection box, if you change the policy expression and disable HTML injection, the rewrite and responder policies are still
bound to the load balancing virtual server.
Issue ID 0402105: The following error may occur when you access NetScaler Insight Center appliance from XenDexktop
5.6 or XenApp 6.5 using IE8 browser:
Object does not support this property or method.
Issue ID 0404100: The VPN option on the View drop-down list is available for NetScaler 10.0 appliances.
Issue ID 0404204: NetScaler 10 appliances do not support clearing AppFlow configurations from a virtual server.
Issue ID 0404477: If you use Internet Explorer to open Desktop Director on an RDP machine, the graph displays extra
dotted lines even though everything works f ine functionally.
Issue ID 0405849: NetScaler entity names are case insensitive, but NetScaler Insight Center expects the virtual server
names or policy names to be case sensitive.
Issue ID 0405853: If AppFlow is enabled for a virtual server on more than one NetScaler Insight Center virtual appliance,
then the clear AppFlow configurations (select Configuration > Inventory > <ipaddress> > Application List > <ipaddress>
>Action > Clear AppFlow Configuration) does not work on the virtual server having the least priority.
Issue ID 0405936: After the NetScaler upgrade or downgrade operation, NetScaler Insight Center does not report any
data on the dashboard.

© 1999-2017 Citrix Systems, Inc. All rights reserved. p.13https://docs.citrix.com
Workaround: Restart the NetScaler Insight Center appliance.
Issue ID 0405951: The count of embedded objects displayed in the waterfall chart can be wrong for recurrent page
requests if the NetScaler integrated cache or browser cache is enabled.
Issue ID 0405953: The waterfall chart displays a blank tooltip when you hover over the blank space between the x-axis
and the y-axis.
Issue ID 0409885: The report for desktop session count also includes the count of XenApp sessions, which are launched
by the user.
Issue ID 0412129: The WAN jitter and DC jitter values are not displayed in the NetScaler Insight Center reports.
Issue ID 0414155: If you move columns and refresh the page, the column ordering is sometimes reset to default.
Issue ID 0414214: On the HDX Insight reports, a Y-axis value of 0 is sometimes shown at a location higher than the x
axis.
Issue ID 0414160: The following error message appears when NetScaler Insight Center installed on VMware ESX is
powered on or off : The VMware Tools power-on script did not run successfully in this virtual machine. If you have
configured a custom power-on script in this virtual machine, make sure that it contains no errors.
Issue ID 0417415: If you add a NetScaler appliance to a NetScaler Insight Center setup while ICA sessions are enabled,
NetScaler Insight Center does not report the existing ICA sessions. It reports only the ICA sessions initiated after the
appliance is added.
Issue ID 0424610: On the dashboard, the table that appears when you navigate to HDX Insight > Gateways might
display a blank desktop name.
Issue ID 0424673: Upgrading NetScaler Insight Center on VMware ESX server from build 118.7 or 119.7 to 120.13 or later
builds is not supported. However, upgrade from build 120.13 to later builds is supported.
Workaround: To upgrade to 120.13 or later builds, perform a fresh installation. To retain your existing configurations,
make sure that the IP address of the NetScaler appliance and the IP address of NetScaler Insight Center remain the
same .
Issue ID 0421657: If the ICMP port used to verify the network reachability of a NetScaler appliance from NetScaler
Insight Center is blocked, the internal routing in NetScaler Insight Center is disrupted and the HDX Insight node is not
displayed on the dashboard.
Issue IDs 0437475 and 0439088: In certain scenarios, if data sent from the XenApp server to the client receiver is
delayed because of network congestion or increased network latency, the client re-transmits the ICA magic string, which
causes the Netscaler Gateway to fail. This failure happens because the NetScaler Gateway was not expecting two
packets containing the magic string.
Build 121.10
Updated: 2013-10-25
This release notes covers the following bug fixes and known issues identified in this release.
Enhancements
ENH ID 0404805: NetScaler Insight Center now saves the following:
Granular Data Time to purge
7 seconds data 6 min

© 1999-2017 Citrix Systems, Inc. All rights reserved. p.14https://docs.citrix.com
5 minutes data 65 minutes
Hourly data 25 hours
Daily data 8 days
Weekly data 5 weeks
Bug Fixes
Issue ID 0416889: In some cases, NetScaler Insight Center reports incorrect values for XenApp launch count.
Known Issues
Issue ID 0331944: When there are no devices added in the inventory, the welcome screen is displayed for the
configuration tab along with the dashboard tab which makes it unable to perform any basic configurations.
Issue ID 0333555 and 346171: After you enable appflow on some virtual servers, even though no error message appears,
the check box does not appear in the Insight column .
Workaround: Refresh the screen. If appflow is enabled, the check box in the Insight column is selected.
Issue ID 0350977: When you enable Appflow from NetScaler Insight Center, complex policy expressions are not
accepted. This issue occurs when you directly type the complex expression in the text box.
Workaround: Copy and paste the expression from a notepad.
Issue ID 0368967: In a graph that displays a very low number of data points, the time value displayed on the x-axis
includes milliseconds. The value displayed for milliseconds has no signif icance.
Issue ID 0379876: The time values on the graphs display overlapping values, mostly in the 5-minute-interval view.
Issue ID 0385821: When an ICA session is initiated by launching XenDesktop, the user name is displayed along with the
domain name (user-id@domain-name).
Issue ID 0386911: While launching n instances of an application, the NetScaler appliance sends n-1 termination records
for the application. Consequently, the HDX Insight node displays only a single instance of this application as active.
Issue ID 0388096: When you launch XenApp through Citrix Receiver (standard edition), the app launch duration is not
calculated and is shown as zero.
Issue ID 0388875: Only one page of load balancing virtual servers is displayed. For example, if you have selected a page
size of 25, and the number of load balancing virtual servers (including those associated with content switching virtual
servers) exceeds 25, n-25 load balancing virtual servers are not displayed.
Issue ID 0394526: On the Dashboard > Web Insight > Applications page, the values shown when you select ResponseTime from the drop-down list can be incorrect.
Issue ID 0394613: The Total App Launch Count is not displayed when you navigate to Dashboard > HDX Insight >
Gateways and view the summary for a particular user.
Issue ID 0397258: On the Dashboard > HDX Insight > Users page, the line graph plots might not add up to the summary
shown to the left of the line graph for average bandwidth.
Issue ID 0398844: On the Dashboard > HDX Insight > Users page, the report for a specif ic user does not display data for
Total Application Launch count.
Issue ID 0399626: In transparent mode, after you initiate a session and launch an application through Citrix Receiver

© 1999-2017 Citrix Systems, Inc. All rights reserved. p.15https://docs.citrix.com
(Enterprise edition) from a Windows 8 client, the session terminates and resumes when you launch subsequent
applications. Consequently, HDX Insight reports include session termination records.
Issue ID 0401514: On an HTTP virtual server, after you enable AppFlow by selecting the expression TRUE and the HTML
Injection box, if you change the policy expression and disable HTML injection, the rewrite and responder policies are still
bound to the load balancing virtual server.
Issue ID 0402105: The following error may occur when you access NetScaler Insight Center appliance from XenDexktop
5.6 or XenApp 6.5 using IE8 browser:
Object does not support this property or method.
Issue ID 0404100: The VPN option on the View drop-down list is available for NetScaler 10.0 appliances.
Issue ID 0404204: NetScaler 10 appliances do not support clearing AppFlow configurations from a virtual server.
Issue ID 0404477: If you use Internet Explorer to open Desktop Director on an RDP machine, the graph displays extra
dotted lines even though everything works f ine functionally.
Issue ID 0405849: NetScaler entity names are case insensitive, but NetScaler Insight Center expects the virtual server
names or policy names to be case sensitive.
Issue ID 0405853: If AppFlow is enabled for a virtual server on more than one NetScaler Insight Center virtual appliance,
then the clear AppFlow configurations (select Configuration > Inventory > <ipaddress> > Application List > <ipaddress>
>Action > Clear AppFlow Configuration) does not work on the virtual server having the least priority.
Issue ID 0405936: After the NetScaler upgrade or downgrade operation, NetScaler Insight Center does not report any
data on the dashboard.
Workaround: Restart the NetScaler Insight Center appliance.
Issue ID 0405951: The count of embedded objects displayed in the waterfall chart can be wrong for recurrent page
requests if the NetScaler integrated cache or browser cache is enabled.
Issue ID 0405953: The waterfall chart displays a blank tooltip when you hover over the blank space between the x-axis
and the y-axis.
Issue ID 0409885: The report for desktop session count also includes the count of XenApp sessions, which are launched
by the user.
Issue ID 0412129: The WAN jitter and DC jitter values are not displayed in the NetScaler Insight Center reports.
Issue ID 0414155: If you move columns and refresh the page, the column ordering is sometimes reset to default.
Issue ID 0414214: On the HDX Insight reports, a Y-axis value of 0 is sometimes shown at a location higher than the x
axis.
Issue ID 0414160: The following error message appears when NetScaler Insight Center installed on VMware ESX is
powered on or off : The VMware Tools power-on script did not run successfully in this virtual machine. If you have
configured a custom power-on script in this virtual machine, make sure that it contains no errors. You can also submit a
support request to report this issue.
Issue ID 0417415: If you add a NetScaler appliance to a NetScaler Insight Center setup while ICA sessions are enabled,
NetScaler Insight Center does not report the existing ICA sessions. It reports only the ICA sessions initiated after the
appliance is added.
Build 120.13
Updated: 2013-10-18
This release notes covers the following bug fixes and known issues identified in this release.
Fixes
Issue ID 0369664: For an Active session, data is sent to the AppFlow collector even if the policy rule is changed to FALSE

© 1999-2017 Citrix Systems, Inc. All rights reserved. p.16https://docs.citrix.com
when the session is active.
Issue ID 0395022: On the Dashboard > HDX Insight > Users page, the Active Apps count is not updated instantly on the
left pane.
Issue ID 0402458: If the memory usage on the NetScaler Insight Center reaches the maximum limit, the appliance fails
to respond to further memory-allocation requests by other modules and becomes unresponsive.
Issue ID 0402727: If you have installed NetScaler Insight Center virtual appliance on ESX, then the console may display
watchdog timeout errors or the Graphical User Interface (GUI) may freeze sometimes.
Issue ID 0402959: In certain situations, the NetScaler appliance incorrectly interprets the compression buffer size
negotiation between the client and the server, and enabling AppFLow on the ICA connection causes the appliance to
fail when the connection is used to launch an application or desktop. This problem most commonly occurs when a
CloudBridge appliance or any WAN optimization device is placed between the client and the NetScaler appliance.
Issue ID 0405818/ 0405273: On the Dashboard > Users page, ICA RTT values displayed on the graph in the left panel do
not match the values displayed below the graph, or there is a delay in the updating the values.
Issue ID 0408495: During installation of a virtual NetScaler Insight Center on VMware ESX, NetScaler Insight allocates
only 14 GB of space in the var directory, even though the OVF f ile specif ies 120 GB.
Issue ID 0411107: In a mixed XenApp/XenDesktop server farm, if the XenApp and XenDesktop versions are older than 6.5
and 5.0 respectively, the applications fail to launch because the NetScaler appliance incorrectly parses the ICA packets.
Issue ID 0413016/0414140 : NetScaler appliance may fail to respond when AppFlow is enabled on the NetScaler Insight
Center and the user tries to access the XenApp/XenDesktop farm.
Issue ID 0414844: HDX Insight does not support XenApp versions earlier than 6.5.
Issue ID 0415812: If a CloudBridge appliance is placed between the client and a NetScaler appliance, and AppFlow is
enabled for ICA traff ic, the XenApp/XenDesktop applications fail to launch and the NetScaler appliance fails.
Issue ID 0413657: In some situations, the NetScaler appliance fails after parsing ICA traff ic incorrectly.
Known Issues
Issue ID 0331944: When there are no devices added in the inventory, the welcome screen is displayed for the
configuration tab along with the dashboard tab which makes it unable to perform any basic configurations.
Issue ID 0350977: When you enable Appflow from NetScaler Insight Center, complex policy expressions are not
accepted. This issue occurs when you directly type the complex expression in the text box.
Workaround: Copy and paste the expression from a notepad.
Issue ID 0368967: In a graph that displays a very low number of data points, the time value displayed on the x-axis
includes milliseconds. The value displayed for milliseconds has no signif icance.
Issue ID 0379876: The time values on the graphs display overlapping values, mostly in the 5-minute-interval view.
Issue ID 0385821: When an ICA session is initiated by launching XenDesktop, the user name is displayed along with the
domain name (user-id@domain-name).
Issue ID 0386911: While launching n instances of an application, the NetScaler appliance sends n-1 termination records
for the application. Consequently, the HDX Insight node displays only a single instance of this application as active.
Issue ID 0388096: When you launch XenApp through Citrix Receiver (standard edition), the app launch duration is not
calculated and is shown as zero.
Issue ID 0388875: Only one page of load balancing virtual servers is displayed. For example, if you have selected a page
size of 25, and the number of load balancing virtual servers (including those associated with content switching virtual
servers) exceeds 25, n-25 load balancing virtual servers are not displayed.
Issue ID 0394526: On the Dashboard > Web Insight > Applications page, the values shown when you select ResponseTime from the drop-down list can be incorrect.
Issue ID 0394613: The Total App Launch Count is not displayed when you navigate to Dashboard > HDX Insight >

© 1999-2017 Citrix Systems, Inc. All rights reserved. p.17https://docs.citrix.com
Gateways and view the summary for a particular user.
Issue ID 0397258: On the Dashboard > HDX Insight > Users page, the line graph plots might not add up to the summary
shown to the left of the line graph for average bandwidth.
Issue ID 0398844: On the Dashboard > HDX Insight > Users page, the report for a specif ic user does not display data for
Total Application Launch count.
Issue ID 0399626: In transparent mode, after you initiate a session and launch an application through Citrix Receiver
(Enterprise edition) from a Windows 8 client, the session terminates and resumes when you launch subsequent
applications. Consequently, HDX Insight reports include session termination records.
Issue ID 0401514: On an HTTP virtual server, after you enable AppFlow by selecting the expression TRUE and the HTML
Injection box, if you change the policy expression and disable HTML injection, the rewrite and responder policies are still
bound to the load balancing virtual server.
Issue ID 0402105: The following error may occur when you access NetScaler Insight Center appliance from XenDexktop
5.6 or XenApp 6.5 using IE8 browser:
Object does not support this property or method.
Issue ID 0403665: If the values for certain metrics are zero, the graphs display these values incorrectly.
Issue ID 0404100: The VPN option on the View drop-down list is available for NetScaler 10.0 appliances.
Issue ID 0404204: NetScaler 10 appliances do not support clearing AppFlow configurations from a virtual server.
Issue ID 0404477: If you use Internet Explorer to open Desktop Director on an RDP machine, the graph displays extra
dotted lines even though everything works f ine functionally.
Issue ID 0405849: NetScaler entity names are case insensitive, but NetScaler Insight Center expects the virtual server
names or policy names to be case sensitive.
Issue ID 0405853: If AppFlow is enabled for a virtual server on more than one NetScaler Insight Center virtual appliance,
then the clear AppFlow configurations (select Configuration > Inventory > <ipaddress> > Application List > <ipaddress>
>Action > Clear AppFlow Configuration) does not work on the virtual server having the least priority.
Issue ID 0405936: After the NetScaler upgrade or downgrade operation, NetScaler Insight Center does not report any
data on the dashboard.
Workaround: Restart the NetScaler Insight Center appliance.
Issue ID 0405951: The count of embedded objects displayed in the waterfall chart can be wrong for recurrent page
requests if the NetScaler integrated cache or browser cache is enabled.
Issue ID 0405953: The waterfall chart displays a blank tooltip when you hover over the blank space between the x-axis
and the y-axis.
Issue ID 0409885: The report for desktop session count also includes the count of XenApp sessions, which are launched
by the user.
Issue ID 0412129: The WAN jitter and DC jitter values are not displayed in the NetScaler Insight Center reports.
Issue ID 0424673: Upgrading NetScaler Insight Center on VMware ESX from build 118.7 or 119.7 to 120.13 is not
supported.
Workaround: To upgrade to build 120.13, perform a fresh installation. To retain your existing configurations, make sure
that the IP address of the NetScaler appliance and the IP address of NetScaler Insight Center remain the same.
Build 119.7
Updated: 2013-08-29
This release notes covers the following bug fixes and known issues identified in this release.
Enhancements
© 1999-2017 Citrix Systems, Inc. All rights reserved. p.18https://docs.citrix.com
ENH ID 0400867: HDX Insight reports now include details about Client Side NS Latency, Server Side NS Latency and
Host Delay.
Fixes
Issue ID 0332854: Unable to add the IP address in the inventory which contains the number 255 in any quadrant.
Issue ID 0400545: The help page on the Graphical User Interface (GUI) displays incorrect information for enabling data
collection.
Issue ID 0400665: The HDX Insight node is not displayed for Enterprise licenses of NetScaler appliances.
Issue ID 0400900: The load time and render time metrics are not displayed for standard or enterprise licenses of
NetScaler appliances.
Issue ID 0405177: During an ICA session, the NetScaler appliance fails to respond when you access it's invalid memory
space.
Issue ID 0403134/0403195: During an ICA session, the NetScaler appliance fails to respond due to a NULL pointer
access.
Known Issues
Issue ID 0331944: When there are no devices added in the inventory, the welcome screen is displayed for the
configuration tab along with the dashboard tab which makes it unable to perform any basic configurations.
Issue ID 0369664: In HDX Insight mode, data is sent to the AppFlow collector even if the policy rule is set to FALSE.
Workaround: Start the session again.
Issue ID 0379876: The time values on the graphs display overlapping values, mostly in the 5-minute-interval view.
Issue ID 0385821: When an ICA session is initiated by launching XenDesktop, the user name is displayed along with the
domain name (user-id@domain-name).
Issue ID 0386911: While launching n instances of an application, the NetScaler appliance sends n-1 termination records
for the application. Consequently, the HDX Insight node displays only a single instance of this application as active.
Issue ID 0388096: In transparent mode, when you launch XenApp through Citrix Receiver (standard edition), the app
launch duration is shown as zero.
Issue ID 0388875: If the number of load balancing virtual servers (including those associated with content switching
virtual servers) exceeds 25, and the page size is set to 25, only the f irst 25 virtual servers are shown. The list does not
continue on another page.
Issue ID 0394526: On the Dashboard > Web Insight > Applications page, the values shown when you select ResponseTime from the drop-down list can be incorrect.
Issue ID 0394613: The Total App Launch Count is not displayed when you navigate to Dashboard > HDX Insight >
Gateways and view the summary for a particular user.
Issue ID 0395022: On the Dashboard > HDX Insight > Users page, the Active Apps count is not updated instantly on the
left pane.
Workaround: The correct value is displayed in the Dashboard > HDX Insight > Applications page.
Issue ID 0397236 :On the Dashboard > HDX Insight > Users page, the report for user sessions displays incorrect values.
The left pane displays the average values for the entire session, but, the right pane displays the values for the period
selected from the drop-down list.
Issue ID 0397258: On the Dashboard > HDX Insight > Users page, the line graph plots might not add up to the summary
shown to the left of the line graph for average bandwidth.
Issue ID 0398844: On the Dashboard > HDX Insight > Users page, the report for a specif ic user does not display data for
Total Application Launch count.

© 1999-2017 Citrix Systems, Inc. All rights reserved. p.19https://docs.citrix.com
Issue ID 0399626: In transparent mode, after you initiate a session and launch an application through Citrix Receiver
(Enterprise edition) from a Windows 8 client, the session terminates and resumes when you launch subsequent
applications. Consequently, HDX Insight reports display session termination records.
Issue ID 0401514: On an HTTP virtual server, after you enable AppFlow by selecting the expression TRUE and the HTML
Injection box, if you change the policy expression and disable HTML injection, the rewrite and responder policies are still
bound to the load balancing virtual server.
Issue ID 0404204: NetScaler 10 appliances do not support clearing AppFlow configurations from a virtual server.
Issue ID 402105: The following error may occur when you access NetScaler Insight Center appliance from XenDexktop
5.6 or XenApp 6.5 using IE8 browser:
Object does not support this property or method.
Issue ID 0402458: If the analytics decoding process requires more than 100% of RAM memory, the system fails to
respond to further memory-allocation requests by other modules.
Issue ID 0402727: If you have installed NetScaler Insight Center virtual appliance on ESX, then the console may display
watchdog timeout errors or the Graphical User Interface (GUI) may freeze sometimes.
Issue ID 0403665: If the values for certain metrics are zero, the graphs display these values incorrectly.
Issue ID 0404477: If you use Internet Explorer to open Desktop Director on an RDP machine, the graph displays extra
dotted lines even though everything works f ine functionally.
Issue ID 0405953: The waterfall chart displays a blank tooltip when you hover over the blank space between the x-axis
and the y-axis.
Issue ID 0405818/ 0405273: On the Dashboard > Users page, ICA RTT values displayed on the graph in the left panel do
not match the values displayed below the graph, or there is a delay in the updating the values.
Issue ID 0404100: The VPN option on the View drop-down list is available for NetScaler 10.0 appliances.
Issue ID 0405849: Sometimes, the commands used in the NetScaler Insight Center command line interface are case
sensitive.
Issue ID 0405853: If AppFlow is enabled for a virtual server on more than one NetScaler Insight Center virtual appliance,
then the clear AppFlow configurations (select Configuration > Inventory > <ipaddress> > Application List > <ipaddress>
>Action > Clear AppFlow Configuration) does not work on the virtual server having the least priority.
Issue ID 0405936 : If the NetScaler Insight Center virtual appliance remains inactive for a longer duration, the data will
not be logged.
Workaround: Restart the appliance by running the following command on the command line interface:
#/etc/rc.d/analyticsd restartIssue ID 0408495: During installation of a virtual NetScaler Insight Center on VMware ESX, NetScaler Insight allocates
only 14 GB of space in the var directory, even though the OVF f ile specif ies 120 GB.
Build 118.7
Updated: 2013-10-03
This release notes covers the following bug fixes and known issues identified in this release.
Enhancements
ENH ID 0341904: NetScaler Insight Center supports clearing AppFlow configurations from a virtual server.
ENH ID 0381072: NetScaler Insight Center supports sending syslog messages to an external syslog server.
ENH ID 0388409: On the Dashboard > HDX Insight > Users > <user name> page, the application and gateway reports
display the active applications by default.
ENH ID 0392732: The HTML Injection feature is now available for Web Insight data collection on platinum licenses of

© 1999-2017 Citrix Systems, Inc. All rights reserved. p.20https://docs.citrix.com
NetScaler 10.0 appliances and on all licenses of NetScaler 10.1 appliances.
Changes and Fixes
In this release, the following issues have been f ixed:Issue IDs 0377737 and 0365977: NetScaler Insight Center appliance fails to respond.
Issue ID 0378044: On the Configuration > Inventory > Application List page, the values for number of applications
displayed and total number of applications can be incorrect.
Issue ID 0378652: The Page analysis button is in the wrong place and not functional on the Dashboard > Web Insight >
URL page.
Issue ID 0381522: On the Dashboard > HDX Insight > Applications page, the Total Session Launch count displays an
incorrect number of sessions launched.
Issue ID 0385895: The graph of user applications, which appears when you navigate to Dashboard > HDX Insight > Users
<username> > <sessionID> >Applications > More <application name>, is incorrectly plotted.
Issue ID 0386543: No graph is plotted for users on the page that appears when you click the Dashboard > HDX Insight >
Users <username> > <SessionID> > Applications > More button.
Issue ID 0387257: The introduction that appears when you log on to a new NetScaler Insight Center appliance provides
only Web Insight information. It does not provide information about HDX Insight.
Issue ID 0388093: When the Dashboard tab displays reports, the text that appears when you on click the orange icon
beside a metric does not accurately describe the licensing issue.
Issue ID 0388453: On the Configuration > Inventory > Application List page, after you right-click a VPN application and
select Enable AppFlow, then clear the ICA check-box and click Enable AppFlow, AppFlow is shown enabled, but no data
is collected and therefore no reports are displayed on the Dashboard > HDX Insight page.
Issue ID 0388650: NetScaler appliance crashes when AppFlow is enabled on the virtual servers from Netscaler Insight
Center appliance.
Issue ID 0390581: On the Dashboard tab, in some cases, the breadcrumb navigation does not display any text for labels.
Issue ID 0391336: The HDX Insight node appears even if all NetScaler appliances have only standard licenses. The node is
supposed to appear only when at least one appliance has an Enterprise or Platinum license.
Issue ID 0391477: You cannot enable Appflow on a VPN application for which you have specif ied an expression from
the drop-down list.
Issue ID 0392515: Data collection cannot be enabled on virtual servers (load balancing, content switching, or VPN) that
have space characters in their names.
Known Issues
Issue ID 0369664: In HDX Insight mode, data is sent to the AppFlow collector even when the policy rule is set to FALSE.
Workaround: Start the session again.
Issue ID 0379876: The time values on the graphs display overlapping values, mostly in the 5-minute-interval view.
Issue ID 0385821: When an ICA session is initiated by launching XenDesktop, the user name is displayed along with the
domain name (user-id@domain-name).
Issue ID 0386911: While launching n instances of an application, the NetScaler appliance sends n-1 termination records
for the application. Consequently, the HDX Insight node displays only a single instance of this application as active.
Issue ID 0388096: In transparent mode, when you launch XenApp through Citrix Receiver (standard edition), the app
launch duration is shown as zero.
Issue ID 0388875: If the number of load balancing virtual servers (including those associated with content switching
virtual servers) exceeds 25, and the page size is set to 25, only the f irst 25 virtual servers are shown. The list does not

© 1999-2017 Citrix Systems, Inc. All rights reserved. p.21https://docs.citrix.com
continue on another page.
Issue ID 0394526: On the Dashboard > Web Insight > Applications page, the values shown when you select ResponseTime from the drop-down list can be incorrect.
Issue ID 0394613: The Total App Launch Count is not displayed when you navigate to Dashboard > HDX Insight >
Gateways and view the summary for a particular user.
Issue ID 0395022: On the Dashboard > HDX Insight > Users page, the Active Apps count is not updated instantly on the
left pane.
Workaround: The correct value is displayed in the Dashboard > HDX Insight > Applications page.
Issue ID 0397236 :On the Dashboard > HDX Insight > Users page, the report for user sessions displays incorrect values.
The left pane displays the average values for the entire session, but, the right pane displays the values for the period
selected from the drop-down list.
Issue ID 0397258: On the Dashboard > HDX Insight > Users page, the line graph plots might not add up to the summary
shown to the left of the line graph for average bandwidth.
Issue ID 0398844: On the Dashboard > HDX Insight > Users page, the report for a specif ic user does not display data for
Total Application Launch count.
Issue ID 0399626: In transparent mode, after you initiate a session and launch an application through Citrix Receiver
(Enterprise edition) from a Windows 8 client, the session terminates and resumes when you launch subsequent
applications. Consequently, HDX Insight reports display session termination records.
Issue ID 0400545: The help page on the Graphical User Interface (GUI) displays incorrect information for enabling data
collection.
Workaround: To view the details, click the help icon in the graphical user interface when the help page opens, click on the
TOC tab and navigate to NetScaler Insight Center 10.1 > Enabling Data Collection.
Issue ID 0400665: The HDX Insight node is not displayed for Enterprise licenses of NetScaler appliances.
Issue ID 0400900: The load time and render time metrics are not displayed for Standard Licenses of NetScaler
appliances.
Issue ID 0402727: If you have installed NetScaler Insight Center virtual appliance on ESX, then the console may display
watchdog timeout errors or the Graphical User Interface (GUI) may freeze sometimes.
Issue ID 0408495: During installation of a virtual NetScaler Insight Center on VMware ESX, NetScaler Insight allocates
only 14 GB of space in the var directory, even though the OVF f ile specif ies 120 GB.
Build 112.15 (Main Release)
Updated: 2013-07-19
This release notes covers the following known issues identified in NetScaler Insight Center release 10.1.
Web and HDX Insight
Issue ID 0377737 and 0365977: NetScaler Insight Center appliance fails to respond.
Workaround: Stop and restart the processes. From the shell:
1. Change directory to /etc/rc.d.
2. Stop processes by executing analyticsd stop.
3. Start processes by executing analyticsd start .
Issue ID 0378044: On the Configuration > Inventory > Application List page, the value for number of applications
displayed and total number of applications can be incorrect.
Issue ID 0388093: On the Dashboard tab, the text that appears when you click the orange icon beside a metric does not
© 1999-2017 Citrix Systems, Inc. All rights reserved. p.22https://docs.citrix.com
accurately describe the licensing issue.
Workaround: Click the Learn More button to get more information about the issue.
Issue ID 0390581: Data collection cannot be enabled on applications (load balancing, content switching or VPN) that
have space characters in their names.
Issue ID 0387257: The introduction that appears when you log on to a new NetScaler Insight Center appliance provides
only Web Insight information. It does not provide information related to HDX Insight.
Web Insight
Issue ID 0378652: The Page Analysis button is in the wrong place and not functional on the Dashboard > Web Insight >
URL page.
Issue ID 0388875: If the number of load balancing virtual servers (including those associated with content switching
virtual servers) exceeds 25, and the page size is set to 25, only the f irst 25 virtual servers are shown. The list does not
continue on another page.
HDX Insight
Issue ID 0381522: On the Dashboard > HDX Insight > Applications page, the Total Session Launch count displays an
incorrect number of sessions launched.
Issue ID 0385895: The graph is incorrectly plotted for user applications. This issue is observed on navigating to
Dashboard > HDX Insight > Users > <user name> > < sessionID> > Applications > More > < application name>.
Issue ID 0386543: The graph is not plotted for user applications. This issue is observed upon navigating to Dashboard >
HDX Insight > Users > < sessionID> > Applications > More button.
Issue ID 0388453: On the Configuration > Inventory > Application List page, click a VPN virtual server, and select Enable
AppFlow from the Action drop-down list. When you uncheck the ICA check-box and click Enable AppFlow , you will see
AppFlow enabled but no data is collected and therefore no reports are displayed in the Dashboard > HDX Insight page.
Issue ID 0391336: The HDX Insight node appears even when all NetScaler appliances have only standard licenses. The
node is supposed to be visible only when at least one appliance has an Enterprise or Platinum license.
Issue ID 391477: You cannot enable Appflow on a VPN application for which you have selected an expression from the
drop-down list.
Workaround: Manually set the expression for the VPN application to TRUE, or select a different expression.

© 1999-2017 Citrix Systems, Inc. All rights reserved. p.23https://docs.citrix.com
FAQs
Jun 13, 2016
Basic Information
What is NetScaler Insight Center?NetScaler Insight Center is a reporting and monitoring tool that collects AppFlow traffic generated across NetScaler ADCs and generatesreports.
What are the main components of NetScaler Insight Center support?NetScaler Insight Center combines Web Insight for HTTP analytics and HDX Insight for ICA visibility.
Is NetScaler Insight Center hardware or sof tware?NetScaler Insight Center is a virtual appliance designed to be installed on a XenServer hypervisor or VMware ESX. Currently, only single serverdeployment is supported on all platforms. For scale-out deployment, see Installing NetScaler Insight Center Scale-Out Deployment.
What conf igurations do I have to verify on the XenApp or XenDesktop server?On a XenApp or XenDesktop server running version 6.5, if you require RTT calculations for idle connections, then make sure that the ICA roundtrip calculations for Idle Connections option is enabled for NetScaler Insight Center. If the option is disabled, enable it and execute thegpupdate command.Note: The RTT calculation interval should be less than 60 seconds. By default, it is set to 30 seconds.
What type of reports does NetScaler Insight Center generate?NetScaler Insight Center generates analytical reports, from which users can view the performance of applications, identify problem areas, andintelligently troubleshoot issues with performance and access.
Is there any physical connection required between the NetScaler appliances to be monitored and the XenServer?No.
How do I specify the NetScaler appliances to be monitored by NetScaler Insight Center?You add the NetScaler appliances to the NetScaler Insight Center Inventory list. To do so, you have to specify the IP address, user name, andpassword of the NetScaler appliance.
After I add the NetScaler appliance, does NetScaler Insight Center start collecting information?No. You must first enable AppFlow on CloudBridge devices or on the applications managed by the NetScaler appliance. When you enableAppFlow, you should specify an expression to identify the traffic for which the NetScaler appliance will generate AppFlow records.
Should I access the individual NetScaler appliance for enabling AppFlow?No. All configuration is done from the NetScaler Insight Center user interface, which lists the virtual servers for a specific NetScaler appliance.In addition, for HDX Insight, ICA ports can be configured at a global level so that traffic flowing to these ports is inspected and Appflow recordsare generated.
Are all virtual servers on a NetScaler appliance listed for enabling AppFlow?Currently, the NetScaler Insight Center user interface lists the load balancing, content switching, VPN, and NetScaler Gateway virtual serversfor enabling AppFlow.
Should the virtual server be UP when you enable AppFlow on it?Yes. To verify that the virtual server is UP, you can view its operational status on the NetScaler Insight Center user interface.
After I integrate NetScaler Insight Center with Desktop Director, Desktop Director does not display any records in myChrome browser. What should I do?If Desktop Director does not display any records, make sure that both Desktop Director and NetScaler Insight Center have either HTTPS orHTTP enabled. For details about NetScaler Insight Center configurations, see Modifying System Security Settings.
Q. How do I attach an additional disk to NetScaler Insight Center?
To attach an additional disk to NetScaler Insight Center:

© 1999-2017 Citrix Systems, Inc. All rights reserved. p.24https://docs.citrix.com
1. Shut down the NetScaler Insight Center virtual machine.2. In the hypervisor, attach an additional disk of the required disk size to NetScaler Insight Center virtual machine.
For example, for a NetScaler Insight Center virtual machine of 120 GB, if you want to increase its disk space to 200 GB, you then need toattach a disk space of 200 GB instead of 80 GB. Newly attached 200 GB of disk space will be used to store Database data, NetScalerInsight Center log files. The existing 120 GB disk space will be used to store core files, Operating system log files, and so on.
3. Start the NetScaler Insight Center virtual machine.
NetScaler Appliance Specifications
Is there any specif ication for a NetScaler appliance to be monitored?
Yes, only NetScaler nCore appliances running version 9.3 or later software can be monitored. In addition, for HDX Insight,
only Netscaler appliances running version 10.1 software can be monitored.
Can I add NetScaler appliances running dif ferent licenses?
Any nCore appliances running software version 9.3 or later build can be monitored by NetScaler Insight Center. However,
the full set of counters and reports are generated only for Platinum-licensed NetScaler 10.1 appliances.
Can NetScaler Insight Center monitor a NetScaler high availability setup?
Yes.NetScaler Insight Center can monitor appliances in a high availability setup. Citrix recommends that you add both the
appliances (primary and secondary) to the NetScaler Insight Center appliance. When the primary appliance fails, the
secondary appliance generates the performance reports. You do not have to explicitly enable AppFlow on the secondary
appliance.
Can a NetScaler cluster be monitored by NetScaler Insight Center?
No. NetScaler Insight Center does not support cluster nodes.
CloudBridge Appliance Specifications
Which version of NetScaler Insight Center can I use to monitor CloudBridge appliances?
CloudBridge monitoring is supported on NetScaler Insight Center release 10.5 build 51.10 and later.
Which CloudBridge appliances can I monitor using NetScaler Insight Center?
Only CloudBridge datacenter appliances (CloudBridge 2000, 2000WS, 3000, 4000, and 5000) can be monitored by NetScaler
Insight Center.
Which version of CloudBridge software is supported by NetScaler Insight Center?
The CloudBridge version supported is 7.3.0 build 194 and later.
Does NetScaler Insight Center monitor both CloudBridge datacenter appliances and branch off ice appliances?
NetScaler insight Center only monitors the CloudBridge datacenter appliances.
However, CloudBridge datacenter appliances aggregate information from the CloudBridge branch-office appliances.
What CloudBridge deployment modes are supported by NetScaler Insight Center?
Supported Deployments Unsupported Deployments
Inline Mode
Virtual Inline Mode (WCCP mode and PBR mode)
High- Availability Mode (Only the primary node sends records)
Group Mode

© 1999-2017 Citrix Systems, Inc. All rights reserved. p.25https://docs.citrix.com
What are the minimum XenApp or XenDesktop versions and Citrix Receiver versions required by NetScaler InsightCenter to monitor CloudBridge appliances?
Table 1. XenApp/XenDesktop Versions and builds
Product HDX Insight
XenApp 6.5, build 6682 with HRP01
XenDesktop 5.6, build 56060
7.0 and higher versions
Table 2. Operating systems and receiver details
Operating system Receiver version
Windows 7 3.4 Enterprise Edition
4.0 Standard Edition
Windows 8 3.4 Enterprise Edition
4.0 Standard Edition
Mac 11.8, build 238301 and above
Note: Mac client does not support ICA RTT reports for CloudBridge version 7.3.0.
Linux 13 and above
Which appliance is monitored, when both NetScaler ADC (with ICA proxy mode enabled) and CloudBridgeappliances are in the network path?
NetScaler Insight Center monitors NetScaler ADC.
Which IP address is used by NetScaler Insight Center to monitor CloudBridge appliances?
For CloudBridge 2000, 2000WS and 3000 appliances, NetScaler Insight Center uses CloudBridge Instance IP address.
For CloudBridge 4000 and 5000 appliances, NetScaler Insight Center uses CloudBridge Accelerator IP address.
What are the default credentials to access CloudBridge appliances?
The default credentials are:
Username: admin
Password: admin_passwd

© 1999-2017 Citrix Systems, Inc. All rights reserved. p.26https://docs.citrix.com
Can Management Service IP address (running on CloudBridge 4000 and 5000 appliances) be used to discoverCloudBridge appliances?
No.
Can I use a CloudBridge VPX to demonstrate how NetScaler Insight Center collects reports f rom CloudBridgeappliances?
NetScaler Insight Center does not support CloudBridge VPX.
However, if you want to use CloudBridge VPX for demonstration purpose, make sure that the CloudBridge VPX has primary
and accelerated pairs (apA) configured.
For details, see the section "Configuring Inline Mode" in CloudBridge 7.3 Product Documentation.
What are the prerequisites to monitor CloudBridge appliances?
Before you start using NetScaler Insight Center to monitor a CloudBridge appliance, make sure that you have met the
following prerequisites:
The NTP server must be configured on both the CloudBridge appliance and NetScaler Insight Center. To add an NTP
server to NetScaler Insight Center, see Configuring Clock Synchronization. These NTP servers must be closely
synchronized to each other.
Make sure that the CloudBridge appliances can communicate with NetScaler Insight Center by using port 4739.
When both NetScaler ADC and CloudBridge appliance is located in the same network path, you cannot configure a
single NetScaler Insight Center to monitor both the appliances. NetScaler ADC and CloudBridge appliance should use
different NetScaler Insight Center virtual appliances for generating HDX Insight reports.
Make sure that the CloudBridge appliance should only use the primary interface for sending Appflow records.
Do not configure the CloudBridge appliance at the branch off ice to send Appflow records to NetScaler Insight Center.
Verify that the CloudBridge appliance, XenApp or XenDesktop, and Receiver versions are supported by NetScaler Insight
Center.
To monitor the CloudBridge appliance, NetScaler Insight Center must successfully discover the CloudBridge appliance.
Enable HDX data set on the CloudBridge appliance. To verify, on the Configuration tab, navigate to Appliance Settings >
AppFlow.
Make sure that the Update Interval is set to one minute on the CloudBridge appliance. Also, make sure that the IP
address and port values are not deleted. To verify, on the Configuration tab, navigate to Appliance Settings > AppFlow.
Make sure that CloudBridge ICA connections are accelerated with Disk Based Compression (DBC) policy. To verify, on the
Configuration tab, navigate to Optimization Rules > Service Classes and in the right pane, expand ICA and click Edit. The
Acceleration policy must be Disk.
Does the CloudBridge appliance generate AppFlow reports for non-accelerated ICA connections?
No. NetScaler Insight Center reports are generated only when CloudBridge ICA connections are accelerated with Disk
Based Compression (DBC) policy.
To verify, on the Configuration tab, navigate to Optimization Rules > Service Classes and in the right pane, expand ICA and
click Edit. The Acceleration policy must be Disk ICA connections. The ICA Service class policies that are not accelerated and
configured with Flow Control policy, do not generate HDX Insight reports.
NetScaler insight Center does not generate reports if CloudBridge ICA connections are accelerated with flow control
policy.
Does NetScaler Insight Center support Multi Stream ICA (MSI) for CloudBridge appliances?

© 1999-2017 Citrix Systems, Inc. All rights reserved. p.27https://docs.citrix.com
Currently NetScaler Insight center does not support collecting data records for MSI connections.
Is the CloudBridge Plug-In supported by NetScaler Insight Center reports?
Yes. ICA connections from Plug-in-equipped systems must be accelerated with DBC compression policy.
To verify, on the Configuration tab of the CloudBridge appliance, navigate to Optimization Rules > Service Classes and in
the right pane, expand ICA and click Edit. The Acceleration policy must be Disk.
Are thin clients supported by NetScaler Insight Center?
NetScaler Insight Center supports thin clients, but the client type details in the User Agent reports display incorrect values.
Can a CloudBridge datacenter appliance and NetScaler ADC be added to the same NetScaler Insight Center,present in the same datacenter location?
No. This is not supported in this release.
Can I add multiple CloudBridge datacenter appliances (present in the same datacenter location) to the sameNetScaler Insight Center?
Yes.
Can a CloudBridge appliance at the branch off ice be monitored by NetScaler Insight Center?
Currently NetScaler Insight Center does not support this.
Is the CloudBridge appliance supported with Desktop Director?
Yes. CloudBridge appliance is supported with Desktop director. However, the WAN Jitter and DC Jitter values are not
supported.
Why is the DC Latency value more than ICA RTT?
Ideally ICA RTT should be greater than the sum of WAN Latency and DC latency.
If the application is not actively sending data, then it does not work as expected. This is because, the TCP RTT estimation
works only on active connections. If a connection is not very active or if it is idle, the DC latency value will be more than ICA
RTT or WAN Latency.
What are the limitations of using Desktop Director Plug-in for generating HDX Insight reports for CloudBridgeappliances?
Desktop director does not correlate data across user sessions with NetScaler Insight Center, if CloudBridge generates a
Replacement Session GUID (instead of using an Genuine GUID).
To verify, on the CloudBridge appliance, navigate to Monitoring > ICA Advanced > Conn Info.
This occurs if the customer is using an unsupported ICA Client or XenApp or XenDesktop server. For supported versions,
see Supported Software.
Desktop Director does not support WAN Jitter and LAN Jitter values.
General Information
If I change the host name of the NetScaler appliance, will the NetScaler Insight Center inventory and Dashboardref lect the change?
Yes. NetScaler Insight Center reflects the changes every 30 minutes.

© 1999-2017 Citrix Systems, Inc. All rights reserved. p.28https://docs.citrix.com
If the logon credentials of my NetScaler ADC change, should I update that information in NetScaler InsightCenter?
Yes. Fifteen seconds after the logon credentials of a NetScaler ADC change, the NetScaler Insight Center inventory
displays the state of the NetScaler ADC as OUT-OF-SERVICE , but you can view the reports for the NetScaler ADC.
However, to continue collecting AppFlow records for the virtual servers managed by the NetScaler ADC, you must update
the logon credentials in NetScaler Insight Center. For more information about updating the logon credentials in
theNetScaler Insight Center, see Updating Logon Credentials of NetScaler Appliances.
If I update the login credentials, will the state of the NetScaler ADC be "UP" immediately?
The state of the NetScaler ADC in the NetScaler Insight Center inventory changes to "UP" after a few seconds.
My NetScaler appliance uses it 's Subnet IP address (SNIP) as the source IP address for management access. DoesNetScaler Insight Center collect data f rom the NetScaler appliances?
Yes. NetScaler Insight Center collects data from the NetScaler appliance. When adding the NetScaler appliance to
NetScaler Insight Center Inventory, specify the SNIP address used for management access as the IP address of the
appliance.
Reports
How do I view the reports?
By default, the Dashboard page displays a performance chart of the NetScaler ADCs monitored by NetScaler Insight
Center. You can click on the chart to move to the next level of information.
Are reports generated for all NetScaler ADCs added to the NetScaler Insight Center inventory?
No. Only if you enable AppFlow on a CloudBridge appliance, or at least one virtual server in the NetScaler appliance does
NetScaler Insight Center collect data from that appliance and generate reports.
How are the reports organized?
You can view reports for devices, applications, URLs, clients and servers on the Web Insight node, and reports for users,
applications, desktop, gateways and licenses on the HDX Insight node, by clicking on the respective data-point on the
Dashboard. When you access the reports from one of these data points, you get a consolidated report for that data point.
For example, click Applications to display the performance chart for all applications (across all NetScaler appliances)
monitored by NetScaler Insight Center.
Even when the Appf low is enabled on a NetScaler ADC, I do not see the reports on the Dashboard. What are thepossible reasons?
Even if Appflow is enabled on the virtual servers, the services bound to the virtual servers might have AppFlow logging set
to disabled. In that case, you might not see the reports in the dashboard. On the NetScaler appliance, enable AppFlowlogging at the service level to view the reports. For more information, see Troubleshooting Tips.
How is NetScaler Insight Center dif ferent f rom the Reporting tool on the NetScaler appliance?
The following table explains the basic differences between the Reporting tool and NetScaler Insight Center:
NetScaler Reporting tool NetScaler Insight Center
Web based interface accessed
from the NetScaler appliance
A virtual machine hosted on a vitalization server like XenServer or VMware ESX
server. Multiple NetScaler appliances can be added to the NetScaler Insight Center
for monitoring.
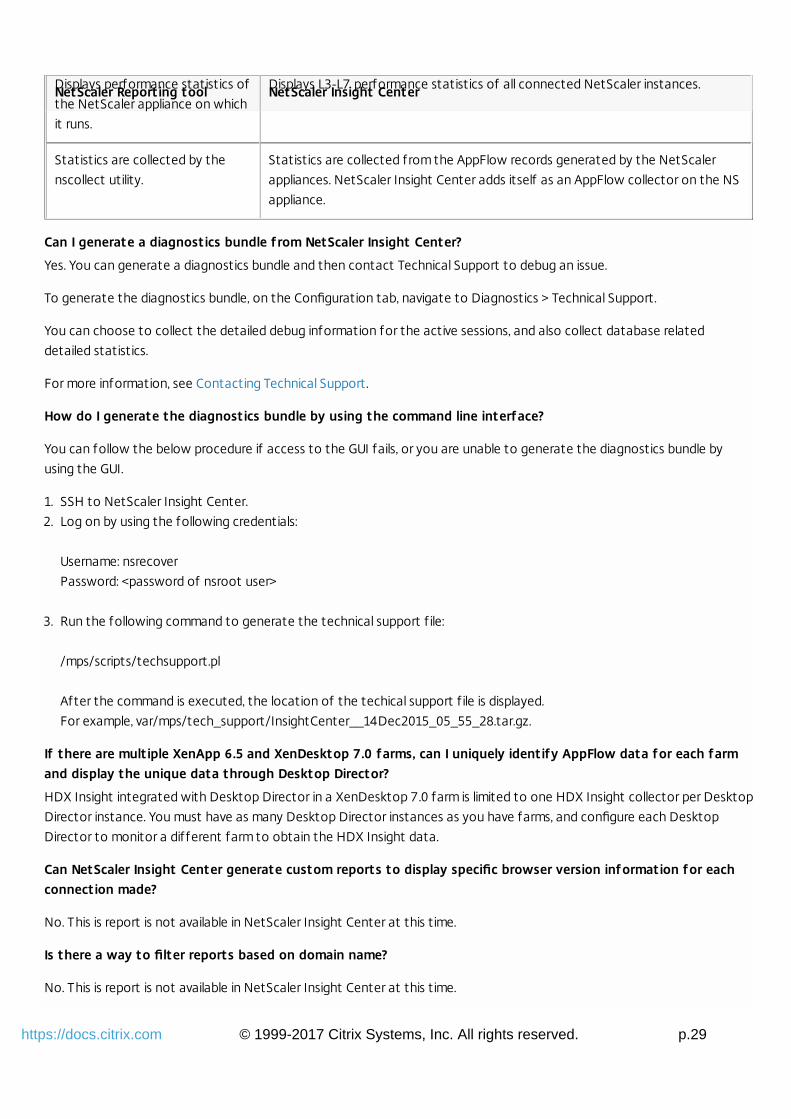
© 1999-2017 Citrix Systems, Inc. All rights reserved. p.29https://docs.citrix.com
Displays performance statistics of
the NetScaler appliance on which
it runs.
Displays L3-L7 performance statistics of all connected NetScaler instances.
Statistics are collected by the
nscollect utility.
Statistics are collected from the AppFlow records generated by the NetScaler
appliances. NetScaler Insight Center adds itself as an AppFlow collector on the NS
appliance.
NetScaler Reporting tool NetScaler Insight Center
Can I generate a diagnostics bundle f rom NetScaler Insight Center?
Yes. You can generate a diagnostics bundle and then contact Technical Support to debug an issue.
To generate the diagnostics bundle, on the Configuration tab, navigate to Diagnostics > Technical Support.
You can choose to collect the detailed debug information for the active sessions, and also collect database related
detailed statistics.
For more information, see Contacting Technical Support.
How do I generate the diagnostics bundle by using the command line interface?
You can follow the below procedure if access to the GUI fails, or you are unable to generate the diagnostics bundle by
using the GUI.
1. SSH to NetScaler Insight Center.
2. Log on by using the following credentials:
Username: nsrecover
Password: <password of nsroot user>
3. Run the following command to generate the technical support f ile:
/mps/scripts/techsupport.pl
After the command is executed, the location of the techical support f ile is displayed.
For example, var/mps/tech_support/InsightCenter__14Dec2015_05_55_28.tar.gz.
If there are multiple XenApp 6.5 and XenDesktop 7.0 farms, can I uniquely identify AppFlow data for each farmand display the unique data through Desktop Director?
HDX Insight integrated with Desktop Director in a XenDesktop 7.0 farm is limited to one HDX Insight collector per Desktop
Director instance. You must have as many Desktop Director instances as you have farms, and configure each Desktop
Director to monitor a different farm to obtain the HDX Insight data.
Can NetScaler Insight Center generate custom reports to display specific browser version information for eachconnection made?
No. This is report is not available in NetScaler Insight Center at this time.
Is there a way to filter reports based on domain name?
No. This is report is not available in NetScaler Insight Center at this time.

© 1999-2017 Citrix Systems, Inc. All rights reserved. p.30https://docs.citrix.com

© 1999-2017 Citrix Systems, Inc. All rights reserved. p.31https://docs.citrix.com
Supported Software
Nov 26, 2014
NetScaler Insight Center is compatible with the following products.
Table 1. Software versions and builds
Product NetScaler Insight Center Component
Web Insight HDX Insight
NetScaler 9.3, build 61.2 and later 10.1 build 112.15 and later
10.0, build 73.5 and later
10.1, build 112.15 and later
XenApp - 6.5, build 6682 with HRP01
XenDesktop - 5.6, build 56060
7.0, build 3018
CloudBridge - 7.3.0.61 and later
Note: The NetScaler Gateway feature (branded as Access Gateway Enterprise for versions 9.3 and 10) must be available onthe NetScaler appliance. NetScaler Insight Center does not support standalone Access Gateway Standard appliances.NetScaler Insight Center can generate reports for applications that are published on XenApp or XenDesktop and accessed
through Citrix Receiver. However, this capability depends on the operating system on which the receiver is installed.
The following table lists the supported operating systems:
Table 2. Operating systems and receiver details
Operating system Receiver version
Windows 7 3.4 Enterprise Edition
4.0 Standard Edition
Windows 8 3.4 Enterprise Edition

© 1999-2017 Citrix Systems, Inc. All rights reserved. p.32https://docs.citrix.com
4.0 Standard Edition
Mac 11.8, build 238301 and above
Note: Mac client does not support ICA RTT reports for CloudBridge version 7.3.0.
Linux 13 and above
Operating system Receiver version
The following table lists the supported web browsers:
Web Browser Version
Internet Explorer IE 9 or later
Google Chrome Chrome 19 or later
Safari Safari 5.1.1 or later
Mozilla Firefox Firefox 3.6.25 or later

© 1999-2017 Citrix Systems, Inc. All rights reserved. p.33https://docs.citrix.com
Overview
May 20 , 2015
NetScaler Insight Center is a virtual appliance that collects and provides detailed information about web traff ic and virtualdesktop traff ic that passes through your NetScaler appliances. It has two components:
Web Insight, which monitors HTTP traff ic (web-application traff ic) passing through load balancing and content
switching virtual servers defined on a NetScaler appliance.
HDX Insight, which monitors ICA traff ic (virtual-desktop traff ic) passing through NetScaler Gateway virtual servers
defined on a NetScaler appliance.
NetScaler Insight Center collects information about applications from the virtual servers to which the applications are
bound as services.
The objective of a NetScaler Insight Center virtual appliance is to retrieve AppFlow logging information for each monitored
application, analyze the information, and present it as visual reports.
Note: ICA is a Citrix proprietary protocol used in XenApp/XenDesktop traff ic. It is composed of virtual channels. A virtualchannel is a bidirectional, error-free connection used for the exchange of generalized packet data between a Citrix host foronline delivery (XenApp or XenDesktop) and the Citrix Receiver online plug-in. Connections for sound, graphics, client drivemapping, printing, and end user experience monitoring are a few examples of the virtual channels.The following f igure depicts the network deployment of a NetScaler Insight Center.Figure 1. Network Deployment of NetScaler Insight Center

© 1999-2017 Citrix Systems, Inc. All rights reserved. p.34https://docs.citrix.com
This topic includes the following details:Web Insight
HDX Insight
Features and Benefits
Limitations
Licensing Information
Ports
Web Insight
Web Insight provides visibility into web applications and allows IT administrators to monitor all web applications being
served by NetScaler ADCs. It generates visual reports that provide critical information such as user and server response time,
enabling IT organizations to improve web application performance. Key features of Web Insight include application-specific
reports and URL-specific reports. Information about client-side parameters enables you to evaluate user experience. Along
with other capabilities, you can identify the top web applications accessed by clients and track their peak usage.
HDX Insight
HDX Insight provides administrators of Citrix XenApp and Citrix XenDesktop environments with an easy way to monitor
users and the performance of the applications hosted on those products. HDX Insight captures data about the ICA traffic
that flows between the clients and the servers, generates AppFlow records by doing deep inspection of the data, and
presents the records as visual reports on the HDX Insight tab on the dashboard. HDX Insight enables IT administrators to
troubleshoot as well as proactively monitor customer issues in matter of minutes.
Note: HDX is built on top of the Citrix ICA protocol.HDX Insight supports collecting ICA data from NetScaler appliances in the following scenarios:
Single-Hop Mode: This is applicable when a NetScaler Gateway appliance is used to connect to the XenApp and
XenDesktop applications.
Transparent Mode: This is applicable when the user is local to the XenApp and XenDesktop applications.
This release does not support Multi-Hop mode. Also, NetScaler Insight Center does not generate reports for ICA traff icwhen a CloudBridge appliance is placed between the NetScaler and the client.This release of NetScaler Insight Center is compatible with the following XenApp and XenDesktop version and builds.
Table 1. Software versions and builds
Software Version and Builds
XenApp 6.5, build 6682 with HRP01
XenDesktop 5.6, build 56060
7.0, build 3018 and later
CloudBridge 7.3.0.61 and later

© 1999-2017 Citrix Systems, Inc. All rights reserved. p.35https://docs.citrix.com
Note: NetScaler Insight Center can also be integrated with Desktop Director. In that case, to enable HDX network analysis,you must configure the NetScaler Insight Center virtual appliance in Desktop Director. For more information, see ConfigureHDX Insight.
Features and Benefits
Because NetScaler Insight Center is installed on a XenServer server, it has no dependency on an external database and
requires no additional hardware. It provides visual reports that administrators can use to:
Monitor and help improve performance of web applications being served by the NetScaler appliance (Web applications
are served by content switching and load balancing virtual servers).
Monitor users of Citrix XenApp and XenDesktop environments.
Monitor performance of applications hosted on Citrix XenApp and XenDesktop environments.
Identify problem areas without accessing individual devices.
Identify user experience with respect to client-side parameters.
Know the top applications accessed by clients.
Track peak usage.
View the performance of applications in the last 5 minutes, 1 hour, 1 day, 1 week, and 1 month.
Identify URL-specif ic information: URL-level response time, render time, and load time.
Navigate from one report to another.
Limitations
The limitations of NetScaler Insight Center are listed below:
NetScaler Insight Center does not support IPv6 address.
You can enable a maximum of four AppFlow collectors on a NetScaler appliance.
Licensing Information
The data collected by the NetScaler Insight Center depends on the version and licenses of the NetScaler appliance being
monitored.
Web Insight
Web Insight reports are displayed for NetScaler appliances running releases 9.3, 10, and 10.1 as shown in Table 1, where indicates that the reports do not include response time, load time, render time, server processing time, client networklatency, server network latency, or waterfall charts.
Table 2. Web Insight License Information
License/ Version 9.3 10 10.1
Standard
Enterprise
Platinum

© 1999-2017 Citrix Systems, Inc. All rights reserved. p.36https://docs.citrix.com
HDX Insight
HDX Insight reports are displayed only for NetScaler Platinum and Enterprise appliances running release 10.1 and 10.5.
Table 3. HDX Insight License Information
License/Duration 5 minutes 1 Hour 1 Day 1 Week 1 Month
Standard
Enterprise
Platinum
For appliances running a Platinum edition of XenApp or XenDesktop, HDX Insight reports can also be integrated with
Director.
Important: On NetScaler appliances running release 10.1 or later, you must install a Platinum license if you want to use thirdparty collectors to extract HDX Insight reports.Note: For information about reports, see Viewing Reports.
Ports
Updated: 2014-09-12
NetScaler Insight Center uses the NetScaler ADC's NetScaler IP (NSIP) address to communicate with the ADC. Forcommunication purposes, the following ports must be open between the NetScaler ADC and NetScaler Insight Center.
Table 4 . Ports
Component Type Port Details
NetScaler Insight
Center
TCP 80/443 For NITRO communication from NetScaler Insight Center to
NetScaler
TCP 22 For SSH communication from NetScaler Insight Center to NetScaler
UDP 4739 For AppFlow communication from NetScaler to NetScaler Insight
Center
ICMP No reserved
port
To detect the network reachability from NetScaler Insight Center to
NetScaler

© 1999-2017 Citrix Systems, Inc. All rights reserved. p.37https://docs.citrix.com
Installing NetScaler Insight Center on XenServer
May 15, 2015
To install NetScaler Insight Center virtual appliances on Citrix XenServer, you use XenCenter.
This topic includes the following details:Prerequisites for Installing NetScaler Insight Center
Installation Procedure
Prerequisites for Installing NetScaler Insight Center
You install NetScaler Insight Center as a virtual appliance on a XenServer server. Before installing the NetScaler Insight
Center virtual appliance, verify that the following requirements have been met:
XenServer version 5.6 or later is installed on hardware that meets the minimum requirements.
XenCenter is installed on a management workstation that meets the minimum requirements. You have to use XenCenter
to install NetScaler Insight Center on XenServer.
You have downloaded the NetScaler Insight Center .xva image f ile.
XenServer Requirements for NetScaler Insight Center
The following table lists the virtual computing resources that XenServer must provide for each NetScaler Insight Centervirtual appliance.
Table 1. Minimum Virtual Computing Resources Required for Running NetScaler Insight Center
Component Requirement
RAM 3 GB or more
Virtual CPU 2 or more
Storage space 120 GB required
Virtual Network Interfaces 1
Throughput 1 Gbps or 100 Mbps
For production use of NetScaler Insight Center, Citrix recommends that you set CPU priority (in virtual machine properties)to the highest level, to improve scheduling behavior and network latency.On a XenApp or XenDesktop server running version 6.5, make sure that the ICA round trip calculations for IdleConnections option is enabled. If the option is not enabled, enable it and execute the gpupdate command. Also, the EUEM
service must be running on the server.
Note: Verify that correct date, time, and time zone is configured on XenServer before NetScaler Insight Center is installed.For information about XenServer, see the documentation at XenServer 6.5.
*

© 1999-2017 Citrix Systems, Inc. All rights reserved. p.38https://docs.citrix.com
XenCenter System Requirements
XenCenter is a Windows client application. It cannot run on the same machine as the XenServer host. The following table
describes the minimum system requirements.
Table 2. Minimum System Requirements for XenCenter Installation
Component Requirement
Operating System Windows 7, Windows XP, Windows Server 2003, or Windows Vista
.NET framework Version 2.0 or later
CPU 750 megahertz (MHz), Recommended: 1 gigahertz (GHz) or faster
RAM 1 GB, Recommended: 2 GB
Network Interface Card 100 megabits per second (Mbps) or faster NIC
Installation Procedure
The number of NetScaler Insight Center instances that you can install depends on the memory available on the XenServer
server.
To install NetScaler Insight Center
1. Start XenCenter on your workstation.
2. On the Server menu, click Add.
3. In the Add New Server dialog box, in the Hostname text box, type the IP address or DNS name of the XenServer that
you want to connect to.
4. In the User Name and Password text boxes, type the administrator credentials set up during the XenServer installation,
and then click Add. The XenServer server name appears in the navigation pane with a green circle, which indicates that
the server is connected.
5. In the navigation pane, right-click the name of the XenServer server on which you want to install NetScaler Insight
Center, and then click Import.
6. In the Import dialog box, from the Import Source node, browse to the location where you saved the NetScaler Insight
Center .xva image f ile. Make sure that the Exported VM option is selected, and then click Next.
7. Select the XenServer server on which you want to install the virtual appliance, and then click Next.
8. Select the local storage repository in which to store the virtual appliance, and then click Import to begin the import
process.
Note: Citrix recommends using local storage repository to store the virtual appliance.
9. You can add, modify, or delete virtual network interfaces as required. When f inished, click Next.
10. Click Finish to complete the import process.
Note: To view the status of the import process, click the Logs tab.
When the import is complete, the kernel reboots.
11. Select the Console tab to display the NetScaler Insight Center Initial Network Configuration options for specifying the

© 1999-2017 Citrix Systems, Inc. All rights reserved. p.39https://docs.citrix.com
initial IPv4 address, subnet mask (Netmask), and Gateway IP address for the NetScaler Insight Center virtual server.
Note: If the wizard closes and you want to update the network details, run the networkconfig command from the
command line interface.
12. If you want to install another NetScaler Insight Center virtual appliance, repeat steps 5 through 11.
* After provisioning NetScaler Insight Center, you cannot increase the amount of storage space allocated to it, even if
more space becomes available.

© 1999-2017 Citrix Systems, Inc. All rights reserved. p.40https://docs.citrix.com
Installing NetScaler Insight Center on VMware ESX
May 15, 2015
To install NetScaler Insight Center virtual appliances on VMware ESX, use VMware vSphere client.
This topic includes the following details:Prerequisites for Installing NetScaler Insight Center
Installation Procedure
Prerequisites for Installing NetScaler Insight Center
Before you begin installing a virtual appliance, verify that the following requirements have been met:
Install VMware ESX version 4.1 or later hardware that meets the minimum requirements.
Install VMware Client on a management workstation that meets the minimum system requirements.
Install VMware OVF Tool (required for VMware ESX version 4.1) on a management workstation that meets the minimum
system requirements.
Download the NetScaler Insight Center set up f iles.
VMware ESX Hardware Requirements
The following table lists the virtual computing resources that VMware must provide for each NetScaler Insight Centervirtual appliance.
Table 1. Minimum Virtual Computing Resources Required for Running NetScaler Insight Center
Component Requirement
RAM 3 GB or more
Virtual CPU 2 or more
Storage space 120 GB required
Virtual Network Interfaces 1
Throughput 1 Gbps or 100 Mbps
Installation Procedure
The number of NetScaler Insight Center instances that you can install depends on the memory available on the VMware
server.
To install NetScaler Insight Center
1. Start the VMware vSphere client on your workstation.
2. In the IP address / Name text box, type the IP address of the VMware ESX server that you want to connect to.
*

© 1999-2017 Citrix Systems, Inc. All rights reserved. p.41https://docs.citrix.com
3. In the User Name and Password text boxes, type the administrator credentials, and then click Login.
4. On the File menu, click Deploy OVF Template.
5. In the Deploy OVF Template dialog box, in Deploy from a f ile or URL, browse to the location where you saved the
NetScaler Insight Center setup f iles, select the .ovf f ile, and click Next.
Note: If a warning message appears with the following text: The operating system identif ier is not supported onthe selected host , check to see if the VMware server supports FreeBSD operating system.
6. On the OVF Template Details page, click Next.
7. Type a name for the NetScaler Insight Center virtual appliance, and then click Next.
8. Specify the Disk Format by selecting either Thin provisioned format or Thick provisioned format .
Note: Citrix recommends that you select Thick provisioned format .
9. Map the networks shown in the OVF template to the networks that you configured on the ESX host.
10. Click Next to start installing the NetScaler Insight Center virtual appliance on VMware ESX. When installation is
complete, a pop-up window informs you of the successful installation.
11. Click Finish to complete the installation process.
Note: To view the status of the installation process, click the Logs tab.
12. You are now ready to start the NetScaler Insight Center virtual appliance. In the navigation pane, select the virtual
appliance that you just installed and, from the right-click menu, select Power On.
13. Select the Console tab to display the NetScaler Insight Center Initial Network Configuration options for specifying the
initial IPv4 address, subnet mask (Netmask), and Gateway IP address for the NetScaler Insight Center virtual appliance.
Once the installation is complete, the VMware client reboots.
14. If you want to install another NetScaler Insight Center virtual appliance, repeat steps 4 through 10.
* After provisioning NetScaler Insight Center, you cannot increase the amount of storage space allocated to it, even if
more space becomes available.

© 1999-2017 Citrix Systems, Inc. All rights reserved. p.42https://docs.citrix.com
Upgrading NetScaler Insight Center
Dec 30 , 2014
To upgrade NetScaler Insight Center to a new build, you must f irst download the application build f ile. Upgrading to a newbuild is a simple procedure.Note: Upgrading NetScaler Insight Center on VMware ESX server from build 118.7 or 119.7 to 120.13 or later builds is notrecommended. However, upgrade from build 120.13 to later builds is supported. To upgrade to 120.13 or later builds, performa fresh installation. The old configurations on the NetScaler appliance and on NetScaler Insight Center will remain the sameand continue to work if the IP address of NetScaler Insight Center remains the same.
To upgrade NetScaler Insight Center
1. Upload the latest software image to the NetScaler Insight Center application.
1. On the Configuration tab, navigate to NetScaler Insight Center > Software Images.
2. In the details pane, from the Action drop-down list, select Upload.
3. In the Upload NetScaler Insight Center Software Image dialog box, click Browse and navigate to the folder that
contains the build f ile, and then double-click the build f ile.
4. Click Upload.
Note: You can create a backup of the software image by selecting an image and then selecting the Download option
from the Action drop-down list.
2. Upgrade NetScaler Insight Center to a new version.
1. On the Configuration tab, navigate to System.
2. In the System pane, under System Administration, click Upgrade Netscaler Insight Center
3. In the Upgrade Netscaler Insight Center dialog box, in Software Images, select the f ile of the build to which you want
to upgrade.
4. Click OK.
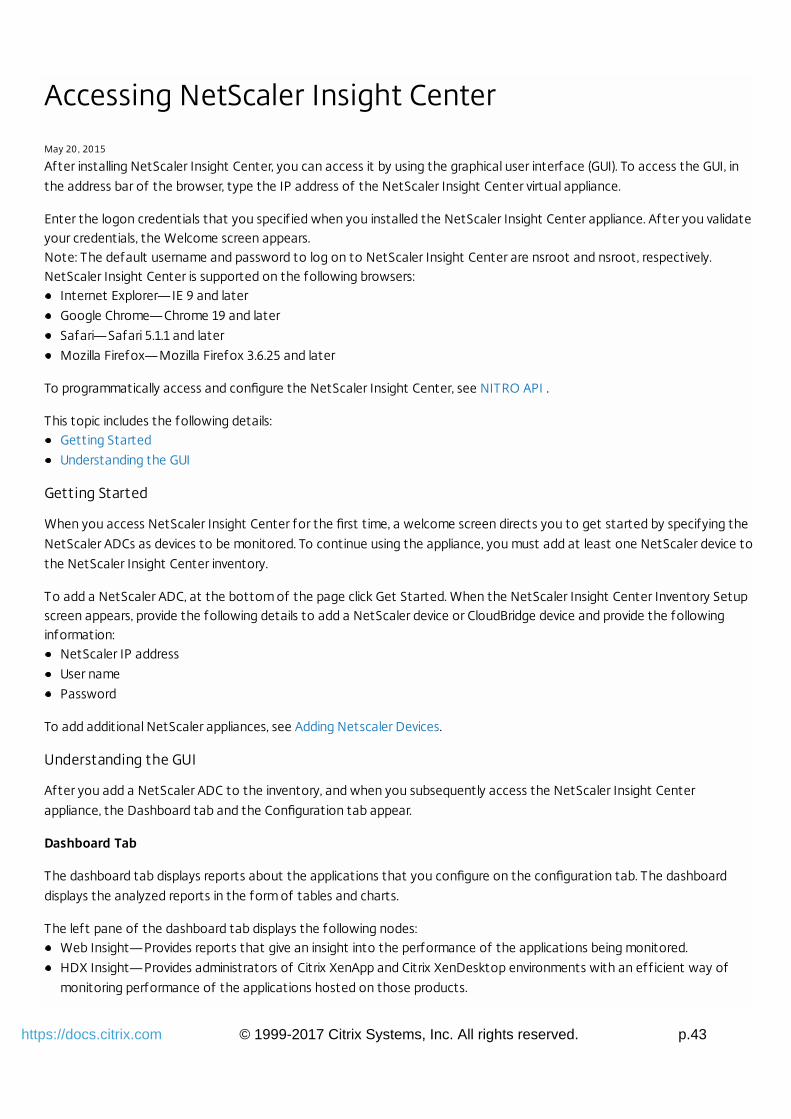
© 1999-2017 Citrix Systems, Inc. All rights reserved. p.43https://docs.citrix.com
Accessing NetScaler Insight Center
May 20 , 2015
After installing NetScaler Insight Center, you can access it by using the graphical user interface (GUI). To access the GUI, in
the address bar of the browser, type the IP address of the NetScaler Insight Center virtual appliance.
Enter the logon credentials that you specif ied when you installed the NetScaler Insight Center appliance. After you validateyour credentials, the Welcome screen appears.Note: The default username and password to log on to NetScaler Insight Center are nsroot and nsroot, respectively.NetScaler Insight Center is supported on the following browsers:
Internet Explorer— IE 9 and later
Google Chrome— Chrome 19 and later
Safari— Safari 5.1.1 and later
Mozilla Firefox— Mozilla Firefox 3.6.25 and later
To programmatically access and configure the NetScaler Insight Center, see NITRO API .
This topic includes the following details:Getting Started
Understanding the GUI
Getting Started
When you access NetScaler Insight Center for the first time, a welcome screen directs you to get started by specifying the
NetScaler ADCs as devices to be monitored. To continue using the appliance, you must add at least one NetScaler device to
the NetScaler Insight Center inventory.
To add a NetScaler ADC, at the bottom of the page click Get Started. When the NetScaler Insight Center Inventory Setupscreen appears, provide the following details to add a NetScaler device or CloudBridge device and provide the followinginformation:
NetScaler IP address
User name
Password
To add additional NetScaler appliances, see Adding Netscaler Devices.
Understanding the GUI
After you add a NetScaler ADC to the inventory, and when you subsequently access the NetScaler Insight Center
appliance, the Dashboard tab and the Configuration tab appear.
Dashboard Tab
The dashboard tab displays reports about the applications that you configure on the configuration tab. The dashboard
displays the analyzed reports in the form of tables and charts.
The left pane of the dashboard tab displays the following nodes:Web Insight— Provides reports that give an insight into the performance of the applications being monitored.
HDX Insight— Provides administrators of Citrix XenApp and Citrix XenDesktop environments with an eff icient way of
monitoring performance of the applications hosted on those products.

© 1999-2017 Citrix Systems, Inc. All rights reserved. p.44https://docs.citrix.com
Note: The HDX Insight node is displayed only if at least one of the NetScaler appliances in the inventory has a license
that is higher than a standard license.
The right pane of the dashboard displays the Web Insight and HDX Insight reports that provide information about the
performance of the applications.
Configuration Tab
The configuration tab provides the interface for configuring the NetScaler Insight Center appliance. Some of the keyoperations you can perform from the configuration tab are:
Adding a NetScaler ADC
Enabling AppFlow for applications
Upgrading NetScaler Insight Center
Troubleshooting NetScaler Insight Center
Managing NetScaler Insight Center

© 1999-2017 Citrix Systems, Inc. All rights reserved. p.45https://docs.citrix.com
Adding NetScaler Devices
May 21, 2015
In addition to the NetScaler ADC or CloudBridge appliance that you added to the inventory when you accessed NetScaler
Insight Center for the first time, you must add any additional appliances that you want to monitor.
Points to remember
Only nCore NetScaler appliances running version software 9.3 or later can be added to the inventory. You cannot add
standalone Access Gateway appliances.
If the NetScaler appliance uses its Subnet IP address (SNIP) as the source IP address for AppFlow records, specify the
SNIP address as the NetScaler IP address.
You cannot monitor a NetScaler cluster setup.
NetScaler Insight Center can monitor appliances in a high availability setup. Citrix recommends that you add both the
appliances (primary and secondary) to the NetScaler Insight Center appliance. When the primary appliance fails, the
secondary appliance generates the performance reports. You do not have to explicitly enable AppFlow on the secondary
appliance.
Make sure that both the NetScaler appliance and the NetScaler Insight Center appliance have either HTTP access or
HTTPS access enabled. For details about configurations, see Modifying System Security Settings.
To add a NetScaler appliance
1. On the Configuration tab, navigate to Inventory, and click Add. All NetScaler appliances that are added to the NetScaler
Insight Center are displayed on the Inventory page.
2. Enter the source IP address that the NetScaler appliance uses for AppFlow records. Also enter the user name and
password required for access to the NetScaler appliance.
3. Click Add. When the NetScaler appliance is added, information about the appliance appears in the Inventory list.
Note: You can delete NetScaler appliances from the Inventory list by selecting the row that lists the NetScaler applianceand clicking Delete. If you delete the entire list, the Welcome screen appears.
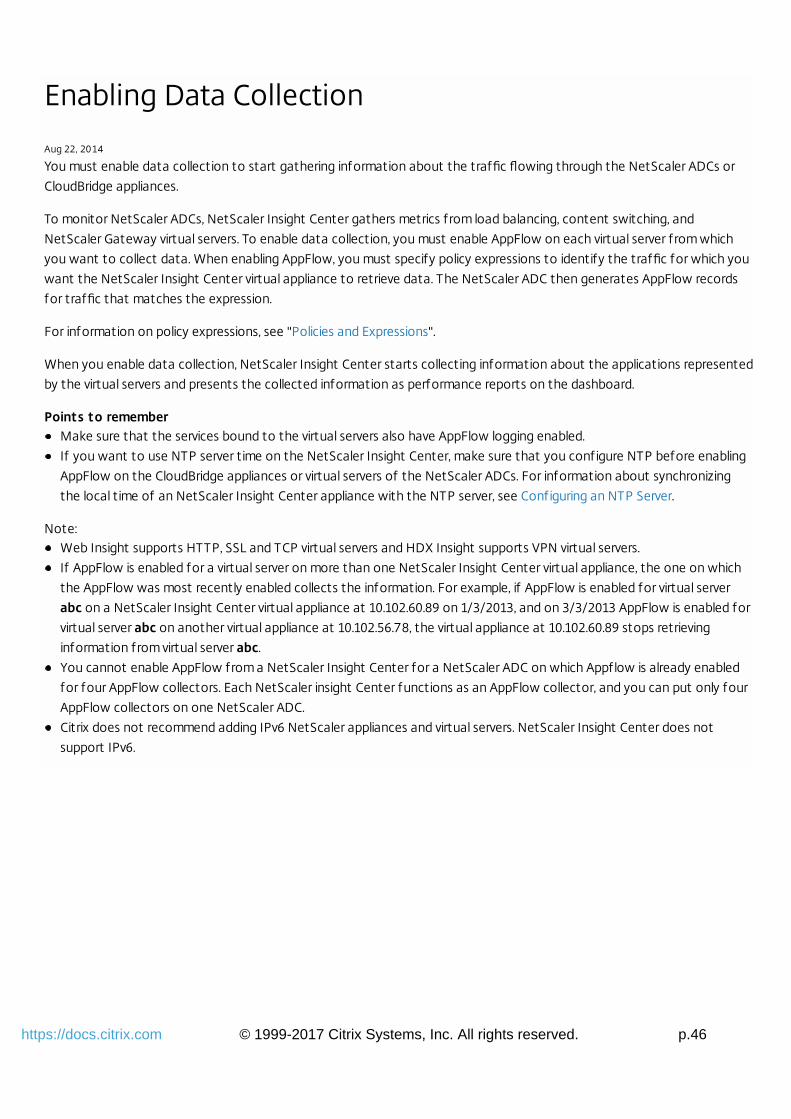
© 1999-2017 Citrix Systems, Inc. All rights reserved. p.46https://docs.citrix.com
Enabling Data Collection
Aug 22, 2014
You must enable data collection to start gathering information about the traffic flowing through the NetScaler ADCs or
CloudBridge appliances.
To monitor NetScaler ADCs, NetScaler Insight Center gathers metrics from load balancing, content switching, and
NetScaler Gateway virtual servers. To enable data collection, you must enable AppFlow on each virtual server from which
you want to collect data. When enabling AppFlow, you must specify policy expressions to identify the traffic for which you
want the NetScaler Insight Center virtual appliance to retrieve data. The NetScaler ADC then generates AppFlow records
for traffic that matches the expression.
For information on policy expressions, see "Policies and Expressions".
When you enable data collection, NetScaler Insight Center starts collecting information about the applications represented
by the virtual servers and presents the collected information as performance reports on the dashboard.
Points to rememberMake sure that the services bound to the virtual servers also have AppFlow logging enabled.
If you want to use NTP server time on the NetScaler Insight Center, make sure that you configure NTP before enabling
AppFlow on the CloudBridge appliances or virtual servers of the NetScaler ADCs. For information about synchronizing
the local time of an NetScaler Insight Center appliance with the NTP server, see Configuring an NTP Server.
Note:Web Insight supports HTTP, SSL and TCP virtual servers and HDX Insight supports VPN virtual servers.
If AppFlow is enabled for a virtual server on more than one NetScaler Insight Center virtual appliance, the one on which
the AppFlow was most recently enabled collects the information. For example, if AppFlow is enabled for virtual server
abc on a NetScaler Insight Center virtual appliance at 10.102.60.89 on 1/3/2013, and on 3/3/2013 AppFlow is enabled for
virtual server abc on another virtual appliance at 10.102.56.78, the virtual appliance at 10.102.60.89 stops retrieving
information from virtual server abc.
You cannot enable AppFlow from a NetScaler Insight Center for a NetScaler ADC on which Appflow is already enabled
for four AppFlow collectors. Each NetScaler insight Center functions as an AppFlow collector, and you can put only four
AppFlow collectors on one NetScaler ADC.
Citrix does not recommend adding IPv6 NetScaler appliances and virtual servers. NetScaler Insight Center does not
support IPv6.

© 1999-2017 Citrix Systems, Inc. All rights reserved. p.47https://docs.citrix.com
Enabling Web Insight Data Collection
Aug 21, 2014
When AppFlow is enabled for Web Insight data collection, the NetScaler Insight Center retrieves the performance reports
of web applications (load balancing and content switching virtual servers) that are bound to the NetScaler ADC.
To enable data collection on a virtual server for Web Insight
1. On the Configuration tab, click Inventory.
2. From the inventory list, select the IP address of the ADC on which you want to enable data collection.
3. On the NetScaler Insight Center Inventory Setup screen, in the Application List pane, from the View drop-down list,
select the type of virtual server (Load Balancing or Content Switching).
The virtual servers of the specified type populate a table that includes the following information:
IP Address— IP address of the virtual server
Name— Name of the virtual server
State— Current operational state of the virtual server. Can be UP or DOWN
Type— Service type of the virtual server
Insight— Data-collection status of the virtual server (ENABLED or DISABLED)
4. Select a virtual server for which you want to enable data collection.
Note: You can enable data collection on a virtual server only if the operational state of the virtual server is UP.
5. From the Action drop-down list, select Enable Appflow.
6. In the Enable AppFlow dialog box, from the Select Expression drop-down list, specify the traff ic to be f iltered by
selecting one of the available expressions or by manually typing the expression. You can also use multiple expressions by
using the logical operators AND (&&) or OR (||).
The following are examples of some expressions that can be used:
To collect information about HTTP requests where URL contains the word images, specify the expression
HTTP.REQ.URL.CONTAINS("images")
To collect information about HTTP virtual servers which have greater than 15000 connections, specify the expression
HTTP.REQ.LB_VSERVER.CONNECTIONS.GE(15000)
To collect information about HTTP requests where URL suff ix is not json and css, specify the expression
HTTP.REQ.URL.SUFFIX.EQ("json").NOT && HTTP.REQ.URL.SUFFIX.EQ("css").NOT
To collect information about HTTP requests where hostname contains the word abc.com and HTTP requests where
cookie contains the word JSESSIONID, specify the expression
HTTP.REQ.HOSTNAME.CONTAINS("abc.com")&&HTTP.REQ.COOKIE.CONTAINS("JSESSIONID")
To collect the information for all the traff ic that f lows through the virtual server, specify the expression true
For more information on expressions, see "Policies and Expressions".
Note: After enabling data collection on a virtual server, if you want to edit the expression that you selected, select the
virtual server, and then select Edit AppFlow Expression from the Action drop-down list.
7. Select the HTML Injection check box. When this option is selected, the web insight reports will include information
about load time and render time, which is useful for comparing the performance of web applications.
Note: On NetScaler 10 appliances, the HTML Injection feature is available only for Platinum licenses. On NetScaler 10.1
appliances, it is available for all licenses.
8. Click OK to save the configuration. If data collection is enabled, the Insight column in the Application List table for that

© 1999-2017 Citrix Systems, Inc. All rights reserved. p.48https://docs.citrix.com
virtual server displays the word Enabled.
Note: If AppFlow logging is not enabled for the respective services or service groups on the NetScaler appliance, the
NetScaler Insight Center dashboard does not display the records, even if the Insight column shows Enabled.
9. To return to the inventory list, from the Action drop-down, select Return to Inventory list.

© 1999-2017 Citrix Systems, Inc. All rights reserved. p.49https://docs.citrix.com
Enabling HDX Insight Data Collection
May 20 , 2015
HDX Insight collects data about virtual desktop connections. The NetScaler ADCs from which HDX Insight collects data
can be deployed in either single-hop mode or transparent mode.
Data collection for single-hop mode is configured through the NetScaler Insight Center interface. For transparent mode,
you configure data collection on the NetScaler ADC, by using the command line interface.
This release of NetScaler Insight Center is compatible with the following XenApp and XenDesktop version and builds.
Table 1. Software Versions and Builds
Software Version Build
XenApp 6.5 6682 with HRP01
XenDesktop 5.6 56060
7.0 3018
This topic includes the following details:Single-Hop Mode
Transparent Mode
Single-Hop Mode
In single-hop mode, users access the NetScaler appliances through a virtual private network (VPN).
To enable data collection in single-hop mode
1. On the Configuration tab, click Inventory.
2. From the inventory list, select the IP address of the appliance on which you want to enable data collection.
3. On the NetScaler Insight Center Inventory Setup screen, in the Application List pane, from the View drop-down list,
select VPN. A list of the SSL VPN virtual servers configured on the appliance populates a table with the following
information about each virtual server:
IP Address— IP address of the virtual server
Name— Name of the virtual server
State— Current operational state of the virtual server. Can be UP or DOWN.
Type— Service type of the virtual server.
Insight— Data-collection status of the virtual server (ENABLED or DISABLED).
4. Select the SSL VPN virtual server for which you want to enable data collection.
Note: You can enable data collection on a virtual server only if the operational state of the virtual server is UP.
5. From the Action drop-down list, select Enable Appflow.
6. In the Enable AppFlow dialog box, from the Select Expression drop-down list, specify the traff ic to be f iltered.
Note: Currently, the only expression supported is true.

© 1999-2017 Citrix Systems, Inc. All rights reserved. p.50https://docs.citrix.com
For more information on expressions, see Policies and Expressions.
7. Click OK to save the configuration. If data collection is enabled, the Insight column in the Application List table displays
as enabled.
Note: If AppFlow logging is not enabled for the respective services or service groups on the NetScaler appliance, the
NetScaler Insight Center dashboard does not display the records, even if the Insight column shows Enabled.
8. To return to the inventory list, from the Action drop-down, select Return to Inventory list.
Note: The following commands are executed in the background when you enable AppFlow in single-hop mode. Thesecommands are explicitly specif ied here for troubleshooting purposes.
add appflow collector <name> -IPAddress <ip_addr>
add appflow action <name> -collectors <string>
set appflow param -f lowRecordInterval <secs>
disable ns feature AppFlow
enable ns feature AppFlow
add appflow policy <name> <rule> <expression>
set appflow policy <name> -rule <expression>
bind vpn vserver <vsname> -policy <string> -type <type> -priority <positive_integer>
set vpn vserver <name> -appflowLog ENABLED
save ns config
Transparent Mode
If a NetScaler appliance is deployed in transparent mode in a XenApp/XenDesktop environment, the ICA traffic is not
transmitted over a VPN. In that case, you have to add NetScaler Insight Center as an AppFlow collector on each NetScaler
appliance, and you must configure an Appflow policy to collect all or specific ICA traffic that flows through the appliance.
Note:Use the NetScaler command line interface to configure transparent-mode data collection manually on a NetScaler
appliance. You cannot configure it in the NetScaler Insight Center Graphical User Interface (GUI).
For detailed information about the commands and their usage, see Command Reference.
For information on policy expressions, see Policies and Expressions.
To configure data collection on a NetScaler appliance by using the command line interface
At the command prompt, do the following:
1. Log on to an appliance.
2. Specify the ICA ports at which the NetScaler appliance listens for traff ic.
set ns param --icaPorts <port>...
Example:
set ns param -icaPorts 2598 1494Note:
You can specify up to 10 ports with this command.
The default port number is 2598. You can modify the port number as required.
3. Add NetScaler Insight Center as an appflow collector on the NetScaler appliance.
add appflow collector <name> -IPAddress <ip_addr>
Example:

© 1999-2017 Citrix Systems, Inc. All rights reserved. p.51https://docs.citrix.com
add appflow collector MyInsight -IPAddress 192.168.1.101Note: A NetScaler appliance supports a maximum four Appflow collectors. If there are already four Appflow collectors
configured, you cannot add another AppFlow collector (in this case, NetScaler Insight Center) to the NetScaler
appliance. Delete an existing Appflow collector to add a new collector. To view the appflow collectors configured on the
NetScaler appliance, use the show appflow collector command.
4. Create an appflow action and associate the collector with the action.
add appflow action <name> -collectors <string> ...
Example:
add appflow action act -collectors MyInsight5. Create an appflow policy to specify the rule for generating the traff ic.
add appflow policy <policyname> <rule> <action>
Example:
add appflow policy pol true act6. Bind the appflow policy to a global bind point.
bind appflow global <policyname> <priority> -type <type>
Example:
bind appflow global pol 1 -type ICA_REQ_DEFAULTNote: The value of type should be ICA_REQ_OVERRIDE or ICA_REQ_DEFAULT in order to apply to ICA traff ic.
7. Set the value of the f lowRecordInterval parameter for Appflow to 60 seconds.
set appflow param -flowRecordInterval 60
Example:
set appflow param -flowRecordInterval 608. Save the configuration. save ns config

© 1999-2017 Citrix Systems, Inc. All rights reserved. p.52https://docs.citrix.com
Disabling and Clearing Data Collection
Jul 29, 2013
Disabling data collection stops the NetScaler Insight Center from retrieving the data collected by a virtual server. Clearing
data collection removes the NetScaler Insight Center configuration from a virtual server.
Note: These procedures are applicable to both Web Insight and HDX Insight.To disable data collection on a virtual server
1. On the Configuration tab, click Inventory.
2. From the Inventory list, select the IP address of the appliance on which you want to disable data collection.
3. In the Application List pane, from the View drop-down list, select the type of virtual server.
4. Select a virtual server for which you want to disable data collection.
Note: You can disable data collection on a virtual server only if the operational state of the virtual server is UP.
5. From the Action list, select Disable Appflow.
6. Click Yes when prompted for confirmation. The Enabled option on Insight column in the Application List is no longer
displayed.
To clear data collection on a virtual server
To clear data collection, follow steps 1 through 4 in the above procedure and then select Clear AppFlow Configuration from
the Action list.
The following commands are executed in the background when you clear Web Insight data collection:unbind <vserver_type> vserver <vserver_name> -policyName <responder_policy_name>
unbind <vserver_type> vserver <vserver_name> -policyName __ESNS_PREBODY_POLICY
unbind <vserver_type> vserver <vserver_name> -policyName __ESNS_POSTBODY_POLICY
unbind <vserver_type> vserver <vserver_name> -policyName __ESNS_REWRITE_POLICY
unbind <vserver_type> vserver <vserver_name> -policyName __ESNS_REWRITE_POLICY_APPFLOW
remove responder policy <responder_policy_name>
unbind lb vserver <vservername> -policyName <af_policy_name>
remove appflow policy <af_policy_name>
The following commands are executed in the background when you clear HDX Insight data collection :unbind vpn vserver <vservername> -policyName <af_policy_name>
remove appflow policy <af_ploicy_name>

© 1999-2017 Citrix Systems, Inc. All rights reserved. p.53https://docs.citrix.com
Viewing the Reports
May 22, 2015
NetScaler Insight Center reports provide a detailed view of the performance of the NetScaler ADCs. With the help of these
reports, you can analyze the devices being monitored by NetScaler Insight Center and track performance issues.
When you enable data collection, NetScaler Insight Center collects traff ic data, analyzes the collected data, and presentsit as reports on the dashboard, in various formats as displayed in the following f igure.Figure 1. An example of the various visual representations
The data collected from the NetScaler ADCs is aggregated to display the data collected during the last 5 minutes, 1 hour, 1
day, 1 week, and 1 month. You can choose to view the data for a particular period.
The list of parameters displayed in the report depends on the metrics selected at the top right corner of the page. When
you select an entity, duration, and metric from the drop-down-list, NetScaler Insight Center displays the relevant values in
multiple formats.
For example, if you select Devices from the Web Insight node, select Day as duration and select Hits as the metric to
display, then the dashboard displays a bar chart. Below the chart is a tabular representation of the data. In the table you
can click on an entry to display a more detailed report, with all of the applicable values shown as both a bar chart and a pie
chart.
Note: By default, the dashboard bases the performance chart for the NetScaler ADCs or CloudBridge appliances on thenumber of hits. To display more details of an appliance's performance, click on its host name, or click on the chart. Allcomponents that affect the performance of the appliance are represented in charts.

© 1999-2017 Citrix Systems, Inc. All rights reserved. p.54https://docs.citrix.com
Web Insight Reports
Jun 11, 2014
For application traff ic, the reports generated by NetScaler Insight Center are available on the Web Insight node on theDashboard. The reports include the following categories of entities:
Devices. Displays the reports for all NetScaler appliances accessed by the clients.
Applications. Displays the reports for all applications used by the clients across all the NetScaler appliances.
URLs. Displays the reports for all the application URLs accessed by the clients.
Clients. Displays the reports for all clients accessing the applications across all the NetScaler appliances.
Servers. Displays the reports for all the servers responding to the client requests.
Web Insight reports consolidate the following data:Applications managed by the selected NetScaler appliances
Top f ive clients details
Top f ive servers details
HTTP request methods used by the clients
HTTP Response Status
Operating Systems used by the clients
User agents (browsers) used by the clients
Note: You can click on a chart to view details of the selected component.The following table lists the Web Insight metrics available with different licenses:
Table 1. Web Insight Metrics with Applicable Licenses
Metrics Description NS 10Platinumedition,and NS10.1 alleditions
NS 10(Standard andEnterpriseeditions, andNS 9.3 (Alleditions)
Devices Hits Number of requests received by NetScaler. Yes Yes
Bandwidth Total bytes processed by NetScaler appliance. Yes Yes
Applications Hits Number of requests received by application. Yes Yes
Bandwidth Total bytes sent to the application. Yes Yes
Response
Time
Elapsed time between the end of an enquiry and the
beginning of a response from the application.
Response time consists of Client Network Latency,
Server Processing Time and Server Network Latency.
Yes No
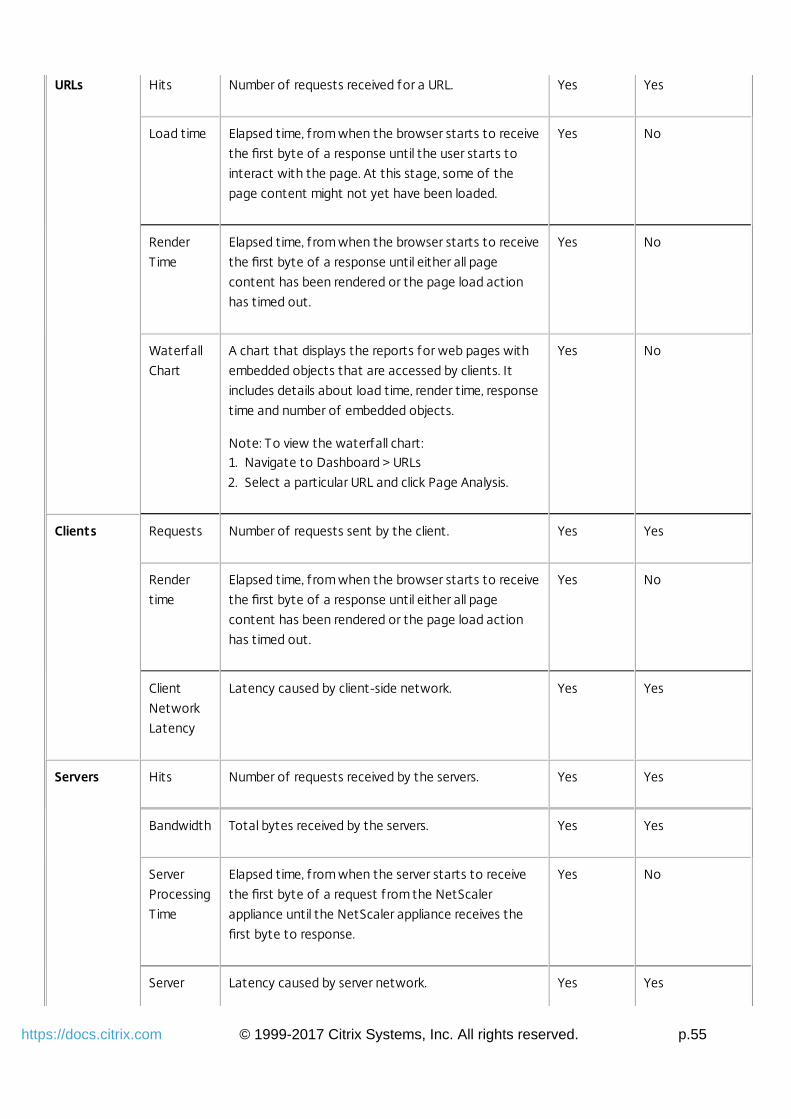
© 1999-2017 Citrix Systems, Inc. All rights reserved. p.55https://docs.citrix.com
URLs Hits Number of requests received for a URL. Yes Yes
Load time Elapsed time, from when the browser starts to receive
the first byte of a response until the user starts to
interact with the page. At this stage, some of the
page content might not yet have been loaded.
Yes No
Render
Time
Elapsed time, from when the browser starts to receive
the first byte of a response until either all page
content has been rendered or the page load action
has timed out.
Yes No
Waterfall
Chart
A chart that displays the reports for web pages with
embedded objects that are accessed by clients. It
includes details about load time, render time, response
time and number of embedded objects.
Note: To view the waterfall chart:1. Navigate to Dashboard > URLs
2. Select a particular URL and click Page Analysis.
Yes No
Clients Requests Number of requests sent by the client. Yes Yes
Render
time
Elapsed time, from when the browser starts to receive
the first byte of a response until either all page
content has been rendered or the page load action
has timed out.
Yes No
Client
Network
Latency
Latency caused by client-side network. Yes Yes
Servers Hits Number of requests received by the servers. Yes Yes
Bandwidth Total bytes received by the servers. Yes Yes
Server
Processing
Time
Elapsed time, from when the server starts to receive
the first byte of a request from the NetScaler
appliance until the NetScaler appliance receives the
first byte to response.
Yes No
Server Latency caused by server network. Yes Yes

© 1999-2017 Citrix Systems, Inc. All rights reserved. p.56https://docs.citrix.com
Network
Latency
HTTPRequestMethods
Hits Number of requests received, distributed with respect
to various request methods.
Yes Yes
Bandwidth Total bytes received, with respect to HTTP request
methods.
Yes Yes
HTTPResponseStatus
Hits Number of responses sent, segregated with respect
to HTTP response status.
Yes Yes
Bandwidth Total bytes received, segregated with respect to
HTTP response status.
Yes Yes
Render
Time
Average render time experienced by clients
segregated with respect to HTTP status responses.
Yes No
OperatingSystems
Hits Number of client requests received, segregated with
respect to user agents used.
Yes Yes
Bandwidth Total bytes received from clients, segregated with
respect to OS used.
Yes Yes
Render
Time
Average Render time experienced by clients,
segregated with respect to OS used.
Yes No
User Agents Hits Number of client requests received, segregated with
respect to the user agents used.
Yes Yes
Bandwidth Total bytes received, from clients segregated with
respect to user agents used.
Yes Yes
Render
Time
Averaged Render time experienced by clients,
segregated with respect to user agents used.
Yes No

© 1999-2017 Citrix Systems, Inc. All rights reserved. p.57https://docs.citrix.com
HDX Insight Reports
Dec 29, 2014
For virtual desktop traff ic, the reports generated by NetScaler Insight Center are available on the HDX Insight node of theDashboard. The HDX Insight reports provide complete visibility of the ICA traff ic. The reports include the followingcategories of entities:
Users. Displays the reports for all the users accessing the applications in a selected time slot.
Applications. Displays the reports for total number of applications, and the total number of times the applications were
launched, within the specif ied time slot.
Gateways. Displays the reports on the NetScaler appliances that act as gateways for incoming traff ic.
Desktops. Displays the reports for the desktops used in the selected time frame.
Licenses. Displays the reports for total SSL VPN licenses used within the specif ied time slot.
Note: The Licenses value does not apply to CloudBridge appliances.
The following table lists HDX Insight metrics:
Table 1. HDX Insight Metrics
Metrics Description
Users WAN Latency Average latency caused by the client side network.
DC Latency Average latency caused by the server network.
ICA RTT Average ICA RTT is the screen lag that the user experiences while interacting with
an application or desktop hosted on XenApp or XenDesktop, respectively.
Bandwidth Rate at which data is transferred over the ICA session.
Client Side NS
Latency
Average latency caused by a NetScaler appliance when ICA traffic flows from
client network to server network.
Server Side NS
Latency
Average latency caused by a NetScaler appliance when ICA traffic flows from
server network to client network.
Host Delay Average delay in ICA traffic that passes through the NetScaler ADCs, caused by
server network.
Client side zero
window size
event
This counter indicates how many times the client advertised a zero TCP window(in
this interval).
Server side zero This counter indicates how many times the server advertised a zero TCP window (in
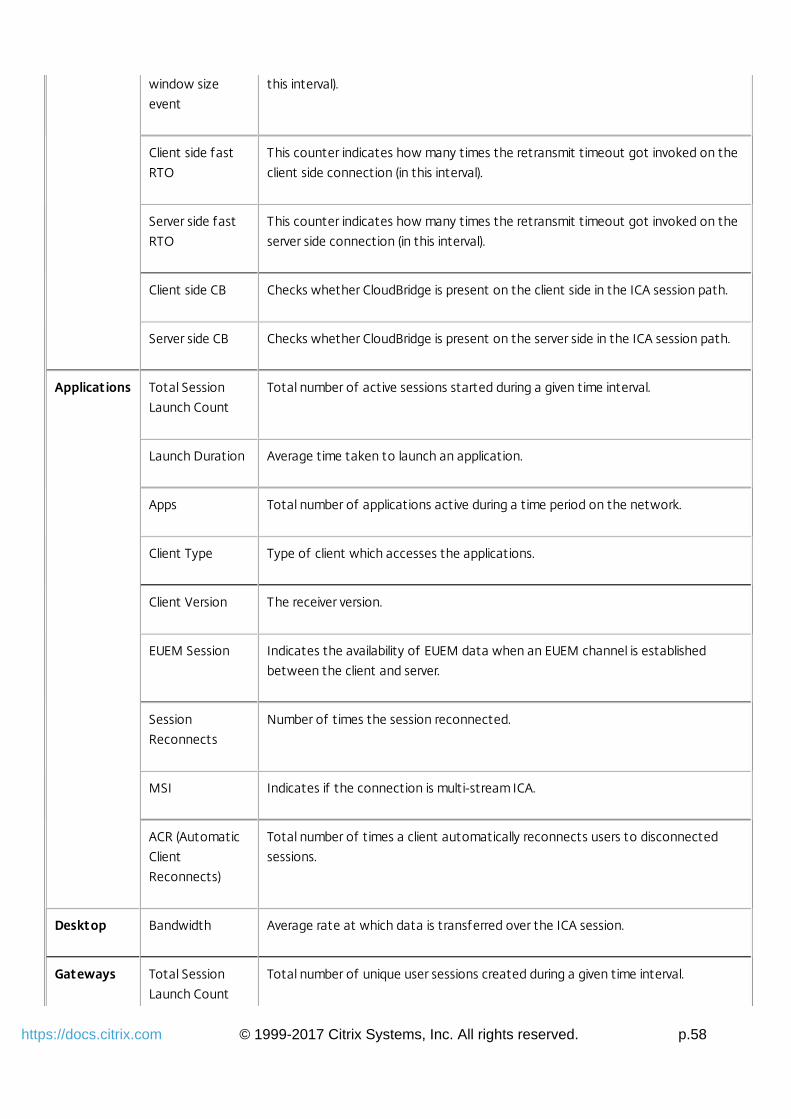
© 1999-2017 Citrix Systems, Inc. All rights reserved. p.58https://docs.citrix.com
window size
event
this interval).
Client side fast
RTO
This counter indicates how many times the retransmit timeout got invoked on the
client side connection (in this interval).
Server side fast
RTO
This counter indicates how many times the retransmit timeout got invoked on the
server side connection (in this interval).
Client side CB Checks whether CloudBridge is present on the client side in the ICA session path.
Server side CB Checks whether CloudBridge is present on the server side in the ICA session path.
Applications Total Session
Launch Count
Total number of active sessions started during a given time interval.
Launch Duration Average time taken to launch an application.
Apps Total number of applications active during a time period on the network.
Client Type Type of client which accesses the applications.
Client Version The receiver version.
EUEM Session Indicates the availability of EUEM data when an EUEM channel is established
between the client and server.
Session
Reconnects
Number of times the session reconnected.
MSI Indicates if the connection is multi-stream ICA.
ACR (Automatic
Client
Reconnects)
Total number of times a client automatically reconnects users to disconnected
sessions.
Desktop Bandwidth Average rate at which data is transferred over the ICA session.
Gateways Total Session
Launch Count
Total number of unique user sessions created during a given time interval.

© 1999-2017 Citrix Systems, Inc. All rights reserved. p.59https://docs.citrix.com
Total Application
Launch Count
Total number of unique applications launched during a given time interval.
Licenses Licenses in use Licenses in use for SSL VPN and ICA traffic.

© 1999-2017 Citrix Systems, Inc. All rights reserved. p.60https://docs.citrix.com
Managing NetScaler Insight Center
May 22, 2015
The configuration tab provides the interface through which you can manage the NetScaler Insight Center virtual appliance.
You can perform management activities such as modify the network configuration, update logon credentials of devices,
configure user accounts, and manage client sessions. You can also restart NetScaler Insight Center and configure security
settings. You can further configure mail notifications to receive emails whenever an alert is raised.
This topic includes the following details:Managing ICA Sessions
Modifying the Network Configuration
Updating Logon Credentials of NetScaler Appliances
Modifying the Time Zone
Configuring User Accounts
Managing Client Sessions
Restarting the NetScaler Insight Center
Modifying System Security Settings
Managing ICA Sessions
You can use the ICA session timeout feature to specify the time period for which an ICA session can remain in the idle state
before being terminated. By default, if there is no flow of traffic, the session remains in active state for the first 2 minutes
and then moves to Idle state.
For example, if you set the ICA session timeout value to 5 minutes, a session in which there is no traffic remains active for 2
minutes and then enters the idle state. If there is still no traffic at the end of another 5 minutes, the session is terminated.
If the session has any traffic during the (2+5=) 7-minute period, the session moves to active state.
To set the ICA session time out value1. In the navigation pane, on the Configuration tab, click System.
2. In the System pane, under System Settings, click Change ICA Session Timeout.
3. In the Change ICA Session Timeout dialog box, set the Session Timeout value and click OK.
Modifying the Network Configuration
You can change the NetScaler Insight Center IP address, network mask, and gateway address that you specif ied for theNetScaler Insight Center virtual appliance during initial configuration.
To modify the network configuration of NetScaler Insight Center
1. On the Configuration tab, in the navigation pane, click System.
2. In the System pane, under Setup NetScaler InsightSetup NetScaler Insight Center, click Network Configuration.
3. In the Modify Network Configuration dialog box, set the following parameters:
NetScaler Insight IP Address— IP address of the NetScaler Insight Center.
Netmask— Subnet mask for the subnet in which the NetScaler Insight Center is located.
Gateway— The default gateway for the network.
4. Click OK.
Updating Logon Credentials of NetScaler appliances

© 1999-2017 Citrix Systems, Inc. All rights reserved. p.61https://docs.citrix.com
If the logon credentials of a NetScaler appliance changes after it is added to the inventory, NetScaler Insight Center is not
able to connect to that appliance. In the user interface, the State column in the Inventory list displays a yellow or red circle
in the row that lists the appliance.
Note: There can be many other reasons for this state change. A change in logon credentials is just one of the possiblecauses. To resolve this issue, you must acquire information about the credential change from the administrator of theNetScaler appliance and update NetScaler Insight Center.To update logon credentials for the NetScaler appliance
1. On the Configuration tab, click Inventory.
2. Select the device for which you want to update the credentials, and from the Action drop-down list, select Update Login
Credentials.
3. On the Update Login Credentials screen, enter the new credentials for the device.
Modifying the Time Zone
You can modify the time zone used by the NetScaler Insight Center virtual appliance's clock. The default time zone is UTC.
To modify the time zone
1. On the Configuration tab, in the navigation pane, click System.
2. In the System pane, under System Settings, click Change Time Zone.
3. In the Modify T ime Zone dialog box, select a time zone from the drop-down list, and then click OK.
Configuring User Accounts
To allow a user to access NetScaler Insight Center virtual appliance, you must create an account for the user. Users are
authenticated locally, on the virtual appliance. You can also enable external authentication for the user and specify the
amount of time for which the a user can remain logged on.
To configure a user account
1. On the Configuration tab, in the navigation pane, expand System, and then click Users. The Users pane displays a list of
existing user accounts, with their permissions.
2. In the Users pane, do one of the following:
To create a user account, click Add.
To modify a user account, select the user, and then click Modify.
3. In the Create System User or Modify System User dialog box, set the following parameters:
Name— User name for the account. The following characters are allowed: letters a through z and A through Z,
numbers 0 through 9, period (.), space ( ), and underscore (_). Maximum length: 128 characters. You cannot change the
name after the account is created.
Password— Password for logging on to the NetScaler Insight Center virtual appliance.
Confirm Password The password.
Permission— User's privileges on the virtual appliance. Possible values:
Superuser— Can perform all administration tasks related to the NetScaler Insight Center.
Readonly— Can only monitor the system and change the password of the account.
Default: superuser.
4. Click Create or OK, and then click Close. The user account that you created is listed in the details pane.
Managing Client Sessions

© 1999-2017 Citrix Systems, Inc. All rights reserved. p.62https://docs.citrix.com
A client session is created when a user logs on to the NetScaler Insight Center virtual appliance. You can view all current
client sessions in the Sessions pane, and you can end the session for a user.
To view client sessions, on the Configuration tab, in the navigation pane, expand System, and then click Sessions.
In the Sessions pane, you can view the following details:User Name— User account that is being used for the session.
IP Address— IP address of the client from which the session has been created.
Port— Port being used for the session.
Login Time— Time at which the current session was created on NetScaler Insight Center.
Last Activity Time— Time at which user activity was last detected in the session.
Session Expires In— Time remaining before session expiry.
To end a client session, in the Sessions pane, click the session that you want to remove, and then click End Session.
Note: You cannot end a session from the client that initiated that session.
Restarting the NetScaler Insight Center
Restarting NetScaler Insight Center does not affect the NetScaler appliances monitored by NetScaler Insight Center. The
NetScaler appliances continue to function during the restart process.
To restart NetScaler Insight Center
1. On the Configuration tab, in the navigation pane, click System.
2. In the System pane, under System Administration, click Reboot NetScaler Insight Center.
3. At the confirmation prompt, Click Yes.
Modifying System Security Settings
For security reasons, you can specify that all communication between NetScaler Insight Center and a NetScaler appliance
must be over a secure channel. You can also specify HTTPS-only access to NetScaler Insight Center user interface.
To modify system settings
1. On the Configuration tab, in the navigation pane, click System.
2. In the System pane, under System Settings, click Change System Settings.
3. In the Modify System Settings dialog box, select https from the NetScaler Insight Center to NetScaler Communication
drop-down list.
4. To specify secure-only access to NetScaler Insight Center, select the Secure Access only check box.
5. Click OK.

© 1999-2017 Citrix Systems, Inc. All rights reserved. p.63https://docs.citrix.com
Working with SSL Files
May 15, 2015
Before installing an SSL certificate, you must upload the SSL files to NetScaler Insight Center. Installing an SSL certificate
terminates all current client sessions with the NetScaler Insight Center, so you have to log in again for any additional
configuration tasks.
This topic includes the following details:Uploading SSL f iles to the NetScaler Insight Center
Installing an SSL Certif icate
Viewing SSL Certif icate Details
Uploading SSL files to the NetScaler Insight Center
For any SSL transaction, the server needs a valid certificate and the corresponding private and public key pair. The certificate
file must be present on the NetScaler Insight Center virtual appliance when you install the SSL certificate on NetScaler
Insight Center. You can also download the SSL Certificate and key files to a local computer as a backup.
To upload SSL certificate files to NetScaler Insight Center
1. On the Configuration tab, expand NetScaler Insight Center, and then click SSL Certif icate f iles.
2. In the SSL Certif icates pane, from the Action drop-down list, select Upload.
3. In the Upload SSL Certif icate dialog box, click Browse and select the certif icate f ile that you want to upload.
To create a backup for an SSL certificate file
On the SSL Certificates pane, select the file that you want to download, and then from the Action drop-down list, select
Download and browse to the location where you want to save the file.
Installing an SSL Certificate
After installing the certificate and key files, you can install the SSL certificate.
To install an SSL certificate on NetScaler Insight Center
1. On the Configuration tab, in the navigation pane, click System.
2. In the System pane, in Setup NetScaler Insight Center, click Install SSL Certif icate.
3. In the Install SSL Certif icate dialog box, set the following parameters:
Certif icate File— File name of a valid certif icate. The certif icate f ile must be present on the NetScaler Insight Center
virtual appliance.
Key File— File name of the private key used to create the certif icate. The key f ile must be present on the NetScaler
Insight Center virtual appliance.
Password — Pass phrase that was used to encrypt the private key. This option can be used to load encrypted private
keys. Maximum length: 32 characters.
Note: Password protected private keys are supported only for the PEM format.
4. Click OK, and then click Close.
Viewing SSL Certificate Details

© 1999-2017 Citrix Systems, Inc. All rights reserved. p.64https://docs.citrix.com
The NetScaler Insight Center virtual appliance uses an SSL certif icate for secure client connections. After installing thecertif icate, you can view details such as certif icate's validity status, issuer, subject, days to expiration, valid from and todates, version, and serial number.
To view the SSL certificate on NetScaler Insight Center
1. In the navigation pane, click System.
2. In the System pane, under Setup NetScaler InsightSetup NetScaler Insight, click View SSL Certif icate. The certif icate
details appear.

© 1999-2017 Citrix Systems, Inc. All rights reserved. p.65https://docs.citrix.com
Managing Threshold
May 21, 2015
The adaptive threshold functionality in NetScaler Insight Center dynamically sets the threshold value for the maximum
number of hits on each URL. If the maximum number of hits on a URL is greater than the threshold value set for the URL, a
syslog message is sent to an external syslog server. The threshold value interval can be either days or weeks
Threshold-value calculation uses the following formula: Threshold value = Max hit * Threshold multiplier, whereMax hit is the maximum number of hits on a URL.
Threshold multiplier is a user-defined integer value (default: 2).
Note: The adaptive threshold functionality is supported only on NetScaler 10.1.e and NetScaler release 10.5 onwards.Example
In the following example, duration of the threshold has been set to Day, and the threshold multiplier is 2.
On day 1, a syslog message is not sent, because a threshold value is not calculated by NetScaler Insight Center for the
previous day. The largest number of hits on any URL is 15 on day 1.
On day 2, the maximum number of hits on any URL is 60, and the threshold value set by NetScaler Insight Center is 30 (Max
Hit on day 1 * Threshold multiplier). The threshold value on day 2 is less than the maximum number of hits on day 2.
Therefore, a syslog message is sent to an external syslog server.
On day 3, the maximum number of hits on any URL is 10, and the threshold value is 120 (maximum hit on day 2 * Threshold
multiplier). The threshold value on day 3 is greater than the maximum number of hits on day 3. Therefore, a syslog message
is not sent to an external syslog server.
The following table shows an example of how a threshold value is calculated:
Day URL MaxHit
ThresholdMultiplier
Threshold value = Max Hit *Threshold multiplier
Syslog sent
Day1
URL1 15 2 No threshold value is configured forDay1
No
Day2
URL1 60 2 15*2 = 30 Yes Day 2 Max Hit (60) > Day 2threshold value (30)
Day3
URL1 10 2 60*2 = 120 No Day3 Max hit (10) < Day 3threshold value (120)
Note: To configure a syslog server, see Monitoring Syslog Events.To enable adaptive threshold
1. On the Configuration tab, in the navigation pane, click System and in the right pane click Change Adaptive Threshold
Settings.
2. On the Change Adaptive Threshold Settings page, select the check box and click OK.
To set the threshold value in NetScaler Insight Center

© 1999-2017 Citrix Systems, Inc. All rights reserved. p.66https://docs.citrix.com
1. On the Configuration tab, navigate to NetScaler Insight Center>Thresholds.
2. Click Add.
3. In the Create Thresholds dialog box, set the following parameters:
Name— Threshold name
Resource Type— URL
Duration— Duration of the threshold (Day or Week)
Threshold Multiplier— User-defined integer value
4. Click Create.

© 1999-2017 Citrix Systems, Inc. All rights reserved. p.67https://docs.citrix.com
Configuring Clock Synchronization
May 15, 2015
You can configure your NetScaler Insight Center virtual appliance to synchronize its local clock with the Network Time
Protocol (NTP) server used by your servers and NetScaler appliance. NetScaler Insight Center then has the same date and
time settings as the other servers and appliances in your network. The clock synchronization configuration does not change
if NetScaler Insight Center is restarted, upgraded, or downgraded.
The clock is synchronized immediately if you add a new NTP server or change any of the authentication parameters. You
can also explicitly enable and disable NTP synchronization.
Note: If you do not have a local NTP server, you can f ind a list of public and open access NTP servers at the off icial NTPsite, http://www.ntp.org. Before configuring a NetScaler appliance or other network entity to use a public NTP server, besure to read the Rules of Engagement page (link included on all Public T ime Servers pages).This topic includes the following details:
Configuring an NTP Server
Enabling an NTP Synchronization
Modifying the Authentication Options
Configuring an NTP Server
To synchronize the local time of the NetScaler Insight Center appliance, you have to first configure an NTP server.
To add an NTP server
1. On the Configuration tab, expand System > NTP Servers.
2. In the details pane, do one of the following:
To add a new NTP server, click Add.
To modify settings for an existing NTP server, select the NTP server, and then click Modify.
3. In the Add NTP Server dialog box, set the following parameters:
Server Name/IP Address— Domain name of the NTP server or the IP address of the NTP server. The name or IP
address cannot be changed for an existing NTP server.
Minimum Poll Interval— Minimum number of seconds after which the NTP server must poll the NTP messages,
expressed as a power of 2. Minimum value: 4 (2^4=16 seconds). Maximum value: 6 (2^6=64 seconds). Default: 6
(2^6=64 seconds).
Maximum Poll Interval— Maximum number of seconds after which the NTP server must poll the NTP messages,
expressed as a power of 2. Minimum value: 10 (2^10=1024 seconds). Maximum value: 17 (2^17=36 hours). Default : 10
(2^10=1024 seconds).
Key Identif ier— Key to be used for the specif ied server. This key identif ier should be added to the list of Trusted Key
IDs in the authentication parameters. Minimum value: 1. Maximum value: 65534.
Note: Do not add a key if you select Autokey.
Autokey— Use the Autokey protocol for the specif ied server.
Preferred— Synchronize with this server f irst. Applicable if more than one server is configured.
4. Click Add, and then click Close.
5. In the details pane, verify that the settings displayed for the NTP server that you just configured are correct.
Enabling an NTP Synchronization
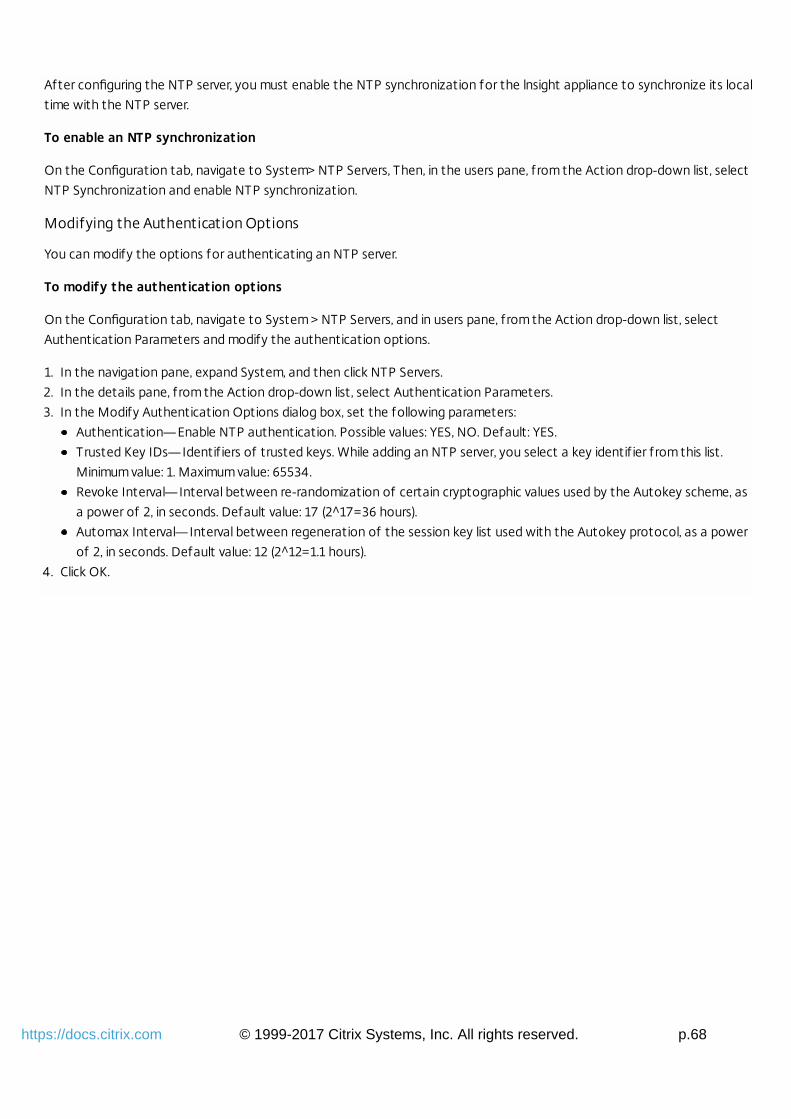
© 1999-2017 Citrix Systems, Inc. All rights reserved. p.68https://docs.citrix.com
After configuring the NTP server, you must enable the NTP synchronization for the lnsight appliance to synchronize its local
time with the NTP server.
To enable an NTP synchronization
On the Configuration tab, navigate to System> NTP Servers, Then, in the users pane, from the Action drop-down list, select
NTP Synchronization and enable NTP synchronization.
Modifying the Authentication Options
You can modify the options for authenticating an NTP server.
To modify the authentication options
On the Configuration tab, navigate to System > NTP Servers, and in users pane, from the Action drop-down list, select
Authentication Parameters and modify the authentication options.
1. In the navigation pane, expand System, and then click NTP Servers.
2. In the details pane, from the Action drop-down list, select Authentication Parameters.
3. In the Modify Authentication Options dialog box, set the following parameters:
Authentication— Enable NTP authentication. Possible values: YES, NO. Default: YES.
Trusted Key IDs— Identif iers of trusted keys. While adding an NTP server, you select a key identif ier from this list.
Minimum value: 1. Maximum value: 65534.
Revoke Interval— Interval between re-randomization of certain cryptographic values used by the Autokey scheme, as
a power of 2, in seconds. Default value: 17 (2^17=36 hours).
Automax Interval— Interval between regeneration of the session key list used with the Autokey protocol, as a power
of 2, in seconds. Default value: 12 (2^12=1.1 hours).
4. Click OK.

© 1999-2017 Citrix Systems, Inc. All rights reserved. p.69https://docs.citrix.com
Diagnostics
May 20 , 2015
If you have problems with your NetScaler Insight Center deployment, see Troubleshooting Tips. If you do not find a
solution there, check the audit logs and task logs for a possible reason for the problem. These logs are also useful for
monitoring NetScaler Insight Center operations. You can supplement them by designating a syslog server to which to
redirect system log messages.
This topic includes the following details:Using Audit Logs
Using Task Logs
Monitoring Syslog Events
Contacting Technical Support
Using Audit Logs
Audit logs provide detailed information about user-initiated operations that are performed on the NetScaler Insight Center.
To view audit logs
1. On the Configuration tab, navigate to System > Audit.
2. View the following details of operations performed:
User name— Name of the user who performed the operation.
IP Address— IP address of the NetScaler ADCs on which the operation was performed.
Port— Port at which the system was sending and receiving data when the operation was performed.
Resource Type — Type of resource on which the operation was performed.
Resource Name— Name of the resource used to perform the operation, and the user name used to log in.
Audit Time— Time when the audit log was generated.
Operation— Task that was performed, such as add, delete, or log out.
Status— Status of the audit, such as success or failure.
Message— Message describing the status of a task and the cause of failure (if the operation failed).
Using Task Logs
Tasks logs provide detailed information about the operations that NetScaler Insight Center performs on NetScaler
appliances. The Task Logs category includes subcategories for devices and commands. The three types of logs can be
described as follows:
Task Logs— The operations that were performed.
Device Logs— The NetScaler ADCs on which the operations were performed.
Command Logs— The NetScaler or CloudBridge commands that were executed.
To view the task logs
1. On the Configuration tab, navigate to Diagnostics > Task Log.
2. View the following details of tasks that were performed on the NetScaler ADCs.
Name— Name of the task that is being executed or has already been executed.
Status— Status of the task, such as In progress, Completed, or Failed.
Executed by— NetScaler Insight Center user who performed the operation.

© 1999-2017 Citrix Systems, Inc. All rights reserved. p.70https://docs.citrix.com
Start t ime— Time at which the task started.
End time— Time at which the task ended.
3. Click a task to view the device logs. This is a list of the devices on which the operation was executed.
Status— Status of the operation, such as In progress, Completed, or Failed.
IP address— IP address of the NetScaler ADC.
Start Time— Time at which the operation started.
End Time.— Time at which the operation ended.
4. Click a device to view the command logs. This is a list of the commands that were executed on that device.
Status— Status of the operation, such as In progress, Completed, or Failed.
Message— Message describing the status of operation.
Command— The command that was executed.
Start Time— Time at which the command started.
End Time— Time at which the command ended.
Monitoring Syslog Events
You can monitor the syslog events generated by the NetScaler ADCs in the NetScaler Insight Center inventory if you have
configured the NetScaler Insight Center virtual appliance to redirect all syslog messages to the syslog servers. To monitor
syslog events, you have to designate a syslog server. A syslog server is an external server that displays the log events
generated by NetScaler Insight Center. After you configure the syslog server, you can view the details of the events
generated by the NetScaler ADCs.
Designating a Syslog Server
1. On the Configuration tab, navigate to System > Syslog Servers.
2. In the Syslogs Servers pane, click Add.
3. Enter the following details in the Add SysLog Server dialog box:
Name— Name of the syslog server.
IP Address— IP address of the syslog server.
Port— Port at which the system sends and receives data when the operation is performed.
By default, the port value is 514.
Log Levels— Select any of the log levels displayed.
4. Click Add. The syslog server is displayed on the Syslogs Servers pane.
Note: You can also select the date and time format to be displayed in the logs by selecting System Logs Parameters fromthe Action drop-down list.
Viewing Syslogs
1. On the Configuration tab, navigate to System > System logs.
2. The following details are displayed on System Logs pane:
Severity— Severity of the issue
Source— IP address of the virtual server
Date— Time and date when the issue was logged
Category— Category of the issue
Message— Details of the issue
Contacting Technical Support
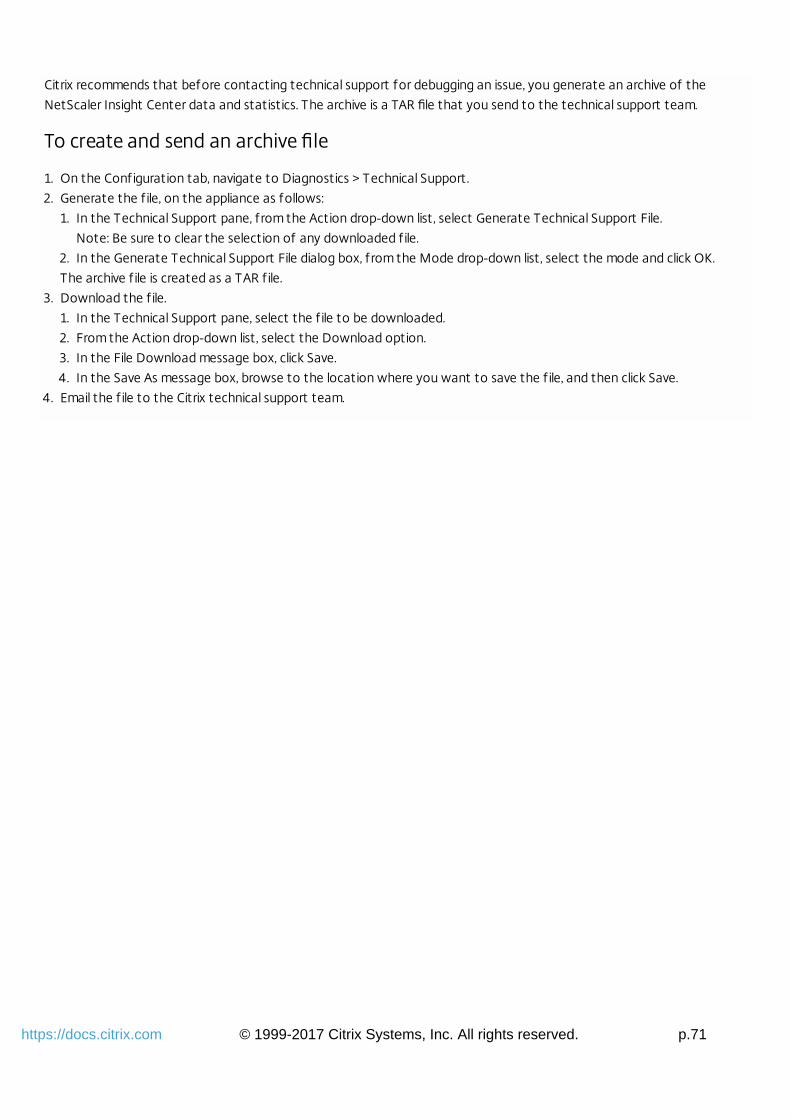
© 1999-2017 Citrix Systems, Inc. All rights reserved. p.71https://docs.citrix.com
Citrix recommends that before contacting technical support for debugging an issue, you generate an archive of the
NetScaler Insight Center data and statistics. The archive is a TAR file that you send to the technical support team.
To create and send an archive file
1. On the Configuration tab, navigate to Diagnostics > Technical Support.
2. Generate the f ile, on the appliance as follows:
1. In the Technical Support pane, from the Action drop-down list, select Generate Technical Support File.
Note: Be sure to clear the selection of any downloaded f ile.
2. In the Generate Technical Support File dialog box, from the Mode drop-down list, select the mode and click OK.
The archive f ile is created as a TAR f ile.
3. Download the f ile.
1. In the Technical Support pane, select the f ile to be downloaded.
2. From the Action drop-down list, select the Download option.
3. In the File Download message box, click Save.
4. In the Save As message box, browse to the location where you want to save the f ile, and then click Save.
4. Email the f ile to the Citrix technical support team.

© 1999-2017 Citrix Systems, Inc. All rights reserved. p.72https://docs.citrix.com
Troubleshooting Tips
Dec 30 , 2015
Following are some reported problems and their resolutions.
I cannot see any records on the NetScaler Insight Center dashboard.
If no reports appear on the dashboard after you have enabled AppFlow for at least one virtual server on a NetScaler ADC
or NetScaler Gateway that has been added to the inventory, check the following:
Is the NetScaler Insight Center version the same as or higher than the NetScaler ADC version?
Does the NetScaler ADC have the required license for NetScaler Insight Center to collect data? For details, see Licensing
Information.
Are all the configurations implemented from NetScaler Insight center, and not from the NetScaler ADC?
Did you wait for 5 minutes for the data to appear on the dashboard? If not, wait for at least 5 minutes for NetScaler
Insight Center to display the data.
Is the configuration utility displaying any repeating error messages? If so, check to see if there are any core dumps in the
/var/core directory.
Is AppFlow enabled on the NetScaler appliance?
Is AppFlow logging enabled on the virtual servers (load balancing, content switching, or VPN virtual servers) of the
NetScaler appliance?
Is AppFlow enabled for the services and service groups that are bound to the load balancing virtual servers?
Does the AppFlow policy for the virtual server have the highest priority for which AppFlow is most recently enabled? (If
AppFlow is enabled for a virtual server on more than one NetScaler Insight Center virtual appliance, the virtual appliance
on which AppFlow was most recently enabled for the NetScaler appliance collects the information). Follow the below
procedure to check the priority:
1. On the NetScaler appliance, navigate to Traff ic Management.
2. Expand Load Balancing, or expand Content Switching and then click Virtual servers.
3. Double-click the virtual server for which you want to see if AppFlow is enabled.
4. In the Conf igure Virtual Server (Load Balancing) or Conf igure Virtual Server (Content Switching) dialog box, on
the Policies tab, click the arrow in the right corner of the dialog box.
5. Select AppFlow from the drop-down list.
6. Check if the AppFlow policy name has the highest priority.
Also, from the command line interface, run the sh appflow global command to make sure that the global AppFlow
policies do not override the virtual server policies.
Are the NetScaler Insight Center virtual appliances and port values set correctly on the NetScaler appliance? To check:
1. On the Configuration tab of NetScaler appliance, navigate to System > AppFlow.
2. Under Policy manager select AppFlow policy Manager.
3. Select a virtual server (LB virtual server or CS Virtual server).
4. Double click Action Name and verify that if the NetScaler Insight Center IP address and port are correct.
On the NetScaler appliance, is traff ic f lowing through the virtual server for which data collection was enabled in
NetScaler Insight Center? Also verify that the hits counter is increasing on the AppFlow policy, by running the following
command from the NetScaler command line interface:
sh appflow policy <policyname>
Is UDP port 4739 on the NetScaler Insight Center virtual appliance reachable from NetScaler appliance?
To see Web Insight records, run the following command on the NetScaler command line interface to check if Log only

© 1999-2017 Citrix Systems, Inc. All rights reserved. p.73https://docs.citrix.com
client-side traff ic is set to NO.
show appflow param
Example
> show appflow param AppFlow parameters IPFIX template refresh interval: 3600 seconds Appname refresh interval: 60 seconds IPFIX flow record export interval: 60 seconds IPFIX UDP Path MTU: 1472 bytes HTTP URL logging: ENABLED AAA username logging: ENABLED HTTP cookie logging: ENABLED HTTP referer logging: ENABLED HTTP method logging: ENABLED HTTP host logging: ENABLED HTTP user-agent logging: ENABLED HTTP Content-Type header logging: ENABLED HTTP Authorization header logging: ENABLED HTTP Via header logging: ENABLED HTTP X-Forwarded-For header logging: ENABLED HTTP Location header logging: ENABLED HTTP Setcookie header logging: ENABLED HTTP Setcookie2 header logging: ENABLED Log only cl ient-side traffic: NO Connection Chaining: DISABLED If Log only client-side traff ic is set to YES, then run the following command to change the setting to NO:
set appflow param -clientTrafficOnly (YES | NO)
Example:
set appflow param -clientTrafficOnly NOIs NetScaler Insight Center receiving data records from the device?
To verify that NetScaler Insight Center is receiving data records,
On the NetScaler Insight Center virtual machine, open the mps_afdecoder.log f ile located in /var/mps/log/ and check
to see if the f ile displays text similar to the following once every second:
Monday, 22 Dec 14 20:12:03 +0000 [Debug] For AFProto Thread id :: 34473829696, Elapsed time is:1010014 micro sec, Packet pick up is: 19, Packet processed is: 19, Decode rate is: 18/sec, Meandecode rate is: 13/sec, Data record processed is: 29, Data record routed is: 15
Following are descriptions of the parameters in the above text:
Elapsed time is: T ime consumed, in microseconds, since NetScaler Insight Center last displayed this text.
Packet pick up is: Number of UDP packets that NetScaler Insight Center has received in the elapsed time.
Packet processed is: Number of UDP packets that NetScaler Insight Center has processed in the elapsed time.
Decode rate is and Mean decode rate is: Rate at which NetScaler Insight Center has received UDP packets.
Data record processed is: Number of data records present in the UDP packets that were successfully decoded.
(One UDP packet can contain more than one data record).

© 1999-2017 Citrix Systems, Inc. All rights reserved. p.74https://docs.citrix.com
Data record routed is: Number of data records that were routed properly to a proper handler (such as Web Insight
or HDX Insight).
If the Data record routed is parameter's value is consistently zero, the NetScaler Insight Center virtual machine is
not receiving any valid data records. Check the device's AppFlow configuration, or contact the technical support team
to debug the issue.
On the NetScaler Insight Center virtual machine, in the mps_afdecoder.log f ile located at /var/mps/log/, check to see
if NetScaler Insight Center displays the data records, such as :
ica_session_setup, ica_session_network_update, and ica_session_update, every second for HDX Insight.
l7_clt_to_ns, ns_es4ns_client_load and ns_es4ns_client_render records every second for Web Insight.
If it displays these records, the data records are being sent to NetScaler Insight Center. Otherwise, check the device's
AppFlow configuration.
Are the data record logs enabled for Web Insight and/or HDX Insight?
To check, on the Configuration tab, click System, and in the right pane, select Change Data Record Log Settings and
verify that the HDX Insight Logs or/and Web Insight logs option is selected.
Note: Web Insight logs are disabled by default.
Enable Web Insight Logs only if the value of Data record routed is parameter in the var/mps/log/mps_afdecoder.log file
is in the range of 1 to 20. If the value is more than 20, disable AppFlow on the virtual server that has high traffic. If you
enable Web Insight logs for a virtual server that has high traffic, the load on the mps_afdecoder.log file can become
heavy and the appliance can become unresponsive.
NetScaler Insight Center does not display reports for a particular user name. What should I do?
If you suspect that a particular user report is not being displayed, on the NetScaler Insight Center virtual machine, open the
mps_afdecoder.log f iles located in /var/mps/log/ f ile and run the following command:
grep <username> < mps_afdecoder.log>
If the output includes the user name, the user record is displayed in the reports. If the output does not display the user
name, verify that the Citrix Receiver version being used is supported by NetScaler Insight Center. For details, see Supported
Software.
Why does the WAN latency and DC latency metrics display the values zero?
If the latency is less than 1 millisecond, the WAN latency and DC latency values are displayed as zero.
I am not able to add a NetScaler appliance. What are the possible reasons?
Make sure that NetScaler appliance you add is UP and reachable when you add it to the Inventory. If the appliance is
DOWN, or OUT-OF-SERVICE, you cannot add it to the Inventory.
Make sure that you have not added a standalone Access Gateway Standard appliance.
The session up time value is incorrect.
Make sure that the times set for the NetScaler appliance and NetScaler Insight Center are correct and in sync. For more
information, see Configuring Clock Synchronization.
The graphs are not clearly displayed or they look scrambled.
Clear the browser cache and retry. Also make sure the NetScaler Insight Center is supported on the browser. For details, see
Accessing NetScaler Insight Center.
I am unable to log on to NetScaler Insight Center through the Internet Explorer browser.
The browser might be set in compatibility mode. To disable compatibility mode, go to Tools >Compatibility ViewSettings and clear the Display all websites in Compatibility View check box.

© 1999-2017 Citrix Systems, Inc. All rights reserved. p.75https://docs.citrix.com
If you still cannot access NetScaler Insight Center after you disable the compatibility mode in Internet Explorer version 8 or
9, make sure that the browser mode and document mode in the browser are set to the same version. To view the
configuration, press F12. Set the values to either Internet Explorer 8 or Internet Explorer 9.
Why does the RTT metric display an incorrect value? Or, The ICA RTT is shown as N/A on the NetScaler InsightCenter reports. What should I do?
To debug this issue, check to see if the EUEM value on XenApp or XenDesktop is enabled or not. If EUEM is disabled, then
NetScaler Insight Center does not display the ICA RTT values. If EUEM is enabled, and ICA RTT is shown as N/A, then
perform each of the following diagnostic operations sequentially till the issue is resolved.
Check if the Citrix End User Experience Monitoring (EUEM) configurations are enabled on the XenApp server:
1. From the Citrix AppCenter, navigate to Citrix Resources > XenApp > Farm > Policies.
2. On the Settings tab, go to ICA > End User Monitoring and make sure that the following configurations are enabled:
ICA Round Trip Calculation
ICA Round Trip Calculation Interval
ICA Round Trip Calculation for Idle Connections
3. Verify the configurations.
1. Check for ICA RTT policy entries in the registry.
1. Open the command prompt from your Windows machine.
2. Type regedit and press Enter.
3. Navigate to HKEY_LOCAL_MACHINE > Software > Policies > Citrix > EndUserMonitoring.
4. Make sure that the following configurations are available:
ICA Round Trip Calculation
ICA Round Trip Calculation Interval
ICA Round Trip Calculation for Idle Connections
2. Make sure that the services for these configurations are set to Automatic.
1. Open the command prompt from your Windows machine.
2. Type services.msc and press Enter.
3. In the Services dialog box, make sure that Citrix End User Experience Monitoring is listed and the Startup
Type is set to Automatic.
If you are using a virtual desktop application, make sure that the Startup Type is set to Automatic. This has to be done
on the master image.
1. Open the command prompt from your Windows machine.

© 1999-2017 Citrix Systems, Inc. All rights reserved. p.76https://docs.citrix.com
2. Type services.msc and press Enter.
3. In the Services dialog box, make sure that Citrix End User Experience Monitoring is listed and the Startup Type is
set to Automatic.
Make sure that the Citrix EUEM Hotfix is available.
1. Open the command prompt from your Windows machine.
2. Type appwiz.cpl and press Enter.
3. On the Uninstall or Change a Program dialog box, make sure that the Citrix HotFix XA650R01W2K8R2X64064 for
the XenApp 6.5 with R01 server is installed.
Make sure that the value of f lowRecordInterval parameter on the NetScaler ADC is set to 60 seconds. To verify, run the
following command on the NetScaler appliance:
show appflow param
Confirm by checking if the following output parameter is set to 60:
IPFIX flow record export interval: 60 secondsIf the value is not 60, then set the value by running the following command:
set appflow param -flowRecordInterval 60
After you start the XenApp or XenDesktop traff ic, wait for two or three minutes and check to see the ICA RTT value in
NetScaler Insight Center reports.
Check if NetScaler Insight Center dashboard displays session ID as NON-EUEM as shown in the following image:
Figure 1. NetScaler Insight Center Report
Make sure that the ICA connections actively send data.
Verify the XenApp or XenDesktop versions.
Table 1. XenApp/XenDesktop Versions and builds
Product HDX Insight
XenApp 6.5, build 6682 with HRP01
XenDesktop 5.6, build 56060
7.0 and higher versions
Table 2. Operating systems and receiver details
Operating system Receiver version

© 1999-2017 Citrix Systems, Inc. All rights reserved. p.77https://docs.citrix.com
Windows 7 3.4 Enterprise Edition
4.0 Standard Edition
Windows 8 3.4 Enterprise Edition
4.0 Standard Edition
Mac 11.8, build 238301 and above
Note: Mac client does not support ICA RTT reports for CloudBridge version 7.3.0.
Linux 13 and above
Operating system Receiver version
Make sure that the ICA RTT calculation for idle connections is enabled on the XenApp server.
Note: If none of the debugging options work, contact technical support to install the Sems Com Plugin test tool on
Xenapp Server to see if you receive ICA RTT events.
An error message is displayed when I add the NetScaler appliance to the NetScaler Insight Center inventory.
Make sure that the GUI is accessible, by verifying that port is open for communication. To do so, run the following
command from the command line interface:
show ns ip <ipaddress>
Example: show ns ip 10.102.60.31
IP: 10.102.60.31 Netmask: 255.255.255.128 Type: NetScaler IP ... ... ... gui: Enabled ... ... ... If GUI is set to secureonly, then make sure that all communication between NetScaler Insight Center and a NetScaler
appliance is over a secure channel. For more information, see Modifying System Security Settings.
Also, make sure that proper licenses are available for the NetScaler appliances that are added in NetScaler Insight Center
inventory. For more information, see Licensing Information. Also check if the required ports are open for communication.
For more details, see Ports.
I am not able to clear all the AppFlow related conf igurations for a selected virtual server by using the NetScalerInsight Center graphical user interface.

© 1999-2017 Citrix Systems, Inc. All rights reserved. p.78https://docs.citrix.com
Log on to the NetScaler appliance by using the graphical user interface and delete the required collector and action. To
delete the action name, perform the following procedure:
1. Navigate to System > AppFlow > Actions.
2. Select the AppFlow action name that you want to delete.
3. Click Remove.
To delete the collector, perform the following procedure:
1. Navigate to System > AppFlow > Collectors.
2. Select the Collector name that you want to delete.
3. Click Remove.
The following error is displayed when I upgrade the NetScaler Insight Center appliance: "Backup/ Restoreoperation in progress. Try after some time."
Reboot the NetScaler Insight Center appliance or run the following commands at the NetScaler Insight Center shell
prompt:
/etc/rc.d/analyticsd stop /etc/rc.d/analyticsd startThe HDX Insight node does not appear on the NetScaler Insight Center dashboard.
Make sure that proper licenses are available for the NetScaler appliances that are added in NetScaler Insight Center
inventory. For more information, see Licensing Information. Also check if the required ports are open for communication.
For more details, see Ports.
An error message is displayed when I access NetScaler Insight Center using Internet Explorer 8.
Some features of NetScaler Insight Center are not support on Internet Explorer 8. You can access the appliance using
Internet Explorer 9. For more details on browser support, see Accessing NetScaler Insight Center.
I cannot see the waterfall chart or the Page Analysis button on the NetScaler Insight Center dashboard.
Check the following possible causes:
1. Is the HTML Injection check box selected?
2. Is the URL response content type of the web page in text or HTML format? NetScaler Insight Center does not display
the waterfall charts if the response type is anything other than text or HTML.
3. Was the transaction for the web page successful? Make sure the response header indicates 200 OK.
4. Were the page rendering and loading successful? If either fails, the timing information is not received from the client and
the waterfall charts are not be displayed.
5. Check to see if the transactions are served by the NetScaler appliance (either NetScaler generated or served from
NetScaler cache). If so, the waterfall charts are not displayed.
6. Is the appropriate license installed on the NetScaler appliance?
NetScaler Insight Center does not display the HDX Insight reports for CloudBridge appliances. What should I do?
Check the f irewall configuration and make sure that the CloudBridge appliance and NetScaler Insight Center
communicate over port 4739.
Wait for 2 to 3 minutes after the traff ic is generated. NetScaler Insight Center usually takes two to three minutes to
display the HDX Insight reports for a user.
Check the CloudBridge discovery status on the NetScaler Insight Center Inventory.
Make sure that CloudBridge ICA connections are accelerated with Disk Based Compression (DBC) policy. To verify, on the
Monitoring tab, navigate to Optimization > Connections, and in the right pane check to see if the Compression Type is
Disk for ICA service class.

© 1999-2017 Citrix Systems, Inc. All rights reserved. p.79https://docs.citrix.com
Also, on the Configuration tab, navigate to Optimization Rules > Service Classes and in the right pane, expand ICA and
click Edit. The Acceleration Policy selected must be Disk.
On the CloudBridge appliance, make sure that the configuration for Appflow HDX Data set is enabled. Also, make sure
that the update Interval is set to one minute and NetScaler Insight Center collector IP or port should not be deleted. To
verify, on the Configuration tab, navigate to Appliance Settings > AppFlow and verify the values on the right pane.
The HDX Insight reports display the Uptime as 'Negative.' What should I do?
Make sure that the NTP server is configured on both CloudBridge appliance and NetScaler Insight Center. To add an NTP
server on NetScaler Insight Center, see Configuring Clock Synchronization.
Note: If you have configured the NTP server at a later point of time, then, run the drop_table command from the
NetScaler Insight Center Command Line Interface (CLI). Then discover the appliance again and establish a new ICA
connection.
NetScaler Insight Center does not display the geo maps. What should I do?
If NetScaler Insight Center does not display the geo maps, then make sure to follow the below steps:
1. Make sure to upload the geo database f ile:
1. On the Configuration tab, expand NetScaler Insight Center, and then click Geo Database Files.
2. From the Action drop-down menu, select Upload.
3. In the Upload Geo Database File window, click Browse.
4. Navigate to the location of the geo database f ile, GeoLiteCity.dat, and then click Upload.
2. Enable geo data collection.
1. On the Configuration tab, click Inventory.
2. From the inventory list, select the IP address of the NetScaler appliance for which you want to enable geo data
collection.
3. In the NetScaler Insight Center Inventory Setup pane, select the Enable geo data collection check box.
3. If the geo maps are not displayed even after uploading the geo database f ile and enabling geo data collection, remove
(drop) the tables in NetScaler Insight Center.
1. Run the following commands from the NetScaler insight Center command line interface:
/etc/rc.d/analyticsd stop cd /mps ./drop_table
2. Restart NetScaler Insight Center.

© 1999-2017 Citrix Systems, Inc. All rights reserved. p.80https://docs.citrix.com
NITRO API
Jun 03, 2014
With the NetScaler Insight Center NITRO protocol, you can configure and monitor the NetScaler Insight Center virtual
appliance programmatically.
NITRO exposes its functionality through Representational State Transfer (REST) interfaces. Therefore, NITRO applications
can be developed in any programming language. Additionally, for applications that must be developed in Java or .NET, NITRO
APIs are exposed through relevant libraries that are packaged as separate Software Development Kits (SDKs).
Note: You must have a basic understanding of NetScaler Insight Center before using NITRO.To use the NITRO protocol, the client application needs only the following:
Access to a NetScaler Insight Center virtual appliance.
To use REST interfaces, you must have a system that can generate HTTP or HTTPS requests (payload in JSON format)
to the NetScaler Insight Center virtual appliance. You can use any programming language or tool.
For Java clients, you must have a system on which Java Development Kit (JDK) 1.5 or above version is available. The JDK can
be downloaded from http://www.oracle.com/technetwork/java/javase/downloads/index.html.
For .NET clients, you must have a system on which .NET framework 3.5 or above version is installed. The .NET framework
can be downloaded from http://www.microsoft.com/downloads/en/default.aspx.

© 1999-2017 Citrix Systems, Inc. All rights reserved. p.81https://docs.citrix.com
Obtaining the NITRO Package
Jun 03, 2014
The NITRO package is available as a tar file on the Downloads page of the NetScaler Insight Center virtual appliance's
configuration utility. You must download and un-tar the file to a folder on your local system. This folder is referred to as
<NITRO_SDK_HOME> in this documentation.
The folder contains the NITRO libraries in the lib subfolder. The libraries must be added to the client application classpathto access NITRO functionality. The <NITRO_SDK_HOME> folder also provides samples and documentation that can helpyou understand the NITRO SDK.Note:
The REST package contains only documentation for using the REST interfaces.

© 1999-2017 Citrix Systems, Inc. All rights reserved. p.82https://docs.citrix.com
How NITRO Works
Jun 03, 2014
The NITRO infrastructure consists of a client application and the NITRO Web service, which runs on a NetScaler Insight
Center virtual appliance. The communication between the client application and the NITRO web service is based on REST
architecture and uses HTTP or HTTPS.
Figure 1. NITRO execution f low
As shown in the above figure, a NITRO request is executed as follows:
1. The client application sends a REST request message to the NITRO web service. When using the SDKs, an API call is
translated into the appropriate REST request message.
2. The web service processes the REST request message.
3. The NITRO web service returns the corresponding REST response message to the client application. When using the
SDKs, the REST response message is translated into the appropriate response for the API call.
To minimize network traffic, you retrieve the whole state of a resource from the server, modify the state of the resource
locally, and then upload it back to the server in one network transaction.
Note: Local operations on a resource (changing its properties) do not affect its state on the server until the state of theobject is explicitly uploaded.NITRO APIs are synchronous in nature. The client application waits for a response from the NITRO web service before
executing another NITRO API.
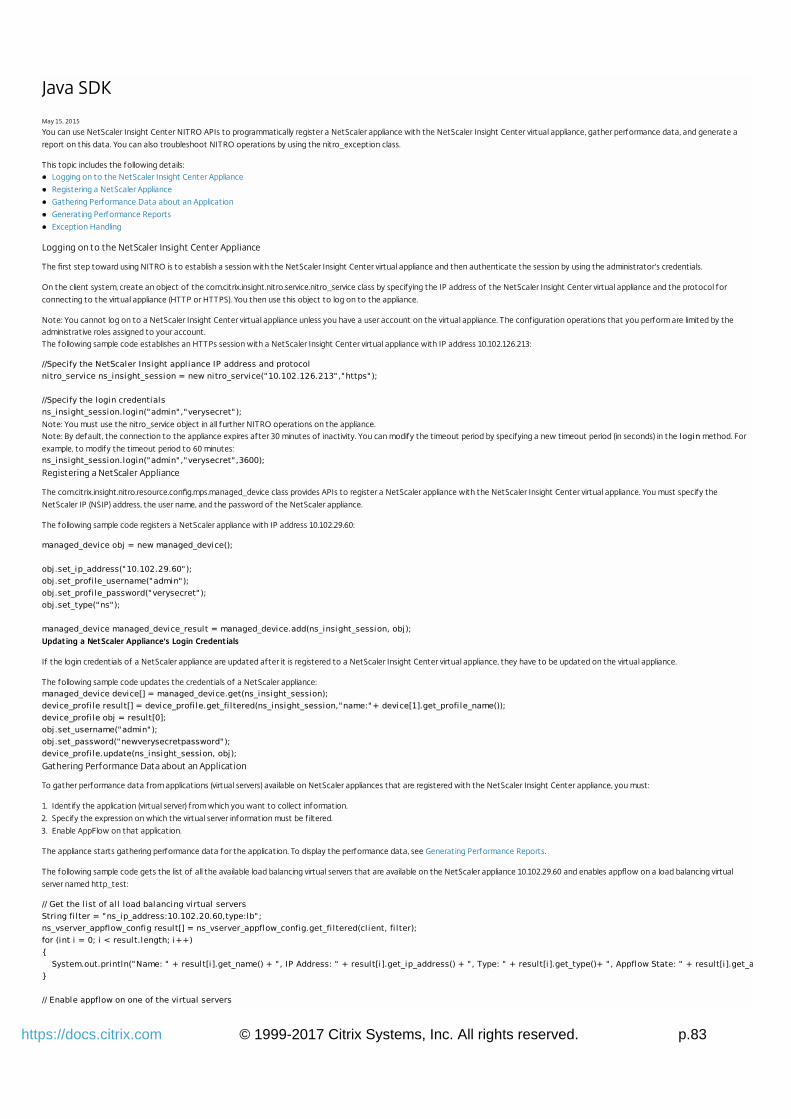
© 1999-2017 Citrix Systems, Inc. All rights reserved. p.83https://docs.citrix.com
Java SDK
May 15, 2015
You can use NetScaler Insight Center NITRO APIs to programmatically register a NetScaler appliance with the NetScaler Insight Center virtual appliance, gather performance data, and generate a
report on this data. You can also troubleshoot NITRO operations by using the nitro_exception class.
This topic includes the following details:Logging on to the NetScaler Insight Center Appliance
Registering a NetScaler Appliance
Gathering Performance Data about an Application
Generating Performance Reports
Exception Handling
Logging on to the NetScaler Insight Center Appliance
The first step toward using NITRO is to establish a session with the NetScaler Insight Center virtual appliance and then authenticate the session by using the administrator's credentials.
On the client system, create an object of the com.citrix.insight.nitro.service.nitro_service class by specifying the IP address of the NetScaler Insight Center virtual appliance and the protocol for
connecting to the virtual appliance (HTTP or HTTPS). You then use this object to log on to the appliance.
Note: You cannot log on to a NetScaler Insight Center virtual appliance unless you have a user account on the virtual appliance. The configuration operations that you perform are limited by theadministrative roles assigned to your account.The following sample code establishes an HTTPs session with a NetScaler Insight Center virtual appliance with IP address 10.102.126.213:
//Specify the NetScaler Insight appliance IP address and protocol nitro_service ns_insight_session = new nitro_service("10.102.126.213","https"); //Specify the login credentials ns_insight_session.login("admin","verysecret");Note: You must use the nitro_service object in all further NITRO operations on the appliance.Note: By default, the connection to the appliance expires after 30 minutes of inactivity. You can modify the timeout period by specifying a new timeout period (in seconds) in the login method. For
example, to modify the timeout period to 60 minutes:ns_insight_session.login("admin","verysecret",3600);Registering a NetScaler Appliance
The com.citrix.insight.nitro.resource.config.mps.managed_device class provides APIs to register a NetScaler appliance with the NetScaler Insight Center virtual appliance. You must specify the
NetScaler IP (NSIP) address, the user name, and the password of the NetScaler appliance.
The following sample code registers a NetScaler appliance with IP address 10.102.29.60:
managed_device obj = new managed_device(); obj.set_ip_address("10.102.29.60"); obj.set_profi le_username("admin"); obj.set_profi le_password("verysecret"); obj.set_type("ns"); managed_device managed_device_result = managed_device.add(ns_insight_session, obj);Updating a NetScaler Appliance's Login Credentials
If the login credentials of a NetScaler appliance are updated after it is registered to a NetScaler Insight Center virtual appliance, they have to be updated on the virtual appliance.
The following sample code updates the credentials of a NetScaler appliance:managed_device device[] = managed_device.get(ns_insight_session); device_profi le result[] = device_profi le.get_fi ltered(ns_insight_session,"name:"+ device[1].get_profi le_name()); device_profi le obj = result[0]; obj.set_username("admin"); obj.set_password("newverysecretpassword"); device_profi le.update(ns_insight_session, obj);Gathering Performance Data about an Application
To gather performance data from applications (virtual servers) available on NetScaler appliances that are registered with the NetScaler Insight Center appliance, you must:
1. Identify the application (virtual server) from which you want to collect information.
2. Specify the expression on which the virtual server information must be f iltered.
3. Enable AppFlow on that application.
The appliance starts gathering performance data for the application. To display the performance data, see Generating Performance Reports.
The following sample code gets the list of all the available load balancing virtual servers that are available on the NetScaler appliance 10.102.29.60 and enables appflow on a load balancing virtual
server named http_test:
// Get the l ist of al l load balancing virtual servers String fi lter = "ns_ip_address:10.102.20.60,type:lb"; ns_vserver_appflow_config result[] = ns_vserver_appflow_config.get_fi ltered(client, fi lter); for (int i = 0; i < result.length; i++) { System.out.println("Name: " + result[i].get_name() + ", IP Address: " + result[i].get_ip_address() + ", Type: " + result[i].get_type()+ ", Appflow State: " + result[i].get_appflowlog()); } // Enable appflow on one of the virtual servers

© 1999-2017 Citrix Systems, Inc. All rights reserved. p.84https://docs.citrix.com
ns_vserver_appflow_config new_obj = new ns_vserver_appflow_config(); new_obj.set_ns_ip_address("10.102.29.60"); new_obj.set_type("lb"); //Virtual server whose performance data must be gathered new_obj.set_name("http_test"); new_obj.set_servicetype("http"); // Policy rule new_obj.set_appflow_policy_rule("true"); // Enable appflow data collection log new_obj.set_appflowlog("enabled"); // Enable cl ient side data collection log new_obj.set_es4nslog("enabled"); ns_vserver_appflow_config ns_vserver_appflow_config_result = ns_vserver_appflow_config.add(client, new_obj);Note: To stop gathering data, disable AppFlow on the application.
Generating Performance Reports
The com.citrix.insight.nitro.resource.config.af.device class provides the APIs to generate and view reports about applications. You must retrieve the details of the application and specify the period for
which you want the details.
The following sample code generates a report for a load balancing virtual server named http_test:
device device_obj = new device(); options option_obj = new options(); option_obj.set_duration("last_1_month"); option_obj.set_pageno(1); option_obj.set_pagesize(25); option_obj.set_args("app_unit_name:http_test"); device.get_with_options(ns_insight_session, option_obj); for (int i = 0; i < result.length; i++) { System.out.println("Application: " + result[i].get_name() + ", Total requests: " + result[i].get_total_requests() + ", Total bytes: " + result[i].get_total_bytes() + ", Application response time: " + result[i].get_application_response_time()); }Exception Handling
The status of a NITRO request is captured in the com.citrix.insight.nitro.exception.nitro_exception class. This class provides the following details about the exception:
Session ID. The session in which the exception occurred.
Error code. The status of the NITRO request. An error code of 0 indicates that the NITRO request is successful. A non-zero error code indicates an error in processing the NITRO request.
Error message. A brief description of the exception.
Note: For a list of error codes, see the errorlisting.html f ile available in the <NITRO_SDK_HOME>/doc/api_reference folder.

© 1999-2017 Citrix Systems, Inc. All rights reserved. p.85https://docs.citrix.com
.NET SDK
May 15, 2015
You can use NetScaler Insight Center NITRO APIs to programmatically register a NetScaler appliance with the NetScaler Insight Center virtual appliance, gather performance data, and generate a
report on this data. You can also troubleshoot NITRO operations by using the nitro_exception class.
This topic includes the following details:Logging on to the NetScaler Insight Center Appliance
Registering a NetScaler Appliance
Gathering Performance Data about an Application
Generating Performance Reports
Exception Handling
Logging on to the NetScaler Insight Center Appliance
The first step toward using NITRO is to establish a session with the NetScaler Insight Center virtual appliance and then authenticate the session by using the administrator's credentials.
On the client system, create an object of the com.citrix.insight.nitro.service.nitro_service class by specifying the IP address of the NetScaler Insight Center virtual appliance and the protocol for
connecting to the virtual appliance (HTTP or HTTPS). You then use this object to log on to the appliance.
Note: You cannot log on to a NetScaler Insight Center virtual appliance unless you have a user account on the virtual appliance. The configuration operations that you perform are limited by theadministrative roles assigned to your account.The following sample code establishes an HTTPs session with a NetScaler Insight Center virtual appliance with IP address 10.102.126.213:
//Specify the NetScaler Insight appliance IP address and protocol nitro_service ns_insight_session = new nitro_service("10.102.126.213","https"); //Specify the login credentials ns_insight_session.login("admin","verysecret");Note: You must use the nitro_service object in all further NITRO operations on the appliance.Note: By default, the connection to the appliance expires after 30 minutes of inactivity. You can modify the timeout period by specifying a new timeout period (in seconds) in the login method. For
example, to modify the timeout period to 60 minutes:ns_insight_session.login("admin","verysecret",3600);Registering a NetScaler Appliance
The com.citrix.insight.nitro.resource.config.mps.managed_device class provides APIs to register a NetScaler appliance with the NetScaler Insight appliance. You must specify the NetScaler IP (NSIP)
address, the user name, and the password of the NetScaler appliance.
The following sample code registers a NetScaler appliance with IP address 10.102.29.60:
managed_device obj = new managed_device(); obj.ip_address = "10.102.29.60"; obj.profi le_username = "admin"; obj.profi le_password = "verysecret"; obj.type = "ns"; managed_device managed_device_result = managed_device.add(ns_insight_session, obj);Updating NetScaler Appliance's Logon Credentials
If the login credentials of a NetScaler appliance are updated after it is registered to a NetScaler Insight Center appliance, they have to be updated in the Insight appliance.
The following sample code updates the credentials of a NetScaler appliance:managed_device device[] = managed_device.get(ns_insight_session); device_profi le result[] = device_profi le.get_fi ltered(ns_insight_session,"name:"+ device[1].profi le_name); device_profi le obj = result[0]; obj.username = "admin"; obj.password = "newverysecretpassword"; device_profi le.update(ns_insight_session, obj);Gathering Performance Data about an Application
To gather performance data from applications (virtual servers) available on NetScaler appliances that are registered with the NetScaler Insight Center appliance, you must:
1. Identify the application (virtual server) from which you want to collect information.
2. Specify the expression with which to f ilter the virtual server information.
3. Enable AppFlow on the virtual server.
The appliance starts gathering performance data about the application. To display the performance data, see Generating Performance Reports.
The following sample code gets the list of all the available load balancing virtual servers that are available on the NetScaler appliance 10.102.29.60 and enables appflow on a load balancing virtual
server named http_test:
// Get the l ist of al l load balancing virtual servers String fi lter = "ns_ip_address:10.102.20.60,type:lb"; ns_vserver_appflow_config result[] = ns_vserver_appflow_config.get_fi ltered(client, fi lter); for (int i = 0; i < result.length; i++) { Console.WriteLine("Name: " + result[i].name + ", IP Address: " + result[i].ip_address + ", Type: " + result[i].type + ", Appflow State: " + result[i].appflowlog); } // Enable appflow on one of the virtual servers

© 1999-2017 Citrix Systems, Inc. All rights reserved. p.86https://docs.citrix.com
ns_vserver_appflow_config new_obj = new ns_vserver_appflow_config(); new_obj.ns_ip_address = "10.102.29.60"; new_obj.type = "lb"; //Virtual server whose performance data must be gathered new_obj.name = "http_test"; new_obj.servicetype = "http"; // Policy rule new_obj.appflow_policy_rule = "true"; // Enable appflow data collection log new_obj.appflowlog = "enabled"; // Enable cl ient side data collection log new_obj.es4nslog = "enabled"; ns_vserver_appflow_config ns_vserver_appflow_config_result = ns_vserver_appflow_config.add(client, new_obj);Note: To stop gathering data, disable AppFlow on the application.
Generating Performance Reports
The com.citrix.insight.nitro.resource.config.af.device class provides the APIs to generate and view reports of applications. You must retrieve the details and specify the period for which you want the
details.
The following sample code generates a report for a load balancing virtual server named http_test:
device device_obj = new device(); options option_obj = new options(); option_obj.duration = "last_1_month"; option_obj.pageno = 1; option_obj.pagesize = 25; option_obj.args = "app_unit_name:http_test"; device.get_with_options(ns_insight_session, option_obj); for (int i = 0; i < result.length; i++) { Console.WriteLine("Application: " + result[i].name + ", Total requests: " + result[i].total_requests + ", Total bytes: " + result[i].total_bytes + ", Application response time: " + result[i].application_response_time); }Exception Handling
The status of a NITRO request is captured in the com.citrix.insight.nitro.exception.nitro_exception class. This class provides the following details about the exception:
Session ID. The session in which the exception occurred.
Error code. The status of the NITRO request. An error code of 0 indicates that the NITRO request is successful. A non-zero error code indicates an error in processing the NITRO request.
Error message. A brief description of the exception.
Note: For a list of error codes, see the errorlisting.html f ile available in the <NITRO_SDK_HOME>/doc/ folder.
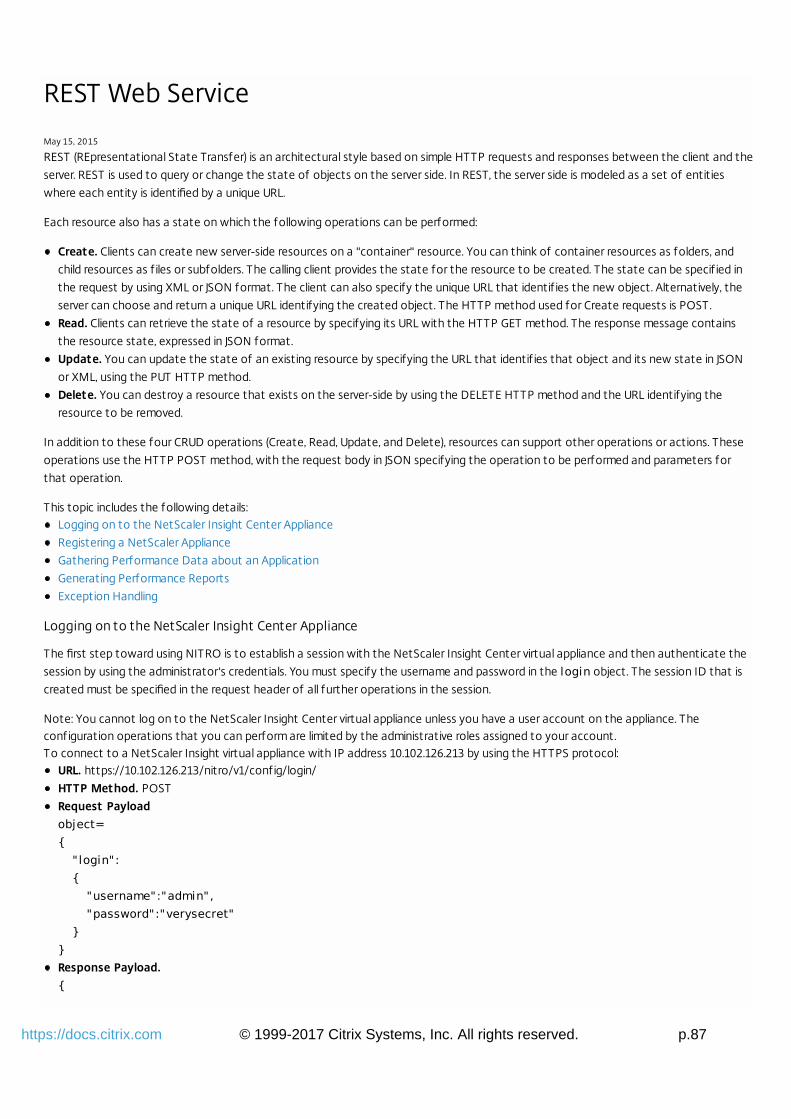
© 1999-2017 Citrix Systems, Inc. All rights reserved. p.87https://docs.citrix.com
REST Web Service
May 15, 2015
REST (REpresentational State Transfer) is an architectural style based on simple HTTP requests and responses between the client and the
server. REST is used to query or change the state of objects on the server side. In REST, the server side is modeled as a set of entities
where each entity is identified by a unique URL.
Each resource also has a state on which the following operations can be performed:
Create. Clients can create new server-side resources on a "container" resource. You can think of container resources as folders, and
child resources as f iles or subfolders. The calling client provides the state for the resource to be created. The state can be specif ied in
the request by using XML or JSON format. The client can also specify the unique URL that identif ies the new object. Alternatively, the
server can choose and return a unique URL identifying the created object. The HTTP method used for Create requests is POST.
Read. Clients can retrieve the state of a resource by specifying its URL with the HTTP GET method. The response message contains
the resource state, expressed in JSON format.
Update. You can update the state of an existing resource by specifying the URL that identif ies that object and its new state in JSON
or XML, using the PUT HTTP method.
Delete. You can destroy a resource that exists on the server-side by using the DELETE HTTP method and the URL identifying the
resource to be removed.
In addition to these four CRUD operations (Create, Read, Update, and Delete), resources can support other operations or actions. These
operations use the HTTP POST method, with the request body in JSON specifying the operation to be performed and parameters for
that operation.
This topic includes the following details:Logging on to the NetScaler Insight Center Appliance
Registering a NetScaler Appliance
Gathering Performance Data about an Application
Generating Performance Reports
Exception Handling
Logging on to the NetScaler Insight Center Appliance
The first step toward using NITRO is to establish a session with the NetScaler Insight Center virtual appliance and then authenticate the
session by using the administrator's credentials. You must specify the username and password in the login object. The session ID that is
created must be specified in the request header of all further operations in the session.
Note: You cannot log on to the NetScaler Insight Center virtual appliance unless you have a user account on the appliance. Theconfiguration operations that you can perform are limited by the administrative roles assigned to your account.To connect to a NetScaler Insight virtual appliance with IP address 10.102.126.213 by using the HTTPS protocol:
URL. https://10.102.126.213/nitro/v1/config/login/
HTTP Method. POST
Request Payloadobject= { " login": { "username":"admin", "password":"verysecret" } }Response Payload.{
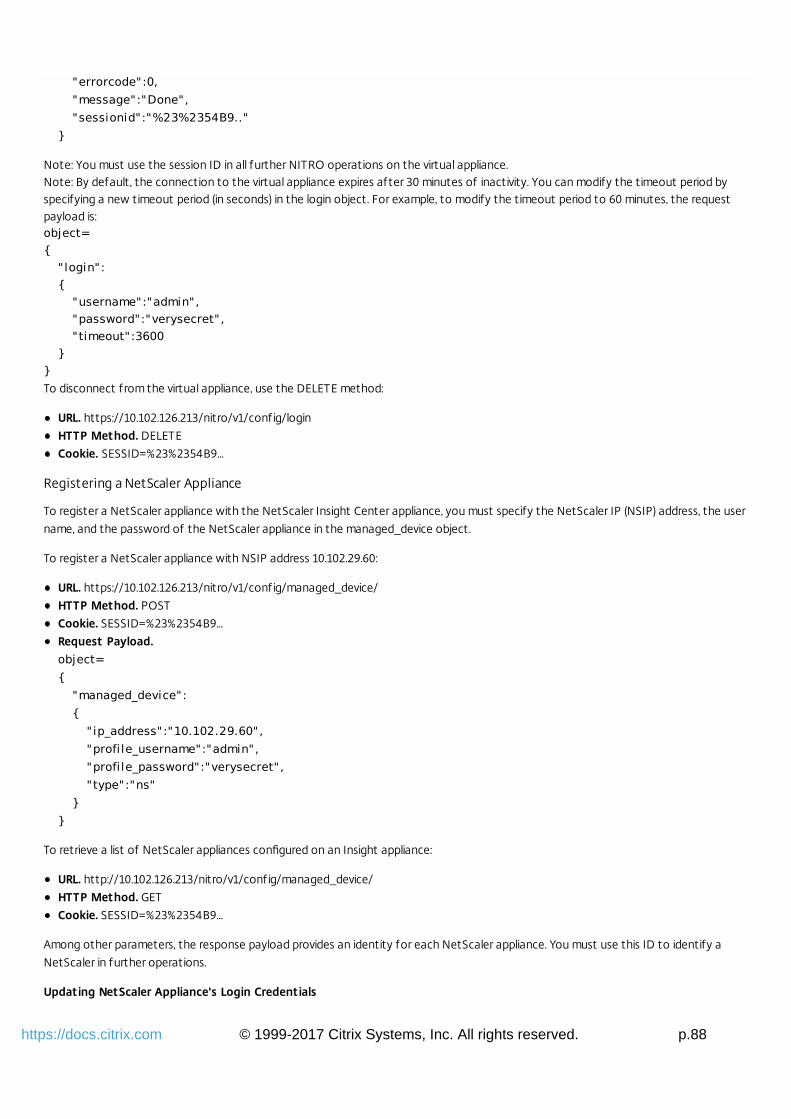
© 1999-2017 Citrix Systems, Inc. All rights reserved. p.88https://docs.citrix.com
"errorcode":0, "message":"Done", "sessionid":"%23%2354B9.." }
Note: You must use the session ID in all further NITRO operations on the virtual appliance.Note: By default, the connection to the virtual appliance expires after 30 minutes of inactivity. You can modify the timeout period byspecifying a new timeout period (in seconds) in the login object. For example, to modify the timeout period to 60 minutes, the requestpayload is:object= { " login": { "username":"admin", "password":"verysecret", "timeout":3600 } }To disconnect from the virtual appliance, use the DELETE method:
URL. https://10.102.126.213/nitro/v1/config/login
HTTP Method. DELETE
Cookie. SESSID=%23%2354B9...
Registering a NetScaler Appliance
To register a NetScaler appliance with the NetScaler Insight Center appliance, you must specify the NetScaler IP (NSIP) address, the user
name, and the password of the NetScaler appliance in the managed_device object.
To register a NetScaler appliance with NSIP address 10.102.29.60:
URL. https://10.102.126.213/nitro/v1/config/managed_device/
HTTP Method. POST
Cookie. SESSID=%23%2354B9...
Request Payload.object= { "managed_device": { " ip_address":"10.102.29.60", "profi le_username":"admin", "profi le_password":"verysecret", "type":"ns" } }
To retrieve a list of NetScaler appliances configured on an Insight appliance:
URL. http://10.102.126.213/nitro/v1/config/managed_device/
HTTP Method. GET
Cookie. SESSID=%23%2354B9...
Among other parameters, the response payload provides an identity for each NetScaler appliance. You must use this ID to identify a
NetScaler in further operations.
Updating NetScaler Appliance's Login Credentials

© 1999-2017 Citrix Systems, Inc. All rights reserved. p.89https://docs.citrix.com
If the login credentials of a NetScaler appliance are updated after it is registered to a NetScaler Insight Center appliance, they have to be
updated on the Insight appliance.
To update the password of a NetScaler appliance with IP address 10.102.29.60:
URL. https://10.102.126.213/nitro/v1/config/device_profile
HTTP Method. PUT
Cookie. SESSID=%23%2354B9...
Request Payload.{ "device_profi le": { "username":"admin", "password":"verysecret-new", " id":"507be920475294e414f90889" } }Note: The ID of the NetScaler appliance must be obtained by using the GET HTTP method on the
http://10.102.126.213/nitro/v1/config/managed_device/ URL.
Gathering Performance Data about an Application
To gather performance data from an appliance, you must select the virtual server, specify the filter condition, and then enable Appflow on
the appliance in the ns_vserver_appflow_config object. The appliance then starts gathering performance data for the applications
(services) bound to the virtual server.
Note: This operation gathers the performance data but does not display.To gather performance data of an application linked to virtual server with name "http_test":
URL. http://10.102.126.213/nitro/v1/config/ns_vserver_appflow_config
HTTP Method. PUT
Cookie. SESSID=%23%2354B9...
Request Payload.{ "ns_vserver_appflow_config": { "appflow_policy_rule":"TRUE", "appflowlog":"enabled", "es4nslog":"enabled", "name":"http_test", "state":"UP", "ns_ip_address":"10.102.29.60", " ip_address":"10.102.126.237", "type":"lb", "servicetype":"HTTP" } }
Generating Performance Reports
To generate a report of the performance data of an application (a virtual server), you must specify the period for which you want the
data in the URL.
To generate a report of the performance data for a device with IP address 10.102.71.201, for the past one month:URL. http://10.102.60.45/nitro/v1/appflow/user_agent?

© 1999-2017 Citrix Systems, Inc. All rights reserved. p.90https://docs.citrix.com
args=device_ip_address:10.102.71.201&asc=no&order_by=total_requests&pagesize=25&type=total_requests&duration=last_1_month
where,
asc=no: Displays records in descending order.
order_by=total_requests: Orders records on the basis of the total requests.
pagesize=25: Displays 25 records per page.
type=total_requests: Total requests to be displayed.
duration=last_1_month: Records of the last one month must be displayed.
HTTP Method. GET
Response Payload.{ "errorcode": 0, "message": "Done", "user_agent": [ { "__count": "-1", "http_resp_status_name": "", "server_ip_address": "", "name": "Chrome", "http_req_method_name": "", "rpt_sample_time": "-1", "total_bytes": "16644969", "device_ip_address": "10.102.71.201", "uri_url": "", "max_transaction_time": "-1", "app_unit_name": "", "render_time": "14", "cl ient_ip_address": "", " id": "", "app_unit_ip_address": "", "total_requests": "245", "operating_system_name": "" }, { "__count": "-1", "http_resp_status_name": "", "server_ip_address": "", "name": "Unknown", ... ... } ] }
Exception Handling
The response header provides the status of an operation by using HTTP status codes and the response payload provides the requested
resource object (for GET method) and error details (for unsuccessful operation). NITRO does not provide a response payload for
successful POST, PUT and DELETE methods. For successful GET method, the response payload consists only the requested resource
object.
For a more detailed description of the error codes, see the API reference available in the <NITRO_SDK_HOME>/doc folder.