neuro neurosurgery - library and archives canada logy and neurosurgery mcgill university montreal,...
TRANSCRIPT

Nathalie Routhier
Neuro logy and Neurosurgery
McGill University
Montreal, Canada.
September 1997
A thesis submitted to the Faculty of
Graduate S tudies and Research
in partial fblfillment of the requirements of the degree of
Master of Science
O Nathalie Routhier 1997
National Library I * m of Canada Biblioth&que nationale du Canada
Acquisitions and Acquisitions et Bibliographie Services services bibliographiques
395 Wellington Street 395. nie Wellington OttawaON KlAON4 OttawaON KlAON4 Canada Canada
The author has granted a non- L'auteur a accordé me licence non exclusive licence allowing the exclusive permettant à la National Library of Canada to Bibliothèque nationale du Canada de reproduce, loaq distribute or sell reproduire, prêter, distribuer ou copies of this thesis in microform, vendre des copies de cette thèse sous paper or elecbonic formats. la forme de microfiche/£ih, de
reproduction sur papier ou sur format électronique.
The author retains ownership of the L'auteur conserve la propriété du copyright in this thesis. Neither the droit d'auteur qui protège cette thèse. thesis nor substantial extracts fkom it Ni la thèse ni des extraits substantiels may be printed or otheMrise de celle-ci ne doivent être imprimés reproduced without the author's ou autrement reproduits sans son permission. autorisation.

Candidates have the option of including, as part of the thesis, the text of a paper(s)
submitted or to be submitted for publication, or the clearly-duplicated text of a published
paper(s). These texts must be bound as an integral part of the thesis.
If this option is chosen, connecting texts that provide logical bridges between the
different papers are mandatory. The thesis must be Wntten in such a way that it is
more than a mere collection of manuscripts; in other words, results of a senes of papers
must be integrated.
The thesis must still conform to al1 other requirements of the "Guidelines for Thesis
Preparation". The thesis must include: A Table of Contents, an abstract in English and
French, an introduction which clearly states the rationale and objectives of the study, a
cornprehensive review of the literature, a &al conclusion and summary, and a thorough
bib liography or reference lis t.
Additional material m u t be provided where appropnate ( e g in appendices) and in
sufncient details to allow a clear and precise judgement to be made of the importance and
originality of the research reported in the thesis.
In the case of manuscnpts co-authored by the candidate and others, the candidate is
required to make an explicit statement in the thesis as to who contributed to such
work and to what extent. Supervisors m u t attest to the accuracy of such statements at
the doctoral oral defense. Since the task of the examiners is made more difficult in these
cases, it is in the candidate's interest to make perfectly clear the responsibilities of al1 the
authors of the co-authored papers. Under no circumstances can a co-author of any
component of such a thesis serve as an examiner for that thesis.

1 k t want to thank my supervisor, Dr Jean Gotman, who provided me with the
opportunity to conduct this study and to expand my knowledge of the field of
neurosciences. His expertise and his availability were greatly appreciated throughout this
research project.
Dr François Dubeau provided useful comments on various parts of the thesis and
communicated his enthusiasm to the team. 1 want to thank Mç Nicole Drouin, Ms
Lorraine Allard and Ms Josée Ailard for their precious technical support and for their
dedication to the project. Ms Drouin and Ms Josée Allard designed equipment
specifically for this study. M. Eddy Puodziunas greatly helped us in dealing with
technical problems related to the recording of evoked potentials. M. Micheal Frank wrote
a program for the joint display of dipoles and MM. M. Yiou Huang was helpful in
solving computer-related problems. Dr Alejandro Bastos reviewed MRIs and was helpful
in establishing diagnoses. M. Rock Comeau helped us in the difficult issue of mapping
electrode positions in MR1: coordinates.
Dr Daniel Gendron was helpful in getting the experiments started and in organizing al1
testing performed in the EMG department. Dr Felipe Quesney and Dr Terry Peters
provided use of the EEG and MRI facilities respectively.
ABSTRACT
The somatosensory representations of hands and feet were deterrnined using spatio-
temporal source analysis of median and postenor tibial nerve somatosensory evoked
potentials (SEPs). In 10 control subjects, modeled generators mapped on MRI correlated
well with the primary somatosensory cortex identified with slrict radiological criteria For
median nerve stimulation, the main generator was located 3.5 mm fiom the central sulcus
on average ( d e r correction for eccentricity) and was perpendicular to it. For posterior
tibial nerve stimulation, the main generator was slightly antenor to the central sulcus
(average distance 6.6 mm) and pointed predominantly postenorly and towards the
longitudinal fissure. In 3 patients with central dysgenetic lesions, all with normal
somatosensory bctions, modeled generators were located outside the lesion, 2 of these
generators being unequivocally displaced to adjacent normal cortex. The only exception
was one patient with small amplitude SEPs, possibly explained by misaligned pyramidal
cells inside the dysgenetic cortex.
Les représentations sensorielles de la main et du pied ont P.té déterminées à l'aide de
l'analyse spatio-temporelle des générateurs des potentiels somesthésiques évoqués par la
stimulation des nerfs médians et tibial postérieurs. Chez les 10 sujets normaux, les
générateurs illustrés sur 171RM corrélaient bien avec le cortex sensoriel primaire identifié
à l'aide de critères radiologiques stricts. Pour le nerf médian, le générateur principal était
situé i une distance moyenne de 3.5 mm du sulcus central (après avoir comgé
I'excenûicité) et était perpendiculaire à celui-ci. Pour la stimulation du nerf postérieur
tibial, le générateur principal était situé légèrement antérieur au sulcus central (distance
moyenne de 6.6 mm) et pointait principalement vers la fissure longitudinale et l'arrière de
la tête. Chez 3 patients avec lésions dysgénétiques centrales et des fonctions sensorielles
intactes, les générateurs modélisés étaient situés à l'extérieur des lésions, deux d'entre eux
ayant sans équivoque été déplacés vers le cortex normal. La seule exception était un
patient présentant des potentials de très petite amplitude, possiblement causés par le
manque d'alignement des cellules pyramidales à l'intérieur du cortex dysgénétique.
Preface
Acknowledgments
Abstract
Résumé
Table of Contents
1. Introduction 1
1.1 Historkal Review of the Functional Mapping of the Sornatosensory 1
Cortex
1.2. Somatosensory Evoked Potentials (SEPs)
1.2.1 Anatomical Substrate
1.2.2 The Underlying Generators
t -2.2.1 Stimulation of the Median Nerve
2 -2.2.2 Stimulation of the Posterior Tibial Nerve
1 -2.3 Influence of Extemal Variables
1.2.3.1 Variables affecting the Latency of SEPs
1.2.3.2 Variables affecting Scalp Topography
1.3 Investigating the Generators of SEPs: Dipole Modeling
2. Project Definition
3. Literature Review
3.1 Mapping the Somatosensory Cortex
3.1.1 Neurologically Normal Subjects
3.1 -2 Patients with Central Lesions
3.1.3 SEPs in Patients with Central Dysgenetic Lesions
4. Study on the Anatomical Substrate of Generators of Sornatosensory 22
Potentials Evoked by Median and Posterior Tibial Nerve Stimulation
5. Study on Patients with Central Dysgenetic Lesions
6. Conclusion
7. References

1.1 Historical Review of the Functional Mapping of the Somatosensory Cortex
The first large-scale study demonstrating a discrete cortical representation of
somatosensory function in humans was performed by PenfieId and Boldley (1937), using
inmcranial stimulation. From 1928 to 1937, these researchers stimulated the exposed
somatosensory cortex of 126 patients during surgery for the treatrnent of intractable
epilepsy, resulting in either numbness or tingling in parts of the contralateral hemibody-
These sensations were elicited by stimulation of the anterior lip of the post-central gyms,
but stimulation of Brodmann's areas 4 and 6a alpha, anterior to the central sulcus, also
elicited these sensations. A distinct somatotopic arrangement of sensation was invariably
observed on the post-central gyms, with an unequal representation of the diEerent parts of
the body. Penfield and Boldley concluded that cortical representation of cutaneous
sensation is located predominantly but not only on the post-central gyrus and invariably
follows a somatotopic arrangement.
The search for the anatomical substrate of somatosensory function has since been
addressed with other electrophysiological methods. In 1950, Dawson k t performed
scalp-recordings of electrical cortical potentials evoked by penpheral nerve stimulation in
humans. Similar potcntials were later recorded fiom eiectrodes on the cortex, dlowing
for a direct localization of the largest amplitude potentials on cortical anatomy (Woolsey
1958). This paradigrn, called somatosensory evoked potentials (SEPs), approximates
everyday cutaneous stimulation. Penpheral stimulation also evokes magnetic fields
which are generated in the cortical mantle of the sulci, with an orientation perpendicular
t~ the evoked electrical fields. In 1978, Brenner et al recorded for the k s t tirne magnetic
evoked fields (MEF) following cutaneous peripheral stimulation. Uniike SEPs, MEFs are
not distorted by the skull and scalp. However, MEFs only records f?om tangentiai sources
located in the sulci, ignoring the radiai sources. Both SEPs and MEFs results (Yang et
al. 1993; Kawamura et al. 1994; Buchner et al. 1995) were congruent with the homoncula.
organization documented by Pedield. Localization of the somatosensory cortex in area 4
in addition to the post-central gynis has also been reported (Kawarnura et al. 1996).
Penpheral cutaneous stimulation also evokes changes in the metabolic activity of the
somatosensory cortex. Measurements of regional cerebral blood flow or oxygen
consumption with Positron Emission tomography (PET) dunng cutaneous stimulation
show activation of cortical regions involved in somatosensory functions (Fox et al. 1987).
The spatial resolution of this technology now ranges £tom 4.6 to 6.4 mm (Evans et al,
1991), but temporal resolution is quite poor. Functional MRI, which renects variations in
the oxygenation state of the venous vasculature, appears to be a promising non-invasive
technique to study the sornatosensory cortex (Hammeke et al. 1994). The temporal
resolution is approximately 0.5 seconds (Cohen and Bookheimer 1994) and the spatial
resolution of the signal is in the order of 3.75 mm (Haznmeke et al. 1994), and is
expected to reach 1 or 2 mm (Cohen and Bookheimer 1994).
1.2 Somatosensory Evoked Potentials (SEPs)
Amon2 the various techniques outlined above, SEPs present strengths and weaknesses
that detennine its unique contribution to the study of the mapping of somatosensory
cortex. Ln contrast to modern imaging methods, scalp-recorded SEPs constitute a non-
invasive, inexpensive paradigm that provides, with MEG, the greatest temporal resolution
of the above mentioned techniques. Therefore, brain mapping can be detailed in the first
rnilliseconds following stimulus onset. The following paragraphs will detail the technique
of SEPs, its matornicd correlates and the results obtaùied in various studies.
1-2.1 Anatomical Substrate
sornatosensory evoked potentials result kom activation of the dorsal column-media1
Iemniscal system, which is reproduced graphically in figure 1.
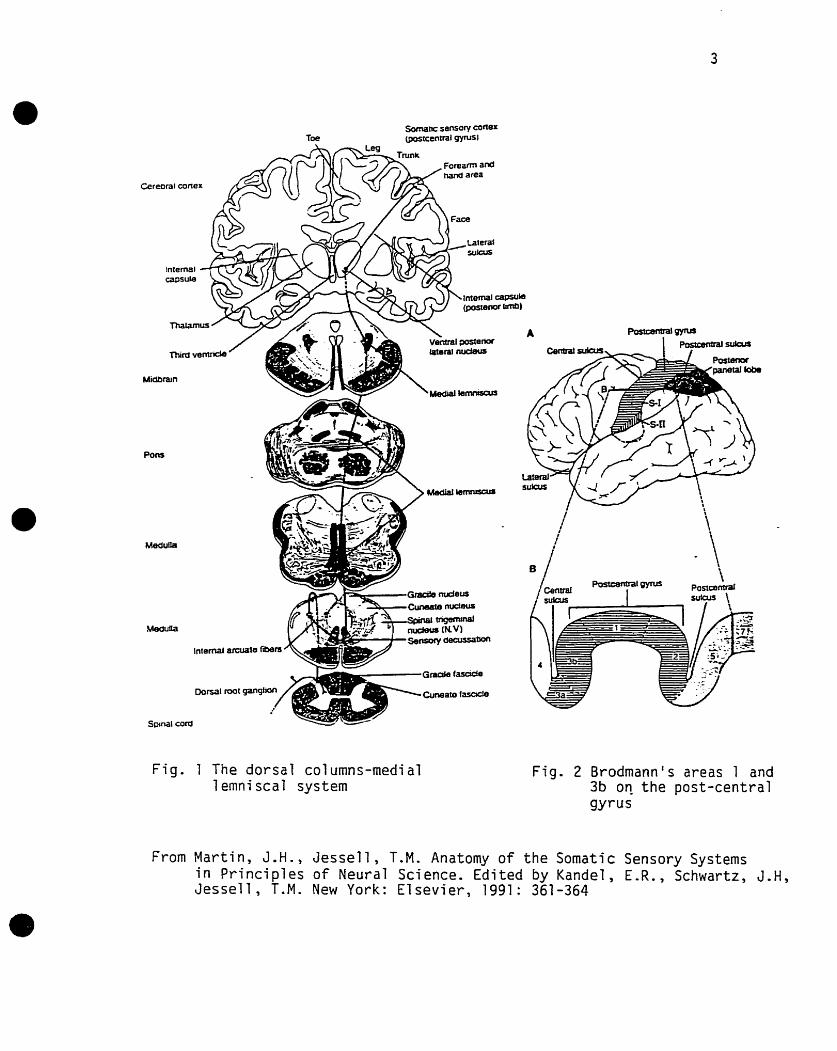
Fig . 1 The dorsa l co l umns-media1 lernniscal system
Fig . 2 Brodmann' s areas 1 and 3b on the post-central gyrus
From Mart in , J.H., Jesse l l , T.M. Anatomy o f the Somatic Sensory Systems i n P r i nc ip les o f Neural Science. Edi ted by Kandel , E.R., Schwartz, J.H, Jessell, T.M. New York: E lsev ie r , 1991: 361-364
Electrical stimulation applied at the wrist and ankle to elicit SEPs activates predominantly
large-diameter, fast-conducting group Ia muscle and group II cutaneous afferent fibers
(Halonen et al. 1988). The central process of these fibers ascends in the dorsal columns
ipsilaterally and synapses onto the gracile (legs) and cuneate (arms) nuclei in the lower
medulla. Second-order neurons cross the midline ventral to the central canal as the
interna1 arcuate fibers and form the medial lemniscus, a contralateral ascending tract. The
medial lemniscus synapses onto the ventrobasal complex of the thalamus, more precisely,
the ventral posterior lateral nucleus pars caudalis (VPLC). In the VPL, the legs are
represented more laterally and the arms more medially (Carpenter 1996). Thkd order
neurons consist of thalamo-cortical neurons projecting to Brodmann's areas 1 and 3b on
the post-central gynis (figure 2), where cutaneous sensation is represented (Carpenter
1996).
The cortical representations of the a m and leg are inverted with respect to that of the
thalamus, with the leg and foot represented more medially, in the paracentral lobule, and
the a m and hand more laterally, in the mid-convexity. The spinothalamic system does
not seem to bear much importance in cornparison with the dorsal-column-medial-
lemniscal system in the generation of SEPs (see Chiappa 1989, for review).
1.2.2 The Underlying Generators
1.2.2.1 Stimulation of the Median Nerve
Multiple evoked potentials are generated along the ascending sornatosensory pathway
following stimulation of the median nerve. The potentials labeled N9, NI 3, P 14, N20,
P20, and P22 c m reliably be detected in neurologically normal subjects. The narne o f the
potentials are based on their polarity (in standard recording montages) and their
approximate latency post-stimulus. For example, N9 is a negative potential generated 9
msec after stimulus onset. The nomenclature of the potentials is quite complex since

different authors use different narnes for the same potential- Figure 3 illustrates the early
potentials evoked by stimulation of the nght median nerve. Positivity will be plotted
upwards in the figures demonstrating the various potentials.
r --r - L
FCz
Fig. 3 SEPS following stimulation of the right median nerve in a normal subject. The N13 potential was recorded on the 6" cervical vertebra (C6) and the P l 4 potential could be observed in midline antenor head region (Fz). These potentials were followed by the N20 and P20 potentids, well recorded in the contralateral centroparietal region (CP3) and fkontocentral region (FCl) respectively. The P22 potential was recorded at CP3.
Peripheral and subcortical potentials N9, NT3, and Pl4 will only be discussed briefly as
the emphasis of this study is on cortical mapping. The N9 potential is generated
immediateiy distal to the brachial plexus (Aminoff and Eisen 1996). The NI3 potential,
which is recorded via an electrode piaced on the sixth cervical vertebrae (C6) in reference
to Fz, results either fiom postsynaptic activity in the gray matter of the c e ~ c a l spinal
cord or fkom activity in the cuneate nucleus (Desmedt and Cheron 1980, 198 1). The far-
field P 14 is generated in the medial lemniscus, at the level of the foramen magnum
(Desrnedt and Cheron 198 1; Delestre et al. 1986). It is important to note that an absence
of these potentials does not necessarily impty a lesion in these generators. In fact, factors
such as changes in the resistance or irnpedance of the volume conductor and the anatomic
orientation of the traveling impulse are lmown to influence the generation of these
potentials (Kimura et al. 1983, 1984).
Approximately twenty milliseconds after median nerve stimulation, a positivity (3'20)
develops antenor to the central sulcus and a negativity (N20) is recorded postenor to the
central sulcus in the hemisphere contralateral to stimulation. In figure 3' maximal
amplitude for the N20 and P20 potentials is recorded at electrodes CP3 and FCl,
approximately 20 msec after stimulation of the right median nerve. Two to five
milliseconds later, an isolated positivity called P22 devetops over the left central region.
Nthough some authors locate the generators of the N20, PZ0 and P22 potentials at a
subcorticai level (Chiappa 1989), it is generally agreed that they are cortically generated
potentials (Allison et al. 1989).
Four theories have been proposed to explain the distribution of these scalp-recorded
cortical potentials. In these theories, generators are modeled as dipoles or elecûical
sources that project in opposite directions positive and negative electrical fields of equal
magnitude. First proposed by Brazier (1 949), dipolar rnodek have received some
experirnental support (Landau 1967). Moreover, it is reasonable to assume that
generators are compact neuronal dipo lar sources whenever scalp potential generators are
spatially resû-icted relative to the distance at which they are recorded, regardless of the
underlying electrophysioIogy (Snyder 199 1). Dipoles are usually classified as radial,
tangential or oblique, depending on their orientation with respect to a spherical model of
the head. In the two radial dipoles model, N20 is generated by a radial dipole over the
post-central gyms, while P20 is generated via a separate radial dipole over the pre-central
gyms and other pre-motor areas (Papakostopoulos and Crow 1980). In the tangential
model, a tangential dipole locatsd in area 3b of the post-central gyrus and pointing
towards the pre-central gyrus generates the N20 and P20 potentials (Broughton 1969).
The tangential + somatosensory radial model proposes, in addition to the above discussed
tangential dipole, a radial dipole in the somatosensory cortex (Brodmann's area 1) to
account for the P22 potential (Allison et al. 1980,1989). Finally, the tangential + motor
radial mode1 explains the P22 potential with a radial dipole in the motor cortex rather than
in Brodmann's area I (Deiber et al. 1986; Cohen and Starr 1987; Desmedt et al. 1987;
Nogueira et al. 1989; Abbruzzesse et al. 1990). Some authors hypothesized that N20 arose
fiom a tangentid generator activated by afferents fiom the VPL, nucleus, whereas P22
arose fiom a radial generator in area 4 activated by afferents fiom the nucleus ventraiis
intemedius of the thalamus (Mauguiere et al. 1983; Desmedt et al. 1987; Mauguiere and
Ibanez 1990).
1.2.2.2 Stimulation of the Posterior Tibia1 Nerve
Twenty-one milliseconds after stimulation of the posterior tibial nerve, a negative
potential (N21) is generated at the level of the first lumbar vertebra, probably reflecting
postsynaptic activity produced by axon collaterals in the lurnbar gray matter (Emerson
1988). The N21 potential of posterior tibial nerve SEPs and N9 potential of median nerve
SEPs reflect the integrity of peripheral nerves, allowing for distinctions between
abnormalities of the peripheral and central nervous system. The N35 potential is a small
amplitude negativity broadly distributed over the scalp, and predominating over rnidline
antenor regions (Chiappa 1989) and the contralateral centroparietal cortex (Yamada et
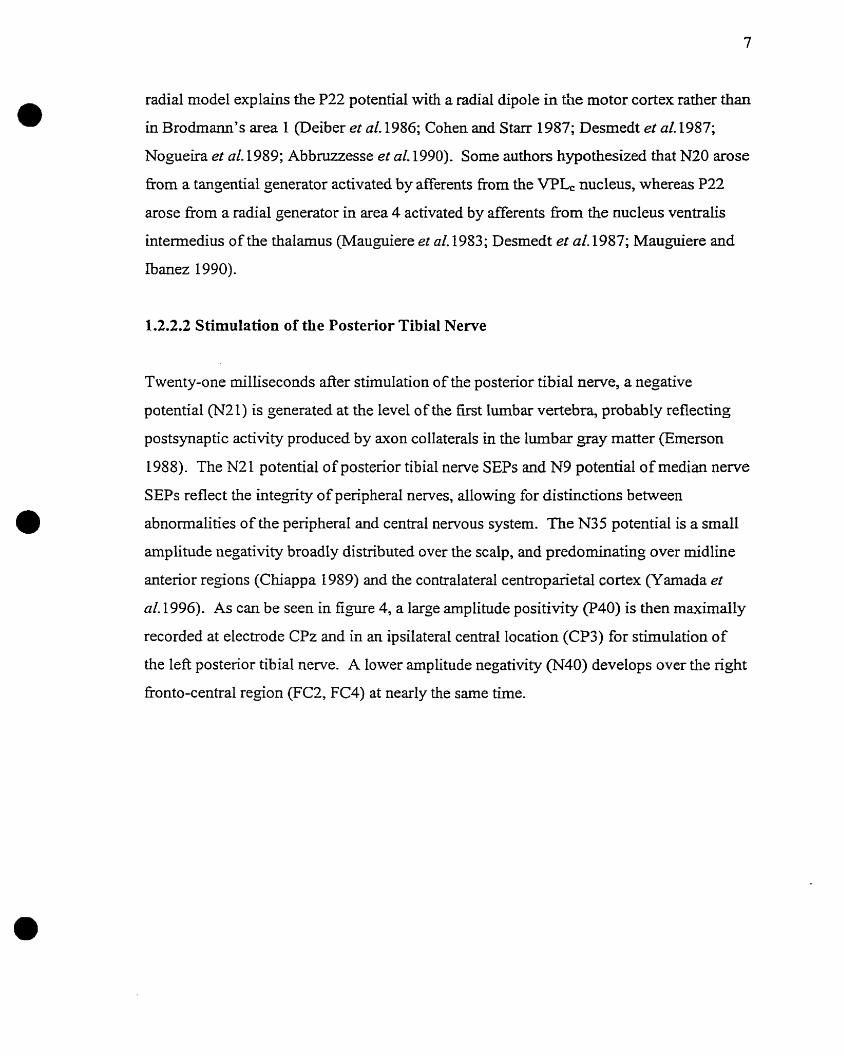
al. 1996). As can be seen in figure 4, a large amplitude positivity (P40) is then maxirnally
recorded at electrode CPz and in an ipsilateral central location (CP3) for stimulation of
the left posterior tibial nerve. A lower amplitude negativity (N40) deveIops over the right
Eonto-central region (FC2, FC4) at nearly the same t h e .
Fig. 4 SEPS following stimulation of the left posterior tibia1 nerve in a normal subject. P40, N50 and P60 potentials were best d e h e d l i the centro-parietal midline region (CPz), while the N40 potential was best defhed in the contra- lateral koonto-central region (FC4).
Three hypotheses have been proposed to explain the generators of N35 and P40. In the
first one, the origin of the generator of N35 is considered to be subcortical. The P40/N40
potentials are generated by a dipole located in region 3b of the contralateral paracentral
lobule. The orientation of this dipole is either tangential or oblique, depending on the foot
and leg representation on the paracentral lobule. The P40/N40 is thought to parallel the
median nenre N20P20 (Seyal et ai. 1983). In the second hypothesis, N35 is also
generated subcortically, but multiple generators underlie the P40/N40 potential (Kakigi
and Shibasaki 1983). Multiple generators are deemed necessary since there is a slight
latency difference between N40 and P40. The third hypothesis postulates that N35, which
is cortically generated, represents the counterpart to the median nerve N20. P40 is
generated by a radial source, rnirnicking the median nerve P22 (Yamada et al. 1996).
However, this theory does not account for the N40 potential which also appears over the
contralateral centroparietal region approximately 40 msec after stimulus onset. Moreover,
if N35 is the counterpart to the N20 generated in the primary sornatosensory cortex, this
potential would be expected to have its maximum amplitude over the cortical
representation of the leg. Yamada et al (1996) reported a maximal amplitude over the
contralateral hemisphere at C3 or C4. Therefore, it is more likely that one tangential or
oblique source or muItiple generators located ia the paracentral lobule generate the
N40P40 potentials, providing a counterpart to the N20P20 rnedian nerve potentiais. No
counterpart has been proposed for the rnedian nerve P22 potential.
1.2.3 Influence of Externa1 Variables
1.2.3.1 Variables affecting Latency
The eEect on SEP latencies of variables such as age, height, gender and antiepileptic
drugs has been extensively studied to improve the use of SEPS as a diagnostic tool.
Results based on absolute latency, which is the time elapsed between stimulus onset and
the potential studied, will not be reviewed here. The emphasis will radier be on central
conduction time (CCT), a synonym for interwave and interpeak latency. CCT is the tirne
elapsed between the latency of a £kt potential generated at the entry or inside the CNS
and that of a potential generated at a later time. CCT is not affected by variables such as
length and temperature of the lirnbs.
Various authon studied the developmental aspect of median nerve CCT (NL3-N20). In
1980, Desmedt and Cheron (l98Oa, 198Ob) observed a lack of correlation between age and
rnedian CCT when comparing 19 octagerÏans to 25 young adults. Two large studies have
since contradicted these results. In 1982, Hume et al (1982) showed, with 83 subjects
aged 10-79, that median CCT remains constant below the age of 50, increases between
the fifth and sixth decades to remain constant thereafter. In a second study, AUison et al
(1983) found a significant increase in the median CCT with age in 286 adults 4 to 95
years old. However, Chu (1986) and Mervaala et al (1988) also conducted large studies
and found that age alone had no significant effect on median CCT. Zegers de Bey1 et al
(1988) replicated these results for the interval P14N20 with a smaller group (N = 40).
For the posterior tibial nenre, Kakigi (1987) found statistically significant shorter
interwave latencies in yomg adults than in elderly subjects. In contrast, Romani et al
(1992) and Kitamura et al (1995) found that age alone did not affect posterior tibial CCT.
Results concerning the effect of age on median and posterior CCT remain thus
controversial.
Although the effect of height on absolute latencies following posterior tibial nerve
stimulation has been well documented, the effect of this variable on interwave latency is
not as clear. Chu (1986) studied SEPS for the posterior tibial nerve and found a
significant correlation between height and tibial CCT. However, two studies contradicted
these results. In the fïrst, Lastirnosa et a1 (1982) observed no significânt height-related
correlation with CCT (N22-P37) in 33 young subjects. In a second study, Kakigi (1987)
found no significant correlation between height and the interpeak latency N28-N35, which
is based on medial lemniscus-sensory cortex CCT. As expected, Mison (1983) found no
significant height-related changes in median interwave latency (N13-N20). These results
were consistently replicated by Hume (1978), Chu (1986), Mervaala et al (1988) and by
Zegers de Bey1 et al (1988), with a slightIy different montage (P14N20). Therefore,
height does not significantly innuence median nerve CCT and the effect of this variable
on posterior tibial nerve CCT is unclear. The difference observed between median and
posterior tibial nerve findings is not surprising since the distance fkom L1 to the
contralateral cenhoparietal cortex is much longer than the distance between C7 and the
cortex-
With regards to the gender variable, Green (1982a) found a signincantly shorter median
CCT (N9-N20) in a group of 21 women compared to a group of 10 men. However, in
two larger series, Alison (1983) and Mervaala et aI (1988) found no significant sex-
related correlations in CCT (N13-N19) in groups of 286 and 120 normal subjects
respectively. These results were replicated by Chu (1986). Since a gender difference was
found with N13-N20 CCT but not with N9-N20, a sex difference in the peripheral CCT
between N9 and N13 potentials might explain this discrepancy.
Hume et al (1979) studied the effect of dnigs on SEPs in comatose patients and found no
correlation between blood levels of phenobarbital(0-146 pg/ml, median 56 pg/ml) and
median nerve CCT. Green et al (1982b) replicated the results obtained for phenobarbital
and found no h g effect with primidone and carbarnazepine in 108 epileptic patients.
However, they observed an ùicreased CCT with a minimal dose of 20 pJml of phenytoin.
Green et al (1982a) have also showed that seizure type, duration of epilepsy, fkequency of
seizures, and abnormal EEG had no effect on central conduction times.
1.2.3.2 Variables affecting Scalp Topography
Few studies have addressed the impact of dernographic variables on the distribution of
SEPs. Kakigi and S hibasaki (1 99 1,1992) investigated the effect of gender and age on
scalp topography of the N20 and P40 component of the SEPs with computenzed bit-
mapped color images of scalp topography. With respect to gender, they reported no
significant difference in scalp distribution of the N20 between female and male subjects,
and significant differences for certain age groups, especially for children and teenagers,
for the PIO. Age represented a more important factor in these studies, although
significant differences between age groups tended to be attributed to differences in
amplitude rather than spatial distribution of the components.
1.3 Lnvestigating the Generators of SEPs: Dipole Modeling
The analysis of surface potentials rernains limited for at least two reasons. First, the
generator is not always located directly under the maximal amplitude potential. Second, a
scalp-recorded potential may result fiom the activiv of multiple generators. Source
analysis evolved out of the concern to characterize the activity of the source itselfrather
than its manifestations.
The characterization of the location and orientation of a source based on its
manifestations on the scalp surface is called the inverse problem. The inverse problem
remains unsolved for vectorial quantities like brain electrical activity. In 1853, Helmholz
stated Siat any potential field on the surface of a volume conductor like the brain is
compatible with an infinite number of interna1 charge arrangements. To address this
limitation, instantaneous and spztio-temporal models yielding a unique mathematical
solution to the inverse problern have been developed.
Instantaneous models use one or multiple dipoles to explain the spatial information in the
potential distribution (in our case SEP) at one instant. In these models, test sources are
placed in a modefed brain and a theoretical distribution of the scalp potentials generated
by these sources is computed. The theoretical potential distribution constitutes the
forward solution to this given set of test sources. The location and orientation of the test
sources are adjusted iteratively w-ith an optimizing algorithm until the forward solution
providing the best mode1 of the actual scalp-recorded potentials is reached. The
corresponding test sources are retained as best models for the generators of scalp recorded
potentials at that instant. Therefore, a unique mathematical solution can be found with
instantaneous models, provided the number of parameters (one dipole has 6 pararneters)
does not exceed the number of recording channels.
Spatio-temporal models have been designed to assess the location, orientation and
ma,+tude of sources generating the observed spatial distribution of scalp potentials
across time. In the moving dipole approach, the dipole which best models activity at each
instant is retained, creating instantaneous models at each instant. The final solution
consists of dipoles, with various locations and orientations, which explain a significant
proportion of the variance in the data at a aven instant. This group of dipoles whose
pararneters Vary across time are often pictured as one dipole migrating through the brain.
This approach is not easily justified in our case, since the generators of SEPS are
presumed to be fixed neuronal masses (Freernan 1975).
Alternatively, spatio-temporal models c m rely on dipoles of static orientation and location
whose strength varies across time. The most commonly used program computing spatio-
temporal models based on fixed sources is named Brain Electrical Source Analysis
(BESA) (Scherg and von Cramon 1985,1986). BESA addresses the inverse problem by
iteratively fitting sources of fixed location and orientation over a given time interval so
that the fonvard solution wili maximally approach the recorded scalp distribution. The
validity of a model is partly judged according to its goodness of fit, which is the
percentage of scalp-recorded variance expIained by the model, as determined by a least-
squares calculation. Thus, a good model is associated with a low residual variance.
To calculate the fonvard solution, BESA models the head as a sphere in which test
charges are passively conducted to the surface of the scalp. Several lines of evidence
support the concept of volume conduction of charges in the brain (Smith et al. 1983), a
concept based on Maxwell's equations. The sphere is actually made of 4 concentric shells
with different conductivities, representing the scalp, skull, cerebrospinal fluid (CSF), and
brain. The radius of the brain is 71 mm, the "concentric layers" of the CSF, skdl and
scalp havins a thickness of 1'7 and 6 mm respectively. As expected, the conductivity of
bone is smallest (0.0042 mho/m), followed by scalp and brain (0.33 mho/m), and CSF
conductivity is highest (1 mho/m). The fissures and ventricles are not represented in this
model, but a simulation study has shown that their effect on the Iocalization of cortical
dipoIes is negligible (He and Musha 1989). Since volume conduction is a linear process,
a linear superposition of the potentials generated by each source is performed to obtain the
forward solution,
In spatio-temporal models, dipole orientation is detennined with more reliability than
location iri the calculation of the inverse solution, since orientation is based on linear
equations and location is computed with non-linear equations (Scherg 1990). Dipole
location c m represent the activity of quite a large region of brain with indeterminate
boundaries and the chosen location represents a 'center of gravity" for activity in this
region (Scherg and Ebersole 1993). Orientation is more accurate and May allow, for
example, the separation of the radial and tangential cortical dipoles of the median nerve
SEPs. The thud characteristic of dipoles, dipole magnitude, partially reflects the
"macroscopic source current in a circumscnbed brain region that contributes significantly
to the surface signals" (Scherg and Ebersole 1993).
Regional sources explain the activity of a circurilscribed brain region with three dipoles
orthogonal to each other. Since the dipoles are orthogonal, any orientation c m be
projected ont0 them and therefore explained by these three dipoles. Regional sources
present the advantage of describing activity in a circumscribed brain region without
having to assess the orientation of the generator. Underlying this approach is the
assumption that the activity modeled is restncted to a circumscnbed anatornical region.
To conclude, both instantaneous and spatio-temporal models correctly avoid necessarily
localizing a source under the maximal amplitude potential, but only spatio-temporal
models rnay disentangle the activity of sources overlapping in t h e , a documented
phenomenon in SEPs (Buchner et al. 1995). Among spatio-temporal models, the moving
dipole approach models sources which diverge fkom the presumed matornical structure of
the neuronal generators. Therefore, only spatio-temporal models relying on static sources
rnay provide adequate answers to the inverse problem applied to SEPs. It must however
be stressed that the most commody used spatio-temporal models are based on the
following assurnptions: The brain is a volume conductor whose shape approximates a
sphere. In the brain, sources are w e l approximated by dipoles with fixed location and
orientation and produce currents which are passively conducted to the surface. The
number of parameters describing the dipolar sources is less than the nunber of EEG
channels.
The k t goal of this study is to assess whether modeled generators of median and
posterior tibial nerve represented in MIU space c m Iocate the primary somatosensory
cortex on the anterior wall of the post-central gyms in neurologically normal subjects.
Strict anatomical cnteria and MRI readings with an experienced radiologist will be used
to define the position of the central sulcus. Mapping of the hand somatosensory cortex
based on the MRI representation of spatio-temporal dipolar models of SEP generators
have achieved reliable localization of the central sulcus in previous studies (Buchner et al.
1 994, 1995). This study will test whether the same spatial accuracy can be obtained with
a slightly different approach based on the use of Current Source Maps to delineate the
epoch to be modeled. This investigation will be extended to the sensory representation of
the foot based on modeling of posterior tibial nerve SEPs. To our knowledge, no study
has addressed this issue with spatio-temporal modeling conjugated with W. The two
analyses Ml1 be performed on the sarne subjects to enable comparisons of different
functional maps in a single subject.
The location, orientation and activity across tirne of modeled sources will be documented
to understand the characteristics of the generators of median and especially posterior tibial
nerve SEPs. For example, basic principles of electroencephalography propose that the
generators of potentials are pyramidal cells oriented perpendicular to the surface of the
brain. If pyramidal cells in a given cortical region can be modeled by a dipolar sheet, it
follows that the modeled sources should be perpendicular to the cortex. To test if models
meet this requirement, the orientation of dipoles modeling the N20P20 potentials of
median nerve SEPs will be to compared to the orientation of the antenor wall of the post-
centrzl gyrus.

Once established in normal controls that source analysis can locate prïmary
somatosensory cortex, the experimental paradigm will be used to locate the
sornatosensory representation of the hand and foot in patients with central dysgenetic
Iesions, who do not always present a clearly identifiable central sulcus.
SEP studies showed that cortical dysgenesis impinging on the central region results in an
abnormal or absent cortical representation of somatosensory fùnction (de Rijk-van Andel
et al, 1992; Vossler et al. 1992; Di Capua et aZ.1993; Raymond et al. 1997). These studies
were based on the analysis of waveforms and did not investigate fùrther the generators of
the potentials, Although source analysis could obviously not be perfomed in the absence
of potentials, a fair number of patients presented abnomally distributed or late potentials
whose generators could have been studied. Progressing towards a more complex analysis,
the present study will investigate the effect of cortical dysgenesis on cortical SEP
generators, using 32 channels EEG recordings, and dipole source analysis combined with
3D-MRI. The patient group will include patients with cortical dysgenetic lesions
irnpinging on the central region. Contra1 subjects will be neurologically normal
volunteers working at the Montreal Neurological Institute. To the best of our knowledge,
such an approach creates a precedent in the investigation of the functional representation
of somatosensory functions in centrally located dysgenetic lesions.
3.1 Mapping the Somatosensory Cortex with SEPS an(
3.1.1 NeuroIogicalIy Normal Subjects
i Source AnaIys
Mapping the central region with dipole source analysis was greatly improved by the
combination of source analysis with skull X-rays and especially 3D-MN. Digitized
electrode positions made possible measurements of eleckode positions in MRI space for
each individual. Individualized electrode positions improved the localization of modeled
sources by canceling the effect of electrode misplacement and determining more realistic
head radii for the spherical head rnodels. Moreover, for the first t h e , the location of
equivalent dipoles could be directly compared to anatomical landmarks
Baumgartner et al (1 993) were the k t to study SEPs with head models based on
electrode positions digitized with respect to skull X-rays. in this coregistration, the sphere
that best fitted the electrode cloud was caIculated and the electrode cloud was then
projected onto that sphere. Source analysis was performed with respect to the electrodes
projected ont0 the sphere and equivalent dipoles were ascertained. The position of
equivalent dipoles was compared only to anatomical landmarks on the s M 1 X-rays so that
function could be superimposed onto an anatornical substrate. However, the anatomico-
functional correlation performed by this group of researchers was limited. The position of
the dipole was compared to anatornical landmarks such as the ear canal and the midline
and not mapped ont0 the skull X-rays. Baumgartner modeled the N20 potential for the
median nerve, the ulnar nerve and the four digits, with a single equivalent tangential
dipole pointhg anteriorly and slightly upwards, explaining 90.4% h of the variance in 4
subjects. Al1 sources were within 15 mm of the C 3 K 4 position of the international 10-20
system and in 2 subjects out of 4, the sequential sensory representation of the digits was
respected.
The combination of source analysis with 3D-MRI for the analysis of median nerve SEPs
was introduced by Buchner et al (1994), in 13 normal subjects and 7 patients with lesions
of the central region (1 angioma and 6 tumors). These authors improved the functiono-
anatomical correlation by mapping the equivalent dipoles directly onto the MRI. They
observed a localization of a regional source less than 3 mm 6om the central sulcus in 15
of 39 conditions (20 subjects x 2 sides of stimulation), and l e s than 6 mm in 20 of 39
conditions (less than 9 mm for al1 subjects). The localization of the regional source was
coniïrmed during neurosurgery in 6 of the 7 patients. These results were reproducible,
since the replications contributing to the average SEP also fell within 9 mm fkom the
central sulcus. Buchner et al's mode1 consisted of two regional sources, one representing
the N14, and the second modeling the N20 and P22. This model explained more than
95% of the variance in the "corticd interval" ie, between the onset of the N20 and the
next positive peak.
Since BESAys inverse solution is based primarily on orientation, the precision of the
localization of equivalent sources has O fien been judged Ïnadequate for preoperative
mapping of the somatosensory region. For example, C u f i et al. (1991) observed an
accuracy of source localization based on scalp potentials in the order of 1 cm at best.
Moreover, Scherg and Ebersole (Scherg and Ebersole 1993) reported that dipoles could be
mislocated by as rnuch as 2.5 cm, yet still image the same temporal waveshapes.
However, the above mentioned study by Buchner et al shows that BESA can provide a
maximal inaccuracy of 9 mm when localizing the equivalent sources with respect to the
centrai sulcus on MRL
To confirm the accuracy of localization of BESA, Buchner et al (1 995) studied the
localization of the five digits on the central sulcus in 8 normal subjects. Their model
consisted of a dipole in the region of the brainstem as weU as two dipoles in the
contralateral centroparietal cortex, one tangential and one radial in orientation. The
cortical sources explained 96.9-98.7% of the variance in the "cortical interval" for the
median nerve stimulation, 90.7-98.2% for the k s t h g e r , 92.3-97.3% for the third h g e r ,
and 92.3-97.7% for the fi& finger. The tangential cortical sources were located within
3 mm fiom the posterior bank of the central sulcus in 14 stimulations, within 6 mm in 10
stimulations and within 9 mm for 8 conditions. The authors reported much greater
variability in the localization of the radial source with respect to the central sulcus.
3.1.2 Patients with Central Lesions
Franssen et al (1 992) used a 3 dipole-mode1 to analyze the rnedian nerve SEPS of 8
patients with small subcortical infarcts located either in the thalamus or in subcortical
white matter underlying the central region (MRI resolution irnpeded a more precise
localization). Five of the 8 patients showed abnormalities in dipole source potentials
associated with cortical potentials on the affected side, compared to the unaffected side.
In three cases, both the tangentid and radial dipoles were diminished in amplitude or
missing. In one case, dipole source analysis clarified the interpretation of the SEPs by
attributing the abnormality to the radial anaor tangentid generator. Upon neurological
examination, the 5 patients with abnormal dipole source potentials presented pure sensory
symptoms or mixed sensory and motor symptoms as opposed to the pure motor symptoms
observed in the 3 patients with normal dipole source potentials. The authors also
examined leWright differences in the location of the dipoles. They found significant
differences only for the radial dipole, in 4 patients. It is impossible to attribute the
abnormal location to matornical or fûnctional differences since the dipoles were not
rnapped ont0 their anatornical substrates.
Correlating function with anatomy, Buchner et al (1994) observed that the localization of
a regional source explaining the cortical activity was less than 9 mm fiom the central
sulcus for 7 patients presenting with cenkal lesions (6 tumors and 1 angioma). The
authors did not report any discrepancy in the localization of the cortical regional source
between patients and nomal controls. Therefore, centrally located tumors of various
histoloag do not seem to drasticdly alter the representation of the somatotopy on the post-
central gyrus.
Dipole source analysis is thus a vahable tool in identi-g abnormalities in the location
of SEP generators. Mapping of dipolar sources onto MRI image has been instrumental in
establishing a solid correlation between fünction and anatomy. Dipole source analysis
also presents the advantage of disentangling abnonnalities due to different generators.
3.2 SEPs in Patients with Central Dysgenetic Lesions
Modem magnetic resonance imaging has largely contnbuted to the increased detection of
cortical dy sgenetic lesions, which O ften underlie epilepsy previously diagnosed as
idiopathic (Kuzniecky et a i 1993; Barkovich et al. 1994). Cerebrd dysgenesis c m be
broadly defined as a cortical malformation resultulg fkom an abnomai neuronal
development Neuronal development is hindered $ different stages of development and
the resulting disorders are classified as pre-migrational, migrational, or post-migrational,
with respect to the onset of neuronal migration. These disorders are associated with
various degrees of cortical andor subcortical abnomalities which presumably deterMine
their effect on SEPS.
In a study on various types of focal cortical dysgenetic lesions, 5/6 patients with abnormal
or absent N20/P20 potentids presented lesions impinging or bordering on primary
somatosensory cortex (Raymond et al. 1997).
In schizencephaly, opened or closed-lip clefts h e d with polyrnicrogyric gray matter
extend from the cortex to the lateral ventricle. In a patient with a closed unilateral parietal
schizencephalic cleft, no N20/P20 were found on the affected side (Vossler et al. 1992).
Hemimegalencephaly is a neuronal developmental disorder characterized by d i f i s e
unilateral hypertrophy of the brain and an enlargement of the gyri, which may present an
abnormal organization. Histologically, thickened gray matter and white-matter gliosis can
be observed, together with giant neurons scattered throughout the cortex and in ectopic
white matter locations. No cortical SEP components were observed on the side of the
dysgenetic cortex in 4 patients with hemirnegalencephaly (Di Capua et al. 1993).
Lissencephaly type 1 is a dif ise developmental disorder characterized by an absence of
cortical circonvolutions. In this four-layered cortex, the gray matter is thickened and a
narrow rim of penventricular gray matter with islands of ectopic neurons is observed. Di
Capua et al (1993) reported an abnormal morphology and prolonged latency for the N20
wave bilaterally in 4 children. However, in a second study, 6 out of 10 children with
lissencephaly type 1 clearly showed an absence of cortical components bilaterally with a
normal N13 (de Rijk-van Andel et ai. 1992).
Astereognosis was the only sensory deficit found upon neurological examination in 3/7
patients with focal dysgenetic lesions (Raymond et al 1997) and 1/ 1 patient with
schizencephaly (Vossler et al. 1 992). Sensory examination was not reported in the studies
on hemimegalencephaly and lissencephaly reported above (de Rijk-van Andel et al. 1992;
Di Capua et al. 1993).
Hernimegalencep haly and lissencephaly are accompanied b y d i f i se abnormal gyral
patterns which most certainly affect the evoked potentials fields. Therefore, both focal
central dysgenetic lesions and di f i se dysgenetic Iesions are associated with abnormal or
absent cortical SEPS, although the effect of diaise cortical dysgenesis in
hemimegalencephaly and lissencephaly cannot be ruled out.
Nathalie Routhier and Jean Gotman
Montreal Neurological Institute & Hospital, and Department of Neurology and
Neurosurgery, McGill University, Montreal, Quebec, Canada.
Address correspondence and reprint requests to Dr Jean Gotmm, Montreal Neurologicd
Institute, 3801 University St., Monireai (QC) H3A 2B4. Tel.: (5 14) 398-1 953 Fax: (5 14)
398-8 106, email: [email protected]
Keywords: Dipole source analysis, somatosensory evoked potentials, media. nerve,
posterior tibia1 nerve, mapping, central region
Spatio-temporal models of the generators of median and postenor tibial nerve
somatosensory evoked potentials (SEPs) were constructed and mapped onto the
individual MIUS. Thirty-two electrode SEP recordings fiom 10 normal individuds were
modeled in a four-shell head mode1 using a regional source approach. For the median
nerve, three-dipole models including one subcortical and two cortical sources explained
93% of the variance in the interval encompassing the N20 and P22 potentials. For the
postenor tibial nerve, two cortical sources accounted for 94% of the variance associated
with the N40R40, NSO and P60 potentials. After correction for eccenhicity, dipole
N2O/P20 was located at an average distance of 3.5 mm (range 0-8 mm) from the anterior
wall of the post-central gynis. The dipole was predominantly tangential, pointing
anteriorly and towards the midline, forming a 75" angle with the post-central g p s .
Dipole N40/P40 was located parasagittally, at an average distance of 6.6 mm and mostly
anterior to the central sulcus. It predominantiy pointed towards the longitudinal fissure
and posteriorly with an orientation ranguig fiom tangential to radial. After correction for
eccentricity, spatio-temporal modeling of SEPs correlated with 3D MRI allows accurate
localization of the central sulcus and provides information on the temporal evolution of
activated somatosensory relay stations.
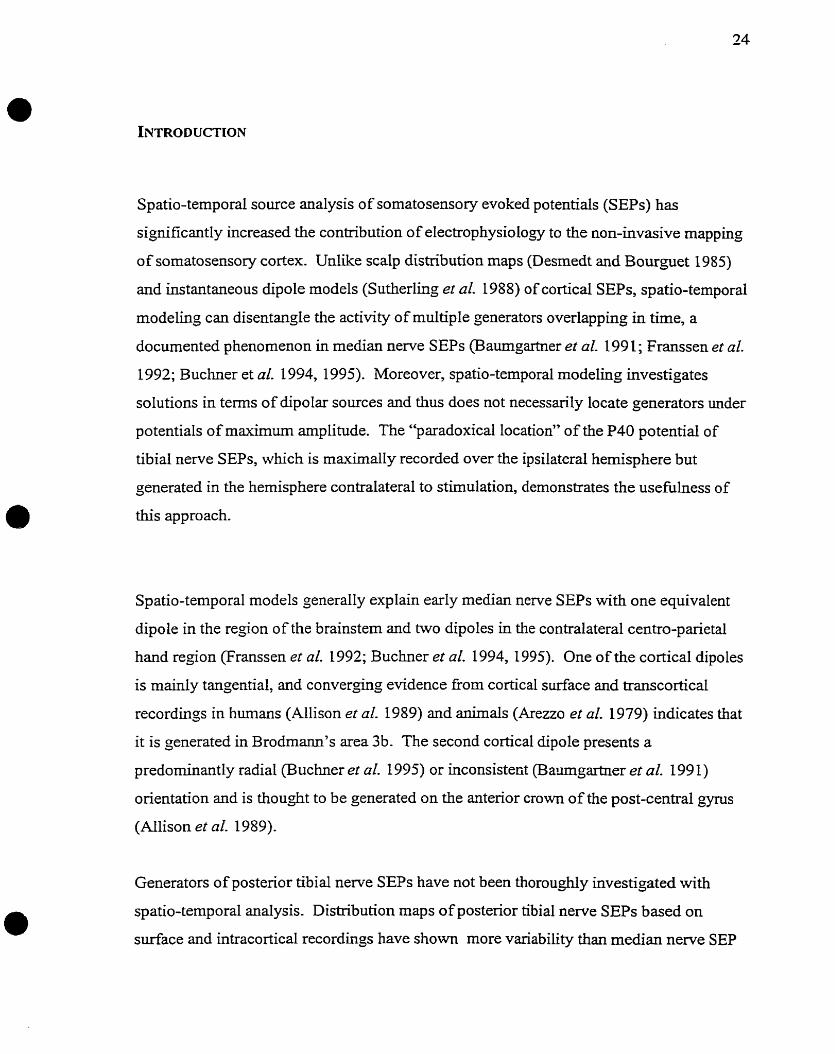
Spatio-temporal source analysis of somatosensory evoked potentials (SEPs) has
sipnificantly increased the contribution of electrophysiology to the non-invasive rnapping
of somatosensory cortex. Unlike scalp distribution maps (Desmedt and Bourguet 1985)
and instantaneous dipole models (Sutherling et al. 1988) of cortical SEPs, spatio-temporal
modeLing can disentangle the activity of multiple generators overlapping in time, a
documented phenornenon in median nerve SEPs (Baumgartner et al. 1991; Franssen et al.
1992; Buchner et al. 1994, 1995). Moreover, spatio-temporal modeling investigates
solutions in tems of dipolar sources and thus does not necessarily locate generators under
potentials of maximum amplitude. The "paradoxical location" of the P40 potential of
tibial nerve SEPs, which is maximally recorded over the ipsilateral hemisphere but
generated in the hemisphere contralateral to stimulation, demonstrates the usefulness of
this approach.
Spatio-temporal models generally explain early median nerve SEPs with one equivalent
dipote in the region of the brainstem and two dipoles in the contralateral centro-parietal
hand region (Franssen et al. 1992; Buchner et al. 1994, 1995). One of the cortical dipoles
is mainiy tangential, and convera%g evidence corn cortical surface and transcortical
recordings in humans (Allison et al. 1989) and animais (Arezzo et al. 1979) indicates that
it is generated in Brodrnann's area 3b. The second cortical dipole presents a
predominantly radial (Buchner et al. 1995) or inconsisteot (Balmgartner et al. 199 1)
orientation and is thoug,ht to be generated on the anterior crown of the post-central gyrus
(Ailison et al- 1989).
Generators of posterior tibial nen-e SEPs have not been thoroughly investigated with
spatio-temporal analysis. Distribution maps of posterior tibial nerve SEPs based on
surface and intracortical recordings have shown more variability than median nerve SEP
maps, but they mainly suggested a generator located in the paracentral lobule contralateral
ta the side of stimulation, (Lesser et al. 1987; Takahashi et al. 1996). The generator was
thought to be perpendicular to the Iongitudinal fissure, with a horizontal or oblique
orientation, depending on the representation of the foot in the paracentral lobule-
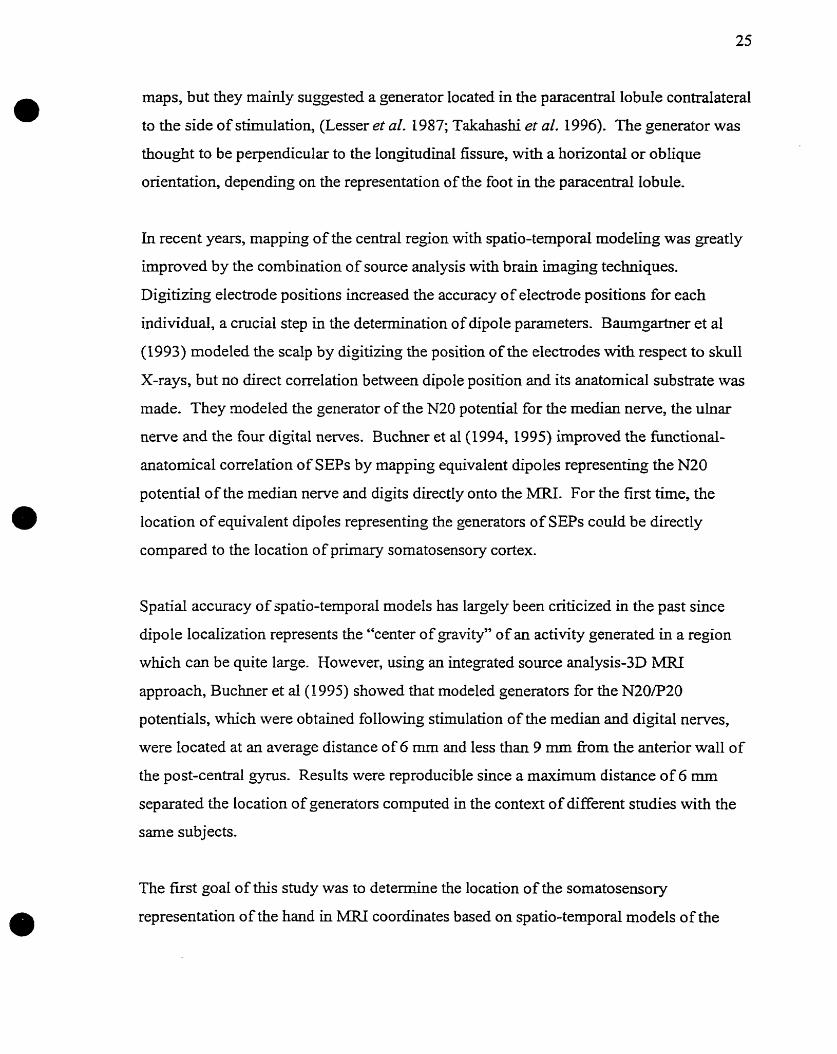
In recent years, mapping of the central region with spatio-temporal modeling was greatly
improved by the combination of source analysis with brain imaging techniques.
Digitizing electrode positions increased the accuracy of electrode positions for each
individual, a crucial step in the detenninatiori of dipole parameters. Baumgartner et al
(1993) modeled the scalp by digitizing the position of the electrodes with respect to skull
X-rays, but no direct correlation between dipole position and its anatomical substrate was
made. They modeled the generator of the N2O potential for the median nerve, the ulnar
nerve and the four digtal nerves. Buchner et al (1994, 1995) improved the fûnctional-
anatomical correlation of SEPs by mapping equivalent dipoles representing the N20
potential of the median nerve and digits directly onto the MRI. For the fïrst time, the
location of equivalent dipoles representing the generators of SEPs codd be directly
compared to the location of primary somatosensory cortex.
Spatial accuracy of spatio-temporal rnodels has largely been criticized in the past since
dipole localization represents the 'tenter of gravity" of an activity generated in a region
which can be quite large. However, using an integrated source analysis-3D MRI
approach, Buchner et a1 (1995) showed that modeled generators for the N20P20
potentials, which were obtained following stimulation of the median and digital nerves,
were located at an average distance of 6 mm and less than 9 mm fiom the anterior wall of
the post-central gynis. Results were repraducible since a maximum distance of 6 mm
separated the location of generators computed in the context of different studies with the
same subjects.
The first goal of this study was to determine the location of the somatosensory
representation of the hand in M N coordinates based on spatio-temporal rnodels of the
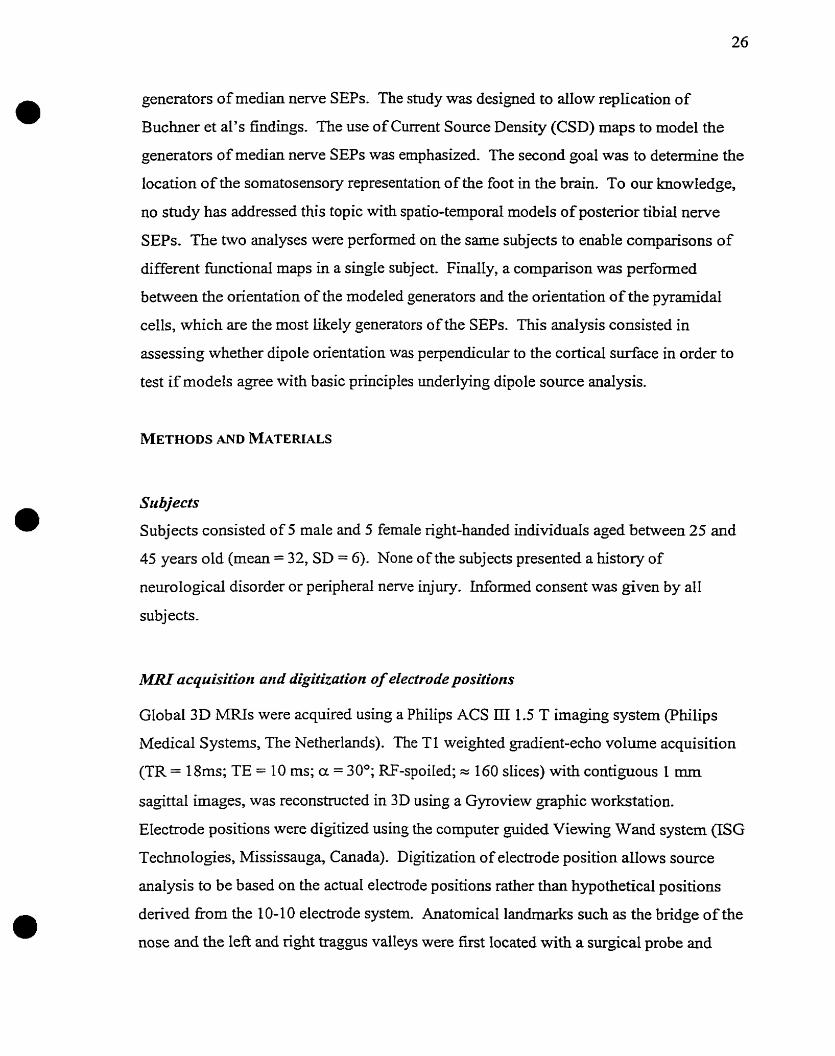
generators of median nerve SEPs. The study was designed to alIow replication of
Buchner et al's findings. The use of Curent Source Density (CSD) maps to mode1 the
generators of median nerve SEPs was emphasized. The second goal was to determine the
location of the somatosensory representation of the foot in the brain. To our knowledge,
no study has addressed this topic with spatio-temporal models of posterior tibia1 nerve
SEPs. The two analyses were performed on the same subjects to enable cornparisons of
different fûnctionai rnaps in a single subject. Finally, a cornparison was performed
between the orientation of the modeled generators and the onentation of the pyramidal
cells, which are the most likely generators of the SEPs. This analysis consisted in
assessing whether dipole onentation was perpendicular to the cortical surface in order to
test if models agree with basic principles underlying dipole source analysis.
METHODS AND MATERIALS
Subjects
Subjects consisted of 5 male and 5 fernale nght-handed individuals aged between 25 and
45 years old (mean = 32, SD = 6). None of the subjects presented a history of
neurological disorder or peripheral nerve injury. Informed consent was given by al1
subj ec ts.
M m acqrrisitiorr and digitizafio~z of electrode positions
Global 3D MEUS were acquired using a Philips ACS III 1.5 T haging system (Philips
Medical Systems, The Netherlands). The Tl weighted gradient-echo volume acquisition
(TR = 18ms; TE = 10 ms; a = 30°; RF-spoiled; = 160 slices) with contiguous I mm
sagittal images, was reconstmcted in 3D using a Gyroview graphic workstation.
Electrode positions were digitized using the cornputer guided Viewing Wand system (ISG
Technologies, Mississauga, Canada). Digitization of electrode position allows source
analysis to be based on the actual electrode positions rather than hypothetical positions
derived from the 10-10 electrode system. Anatomical landmarks such as the bridge of the
nose and the left and right traggus valleys were fuçt located with a surgical probe and

were correlated with the same points on the subject's MR image. Electrode positions
were then digitized with respect to these reference points, using the same probe.
SEPs recordi~zgs
Subjects were instructed to lie d o m and relax with their eyes closed. No sedative was
administered and subjects were instructed to stay awake to avoid the effects of sleep on
the amplitude, latency and morphology of early cortical components of SEPs (Nakano et
al. 1995). Left and right median and postenor tibial nerves were electncally stimulated
during 2 sessions of 2000 stimuli each (5 Hz, 0.2 msec). The intensity of the stimulus
was adjusted to obtain a minimal to moderate contraction of the thumb or big toe.
Median nerve responses were recorded using 3 1 electrodes referenced to Fz and placed
according to the 10- 10 system (figure 1).
F i 1 Thirty-one electrode montage used to record rnedian nerve SEPs. For posterior tibial nerve SEPs, Fpl and Fp2 eiectrodes replaced the Fpz electrode, resulting in a thnty-hvo electrode montage. Note the high density of electrodes symmetrically placed over the central region to favor mapping as well as a good fit of the sphencal head mode1 over this region.
For posterior tibial nerve SEPs, Fpl and Fp2 electrodes replaced the Fpz electrode,
resultîng in a thirty-two electrode montage. Elecbodes were placed symmetrically over
b o t . hemispheres, densely covering the central region. Symmetncal electrode coverage is
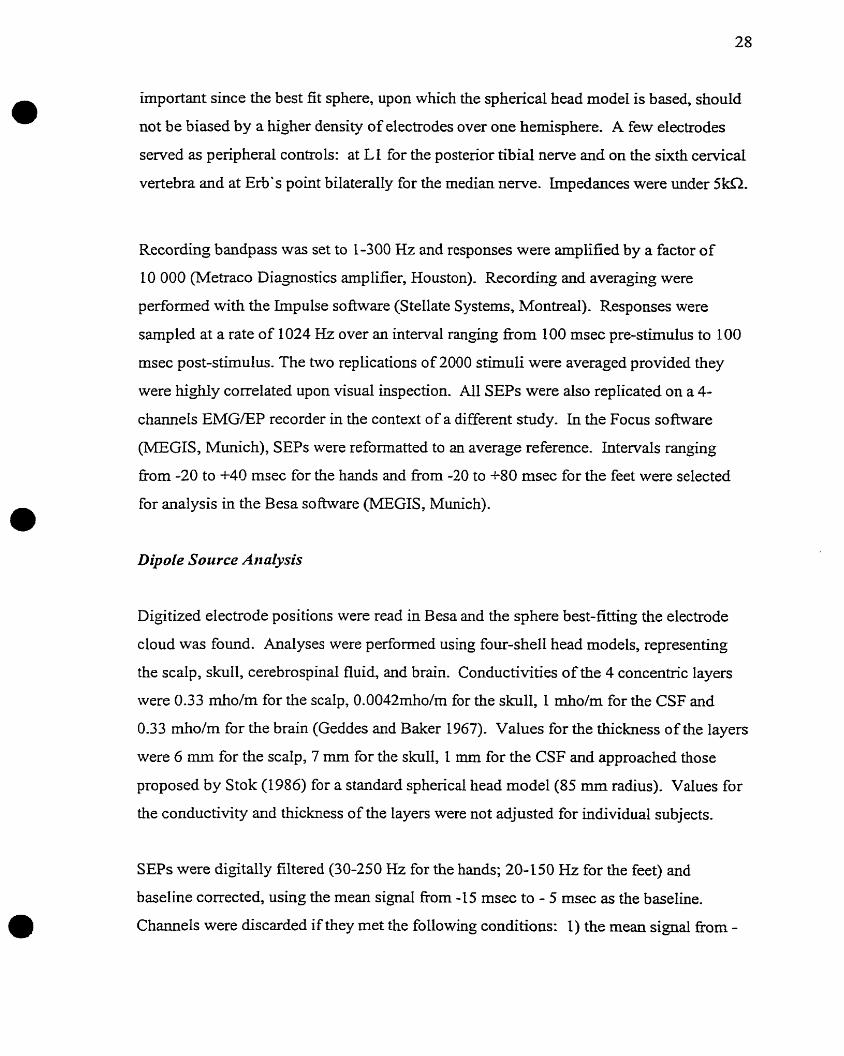
important since the best fit sphere, upon which the spherical head mode1 is based, should
not be biased by a higher density of electrodes over one hernisphere. A few electrodes
served as peripheral controls: at LI for the posterior tibia1 nerve and on the sixth cervical
vertebra and at Erb's point bilaterally for the median nerve. hpedances were under 5W2.
Recording bandpass was set to 1-300 Hz and responses were amplified by a factor of
10 000 (Meîraco Diagnostics amplifier, Houston). Recording and averaging were
performed with the Impulse software (Stellate Systerns, Montreal). Responses were
sarnpled at a rate of 1024 Hz over an interval ranging f?om 100 msec pre-stimulus to 100
msec post-stimulus. The two replications of 2000 stimuli were averaged provided they
were highly correlated upon visual inspection. Al1 SEPs were also replicated on a 4-
channefs EMGEP recorder in the context of a different study. In the Focus software
(MEGIS, Munich), SEPs were reformatted to an average reference. Intervals ranging
fkom -20 to +40 msec for the hands and £tom -20 to +80 msec for the feet were selected
for analysis in the Besa software (MEGIS, Munich).
Dipole Source Aizalysis
Digitized electrode positions were read in Besa and the sphere best-fitting the electrode
cloud was found. Analyses were performed using four-shell head models, representing
the scalp, skull, cerebrospinal fluid, and brain. Conductivities of the 4 concentric layers
were 0.33 mho/m for the scalp, 0.0042mho/m for the skull, 1 rnho/m for the CSF and
0.33 rnho/m for the brain (Geddes and Baker 1967). Values for the thickness of the layers
were 6 mm for the scalp, 7 mm for the skull, 1 mm for the CSF and approached those
proposed by Stok (1986) for a standard spherical head mode1 (85 mm radius). Values for
the conductivity and thickness of the layers were not adjusted for individual subjects.
SEPS were digitally filtered (30-250 Hz for the hands; 20-150 Hz for the feet) and
baseline corrected, using the mean signal fiom -15 msec to - 5 msec as the baseline.
Channels were discarded if they met the following conditions: 1) the mean signal £tom -
10 to O msec was more than twice the averaged noise in the 32 channels over the same
interval and 2) the signal to noise ratio ( S m ) was less than 1.5. SNRs were calculated by
dividing the root mean square ( R M S ) over the "cortical interval" (see below) by the RMS
£kom -10 to O msec. Using these guidelines, an average of 0.6 electrodes were deleted for
the hand recordings and 1.7 electrodes for the foot recordings, and the maximum number
of electrodes deleted in a single recording was 3.
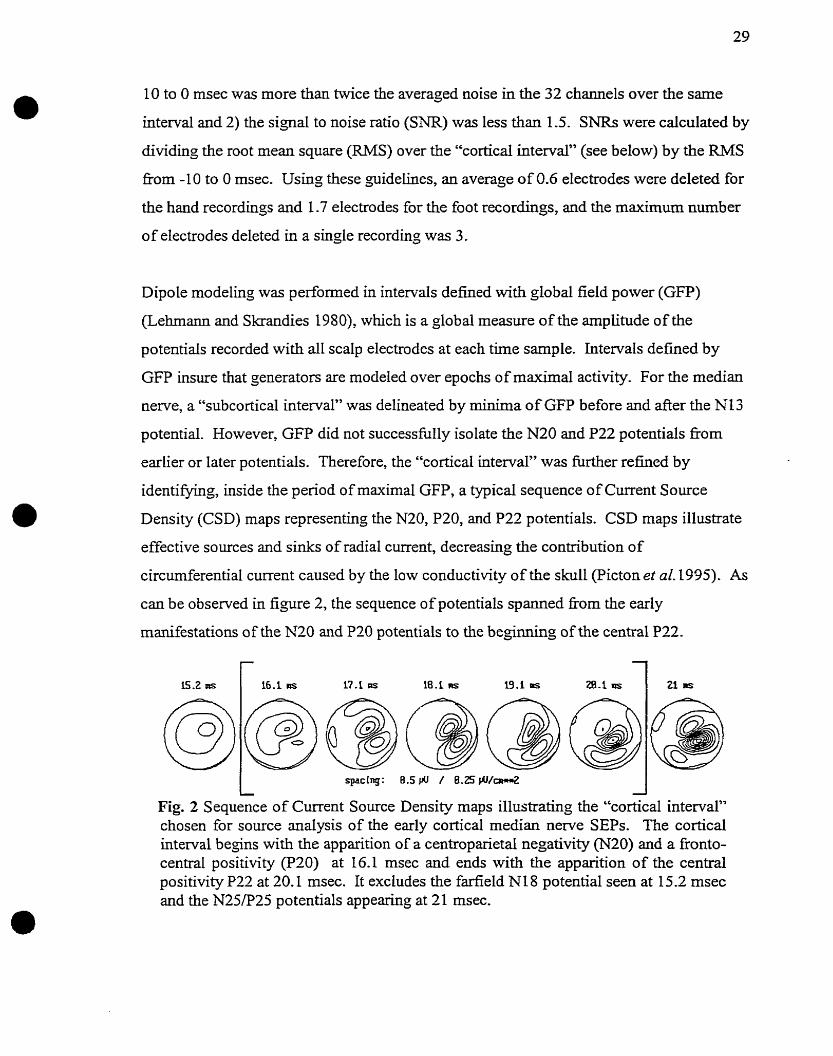
Dipole modeling was perfomed in intervals d e h e d with global field power (GFP)
(Lehmann and Skrandies 198 O), which is a global rneasure of the amplitude of the
potentials recorded with al1 scalp electrodes at each time sample. Intervals d e h e d by
GFP insure that generaton are modeled over epochs of maximal activity. For the median
nerve, a "subcortical interval" was delineated by minima of GFP before and after the Nt 3
potential. However, GFP did not successfully isolate the N20 and PZ2 potentials fÏom
earlier or later potentials. Therefore, the "cortical interval" was M e r refined by
identiwng, inside the period of maximal GFP, a typical sequence of Current Source
Density (CSD) maps representing the N20, P20, and P22 potentials. CSD maps illustrate
effective sources and sinks of radial current, decreasing the contribution of
circumferential current caused by the low conductivity of the skull (Picton et al. 2935). As
c m be observed in figure 2, the sequence of potentials spanned fÏom the early
manifestations of the N20 and P20 potentials to the beginning of the central P22.
Fig. 2 Sequence of Current Source Density maps illustrating the "cortical interval" chosen for source analysis of the early cortical median nerve SEPS. The cortical interval begins with the apparition of a centroparietal negativity (N20) and a fkonto- centra1 positivity (P20) at 16.1 msec and ends with the apparition of the central positivity f 22 at 20.1 msec. It excludes the farfield NI8 potential seen at 15.2 msec and the N25F25 potentials appearing at 21 msec.
It excluded the Ni8 potential, which has a generator tlïat appears to be iocated below the
thalamus (Maquière and Desmedt 1989). The cortical interval also excluded the N25
and P25 potentials since the location and orientation of the generators of the N20 and P20
were shown to be different f?om those of the N25 and P25 by fitting instantaneous dipoles
at the peak amplitude of the N20/P20 and N25P25 potentials (see results).
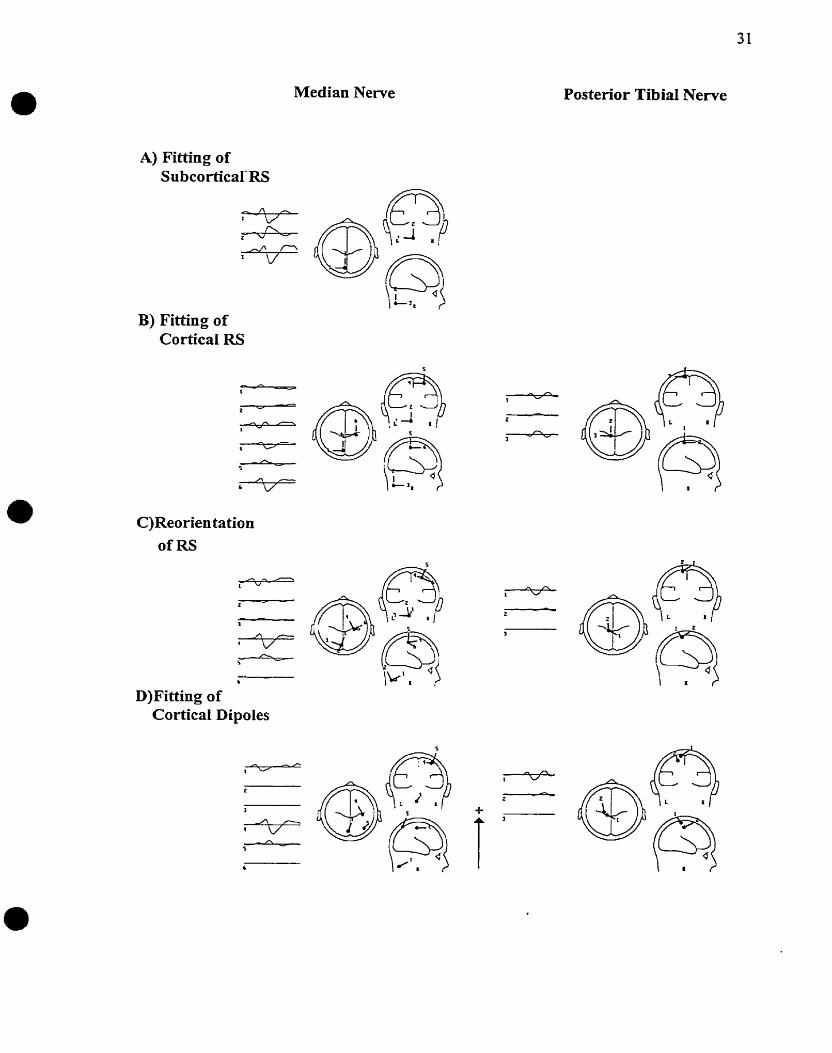
The strategy used to mode1 the generator of median nerve SEPS was based on a regional
source approach p u c h e r et al. 1995) and is outlined in figure 3. Regional sources, which
consist of three collocated dipoles orthogonal to each other, present the advantage of
describin~ current flow in a circumscribed brain region in any direction (Scherg and von
Cramon 1986). Therefore, regional sources provide a good starting hypothesis for a more
refined fitting of source location and orientation. The strategy first consisted in fitting a
regional source (ccsubcortical RS") in the early interval to explain the N13 potential. The
first source was maintained in place while a second regional source ("corticzl RS") was
fitted in the cortical interval. The subcortical RS was maintained active because there is
most probably a temporal overlap in the activity of the two generators. Regional sources
were then reoriented to maxirnize the energy explained by the dipoles. Following
reorientation, two of the dipoles of the subcortical RS explained only an average of 5.9%
of the variance in the early interval and one of the dipoles of the cortical RS explained
only an average of 0.4% of the variance in the cortical interval. These dipoles were
considered inactive and were deleted. The orientation and localization of the cortical
dipoles were then simultaneously fitted to r e h e the rnodeling of the cortical generators.
Final models consisted of one subcortical dipole explaining the early interval and two
cortical dipoles, accounting for the activity in the cortical interval. The subcortical dipole
was narned dipole N13 and the two sequentially activated cortical dipoles were narned
dipole N20/P20
31
Posterior Tibia1 Nerve Median Nerve
A) Fitting of SubcorticaIXS
B) Fitting of Cortical RS
C)Reorien tation ofRS
D)Fitting of Cortical Dipoles

Fig. 3 Dipole source andysis strategîes used to model the generators of left median neme and right posterior tibial nerve SEPS. A) Fitting of a regional source in the interval delineated around subcortical potentials. Since subcortical potentids are not easily recorded for the posterior tibial nerve potentials, this was only done for the rnedian nerve potential N13. The k s t source was rnaintained while a second regional source C'cortical RS") was fitted in the cortical interval. B)Fitting of a second regional source in a cortical interval defined around the cortical potentials N20P20 and P22 for the median nerve and around potentials N40P40, N50 and P60 for the posterior tibial nerve. C)Regional sources were reoriented to rnaximize the activity explained by dipoles and inactive dipoles were deleted. D)Fitting of the location and orientation o f the semaining cortical dipoles in the cortical interval to r e h e the modeling of the cortical generators.
and dipole P22, based on the potentials they presumably explained. Dipole N13 aiso
seemed to explain the N14Pl4 potentials, but this simplified name was chosen. A
regional source was used to scan other brain regions for unexplained activity. Ln one
subject, no stable model was found for the two hands and consequently, the data was
excluded fiom analysis.
For the posterior tibial nerve, no "subcortical interval" was defined due to the small
amplitude of the subcortical components. A "cortical interval" was delineated around the
N40, P40, N50 and P60 potentials based on minima of GFP, since a typical sequence of
CSD maps was only observed around 40 ms, and CSD maps were quite variable over the
full cortical interval. Around 40 ms, a parasagittal ipsilateral and midline positivity (P40)
and a contralateral negativity (N40) corresponding either to a tangential or an oblique
dipole were generally seen in the central region. However, an unaccompanied midline
central positivity suggestive of a radial dipole pattern was observed in a few subjects.
Dipole source analysis first involved fitting a regiond source in the cortical interval
(figure 3 j. Dipole orientation was then optimized. One dipole only explained 3.7% of the
variance on average and was therefore deleted, yielding a two-dipole model. One source
reached its first peak activity at the same t h e as the N40P40 potential (dipole N40/P40)
while the second one reached its maximal activity a few milfiseconds later (dipole N50).
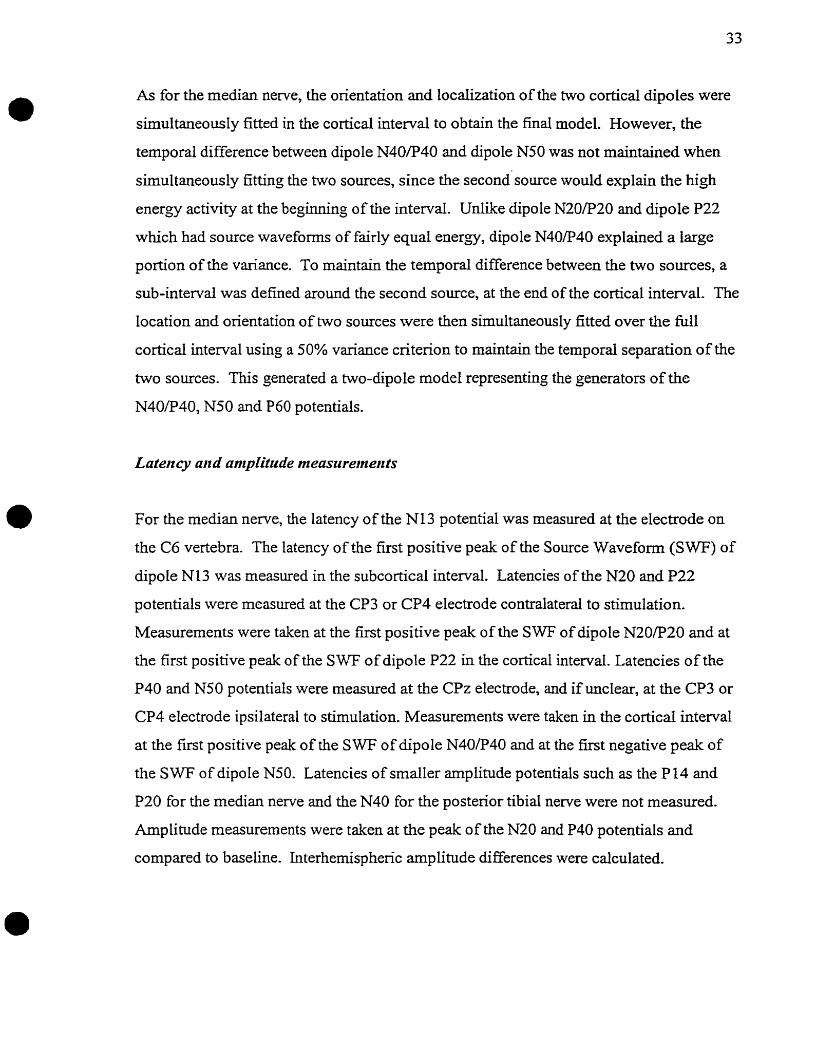
As for the median nerve, the orientation and localization of the two cortical dipoles were
simultaneously fitted in the cortical interval to obtain the h a I model. However, the
temporal difference between dipole N4OR 40 and dipole N50 was not maintained when
simultaneously fitting the two sources, since the second source would explain the hi@
energy activity at the beginning of the interval. Unlike dipo le N20/P20 and dipole P22
which had source waveforms of fairly equal energy, dipole N40/P40 explained a large
portion of the variance. To maintaîn the temporal difference between the two sources, a
sub-interval was defined around the second source, at the end of the cortical interval. The
location and orientation of two sources were then simultaneousIy fitted over the full
cortical interval using a 50% variance criterion to maintain the temporal separation of the
two sources. This generated a two-dipole mode1 representing the generatos of the
N40/P40, N50 and P60 potentials,
Late12 cy and amplitude measrîretnents
For the rnedian nerve, the latency of the N13 potenlial was measured at the electrode on
the C6 vertebra. The latency of the first positive peak of the Source Waveform (SWF) of
dipole NI3 was rneasured in the subcortical interval. Latencies of the N20 and P22
potentials were measured at the CP3 or CP4 electrode contralateral to stimulation.
Measurements were taken at the first positive peak of the S WF of dipole N20/P20 and at
the first positive peak of the SWF of dipole P22 in the cortical interval. Latencies of the
P40 and N50 potentiais were measured at the CPz electrode, and if unclear, at the CP3 or
CP4 electrode ipsilaterai to stimulation. Measurernents were taken in the cortical interval
at the first positive peak of the SWF of dipole N40P40 and at the first negative peak of
the SWF of dipole N50. Latencies of smaller amplitude potentials such as the P l 4 and
P20 for the median nerve and the N40 for the posterior tibia1 nerve were not measured.
Amplitude measurements were taken at the peak of the N20 and P40 potentials and
cornpared to baseiine. Interhemispheric amplitude differences were calculated.
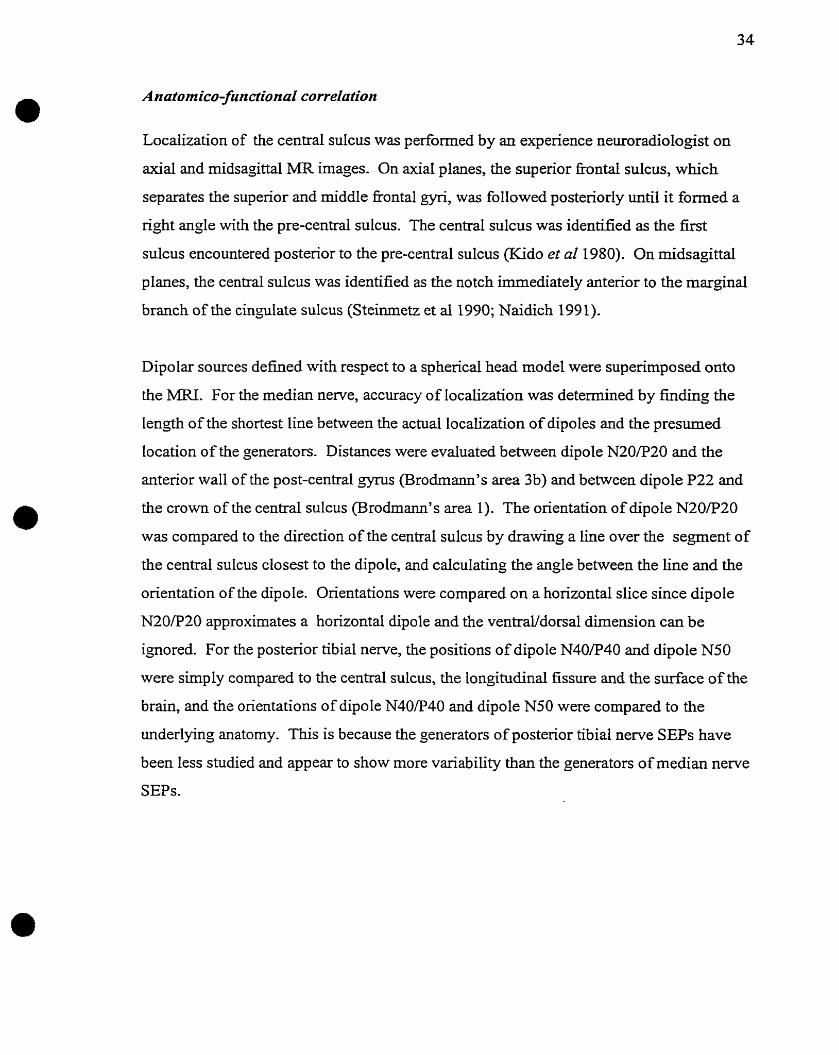
Localization of the central sulcus was performed by an experience neuroradiologist on
axial and midsagittal MR images. On axial planes, the superior frontal sulcus, which
separates the supenor and middle frontal gyri, was folIowed postenorly until it fomed a
nght angle with the pre-central sulcus. The central sulcus was identified as the first
sulcus encountered posterior to the pre-central sulcus (Kido et al 1980). On midsagittal
planes, the central sulcus was identified as the notch immediately anterior to the marginal
branch of the cinplate sdcus (Steinmetz et al 1990; Naidich 199 1).
Dipolar sources defined with respect to a spherical head mode1 were superhposed onto
the MRI. For the median nerve, accuracy of Iocalization was detennined by finding the
length of the shortest line between the actual Iocalization of dipoles and the presumed
location of the generators. Distances were evaluated between dipole N20/P20 and the
anterior waIl of the post-central g p s (Brodmann's area 3b) and between dipole P22 and
the crown of the central sulcus (Brodmann' s area 1). The orientation of dipole N20P20
was compûred to the direction of the central sulcus by drawing a line over the segment of
the central sulcus closest to the dipole, and calculating the angle between the line and the
orientation of the dipole. Orientations were compared on a horizontal slice since dipole
N20ff 20 approximates a horizontal dipole and the ventraVdorsal dimension can be
ignored. For the posterior tibial nerve, the positions of dipole N40/P40 and dipole N50
were sirnply compared to the central sulcus, the longitudinal fissure and the surface of the
brain, and the orientations of dipole N40/P40 and dipole N50 were cornpared to the
underlying anatomy. This is because the generators of posterior tibial nerve SEPS have
been less studied and appear to show more variability than the generators of median nerve
SEP S.

Accuracy of the spherical head model
Figure 4 shows the superposition of the spherical head model on the head of an individual
subject.
Fig. 4 Four-shell head model used for source analysis of SEPs. The accuracy of the spherical mode1 was low for temporal electrodes and the neck electrode, which are located far f?om the central region. The spherical mode1 fitted reasonably well the electrodes positioned over the central region.
Temporal electrodes (T3, T4, TS, T6) and Fpz were located 1.5 cm from the surface of the
best fÏtting sphere on average. The neck electrode was 3.6 cm outside the sphere on
average. More importantly, al1 other electrodes were located at an average distance of 3.7
mm f?om the best fitting sphere.
Median N e w e SEPs
Instantaneous rn odeCs for the N20LP20 and N . U ? X potentiais
Instantaneous dipoles were fitted at the peak amplitude of the N20P20 and N2SR 25
potentials to compare the generators of these potentials. Locations of instantaneous
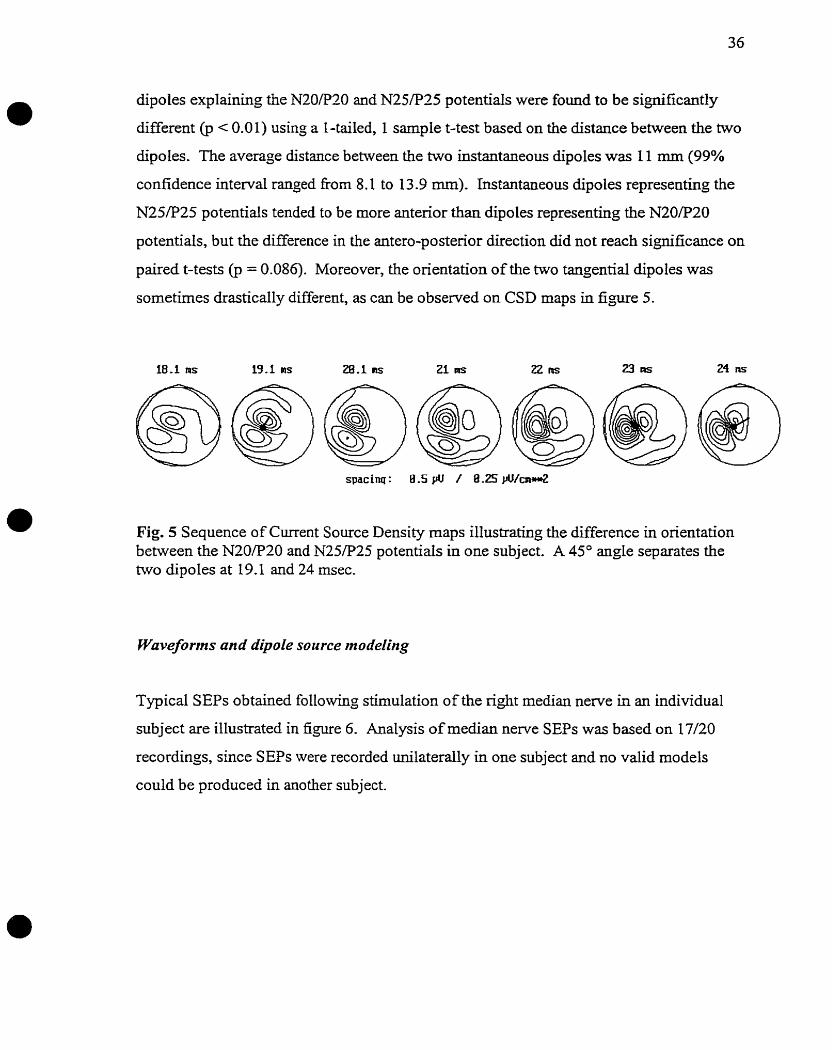
dipoles explaining the N20R20 and N25/P25 potentials were found ta be significantfy
different @ < 0.01) using a 1-tailed, 1 sample t-test based on the distance between the two
dipoles. The average distance bebveen the two instantaneous dipoles was 11 mm (99%
confidence interval ranged fkom 8.1 to 13.9 mm). Lnstantaneous dipoles representing the
N25/P25 potentials tended to be more anterior than dipoles representing the N20P20
potentials, but the difference in the antero-posterior direction did not reach significance on
paired t-tests @ = 0.086). Moreover, the onentation of the two tangentid dipoles was
sometirnes drasticdly different, as can be observed on CSD maps in figure 5.
spacing: 0.5yCI / 0.2SyU/cmrwr2
Fig. 5 Sequence of Current Source Density maps illustrating the difference in orientation between the N20P20 and N25P25 potentials in one subject. A 45O angle separates the two dipoles at 19.1 and 24 msec.
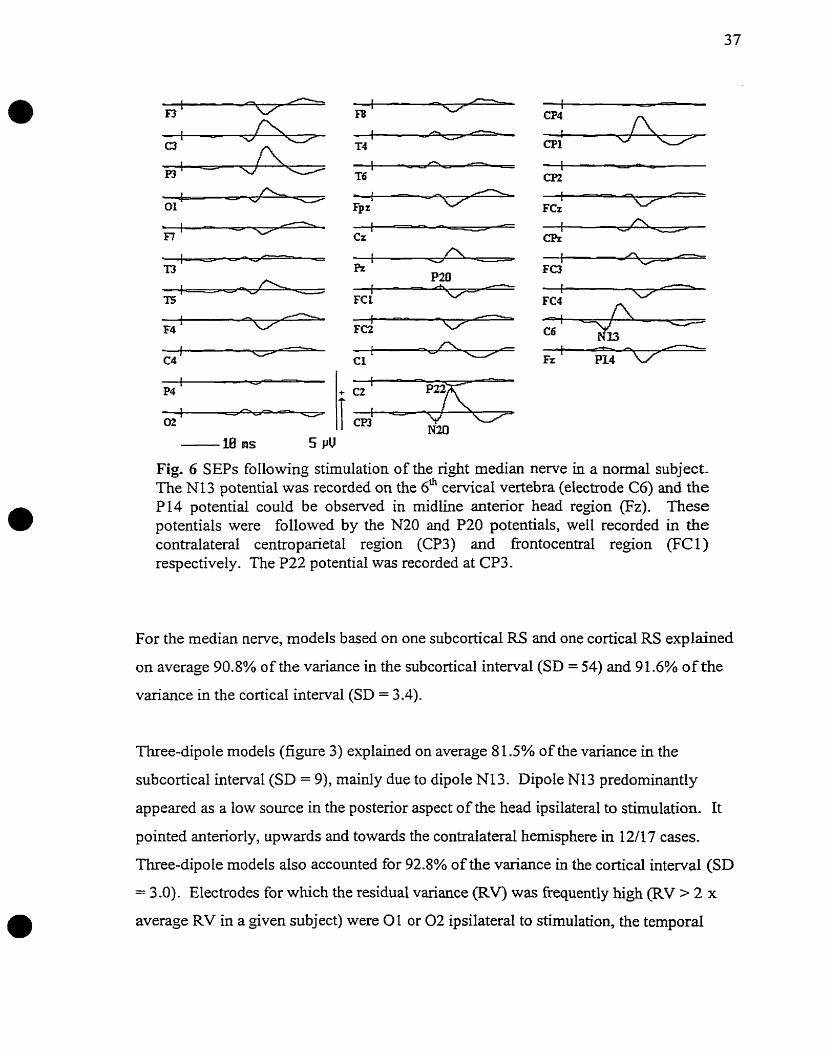
Waveforms and dipole source modeling
Typical SEPs obtained following stimulation of the right median nerve in an individual
subject are illustrated in figure 6. Analysis of median newe SEPs was based on 17/20
recordings, since SEPs were recorded unilaterally in one subject and no valid models
could be produced in another subject.
/
FCz
Fig. 6 SEPS following stimulation of the nght median nerve in a normal subject. The NI3 potential was recorded on the 6h ceMcal vertebra (electrode C6) and the P 14 potential could be observed in rnidline anterior head region (Fz). These potentials were followed by the N20 and PZ0 potentials, well recorded in the contralateral centroparietal region (CP3) and frontocentra1 region (FC1) respectively. The P22 potential was recorded at CP3.
For the median nerve, models based on one subcortical RS and one cortical RS explained
on average 90.8% of the variance in the subcortical interval (SD = 54) and 91.6% of the
variance in the cortical interval (SD = 3.4).
Three-dipole models (figure 3) explained on average 8 1.5% of the variance in the
subcortical intemal (SD = 9), mainly due to dipole N13. Dipole NI3 predominantly
appeared as a low source in the posterior aspect of the head ipsilateral to stimulation. It
pointed anteriorly, upwards and towards the contralateral hemisphere in 12/17 cases.
Three-dipole models aIso accounted for 92.8% of the variance in the cortical interval (SD
= 3 .O). Electrodes for which the residual variance (RV) was fiequently high (RV > 2 x
average RV in a given subject) were 01 or 0 2 ipsilateral to stimulation, the tempord

elech-odes independently of the side of stimulation, and FC3 or FC4 contralateral to
stimulation. Dipole N20/P20 predominantly appeared as a tangential dipole located in the
contralateral centroparietal region (figure 3), but it presented a more oblique orientation in
a few subjects. Fiawe 7 illustrates an example of a three-dipole mode1 in which the
N20P20 dipole was oblique.
Fig. 7 Three-dipole mode1 illustrating the variability in the orientation of the N20F20 dipole, which models the generator of the median nerve N20/P20 potentials. In this subject, the orientation of dipole N20/P20 was rather oblique, unlike the majorîty of dipoles which were tangential.
In 16/27 conditions, dipole N20P20 pointed in an anterior and midline direction. Dipole
P22 reached its maximum activity 2 msec later than dipole N20P20 on average. It was
located in the contralateral parietal or parieto-occipital head regions in 15/17 conditions.
The orientation of dipole PZ2 approached a radial orientation.
Latencies and Amplitudes
Results of statistical cornparisons between peak latencies of source waveforms in 3-dipole
models and SEP cornponents are given in table 1.

* : p < 0.05 Table 1 Cornparison between mean peak latencies of SEPs and mean peak latencies of dipole source waveforms
In 3-dipole models, the peak latency of the source waveform of dipole N13 did not
significantly differ fiom the latency of the N13 potentiai @ > 0.05). The peak latency of
dipole N20P20 was significantly later than the latency of the N20 potential (p < 0.05). A
significant difference was also observed between peak latencies of dipole P22 and of the
P22 potential @ c 0.05). Central conduction tïmes (N13-N20) as well as the lowest peak-
to-baseline amplitude and maximal interside amplitude difference of N2O observed in a
normal subject are given in table 2. The iowest peak-to-baseline amplitude encountered
in control subjects for either median or posterior tibial nerve SEPs was 0.3 1 yV. The
-
- x SD
maximal interside amplitude difference observed in this group was 60% for both median
and posterior tibial nerve SEPs.
, t l
NI3
12.6 1.21
Dip.NP0
19.2 1.18
1 Central conduction time (ms) 1 N20-N13 1 Left 1 5.9 * 0.7
Dip.P22
21.2 1.28
P22
22.3 1.43
1 1 Right 1 5.6 * 0.4
0.00
Dip.Ni3
12.6 1.21
N20
18.4 1.21
P40
39.6
4-95" 1 5.99"
Lowest peak-to-baselïne amplitude
Maximal Interhemisp heric amplitude di fference
Dip P40
39.4
0.70 1.931 2.15
Table 2 Central conduction times, lowest peak-to-baseline amplitude and maximal interside amplitude difference
Arms & legs
Anils
Legs
4.28,
N50
49.4
Dip N50
46.0 2.86
Right N20 &
P40 N20
P40
4.00
15.6 * 1.3 0.31 pV
60%
60%
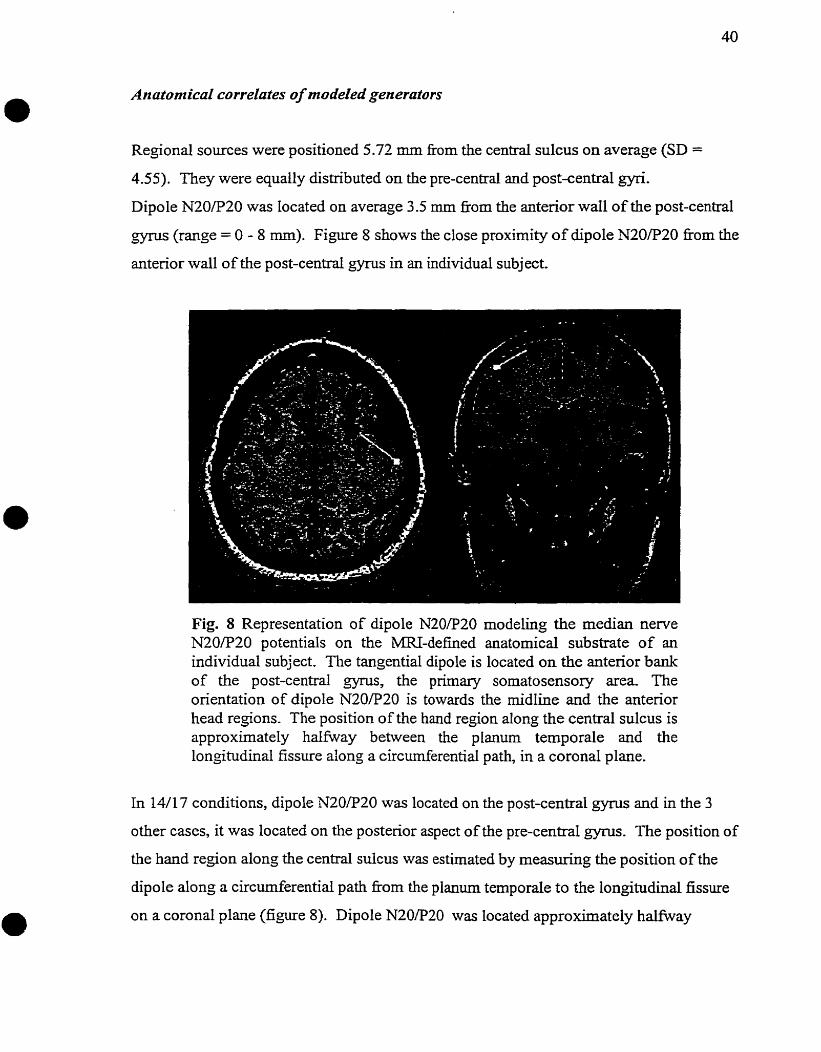
Anatonticai correlates of modeled generaturs
Regional sources were positioned 5.72 mm fiom the central sulcus on average (SD =
4.55). They were equally distributed on the pre-central and post-central gyri.
Dipole N20P20 was located on average 3.5 mm fiom the anterior w d l of the post-central
gyrus (range = O - 8 mm). Figure 8 shows the close proximity of dipole N20R20 fkom the
anterior wall of the post-central gyms in an individual subject.
Fig. 8 Representation of dipole N20/P20 rnodeling the median nerve N20P30 potentials on the MRI-defined anatomical substrate of an individual subject. The tangentid dipole is located on the antenor bank of the post-central ="ynis, the prirnary somatosensory area- The orientation of dipole N20P20 is towards the midline and the anterior head regions. The position of the hand region along the central sulcus is approximately halfway between the planum temporale and the longitudinal fissure aiong a circumferential path, in a coronal plane.
In 14/17 conditions, dipole N20E20 was located on the post-central gyrus and in the 3
other cases, it was located on the posterior aspect of the pre-central gyrus. The position of
the hand region along the central sulcus was estimated by rneasuring the position of the
dipole along a circumferential path from the planum temporale to the longitudinal fissure
on a coronal plane (figure 8). Dipole N20/P20 was located approximately halfway
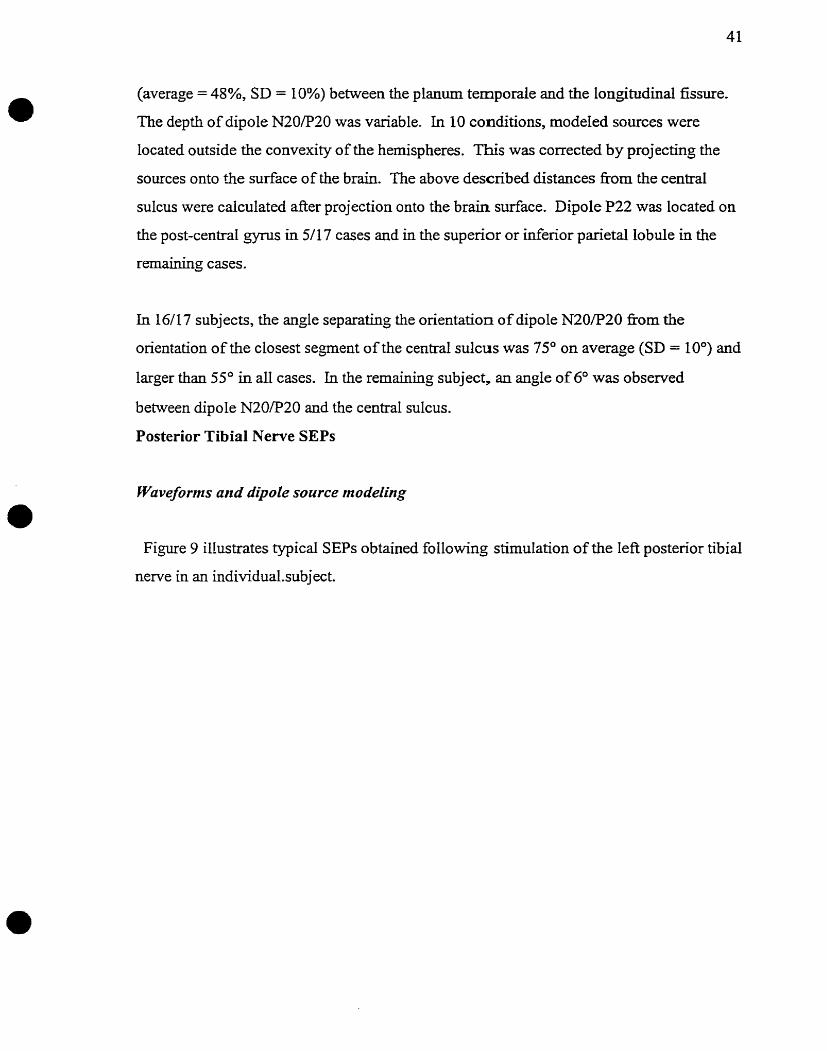
(average = 48%, SD = 20%) between the planum temporale and the Iongitudinal fissure.
The depth of dipole N20F20 was variable. In 10 conditions, modeled sources were
located outside the convexity of the hemispheres. This was corrected by projecting the
sources ont0 the surface of the braln. The above described distances fÎom the central
sulcus were cdculated after projection onto the brain surface. Dipole P22 was Iocated on
the post-central gyms in 5/17 cases and in the superior or inferior parietal lobule in the
remaining cases.
In 16/17 subjects, the angle separating the orientation of dipole N20/P20 f?om the
orientation of the closest segment of the central sulcus was 75" on average (SD = 10") and
larger than 55" in al1 cases. Ln the remaining subject, an angle of 6' was observed
between dipole N20P 20 and the central sulcus.
Posterior Tibia1 Nerve SEPs
Wavefornzs and dipole source modeling
Figure 9 illustrates typical SEPs obtained following stimulation of the left posterior tibia1
nerve in an individual.subject.
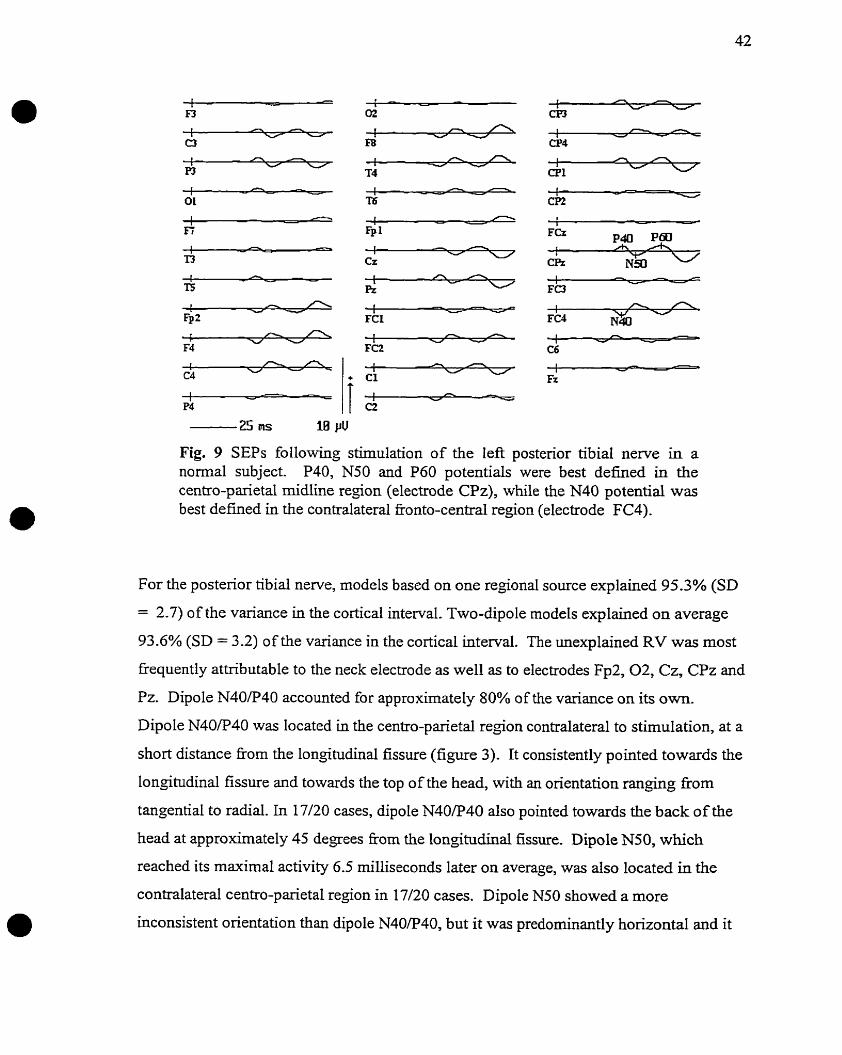
Fig. 9 SEPS following stimulation of the left posterior tibid nerve in a normal subject. P40, N50 and P60 potentials were best defined in the centra-pariet al midline region (electrode CPz), while the N40 potential was best defked in the contralateral bnto-central region (electrode FC4).
For the posterior tibia1 nerve, models based on one regional source explained 95.3% (SD
= 2.7) of the variance in the cortical interval. Two-dipole models explained on average
93.6% (SD = 3.2) of the variance in the cortical interval. The unexplained RV was most
fkequently attributable to the neck electrode as well as to electrodes Fp2,02, Cz, CPz and
Pz. Dipole N40R40 accounted for approximately 80% of the variance on its own.
Dipole N40/P40 was located in the centro-parietal region contralateral to stimulation, at a
short distance fiorn the longitudinal fissure (figure 3). It consistently pointed towards the
longitudinal fissure and towards the top of the head, with an orientation ranging fiom
tangential to radial. In 17/20 cases, dipole N40P40 also pointed towards the back of the
head at approximately 45 degrees fiom the longitudinal fissure. Dipole N50, which
reached its maximal activity 6.5 miIliseconds later on average, was also located in the
contralateral centro-parietal region in 17/20 cases. Dipole N50 showed a more
inconsistent onentation than dipole N40P40, but it was predominantly horizontal and it

pointed in an anterior direction, approximately parallel to the longitudinal fissure. in 7/20
cases, the orientation of dipole N50 was close to radial.
Latencies and Amplitudes
Dipole N40/P40 became maximally active 39 -4 msec &er stimulus onset on average
(table 1). Its Iatency was not significantly different from that of the P40 potential @ >
0.05). Dipole N50 reached its peak 3.4 msec before the actual N50 potential, a statisticaily
significant Iatency difference (p < 0.05). Table 2 shows central conduction times (N21-
P40) as well as the lowest peak-to-baseline amplitude and maximal interside amplitude
difference obsemed for the P40 potential in a normal subject.
AH atorrr ical currel ares of m odeled gerr erators
The average distance between regional sources and the centrd sulcus was 5.1 mm and
regional sources were located anterior to the central sulcus in 18/20 conditions. Regional
sources were positioned on average ai a depth of 9.5 mm fiom the surface of the brain and
6.1 mm lateral to the longitudinal fissure in the contralateral hemisphere.
Dipole N40R40 was located in the central sulcus or anterior to it (mean distance = 6.6
mm; range 0-18 mm). Figure 10 illuseates the position of dipole N40P40 with respect to
the central sukus in an individual subject.

Fig. 10 Representation of dipole N40/P40 modeling the posterior tibid N40P40 potentials on the MRI-defuied anatomical substrate of a . individual subject. Dipole N40P40 is Iocated anterior to the central sulcus at a short distance £rom the longitudinal fissure. It points towards the longihidinal fissure, the top of the head, and the back of the head, in a direction approaching that of the central sulcus.
Dipole N40/P40 was positioned 2 to 11 mm lateral to the longitudinal fissure (mean = 6.7
mm) and at an average depth of 8-35 mm. Dipole N50 was seated deeper in the brain
(average depth = 15 mm) than dipole N40P40. It was located anterior to the central
sulcus in the majority of cases, and 8.7 mm lateral to the longitudinal fissure on average
(SD = 7).
Gelterators of Median Newe SEPs
After correction for eccentricity, accurate locaiization of primary somatosensory hand
region in the anterior aspect of the post-central gyms can be achieved using spatio-
temporal modeling of the generators of median nerve SEPs. Localization is based on the
position of dipole N20P20, a tangential dipole modeling the early cortical components of
median nerve SEPS. The average distance between dipole N20/P20 and the anterior wall
of the post-central gyrus was 3.5 mm and the maximal distance was 8 mm. These resdts
are comparable with those of Buchner et al (1995) who reported an average distance of 6
mm and a maximal distance of 9 mm between modeled generators for the N20/P20
potentiais and Brodmann's area 3b. In addition, the position of the hand region dong the
central sulcus was found to be approximately halftvay between the planum temporale and
the longitudinal fissure dong a circumferential path, in a coronal plane. This last measure
constitutes a gross estimation of the localization of the hand region dong the post-central
g y m since it is based on a coronal plane which ignores the circumvolutions of the post-
central gyms. However, it is interesting to note that in all cases, dipole N20P20 was
located in a f d y narrow region between 27% and 65% of the distance fiom the planum
temporale to the longitudinal fissure.
In contrast, dipole P22 constitutes a poor marker of the somatosensory hand region.
Dipole P22 was located on the post-central gynis in only 29% of the cases and in the
idenor and supenor parietal lobules in 71% of the cases. One possible explanation for
this unexpected finding is the length of the cortical interval which includes only part of
the activity of the source wavefom of dipole P22. This short interval may lead to an
inaccurate localization of dipole P22. However, the source was also frequently located in
posterior head regions when, in a preliminary analysis, we used a longer cortical interval
including the N20P20 and N25/P25 potentials (Routhier and Gotman 1996). A longer
interval was not associated with a localization of dipole P22 on the crown of the post-
central gyrus, as predicted by Allison et al (1989). Therefore, the present results do not
provide strong support for the hypothesis of a second cortical generator located on the
post-central gyrus. Buchner et al (1 995) reported an equal distribution of the radial dipole
antenor, posterior, or within the central sulcus, but these authors did not report the actual
distance fiom the crown of the post-central gyms.

Three-dipole models based on one subcortical dipole and two cortical dipoles explain well
the scalp-recorded potentials evoked by stimuIation of the median nerve. Eighty percent
of the variance in the subcorticul interval was explained by a low source in the posterior
aspect of the head. Dipole NI3 models the large amplitude N13 potential, since peak
latencies of the source waveform and of the potential do not significantly differ. It also
appears to mode1 the far-field P 14 because the dipole points towards anterior head regions
where P l 4 is maximally recorded, The position of dipole N13 is not weli defined due to
the scarcity of eiectrodes in the inferior haif of the sphere. Moreover, the genesis of this
far-field potential is likely linked to a variety of factors: fïxed neural generators, changes
in the resistance or impedance of the volume conductor, and the anatomic orientation of
the traveling impulse (Kimura et al. 1983 1984).
Early cortical components of median nerve SEPS are adequately modeled by dipole
N20P20 and dipole P22, as shown by the very large portion of the variance explained by
three-dipole models in the cortical interval (92.8%). However, the peak activity of the
N20P20 and P22 dipole source waveforms differ significantly fiom the peak activity of
the N20/P20 and P22 potentials. Dipole N20P20 peaks slightly but quite consistentty
Mer than the N20 potential, measured at the CP3 or CP4 electrode contralateral to
stimulation. This fhding was also reported by Franssen et a1 (1992) and Buchner et al
(1995). Measurements at the CP3 or CP4 electrode represent the largest amplitude
potential, but this high amplitude activity is restricted to a few electrodes. Approximately
one millisecond later, the activity fiom the tangential generator is spread to neighboring
electrodes, resulting in a higher global field power. Since source analysis explains mainly
latencies of maximum global field power, the activity of dipole N20P20 peaks
approximately 1 msec after the CP3/CP4 maximum. With regards to dipole P22, the
maximum activity occurs before the P22 potential measured at the CP3 or CP4 electrode
contralateral to the side of stimulation. When a CSD map is constructed at the peak
latency of the P22 potential (measured at the CP electrode), we fiequently observe a
central positivity and an 'inverted tangential dipole' corresponding to the N25P25
potentials (figure 2: CSD map at 21 msec). Since the N25/P25 potentials were excluded
fkom analysis, dipole P22 will obviously not mode1 the activity at the peak latency of the
P22 potential. In our opinion, dipole PZ2 models the transition between the N20P20 and
N25/P25 potentials which appears as a central positivity often accompanied by a
negativity posterior to the N20 potential (figure 2: CSD map at 20.1 msec). This
explmation would account for the posterior localization of dipole P22. The transition
state would also explain the variability that we and others have observed in the orientation
of dipole P22 Paumgartner et al. 1991).
Three-dipole models explained nearly dl data sets (17/19), and the two cases in which
these models were not applicable occurred in a single subject who presented one of the
worst overall signal-to-noise ratio.
CSD maps have proven usekl in the definition of the cortical interval of median nerve
SEPS by allowing the exclusion of undesired potentials. The analysis of the position of
instantaneous dipoles fitted at the peak amplitude of the N20P20 and N25P25 potentials
showed a significant difference between the position of the two dipoles @ < 0.01).
However, this analysis is based on instantaneous dipoles which may lead to erroneous
results since the activity of multiple sources overlap in time in the cortical interval.
Therefore, a different approach based on spatio-temporal modeling was taken to confïnn
our findings. ThÏs approach consisted in testing how well three-dipole models based on
the cortical interval explain the interval covering the N25R25 potentials. In 9/17 cases,
the fixed dipoles explained well the N25P25 potentials, resulting in a less than 5%
increase in RV cornpared to the cortical interval. However, in 6 cases, the RV increased
by at least IO%, reaching a 28% increase in the case illustrated in figure 5. The
inadequacy of the modeled generators of the N20 and P22 potentials to explain the later
potentials was obvious in 6/17 cases. Therefore, the cortical in t end should not include
the N25@25 potentials which appear to be generated by a generator different from the
N20/P20 potentials. This fhding disagrees with the positive-negative potential sequence
documented in animal experiments (Mitzdorf, 1985). In addition, there was a tendency for
instantaneous dipoles representing the N25P25 potentials to be located more anteriorly

than the generators of the N20/P20 potentials. This was also observed by Garcia-Larrea et
aL(1992) who reported a more anterior isoelectric line for dipole P24/N24 than for dipole
P20N20. This suggests that the generator of the N25/P25 potentials may be in the
posterior wali of the pre-central gyrus, which is known to have strong anatomical
connections with the post-central gynis.
Generators of Posterior Tibiul Nerve SEPs
Spatio-temporal modeling of the generators of posterior tibial nerve SEPs localize the
modeled generators near the primary somatosensory foot region. Dipole N40/P40 was
located at an average distance of 6 mm fkom the central sulcus or its projection on the
paracentral lobule. A position 2 to 11 mm lateral to the longitudinal fissure and an
average depth of 8.4 mm were observed. This location is shallower and closer to the
rnidluie than the position of equivalent current dipoles found with MEG at this latency
(Huttunen, 1987). Dipole N50 was seated deeper in the brain and slightiy more lateral
than dipole N40P40. A deep seated dipole was suggested by Takahashi et a1 (1996) to
explain two different wave patterns at superficial and deep locations along the
longitudinal fissure. Unexpectedly, dipole N40ff40 and dipole N50 were located anterior
to the central sulcus in the rnajority of cases. The reason for this anterior location is
unclear. It is unlikely due to an inadequate head model since sources for the hanci SEPs
based on the same head model did not display such a bias.
The N40P40, N50 and P60 potentials of posterior tibial nerve SEPs are well accounted
for by two-dipole rnodels, since 94% of the variance in the cortical interval is explained
on average. Al1 recorded data sets could be explained by simple two-dipole models. At
the beginning of the interval, dipole N40R40 is responsible for the generation of the
N40P40 dipole since dipole N50 becomes ody active 6.5 msec later. These results are in
agreement with models generated fiom MEG recordings (Hu~inen et ul. 1987) and
topographical analysis of CSD maps (Nagarnine et al. 1992) following stimulation of the
posterior tibial nerve, which point to a single generator at these latencies. Even though
dipole N40/P30 accounts for 80% of the variance in the cortical interval, a second source,

dipole MO, is needed to explain potentials observed later than the N40/P40 potential.
This again is in agreement with MEG models which cannot explain later potentials with a
single equivalent dipole (Huttunen et al. 1987).
Unlike modeled generators for the early corncal median nerve potentials, the activity of
dipote N40P40 peaks at the same t h e as the P40 potential. Moreover, the spread of
activation is restncted and no subsequent increase in global field power is seen. These
three observations support the hypothesis that dipole N40P40 fully explains the P40
potential. Dipole N50 reaches its first peak activity before the N50 potential and models
the N50 and P60 potentials.
Even though good agreement is observed between recorded potentials and forward
solutions based on modeled generators, these models constitute simple approximations of
the generators of SEPS. The remaining residual variance at certain electrodes testiQ to the
complexity of the neuronal generators of these potentials.
Accwacy of Head models
Ln the present study, dipole N20P20 occupied a very eccentric position in some subjects.
This modeling error was not observed for dipole N40P40, but dipole N40F40 was still
located more superficially than the corresponding MEG dipole, which was located at a
depth of 27 & 4mm (Huttunen, 1987). The larger eccentricity of dipole N20/P20
compared to dipole N40/P40 is probably due to the increaçed inaccuracy of the head
mode1 fiom media1 to lateral aspects of the head (figure 4). This inaccuracy was
compensated by projecting dipole N20P20 ont0 the brain surface. However, an overall
tendency of dipoles to occupy eccentric positions was also observed. The inaccuracy in
the depth of the dipoles was not observed when prelimùiary results were computed with
the Ary approximation to the three-shell head mode1 (Routhier and Gotman 1996). Four-
shell head models were chosen since various authors (Berg and Scherg 1994; Zhang and
Jewett 1993) argued that the Ary approximation could lead to inaccurate location for

sources located at large eccentricity. By adopting Cshell head models, the eccentricity of
modeled generators increased, but the distance between the 'projected dipole N20/P207
and the central sulcus dong the antero-posterior and medial-lateral axes was reduced,
Orientation of the gelterators
Regional sources also provide good approximations of the location of the plimary
somatosensory areas. Regional sources located the cenbal sulcus with an average
accuracy of 5.7 mm for the median nerve SEPs and 5.1 mm for the posterior tibial nerve
SEPs.
However, regional sources lack important information that c m contribute to the
characterization of the generators: the orientation of the dipoles. The orientation of the
rnodeled generators can be compared to the underlying anatomy to assess whether
modeled generators are onented perpendicular to the cortical surface, as wouid be the case
if dipoles modeled sheets of pyramidal cells. For the median nerve, dipole N20P20
consistently pointed towards the midline and anterior head regions and it approximated a
horizontal dipole. An average angle of 75' separated the orientation of dipole N20/P20
from the orientation of the closest segment of the anterior wall of the post-central gyms.
We can thus deduce that the orientation of dipole N20P20 differs Erom the presumed
orientation of pyramidal cells by an average angle of 15". Even though the rnodeled
generator is not exactly perpendicular to the anterior wall of the post-central gyrus, it
constitutes a good approximation of the orientation of the pyramidal sheets in the primary
somatosensory area. Such an analysis was not performed for dipole P22 which presented
an inconsistent orientation.
For the posterior tibial nerve, dipole N40P40 consistently pointed postenorly, medially
and towards the top of the head, with an orientation ranging fiom tangential to radial.
Cornparisons between dipole orientation and the orientation of the anatomical substrate
are difficult because dipole N40/P40 is f?equently oblique and it cannot be well visualized
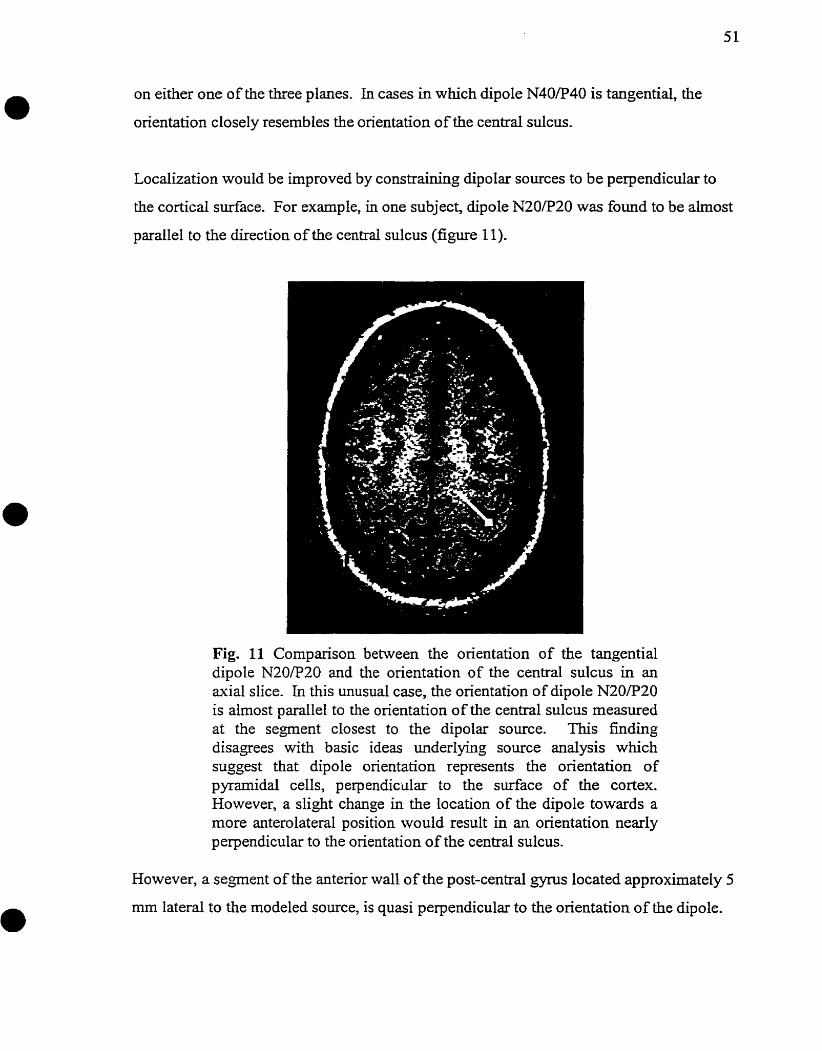
on either one of the t.hree planes. In cases in which dipole N40P40 is tangential, the
orientation closely resembles the orientation of the central sulcus.
Localization would be improved by constraining dipolar sources to be perpendicular to
the cortical surface. For example, in one subject, dipole N20P20 was found to be almost
parallel to the direction of the central sulcus (figure 11).
Fig. 11 Cornparison between the orientation of the tangential dipole N20P20 and the orientation of the central sulcus in an axial slice. In this unusual case, the orientation of dipole N20/P20 is almost parallel to the orientation of the central sulcus measured at the segment closest to the dipolar source. This hd ing disagrees with basic ideas underIying source analysis whïch suggest that dipole orientation represents the orientation of pyramidal cells, perpendicular to the surface of the cortex. However, a slight change in the location of the dipole towards a more anterolateral position would result in an orientation nearly perpendicular to the orientation of the central sulcus.
However, a segment of the anterior wall of the post-central gyms located approximately 5
mm lateral to the modeled source, is quasi perpendicular to the orientation of the dipole.

Therefore, source analysis based on a normality constraint would have found a source
slightly more laterally, in good agreement with the anatomical substrate.
In conclusion, spatio-temporal rnodeling of median nerve and posterior tibia1 nerve SEPS
based on a relatively small number of electrodes provides an effective tool for the
localization of the central sulcus. The digitization of electrode coordinates in MRI space
allows for the correlation of source localization with the MRI-defined anatomical
substrate. Constraining generators to be located in the gray matter with an orientation
normal to the cortex will M e r Uicrease the mapping power of this technique, making it
applicable to a wide variety of evoked responses. Although adequate mapping of
somatosensory cortex can be achieved with spatio-temporal rnodeling, extemal validation
with high spatial resolution mapping techniques in the sarne MR space is warranted. In
the context of this rnultimodality mapping, spatio-temporal modehg will be instrumental
in interpreting the temporal evolution of the sensory systems activated.
Acknowledgrnents: We are gratefûl to Ms Nicole Drouin and to Ms Lorraine Allard for
technical assistance and for their dedication to this research project. We also want to
thank Dr François Dubeau for useful comments on the manuscript and for constant
support. Dr Daniel Gendron, Dr Terry Peters, and Dr Felipe Quesney provided use of the
EMG, MN, and EEG facilities respectively. Dr Alejandro Bastos helped in the
interpretation of MRls-

l This project was supported by the Savoy Foundation and the Neurology and
Neurosurgery program at McGill University.
Allison, T., McCarthy, G., Wood, CC., Darcey, T.M., Spencer, D.D., Williamson, P.D.
Human Cortical Potentials Evoked by Stimulation of the Median Nerve. 1.
C ytoarchitectonic Areas Generating S hort-Latency Activity. J Neurophysiol, 1 98 9, 62:
694-710.
Arezzo, J., Legatt, A.D., Vaughan, J., H.G. Topography and intracranial sources of
somatosensory evo ked po tentials in the monkey. 1. Early components. Electroencep h clin
Neurophysiol, 1979,46: 155-1 72.
Baumgartner, C., Barth, D.S ., Levesque, M.F., Sutherling, W. W. Functional anatomy of
human hand sensonmotor cortex kom spatiotempord analysis of electrocorticography.
Electroenceph clin Neurophysiol, 199 1, 78: 56-65.
Baumgartner, C., Doppelbauer, A., Sutherling, W.W., Lindinger, G., Levesque, M.F.,
Aull, S., Zeitlhofer, I., Deecke, L. Somatotopy of Human Hand Somatosensory Cortex as
Studied in Scalp EEG. Electroenceph clin Neurophysiol, 1993, 88: 27 2 -279.
Berg, P., Scherg, M. A fast method for foward computation of multiple-shell spherical
head rnodels. Electroenceph clin Neurophysiol, 1994,90: 58-64.
Broughton, R.J. Somatosensory Evoked Potentials in Man: Cortical and Scalp
Recorduigs. Unpublished doctoral dissertation, McGill University, Montreal, Canada,
1967.
Buchner, H., Adams, L., Knepper, A., Rüger, R., Laborde, G., Gilsbach, LM., Ludwig, I.,
Red, I., Scherg, M. Preoperative localization of the central sulcus by dipole source
analysis of early somatosensory evoked potentials and three-dimensional magnetic
resonance imaging. J Neurosurg, 1994,SO: 849-856.
Buchner, H., Adams, L., Müller, A., Ludwig, L, Knepper, A-, Thron, A., Niemaun, K.,
Scherg, M. Somatotopy of Huma. Hand Somatosensory Codex Revealed by Dipole
Source Analysis of Early Somatosensory Evoked Potentids and 3D-NMR Tomography.
Electroenceph clin Neurophysiol, 1995, 96: 12 1-134.
Desrnedt, J.E., Bouguet, M. Color imaging of parietal and frontal somatosensory
potential fields evoked by stimulation of rnedian or postenor tibial nerve in man.
Electroenceph clin Neurophysiol, l985,62: 1-17.
Franssen, H., Stegeman, D.F., Maleman, J., Schoobaar, R.P. Dipole Modelling of Median
Nerve SEPS in Nomal Subjects and Patients with Small Subcortical Tnfarcts.
Electroenceph clin Neurophysiol, 1992, 84: 461-417.
Garcia-Larrea, L., Bastuji, H., Mauguiere, F. Unmasking of cortical SEP components by
changes in stimulus rate: a topographic study. Electroenceph clin Neurophysio l, 1992,
84: 71-83.
Geddes, LA., Baker, L.E. The specific resistance of biological materials - a compendium
of data for the biomedical engineer and physiologist. Med Bi01 Eng, 1967,s: 271-293.
HuMuien, J., Kaukoranta, E., Hari, R Cerebral magnetic responses to stimulation of tibial
and sural nerves. J Neurol Sci, 1987,79: 43-54.
Kido, D.K., Le May, M., Levinson, A.W., Benson, W.E. Computed tornographic
localization of the precentral gyms. Radiology, 1980, 135: 373-377.
Kimura, J., Mitsudome, A., Beck, D.O., Yamada, T., Dickins, Q.S. Field Disiribution of
Antidromically Activated Digital Nerve Potentials: Model for Far-Field Recording.
Neurology, 1983,33: 1164-1169.

Kimura, J., Mitsudome, A., Yamada, T., Dickins, Q.S. Stationary Peaks koom a Moving
Source in Far-Field Recording. Electroenceph clin Neurophysiol, 1984,58: 351-361.
Lehmann, D., Skrandies, W. Reference-kee identification of components of
checkerboard-evoked multichanneI potential fields. Electroenceph clin Neurop hysio 1,
1980,48: 609-62 1,
Lesser, R.P., Lüders, H., Dinner, D-S., Hahn, J., Morris, H., Wyliie, E., Resor, S. The
source of 'paradoxical lateralization' of cortical evoked potentials to posterior tibial nerve
stimulation. Neurology, 1987, 37: 82-88.
Mauguiere, F ., Desrnedt, J.E. Bilateral Somatosensory Evoked PotentiaIs in Four Patients
with Long-standing Surgical Hemispherectomy. Ann Neurol, 1989,26,6: 724-73 1.
Mitzdorf, U. Current source-density method and application in cat cerebral cortex:
investigation of evoked potentials and EEG phenomena. Physiol Rev, 1985, 65: 3 7-100.
Nagamine, T., Kaji, R., Suwazono, S., Hamano, T., Shibasaki, H., Kimura, J. Cunent
source density mapping of somatosensory evoked responses following median and tibia1
nerve stimulation. Electroenceph clin Neurophysiol, 1992, 84: 248-256.
Naidich, T.P. MR imaging of brain surface anatomy. Neuroradiology, 1991, 33(Suppl):
S95-S99.
Nakano, S., Tsuji, S., Matsunaga, K., Murai, Y. Effect of sIeep stage on somatosensory
evoked potentials by median nerve stimulation. Electroenceph clin Neurophysiol, 1995,
96: 385-389.
Picton, T.W., Lins, O.G., Scherg, M. The recording and analysis of event-related
potentials. In: F. Boller, J. Grafman (Eds), Handbook of Neuropsychhology, Ch. 1. Elsevier
Science B.V., Amsterdam, 1995: 3-73.
Routhier, N., Gotrnan, J., Anatomical Substrate of Generators of Somatosensory
Potentials Evoked by Posterior Tibiai Nerve Stimulation. American Clinical
Neurophysiology Society Annual Meeting, 1996, (Abstract), (in press).
Scherg, M., von Cramon, D. Evoked Dipole Source Potentials of the Human Auditory
Cortex. Electroenceph clin Neurophysiol, l986,65: 344-360.
Steinrnetz, H., Furst, G., Freund, H.J. Variation of perisylvian and calcarine anatomic
landmarks withh stereotaxic proportional coordinates. AJNR: Am J Neuroradio, 1990,
11: 1123-1 130
Stok C.J. The inverse problem in EEG and MEG with application to visual evoked
responses. CIP Gegevens Koninklijke Bïbliotheek, The Hague, 1986.
Sutherling, W.W., Crandall, P.H., Darcey, T.M., Becker, D.P., Levesque, M.F., Barth,
D.S- The magnetic and electric fields agree with intracranial localizations of
somatosensory cortex. Neuology, 1988,38: 1705-1714.
Takahashi, H., Suzuki, I., Ishijima, B. Cortical and Subcortical SEPS Following Posterior
Tibia1 Nerve Stimulation. Brain Topography, 1996, 8, 3: 233-235.
Woolsey, C.N. Organization of Somatic Sensory and Motor Areas of the Cerebrat Cortex.
In: H.F. Harlow, C.N. Woolsey (Ed.) Bio&ical and Biochenzical Bases of Behavior,
University of Wilconsin Press, Wisconsin, 1958: 63-8 1.

Zhang, Z., Jewett, D.L. Insidious errors in dipole localization parameters at a single time
point due to mode1 rnisspecification of number of shells. Electroenceph clin
NeurophysioI, 1993, 88: 1-1 1.
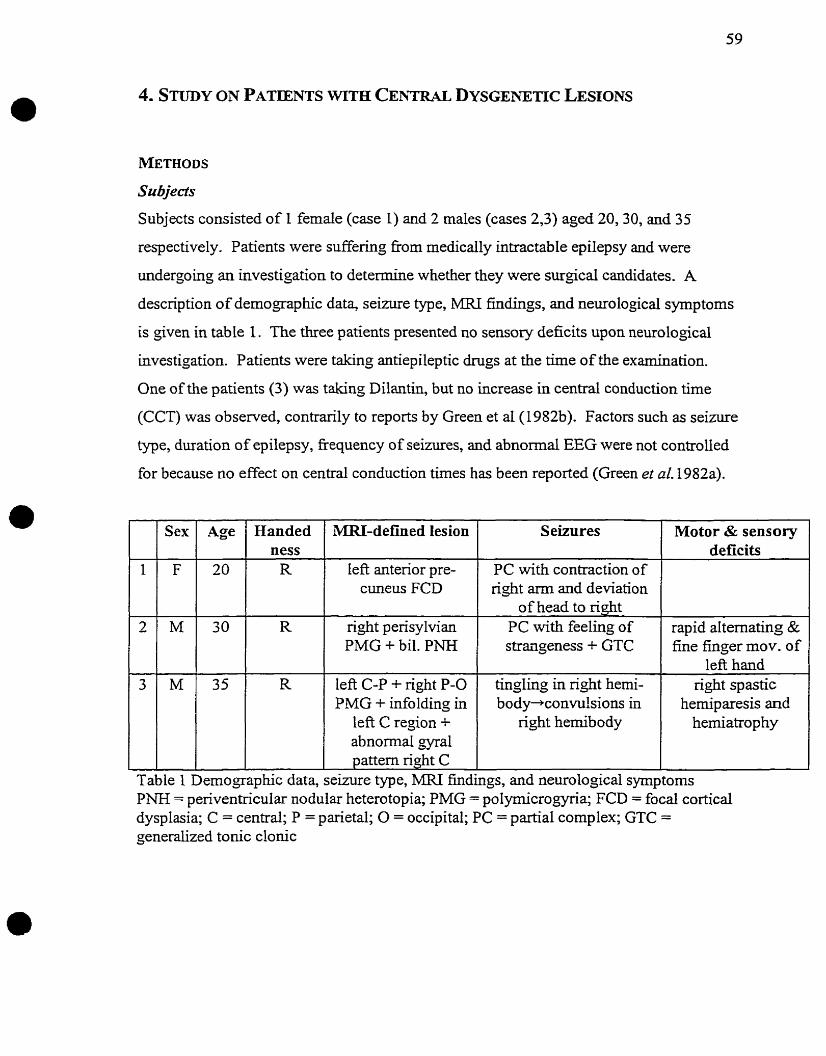
METHODS
Subjects
Subjects consisted of 1 femde (case 1) and 2 males (cases 2,3) aged 20,30, and 35
respectively. Patients were s u f f e ~ g fiom medically intractable epilepsy and were
undergohg an investigation to determine whether they were surgical candidates. A
description of dernographic data, seinire type, MRI hdings, and neurological symptoms
is given in table 1. The three patients presented no sensory deficits upon neurological
investigation. Patients were taking antiepileptic drugs at the time of the examination.
One of the patients (3) was taking Dilantin, but no increase in central conduction time
(CCT) was observed, contrarÏly to reports by Green et al (1982b). Factors such as seizure
type, duration of epilepsy, fkequency of seimes, and abnormal EEG were not controlled
for because no effect on central conduction times has been reported (Green et al. I982a).
Table 1 Demog PNH = periveni dysplasia; C = c
1
2
Sex
F
M
Handed ness R
Motor & sensory deficits
Age
20
30 R - .
rapid altemating & fine finger mov. of
lefi hand
%TRI-defined Lesion
lefi anterior pre- cuneus FCD
S eizures
PC with contraction of ri& arm and deviation
nght pensylvian PMG + bil. PNH
generalized tonic clonic
of head to right PC with feeling of straageness + GTC
R
aphic data, seizure type, MRI findings, and neurological symptoms icular nodular heterotopia; PMG = polyrnicrogyria; FCD = focal cortical mtral; P = parietal; O = occipital; PC = partial complex; GTC =
lefi C-P + right P-O PMG + infolding in
lefi C region + abnormal gyral pattern right C
tingling in right hemi- body+convu!sions in
right hernibody
nght spastic herniparesis and
hemiatrophy
Radiologicnl classification of dysgenetic lesions and M X l rneasurements
Al1 classincations were made on radiological criteria Some patients presented more than
one type of dysgenetic lesion (table 1). Pen~en~cuZar nodular heterotopia (PNTI),
characterized by nodules of gray matter isointense to the cortex and lùiiog the lateral
ventricles, was observed in patient 2. Multiple small irregular gyri, irregularities of the
-white matter interface, and normal cortical thiclaiess characterized polynzicr~gy~a
(PMG) (patients 2 and 3). In patient 3, a severe infolding lined with PMG was observed
in the left central region. Focal cortical dysplasia (FCD) seen in patient 1 was
characterized by an abnomal cortical pattern, cortical thickening and blurrïng of the gray
mattedwhite matter interface.
In patients 1 and 2, the central suIcus could be identified ushg the same critena as was
used in control subjects. In patient 3, it was ill-defined in the right hemisphere and
unidentifiable in the le fi hemisp here
It was determined whether lesions invaded the primary somztosensory representations of
the hand and foot on the post-central gyrus. Based on control subjects, the extent of the
hand rspresentation on the post-central gyms was grossly d e h e d as 48% t 20% of the
distance fiom the planum temporale to the longitudinal fissure on a coronal slice taken at
the level of the post-central a"ynis. The foot representation occupied a parasagittal
position close to the paracentral lobule and less than 1.7 cm away fiorn the longitudinal
fissure in 95% of the control cases. In patient 3, the bilateral lesions invaded the central
region in a d i f i se marner, and even though the central sulcus could not be identified, al1
parts of the "ill-defined post-central gyri" were considered to be invaded by dysgenetic
lesions (or by abnormal gyral patterns).
SEPs
Recording parameters, processing of SEPs, dipo le modehg, and measurements were the
same as in the study on control subject unless specified otherwise in the following
paragraphs.
Laten cy and Amplitude Measurernents
In cases of abnormally distributed potentids, latencies and amplitudes were measured at
the highest amplitude peaks. Patients central conduction times (CCTs) which were more
than 3 SD from the mean CCT of the control group were considered abnorrnal. Analysis
extended to 40 ms post-stimulus for the median nerve and 80 ms for the posterior tibia1
nerve SEPs. Interhernispheric amplitude differences exceeding the highest difference
fomd in control subjects were considered abnormal. Peak to baseline amplitudes lower
than the lowest amplitude value encountered in control subjects were classified as
abnormal. However, it is more difficult to interpret peak to baseline amplitudes given the
hi& variability observed in the control group.
Distribution of SEPs
The distribution of early cortical SEPs was analyzed with Current Source Density (CSD)
maps based on the 32 electrode recordings and compared to typical maps of control
subjects.
SEPs
Normal SEPs were recorded at penpheral locations (C6 and LI), confimiing the absence
of abnormalities of the peripheral nervous system. As can be seen in table 2, SEPs were
normal in patients 1 and 2. Patient 3 presented srnaIl and ill-dehed N2OP20 and

N40/P40 potentids for the right median and posterior tibial nerve SEPs. For the left
median and postenor tibial nerve SEPs, early cortical potentials were of normal amplitude
and latency, but CSD maps showed a parietal rather than a centrai location.
SEPs vs Location of Dysgenetic Lesians
Table 2 shows a cornparison between the part of the post-central gyms invaded by the
dysgenetic lesion and SEP abnormalities.
MRI Part of post-central gyrus (PCG)
SEP abnormalities L. median 1 R median 1 E. 1 R
1 2 3
Table 2 CSD = CSD maps sequence; L = latency; A = interside amplitude diffience, a =
invaded by dysgenetic Iesion -
right PCG ( with large infolding on left PCG)
absolute amplitude
hand region on right PCG hand and foot regions on left and
No SEP abnormalities were observed in patient 1, who presented focal cortical dysplasia
bordering, but slightly outside primary somatosensory cortex. The polymicrogyric Lesion
of patient 3 clearly invaded the hand and foot regions of the lefi post-central gyms and
was accompanied by a large infolding. In the right central region, an abnorrnal gyral
pattern, which was not clearly dysgenetic in nature but which may be an extension of the
parieto-occipital PMG, was observed. Correspondingly, SEPs were abnormal for al1 four
lirnbs in patient 3. SEP abnomalities were more pronounced for the nght median and
posterior tibia1 nerves, in agreement with the severe structural abnormalities of the left
central region. Therefore, in these two, SEP abnormalities were only present if the
corresponding part of the post-central gyrus was found abnormal.
-
posteriorly located
N20iP20
- CSD:
-
ill-defïned N20P20
- A;a;CSD:
post. tib. -
1 N4W40
posteriorly located
post.tib. -
- CSD:
deflned N40/P40
- a;CSD: ill-
No such correlation was found for patient 2. SEPs were normal for all four limbs even
though a pensylvian polymicrogyria invaded the hand region on the right post-central
W S -
Modeied Generators of SEPs
Three-dipo le models explahed on average 92% of the variance in median nerve SEPs
while two-dipole models explained 93% of the variance in posterior tibia1 nerve SEPs.
Dipole pararneters obtained £kom patients were compared to the positions and orientations
obtained fiom control subjects. Positions and orientations which were more than 2 SD
away fiom the mean position and orientation of control subjects were considered
abnonnal.
Modeled Sozïrces us Location of Dysgen efic Lesions
A cornparison hetween the part of the post-central gyms invaded by the dysgenetic lesion
and abnormalities of the modeled sources was perfomed. In patient 1, al1 dipole
pararneters were within normal limits for the four limbs, in agreement with a lesion
located outside the post-central gynis. Figure 5 illustrates the modeled sources obtained
for this patient.
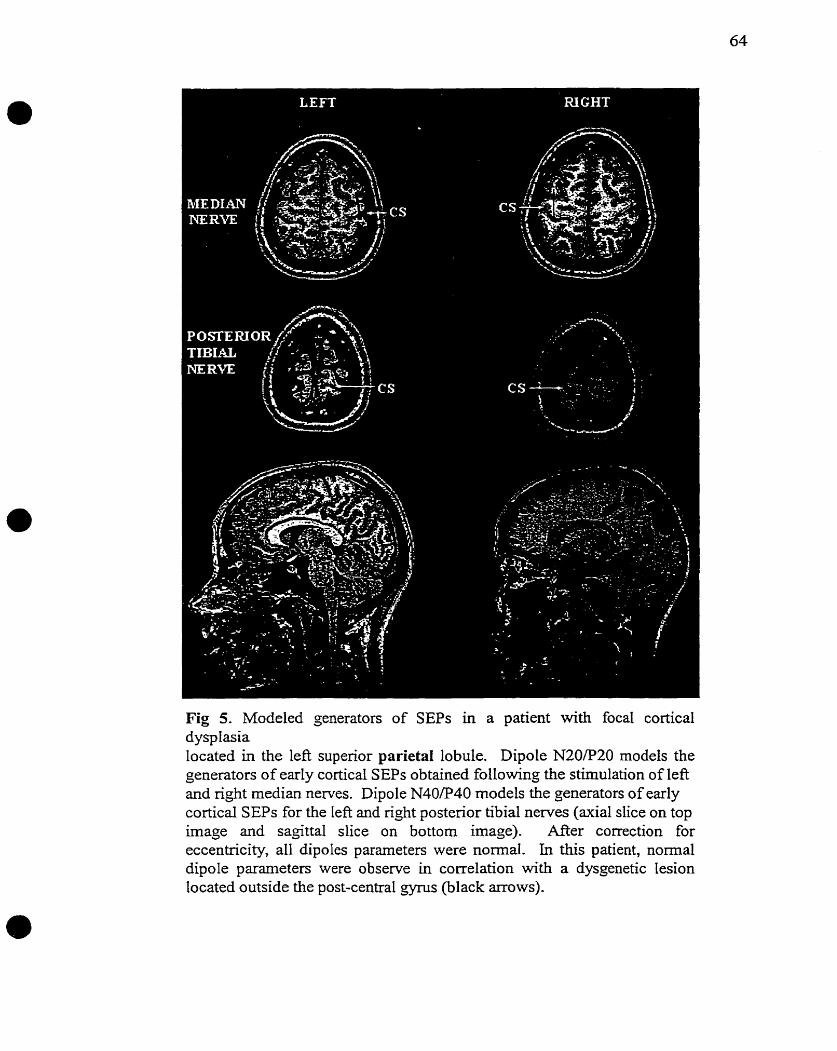
Fig 5. Modeled generators of SEPs in a patient with focal cortical dyspIasia located in the left superior parietal lobule. Dipole N20P20 models the generators of early cortical SEPs obtained following the stimulation of left and right median nerves. Dipole N40P40 models the generators of early cortical SEPs for the left and right posterior tibia1 nerves (axial slice on top image and sagittal slice on bottom image). After correction for eccentricity, al1 dipoles parameters were normal. In this patient, normal dipole parameters were observe in correlation with a dysgenetic Iesion Iocated outside the post-central gynis (black arrows).
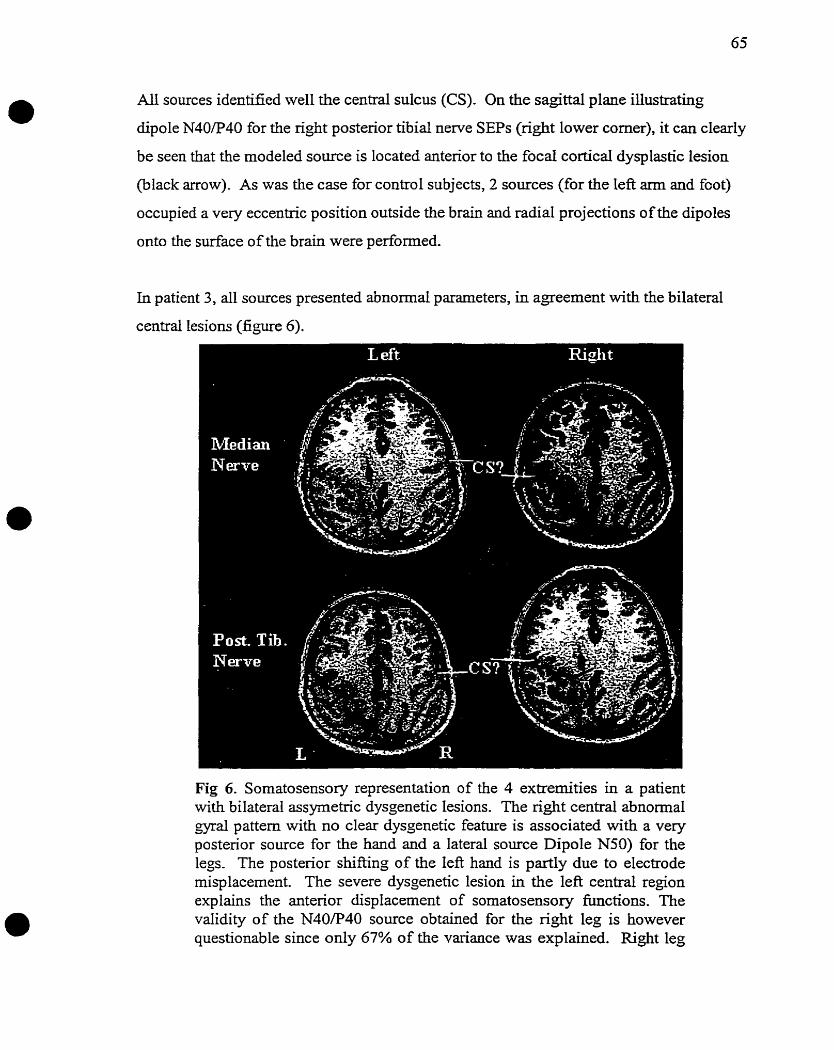
Al1 sources identi5ed well the central sulcus (CS). On the sagittal plane illustrating
dipole N40/P40 for the nght postenor tibial nerve SEPS (nght lower corner), it can clearly
be seen that the modeled source is located anterior to the focal cortical dysplastic lesion
(black arrow). As was the case for control subjects, 2 sources (for the left ann and fcot)
occupied a very eccentric position outside the brain and radial projections of the dipoles
onto the surface of the brain were performed.
In patient 3, al1 sources presented abnomal parameters, in agreement with the bilateral
central lesions (figure 6).
Fig 6. Somatosensory representation of the 4 extremiies in a patient with bilateral assyrnetric dysgenetic lesions. The right central abnormal
pattern with no clear dysgenetic feature is associated with a very posterior source for the hand and a lateral source Dipole N50) for the legs. The posterior shifting of the Ieft hand is partly due to electrode misplacement. The severe dysgenetic lesion in the left central region explains the anterior displacement of somatosensory functions. The validity of the N40/P40 source obtained for the right leg is however questionable since only 67% of the variance was explained. Right leg
SEPs were raîher characterized by a low amplitude, possibly due to the proximity of the dysgenetic lesion-
Modeled sources presented a very diEerent pattern in the two hemispheres, which
correlated with the asymmetnc lesions (figure 6). In the right hemisphere, the tangentid
source modeling the N2OE20 became active around 20 ms and followed a normal
temporal evolution. However, dipole N20/P20 was located in the parietal lobe, 2.4 cm
fiom what appeared to be the central sulcus. The orientation of dipole N20/P20 formed a
79 O angle with the central sulcus, but it also formed a 78" angle with anterior wall of the
abnormal gyms on which it was located. The posterior localization of dipole N20/P20
following stimulation of the lei? median nerve is surprising, considering the parieto-
occipital abnormalities. Closer investigation showed that electrodes F8, T4, T6, F4 and
FC4 were systematically located posterior to their counterpart in the left hemisphere, at an
average distance of 1 1 mm. Since these electrode positions were registered one after the
other, it is most probable that the patient moved backwards with respect to the reference
Eame during registration of these electrodes and went back to his original position after.
Since electrode misplacernent was probably approximately 1 cm in the posterior direction,
this error does not completely explain why dipole N20/P20 was located a 24 mm posterior
to the central sulcus. Therefore, the posterior location of dipole N20/P20 for stimulation
of the left arm is thus equivocally abnormal.
For right posterior tibia1 nerve SEPs, dipole N40/P40 was located 2.4 cm deep to the
cortical surface and anterior to the central sulcus (more precise measurement could not be
made due to the depth of the dipole), but al1 other dipole parameters were nomal. The
second source, which modeled the N50 and P60 potentials in addition to dipole N40/P40,
was abnormal. In control subjects, dipole N50 usually occupies a central, parasagittal
location and, although the orientation is somewhat variable, it usually points anteriorly.
In patient 3, dipole N50 was of considerable importance in the 2-dipole mode1 as both
dipoles had fairly equal weight. Dipole N50 was located close to dipole N20/P20, on
what appeared to be the post-central gyms. Dipole N50 pointed laterally, upwards and
slightly posteriorly, and explained an isolated positivity maximally recorded at C4 around
49 ms post-stimulus. On a horizontal plane, the orientation of dipole N50 was almost
perpendicular to the orientation of the post-central gyrus.
For the lep henkphere, dipole N20P20 was located deep in the fiontal lobe and pointed
anteriorly and laterally to generate the large positivity maximally recorded at F3 and a
small negativity maxirnally recorded at CPz-CP2 at 22 ms. Dipole N20ff20, was located
slightly anterior to the dysgenetic lesion. For rÏght posterior tibial SEPs, 2-dipole rnodels
could explain only 67% of the variance in the data due to the srnail amplitude of the
potentials (generators model noise as well). This small field is not surprising considering
the large structural abnormality found in the left parasagittal central region. Although the
2-dipole model offers a poor explanation of the data due to the small signal-to noise ratio,
dipole N40P40 could be mapped onto MRI and was found anterior to the large
invagination, as was the case for dipole N20/P20 on the same side. These findings
suggest that somatosensory representation of the right hand and foot were displaced
anteriorly due to the central dysgenetic lesion.
In patient 2, abnormal dipole parameters were found for the left median nerve and nght
posterior tibia1 nerve SEPs. For lefl median nerve, dipole N20P20 was located 1 cm
posterior to the central sulcus, more than 2 SD fiom the average distance found in control
subjects. However, dipole N20/P20 was still located on the post-central gyms. For nght
posterior tibial nerve SEPs, dipole N40/P40 was located 1.6 cm parasagittally and 2.5 cm
deep to the cortical surface in the lefi hemisphere. Since all other dipole parameters were
normal and the latency, amplitude and CSD maps of SEPs presented no abnormalities, the
significance of these fuidings is difficult to assess. The apparent lack of correlation
between the presence of dysgenetic cortex in the hand region of the right post-central
g p s and normal SEPs could be explained by the location of the modeled source outside
the area of polymicrogyria visible on MRI (figure 3).
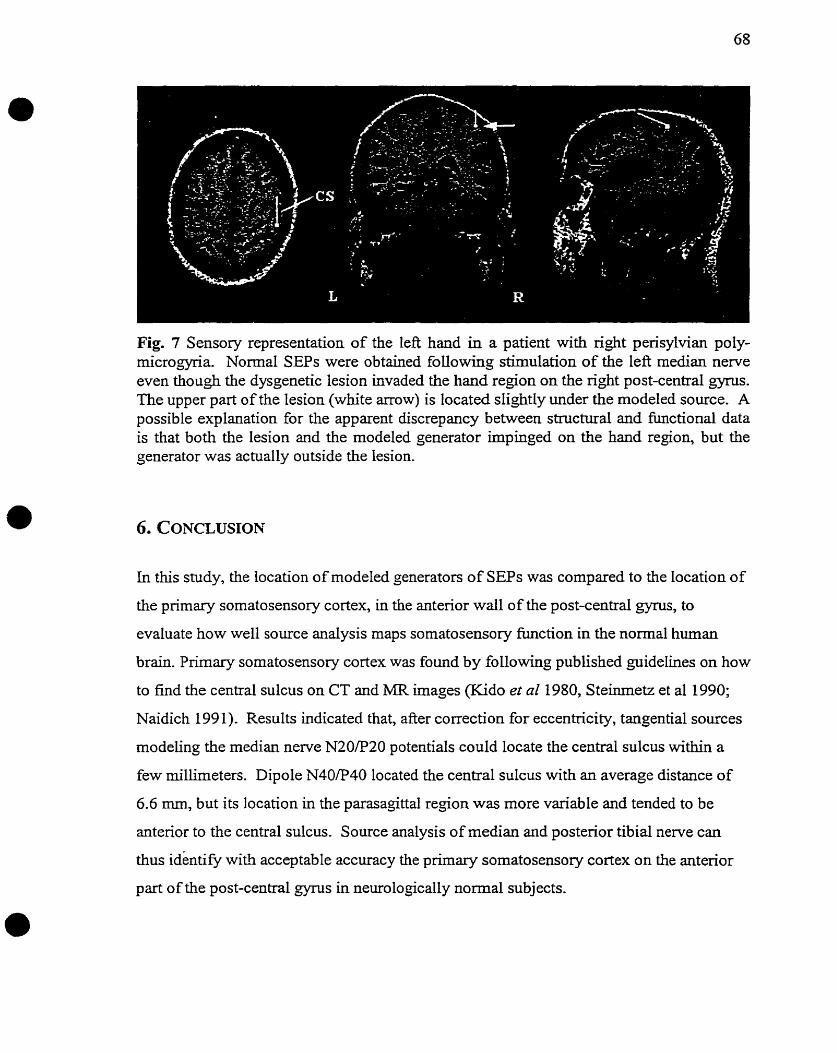
Fig. 7 Sensory representation of the left hand in a patient with right perisylvian poly- rnicrogyria. Normal SEPs were obtained following stimulation of the left rnedian nerve even though the dysgenetic lesion invaded the hand region on the nght post-central gyrus. The upper part of the lesion (white arrow) is located slightly under the modeied source. A possible explanation for the apparent discrepancy between structural and fûnctional data is that both the lesion and the modeled generator impinged on the hand region, but the generator was actually outside the lesion.
In this study, the location of modeled generators of SEPs was compared to the location of
the primary sornatosensory cortex, in the anterior wall of the post-central gyrus, to
evaluate how well source analysis maps somatosensory function in the normal human
brain. Prirnary somatosensory cortex was fomd by following published guidelines on how
to fïnd the central sulcus on CT and MR images (Kido et al 2980, Steinmetz et al 1990;
Naidich 199 1). Results indicated that, after correction for eccentricity, tangential sources
rnodeling the median nerve N20/P20 potentials could locate the centrai sulcus withul a
few millimeters. Dipole N40/P40 located the central sulcus with an average distance of
6.6 mm, but its location in the parasagittal region was more variable and tended to be
anterior to the central sulcus. Source analysis of rnedian and posterior tibia1 nerve can
thus i d e n t i ~ wih acceptable accuracy the primary somatosensory cortex on the anterior
part of the post-central gyms in neurologically normal subjects.
Other dipole parameters were analyzed to understand the charactenstics of the generators
of median and especially posterior tibia1 nerve SEPs. The acceptable varïability in dipole
parameters was documented in 10 neurologically normal individuals and clear patterns
ernerged. Dipole N20P20 pointed anteriorly and towards the midline, forming an average
angle of 75' (SD=lOO) with the post-central gyrus. Dipole N40P40 was somewhat more
variable in orientation, but it predominantly pointed towards the longitudinal fissure and
posteriorly with an orientation ranging fiom tangential to radial.
The study on control subjects also ailows the investigation of more theoretical questions.
The N20P20 and P22 potentials of median nerve SEPs were well modeled by 1
subcortical dipole and 2 cortical sources. The number of sources used to model recorded
wavefoms is always subject to discussion, but the 3-dipole model was supported by
previous research (Franssen et al. 1992; Buchner et al. 1994, 1995) and confirmed with
Principle Component Analysis in many cases. Three-dipole models usually consisted of
a tangentid+ radial parietal model and therefore approximated the tangential + somatosensory radial model proposed by AUison (Allison et al. 1980,1989). The radial
dipole, dipole P22, was usually located posterior to the post-central g p s in order to
model the transition between the two well defïned dipolar fields N20/P20 and N25/P25.
The poor fit obtained at electrodes FC3EC4 may suggest that the P22 potential was not
well modeled by dipole P22. However, a better definition of P22 based on a slightly
longer cortical interval was precluded by the be,-g of the N25P25 potentials.
Models were also biased towards one tangential rather than two radial dipoles to model
the N20/P20 because the high concentration of electrodes in the central region and the
lack of low electrodes favors the detection of tangential rather than radial dipoles.
Centrally located radial dipoles are best defined by low electrodes and electrodes at the
vertex. Tangentid dipoles are well defbed by a large array of electrodes on the top of the
head, which was the chosen montage in this study. Moreover, the beginning of cortical
intervals was defined by the apparition of the N20P20 potentials, excluding the isolated
fiontal positivity P20 seen in the previous time sample. The asynchronous apparition of
the N20 and P20 potentials speaks against a tangential dipolar model.
The experirnental paradigm used to model early cortical median nerve SEPs was similar
to protocols already pubrished (Buchner et al. 1995) wiîh the exception of the method used
to delineate the epoch containing the early cortical SEPs. However, the definition of the
epoch of interest is crucial since successive dipolar fields c m present slightly different
orientations md/or locations, which will result in interaction of the dipoles. For median
nerve SEPs, the orientation of instantaneous dipoles N20P20 and N25/P25 was
sometirnes separated by a large angle. A cortical interval which would include N25/P25
as well as N20P20 would contain 3 generators (with the radial dipole) very dose in space
and Likely to interact upon fitting the sources. Afthough delineation of intervals with
Global Field Power (GFP) is a more objective way of defining epochs of interest, GFP
cannot isolate desired generators when multiple sources are active very close in time.
Postenor tibial nerve SEPs can also be modeled by simple dipolar models, but 2 dipoles,
instead of 3, are generally sufficient to explain the data sets. Two-dipole models are
associated with a low residual variance in the cortical interval (6% on average).
Moreover, a horizontal or oblique dipole pointing towards the hemisphere ipsilateral to
stimulation makes physiological sense in view of the representation of the foot almg the
longitudinal fissure (Penfield and Boldrey 1937). The presence of a unique dipole to
model the N40/P40 potentials and additional dipole(s) at later latencies corroborates MEG
findings (Huttunen et al. 1987). It is difficult to evaluate the possibility of two radial
dipoles instead of a single tangntial dipole for the same reasons as was described for
median nerve SEPs. Even though variabiiity in the distributions of postenor tibial nerve
SEPs was reported in the literature (Emerson,1988), parameters describing dipole
N40P40 were quite stable across subjects.
The digitization of electrodes in MRI space provided a lïnk between functional data and
. the anatomical substrate and allowed direct comparisons. It has not been tested whether
digitization of electrodes greatly improves the localization of the generators inside the
spherical head model compared to the use of standard electrode coordinates, but the

representation of dipoles onto individual MEUS is surely superior to extrapolations nom
anatomical landmarks. Of course, registration of electrodes must be properly done as
mislocations will affect the position of the modeled sources.
Representation of dipoles in MRI space also allows for the cornparison of dipole
orientation with gyral patterns. In this study, cornparisons were made between the
orientation of dipole N20/P20 and the presumed generator of the N2Q/P20 potentials,
Brodmann's area 3b. The average angle of 75" (SD=lOO) separating dipole onentation
and the cIosest segment of the central sulcus is a good approximation of the 90" angle
expected on theoretical grounds. This idea could be explored M e r . Since orientation is
more accurately assessed than location in source analysis, onentation could contribute to
the mapping and solutions could be constrained to be normal to the cortical surface in the
context of realistic head models. A criterion of normality added to an automated search
for dipole location inside a realistically shaped head mode1 could significantly improve
source localization.
Dipole orientation c m also provide important information about the generators of SEPs.
Generators for posterior tibial nerves have not been well studied. The orientation of
dipole N40P40 is usually tangential, posterior, slightly upwards and approximately
parallel to the central sulcus, although radial dipoles are also observed. A radial dipole
could be due to a generator Iocated on the crest of paracentral lobule rather than in the
longitudinal fissure. The postenor and midline orientation of the tanpential dipole camot
be explained as easily. In hemispheres in which the central sulcus does not open up onto
the longitudinal fissure, it can be hypothesized that the geoerator is located at the most
medial end of the central sulcus. The fibers generating the SEPs would thus course dong
the central sulcus and generate the observed field. However, this small notch at the end of
the central sulcus is not present in cases in which the central sulcus opens up ont0 the
longitudinal fissure. This study did not compare the presence of the notch with the
orientation of dipole N40P40, but m e r investigation could address this issue.
The major pitfall of the study is the large eccenûicity of dipole N20@20, and occasionally
N40R40, in an important number of subjects. Although the same problem was observed
in patients and cornparisons were therefore possible, it is impossible to predict how the
error in the depth of the dipole affects the other spatial coordinates and the orientation of
the dipole. It was observed that a srnall energy criterion can sometirnes solve this
problem, although the mechanism for this effect is unclear. However, the use of variance,
energy or separation criteria represents considerable input fiom the investigator and c m
introduce biases in the solutions. In this study, a very systematic fitting strategy was used
to try to minimize biases. Variance, energy and separation were not used in this study and
fitting depended strictly on the reduction of residual variance. The problem of dipole
eccentricity will be M e r investigated to detennine i fa change in head mode1 will
reduce dipole eccentricity.
To conclude, the study on control subjects demonstrated that, when shortcomings such as
modeling errors in the depth of the dipoles are corrected for, source analysis of median
and posterior tibia1 nerve identifies, as expected, the primary somatosensory cortex on the
anterior part of the post-central gyrus. Since rnodelization of SEPs cm identiQ
somatosensory cortex in normal brains, it follows that it can also identiq somatosensory
function in abnomal brains, in which the post-central gyrus is sornetimes difficult to
identifjr (patient 3). The study on patients with dysgenetic lesions aimed at ascertaining
the representation of the normal sornatosensory functions observed in these patients. It is
of interest to determine whether normal sensory funciion is sustained by the dysgenetic
cortex, by surrounding nomal cortex of by subcortical systems.
Models obtained in the patients group were associated with a residual variance
comparable to that found in control subjects. Models made physiological sense as, in al1
cases, dipole N20/P20 showed an orientation approximately nomal to the post-central
gyms or the gyms on which dipole N20P20 was located. The oniy exception was the
generator of nght hand SEPs in one subject which was displaced to the centnun ovale of
the fiontal lobe by a large left centrd alolding and was thus f a fkom gyral/suIcaI
patterns.
Models were mapped in MRI space and compared to the Location of the lesion and the
central sulcus, when such an anatomical Iandrnark was identifiable. Ln patients 1 and 2,
modeled generators represented al1 somatosensory fünctions in close proximity to the
central sulcus and outside dysgenetic lesions. Ln patient 3, the postenor displacement of
the left hand representation was probably partly attributable to electrode misplacement,
and partly due to an atypical mapping of function. The left leg was represented in the
same area but slightly anterior to the left arm representation (on the post-central gyrus), in
addition to the usual right central, parasagittal position. The reason for these shifts in
position is not clear, as the whole region presents ,VI abnormalities, without clear
dysgenetic features. The somatosensory representation of the right hand was displaced to
the non-lesionai fiontal lobe, due to the presence of a severe left central dysgenetic lesion.
In sumrnary, al1 SEP generators for which adequate models could be obtained were
located outside dysgenetic cortex, with the possible exception of the representation of the
left hand of patient 3 in parieto-occipital polymicrogyria.
Abnormal potentials recorded outside dysgenetic cortex can be attributed to more
widespread dysgenesis invisible on MRI. Rowever, the distribution of SEPs is also
f ict ion of _=al anatomy and it is quite possible that the generators of displaced
potentials present a different anatomical configuration, resulting in different fields.
In patient 3, the amplitude of SEPs obtained following stimulation of the right leg was so
small that modeled generators could only account for 67% of the variance in the data,
because the mode1 was explaining noise. An absence of potentials or srna11 amplitude
potentials were aIso observed in previous studies (de Rijk-van Andel et al. 1992; Di Capua
et al. 1993; Vossler et al. 1992; Raymond et al. 1997). It is possible that the lack of early
cortical potentials observed for right leg SEPs in patient 3 resulted from the activity of
poorly aligned pyramidal cells located in the dysgenetic lesion. Pyramidal cells are the
presumed generators of evoked potentials and the electrical field produced by these cells
is a fùnction of their alignment and the synchronicity of the signal. It is quite unliicely that
a 32 electrode coverage of the head would have "missed" a displaced potential of normal
amplitude. The modeled generator which explained oniy 67% of the data was located
anterior to the central lesion, as was the case for dipole N20P20 on the sarne side. One
c m thus infer an anterior displacement of the sensory region, but the representation of the
leg may border on the dysgenetic lesion, resulting in smaller potentials.
To conclude, it is quite feasible to apply the experimental paradigm designed for control
subjects to the study of patients wiîh dysgenetic lesions. As was seen, the uiterpretation
of SEPs or modeled generators is often hùidered by the lack of fundamental research in
this area. The fact that only the very early potentials were mapped also Limits the
interpretation, as later potentials (eg. in the 30-45 ms range for median nerve SEPs) could
well be representative of the localization of somatosensory functions. In addition, one c m
foresee problems with electrode digitkation in the context of non-cooperative patients.
Digitization of electrodes could be improved by comparing electrode positions to a
chosen reference point on the head, so that if the patient moved, the reference frame
would consequently rnove. Finally, it is quite possible that fields observed in cases of
severe dysgenetic abnomalities will not adopt a dipolar configuration, rendering dipole
source analysis an inadequate modeling tool.
Further investigation with a Iarger number of subjects should identi* how different types
of cortical dysgenesis affect SEPs. The effect of different head models and of different
modeling procedures on the eccentricity of the source should be carefiilly investigated.
An automated search for sources with an orientation normal to the cortex in realistically
shaped head mode1 could result in significantly improved Iocalization of function.
Abbnizzesse, G., Dall'Agata, D., Morena, M., Reni, L., Favale, E. Abnomalities of
Parietal and PreroIandic Somatosensory Evoked Potentials in Huntington's Disease.
Electroenceph cIin Neurophysiol, 1990, 77: 340-346.
Allison, T., Goff, W.R., Williamson, P.D-, Van Gilder, J-C. On the Neural Origin of Early
Components of the Huma. Somatosensory Evoked Potential. In: Chical Uses of
Cerebral, Brainstem and Spinal Samatosensur y Evoked Potentials. Progress in Clinical
NeuuophysioZo~y. Edited by JE Desmedt. Basel, Karger, 1980: 5 1-68.
Allison, T., Wood, C.C., Goff, W.R. Brain Stem Auditory, Pattern-Reversai Visual, and
Short-Latency Somatosensory Evoked Potentials: Latencies in Relation to Age, Sex and
Brain and Body Size. Electroenceph ciin Neurophysiol, l983,55: 619-636.
Allison, T., McCarthy, G., Wood, CC., Darcey, T.M., Spencer, D.D., Williamson, PD.
Human Cortical Potentials Evoked by Stimulation of the Median Nerve. 1.
Cytoarchitectonic Areas Generating S hort-Latency Activity . J Neurop hysiol, 2 989,62:
694-710.
Aminoff, ML, Eisen, A., Somatosensory Evoked Potentials. In EZectrodiagnosis in
Chical Neurology. Edited by M.J. Amino& New York: Churchill Livingstone, 1996:
571-603.
Barkovich, A.J., Guerrini, R., Battaglia, G., Kalifa, G., NGuyen, T., Panneggiani, A.,
Santucci, M., Giovanardi-Rossi, P., Granata, T., D'Incerti, L. Band Heterotopia:
Correlation of Outcome with Magnetic Resonance Irnaging Parameters. Annals of
Neurology, 1994,36: 609-617.
Baumgartner, C., DoppeIbauer, A., Sutherling, W.W., Lindinger, G., Levesque, M.F.,
AuU, S., Zeitlhofer, J., Deecke, L. Somatotopy of Human Hand Somatosensory Cortex as
Studied in Scalp EEG. Electroenceph clin Neurophysiol, 1993, 88: 271-279.
Brazier, M.A.B. A study of the electrical field at the surface of the head. Electroenceph
clin Neurophysiol, 1949,2(Suppf): 3 8-52.
Brenner, D., Lipton, J., Kauhan, L., Williamson, S.J. Somatically evoked magnetic
fields of the human brain. Science, 1978, 199: 81-83.
Broughton, R., Discussion. In: Average Evoked Potentials: Methods. Results, and
Evalirations. Edited by E Donchin, DB Lindsley. Washington: National Aeronautics and
Space Administration, 1969: 79-84.
Broughton, R.J. Somatosensory Evoked Potentials in Man: Cortical and Scalp
Recordings. McGill University, Montreal, Quebec, 1967.
Buchner, H., Adams, L., Knepper, A., Ruger, R., Laborde, G., Gilsbach, J.M., Ludwig, I.,
Reul, J., Scherg, M. Preoperative localization of the central sulcus by dipole source
analysis of early somatosensory evoked potentids and three-dimensional magnetic
resonance irnaging. J Neuroswg, 1994,80: 849-856.
Buchner, H., Adams, L., Muller, A., Ludwig, L, Knepper, A., Thron, A., Niemann, K.,
Scherg, M. Somatotopy of Human Hand Somatosensory Cortex Revealed by Dipole
Source Analysis of Early Somatosensory Evoked Potentials and 3D-NMR Tomography.
Electroenceph clin Neurophysiol, 1995,96: 12 1-1 34.
Carpenter, M.B. Core Text of Neuroanatomy. Baltimore: Williams and Wilkins, 199 1 :
268.
Chiappa, K.H., S hort-Latency Somatosensory Evoked Po tentials : Methodology. In:
Evoked Potentiak in Chical Medicine. Edited by KH Chiappa. New York: Raven Press
Ltd, 1989: 307-371.
Chu, N. Somatosensory Evoked Potentials: Correlations with Height. Electroenceph clin
Neurophysiol, 1986,65: 276.
Cohen, L.G., Starr, A. Locaiization, Timing and Specificity of Gating of Somatosensory
Evoked Potentials during Active Movement in Man. Brain, l987,llO: 45 1-467.
Cohen, M.S., Bookheimer, S.Y. Localization of Brain Function Using Magnetic
Resonance Imaging. Trends in Neurosciences, 2994, 2 7: 268-277.
Cuffin, B.N., Cohen, D., Yunokuchi, K.e. Tests of EEG Localization Accuracy Using
Implanted Sources in the Human Brain. A m Neurol, 199 1,29: 132-1 38.
Dawson, G.D. Cerebral Responses to Nerve Stimulation in Man. Brain Medical Bulletin,
1950,6: 326.
de Rijk-van Andel, J.F., Arts, W.F.M., de Weerd, A.W. EEG and Evoked Potentials in a
Series of 2 1 Patients with Lissencephaly Type 1. Neuropediatrics, 1992,23: 4-9.
Deiber, M.P., Giard, M.H., Mauguiere, F. Separate Generators with Distinct Orientations
for N20 and P22 Somatosensory Evoked Potentials to Finger Stimulation? Electroenceph
clin Neurophysiol, 1986,65: 321-334.
Delestre, F., Longchampt, P., Dubas, F. Neural Generator of Pl4 Far-Field
Somatosensory Evoked Potentialstudied in a Patient with Pontine Lesion. Electroenceph
clin Neurophysiol, l986,65: 227-230.

Desmedt, LE., Nguyen, T.H., Bourguet, M. Bit-Mapped Color Imaging of Human Evoked
Potentials with Reference to the N20, P22, P27 and N30 Somatosensory Responses.
Electroenceph clin Neurophysiol, l987,68: 1-1 9.
Desmedt, J.E., Cheron, G. Central Somatosensory Conduction in Man: Neural
Generators and hterpeak Latencies of the Far-Field Components Recorded fiom Neck
and Right or Left Scaip and Earlobes. Electroenceph clin Neurophysiol, 1980% 50: 382-
403.
Desmedt, J.E., Cheron, G. Somatosensory Evoked Potentids to Finger Stimulation in
Healthy Octogenarians and in Young Adults: Wave Forms, Scalp Topography and
Transit Times of Parietal and Frontal Components. Electroenceph clin Neurophysiol,
1980b, 50: 404-425.
Desmedt, J.E., Cheron, G. Non-Cephalic Reference Recording of Early Somatosensory
Potentials to Finger Stimulation in Adult or Aging Normal Man. Differentiation of
Widespread N18 and Contralateral N20 f?om the Prerolandic P22 and N30 Components.
EIectroenceph clin Neurophysiol, 198 1,52: 553-570.
Di Capua, M., Vigevano, F., Wisniewski, K. Somatosensory Evoked Potentials in
Hemimegalencephaly and Lissencephaly: Anatomo-Functional Correlations. Brain and
Development, 1993, 15: 253-257.
Emerson, R.G. Anatomic and Physiologie Bases of Posterior Tibia1 Nerve Somatosensory
Evoked Potentials. Neurologie Clinics, l988,6: 735-749.
Fox, P.T., Burton, H., Raichle, M.E. Mapping Human Somatosensory Cortex with
Positron Emission Tomography. Journal of Neurosurgery, 1987,67: 34-43.
Franssen, H., Stegeman, D.F., Moleman, J., Schoobaar, R.P. Dipole Modeling of Median
Nerve SEPs in Normal Subjects and Patients with Srnall Subcortical Marcts.
Electroenceph clin Neurophysiol, 1992, 84: 40 1-41 7.
Freeman, W.J. Mass Action of the Newous System. New York: Academic Press, 1975.
Green, J.B., Walcoff, M., Lucke, J.F. Phenytoin Prolongs Far-Field Somatosensory and
Auditory Evoked Potential Interpeak Latencies. Neurology, 1982a: 85-88.
Green, J.B., Walcoff, M., Lucke, J.F. Cornparison of Phenytoin and Phenobarbital Effects
on Far-Field Auditory and Somatosensory Evoked Potential Interpeak Latencies.
Epilepsia, l982b: 41 7-42 1.
Halonen, J.P., Jones, S., Shawkat, F. Contribution of Cutaneous and Muscle Afferent
Fibres to Cortical SEPs Following Median and Radial Nerve Stimulation in Man.
Electroenceph clin Neurophysiol, 2988,71: 33 1.
Hammeke, T.A., Yetkin, F.Z., Wade, M.M., Moms, G.L., Haughton, V.M., Rao, SM.,
Binder, J.R. Functional Magnetic Resonance Imaa$ng of Somatosensory Stimulation.
Neurosurgery, 2 994,3 5 : 677-68 1.
He, B ., Musha, T. Effects of Cavities on EEG Dipole Localization and their Relations
with Surface Electrode Positions. Int J Biomed Comput, 1989,24: 269-282.
Helmholtz, G. über einige Gesetze der Verteilung elektnscher Strome in korperlichen
Leitem, mit Anwendung auf die thierischelektrische Versuche. Ann Phys Chem, 1853 :
Hume, A.L., Cant, B.R., Shaw, N.A. Central Somatosensory CT in Cornatose Patients.
Annals of Neurology, 1979,5: 379-84.

Hume, A.L., Cant, B.R., Shaw, N.A., Cowan, J-C. Central Somatosensory Conduction
Time fiom 10 to 79 Years. Electroenceph clin Neurophysiol, 1982,54: 49-54.
Hume, A.L., Cant, B.R. Conduction Time in Central Somatosensory Pathways in Man.
Electroenceph clin Neurophysiol, 1978,45: 361-375.
Huttunen, J., Kaukoranta, E., Hari, R. Cerebral magnetic responses to stimulation of tibial
and sural nerves. J Neurol Sci, 1987,79: 43-54.
Kakigi, R. The Effect of Aging on Somatosensory Evoked Potentials Following
Stimulation of the Posterior Tibial Nerve in Man. Electroenceph clin Neurophysiol, 1987,
15: 277-286.
Kakigi, R., Shibasaki, H. Scalp topography of the short latency somatosensory evoked
potentials following posterior tibial nerve stimulation in man. Electroenceph clin
Neurophysiol, 1983, 56: 430-437.
Kakigi, R., Shibasaki, H. Effects of Age, Gender and Stimulus Side on Scalp Topography
of Somatosensory Evoked Potentials Following Median Nerve Stimulation. Journal of
Clinical Neurophysiology, 199 1, 8: 320-330.
Kakigi, R., Shibasaki, H. Effects of Age, Gender, and Stimulus Side on the Scalp
Topography of Somatosensory Evoked Potentials Following Postenor Tibial Nerve
Stimulation. Journal of Clinical Neurophysiology, l992,g: 43 1-440.
Kawamura, T., Nakasato, N., Seki K., Shimizu, H., Fujiwara, S., Yoshimoto, T. Locating
the Central Sulcus using Three Dimensional Image Fusion S ystem of Helmet Shaped
Whole Head MEG and MRI (Japanese). No Shinkei Geka - Neurological Surgery, 1994,
Kawamura, T., Nakasato, N., Seki K., Kanno, A., Fujita, S., Fujiwara, S., Yoshimoto, T.
1996, Neuromagnetic evidence of pre-and post-central cortical sources of somatosensoq
evoked responses. Electroenceph clin Neurophysiol, 100: 44-50.
Kido, D.K., Le May, M., Levinson, A. W., B enson, W.E. Computed tomographie
localizaîion of the precentral gyrus. Radiology, 1980, 135: 373-377.
Kimura, J., Mitsudorne, A., Beck, D.O., Yamada, T., Dickins, Q.S. Field Distribution of
Antidrornically Activated Digital Nerve Potentials: Mode1 for Far-Field Recording.
Neurol0~7, t 983, 33: 1 164-1 169.
Kimura., J., Mitsudome, A., Yamada, T., Dickins, Q.S. Stationary Peaks fkom a Moving
Source in Far-Field Recording. Electroenceph clin Neurophysiol, 1 984,S8 : 3 5 1 -3 6 1.
Kitamura, K., Kamio, Y., Futamata, H., Hashimoto, T. Tibial Nerve Somatosensory
Evoked Potentials: Studies on Latency Variability as a Function of Subject Height and
Age. Rïnsho Byori - Japanese Journal of Clinical Pathology, 1995,43: 81-86.
Kuzniecky, R., Cascino, G.D., Palmini, A. Structural irnaging. In: Surgical treatment of
the epilepsies. Edited by JJ Engel. New York: Raven Press, 1993: 197-100.
Landau, W.M., Evoked Potentials- In: The Neurosciences - A Study Program. Edited b y
GC Quarton, T Melnechuk, FO Schmitt. New York: Rockefeller University Press, 1 967.
Lastimosa, A.C.B., Bass, N.H., Stanback, K., Norvell, E.E. Lumbar Spinal Cord and
Early Cortical Evoked Potentials After Tibial Nerve Stimulation: Effects of Stature on
Normative Data. Electroenceph clin Neurophysiol, 1982, 54: 499-507.
Mauguiere, F., Desmedt, J.E., Coujon, J. Astereognosis and Dissociated Loss of Frontal
or Parietal Components of Somatosensory Evoked PotentÏaIs in Hemisphenc Lesions.
Brain, 1983, 106: 271-3 1 1.
Mauguiere, F., Ibanez, V. Loss of Parietal and Frontal Somatosensory Evoked Potentials
in Hemispheric Deaftèrentation. In: Nao Trends and Advanced Techniques in Chical
NettrophysioI0g-y. Edited by PM Rossini, F Mauguiere. Amsterdam: Elsevier, 1990: 274-
285.
Mervaala, E., Paakkonen, A., Partanen, J.V. The Wuence of Height, Age and Gender on
the Iriterpretation of Median Nerve SEPS. Electroenceph clin Neurophysiol, 1988, 71:
109-1 13.
Naidich, T.P. MR imaging of brain surface anatomy. Neuroradiology, 199 1,33(Suppl):
S95-S99.
Nogueira, M C , Bninko, E., Vandesteen, A., De Rood, M., Zegers de Beyl, D.
Differential Effects of Isoflurane on SEP recorded over Parietal and Frontal Scalp.
Neurology, 1989,39: 1210-2215.
Papakostopoulos, D., Crow, H.J. Direct Recording of the Somatosensory Evoked
Potentials fiom the CerebraI Cortex of Man and the Difference between Precentral and
Postcentral Potentials. In: Brainstem and Spinal Somatosensory Evoked Potentials.
Progress in Chical Neurophysio2og-y. Edited by JE Desmedt. Basel: Karger, 1980: 15-
26.
Penfield, W., Boldrey, E. Somatic Motor and Sensory Representation in the Cerebral
Cortex of Man as Studied by Electrical Stimulation. Br&, 1937, 60: 389-443.
Raymond, A.A., Jones, S.J., Fish, D.R., Stewart, J., Stevens, J.M. Somatosensory evoked
potentials in adults with cortical dysgenesis and epilepsy. Electroenceph clin
Neurophysiol, 1997, 104: 132-142.
Romani, A., Bergarnaschi, R., Versino, M., Delnevo, L., Callieco, R,, Cosi, V. Spinal and
Cortical Potentials Evoked by Tibia1 Nerve Stimulation in Humans: Effects of Sex, Age
and Height. Bolletîino - Societa Italiana Biologia Sperimentale, l992,68: 69 1-698.
Scherg, M. Fundamentals of Dipole Source Potential Analysis. In: Auditov Evoked
Magnetic Fields and Elech-ic Poten tials. Edited by F Grandori, M Hoke, GL Romani.
Basel, Karger, 1990: 40-69.
Scherg, M., Ebersole, J.S. Models of Brain Sources. Brain Topogr, 1993, 5 : 41 9-423.
Scherg, M., von Cramon, D. Two Bilateral Sources of the Late AEP as Identified by a
Spatio-Temporal Dipole Model. Electroenceph clin Neurophysiol, 1985,62: 32-44.
Scherg, M., von Cramon, D. Evoked Dipole Source Potentials of the Human Auditory
Cortex. Electroenceph clin Neurophysiol, 1986, 65: 344-360.
Seyal, M., Emerson, R.G., Pedley, T.A. Spinal and early scalp-recorded components of
the somatosensory evoked potential following stimulation of the postenor tibia1 nerve.
Electroenceph clin Neurophysiol, l983,55: 320-330.
Smith, D.B., Sidman, RB., Henke, J.S., Flanigin, H., Labiner, D., Evans, C.N. Scalp and
Depth Recordings of Induced Deep Cerebral Potentials. Electroenceph clin Neurophysiol,
1983,5: 145-150.
Snyder, A.Z. Dipole Source Localization in the Study of EP Generators: a Critique.
Electroenceph clin Neurophysiol, 199 2,80: 32 1-325.
S teinmetz, H., Furst, G., Freund, H. J. Variation of pensylvian and calcarine anatomic
landmarks within stereotaxic proportional coordinates. AJNR: Am J Neuroradio, 1990,
11: 1123-1 130
Vossler, D.G., W i b s , R.J., Pilcher, WH., Farwell, J.R. Epilepsy in Schizencephaly:
Abnormal Cortical Organization Studied by Somatosensory Evoked Potenhals. Epilepsia,
1992, 33 : 487-494.
Woolsey, C.N. Organization of Somatic Sensory and Motor Areas of the Cerebral Cortex.
In: Biological and Biochernical Bases ofBehavior. Edited by HF Harlow, CN Woolsey.
Wisconsin: University of Wilconsin Press, 19%: 63-8 1.
Yamada, T., Matsubara, M., Shiraishi, G., Yeh, M., Kawasaki, M. Topographie analyses
of somatosensory evoked potentials following stimulation of tibial, sural and lateral
femoral cutaneous nerves. Electroenceph clin Neurophysiol, 1996, 100: 33-43.
Yang, T.T., Gallen, C C , Schwartz, B.J., Bloom, F.E. Noninvasive Somatosensory
Homonculus Mapping in Humans by Using a Large-Array Biornagnetometer. National
Academy of Sciences of the United States of Pmerica, 1993, 90: 3098-3 102.
Zegeis de Beyl, D., Delberghe, X., Herbaut, A-G., Bruriko, E. The Sornatosensory Central
Conduction Tirne: Physiological Considerations and Normative Data. Electroenceph clin
Neurophysiol, 1988, 171: 17-26-
IMAGE EVALUATION TEST TARGET (QA-3)
APPLIED IMAGE, lnc 1653 East Main Street - -. - - Rochester. NY 14609 USA -- --= Phone: 71 6/482-0300 -- -- - - FX 71 W88-5989
O 1993. Applied Image. Inc., Al1 Rights Reserved