neutronic design and optimization of a porous-fuel, high
TRANSCRIPT

NEUTRONIC DESIGN AND OPTIMIZATION OF A POROUS-FUEL,
HIGH-TEMPERATURE, GAS-COOLED REACTOR FOR SPACE POWER AND PROPULSION APPLICATIONS
By
EDDY PEREZ CARDENTEY
A THESIS PRESENTED TO THE GRADUATE SCHOOL OF THE UNIVERSITY OF FLORIDA IN PARTIAL FULFILLMENT
OF THE REQUIREMENTS FOR THE DEGREE OF MASTER OF SCIENCE
UNIVERSITY OF FLORIDA
2005

Copyright 2005
by
Eddy Perez Cardentey

To my grandfather, Victor Cardentey Gonzalez, and the memory of my late grandmother, Amparo Rodriguez Chavez.

ACKNOWLEDGMENTS
I would like to thank Dr. Samim Anghaie, Prof. James Tulenko, and Dr. Pasquale
Sforza for serving on my supervisory committee. I express my sincere gratitude to Dr.
Samim Anghaie, who provided excellent tutoring as my committee chair and showed
constant patience and support. I acknowledge Reza Gouw for his invaluable cooperation
in determining fuel isotopic composition and density. I thank my family for their love,
support, and understanding; and my friends for always being here for me.
iv

TABLE OF CONTENTS page
ACKNOWLEDGMENTS ................................................................................................. iv
LIST OF TABLES............................................................................................................ vii
LIST OF FIGURES ......................................................................................................... viii
ABSTRACT.........................................................................................................................x
CHAPTER
1 INTRODUCTION ........................................................................................................1
Nuclear Space Reactors ................................................................................................1 Foam Fuel Space Nuclear Reactor ...............................................................................3 Objectives .....................................................................................................................4
2 METHODOLOGY .......................................................................................................5
Monte Carlo Method.....................................................................................................5 Monte Carlo N-Particle Code .......................................................................................7 Monte Carlo Burnup and Oak Ridge Isotope Generation Codes .................................9
3 REACTOR OPTIMIZATION....................................................................................10
Optimization of Physical Dimensions ........................................................................10 Uranium Density Optimization and Reactor Temperature Defects............................12 Optimum Reactor Solutions .......................................................................................17 Burnup Study ..............................................................................................................20 Control Drum Design and Rotation............................................................................24 Alternate Moderator Composition..............................................................................28
4 REACTOR SAFETY AND SHIELDING..................................................................33
Infinite Reflector Study ..............................................................................................34 Water Immersion Study..............................................................................................36 Operational Reactor Flux............................................................................................40 Reactor Shielding........................................................................................................42
5 SUMMARY AND CONCLUSIONS.........................................................................47
v

Summary of Results....................................................................................................47 Data Summary and Delivery as Maplets ....................................................................48 Future Work................................................................................................................50
APPENDIX
A INPUT FILE FOR MCNP..........................................................................................51
B INTERPOLATING ALGORITHM IN MAPLE........................................................54
LIST OF REFERENCES...................................................................................................55
BIOGRAPHICAL SKETCH .............................................................................................56
vi
LIST OF TABLES
Table page 3-1 Multiplication factor and temperature defects for the fuel, moderator and
reflector for reactor with 0.35 gU/cc density. ..........................................................14
3-2 Re-optimized core multiplication factor and temperature defects for the fuel, moderator and reflector for reactor with 0.35 gU/cc................................................16
4-1 Elemental composition of water-fuel mixture..........................................................36
4-2 Multiplication factor for the system surrounded by varying thicknesses of boron carbide foil, with a boron carbide plug in the central fuel element and in all fuel elements....................................................................................................................37
vii

LIST OF FIGURES
Figure page 1-1 Foam fuel space reactor..............................................................................................3
2-1 Absorption and scattering cross sections for yttrium hydride from ENDF-60 and ENDL-92 cross-section libraries. ...............................................................................8
3-1 Reactor optimization by varying the center-to-flat distance in the fuel lattice. .......11
3-2 Multiplication factor versus lattice radius for the 1.5 g/cc U density reactor. .........12
3-3 Multiplication factor versus Uranium density..........................................................13
3-4 Multiplication factor versus lattice radius for the 0.35 gU/cc reactor......................15
3-5 Reactivity worth of the reactor at operating temperature.........................................17
3-6 Multiplication factor versus Uranium density and lattice radius. ............................18
3-7 Optimized lattice radius for uranium densities between 0.1 gU/cm3 and 1.5 gU/cm3......................................................................................................................18
3-8 Optimized k-effective as a function of uranium density. .........................................19
3-9 Multiplication factor vs. burnup for 8-hr burn at 500 kW thermal power. ..............21
3-10 Core isotopic inventory for approach burn. .............................................................21
3-13 Control drums with variable boron carbide thickness..............................................24
3-14 Multiplication factor versus B4C sliver thickness. ...................................................25
3-15 Multiplication factor versus control drum rotation. .................................................26
3-16 Reactivity worth for control drum rotation. .............................................................27
3-17 Control drum rotation as a function of full power days. ..........................................27
3-18 Critical k-effective for a 140-day burn.....................................................................28
3-19 Absorption and scattering cross sections for YH2 and ZrH2. ...................................29
viii

3-20 Multiplication factor vs. lattice radius for various uranium densities......................30
3-21 Multiplication factor versus lattice radius and uranium density.. ............................30
3-22 Optimized k-effective vs. uranium density for both moderator types......................31
4-1 Convergence on k-effective for shutdown optimized system in an infinite reflector. ...................................................................................................................34
4-2 Neutron flux in the reactor with inner control plugs in all fuel elements, normalized to particle histories. ...............................................................................38
4-3 Neutron flux in the reactor with inner control plugs and shells in all fuel elements, normalized to particle histories. ...............................................................39
4-4 Thermal neutron flux in the reactor core from 0 to 0.625 eV ..................................41
4-5 Power peaking factors in the fuel. ............................................................................42
4-6 Normalized neutron flux in axial BeO reflector.......................................................43
4-7 Attenuation percent across the LiBH4 shield, ± standard error corresponding to one standard deviation..............................................................................................44
5-1 Data delivery maplet for the YH2 moderated reactor. .............................................49
ix

Abstract of Thesis Presented to the Graduate School
of the University of Florida in Partial Fulfillment of the Requirements for the Degree of Master of Science
NEUTRONIC DESIGN AND OPTIMIZATION OF A POROUS-FUEL, HIGH-TEMPERATURE, GAS-COOLED REACTOR FOR SPACE POWER AND
PROPULSION APPLICATIONS
By
Eddy Perez Cardentey
August 2005
Chair: Samim Anghaie Major Department: Nuclear and Radiological Engineering
Nuclear reactors are currently being considered for space power and propulsion
applications. The system we examined uses a porous fuel matrix as the thermal
interchange medium. Its intended use is in thermal propulsion systems, but it can also be
applied to electric propulsion systems, and as a source of auxiliary power. The reactor
would be used as a power source for interplanetary robotic or manned missions.
Our goal was to develop an optimized relation between fuel density and reactor
dimensions. We used the Monte Carlo N-Particle code version 5 (MCNP5) to analyze
the system at various points. We used a Maple algorithm to interpolate the data and
mathematically maximize it. We used the Monte Carlo Burnup code (MONTEBURNS)
to calculate burnup.
Results showed that the optimized system can easily be made critical. Extended
burns are possible by adding excess reactivity by increasing the uranium density in the
fuel matrix. However, the moderator shows a positive reactivity coefficient, causing the
x

hot core to have a higher k-effective than the cold core. Nonetheless, control drums were
engineered to shut down the reactor even in a hot core.
Safety and shielding were evaluated. We determined that a water-immersion
scenario would significantly increase reactivity, making the system supercritical. This
situation was mitigated by using of safety plugs and shells in all fuel elements during
launch. We used LiBH4 as a shielding material, and it was very effective for this
purpose. Additional attenuation was also observed in the BeO reflector surrounding the
reactor.
Overall, the studied design shows that a critical system can be assembled. Safety
and control were addressed and the system was shown to remain critical during operation
and subcritical in accident scenarios. The positive reactivity coefficient raises some
concern, however, warranting further study in this area.
xi

CHAPTER 1 INTRODUCTION
Space propulsion requirements for manned interplanetary missions in the near
future cannot be met with conventional methods. Chemical rockets have limited thrust
and maneuverability, and because of the limited energy stored in chemical bonds, most of
the mass in these systems is occupied by fuel. After using most of the fuel to escape
earth orbit, little is left to generate sufficient acceleration to reach other planets in a
reasonable amount of time to undergo a manned mission. Nuclear reactors are the only
power source capable of delivering the thrust and onboard power required for such
missions in a small, lightweight, affordable package.
One such reactor concept is under development in a partnership among Ultramet,
Sandia National Labs, and the University of Florida. A team of researchers from these
institutions are working under a joint National Aeronautics Space Administration
(NASA) Small Business Technology Transfer (STTR) project, funded through Marshall
Space Flight Center, to develop a new high-temperature tricarbide fuel matrix.
Nuclear Space Reactors
Nuclear reactors, such as those used for nuclear thermal propulsion, are quite
different from previous chemical propulsion methods. In a chemical rocket, fuel and
oxidizer are mixed in a combustion chamber, and expelled out from a nozzle; thus the
fuel and propellant are the same. Once the propellant is exhausted, the main power
source also vanishes. In addition, the very large quantities of propellant needed simply to
leave earth orbit add tremendous size and weight to the vehicle. In the case of a
1

2
nuclear-powered ship, the fuel stays in the reactor while the propellant passes through it,
picks up energy, and exits through the nozzle. A nuclear reactor can achieve much
higher temperatures than combustion chambers in conventional rockets. Combined with
the use of low-atomic-weight propellants (such as hydrogen), this results in more than
twice the specific impulse than that obtained through chemical means. As a result, a trip
to mars that would take 600 days with conventional rockets can be cut down to 200 days
[1]. In addition to being a more efficient way to generate thrust, when the propellant is
exhausted, the nuclear reactor can be used to generate electrical power for onboard
components.
Space nuclear power first came under study in the 1960s under President John F.
Kennedy. The cold war was raging and the race to the moon was well underway. A
variety of projects (such as the NRX and project Rover), were aimed at using nuclear
thermal propulsion to power a rocket through space. Other projects, such as the SNAP
series, were aimed at developing nuclear reactors to provide auxiliary power. The
program was such a success that a reactor was built and put in orbit (the SNAP-10A).
Although a fault in the electrical system caused it to shut down soon into the mission, its
twin system continued to operate on earth for a year, demonstrating the technical
capabilities of the system.
Project Rover and most of the space nuclear program were terminated in 1973, after
the moon landings left the space program with no immediate mission. More than 30
years elapsed before interest in interplanetary travel prompted new designs and
developments.

3
Foam Fuel Space Nuclear Reactor
The team from the University of Florida, Sandia, and Ultramet is developing a new
type of fuel for space propulsion applications. The fuel in this case is a high-temperature
tricarbide matrix composed of ZrC, NbC, and UC in an open-cell reticulated foam
element [2]. Unlike past designs, the coolant passes through the fuel in this case, rather
than around it. This makes a much larger surface area available for heat transfer [3].
Thus, the coolant can be brought to a higher temperature while minimizing the fuel
centerline temperature.
Figure 1-1. Foam fuel space reactor.
Figure 1-1 shows the overall layout of the reactor. The reactor is surrounded by
20 cm of BeO reflector radially and axially. The fuel has an inner radius of 0.5 cm, and
an outer radius of 2.5 cm; and the thickness of the axial coolant gap is 0.049 cm. None of
the other physical parameters are set, since they are the focus of the optimization
procedure.

4
In this concept, the coolant flows radially inward through the fuel, toward the
central coolant gap. Once there, it flows out of the reactor. Criticality is controlled by
rotating the control drums. The moderator material is ZrH2. We also explored YH2 as an
alternate moderator.
Objectives
Our goal was to simulate the behavior of multiple variations of the system shown in
Figure 1-1, and determine the optimum design parameters. The systems were modeled
on MCNP5. We used MONTEBURNS to calculate burnup. Our study focused mainly
on the following objectives.
• Optimized reactor dimensions: We determined the optimum dimensions for attaining maximum k-effective for varying uranium densities in the fuel, by mathematically maximizing functions obtained through interpolation algorithms derived from the data.
• Reactor burnup: We analyzed the system using MONTEBURNS to determine
isotopic composition through the burn, and to determine length of time at which the system could be run.
• Reactor safety: Various scenarios were explored, arising from an unsuccessful
launch. These scenarios made the system supercritical, and solutions were found to prevent catastrophe.

CHAPTER 2 METHODOLOGY
Our study focused on the neutronic evaluation of several variants of a critical
system. As such it made heavy use of deterministic and probabilistic neutron transport
methods. For this purpose, we decided to use existing codes that were proven to be
robust and reliable. The main code implemented was Monte Carlo N-Particle code
version 5 (MCNP5), developed by Los Alamos National Lab. It is a probabilistic neutron
transport code used to trace particle interactions. We used MCNP5 to obtain criticality,
as well as in conjunction with MONTEBURNS to model burnup. The latter is actually a
linker between MCNP5 and ORIGEN2, rather than an actual code, while MCNP5 is the
de facto Monte Carlo method code.
Monte Carlo Method
The Monte Carlo method is used to duplicate a statistical process in a theoretical
manner. It uses a random sampling technique to model a random process that has a
predefined probability distribution, such as the fission process, neutron scattering, and
absorption. This is achieved through the Fundamental Formulation of Monte Carlo,
whereby the probability density function is integrated as . d⌠⎮⎮ pdf = ⌡a
b
( )x β x 1
After integration, the resulting function is algebraically manipulated by inverting it
so the normalization constant, is solved for. The function is then
expressed in a form such that the dependent variable is sampled as a function of a random
number by first taking the indefinite integral . The resulting
5

6
equation is then solved for x0 as a function of the random number eta. This can be shown
with the process of randomly sampling the distance traveled before interaction by a
particle from the attenuation coefficient. In this case, the pdf is defined as
where Sigma is the attenuation coefficient. The function can then be normalized by
taking the integral and obtaining .
p( )
= ( )r e
Knowing that the limit in the denominator approaches zero, we know that β = Σ. Thus,
, , and where eta is a random
number between zero and one and x is the sampled flight distance. Since eta is a random
number, the sampled distance can be rewritten as x = -ln (η) / Σ.
−Σ r
= ⌡0
∞( )−Σ r
β r 1
= d⌠⌡⎮⎮
0
d⌠⎮⎮ e
x
e( )−Σ r
Σ r η − 1 e−
= ( )Σ x
η
This method can be used to simulate the interactions of particles with materials,
making it particularly useful to simulate problems too complex to be solved with
deterministic methods. To achieve this, the individual probabilistic events that make up a
process are simulated sequentially. Each event’s respective probability distribution is
used to randomly sample the outcome of events along the way. Particle histories are
created by following events particles undergo. By simulating a very large number of
histories, the statistical behavior of the system as a whole emerges. The uncertainty is the
decreased by increasing the number of histories.
The Monte Carlo method is used in nuclear engineering to obtain system
parameters such as multiplication factor, spatial flux and neutron lifetimes, but it is also
used in a variety of other fields. Nuclear medicine uses it to simulate radiation transport
in the human body, for imaging and therapy applications. Electrical engineers make wide
use of the Monte Carlo method for circuit analysis and semiconductor charge carrier
transport. In addition, civil, industrial and a variety of other engineering disciplines use it

7
to simulate problems in their respective fields. Monte Carlo has even been used by
economists to study and predict trends in the financial market. In fact, any problem that
can be described as an aggregate of probabilities from individual events can be simulated
through the use of the Monte Carlo method.
This work made use of the Nuclear Engineering application of the Monte Carlo
method. Namely, we used it to obtain the behavior of neutron flux and multiplication
factors and their variation as a function of variations in the material and geometric
properties of the system. We used MCNP5 for this purpose, since it is a very robust and
versatile implementation of the Monte Carlo method.
Monte Carlo N-Particle Code
The Monte Carlo N-Particle code (MCNP) was first released in 1977, emerging
from Monte Carlo method developments undertaken at Los Alamos National Laboratory
(LANL) during World War II. It has been under continuous development since then.
The latest releases are MCNP5, developed by the Diagnostics Applications group, and
MCNPX, developed by the Applied Physics Division [4]. All development work has
been done at LANL. While both codes can be used for any nuclear or radiological
application, MCNPX is geared towards high energy physics, while MCNP5 is geared
towards reactor analysis and health physics applications.
MCNP5 uses continuous-energy nuclear and atomic cross-section data libraries.
The primary sources are LANL’s Evaluated Nuclear Data File (ENDF), Lawrence
Livermore National Laboratory’s Evaluated Nuclear Data Library (ENDL), Advanced
Computational Technology Initiative (ACTI) and Evaluated Photon Data Library
(EPDL), among others. In addition, the user has the option to use his or her custom
libraries and cross section data. Nuclides are oftentimes furnished with more than one
8
available data library, primarily because data has originated from different sources. In
addition, some data is processed at different temperatures to provide proper Doppler
broadening. Input is fed into MCNP via an input file. Appendix A shows one of such
input files used in this study, illustrating the general structure of the input.
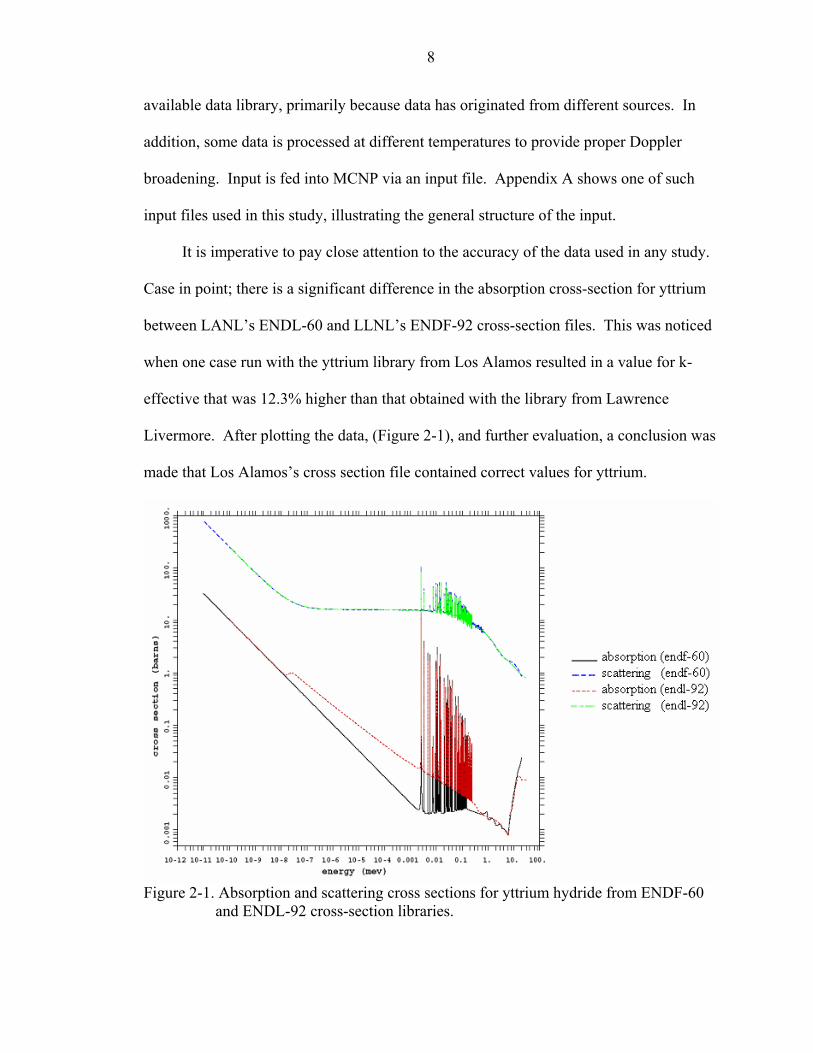
It is imperative to pay close attention to the accuracy of the data used in any study.
Case in point; there is a significant difference in the absorption cross-section for yttrium
between LANL’s ENDL-60 and LLNL’s ENDF-92 cross-section files. This was noticed
when one case run with the yttrium library from Los Alamos resulted in a value for k-
effective that was 12.3% higher than that obtained with the library from Lawrence
Livermore. After plotting the data, (Figure 2-1), and further evaluation, a conclusion was
made that Los Alamos’s cross section file contained correct values for yttrium.
Figure 2-1. Absorption and scattering cross sections for yttrium hydride from ENDF-60
and ENDL-92 cross-section libraries.

9
Fortunately, this error was caught early in the research, but regrettably, a large
amount of data originating from a series of rather lengthy batch runs was deemed invalid
and had to be discarded. This extended the length of time work was conducted and
postponed its termination. Had this research been part of time critical work for a mission,
the delay would have certainly been most detrimental.
Monte Carlo Burnup and Oak Ridge Isotope Generation Codes
The Oak Ridge Isotope Generation code version 2 (ORIGEN2), developed by Oak
Ridge National Laboratory (ORNL), is a widely used code to calculate the buildup, decay
and processing of radioactive materials. ORIGEN2 is the successor to ORIGEN, and the
newer code has updated reactor models cross-sections, fission product yields decay data,
and the code itself.
The Los Alamos National Laboratory’s Monte Carlo Burnup code
(MONTEBURNS) is a link between MCNP and ORIGEN2. It is used to obtain isotopic
compositions and criticality in a system as a function of time and burnup. This is
achieved through the use of a Perl script that executes MCNP, ORIGEN2 and the fortran
77 code monteb.f. Monteb.f, or once compiled, monteb.exe, manipulates the output and
input files between MCNP and ORIGEN2 and creates a fully automated burnup tool.
MONTEBURNS uses MCNP primarily to obtain one-group cross sections and fluxes that
are used by ORIGEN2 to perform burnup calculations [5]. Once completed, new isotopic
compositions from ORIGEN2 are passed back into MCNP to obtain new fluxes and cross
sections and initiate another burnup cycle.

CHAPTER 3 REACTOR OPTIMIZATION
The reactor optimization process was performed in the system moderated with
Zirconium Hydride. A physical optimization was first performed so as to obtain the
optimum parameters. Subsequently, the fuel composition was optimized so as to obtain a
critical system with the minimum Uranium density. This is important because the
tricarbide fuel matrix becomes more robust as the Uranium concentration decreases.
Optimization of Physical Dimensions
To find the optimum reactor dimensions, several models were created, by varying
the flat-to-flat distance of the elements making up the fuel lattice. The reflector thickness
was kept at a thickness of 20 cm at all times. It enveloped the right cylindrical reactor at
all times. As the flat-to-flat distance was varied, the radius of the core changed,
subsequently the axial dimension of the core expanded as well so as to keep it a right
circular cylinder. The enveloping reflector dimensions changed as well as a function of
the fuel lattice radius so as to maintain a constant 20 cm reflector around the core. Thus,
varying the flat-to-flat distance in the fuel lattice impacted all dimensions in the reactor.
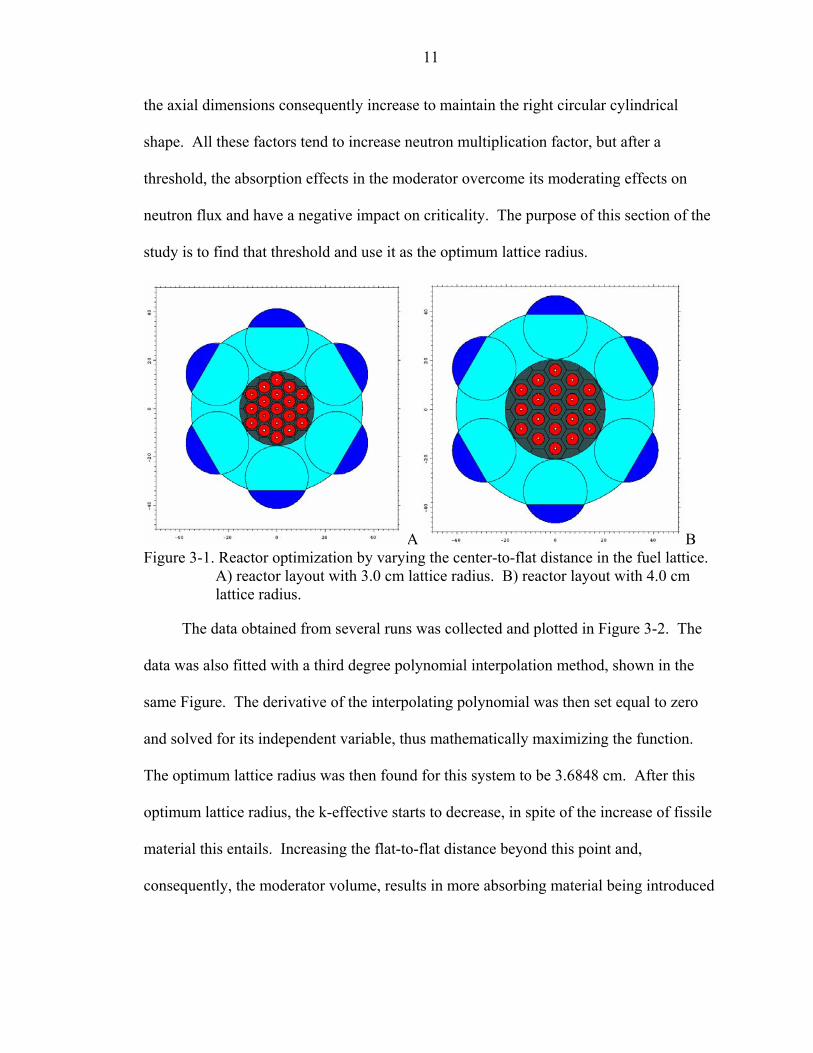
A plot of the reactor is shown in Figure 3-1. The fuel, moderator, reflector and
poison are colored red, gray, cyan and blue, respectively. The Figure makes it easy to
appreciate the extent to which the overall reactor dimensions change as a function of
lattice radius.
As Figure 3-1 shows, increasing the fuel lattice radius results in an increase of
moderator and reflector volume. In addition, the fissile inventory increases as well since
10
11
the axial dimensions consequently increase to maintain the right circular cylindrical
shape. All these factors tend to increase neutron multiplication factor, but after a
threshold, the absorption effects in the moderator overcome its moderating effects on
neutron flux and have a negative impact on criticality. The purpose of this section of the
study is to find that threshold and use it as the optimum lattice radius.
A B Figure 3-1. Reactor optimization by varying the center-to-flat distance in the fuel lattice.
A) reactor layout with 3.0 cm lattice radius. B) reactor layout with 4.0 cm lattice radius.
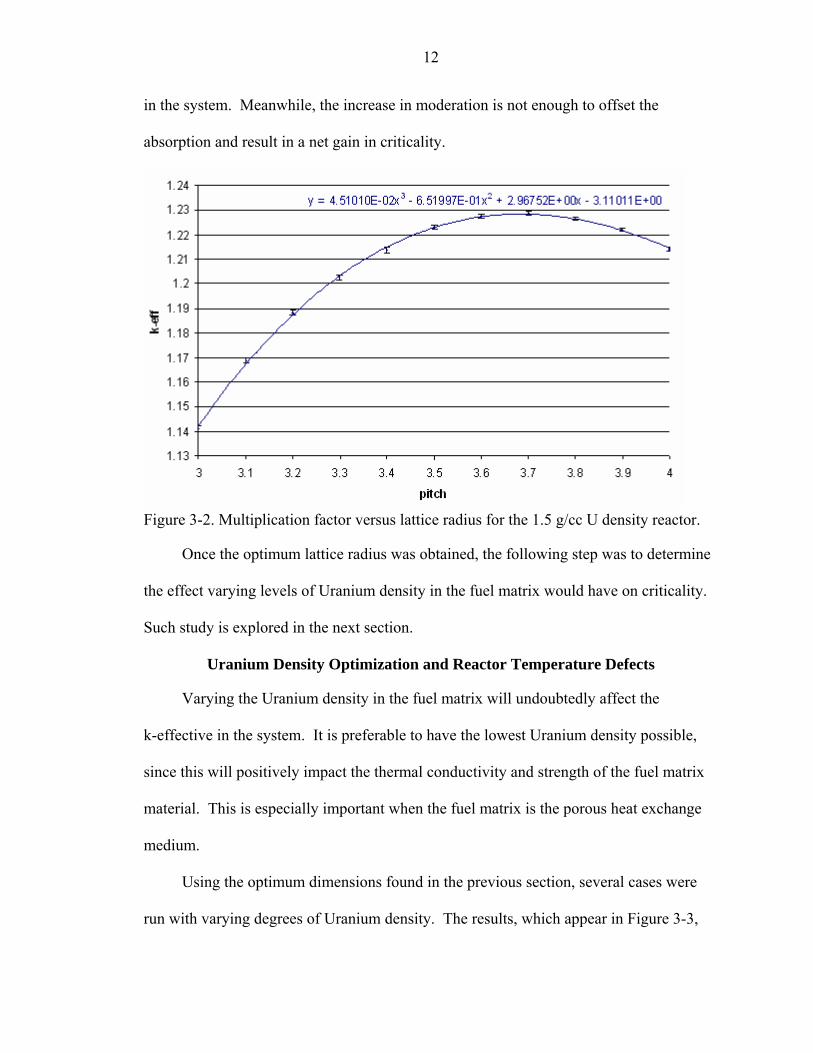
The data obtained from several runs was collected and plotted in Figure 3-2. The
data was also fitted with a third degree polynomial interpolation method, shown in the
same Figure. The derivative of the interpolating polynomial was then set equal to zero
and solved for its independent variable, thus mathematically maximizing the function.
The optimum lattice radius was then found for this system to be 3.6848 cm. After this
optimum lattice radius, the k-effective starts to decrease, in spite of the increase of fissile
material this entails. Increasing the flat-to-flat distance beyond this point and,
consequently, the moderator volume, results in more absorbing material being introduced
12
in the system. Meanwhile, the increase in moderation is not enough to offset the
absorption and result in a net gain in criticality.
Figure 3-2. Multiplication factor versus lattice radius for the 1.5 g/cc U density reactor.
Once the optimum lattice radius was obtained, the following step was to determine
the effect varying levels of Uranium density in the fuel matrix would have on criticality.
Such study is explored in the next section.
Uranium Density Optimization and Reactor Temperature Defects
Varying the Uranium density in the fuel matrix will undoubtedly affect the
k-effective in the system. It is preferable to have the lowest Uranium density possible,
since this will positively impact the thermal conductivity and strength of the fuel matrix
material. This is especially important when the fuel matrix is the porous heat exchange
medium.
Using the optimum dimensions found in the previous section, several cases were
run with varying degrees of Uranium density. The results, which appear in Figure 3-3,

13
show that the k-effective rises steeply as the density increases before leveling off at
higher densities.
Figure 3-3. Multiplication factor versus Uranium density.
The data shown above was particularly ill-conditioned for even a sixth order
polynomial interpolation. As such, we used a cubic spline interpolation method. This
generated nine piecewise continuous third degree polynomial functions. These functions
are shown in Equation 3-1.
(3-1)

14
To pick a Uranium density that ensures criticality at beginning of life, the reactor
model at 0.35 g/cc was chosen as a first approximation, as this is the first point obtained
that results in k-effective greater than one. However, it should be noted that all the runs
were performed at operating temperature, with the fuel at 3000ºK, the moderator at
800ºK, and the reflector at 600ºK. To determine startup capability it is necessary to
model this system at room temperature and determine if there is a positive reactivity
coefficient.
The reactor was modeled with all its components at room temperature so as to
ascertain a cold k-effective. Afterwards, the temperatures of the fuel, moderator and
reflector were individually increased in separate cases, while leaving the other
components at room temperature, to determine their individual reactivity coefficients.
These are shown in the last three data columns of Table 3-1.
Table 3-1. Multiplication factor and temperature defects for the fuel, moderator and reflector for reactor with 0.35 gU/cc density.
Operating temperature
Room temperature
3000 ºK fuel 800 ºK moderator
600 ºK reflector
Eigenvalue 1.02858 0.99428 0.98124 1.0303 1.00607 SD 0.00062 0.00063 0.00062 0.00065 0.00061 ∆k/k-ºK -4.84485E-06 7.14541E-05 3.86248E-05 ± 6.78520E-09 8.49498E-08 4.10477E-08 The data show a negative fuel temperature reactivity defect as well as a positive
reactivity defect in the moderator. The latter is over an order of magnitude higher than
the fuel temperature defect, and indicates that an increase in moderator temperature, such
as that brought about by an abrupt cease in coolant flow, might cause a reactivity
excursion. However, the moderator temperature ultimately depends on the fuel
temperature, and an increase in the latter would have a negative impact on the
multiplication factor. The reflector reactivity defect is also positive, and about half that

15
of the moderator. The reflector temperature, however, depends on the moderator
temperature, which in turn depends on the fuel temperature. In addition, the fuel is
separated from the moderator by a gap intended for coolant flow, thus preventing
conductive heat transfer between the fuel and moderator. Furthermore, in a loss of
coolant scenario, the convective heat transfer to the moderator from the fuel is ceased,
limiting a rapid increase in temperature in the moderator.
By lowering the uranium fuel density the fuel to moderator ratio is no longer the
same. This results in the system being overmoderated and consequently, an increase in
the moderator temperature defect. Thus re-optimizing the system can lower the
moderator temperature defect and maximize the k-effective. To do this, the same study
presented in Figure 3-2 is repeated for the 0.35 gU/cc core. Results are shown in
Figure 3-4.
Figure 3-4. Multiplication factor versus lattice radius for the 0.35 gU/cc reactor.
After maximizing the curve presented in Figure 3-4, the optimum lattice radius
for the 0.35 g/cm3 fuel is determined to be 3.488 cm. This is 5.3% less than the initial

16
estimate of 3.685 cm, showing the system as initially modeled was indeed
overmoderated. Modeling the system again at the optimum point results in a fuel
temperature defect increase of 3.7%, while the moderator temperature defect decreased
by 27.3%. Regardless of this improvement, however, the overall temperature defect for
the whole system continues to be positive, and the k-effective of the hot core is higher
than that of the cold core.
Table 3-2. Re-optimized core multiplication factor and temperature defects for the fuel, moderator and reflector for reactor with 0.35 gU/cc.
Operating temperature
Room temperature
3000 ºK fuel 800 ºK moderator
600 ºK reflector
Eigenvalue 1.03354 1.00819 0.99448 1.03476 1.01981 SD 0.00065 0.00065 0.00064 0.00067 0.00066 ∆k/k-ºK -5.02350E-06 5.19806E-05 3.75427E-05 ± 6.90287E-09 7.26402E-08 5.65132E-08 Undoubtedly, further reducing the lattice radius will further increase the fuel to
moderator ratio, undermoderating the core and decreasing the moderator temperature
defect. However, it is important to decide whether an undermoderated core is really
desirable considering the potentially catastrophic consequences of water ingress in the
core during a launch accident scenario. Nevertheless, the system was again modeled in
its cold condition to determine whether the reactivity worth of the hot core compared to
the cold core would ever become negative for the case with 0.35 g/cm3 U. For this
purpose, the cold system was compared with the system at operating temperatures, with
the fuel, moderator and reflector at 3000 ºK, 800 ºK, and 600 ºK respectively. The results
are shown in Figure 3-5 as the ∆k/k that the hot core represents with respect to the cold
core.
17
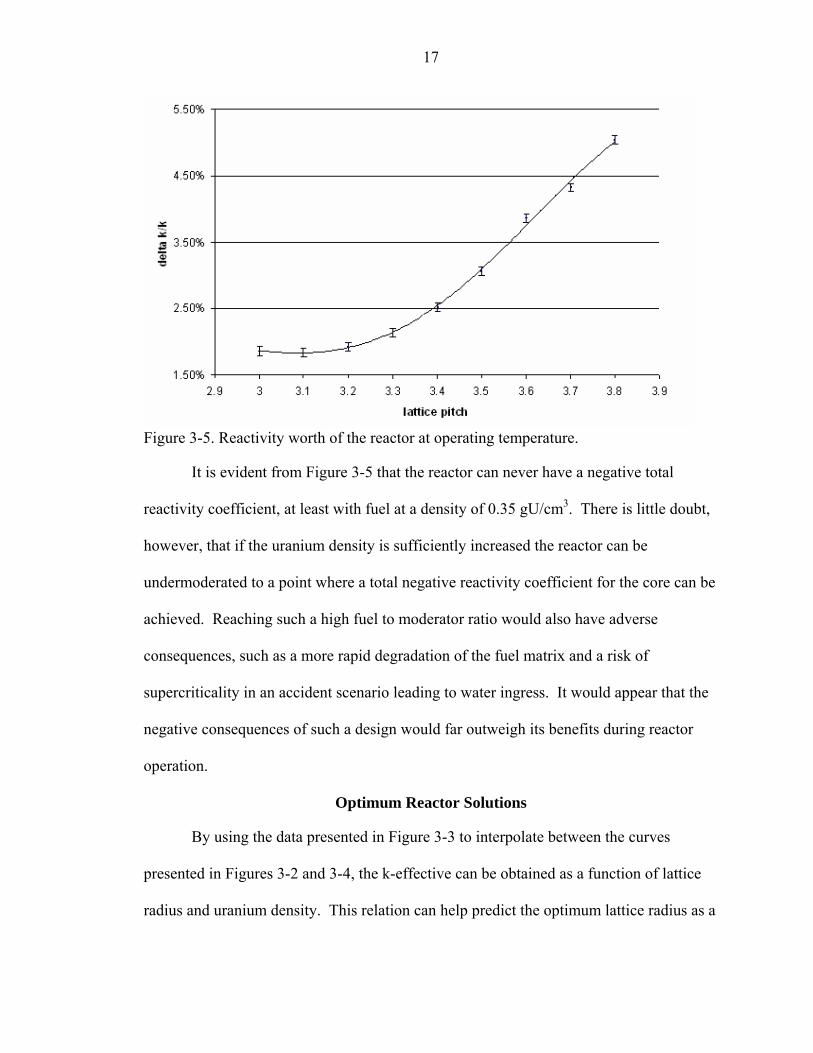
Figure 3-5. Reactivity worth of the reactor at operating temperature.
It is evident from Figure 3-5 that the reactor can never have a negative total
reactivity coefficient, at least with fuel at a density of 0.35 gU/cm3. There is little doubt,
however, that if the uranium density is sufficiently increased the reactor can be
undermoderated to a point where a total negative reactivity coefficient for the core can be
achieved. Reaching such a high fuel to moderator ratio would also have adverse
consequences, such as a more rapid degradation of the fuel matrix and a risk of
supercriticality in an accident scenario leading to water ingress. It would appear that the
negative consequences of such a design would far outweigh its benefits during reactor
operation.
Optimum Reactor Solutions
By using the data presented in Figure 3-3 to interpolate between the curves
presented in Figures 3-2 and 3-4, the k-effective can be obtained as a function of lattice
radius and uranium density. This relation can help predict the optimum lattice radius as a

18
function of Uranium density by maximizing the functions generated in the solution space.
The interpolating algorithm used to achieve this is shown in Appendix B.
A B
Figure 3-6. Multiplication factor versus Uranium density and lattice radius. A) Continuous interpolated function. B) Discrete interpolated functions at various densities.
As a result of this interpolation, the optimum lattice radius can be found for any
uranium density between 0.1 and 1.5. In addition, the k-effective for each of these
optimum points can be found from the function plotted in Figure 3-5.
Figure 3-7. Optimized lattice radius for uranium densities between 0.1 gU/cm3 and 1.5
gU/cm3.
19
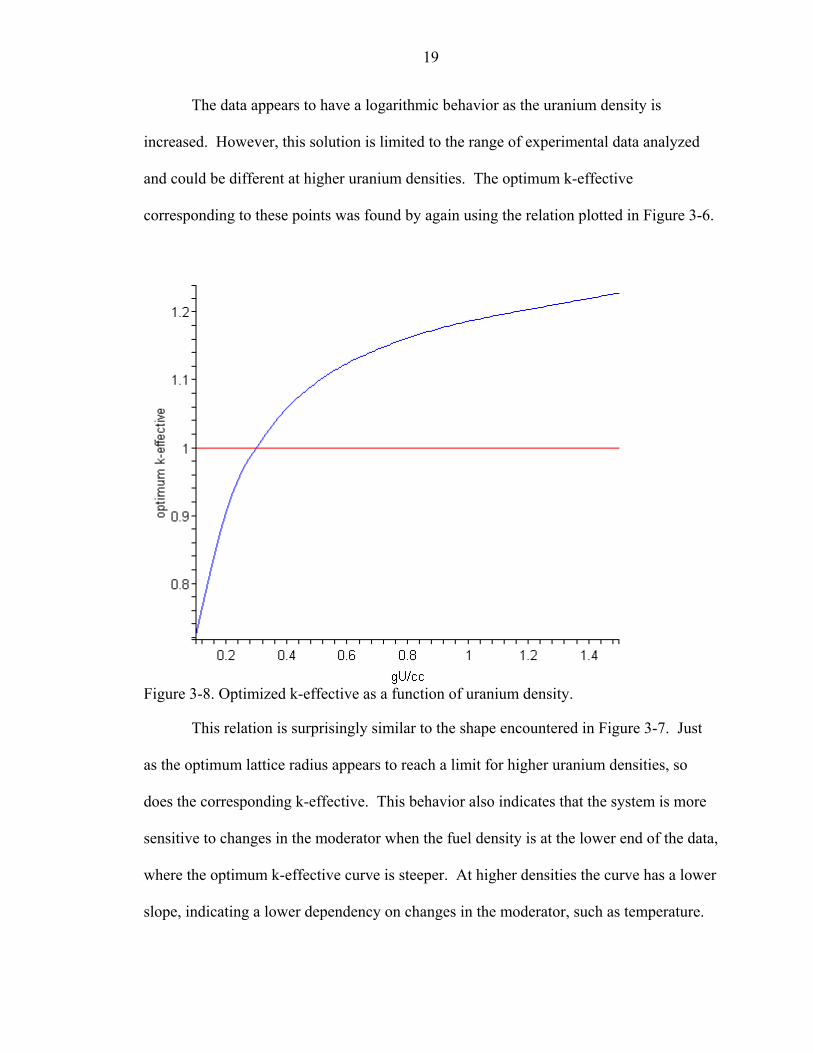
The data appears to have a logarithmic behavior as the uranium density is
increased. However, this solution is limited to the range of experimental data analyzed
and could be different at higher uranium densities. The optimum k-effective
corresponding to these points was found by again using the relation plotted in Figure 3-6.
Figure 3-8. Optimized k-effective as a function of uranium density.
This relation is surprisingly similar to the shape encountered in Figure 3-7. Just
as the optimum lattice radius appears to reach a limit for higher uranium densities, so
does the corresponding k-effective. This behavior also indicates that the system is more
sensitive to changes in the moderator when the fuel density is at the lower end of the data,
where the optimum k-effective curve is steeper. At higher densities the curve has a lower
slope, indicating a lower dependency on changes in the moderator, such as temperature.

20
Burnup Study
The reactor is designed for two 8-hr burns, one on the approach and one on the
return flight to earth. As such, it is necessary that the positive temperature defect be
taken into consideration for cold startup of the core. The core of choice will be that
which is critical at beginning of life in a cold state, so the cold k-effective is set to one
plus three standard deviations (99.7% confidence interval), plus an additional 1% margin.
This results in an initial cold k-effective of 1.0130300. Using the previously-obtained
temperature defects, this corresponds to a hot k-effective of 1.037876992. According to
the mathematical model developed, this corresponds to 0.3577516070 gU/cc and a lattice
radius of 3.492698908 cm.
The reactor was modeled with the aforementioned parameters and resulted in a k-
effective of 1.03943 ± 0.00096 at operational temperatures (0.15% difference from the
model prediction) and 1.01014 ± 0.00094 at shutdown temperature. This means a
temperature reactivity worth of 2.90% ∆k/k. The reactivity worth is assumed to remain
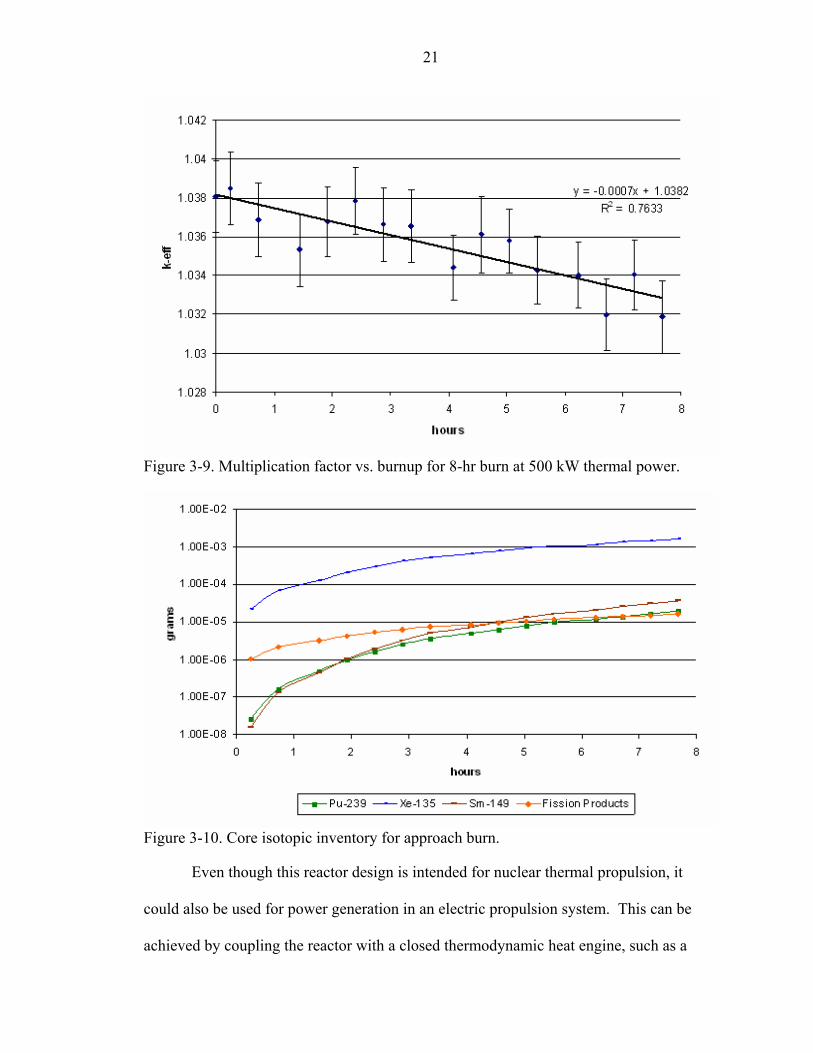
constant through the burn, since its duration is very brief. Indeed, Figure 3-9 shows the
burnup for this reactor during an 8-hour burn within the 95.4% confidence interval. The
change in k-effective is very slight, mainly due to the increase in Xe-135 during this
period, shown in Figure 3-10. Nonetheless, neither Xenon nor Samarium concentrations
reach equilibrium levels in such a brief burn. Samarium inventory reached a total of only
3.66x10⁻⁵ grams in the core at the end of the brief 70.0 MWd/MTU. The levels of Sm-
149 and Pu-239 rose at very similar rates, while the other plutonium isotopes reached a
value of only 3.39x10⁻⁹ grams at the end of cycle.
21
Figure 3-9. Multiplication factor vs. burnup for 8-hr burn at 500 kW thermal power.
Figure 3-10. Core isotopic inventory for approach burn.
Even though this reactor design is intended for nuclear thermal propulsion, it
could also be used for power generation in an electric propulsion system. This can be
achieved by coupling the reactor with a closed thermodynamic heat engine, such as a

22
Brayton cycle, or in a direct energy conversion magneto hydro dynamic system. As such,
it would be interesting to see how long the system currently defined could burn for. The
reactor was indeed determined to run for ~140 days (30.3 GWd/MTU) before reaching a
subcritical state, as shown in Figure 3-11. Undoubtedly, if the mission requires the
reactor to run for longer for electrical generation, the uranium content can be increased to
reach the demand.
The reactor’s extended burn capabilities could be of interest if it were used to
power electric ion thrusters instead of its initially intended use as a thermal propulsion
system. In a nuclear electric propulsion system the reactor is expected to operate for the
entire duration of the mission at lower power levels. Even though the current system is
only intended to burn for 8 hours, the positive reactivity defect allows it to burn for much
longer than that.
Figure 3-11. Reactor k-effective vs. days in operation.

23
A
B
Figure 3-12. Reactor inventory in A) Logarithmic scale and B) linear scale. As a result of the additional reactivity at operating temperature resulting from a
positive reactivity coefficient, the reactor can run for much longer than initially required.
During this additional time, there is a steady linear production of Pu-239, easily observed
in Figure 3-12 B. Production of xenon and samarium can also be seen in 3-12 A, in a

24
logarithmic scale. Xenon reaches equilibrium concentration right after startup, while
samarium takes roughly two months to achieve equilibrium concentrations.
Control Drum Design and Rotation
Even though control drums have already been selected, it is important to use only
the amount of B4C required. Using more poison will result in the drums having more
worth than is necessary, limiting their rotation range. To determine the minimum amount
of boron, several cases were modeled with a decreasing size of the boron sliver, as shown
in Figure 3-13. Once the results were obtained, the amount of boron selected
corresponded to that which would result in a subcritical system at BOL with a two
percent safety margin. This corresponds to a k-effective of 0.98. Using cubic spline
interpolation shown in equation 3.2 for the data presented in Figure 3-14 results in a
desired boron thickness of 0.0366 cm with standard deviation of 0.0007649. The desired
value in the 99.7% confidence interval is then 0.0389 cm B4C.
A B
C D Figure 3-13. Control drums with variable boron carbide thickness of A) 0 cm, B) 1 cm,
C) 2 cm and D) 3 cm

25
Figure 3-14. Multiplication factor versus B4C sliver thickness.
(3.2)
After obtaining the boron thickness, the subsequent step was to determine k-
effective as a function of control drum rotation. For this purpose the system was
simulated at 20º steps from 0º to 180º. The results were plotted and are shown in Figure
3-15 for the 99.7% confidence interval (± 3σ). Since the variation in k-effective was so
small in this case, the number of active k-effective cycles was increased to one thousand
to decrease uncertainty.

26
Figure 3-15. Multiplication factor versus control drum rotation.
We used the data in Figure 3-15 to determine the control drum reactivity worth as
a function of rotation. This was accomplished by obtaining the difference of each data
points with respect to the initial point at 0º rotation. The results (Figure 3-16) were then
processed in conjunction with the time-dependent eigenvalues shown in Figure 3-11 to
maintain a critical system trough the mission duration. This was accomplished by adding
k-effective as a function of time to its product with the reactivity worth as a function of
rotation. The resulting formulation was then solved for rotation values that satisfied a
critical system with time as the independent variable. The resulting inward control drum
rotation as a function of days is shown on Figure 3-17. The k-effective for this period of
time resulting from applying the calculated control drum rotation is shown in
Figure 3-18. Using multiplicative error propagation, the final critical k-effective is
estimated to have ~0.1% error.

27
Figure 3-16. Reactivity worth for control drum rotation.
Figure 3-17. Control drum rotation as a function of full power days.

28
Figure 3-18. Critical k-effective for a 140-day burn.
The statistical error in the calculations causes the mathematical model developed
to lose convergence at beginning of life and end of life, as shown in Figure 3-18.
However, the model appears to work well during the middle of the burn. The problem
stems mainly from insufficient data points and accuracy during modeling of burnup. Due
to the limited computational resources available for this work the error unfortunately
could not be significantly reduced for this part of the problem.
Alternate Moderator Composition
Besides the reactor design under study, several other variants have been proposed.
One of them focuses on replacing the zirconium hydride moderator with yttrium hydride.
This section will focus on evaluating the neutronic characteristics of such a design
29
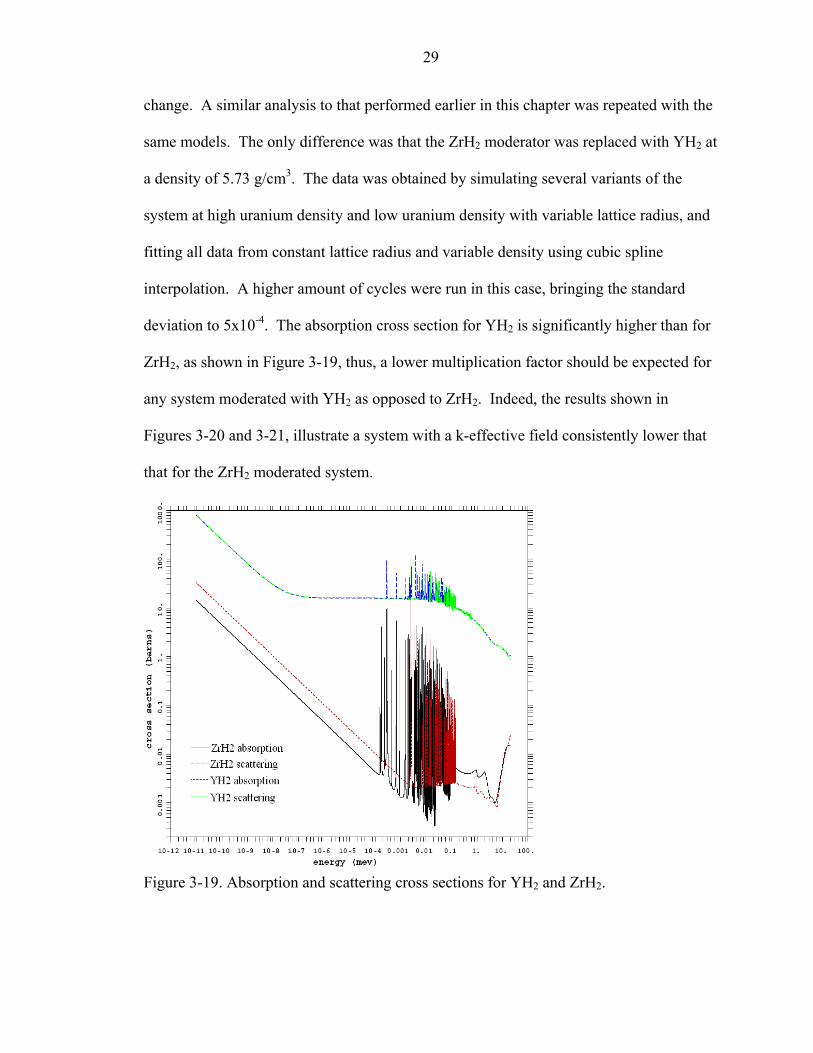
change. A similar analysis to that performed earlier in this chapter was repeated with the
same models. The only difference was that the ZrH2 moderator was replaced with YH2 at
a density of 5.73 g/cm3. The data was obtained by simulating several variants of the
system at high uranium density and low uranium density with variable lattice radius, and
fitting all data from constant lattice radius and variable density using cubic spline
interpolation. A higher amount of cycles were run in this case, bringing the standard
deviation to 5x10⁻⁴. The absorption cross section for YH2 is significantly higher than for
ZrH2, as shown in Figure 3-19, thus, a lower multiplication factor should be expected for
any system moderated with YH2 as opposed to ZrH2. Indeed, the results shown in
Figures 3-20 and 3-21, illustrate a system with a k-effective field consistently lower that
that for the ZrH2 moderated system.
Figure 3-19. Absorption and scattering cross sections for YH2 and ZrH2.

30
Figure 3-20. Multiplication factor vs. lattice radius for various uranium densities.
A B Figure 3-21. Multiplication factor versus lattice radius and uranium density. The thick
black curve represents the optimized points and the blue curve represents points where criticality is met. A) Three dimensional view. B) Contour view. The optimized points represented by the black curve were obtained by mathematically maximizing several slices of the k-effective field at constant uranium densities. In addition, the points where the system is critical are represented by the blue curve.

31
There was a significant and fairly constant difference of ~13% ∆k/k between the
ZrH2-moderated system and the YH2-moderated system (Figure 3-22). This was
expected due to the higher absorption cross-section of YH2. However, in spite of the
lowered reactivity of the YH2-moderated system, the curve of optimized k-effective
versus uranium density has a very similar slope to that of the ZrH2-moderated system for
any value of uranium density.
Figure 3-22. Optimized k-effective vs. uranium density for both moderator types.
A critical system was analyzed in order to verify the accuracy of the model in this
case. The model predicts 3.268cm pitch and 0.754 gU/cm3 for a critical system, and
after modeling such a system on MCNP with the aforementioned parameters, the
obtained k-effective was 0.99957 ± 0.00072. In this case the resulting value for k-eff was
statistically the same as the prediction from the mathematical model.
Since yttrium hydride has fewer absorption resonances, and they are present at
even higher energies, this material will have a higher positive temperature defect than

32
zirconium hydride. In fact, the temperature defect for the whole core in this case was
4.589 % ∆k/k.
After reviewing the data presented in the previous three Figures it is evident that
the YH2 moderator carries with it a heavy tax on neutron utilization. As a result, to
obtain a critical system, the uranium density necessary in the foam fuel is 153.4% higher
in the YH2-moderated system than in the ZrH2-moderated one. A separate study would
need to be conducted to determine if the gains in material properties brought about by
yttrium hydride surpass the structural detriment subtended by the fuel matrix by
increasing its uranium content.

CHAPTER 4 REACTOR SAFETY AND SHIELDING
This chapter explores the reactor behavior under accident conditions. Before
reaching space, the reactor must be launched from a terrestrial facility. If the launch is
unsuccessful, the reactor might fall to earth. The concern in this case is to prevent the
reactor from reaching criticality no matter what conditions it might encounter when
crashed. There are two scenarios that could potentially cause a reactivity increase in the
core: falling in sand and falling in water. Sand has been found to be an excellent
reflector, as such, a reactor lodged in sand can be assumed to be surrounded by an infinite
reflector. In the case of water landing, the water could potentially leak into cavities in the
core design for coolant flow, altering the neutron spectrum and physical properties of the
system.
Once the reactor is in space and operational, it is important to minimize power
peaking. A flat power distribution ensures maximum heat transfer from the fuel by
allowing it to be at a higher temperature throughout. In addition, if there is substantial
power peaking it can result in fuel melting in certain parts of the core. Because of the
nature of the design, a fuel melt scenario would be especially catastrophic, since it would
prevent coolant from moving through the fuel. To determine power peaking, this study
will examine the thermal flux distribution in the core, since in a thermal system this
ultimately dictates where fission occurs.
While the aforementioned provisions are meant to protect the core, it is also
important to protect the electronic components in the reactor. For this purpose, a slab of
33

34
lithium borohydrate (LiBH4) was chosen as the shielding material between the reactor
and the rest of the ship. To determine the effectiveness of this shielding material, the
thermal flux was measured at varying depths in the shield. In addition, Li6B10H4 was
compared with natural LiBH4 to evaluate the differences between these two materials
and determine which would make a better shield.
Infinite Reflector Study
The finalized reactor design was modified to simulate sand immersion. This was
performed by adding reflective properties to the outer reactor surfaces, surrounding the
reactor by an infinite reflective medium. In addition, the reactor was modeled at room
temperature, since it will not be sent at operational temperature. This is important
because, due to the positive reactivity coefficient, the multiplication factor in the core is
lower when the system is at room temperature.
Figure 4-1. Convergence on k-effective for shutdown optimized system in an infinite reflector.

35
After modeling the reactor with an infinite reflector, it was found that the system
would be supercritical under those conditions. The data, shown in Figure 4-1, shows that
the final k-effective would be 1.01049 with standard deviation 7.4x10⁻⁴. While the
designed control drums were sufficient to make the reactor subcritical when surrounded
by a non-reentrant surface, such as in space, they were insufficient in keeping the
reflected flux from making the system supercritical.
The results confirm that, in case of an unsuccessful launch resulting in sand
landing, the reactor would become supercritical, even with the control drums in place.
Since the system will be shutdown, no coolant will be flowing through the core. In
addition to the heat generated from fission, the lack of cooling would further contribute to
the increase in temperature in the fuel and the system as a whole. Because of the positive
reactivity coefficient in the core, this will result in a further increase in k-effective,
resulting in the temperature increasing even more. As a direct consequence of the very
high temperatures likely to be reached in the system the fuel will melt and core materials
and structural support will suffer severe degradation. The core will collapse and its
contents will escape into the environment. Fortunately, this would happen with a clean
core, so iodine-131, strontium-90, cesium-137 and other fission products would have no
inventory in the core at the beginning of the accident. However, these fission products
would be produced and released as long as the core stays critical or supercritical.
These results are undoubtedly unacceptable, and could be remediated in several
manners. One such methods might include enlarging the thickness of the boron sliver in
the control drums, since according to Figure 3-14, the maximum reactivity worth

36
attainable with this method is 0.17643 ∆k/k. However, doing this would limit the range
of motion of the drums once the system is in operation, limiting the resolution with which
control is maintained.
Water Immersion Study
To simulate the water landing scenario, the reactor was modeled with water in the
inner and outer radial coolant flow gaps, as well as filling up the pores in the foam fuel.
In addition, the reactor is assumed to be fully submerged in a body of water, and as such
it was modeled as being surrounded by a water sphere with a ten meter radius. The
number density of materials comprising the fuel cylinders are shown in table 4-1. The
water filling the inner and outer coolant gaps was modeled at 1 g/cm3.
Table 4-1. Elemental composition of water-fuel mixture Element Number Density (b-cm)^-1U-235 8.88800E-04U-238 2.75000E-05Zr 2.92010E-02Nb 9.73370E-03C 3.98509E-02H 3.34367E-02O 1.67183E-02 In the event of a water landing, the core and foam fuel will be filled with water,
and in addition the sphere surrounding the reactor will contribute to additional
moderation in the medium. Several options were explored to maintain the core
subcritical in this instance. These included the insertion of boron carbide control plugs in
the central coolant channels in the fuel elements. One variant used a control plug in the
central fuel element, while the other used plugs in all fuel elements. In addition, the
reactor was also surrounded by varying thicknesses of B4C foil to prevent the reflected
37
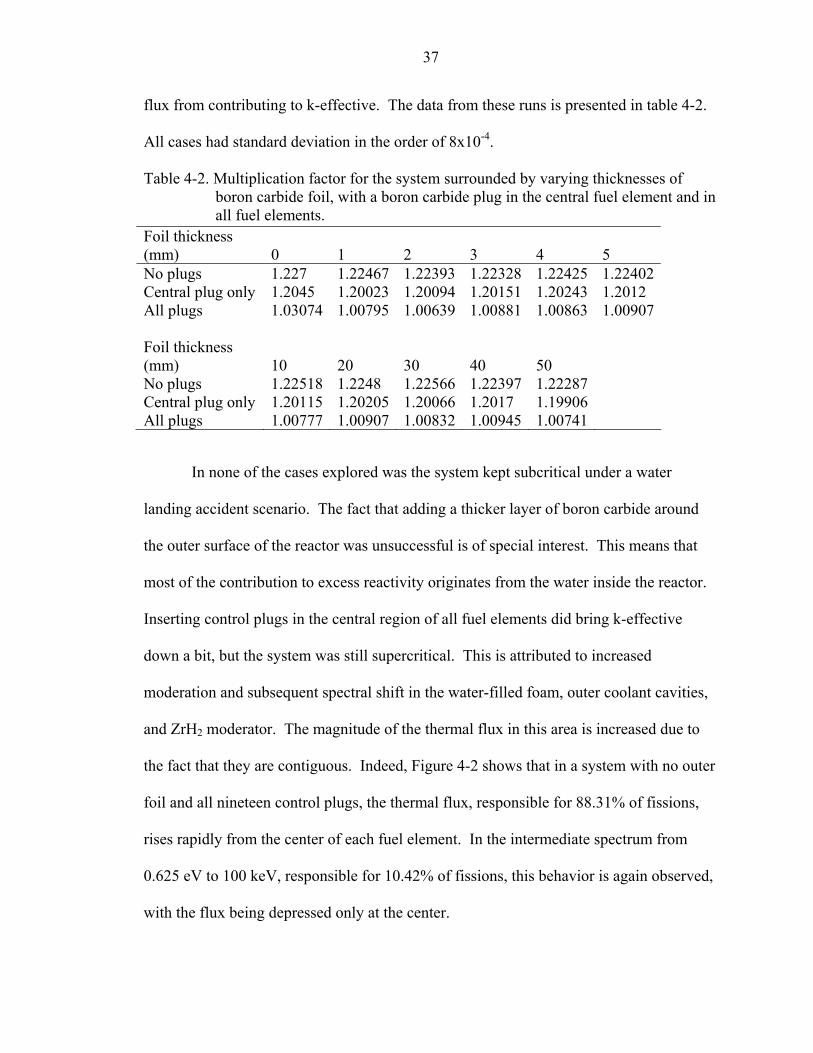
flux from contributing to k-effective. The data from these runs is presented in table 4-2.
All cases had standard deviation in the order of 8x10⁻⁴.
Table 4-2. Multiplication factor for the system surrounded by varying thicknesses of boron carbide foil, with a boron carbide plug in the central fuel element and in all fuel elements.
Foil thickness (mm) 0 1 2 3 4 5 No plugs 1.227 1.22467 1.22393 1.22328 1.22425 1.22402Central plug only 1.2045 1.20023 1.20094 1.20151 1.20243 1.2012 All plugs 1.03074 1.00795 1.00639 1.00881 1.00863 1.00907 Foil thickness (mm) 10 20 30 40 50 No plugs 1.22518 1.2248 1.22566 1.22397 1.22287 Central plug only 1.20115 1.20205 1.20066 1.2017 1.19906 All plugs 1.00777 1.00907 1.00832 1.00945 1.00741
In none of the cases explored was the system kept subcritical under a water
landing accident scenario. The fact that adding a thicker layer of boron carbide around
the outer surface of the reactor was unsuccessful is of special interest. This means that
most of the contribution to excess reactivity originates from the water inside the reactor.
Inserting control plugs in the central region of all fuel elements did bring k-effective
down a bit, but the system was still supercritical. This is attributed to increased
moderation and subsequent spectral shift in the water-filled foam, outer coolant cavities,
and ZrH2 moderator. The magnitude of the thermal flux in this area is increased due to
the fact that they are contiguous. Indeed, Figure 4-2 shows that in a system with no outer
foil and all nineteen control plugs, the thermal flux, responsible for 88.31% of fissions,
rises rapidly from the center of each fuel element. In the intermediate spectrum from
0.625 eV to 100 keV, responsible for 10.42% of fissions, this behavior is again observed,
with the flux being depressed only at the center.

38
It would seem that if the thermal flux could be depressed on the outer gaps of the
fuel elements, this problem could be corrected. Placing a neutron poison at these
locations should prove an effective way to prevent criticality, and indeed it does. Figure
4-3 shows the flux distribution in the reactor after filling the peripheral gaps in the fuel
elements with B4C.
A
B
Figure 4-2. Neutron flux in the reactor with inner control plugs in all fuel elements, normalized to particle histories. A) Energy range 0 eV to 0.625 eV (88.31% of fissions). B) Energy range 0.625 eV to 100 keV (10.42% of fissions).

39
A
B
Figure 4-3. Neutron flux in the reactor with inner control plugs and shells in all fuel elements, normalized to particle histories. A) Energy range 0 eV to 0.625 eV (49.14% of fissions). B) Energy range 0.625 eV to 100 keV (41.64% of fissions).
Placing control shells surrounding the control plugs in each fuel element clearly
depresses the thermal flux in the fuel elements. As evidenced by Figure 4-3 A, the
thermal flux is consistently depressed in the fuel by use of this system. In addition, the
intermediate flux, responsible for 42% of fissions in this case, is also depressed on the

40
periphery of the fuel elements, as evidenced by Figure 4-3 B. This results in the k-
effective for this system being 0.13628 with standard deviation 3.2x10⁻⁴, a value 86.8%
lower than that resulting from the use of central control plugs alone. This proves that the
reactor can safely crash in a body of water and stay subcritical if equipped with central
control plugs and peripheral control shells during launch. In addition, the use of a control
foil surrounding the reactor is not necessary. Since this measure prevents criticality in
case of water immersion, it will also maintain the system subcritical in case of sand
immersion, since excess criticality in that case is only a fraction of that observed in water
immersion.
The use of multiple control plugs and shells will require additional mechanical
complexity in the system. To eject them, the nozzle will need to detach from the reactor.
As a result of this requirement, an interchangeable mechanism could be developed to
swap the nozzle with the hot leg of a heat engine or MHD energy conversion unit as
required. This results in a more versatile system, as it can be used for thermal propulsion,
electric propulsion, and auxiliary power generation.
Operational Reactor Flux
To determine the reactor flux while in operation, the reactor was modeled with the
control drums rotated outwards and with no safety plugs or shells. In this case, 91.4% of
fissions were caused by thermal neutrons from 0 eV to 0.625 eV and thus, the thermal
flux provides an excellent indicator of power distribution in the core. The thermal flux
distribution across the core is shown in Figure 4-4. The plot qualitatively shows very
little difference in the thermal flux between the fuel elements. This indicates that power
peaking is not very pronounced.
41
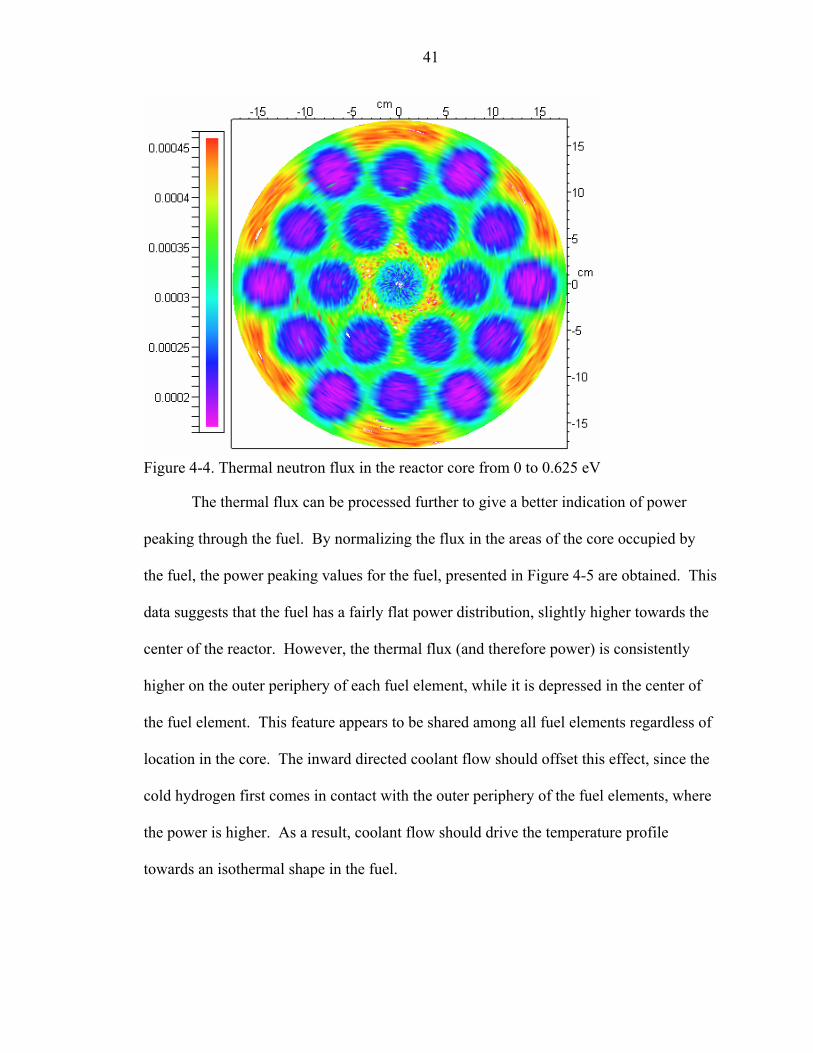
Figure 4-4. Thermal neutron flux in the reactor core from 0 to 0.625 eV
The thermal flux can be processed further to give a better indication of power
peaking through the fuel. By normalizing the flux in the areas of the core occupied by
the fuel, the power peaking values for the fuel, presented in Figure 4-5 are obtained. This
data suggests that the fuel has a fairly flat power distribution, slightly higher towards the
center of the reactor. However, the thermal flux (and therefore power) is consistently
higher on the outer periphery of each fuel element, while it is depressed in the center of
the fuel element. This feature appears to be shared among all fuel elements regardless of
location in the core. The inward directed coolant flow should offset this effect, since the
cold hydrogen first comes in contact with the outer periphery of the fuel elements, where
the power is higher. As a result, coolant flow should drive the temperature profile
towards an isothermal shape in the fuel.

42
Figure 4-5. Power peaking factors in the fuel.
Thermal flux levels are understandably higher in the operational core than they
were in the shutdown core with all safety devices inserted. In addition thermal flux is
responsible for 91.4% of fissions in the system, facilitating control due to the higher
contributions of delayed neutrons.
Reactor Shielding
A space mission not only requires propulsion, but also an array of scientific
instrumentation and possibly a crew. Proper reactor shielding must be used to keep
components and astronauts from being damaged by neutron radiation. This section
evaluates the use of a 20-cm slab of lithium borohydrate (LiBH4) as a shielding material.
Natural LiBH4 was compared with Li6B10H4 to determine to what extent shielding can be
improved with the alternate isotopic composition.
43
A
B
C
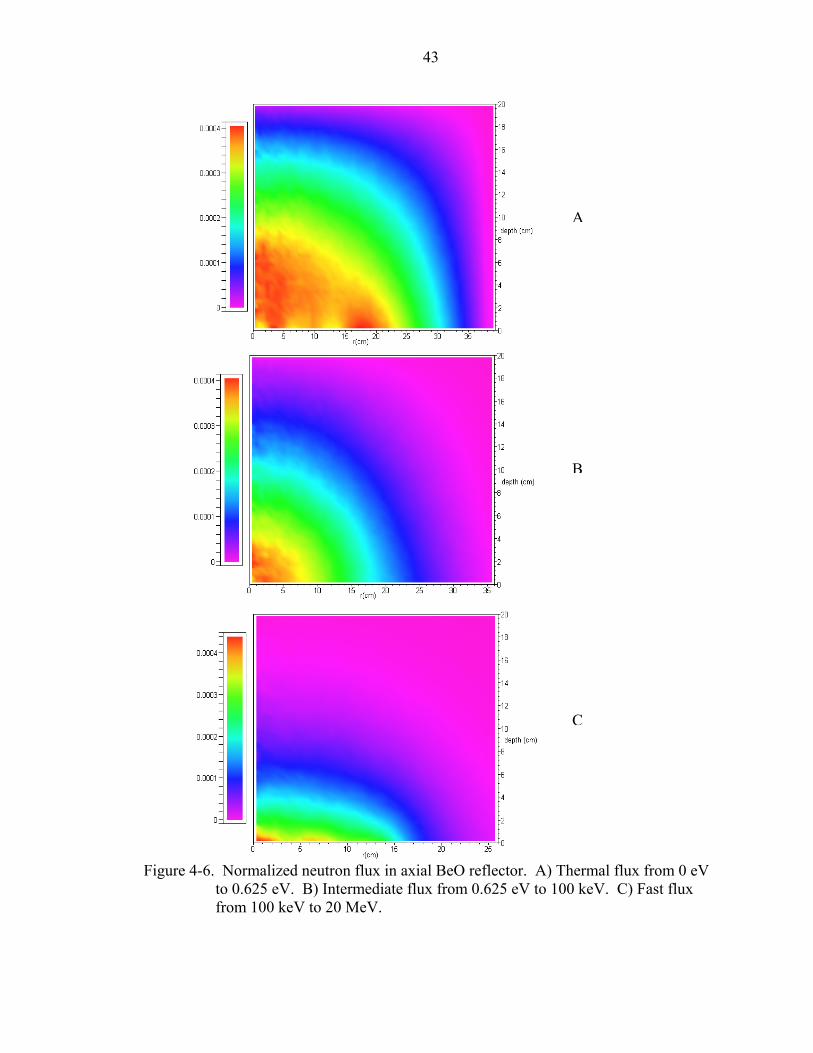
Figure 4-6. Normalized neutron flux in axial BeO reflector. A) Thermal flux from 0 eV to 0.625 eV. B) Intermediate flux from 0.625 eV to 100 keV. C) Fast flux from 100 keV to 20 MeV.

44
In addition to the LiBH4 slab, the reactor’s BeO reflector does a significant
amount of shielding by itself. In keeping neutrons in the reactor, a great deal of leakage
is prevented as well. The normalized flux distribution in the BeO slab adjacent to the
LiBH4 shield is shown in Figure 4-6. The plot shows a substantial reduction in all
spectrums. The thermal flux is reduced by 92.2% across the reflector, while the
intermediate and fast flux are reduced by 94.7% and 98.5% respectively. Clearly, the
system can be thought of as having two shields, the first of which being the reflector.
The use of a LiBH4 shield brings about additional attenuation, as shown in Figure
4-7. A significantly larger attenuation in the intermediate energy group results in the
Li6B10H4 shield than in the natural LiBH4 counterpart. There is no statistically significant
difference between the two materials in the fast group. The thermal group attenuates
very quickly in the slab, with the Li6B10H4 being more effective at this.
Figure 4-7. Attenuation percent across the LiBH4 shield, ± standard error corresponding
to one standard deviation.

45
The combination of the BeO reflector and an additional Li6B10H4 or LiBH4 slab
proves to be a very effective may to attenuate the neutron flux to the rest of the vehicle.
The 20-cm thick Li6B10H4 shield provides, at the lower limit of the error margin,
99.97663639 %, and 99.60847405 % attenuation the intermediate and fast spectrums
respectively. Natural LiBH4, on the other hand, results in 99.91972275 % and
99.18713220 % attenuation in the intermediate and fast spectrums respectively. The
thermal flux attenuation in the shield was not as simple to obtain, since many of the
tallies were zero into the slab.
By using the difference in flux in the first 2 cm of the slab, a linear attenuation
coefficient was derived and used to approximate the thermal flux attenuation through the
slab. Using the standard error corresponding to one standard deviation, this resulted in a
fraction of transmitted radiation in the range of 8.819148271 10-86 to 1.735657896 10-79
for the natural LiBH4 and 1.239948923 10-116 to 2.963058401 10-103 for the Li6B10H4
shield at 20 cm thickness. These results indicate that essentially no thermal neutrons can
get through the slab, since the highest conceivable neutron flux would be in the order of
1016 n/cm2-s.
Even though Li6B10H4 proves to be a better shield than natural LiBH4, the latter still
proves to be quite a formidable shield at 20 cm thickness. When attenuation from the
BeO reflector is taken into account, the total fraction of neutrons that transverse both the
reflector and LiBH4 shield, at the most conservative limit of the error margin, is
1.405339639 10-82, 0.00004529993750, and 0.0001337806510, for the thermal,
intermediate and fast groups respectively. For the Li6B10H4 shield, these values were
2.399149874 10-104, 0.00001318393533, and 0.00006443679585 for the thermal,

46
intermediate and fast energy groups, respectively. This data suggests that, using the ratio
of their multiplicative spectral attenuation aggregates, Li6B10H4 is 97.5% more effective
as a shielding material than its natural counterpart. In spite of this, sufficient attenuation
can be obtained by the use of either material. In addition, a 20 cm slab may not be
necessary. The thickness of the slab can be significantly less, reducing the payload mass.
Ultimately, only the required radiation limit would dictate the amount of shielding
required.

CHAPTER 5 SUMMARY AND CONCLUSIONS
Summary of Results
The main goal of this work was to develop a model of the neutronic behavior of the
foam fuel reactor and evaluate it as a feasible candidate for a space power and propulsion
system. The results presented in chapter 3 showed that the system would work from a
neutronic point of view. In addition, it was shown that the reactor can have enough
excess criticality to run for an extended period of time.
Chapter 4 evaluated different accident scenarios, and recommendations were made
to include axial and central control elements to be used during launch to prevent
criticality in case of failure. However, this implied that the nozzle or hot leg needs to be
detached from the system to eject the safety controls prior to reactor startup. This adds
additional mechanical complexity to the system, and this is typically unwanted in space
systems.
There were some troubling results suggesting that the system would have a positive
reactivity coefficient regardless of how it is designed, as long as the moderating materials
under evaluation are used. This is due to the ZrH2 not having absorption resonances any
lower than 100 eV. Doppler broadening effects are comparatively small in this case
because 91.4% of fissions are caused by neutrons with energy less than 0.623 eV. Thus,
increases in moderator temperature will have mainly a 1/v effect, decreasing neutron
absorptions in the moderator. This problem is exacerbated through the use of YH2,
since this material has even fewer absorption resonances, and those that are present
47

48
appear at energies greater than 2 keV. As a result, when YH2 is used as the moderator the
system has a 58 % higher temperature defect.
The positive reactivity in the core could be counteracted by a feedback mechanism
controlling control drum rotation based on moderator temperature monitoring and/or
thermal flux levels. With advanced computers available nowadays, this algorithm should
not be a big technical challenge. In addition, the reactor operates on the thermal
spectrum, making control even easier thanks to delayed neutrons.
Data Summary and Delivery as Maplets
The data obtained for reactor parameter correlations in Chapter 3 was compiled and
summarized as maplets, included in this document. Two maplets were compiled, one for
the ZrH2 moderated reactor and one for the YH2 moderated reactor, accessible as objects
5-1 and 5-2, respectively. In each case, the user is first given the choice to select the
desired input in a dialog shown in Figure 5-1 A. Once selected, the dialog disappears and
the user is prompted to input the value of the desired parameter, as shown in Figure 5-1
B. Pressing the “Evaluate” button or return key then returns the other corresponding
parameters at the optimal point according to the mathematical model. In addition, the
“Plot” button plots the location in the relevant section of the data where this point falls.
The black curve corresponds to optimized parameters, and the khaki curve corresponds to
the k-effective at the point. In addition, the “Help” button displays an information
window showing the user the range of values for the system. There are error messages
built in to the maplet that prevent it from crashing if the user inputs values out of the data
range. The other options are “Clear” and “Exit”, which perform the functions implied.
The maplets were created using Maple 9.5, but might also work with other versions
of Maple with perhaps limited functionality. They can be executed by double-clicking

49
the files on a windows PC with Maple installed. Maple’s maplet viewer should
automatically open the files, appearing to the user as an executable application.
A B Figure 5-1. Data delivery maplet for the YH2 moderated reactor. A) Initial Prompt. B)
user interface.
Object 5-1. ZrH reactor data delivery maplet2
Object 5-2. YH reactor data delivery maplet2

50
Future Work
Additional work should be done to further evaluate this design. It would be
advantageous to obtain data for systems with other fuel porosities in addition to 50%. Of
special importance is the need to perform detailed heat transfer studies to evaluate the
possibility of an uncontrolled reactivity excursion due to the positive moderator
temperature defect. The gap between the fuel and the moderator should aid in preventing
a large increase in the moderator temperature from a transient in the fuel, but this is
difficult to say at this point. A detailed study in this area should address whether the
fuel’s negative reactivity coefficient and the importance of delayed neutrons is enough to
offset the moderator’s positive reactivity coefficient in preventing an excursion. If a
reactivity excursion is indeed likely, it would be necessary to determine if it occurs
slowly enough so a computer can correct for it trough control drum rotation.

APPENDIX A INPUT FILE FOR MCNP
Foam fuel -- 5cm OD & 2cm ID 0.365gu/cc 50% porosity optimized at 3.493 cm pitch 1 0 -1 imp:n=1 U=5 $ inner coolant 2 2 -3.538815047 1 -2 imp:n=1 U=5 $ fuel foam 3 0 2 -3 imp:n=1 U=5 $ outer coolant 4 3 -5.47 3 imp:n=1 U=5 $ YH2 moderator 5 3 -5.47 -4 5 -6 -7 -8 -9 imp:n=1 U=2 lat=2 $just mod 6 0 -4 5 -6 -7 -8 -9 imp:n=1 U=1 lat=2 fill=5 $just mod 7 0 -4 5 -6 -7 -8 -9 imp:n=1 U=3 lat=2 fill=-5:5 -5:5 0:0 2 2 2 2 2 2 2 2 2 2 2 2 2 2 2 2 2 2 2 2 2 2 2 2 2 2 2 2 2 2 2 2 2 2 2 2 2 2 1 1 1 2 2 2 2 2 2 2 1 1 1 1 2 2 2 2 2 2 1 1 1 1 1 2 2 2 2 2 2 1 1 1 1 2 2 2 2 2 2 2 1 1 1 2 2 2 2 2 2 2 2 2 2 2 2 2 2 2 2 2 2 2 2 2 2 2 2 2 2 2 2 2 2 2 2 2 2 2 2 2 2 8 0 -10 13 -12 imp:n=1 fill=3 9 4 -3.01 (10:12:-13) -14 -11 15 20 21 22 23 24 25 imp:n=1 $ BeO reflector c ---------control drums------------- 10 4 -3.01 -20 -30 -14 15 imp:n=1 11 4 -3.01 -21 -31 -14 15 imp:n=1 12 4 -3.01 -22 -32 -14 15 imp:n=1 13 4 -3.01 -23 -33 -14 15 imp:n=1 14 4 -3.01 -24 -34 -14 15 imp:n=1 15 4 -3.01 -25 -35 -14 15 imp:n=1 c 20 5 -2.52 -20 30 -14 15 imp:n=1 21 5 -2.52 -21 31 -14 15 imp:n=1 22 5 -2.52 -22 32 -14 15 imp:n=1 23 5 -2.52 -23 33 -14 15 imp:n=1 24 5 -2.52 -24 34 -14 15 imp:n=1 25 5 -2.52 -25 35 -14 15 imp:n=1 c 55 0 (11:14:-15) (20:14:-15) (21:14:-15) (22:14:-15) (24:14:-15) (25:14:-15) (23:14:-15) imp:n=0 $ void 1 cz 0.5 $ inner fuel radius 2 cz 2.5 $ outer fuel radius 3 cz 2.549 $ outer flow radius c ------------------lattice planes---------------
51

52
4 py 3.4927 5 py -3.4927 6 p 2.016511285 3.4927 0 2.016511285 3.4927 1 4.03302257 0 0 7 p -2.016511285 -3.4927 0 -2.016511285 -3.4927 1 -4.03302257 0 0 8 p 2.016511285 -3.4927 0 2.016511285 -3.4927 1 4.03302257 0 0 9 p -2.016511285 3.4927 0 -2.016511285 3.4927 1 -4.03302257 0 0 c -----------Core top, bottom, reflector----------- 10 cz 17.8635 11 cz 37.8635 12 pz 17.8635 13 pz -17.8635 14 pz 37.8635 15 pz -37.8635 c ------------Control drums-------------- 20 c/z 0 27.9024303 10.02893 21 c/z 24.16421347 13.95121515 10.02893 22 c/z 24.16421347 -13.95121515 10.02893 23 c/z 0 -27.9024303 10.02893 24 c/z -24.16421347 -13.95121515 10.02893 25 c/z -24.16421347 13.95121515 10.02893 c -----------planes in the drums--------- 30 p 0 37.84403485 0 0 37.84403485 1 1 37.84403485 1 31 p 32.77389556 18.92201742 0 32.77389556 18.92201742 1 33.27389556 18.05599202 1 32 p 32.77389556 -18.92201742 0 32.77389556 -18.92201742 1 32.27389556 -19.78804283 1 33 p 0 -37.84403485 0 0 -37.84403485 1 -1 -37.84403485 1 34 p -32.77389556 -18.92201742 0 -32.77389556 -18.92201742 1 -33.27389556 -18.05599202 1 35 p -32.77389556 18.92201742 0 -32.77389556 18.92201742 1 -32.27389556 19.78804283 1 mode n kcode 4000 1.0 20 1000 4000 $ 20 inactive 100 active ksrc 0.0 1.5 0.0 TMP:n 0 2.5851e-7 0 6.8936e-8 6.8936e-8 0 0 0 5.1702e-8 5.1702e-8 5.1702e-8 5.1702e-8 5.1702e-8 5.1702e-8 5.1702e-8 5.1702e-8 5.1702e-8 5.1702e-8 5.1702e-8 5.1702e-8 5.1702e-8 FMESH4:n GEOM=cyl IMESH=17.8635 IINTS=100 JMESH=-17.8635 17.8635 KMESH=1 KINTS=100 EMESH 0.625e-6, 1e-3 EINTS= 1 1 OUT=iK c m2 92235.65c 0.0008888 92238.65c 0.0000275 40000.60c 0.0292010 41093.60c 0.0097337 6000.60c 0.0398509 mt2 grph.08t $2000 K graph, fuel @ 3000 c m3 40000.60c 1 $ ZrH2 moderator 1001.60c 2 mt3 h/zr.63t $ H in ZrH2 @ 800 K zr/h.63t $ Zr in ZrH2 @ 800 K c m4 4009.60c .5 $ BeO

53
8016.60c .5 $ BeO mt4 beo.62t $ BeO at 600 K c m5 5010.60c 4 $ B4C absorber 6000.60c 1

APPENDIX B INTERPOLATING ALGORITHM IN MAPLE
M:=Matrix(<<.1|.45485>,<.2|.65272>,<.3|.76376>,<.35|.80407>,<.4|.8362>,<.5|.88715>,<.75|.96761>,<1|1.01391>,<1.25|1.04588>,<1.5|1.07149>>): H:=Matrix(<<3|1.05785>,<3.1|1.07473>,<3.2|1.08516>,<3.3|1.09026>,<3.4|1.09057>,<3.5|1.0861>,<3.6|1.07799>,<3.7|1.06679>,<3.8|1.05413>,<3.9|1.03723>,<4|1.02005>>): L:=Matrix(<<3|.85873>,<3.1|.86289>,<3.2|.86135>,<3.3|.85523>,<3.4|.84577>,<3.5|.83212>,<3.6|.81805>,<3.7|.80035>,<3.8|.78349>,<3.9|.76348>,<4|.74318>>): high:=spline([seq(H[i,1],i=1..11)],[seq(H[i,2],i=1..11)],x,3): low:=spline([seq(L[i,1],i=1..11)],[seq(L[i,2],i=1..11)],x,3): f:=spline([seq(M[i,1],i=1..10)],[seq(M[i,2],i=1..10)],x,3): new:=(high*(subs(x=y,f)-eval(f,x=.35))+low*(eval(f,x=1.5)- subs(x=y,f)))/(eval(f,x=1.5)-eval(f,x=.35)): for i from 1 by 1 to 15 do part[i]:=plot(eval(new,y=i/10),x=3..4); end do: > opt:=Vector(1000): > Y:=Vector(1000): > j:=0: for y from 0.23 by 0.01 to 1.5 do j:=j+1: Y[j]:=y: opt[j]:=fsolve(diff(new,x)=0,x=3..4); end do: unassign('y'): > optimized:=spline([seq(Y[i],i=1..128)],[seq(opt[i],i=1..128)],x,3): > optk:=spline([seq(Y[i],i=1..128)],[seq(eval(subs(y=Y[i],x=opt[i],new)),i=1..128)],x,3): > > getr:=proc(a) eval(subs(x=a,optimized)); end proc: > getk:=proc(a) eval(subs(x=a,optk)); end proc: > getrhofromk:=proc(a) fsolve(optk=a,x=0.1..1.5); end proc:
54

LIST OF REFERENCES
1. Anghaie S, Knight T-W: Status of Advance Carbide Fuels: Past, Present, and Future (p. 852-856). Proceedings of the Space Technology and Applications International Forum (STAIF), ed. M. S. El-Genk, AIP Conf. Proceedings, 608, AIP, New York, 2002.
2. Youchison D-L, Lenard R-X, Williams B-E, Anghaie S: 2005: Development of a Tricarbide Foam Fuel Matrix for Nuclear Propulsion. Proceedings of the space nuclear conference, 2005.
3. Lenard R-X, Youchison D-L: Analysis of a Reticulated Vitreous Foam Nuclear Thermal Rocket Reactor Core. Proceedings of the space nuclear conference, 2005.
4. X-5 Monte Carlo Team: MCNP – A General Monte Carlo N-Particle Transport Code, Version 5. Los Alamos National Lab, Los Alamos, NM, 2003.
5. MONTEBURNS 2.0 An Automated, Multi-Step Monte Carlo Burnup Code System. Los Alamos National Laboratory, Los Alamos, NM, 2003.
55

BIOGRAPHICAL SKETCH
Eddy Perez Cardentey was born in Cuba on January 2nd,1980. After migrating to
the United States on February 2nd, 1995 he enrolled in the International Baccalaureate
(IB) program at Suncoast Community High School in Riviera Beach, Florida. He
graduated 2 years later with an International Baccalaureate diploma, and an Advanced
Placement diploma. He attended the University of Florida since 1997, where he obtained
a Bachelor of Science in Nuclear Engineering in December 2002 and a Master of Science
in August 2005.
56