new annual report 2017–18 - (cw)-creative partnerships australia · 2019. 12. 19. · australian...
TRANSCRIPT

Financial Report 01
Annual Report 2017–18

02 Annual Report 2017–18
Chamber Made, PERMISSION TO SPEAK, Photo: Pier Carthew

01
02 Section 1: Our Purpose
04 Who we are and what we do
05 Our Goals
06 From our Chair
07 From our CEO
08 Section 2: Our Performance
09 Our year at a glance
10 Australian Cultural Fund
14 Our Funding Programs
15 Plus1
18 MATCH
21 ACF Boost
24 Coaching, Mentoring and Presentations
27 Sector Development and Events
31 Research, Trends and Insights into Private Giving
32 Creative Partnerships Awards
33 Section 3: Management and Accountability
34 Company Structure
34 Corporate Governance
34 Audit and Risk Committee
34 Risk Management
35 Financial Management
35 Organisation Chart
35 Locations
36 Reporting Compliance Index
37 Financial Report
Contents
Front cover: Lewis Major Photo: Ren-Haur Liu

02 Annual Report 2016–17
1Our Purpose
02 Annual Report 2017–18
Melbourne Fringe Photo: Melbourne Fringe

03Section 1
Our purpose is to foster a culture of private giving to the arts to build a more sustainable, vibrant and ambitious cultural
sector for all Australians.
03Section 1: Our Purpose

Our purpose is to foster a culture of private giving to the arts.
What do we mean by private giving? Simply, funding from private sector sources, such as donors, philanthropists, trusts, foundations, or corporate support, whether financial, in-kind or other forms of partnerships.
We support artists and arts organisations to develop fundraising skills, build relationships with donors, philanthropists and business and find diverse, innovative and collaborative ways to fund their practice.
We invest in the professional and business development of the cultural sector; work with philanthropists and business to facilitate, celebrate and champion arts partnerships and investment; and deliver matched funding programs for artists and arts organisations.
We also administer the Australian Cultural Fund, a fundraising platform for Australian artists and arts organisations that facilitates tax-deductible donations to the arts.
Who we are and what we do
Blindful by Abbie Madden
04 Annual Report 2017–18

Financial Report 05
We achieve these by focusing on five key areas
AdvocacyBuild philanthropic and business sentiment around the value of supporting the arts
Providing ExpertiseBe an informed and influential source of expertise about private giving to the arts
Building CapacityBuild the development and fundraising skills and capabilities of artists and arts organisations
PartneringFacilitate and incentivise financial and in-kind support for artists and arts organisations from donors and business
Demonstrating ValueBe an efficient and effective organisation, providing high quality programs and services that are valued by the cultural sector and other stakeholders
Our goals1.Grow the culture of giving and volunteering to support the arts, bringing donors, businesses, artists and arts organisations together
2 .Assist Australian artists and arts organisations to attract and maintain support from donors and business, diversifying their sources of revenue
3.Encourage and celebrate innovation and excellence in giving to and partnerships with the arts.
05Section 1: Our Purpose

06 Annual Report 2017–18
On behalf of the Creative Partnerships Board, it is my pleasure to present to you the 2017-18 Annual Report.
It’s been another great year for Creative Partnerships as we continue to support the arts and cultural sector through our matched funding programs, sector development, coaching and mentoring activities, our successful fundraising platform and an increasing digital presence.
I’m pleased to report that Creative Partnerships delivered more than $4.56 million into the sector through our matched funding programs and the grants we provided to artists from donations made to the Australian Cultural Fund.
The many success stories that can be seen through these programs show what can be achieved when the arts sector works to build strong relationships with individuals and businesses.
In December 2017 the Australian Government announced the continuation of funding for Creative Partnerships. This ongoing support acknowledges the important work we do to foster partnerships between the cultural and private sectors and enables us to plan ambitiously and confidently for the future.
It also acknowledges that private sector support, alongside government funding and earned income, is a crucial and growing third pillar underpinning the financial sustainability of the arts sector in Australia.
We thank the Australian Government, in particular Senator the Hon. Mitch Fifield, Minister for Communications and the Arts and the Department of Communications and the Arts for their continued support of Creative Partnerships and the Australian arts sector.
This is my final annual report as the Chair of Creative Partnerships Australia, and it has been my privilege and pleasure to serve this organisation over the past six years.
I thank my fellow Board members for their valuable guidance and skills in steering the organisation into such a strong and well-regarded position. Just like the organisations we support and serve, Creative Partnerships benefits when it collaborates with like-minded organisations and people to achieve our goals. I’d like to acknowledge our close association with the Australia Council and its Chair, Rupert Myer AO, who has also served enthusiastically and skillfully on our board.
I would like to thank CEO Fiona Menzies for her conscientious leadership, advocacy for the arts and knowledge she brings to the role; and Creative Partnerships staff for their energy and efforts to ensure the continued success of the sector. I’ve no doubt the organisation is well-placed to lead and support the Australian arts sector into a bright future.
We know that partnerships between the arts and private sector are a win-win for society, business, and communities. As competition for government funding at all levels continues to grow, it’s imperative that we all work together in new and innovative ways.
Finally, I would like to acknowledge the strong support the sector already receives from trusts and foundations, individual donors, philanthropists and the business sector, all of whom understand that a sustainable, vibrant and risk-taking sector needs enduring support.
A message from our Chair Carol Schwartz, AM
Carol Schwartz AM Chair

07
2017-18 has been a great year for Creative Partnerships, one of consolidation and growth that has seen the culmination of four full years of operation and our mission to foster, support and celebrate partnerships between the arts and private sector.
Over the past 12 months the Board and staff of Creative Partnerships have undertaken a strategic planning process that will see us deliver a new corporate plan with ambitious goals to consolidate our position as the authority on private sector support for the arts in Australia.
The Australian Cultural Fund continues to go from strength to strength. A total of 614 artists and arts organisations registered a campaign this year and more than $3.54 million was received from donors – both record numbers for the platform since it was established in 2003.
Through our matched funding programs Plus1 and MATCH Lab, we were able to assist with grants of more than $1.53 million to 72 organisations, artists and artistic groups – an excellent result. Through their fundraising efforts and the leverage incentive of matched funding, more than $3.7 million was invested into the arts sector through these programs.
In April 2018 we launched ACF Boost, a matched funding initiative for first-time users of the Australian Cultural Fund. The 42 Australian artists and arts organisations accepted into ACF Boost have raised more than $171,000 for a diverse range of projects. With our matched funding of $83,421 an additional $254,524 has been invested into the sector.
Our state managers continued to provide bespoke and one-on-one advice to arts companies around Australia, working to strengthen the professional development of individuals within arts organisations, the fundraising strategies of companies and their boards, and the sustainability of the arts fundraising profession. They delivered more than 661 coaching and mentoring sessions with 460 arts organisations and artists nationally.
We continue to host and support a range of events to give artists, arts organisations and their boards access to thought leaders, experts, global best practice and networking opportunities.
I’d like to thank the Australian Government for their commitment to continued funding for Creative Partnerships, in particular Senator the Hon. Mitch Fifield, Minister for Communications and the Arts and the Department of Communications and the Arts.
I’d like to thank our Board Chair Carol Schwartz AM for her unwavering support and guidance. She has truly steered Creative Partnerships from exciting beginnings to the respected and dynamic organisation it has become.
I’d also like to acknowledge the members of our board, all of whom bring valuable skills to the organisation and the passionate and talented Creative Partnerships staff. The successes of 2017-18 would not have been possible without them.
Lastly, as always, I’d like to thank and acknowledge Australian artists and arts organisations, and the donors, philanthropists and businesses that support them. The breadth and diversity of their partnerships is impressive and worth celebrating.
A thriving arts community creates and sustains a society we all want to live in – curious, authentic, and creative. We thank you for working together to create great outcomes, for your efforts and your energy, and for your contribution to our lives and to society.
A message from our CEO Fiona Menzies
Fiona Menzies CEO
Section 1: Our Purpose

08 Annual Report 2017–18
2Our Performance
Lewis Major Glasshouses by James Williams
08 Annual Report 2017–18

09
Our year at a glance
1 major event sponsored for arts fundraising
professionals
12 arts professionals mentored by leaders in arts fundraising
and philanthropy through our Arts Fundraising Mentorship
Program
23 professional development events delivered
around Australia
More than $3.29 million invested into the arts sector
through Plus1
More than $4.56 million granted to arts organisations, independent artists and groups
through matched funding programs and the Australian
Cultural Fund
614 artists and arts organisations registered
a campaign on the Australian Cultural Fund
More than $3.54 million donated
to the Australian Cultural Fund
More than $449,000 invested into the arts sector through
MATCH Lab
More than 660 coaching and mentoring sessions held
with arts organisations around Australia
Section 2: Our Performance
10 Annual Report 2017–18
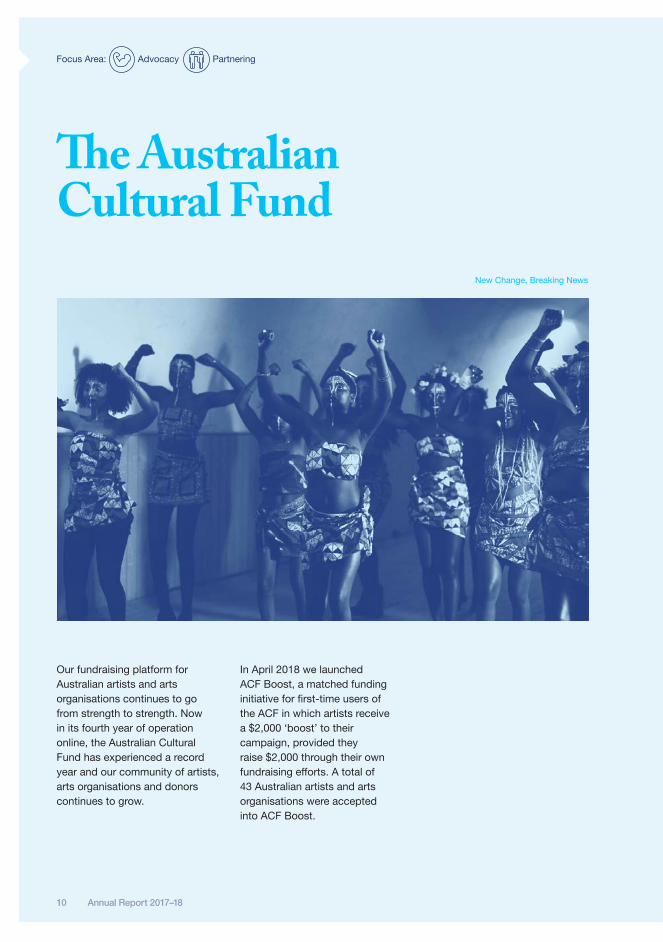
Our fundraising platform for Australian artists and arts organisations continues to go from strength to strength. Now in its fourth year of operation online, the Australian Cultural Fund has experienced a record year and our community of artists, arts organisations and donors continues to grow.
In April 2018 we launched ACF Boost, a matched funding initiative for first-time users of the ACF in which artists receive a $2,000 ‘boost’ to their campaign, provided they raise $2,000 through their own fundraising efforts. A total of 43 Australian artists and arts organisations were accepted into ACF Boost.
The Australian Cultural Fund
Focus Area: Advocacy Partnering
New Change, Breaking News

Financial Report 11
TOMGIRL is a short film that celebrates Filipino and Bakla culture in Western Sydney. Written and directed by Vonne Patiag, the film offers a slice-of-life look at the Filipino community of Australia and features diverse cast and creatives that speak to the authentic experiences of migrants and people of colour in Australia.
Vonne knew that fundraising for TOMGIRL would involve reaching out to his local Filipino community, local cultural leaders and creative friends. He created a visually rich campaign on the Australian Cultural Fund, using pitch videos and imagery that could be easily shared to social media while teasing the film. Through visual marketing and community networking he was able to raise more than $6,000 from 56 donors.
“It’s been very well received, with many viewers in Western Sydney and throughout Australia commenting on how ‘Filipino’ it is, which is such a blessing as Filipino culture is quite hard to pinpoint. I’m glad the project spoke to a level of authenticity,” said Vonne.
Vonnie Patiag, TOMGIRL Photo: Christina Mishell.
11Section 2: Our Performance
ACF case study: Vonne Patiag

12 Annual Report 2017–18
Our artistsThis year 614 artists and arts organisations around Australia registered campaigns with the ACF and their supporters donated a record $3,546,260 – the most ever received in a financial year, an increase of more than 32% on the previous year and well above our target of $2.8 million.
This fantastic result demonstrates the value of the ACF as both a fundraising platform and a means of facilitating larger donations from philanthropists, trusts and foundations.
Increase in ACF campaigns registered since 2014-15
Campaigns completed: 606 (up 50% over last year)
Average $ raised by each campaign
$5,559 (down 18% over last year)
Highest $ raised by a single campaign:
$146,308 (up 1.2% over last year)
We encourage artists and arts organisations to build long-term relationships with their donors. This year close to 90% of artists who completed an acquittal reported continued engagement with their supporters following the completion of their campaigns, demonstrating artists’ growing understanding of the value of donor stewardship.
Our donors A total of 9,807 art lovers, philanthropists, trusts and foundations donated to ACF artists and arts organisations this year. The volume of donations also increased by 15% to 10,969.
This investment in our arts sector brings the total value of donations to more than $10.7 million since the platform launched online in 2015, and more than $23 million since the fund was established in 2003.
Average donations per campaign: 18Donations over $10K
70Single biggest donation:
$140,000A total of 1,117 donors returned to the ACF to donate this year, demonstrating the ongoing relationships artists have built with their supporters, and an increase in awareness of the ACF platform as a tool for facilitating tax-deductible donations for the arts.
Focus Area: Advocacy Partnering
200
300
400
500
600
700
800
17/1816/1715/1614/15
1,500,000
2,000,000
2,500,000
3,000,000
3,500,000
4,000,000
17/1816/1715/1614/15
230
318
452
614
$1,958,111
$2,631,794
$2,677,663
$3,546,260
200
300
400
500
600
700
800
17/1816/1715/1614/15
1,500,000
2,000,000
2,500,000
3,000,000
3,500,000
4,000,000
17/1816/1715/1614/15
230
318
452
614
$1,958,111
$2,631,794
$2,677,663
$3,546,260

Financial Report 13
Musicians Lizzie O’Keefe and Linsey Pollak’s second album, Dangerous Song — Blue, combines the human voice with the sounds of endangered and extinct animals to create an intriguing and moving musical performance and a tool to convey important environmental messages.
Using the Australian Cultural Fund for the second time, the duo’s campaign comprised targeted emails, social media and live performances to speak to their established audience and find new supporters.
“Everyone knows that pushing a fundraising campaign can be hard work,” said Lizzie.
“But because we felt so passionate about the cause, it made it very easy to push.”
Lizzie and Linsey raised $5,000, hitting their target, to record, mix and master the music, and print their album artwork. This year they’re continuing their mission to educate people on single-use plastic and its effect on our oceans and have started their third ACF campaign.
Lizzie O’Keefe and Linsey Pollak
Making culture happen
13Section 2: Our Performance
The ACF online community is active and growing, and our ongoing digital strategy continues to build artist and donor engagement with the ACF. Web traffic has increased by 57% over the previous year, with the site receiving 588,984 views from 142,244 users.
The majority (42%) of traffic to the site is via social media channels, indicating the importance of platforms such as Facebook, Instagram and Twitter in promoting fundraising campaigns.
Organic search (visitors coming from a search engine such as google) has increased by 81% this year, indicating that our ongoing effort to boost search engine optimisation is having an impact. Subscribers to ACF News has climbed to more than 7,260 in the two years since launch and we maintain a higher than industry average engagement rate.
Our artist dashboard, a real-time analytics tool to give ACF users greater insight into their fundraising outcomes and allow them to easily engage with their donors, remains the most viewed area on the site after the homepage, with time spent within the dashboard almost doubling, and increase in pageviews of 102% to 48,518.
Access to tailor-made content on fundraising, campaign planning and budgeting, as well as artist and donor profiles that showcase successful campaigns and passionate supporters of the arts, continues to be a key drawcard of the ACF. Our blog is one of the most viewed areas of the site, with 17,717 views this year – an increase of almost 40% – and the 33 resources developed and published this year have been shared by and between artists and arts organisations.
ACF case study: Lizzie O’Keefe and Linsey Pollak

Our matched funding programs reward good strategy, creative thinking and success in fundraising, and help independent artists and small to medium arts organisations to boost their fundraising skills, secure new donors and partners, and strengthen their networks.
By matching funds secured through the fundraising efforts of artists and arts organisations, we’re supporting the sector to diversify and increase their revenue, achieve their artistic goals, create new work for national and international audiences to enjoy, and become more robust and sustainable.
Our Funding Programs
Focus Area: Partnering
Co3 Photo: Toni Wilkinson
14 Annual Report 2017–18

15
Plus 1 is our matched funding program designed to boost the fundraising efforts of small to medium arts and cultural organisations.
A total of 48 arts organisations raised $1,949,748 through their Plus1 fundraising campaigns this year for a range of projects and artforms, from contemporary Indigenous craft projects and chamber music to community radio station repairs and winter arts festivals. With our contribution of $1,348,510 in matched funding (up from $1,164,500 in 2016-17), a total of $3,298,259 was invested into the arts and cultural sector.
One of Plus1’s key objectives is to encourage and support arts organisations to attract new donors and create ongoing relationships with their supporters. This year, arts organisations raised an average of $40,619 per campaign and secured a total of 2,688 donors to support their campaigns. Of those, 53% were new donors, for an average of 29 new donors per campaign.
Matched funding can be a powerful incentive for supporters to give. With assistance from Plus1, more than 87% of this year’s recipients met or exceeded their fundraising target by an average of $11,537 per campaign. We also increased our leverage impact, with Plus1 organisations raising $1.45 for every $1 matched by us, up from $1.31 in 2016-17.
48 fundraisers
2,688 donors
$1.95 million raised:
$1.34 million matched by US
more than
$3.29 million Total $ invested:
Polyglot, Tangle Photo: Wendy KimptonPlus1
Section 2: Our Performance

16 Annual Report 2017–18
Plus1 case study: The Last Great Hunt The Last Great Hunt is a collective of six Perth-based theatre makers who create theatre in a variety of forms and styles. This year they participated in Plus1 to raise funds for their Local Adventures campaign, which supported the presentation of three new works.
With a target of $30,000, the campaign comprised two primary elements: a general campaign aimed at existing supporters and the general public, and a more targeted campaign that involved launching their first exclusive donor circle.
The collective used a mix of targeted asks and social media marketing which resulted in more than 50 donations from a range of supporters. “We had new donors come on board because they saw the value of our company and our work to the depth and diversity of Perth’s cultural offerings,” said Development Manager Andrew Baker.
The campaign was a success, the team raised their target and with our matched funding of $30,000, the collective was able to present the new works and gain greater exposure within the Australian theatre sector.
Our Funding Programs Focus Area: Partnering
The Last Great Hunt

Financial Report 17
Our Plus1 program funds arts organisations on the strength of their fundraising strategy and their capacity to secure and retain new donors and partners. Since 2014-15 we have supported more than 170 arts organisations around Australia to deliver artistic work for audiences to enjoy or an initiative to boost their fundraising or organisational capacity.
We support our funding recipients from the early stages of campaign development and implementation through to final delivery of their project or activity, which may take several years to complete. In 2017-18, 38 arts organisations around Australia launched a project or activity that was funded in a previous round of Plus1.
Through their fundraising efforts, the generosity of their supporters and the matched funding they received from us, these organisations were able to deliver projects to attract new audiences, build awareness of their work and build their long-term sustainability.
The long-term impact of Plus1
Plus1 case study: Gondwana ChoirsGondwana Choirs uses choir performance to shape Australian sound through the creation of innovative works. As Plus1 recipients in 2016-17, last year Gondwana raised $25,000 to fund world-class training and international touring.
The NSW-based choir has continued to develop its fundraising strategy this year, bringing a whole-of-organisation approach to ensure lasting growth and success, while increasing the opportunity to engage with donors.
Development and Communications Manager Francis Geep explained:
“It starts with changing the mindset of being a small-to-medium company as a disadvantage to being advantageous, with direct contact with donors, direct contact with the CEO and the Board and no working in a smaller team.”
Among the choir’s recent successes was the Vienna Project, in which children’s choir travelled to Vienna to rehearse with the Vienna Boys Choir for the first time. As a recipient of our Arts Fundraising Mentorship Program for 2017-18, Gondwana is working with a mentor to build on the choir’s long-term development strategies.
Gondwana Choir Photo: Robert Catto
17Section 2: Our Performance

18 Annual Report 2017–18
MATCH Lab is our matched funding and professional development program for independent artists and groups, designed to supports artists to build their fundraising skills, increase their knowledge of arts business, philanthropy and partnerships and create sustainable sources of revenue for their work.
The artists accepted into MATCH Lab this year participated in Raising Money for your Art, a two-day professional development and fundraising clinic held in January 2018.
Armed with new skills and knowledge, 24 MATCH Lab artists developed their fundraising strategies, launched their campaigns and raised $268,078 from 1,281 donors by 30 June. With matched funding of $181,817 from us, a total of $449,895 was invested into the arts sector.
Our Funding Programs Focus Area: Partnering
House of Sand — Welcome to the Bright World
MATCH Lab24 fundraisers
1,281 donors
$268,078 raised
$181,817 matched by US
$449,895 Total invested

19Section 1
MATCH Lab case study: Stuart Rose South Australian based contemporary folk, jazz, blues and world musician Stuart Rose is a multi-instrumentalist dedicated to improving his practice. He participated in MATCH Lab this year to raise funds to tour his album internationally and take part in artist workshops in New York.
Stuart used the ACF to fundraise and found that offering tax-deductible donations was a great incentive for his supporters. His strategy focused on digital marketing for a brief but dynamic 30-day campaign and highlighting the importance of patronage on an artist’s sustainability and growth.
Stuart exceeded his target, raising $3,175, and with matched funding from us is able to cover flights, accommodation and tuition fees for sessions with his guitar mentor in Brooklyn.
“I was able to reach the target in three weeks through some good planning and pitching my project to people,” said Stuart. “It was hair-raising running a 30-day campaign. Honing my pitch at the Match Lab Clinic certainly proved to be effective – two new businesses came on board and a very supportive private donor gave $2,000!”
Stuart Rose
19Section 2: Our Performance

20 Annual Report 2017–18
MATCH Lab case study: Helen ThompsonClassical musician Helen Thompson had a lofty goal – to become Tasmania’s first resident violone player and bring a valuable skill set into the state’s cultural sector. Helen participated in Match Lab in 2016-17 and used the ACF to raise funds to purchase the violone.
Her campaign strategy was underpinned by solid research on her target donors and a commitment to confident and audacious requests. On day three of her campaign Helen had met her target of $2,500, going on to raise $2,824.
Our Funding Programs Focus Area: Partnering
Helen has since composed and performed A Tasmanian Requiem, a groundbreaking cross-cultural collaboration between Tasmanian Aboriginal and non-Aboriginal creatives, whose theme is the legacy of the Black War and an opportunity to mourn and atone for the losses suffered. The musical project has gained widespread critical acclaim.
Plans are now in the pipeline to tour and record, as well as for a feature-length documentary which will outline the process of making the work. Helen has been asked to teach the Classical Vocal Ensemble at the University of Tasmania Conservatorium of Music and will perform a VIP gig for her supporters this August.
We support MATCH recipients from the early stages of campaign development and implementation through to final delivery of their project, which may be several years in the making.
Many of last year’s MATCH Lab artists launched fundraising campaigns in this financial year, and through their fundraising efforts and matched funding from us, these independent artists were able to create new projects and build their careers. Our 2016-17 intake raised $254,809 from 2,130 donors and received $216,583 in matched funding from us.
The long-term impact of MATCH
Helen Thompson

In April 2018 we launched ACF Boost, a new matched funding initiative for first-time users of the Australian Cultural Fund, offered through our Plus1 matched funding program.
Designed to help artists secure new supporters and run a strong fundraising campaign, the initiative gave new members of the ACF artist community the opportunity to receive a $2,000 ‘boost’ to their campaign, provided they raised $2,000 through their own fundraising efforts.
ACF Boost generated more than 240 new registrations on the platform, and 42 artists and arts organisations took part in the initiative from 140 applications from around Australia.
As of 30 June, ACF Boost recipients raised $171,103 from 912 supporters for a diverse range of projects, from an online magazine, web series and symphony orchestra to a dance residency and graphic novel. With our matched funding of $83,421 an additional $254,524 has been invested into the arts sector.
42 fundraisers
912 donors
$171,103 raised
$83,421 matched by US
$254,524 Total invested
ACF Boost
Sisters Unearthly — Vexatious Films Focus Area: Advocacy
21Section 2: Our Performance
ACF Boost case study: Vexatious Films
Sisters Unearthly by Vexatious Films is a web series set against a backdrop of the Tasmanian landscape. As an ACF Boost recipient, Vexatious Films’ screenwriter Claire d’Este and director Rebecca Thompson ran a fundraising campaign to develop and produce the series.
The pair dedicated themselves to social media, crafting teaser videos and posting daily messages to thank their donors. As committed supporters of the Tasmanian filmmaking community, they found many of their peers were keen to return the favour.
“I know people donated specifically to help us get over the line (for matched funding), and it definitely gave donors the sense that their money was going further. It gives artists a great argument as to why people should donate to their campaign. It certainly worked that way for us, and it gave us a credibility that we wouldn’t otherwise have had,” Claire said.
Vexatious Films exceeded their fundraising target and raised $2,733. With the $2,000 boost from us, the pair can fund costumes, props, fuel and food for the cast and crew. “We went from no-one knowing about our project to having over 60 people personally invested in the project. It has given us momentum and a sense of responsibility.”

22 Annual Report 2017–18
ACF Boost case study: Black Hole TheatreBlack Hole Theatre’s The Line is a collaboration between First Peoples of Australia, Irish artists, and non-indigenous Australians. The performance, set against the backdrop of the infamous Black Wars in 19th Century Tasmania, was to take place in Hobart, an expensive undertaking, so when the opportunity arose to apply for ACF Boost, the team jumped at the chance.
Our Funding Programs Focus Area: Partnering
The focus of their campaign was a clear and compelling ask – to bring all the First Peoples and international artists to Tasmania to perform. “We chose to make the campaign short and sweet; only one month. That way we could lift the intensity of our requests,” said Artistic Director Nancy Black.
The Line — Black Hole Theatre
The Victorian-based theatre company raised over $12,000 from 50 individual supporters and received a $2,000 boost to their project from us. The funds will pay artist wages, international travel and accommodation costs for the cast and crew, with performances starting in July 2018.

Our new mentorship program offers arts organisations a capacity-building opportunity to work one-on-one with an experienced arts fundraiser. In its inaugural year, the program has matched 12 organisations with expert fundraisers from around Australia, to work together over 10 months to set organisational fundraising goals while developing skills, methodology and strategy.
In May we brought together the mentees and mentors for a two-day workshop in Melbourne to explore common challenges and opportunities facing arts organisations, and to give mentees an opportunity to discuss the fundraising and development issues facing their organisations. The group formed a solid bond and built relationships that will help them with their fundraising well into the future.
“Working closely with my mentor has enabled me to develop a range of skills that will assist me to deliver on multiple fundraising strategies for Linden New Art. The two-day workshop with all the mentors and mentees from around Australia also provided invaluable networking opportunities and advice from experts in the field.” Lyn Johnson Development Manager at Linden New Art, mentored by Tehmi Sukhla, Director of Development at Australian Museum.
“Having the opportunity to be included in the mentorship program has been a most fulfilling and purposeful experience. My mentor’s experience and knowledge of arts fundraising has been exceptionally worthwhile in developing and increasing our organisation’s fundraising strategy.”
Justine Heywood Business Development Officer at Murray Art Museum Albury, mentored by Caroline Sharpen, Creative Industries Consultant
“The mentorship has been invaluable on several levels. On a practical level, we are learning about the nuts and bolts of fundraising. Most importantly, on an organisational level I can see a collective shift in mindset happening towards fundraising – we have taken a step towards our goal defined at the outset: to have an organisation that supports and participates in fundraising activity with energy and enthusiasm.”
Emma Keenan Partnerships Manager at Byron Writers Festival, mentored by Janine Collins, Cultural Strategist.
Arts Fundraising Mentorship program
Focus Area: Advocacy
23Section 2: Our Performance

Our state managers provide bespoke and one-on-one advice to arts companies around Australia, working to strengthen the professional development of individuals within arts organisations, the fundraising strategies of companies and their boards, and the sustainability of the arts fundraising profession.
Coaching and mentoring evaluates and supports fundraising readiness including board and staff capacity, resourcing, and fundraising goals of the organisation; the nature of their supporters and potential revenue sources; the potential for business partnerships and the prospecting process, demonstrating impact for philanthropic support; and relationship development with current and potential donors, the community and partners.
A total of 661 coaching and mentoring sessions with 460 individual artists and arts organisations took place nationally, with a focus on small-to-medium companies with a range of challenges; from practical fundraising planning and advice, to assisting them to articulate the impact of their work to the broader community and grow their supporter base.
Companies that participated in state-based coaching and mentoring this year include: Jam Factory (SA) • Guildhouse (SA) • Adelaide Central School of Art (SA) • The Last Great Hunt (WA) • Yirra Yaakin Theatre Company (WA) • Theatre Kimberley (WA) • Craft ACT Craft and Design Centre (ACT) • Salamanca Arts Centre (TAS) • Canberra International Music Festival (ACT) • M16 Gallery (ACT) • The House that Dan Built (NSW) • Operantics (NSW) • Australian Centre for Photography (NSW) • Watch This Space (NT) • Tactile Arts (NT) • North Home (NT) • Tasmanian Symphony (Tas) • Melbourne International Jazz Festival (VIC) • West Space (VIC) • Castlemaine State Festival (VIC) • The Boite (VIC) • Jute Theatre Company (QLD) • Metro Arts (QLD) • 4MBS Radio (QLD). Island Magazine (TAS).
Coaching and mentoring
Our Funding Programs Focus Area: Providing Expertise Building Capacity
24 Annual Report 2017–18

Focus Area: Providing Expertise Building Capacity
Brisbane Festival — En Masse
Brisbane Festival is a Queensland institution and a highlight of Australia’s festival calendar. The team produces a program of events that explodes across the city and needs a steady flow of donations and philanthropic support to ensure it continues to grow its audiences.
Obtaining deductible gift recipient (DGR) status and securing Plus1 matched funding in 2015 – which helped to employ a philanthropy manager – kickstarted the festival’s giving program.
The festival set a humble income target in its first year and doubled its targets each year. An initial coaching and mentoring session with Acting State Manager Steven Richardson in early 2018 focused on reviewing the festival’s current philanthropic state of play and exploring strategies for future growth.
At a follow-up session Steven met with the festival’s Giving Committee, a group of passionate philanthropists and arts lovers, to present tailored advice on the program’s strategic direction, strengths, weaknesses and opportunities.
Philanthropy Manager Fabienne Cooke said working with Creative Partnerships affirmed the committee’s belief that relationships, collaboration and persistence pays off. “Being a relatively small and young giving program, Steven’s suggestions for future directions and strategy focus areas were all very well received.”
In the months since the coaching and mentoring sessions, Brisbane Festival has continued to achieve its increasingly ambitious philanthropic goals and almost reached its full 2018 target in the first six months of the year.
“We rely on a strong, relationship-building approach to increase the number of donors and value of donations. We have an effective model for philanthropy events where…we highlight a different area of Brisbane Festival programming that needs the support of donors at each of our functions,” Fabienne explained.
“In booking the coaching and mentoring service we were booking an appointment with an expert and hoping to ensure that we were on the right track, almost like a check-up with a GP.”
Case Study: Brisbane Festival
25Section 2: Our Performance

26 Annual Report 2017–18
Case Study: Restless Dance Theatre
Our State Manager for Western Australia and South Australia has been mentoring Restless Dance Theatre since 2016. The theatre was at a significant time in their history with the success of their work Intimate Space and the highly-anticipated Zizanie, directed by Meryl Tankard, set to premiere in 2019. They were on the cusp of rapid growth and increased demand.
Goals to tour nationally and internationally created the need for additional revenue sources, and a compelling case for support. The team developed a donor program for regular giving and major gifts, and fostered relationships with philanthropic trusts and foundations.
With the support and guidance of our coaching and mentoring service, the program was a success, with Perpetual Philanthropy and the James and Diana Ramsay Foundation providing Restless with a combined $214,000 for capacity building, project and touring, and artistic development and leadership support.
A multi-level fundraising campaign followed, and with matched funding provided by two of their private donors, the theatre raised $50,000. Building on that success, they successfully applied for Plus1 matched funding and developed the Restless Goes Global campaign, growing their private giving to more than $110,000 in 2018 and exceeding their target.
Belinda Hellyer, Restless Theatre Development Manager, said State Manager James Boyd was instrumental to their success.
“Seeing the potential of our company, he guided me to shoot higher and create a strategy using our existing programs to reach donors. We broke down each step in donor cultivation and our relationships have developed. The mentoring fine-tuned my thoughts about the power of leverage and match funding, validated our story of artistic excellence and gave us the skills and resources to develop our culture of asking for support. Restless reached a turning point.”
Caitlin Moloney and Chris Dyke, Restless Dance Theatre Photo: Shane Reid
Adelaide Theatre and More Social Club committee member and supporter of Restless Dance, Jean Durran Hancock OAM, said the club was impressed and excited by what Restless had achieved with young people with disability over the past few years. “We were committed to supporting Restless Dance Theatre after seeing their premises, staff commitment and aspirations and viewing the confidence and opportunities they inspire in young people with disabilities.”
Focus Area: Providing Expertise Building Capacity

Section 2: Our Performance 27
We host and support a range of professional development events to give artists, arts organisations and their boards access to expertise and best practice from Australia and internationally, and the chance to network with and learn from their peers.
Our sector development strategy aims to contribute to a more knowledgeable, confident and stable arts fundraising profession, building the overall development and fundraising capacity of the sector.
Sector Development
This year, our staff presented at 26 peak industry sector events, forums and conferences; and convened and facilitated networking activities with CEOs, chairs, fundraising staff and guests from the local philanthropic community.
We held 1 webinar and 22 workshops and masterclasses around the country, attended by 432 organisations and 612 individuals. We exceeded our capacity target, achieving an average of 87% capacity for all our hosted events.
Our partnership with arts fundraising conference Culture Business enabled a further 176 arts professionals to engage with thought leaders and experts bringing the total number of participants in our sector development events to 788.
Rafael Karlen by Dave Collins

28 Annual Report 2017–18
Our events
Major Gifts | Masterclass Interactive masterclasses about incorporating major gifts into organisational fundraising strategy, presented by senior consultants Ann Badger and Clare Pullar of award-winning international fundraising consultancy Marts & Lundy.
Where: Perth, Brisbane, Melbourne, Sydney and Adelaide Attendees: 105
Fundraising through Bequests and Planned Giving | WebinarOur first webinar, on the theory and practice of planning and operating an effective bequests and planned giving program, with leading bequests expert Kenneth W Park.
Attendees: 107
Fundamentals of Fundraising | WorkshopAustralia-wide workshops on the foundations and principles of arts philanthropy and sponsorship, presented by our state managers
Where: Adelaide, Alice Springs, Canberra, Hobart, Melbourne, Perth and Sydney Attendees: 104
In Conversation with Frankie Airey | WorkshopAustralia-wide workshops on how to inspire donors and corporate partners, build a whole-of-organisation fundraising strategy and cultivate relationships, with strategic arts fundraising expert Frankie Airey. These events comprised two tailored sessions – one for general managers, executive directors and fundraising and development staff; and one for board members.
Where: Brisbane, Melbourne, Perth and Sydney Attendees: 255
Sustainability through Philanthropy | WorkshopA workshop for Northern Territory arts organisations and artists on the key success factors, processes and systems required to build sustainable, long-term philanthropic programs, led by strategic fundraising expert Serhat Abdurazak. This event comprised two tailored sessions
– one for staff in development and fundraising roles and one for senior executives, general managers and board members.
Where: Darwin Attendees: 28
Arts and Business Partnerships | WorkshopA half-day workshop on the strategies and partnership models organisations can implement to secure mutually beneficial, long-term partnerships with the local business community, led by leading cultural strategist Janine Collins.
Where: Darwin Attendees: 13

29
Our partnerships
We love collaborating with like-minded organisations to give artists and arts organisations access to the best expertise, knowledge, resources and content from around the world.
Our partnership strategy for 2017-18 focused on exploring best-practice fundraising strategy across all artforms, promoting awareness of the Australian Cultural Fund and increasing our reach across all art forms.
As principal partner of international arts fundraising conference, Culture Business Melbourne, held in July 2017, we brought the world’s best arts leaders together in Melbourne to talk fundraising, philanthropy, sponsorship and the long-term sustainability of the arts sector. Attended by more than 176 arts professionals, the conference’s program challenged participants to think creatively about the future of cultural centres and encourage them to take risks to conquer new markets. Speakers included Michelle Stein, Head of Major Gifts, British Museum; Sanjoy K Roy, Director, Teamwork Arts India, Alice van der Slikke, Manager Professional Services, Van Gogh Museum The Netherlands and Laura Sears, Head of Corporate Partnerships, V&A London.
As official partner of BIGSOUND, Australia’s leading new music festival and industry conference held in Brisbane’s Fortitude Valley in September 2017, we promoted awareness of the Australian Cultural Fund to more than 1,300 delegates and participated on a panel session about raising finance for music production and touring.
In November 2017 we partnered with Melbourne Music Week’s Face the Music industry conference and West Australian Music’s (WAM) WA Music Conference to further increase awareness of the Australian Cultural Fund, contribute to panel sessions on fundraising and investment from private sources and promote our coaching and mentoring service.
Section 2: Our Performance
Access Arts, Leaps and Bounds

30
Our digital and marketing strategyOur digital and marketing strategy focuses on delivering online resources and services to complement our live activities, responding to the online behaviours of our audience, upskilling a broad, diverse and growing arts sector and increasing awareness of Creative Partnerships and the Australian Cultural Fund among artists, arts organisations and their boards, donors, philanthropists and investors.
This year we continued to develop and commission resources that are valuable, engaging, evidence-based and responsive to the sector, publishing more than 60 tools and resources on the Creative Partnerships and Australian Cultural Fund websites, including guides, blog posts, fact sheets, case studies, profiles and videos.
Following the launch of our new Creative Partnerships website in May 2017 to give artists, arts organisations, art supporters and investors better access to resources and showcase the breadth of our programs and services, we’ve experienced steady growth in traffic. Pageviews have increased 17% to 169,831, with the majority of our users reaching us reach us via organic search. Traffic from social channels has increased by an impressive 122% to 3,611 users and direct traffic has increased by 50% to 7,057 users.
Email marketing continues to be an effective and engaging channel for communicating with our audiences, with 6,168 users (12% of total users) visiting our website via our newsletters and email campaigns. This year our Creative Partnerships subscriber base has increased by 22% to 9,685 subscribers.
VolunteeringBusiness professionals and individuals with specialised skills can strengthen arts organisations, helping them build their capacity to do what they do, better. Securing skilled volunteers is an effective way to engage talent that arts organisations might otherwise not afford.
We continue to advocate for skills-based volunteering and in 2017-18 met with a range of stakeholders who deliver skills-based volunteering programs for their staff, to raise awareness of the important role volunteers play in helping to boost both the skills of arts professionals and the capacity of these organisations as a whole.
We also developed online content for arts organisations to assist them to engage volunteers and include information on the benefits of volunteers in our fundamentals of arts fundraising workshops and through our coaching and mentoring service.
The volunteering landscape has evolved over the past four years, with private businesses taking ownership of these opportunities. Our role will be to continue to create awareness of how transformative skills-based volunteers can be to arts organisations, and to provide online resources to support art organisations to engage volunteers from the business community.
Focus Area: Providing Expertise Building Capacity
Annual Report 2017–18

This year we continued working on two major research projects to track trends in giving to the arts and assess the capacity of arts organisations and artists to secure private support.
Through our ‘data harmonisation’ we are working with Australian arts and cultural agencies to achieve consistent reporting of private sector income among government-funded arts organisations, with the long-term objective being to track support of this kind annually, giving the sector the ability to benchmark private giving across jurisdictions and artforms.
Research, trends and insights into private giving
In the interim we have developed a research survey to further our understanding of how arts and cultural organisations source private sector funding and to provide an estimate of support until data harmonisation is achieved. The survey will be distributed, and results presented in late 2018 to help the sector identify and implement successful strategies for securing funding from donors, philanthropists, trusts, foundations and businesses.
Focus Area: Advocacy Providing Expertise Building Capacity
Edward Campbell, Capper and Katzki Project Stage 2
In August 2017 Australian Major Performing Arts Group (AMPAG) released its annual survey on fundraising by major companies, prepared in partnership with us. The AMPAG Tracking changes in corporate sponsorship and donations report confirmed that revenue from donations, corporate sponsorship and fundraising events in Australia’s major performing arts sector grew by more than 15% in 2016 to a total of $95.7 million.
31Section 2: Our Performance

Focus Area: Advocacy
32 Annual Report 2017–18
The Creative Partnerships Awards celebrate outstanding contributions to Australia’s cultural life by leaders who, through example and vision, have put arts first; fostering enduring partnerships between the cultural and private sectors and encouraging the spirit of giving to the arts.
Nominations are open to the public, giving everyone working in the arts, philanthropic and business sectors an opportunity to nominate leaders and colleagues who deserve recognition for championing the arts.
We received 67 nominations from around Australia for this year’s awards, and the ceremony will be held in Sydney in August 2018.
Emerging Philanthropy Leadership Award For an individual new to the philanthropic sector (within the last five years) and whose leadership and contribution to the arts is shaping the future of philanthropy and private giving
Business Leadership Award For an individual working in the business sector who through their leadership, advocacy, practice and example has made an exceptional contribution to Australia’s cultural life by fostering increased investment and engagement between business and the arts.
Arts Leadership Award For an individual working in the arts and cultural sector who through their leadership, advocacy, practice and example has made an exceptional contribution to Australia’s cultural life; demonstrating vision, commercial acumen and strategic thinking in their engagement with donors and business and encouraging increased giving to the arts.
Philanthropy Leadership Award For an individual, family, group, foundation or other entity that through their leadership, advocacy, practice and example has contributed significantly to the arts and encouraged philanthropic giving to the arts.
Creative Partnerships Awards

33Section 1
3Management and Accountability
Lady Example by Mischa Baka
33Section 3: Management and Accountability

Company structure Creative Partnerships Australia is a business name of the Australia Business Arts Foundation (AbaF). AbaF is a not-for-profit company limited by guarantee, is wholly owned by the Commonwealth and is endorsed as a deductible gift recipient under Subdivision 30-BA of the Income Tax Assessment Act 1997.
AbaF is regulated by the Australian Charities and Not-for-profits Commission Act 2001 and the Corporations Act 2001. AbaF is also required to comply with the Public Governance, Performance and Accountability Act 2013 (PGPA Act), specifically Chapter 3, which sets out requirements for Commonwealth companies, in order that they meet public sector accountability standards.
AbaF is supported by the Australian Government through the Department of Communications and the Arts.
Corporate governance Creative Partnerships is overseen by a Board of Directors, appointed by the Minister for the Arts. The board is responsible to the Minister for the governance of Creative Partnerships. Creative Partnerships’ board members are Non-Executive Directors.
The Creative Partnerships Board provides strategic guidance to the company, ensures the effective oversight of management, and the accountability of Creative Partnerships to its stakeholders. The board also:
• endorses the annual budget, corporate plan and annual report
• reviews quarterly financial and performance reports
• approves expenditure that exceeds the approved authority authorisations
• undertakes annual reviews of the risk management framework
Board oversight is achieved through discussion and actions at quarterly board and sub-committee meetings, board-level strategy sessions and board participation in facilitated strategic planning workshops.
Creative Partnerships maintains a conflict register which is updated at each board meeting. A senior executive from the Department of Communications and the Arts attends board meetings as an observer.
Audit and Risk CommitteeThe Creative Partnerships Australia Board maintains an Audit and Risk sub-committee, in accordance with the PGPA Act. The Committee is guided by an Audit and Risk Committee Charter that specifies the role and responsibilities of the Committee.
The Charter is endorsed by the board and reviewed annually. The Audit and Risk Committee undertakes a performance self-assessment process on a periodic basis.
During the 2017-18 financial year, the Audit Committee comprised the following Directors:
• Ms Rosheen Garnon (Chair)• Ms Carol Schwartz AM
• Ms Samantha Meers AO
• Ms Brett Torossi
The Committee reviewed and gave direction on a range of issues during the year, including approval of the internal audit scope and consideration of its findings, review of Creative Partnerships’ risk management framework and strategy and the financial statements audit.
External and internal auditsThe Auditor-General is the external auditor for Creative Partnerships; representatives of the external auditor are invited to attend all meetings of the Audit and Risk Committee in an observational capacity.
In 2017-18 Creative Partnerships’ Audit and Risk Committee engaged PwC to deliver an internal audit of the agency’s cyber security control environment against the Australian Signals Directorate (ASD) Essential Eight Strategies to Mitigate Cyber Security Incidents (“Essential Eight”).
Risk management Following on from the Risk Management Framework Review undertaken with PwC in the 2016-17 financial year, Creative Partnerships continued to monitor strategic, financial and operational risk and to strive to embed a culture of risk management within the agency.
Focus Area: Demonstrating Value
34 Annual Report 2017–18

Level 1 48-50 Smith Street Darwin NT
Level 4 2 Kavanagh Street Southbank Vic
Level 2 372 Elizabeth Street Surry Hills NSW
Level 1 25 Francis Street Perth WA
Level 2 420 Brunswick Street Fortitude Valley QLD
During the financial year, Creative Partnerships undertook formal processes for Board approval of our corporate plan, including programs and performance objectives, and annual budget.
The Risk Management Matrix forms part of the overall Framework and identifies potential risks arising from Creative Partnerships’ activity. The Audit and Risk Committee reviewed the Matrix as a standing agenda item in each quarter, including reports from management on the identified “Highest Risks” both internal and external to the agency, and current or planned controls addressing these key issues.
As a low-risk agency, Creative Partnerships continues to adapt our risk management capacity and capability to a level appropriate to our operating environment and resources.
Financial Management Creative Partnerships’ income comprises mostly grant revenue from the Australian Government (54%) and donations raised for the Australian Cultural Fund (42%). Creative Partnerships’ total income for the year was $8,077,935 compared to total expenses of $7,656,242, resulting in a surplus of $421,693.
In 2017-18, Creative Partnerships maintained its overhead at 12% of expenditure (2017: 13%).
Creative Partnerships Australia staff are employed under individual employment (common law) contracts.
Organisation structure
LocationsCreative Partnerships has offices in five locations in Australia. The major activities of the company are managed from its Melbourne premises.
Board
CEO
Programs &Strategy
State-basedServices
Corporate Services
AustralianCultural Fund
Finance
Funding Programs
SectorDevelopment
Marketing
Digital
Audit &Risk Commitee
Section 3: Management and Accountability 35

36 Annual Report 2017–18
Under 28E of the Public Governance, Performance and Accountability Rule 2014, we are required to report on the following:
Rule Reference Page
Contents of annual report 28E
The purposes of the company as included in the company’s corporate plan for the period 28E (a) 3
The names of the persons holding the position of responsible Minister or responsible Ministers during the period, and the titles of those responsible Ministers
28E (b) 38
Any directions given to the entity by a Minister under the company’s constitution, and Act or an instrument during the period
28E (c) 43
Any government policy orders that applied in relation to the company during the period under section 93 of the Act
28E (d) 43
If, during the period, the company has not complied with a direction or order referred to in paragraph (c) or (d) – particulars of the non-compliance
28E (e) n/a
Information on each director of the company during the period, including: the name of the director, the qualifications of the director, the experience of the director, the number of meetings of the board of the company attended by the director during the period and whether the director is an executive director or non-executive director
28E (f) (i)-(v)
39 – 42
An outline of the organisational structure of the company, including any subsidiaries of the company
28E(g) 35
An outline of the location, whether or not in Australia, of major activities or facilities of the company
28E (h) 35
Information in relation to the main corporate governance practices used by the company during the period
28E (i) 34
The decision-making process undertaken by the directors of the company for making a decision if; the decision is to approve the company paying for a goods or service from the Commonwealth entity or a company; the company, and the Commonwealth entity or the company are related entities; and the value of the transaction, or if there is more than one transaction, the aggregate value of those transactions, is more than $10 000 (GST inclusive)
28E (j) (i) – (iii)
n/a
If the annual report includes information under paragraph (j); if there is only one transaction – the value of the transaction; and if there is more than one transaction – the number of transactions and the aggregate of value of the transactions
28E (k) (i) – (ii)
n/a
Any significant activities and changes that affected the operations r structure f the company during the period
28E (l) 38
Particulars of judicial decisions or decisions of administrative tribunals made during the period that have had, or may have, a significant effect on the operations of the company
28E (m) 43
Particulars of any report on the company given during the period by: the Auditor-General; a Committee of either House or of both Houses of the Parliament; the Commonwealth Ombudsman; the Office of the Australian Information Commissioner or the Australian Securities and Investments Commission
28E (n) (i) – (v)
n/a
If the directors have been unable to obtain information from a subsidiary of the company that is required to be included in the annual report – an explanation of the information hat not obtained and the effect of not having the information on the annual report
28E (o) n/a
An index identifying where the requirements of this section and section 28F (if applicable) are to be found.
28E (p) 36
Australia Business Arts Foundation(Creative Partnerships Australia is a business name of Australia Business Arts Foundation)

37Section 1
38 Directors’ Report
44 Independent Auditor’s Report
47 Directors’ Declaration
48 Statement of Comprehensive Income
49 Statement of Financial Position
50 Statement of Changes in Equity
51 Statement of Cash Flows
52 Notes to and Forming Part of the Financial Report
52 Note 1: Summary of Significant Accounting Policies
60 Note 2: Revenue and Other Income
61 Note 3: Expenditure
62 Note 4: Australian Cultural Fund
62 Note 5: Remuneration of Auditors
62 Note 6: Directors’ Remuneration
63 Note 7: Key Management Remuneration
63 Note 8: Related Party Transactions – Other Related Parties
63 Note 9: Current Assets
64 Note 10: Non-Current Assets
66 Note 11: Liabilities
67 Note 12: Reserves
68 Note 13: Commitments
68 Note 14: Contingent Liabilities and Contingent Assets
68 Note 15: Members’ Guarantee
68 Note 16: Events After the Reporting Date
69 Note 17: Financial Instruments
Financial ReportFor the Year Ended 30 June 2018
Tarneit— John Sheedy
37Financial Report

38 Annual Report 2017–18
The Directors submit the Australia Business Arts Foundation financial report for the financial year ended 30 June 2018.
Directors The names of the Directors in office at any time during the year and to the date of this report are: • Ms Carol Schwartz AM, Chair
• Ms Samantha Meers AO, Deputy Chair
• Ms Rosheen Garnon
• Mr Rupert Myer AO
• Mr Dan Rosen
• Mr Michael Smith
• Professor Susan Street AO
• Ms Brett Torossi
• Mr Myer’s term ended on May 15th, 2018.
Responsible Minister The Minister responsible for the company during the 2017/18 financial year was Senator the Hon Mitch Fifield.
Company SecretaryEmma Calverley held the position of Company Secretary for the duration of the 2017/18 financial year.
Principal Activity The principal activity of the company during the financial year was the promotion and facilitation of philanthropic and business support for the cultural sector in Australia.
Operating Trading Result The net result for the year ended 30 June 2018 was $421,693.
Dividends No dividends have been paid or declared during the year and no dividends proposed. The company is prohibited by its Constitution from making a distribution to its members.
Significant Changes In The State Of AffairsThere were no significant changes in the state of affairs of the company during the year 1 July 2017 to 30 June 2018.
After Balance Date EventsOther than those outlined in this report, there are no matters or circumstances that have arisen since 30 June 2018 which significantly affected, or may significantly affect, the operations of the company, the results of those operations or the state of affairs of the company in future financial years.
Australian Business Arts Foundation (Creative Partnerships Australia is a business name of Australia Business Arts Foundation)
Directors’ Report

Financial Report 39
Future Likely Developments The company will continue to provide support for greater private sector investment in the arts through its programs and initiatives, including matched funding, sector skills development and advocacy activities, and the management of the Australian Cultural Fund.
Meetings Of Directors During the financial year, 8 meetings (including committees of Directors) were held. Attendances by each Director were as follows:
Board of Directors Audit and Risk Committee
Eligible to Attend Attended
Eligible to Attend Attended
Ms Carol Schwartz AM 4 3 4 2
Ms Samantha Meers AO 4 4 4 4
Ms Rosheen Garnon 4 4 4 4
Mr Rupert Myer AO 4 2
Mr Dan Rosen 4 3
Mr Michael Smith 4 4
Professor Susan Street AO 4 3
Ms Brett Torossi 4 4 4 3
Ms Carol Schwartz AM, Chair BA, LLB, MBA, FAICD Director (Non-Executive)
Carol has extensive experience in business, property, the arts, and community organisations and has been a director on many public company and government boards. Carol is currently the Chairman of Our Community and Founding Chair of the Women’s Leadership Institute Australia.
Some of Carol’s other directorships include: Director, Stockland; Director, Reserve Bank of Australia; Director, Qualitas Property Partners; Member Harvard Kennedy Women’s Leadership Board; Founding Director, Scale Angel Network and a BoardLinks champion.
Carol was awarded a Member of the Order of Australia in the Australia Day Honours list in 2006 for her achievements in business and commerce and her contribution to community and the arts. Carol also received the Centenary Medal in 2001 in recognition of her outstanding service as a leading business executive and board participant.
Carol was awarded a Monash University Fellowship in 2010 in recognition of her significant contribution to the community through her professional distinction and outstanding service as a member of the alumni. In March 2011, Carol was inducted into the 2011 Victorian Women’s Honour Roll. In October 2012, Carol was recognised as one of Australia’s most influential women in the Australian Financial Review and Westpac’s Inaugural 100 Women of Influence Awards.

40 Annual Report 2017–18
Ms Samantha Meers AO, Deputy Chair BA LLB MLITT FAICD Director (Non-Executive)
Samantha is executive Deputy Chairman of property and investment group the Nelson Meers Group, and co-founder and trustee of the Nelson Meers Foundation. Her current board appointments include chairman of Belvoir St Theatre; chairman of Documentary Australia; Chairman of the Brett Whiteley Foundation; a trustee of the Art Gallery of NSW; and a director of the State Library of NSW Foundation.
Samantha also sits on advisory boards for the University of Sydney and the Centre for Social Impact at the University of NSW. She began her career as a commercial lawyer with Mallesons Stephen Jacques (now King and Wood Mallesons), and her executive career included senior management roles in the media sector.
Samantha is a member of Chief Executive Women and a fellow of the Australian Institute of Company Directors.
Ms Rosheen Garnon BEc/LLB FCA, CTA, GAICD Director (Non-Executive)
Rosheen has over 29 years’ experience in the professional services sector having been a senior partner with KPMG in Australia. Rosheen was appointed to the Board of Taxation in January 2018. Previously, she was the National Managing Partner for KPMG Australia’s Taxation Division and a member of the Executive Leadership Team of KPMG Australia.
In July 2017, Rosheen was appointed to the Major Performing Arts Panel at the Australia Council for the Arts. Rosheen is a member of Chief Executive Women, and a Director of Women Corporate Directors Australia Limited. Her professional qualifications include Fellow of Chartered Accountants Australia & New Zealand, Chartered Tax Advisor and Graduate of the Australian Institute of Company Directors.
Mr Rupert Myer AO BComm, MA, FAICD Director (Non-Executive)
Rupert is Chair of the Australia Council for the Arts and serves as non-executive Chair and Director of a number of public, private, community and government entities. His background includes serving in roles in the retail and property sector, investment, family office and wealth management services and community sector.
Current roles include Director of AMCIL Ltd, Healthscope Ltd, The Myer Family Investments Pty Ltd and eCargo Holdings Ltd and Mutual Trust Pty Ltd; and he is a Board Member of Jawun Indigenous Corporate Partnerships and The Yulgilbar Foundation.
Rupert is also a member of the University of Melbourne’s Faculty of Business and Economics Advisory Board and The Felton Bequests’ Committee.

Financial Report 41
Mr Dan Rosen LLM, LLB (Hons)/BCom Director (Non-Executive)
Dan has spent his career at the intersection of the creative industries and technology, working in roles as an executive, policy maker, lawyer, and artist. As Chief Executive of ARIA and PPCA, the two peak bodies for the Australian recorded music industry, he has led both organisations through the transition to an increasingly digital music market.
Prior to his current role, Dan was based in New York, working for digital media company KIT Digital. Before leaving for the United States, Dan worked as Advisor to the Federal Minister of Communications and the Arts, responsible for broadband and innovation policy. Dan started his career as a lawyer with Minter Ellison, specialising in media and technology clients. He is a Fulbright Scholar and completed a Masters of Law at New York University, where he was also a Deans Scholar.
An accomplished musician and songwriter, Dan won the Triple J Unearthed competition in 2003 and has independently released two albums. He is former Chair of the New South Wales Creative Industries Taskforce, and member of the Victorian Government’s Creative Victoria Taskforce.
Mr Michael Smith Hon DLitt, FAICD Director (Non-Executive)
Michael has a history in digital, strategy and market research.
Michael is currently the Principal of boutique strategic development consulting firm Black House. He is the Chair of 7-Eleven Stores PL, Starbucks Australia, the Lionel Samson Sadleirs Group and Pioneer Credit Ltd. Michael is the Western Australian Patron of children’s charity Variety and the Co3 Dance Company.
Previously held roles include Chair of iiNet, Synergy, Verve, the Perth International Arts Festival, Barking Gecko Theatre Company and the West Coast Eagles. He was National Chair of the Australian Institute of Company Directors, Deputy Chair of Automotive Holdings Group, State President and National Director of the Australian Marketing Institute, National Chair of Judges for EY Entrepreneur of the Year and a Director of HOME Building Society.
In 2014, Michael was awarded a Doctor of Letters from the University of Western Australia for his contribution to the business sector and the arts. Michael is also the recipient of the Patron’s Medal,His Royal Highness Prince Phillip, for his services to marketing by the Australian Marketing Institute.

42 Annual Report 2017–18
Professor Susan Street AO MA Director (Non-Executive)
Susan is Executive Director, Queensland University of Technology (QUT) Precincts and formally Executive Dean, Creative Industries Faculty at QUT.
Previously held roles include Head of Dance, QUT; Dean, School of Dance, Hong Kong Academy for Performing Arts; Chair, Dance Fund; Council Member of the Australia Council; Trust Director, Brisbane Arts and Environment Trust, Brisbane City Council; Chair, Artistic Advisory Committee and Board Member, Hong Kong Ballet; and Arts advisor to Hong Kong Arts Development Council and the Leisure and Cultural Service Department of Hong Kong Government.
Susan was Board Member, Australia-China Council (DFAT); Trustee, Queensland Performing Arts Trust; Australasian Advisor, Royal Academy of Dance in London and Arts Investment Advisory Board, Queensland Government.
She is the immediate past Chair, Board of Trustees of the Queensland Art Gallery & Gallery of Modern Art; current Board Member, Australia Korea Foundation; Australia Singapore Arts Group; and Artistic Advisor to the Australian Ballet.
Ms Brett Torossi Director (Non-Executive)
Brett is Founder, Owner and Managing Director of New Ground Network. As a property developer and businesswoman, she focuses on creating and developing innovative, sustainable and commercially successful spaces, focusing on tourism, residential and commercial developments.
Brett’s other appointments include Chair, Tasmanian Heritage Council; Director, Tourism Tasmania; Chair, Tourism Tasmania Finance Audit and Risk Committee; Non-singing Director, Festival of Voices; Trustee, Tasmanian Museum and Art Gallery; Chair, Tasmanian Museum and Art Gallery Audit Committee; Director, Tasmanian Development Board; and Member, Tasmanian Statewide Brand Steering Group.
Directors’ Benefits The Directors are paid such remuneration and allowances as determined by the Remuneration Tribunal out of the monies of Creative Partnerships Australia. Since 1 July 2017, no Director of the company has received or become entitled to receive any other benefit, other than a benefit included in the aggregate amount of emoluments received or due and receivable by Directors shown in the accounts or the fixed salary of a full-time employee of the company, by reason of a contract made by the company with the Director or any related party.

Financial Report 43
Indeminities And Insurance Premiums During the financial year, the company has paid premiums to indemnify Directors against third party legal proceedings arising out of their conduct while acting in the capacity of Director of the company. Indemnity is provided to Directors under the coverage of the company’s insurer, Comcover.
The company has not, during or since the financial year, in respect of any person who is or has been an officer or auditor of the company or a related body corporate:• indemnified or made any relevant agreement for indemnity against a liability, including costs
and expenses in successfully defending legal proceedings; or
• paid or agreed to pay a premium in respect of a contract insuring against a liability for the costs or expenses to defend legal proceedings.
Environmental Issues The company’s operations are not regulated by any significant environmental regulations under a law of the Commonwealth or of a state or territory.
Proceedings On Behalf Of The Company No person has applied for leave of Court to bring proceedings on behalf of the company or intervene in any proceedings to which the company is party for the purpose of taking responsibility on behalf of the company for all or part of those proceedings.
The company was not a party to any such proceedings during the year.
Ministerial Directions And Government Policy Orders Under section 93 of the Public Governance, Performance and Accountability Act 2013 (PGPA Act), the Finance Minister may, after consultation with the Minister responsible for the order, make a government policy order that applies to wholly-owned Commonwealth companies. There has been no application of Section 93 of the PGPA Act this this financial year. There were no directions issued to the company by the responsible Minister, under the company’s constitution, or under and Act or instrument.
Auditor’s Independence DeclarationThe lead auditor’s independence declaration for the year ended 30 June 2018 has been received and can be found on page 44 of the Directors’ Report.
Signed in accordance with a resolution of the Board of Directors.
Ms C. Schwartz AM Ms R. GarnonDirector Director
Dated this 20th day of August 2018

44 Annual Report 2017–18

45Financial Report

46 Annual Report 2017–18

Financial Report 47
The Directors of the company declare that:1. The financial report and notes, as set out on pages 48 to 71, are in accordance with the
Corporations Act 2001 and the Australian Charities and Not-for-profits Commission Act 2012: anda. comply with Australian Accounting Standards; anda. give a true and fair view of the financial position as at 30 June 2018 and of the performance
for the year ended on that date of the company.2. In the Directors’ opinion there are reasonable grounds to believe that the company will be able
to pay its debts as and when they become due and payable.This declaration is made in accordance with a resolution of the Board of Directors.
Ms C. Schwartz AM Ms R. GarnonDirector Director
Dated this 20th day of August 2018
Directors’ Declaration

48 Annual Report 2017–18
Note2018
$2017
$
Revenue from operations 2A 3,659,091 2,827,044
Revenue from government and other grants 2B 4,392,000 4,399,000
Finance income 26,844 23,874
Total income 8,077,935 7,249,918
Administration expenditure
Employee benefits expense 3A (1,880,639) (1,909,937)
Grant expense 3B (4,562,617) (3,939,993)
Suppliers expense 3C (1,181,030) (1,001,599)
Depreciation 3D (32,997) (29,956)
Total expense (7,657,283) (6,881,485)
Surplus attributable to members of the company 420,652 368,433
Other comprehensive income
Items that will not be reclassified to profit or loss:
Changes in asset revaluation reserve 1,041 –
Total other comprehensive income 1,041 –
Total comprehensive income attributable to members of the company
421,693 368,433
The above statement should be read in conjunction with the accompanying notes.
Statement of Comprehensive IncomeFor the Year Ended 30 June 2018

Financial Report 49
Statement of Financial Positionas at 30 June 2018
Note2018
$2017
$
Assets
Current Assets
Cash and cash equivalents 9A 4,122,206 3,183,033
Trade and other receivables 9B 15,221 42,368
Other assets 9C 87,207 132,156
Other financial assets 9D 15,693 15,381
Total Current Assets 4,240,327 3,372,938
Non-Current Assets
Property, plant and equipment 10A 45,654 70,248
Total Non-Current Assets 45,654 70,248
Total Assets 4,285,981 3,443,186
Liabilities
Current Liabilities
Trade and other payables 11A 1,185,739 718,502
Provisions 11B 141,288 143,104
Total Current Liabilities 1,327,027 861,606
Non-Current Liabilities
Provisions 11B 37,333 62,946
Total Non-Current Liabilities 37,333 62,946
Total Liabilities 1,364,360 924,552
Net Assets 2,921,621 2,518,634
Equity
Retained surplus 761,168 766,785
Contributed equity 590,284 590,284
Reserves 12 1,570,169 1,161,565
Total Equity 2,921,621 2,518,634
The above statement should be read in conjunction with the accompanying notes.

50 Annual Report 2017–18
Note
Retained Surplus $
Contributed
Equity $
ACF
Donations R
eserve $
Richard
Pratt Arts Scholarship
Reserve $
Small Arts
and Bus D
ev Fund R
eserve $
Asset R
evaluation R
eserve $Total $
Opening Balance 1 July 2016
463,182 590,284
1,029,641 18,706
48,388 –
2,150,201
Com
prehensive income
Surplus for the year
303,603 –
64,830 –
– –
368,433
Total comprehensive incom
e 303,603
– 64,830
– –
– 368,433
Balance at 30 June 2017
766,785 590,284
1,094,471 18,706
48,388 –
2,518,634
Com
prehensive income
Surplus/(deficit) for the year
(5,617) –
426,269 –
– –
420,652
O
ther comprehensive incom
e –
– –
– –
1,041 1,041
Total comprehensive incom
e (loss) (5,617)
– 426,269
– –
1,041 421,693
M
ovement in reserve
– –
– (18,706)
– –
(18,706)
Balance at 30 June 201812
761,168 590,284
1,520,740 –
48,388 1,041
2,921,621 The above statem
ent should be read in conjunction with the accom
panying notes.
Statement of Changes in EquityFor the Year Ended 30 June 2018

Financial Report 51
Note2018
$2017
$
Cash Flow from Operating Activities
Cash received
Receipts from governments 4,392,000 4,399,000
Interest received 26,845 23,874
Receipts from ACF donations 3,375,137 2,525,815
Other receipts 366,985 370,293
Total cash received 8,160,967 7,318,982
Cash used
Payments to suppliers (1,103,073) (1,388,443)
Payments to employees (1,871,333) (1,888,994)
Payments to grants recipients (1,290,651) (1,070,479)
Payments to ACF grants recipients (2,948,868) (2,489,614)
Total cash used (7,212,884) (6,837,529)
Net cash generated from operating activities 948,083 481,453
Cash Flow from Investing Activities
Purchase of property plant and equipment (8,910) (5,575)
Net cash used by investing activities (8,910) (5,575)
Net Increase in cash held 939,173 475,878
Cash and cash equivalents at beginning of the financial year
3,183,033 2,707,155
Cash and cash equivalents at end of the financial year 9A 4,122,206 3,183,033
The accompanying notes form part of these financial statements.
Statement of Cash FlowsFor the Year Ended 30 June 2018

52 Annual Report 2017–18
Notes to and Forming Part of the Financial ReportFor the Year Ended 30 June 2018
The financial statements are for Australia Business Arts Foundation Limited, trading as Creative Partnerships Australia, as an individual entity, incorporated and domiciled in Australia.
Creative Partnerships Australia is a Commonwealth company limited by guarantee.
The registered office and the principal place of business of the company is level 4, 2-4 Kavanagh Street, Southbank, VIC 3006.
Note 1: Summary of Significant Accounting PoliciesBasis of PreparationThe financial statements are general purpose financial statements that have been prepared in accordance with Australian Accounting Standards – Reduced Disclosure Requirements and Interpretations issued by the Australian Accounting Standards Board (AASB), the Australian Charities and Not-for-profits Commission Act 2012 that apply for the reporting period and the Corporations Act 2001. The company is a not-for-profit entity for financial reporting purposes under the Australian Accounting Standards.
The financial statements, except for the cash flow information, have been prepared on an accruals basis and are based on historical costs, modified, where applicable, by the measurement at fair value of selected non-current assets, financial assets and financial liabilities. The amounts presented in the financial statements have been rounded to the nearest dollar.
The financial statements are presented in Australian dollar, which is Creative Partnerships Australia’s functional and presentation currency. The company has no transactions in foreign currencies.
New and revised accounting standards not yet effectiveA number of new standards and amendments to the standards are effective for annual periods beginning after 1 January 2018 (unless otherwise stated). The company has considered the impact of these changes and their application in the preparation of the financial statements.
AASB 15 – Revenue from contracts with customers The AASB has issued a new standard for the recognition of revenue. This will replace AASB118 which covers contracts for goods and services. The new standard is based on the principle that revenue is recognised when control of a good or service transfers to a customer – so the notion of control replaces the existing notion of risks and rewards.
The new standard is effective for all reporting periods commencing 1 January 2018. The potential impact of this standards is not expected to have a material impact.
AASB 1058 – Income for Not-for-Profit EntitiesThis Standard clarifies and simplifies the income recognition requirements that apply to not-for-profit entities, in conjunction with AASB 15. And replaces AASB 1004 Contributions. It establishes revenue recognition principles for transactions where the considerate to acquire an asset is significantly less than fair value to enable the entity to further its objectives.
The new standard is effective for all reporting periods beginning on or after 1 January 2019. The potential impact of this standards is not expected to have a material impact.

Financial Report 53
AASB 16 – Leases In February 2016, the AASB issued AASB16 Leases. The standard provides a single lessee accounting model, requiring lessees to recognise an asset (the right to use the leased item) and a financial liability to pay rentals. The only exemptions are where the lease term is 12 months or less, or the underlying asset has a low value. Lessor accounting is substantially unchanged under AASB16.
The new standard is effective for all reporting periods commencing 1 January 2019. The company has elected not to early adopt this new standard. Note 13 summarise the company’s current lease commitments and Management are in the process of completing their assessment of the impact of the effect of AASB16.
AASB 9 – Financial Instruments The standard addresses the classification, measurement and derecognition of financial instruments. For financial liabilities that are measured under the fair value option, company will need to recognise the part of the fair value change that is due to changes in their own credit risk in other comprehensive income rather than profit or loss. New hedge accounting rules align hedge accounting more closely with common risk management processes. As a general rule, it will be easier to apply hedge accounting going forward. The new standard also introduces expanded disclosure requirement and changes in presentation.
In December 2014, the AASB introduced a new impairment model in relation to assessing impairment of financial instruments under AASB 9. The new impairment is an expected credit loss (ECL) model which may result in the earlier recognition of credit losses.
The new standard is effective for all reporting periods commencing 1 January 2018. Management does not expect the above change to significantly impact the company’s financial statements, there are no hedging activities carried out by the company, and historical credit losses have been minimal in previous accounting periods. Note 17B has further information on the company’s credit risk assessment.
Accounting Policies
1.1 RevenueRevenue is recognised as follows:
• Non-reciprocal grants revenue is recognised in the statement of profit or loss and other comprehensive income when the entity obtains control of the grant and it is probable that the economic benefits gained from the grant will flow to the entity and the amount of the grant can be measured reliably.
• Grants with conditions attached which must be satisfied before the contributions will be received will be recognised as revenue only when those conditions are satisfied.
• When grant revenue is received whereby the company incurs an obligation to deliver economic value directly back to the contributor, this is considered a reciprocal transaction and the grant revenue is recognised in the statement of financial position as a liability until the service has been delivered to the contributor, otherwise the grant is recognised as income on receipt.
• Donations and bequests are recognised as revenue when received.
• Revenue from the rendering of a service is recognised upon the delivery of the service to the customers.
• Interest revenue is recognised using the effective interest rate method, which for floating rate financial assets is the rate inherent in the instrument.
All revenue is stated net of the amount of goods and services tax (GST).

54 Annual Report 2017–18
1.2 Economic DependencyCreative Partnerships Australia is a wholly owned Commonwealth company and received approximately 94% (2017: 94%) of its income from the Australian Government for funding of its operations. The company would not be able to continue its operations in 2017-18 without Australian Government funding.
1.3 Income TaxNo provision for income tax has been raised as the company is exempt from income tax under Section 50-45 of the Income Tax Assessment Act 1997.
1.4 Cash and Cash EquivalentsCash and cash equivalents include cash on hand, deposits held at-call with banks, other short-term highly liquid investments with original maturities of three months or less.
1.5 Acquisition of AssetsAssets are recorded at cost on acquisition except as stated below. The cost of acquisition includes the fair value of assets transferred in exchange and liabilities undertaken.
Assets acquired at no cost, or for nominal consideration, are initially recognised as assets and revenues at their fair value at the date of acquisition.
1.6 Property Plant and Equipment
Leasehold improvementsLeasehold improvements are shown at their fair value based on periodic valuations by external independent valuers, less subsequent depreciation.
In periods when the leasehold improvements are not subject to an independent valuation, the directors conduct directors’ valuations to ensure the carrying amount is not materially different to the fair value.
Increases in the carrying amount arising on revaluation of leasehold improvements are recognised in other comprehensive income and accumulated in the revaluation surplus in equity. Revaluation decreases that offset previous increases of the same class of assets shall be recognised in other comprehensive income under the heading of revaluation surplus. All other decreases are recognised in profit or loss.
Any accumulated depreciation at the date of the revaluation is eliminated against the gross carrying amount of the asset and the net amount is restated to the revalued amount of the asset.
Property Plant and EquipmentEach class of property, plant and equipment is carried at cost or fair value as indicated, less, where applicable accumulated depreciation and impairment losses.
The carrying amount of plant and equipment is reviewed annually by directors to ensure it is not in excess of expected net cash flows that will be received from the assets employment and subsequent disposal. The expected net cash flows have been discounted to their present values in determining recoverable costs.
Independent valuation review conducted by external valuation company on every three years.
Asset Recognition ThresholdPurchases of plant and equipment are recognised initially at cost in the statement of financial position, except for purchases costing less than $2,000, which are expensed in the year of acquisition (other than where they form part of a group of similar items which are significant in total).

Financial Report 55
The initial cost of an asset includes an estimate of the cost of dismantling and removing the item and restoring the site on which it is located. This is particularly relevant to ‘make good’ provisions in property leases taken up by the company where there exists an obligation to restore the property to its original condition. These costs are included in the value of the company’s leasehold improvements with a corresponding provision for the ‘make good’ recognised.
DepreciationThe depreciable amount of all fixed assets is depreciated on a straight-line basis over the assets useful life to the entity commencing from the time the asset is ready for use. Leasehold improvements are depreciated over the shorter of either the unexpired period of the lease or the estimated useful lives of the improvements. Depreciation rates used for each class of depreciable assets are:
Class of fixed asset Depreciation Rate
Plant and equipment 15% to 30%
Leasehold improvements 25%
The assets’ residual values and useful lives are reviewed, and adjusted if appropriate, at the end of each reporting period.
Asset classes carrying amount is written down immediately to its recoverable amount if the asset’s carrying amount is greater than its estimated recoverable amount.
Gains and losses on disposals are determined by comparing proceeds with the carrying amount. These gains or losses are included in the Statement of comprehensive income. When revalued assets are sold, amounts included in the revaluation reserve relating to that asset are transferred to retained earnings.
1.7 Provision for Lease MakegoodA provision is recognised when the company has a legal or constructive obligation, as a result of past events, for which it is probable that an outflow of economic benefits will result and that outflow can be reliably measured. Provisions recognised represent the best estimate of the amounts required to settle an obligation at the end of the reporting period.
The company’s current lease agreement have provisions requiring the company to restore the premises to their original condition at the conclusion of the lease. The company has made a provision to reflect the present value of this obligation.
1.8 Trade and Other PayablesTrade and other payables represent the liability outstanding at the end of the reporting period for goods and services received by the company during the reporting period which remain unpaid. The balance is recognised as a current liability with amounts normally paid within 30 days of recognition of the liability.
1.9 Employee BenefitsProvision is made for the company’s liability for employee benefits arising from services rendered by employees to the end of the reporting period.
Short-term employee benefitsEmployee benefits that are expected to be settled within one year have been measured at the amounts expected to be paid when the liability is settled.

56 Annual Report 2017–18
Long-term employee benefitsEmployee benefits payable later than one year have been measured at the present value of the estimated future cash outflows to be made for those benefits. Those cash outflows are discounted using market yields on notional government bonds with terms to maturity that match the expected timing of cash flows. In respect of long service leave, the probability of long service leave being taken is based upon historical data.
Contributions are made by the company to an employee superannuation fund and are charged as expenses when incurred.
1.10 LeasesLease payments for operating leases, where substantially all the risks and benefits remain with the lessor, are charged as expenses on a straight-line basis over the lease term which is representative of the pattern of benefits derived from the leased assets.
1.11 Financial Instruments
Initial recognition and measurementFinancial assets and financial liabilities are recognised when the entity becomes a party to the contractual provisions of the instrument. For financial assets, this is equivalent to the date that the company commits itself to either purchase or sell the asset (i.e. trade date accounting is adopted). Financial instruments are initially measured at fair value plus transactions costs except where the instrument is classified ‘at fair value through profit or loss’ in which case transaction costs are expensed to profit or loss immediately.
Classification and subsequent measurementFinancial instruments are subsequently measured at fair value, amortised cost using the effective interest rate method or cost. Fair value represents the amount for which an asset could be exchanged or a liability settled, between knowledgeable, willing parties. Where available, quoted prices in an active market are used to determine fair value. In other circumstances, valuation techniques are adopted.
Amortised cost is calculated as:
i. the amount at which the financial asset or financial liability is measured at initial recognition;
ii. less principal payments;
iii. plus or minus the cumulative amortisation of the difference, if any, between the amount initially recognised and the maturity amount calculated using the effective interest method; and
iv. less any reduction for impairment.
The effective interest method is used to allocate interest income or interest expense over the relevant period and is equivalent to the rate that exactly discounts estimated future cash payments or receipts (including fees, transaction costs and other premiums or discounts) through the expected life (or when this cannot be reliably predicted, the contractual term) of the financial instrument to the net carrying amount of the financial asset or financial liability. Revisions of the expected future net cash flows will necessitate an adjustment to the carrying value with a consequential recognition of an income or expense in profit or loss.

Financial Report 57
(i) ReceivablesReceivables are non-derivative financial assets with fixed or determinable payments that are not quoted in an active market and are subsequently measured at amortised cost. Gains or losses are recognised in profit or loss through the amortisation process and when the financial asset is derecognised.
Receivables are included in current assets, except for those which are not expected to mature within 12 months after the end of the reporting period, which will be classified as non-current assets.
(ii) Held-to-maturity investmentsHeld-to-maturity investments are non-derivative financial assets that have fixed maturities and fixed or determinable payments, and it is the company’s intention to hold these investments to maturity. They are subsequently measured at amortised cost. Gains or losses are recognised in profit or loss through the amortisation process and when the financial asset is derecognised.
(iii) Financial liabilitiesNon-derivative financial liabilities (excluding financial guarantees) are subsequently measured at amortised cost. Gains or losses are recognised in profit or loss through the amortisation process and when the financial asset is derecognised.
ImpairmentAt the end of each reporting period, the company assesses whether there is objective evidence that a financial instrument has been impaired. Impairment losses are recognised in the Statement of profit or loss and other comprehensive income.
DerecognitionFinancial assets are derecognised where the contractual rights to receipt of cash flows expires or the asset is transferred to another party whereby the entity no longer has any significant continuing involvement in the risks and benefits associated with the asset. Financial liabilities are derecognised where the related obligations are discharged, cancelled or expired. The difference between the carrying value of the financial liability, which is extinguished or transferred to another party and the fair value of consideration paid, including the transfer of non-cash assets or liabilities assumed, is recognised in profit or loss.
58 Annual Report 2017–18
1.12 Fair Value of Assets and LiabilitiesThe company measures some of its assets and liabilities at fair value on either a recurring or non-recurring basis, depending on the requirements of the applicable Accounting Standard.
Fair value is the price the company would receive to sell an asset or would have to pay to transfer a liability in an orderly (ie unforced) transaction between independent, knowledgeable and willing market participants at the measurement date.
As fair value is a market-based measure, the closest equivalent observable market pricing information is used to determine fair value. Adjustments to market values may be made having regard to the characteristics of the specific asset or liability. The fair values of assets and liabilities that are not traded in an active market are determined using one or more valuation techniques. These valuation techniques maximise, to the extent possible, the use of observable market data.
To the extent possible, market information is extracted from either the principal market for the asset or liability (ie the market with the greatest volume and level of activity for the asset or liability) or, in the absence of such a market, the most advantageous market available to the entity at the end of the reporting period (ie the market that maximises the receipts from the sale of the asset or minimises the payments made to transfer the liability, after taking into account transaction costs and transport costs).
For non-financial assets, the fair value measurement also takes into account a market participant’s ability to use the asset in its highest and best use or to sell it to another market participant that would use the asset in its highest and best use.
1.13 Goods and Services Tax (GST)Revenues, expenses and receivables are recognised net of the amount of GST, except where the amount of GST incurred is not recoverable from the Australian Taxation Office (“ATO”). In these circumstances, the GST is recognised as part of the cost of acquisition of the asset or as part of an item of the expense. Receivables and payables in the statement of financial position are shown inclusive of GST. The net amount of GST recoverable from, or payable to, the ATO is included with other receivables or payables in the statement of financial position.
Cash flows are presented in the statement of cashflows on a gross basis, except for the GST component of investing and financing activities, which are disclosed as operating cash flows.
1.14 Comparative FiguresWhere required by Accounting Standards, comparative figures have been adjusted to conform with changes in presentation for the current financial year.
When an entity applies an accounting policy retrospectively, makes a retrospective restatement or reclassifies items in its financial statements, a statement of financial position as at the beginning of the earliest comparative period must be disclosed.
No changes of comparative figures were required in the current financial year.

Financial Report 59
1.15 Critical Accounting Estimates, Judgments and AssumptionsThe directors evaluate estimates and judgments incorporated into the financial statements based on historical knowledge and best available current information. Estimates assume a reasonable expectation of future events and are based on current trends and economic data, obtained both externally and within the company.
Impairment of non-financial assetsThe company assesses impairment at each reporting date by evaluating conditions specific to the company that may lead to impairment of assets. Where an impairment trigger exists, the recoverable amount of the asset is determined. Value-in-use calculations performed in assessing recoverable amounts incorporate a number of key estimates.
Estimation of useful livesManagement reviews its estimate of the useful lives of depreciable assets at each reporting date, based on the expected utility of the assets. Uncertainties in these estimates relate to technical obsolescence that may change the utility of certain IT equipment.
Employee Benefits ProvisionThe liability for employee benefits is recognised and measured at the present value of the estimated cash flows to be made in respect of all employees at the reporting date. In determining the present value of the liability, consideration is given to employee wage increases and the probability that the employee may not satisfy vesting requirements.

60 Annual Report 2017–18
Note 2: Revenue and Other Income
Note2018
$2017
$
Note 2A: Revenue from Operations
Fees – ticketing income 44,124 28,995
Donations 171,124 123,219
ACF donations received 3,375,137 2,554,444
Service income 68,706 50,400
Other gains (a) – 69,986
Total revenue from operations 3,659,091 2,827,044
a) Other gains Other gains for 2017 represents the reversal of the Australian Government superannuation provision and the adjustment to the key management performance pay.
Note 2B: Revenue from Government and Other Grants
Grants – Australian Government – Operational Funding 2,642,000 2,649,000
Grants – Australian Government – Program Funding 1,750,000 1,750,000
Total revenue from Government and other grants 4,392,000 4,399,000

Financial Report 61
Note 3: Expenditure
2018 $
2017$
Note 3A: Employee Benefits Expense
Wages and salaries 1,871,333 1,888,994
Other employee expense 9,306 20,943
Total employee benefits 1,880,639 1,909,937
Note 3B: Grant Expense
Grant expense 1,613,749 1,441,400
State grant expense – 8,979
ACF grants paid 2,948,868 2,489,614
Total grant expense 4,562,617 3,939,993
Note 3C: Suppliers Expense
Supply of goods and services 1,048,024 870,206
Lease payments 133,006 131,393
Total supplier expense 1,181,030 1,001,599
Note 3D: Depreciation
Depreciation
Leasehold improvements 19,240 19,240
Plant and equipment 13,757 10,716
Total depreciation 32,997 29,956

62 Annual Report 2017–18
Note 4: Australian Cultural Fund“The company administers the Australian Cultural Fund (ACF) to enable donors to make a donation to support the cultural life of Australia and to express a preference for the use of these donations. The bona fide nature of the proposed cultural recipient is verified prior to a decision to make a grant.
Donations received are required to be recognised as revenue upon receipt of the donation whereas the corresponding grant to the preferred recipient is required to be recognised as expenditure when the grant is made. A timing difference will occur where the financial year in which donations are received and included in income does not coincide with the financial year in which the associated grant is paid and recorded as expenditure.
Such timing differences during the financial year resulted in an ACF surplus of $426,269.
Note 5: Remuneration of Auditors
2018 $
2017 $
Auditor remuneration
• audit of the financial statements 25,200 25,200
Total remuneration of auditors 25,200 25,200
Note 6: Directors’ RemunerationThe number of non-executive directors of the company included in these figures are shown below in the relevant remuneration bands:
No. No.
$10,000 – $ 19,999 6 6
$20,000 – $29,999 1 1
$30,000 – $39,999 1 1
Total 8 8
Total remuneration received or due and receivable by directors of the company
164,530 161,300
Superannuation contributions amounting to $15,630 (2016-17: $15,324) were paid on behalf of directors.

Financial Report 63
Note 7: Key Management RemunerationAny person(s) having authority and responsibility for planning, directing and controlling the activities of the company, directly or indirectly, including any director (whether executive or otherwise) is considered a senior management personnel.
2018 $
2017 $
Senior Management Personnel remuneration
• short-term benefits 211,499 246,193
• post-employment benefits 20,093 21,670
• other long-term benefits – –
Total remuneration of senior management personnel 231,592 267,863
The total number of senior management personnel that are included in the above table is 1 (2017:1).
Note 8: Related Party Transactions – Other Related PartiesTransactions between related parties are on normal commercial terms and conditions no more favourable than those available to other parties unless otherwise stated.
There have been no loans or grants made to the directors or director-related entities during the financial year. There have been no other related party transactions during the financial year.
Note 9: Current Assets
Note2018
$2017
$
Note 9A: Cash and Cash Equivalents
Cash at bank and on hand 4,122,206 3,183,033
Total cash and cash equivalents 4,122,206 3,183,033
Note 9B: Trade and Other Receivables
Trade receivables 9B(i) 15,221 42,368
Total current trade and other receivables 15,221 42,368
(i) Provision for Impairment of ReceivablesCurrent trade receivables are generally on 30 day terms. These receivables are assessed for recoverability and a provision for impairment is recognised when there is objective evidence that an individual trade receivable is impaired.
Receivables have been assessed for impairment and it has been determined that no impairment exists at 30 June 2018.
All trade receivables are within initial trade terms.

64 Annual Report 2017–18
2018 $
2017 $
Note 9C: Other Assets
Prepayments 35,763 33,976
GST receivables 51,444 98,180
Total other assets 87,207 132,156
Note 9D: Other financial assets
Held-to-maturity investments 15,693 15,381
Total short-term investments 15,693 15,381
Note 10: Non-Current Assets
Note 10A: Property, Plant and Equipment
Leasehold improvements – at valuation 78,211 77,170
Less: Accumulated depreciation (67,711) (48,471)
Total leasehold improvements 10,500 28,699
Plant and equipment at cost 76,369 69,007
Less: Accumulated depreciation (41,215) (27,458)
Total plant and equipment 35,154 41,549
Total Property, Plant and Equipment 45,654 70,248
The company’s property, plant and equipment measured at fair value at 30 June 2018 and 30 June 2017.
Non- financial assets fair value measurements – valuation processes The company procured the service of the Jones Lang LaSalle (JLL) to undertake a comprehensive valuation of all non-financial assets at 30 June 2018. The company tests the procedures of the valuation model as an internal management review at least once every 12 months (with a formal revaluation undertaken once every three years). If a particular asset class experiences significant and volatile changes in fair value (i.e. where indicators suggest that the value of the class has changed materially since the previous reporting period), that class is subject to specific valuation in the reporting period, where practicable, regardless of the timing of the last specific valuation. The company has engaged JLL to provide written assurance that the models developed comply with AASB 13.
Significant inputs utilised by the company are derived and evaluated as follows:

Financial Report 65
Leasehold Improvements – Physical Depreciation and ObsolescenceAssets that do not transact with enough frequency or transparency to develop objective opinions of value from observable market evidence have been measured utilising the Depreciated Replacement Cost approach.
Sensitivity of inputs
Leasehold Improvements & Property, Plant and Equipment – Consumed economic benefit/ Obsolescence of assetThe significant unobservable inputs used in the fair value measurement of the Company’s leasehold improvements asset classes relate to the physical depreciation and obsolescence deduction. A significant increase (decrease) in this input would result in a significantly lower (higher) fair value measurement.
Note 10B: Movement in Carrying AmountsMovement in the carrying amounts for each class of property, plant & equipment between the beginning and the end of the current financial year:
Leasehold Improvements
$
Plant and Equipment
$Total
$
Balance as at 1 July 2017 28,699 41,549 70,248
Additions – 8,910 8,910
Valuation adjustment 1,041 (1,548) (507)
Depreciation expense (19,240) (13,757) (32,997)
Carrying amount at 30 June 2018 10,500 35,154 45,654
Asset Revaluation The company’s tangible non-finanical assets were independently valued at 30 June 2018 by the JLL. The valuation was based on fair value. Through this review process, a revaluation gain of $1,041 related to the leasehold improvement being recognised in the assets revaluation reserve, a revaluation loss of $1,548 related to the plant and equipment being recognised in the comprehensive income.
At 30 June 2018 the directors reviewed the key assumptions made by the valuers at 21 May 2018. They have concluded that these assumptions remain materially unchanged.
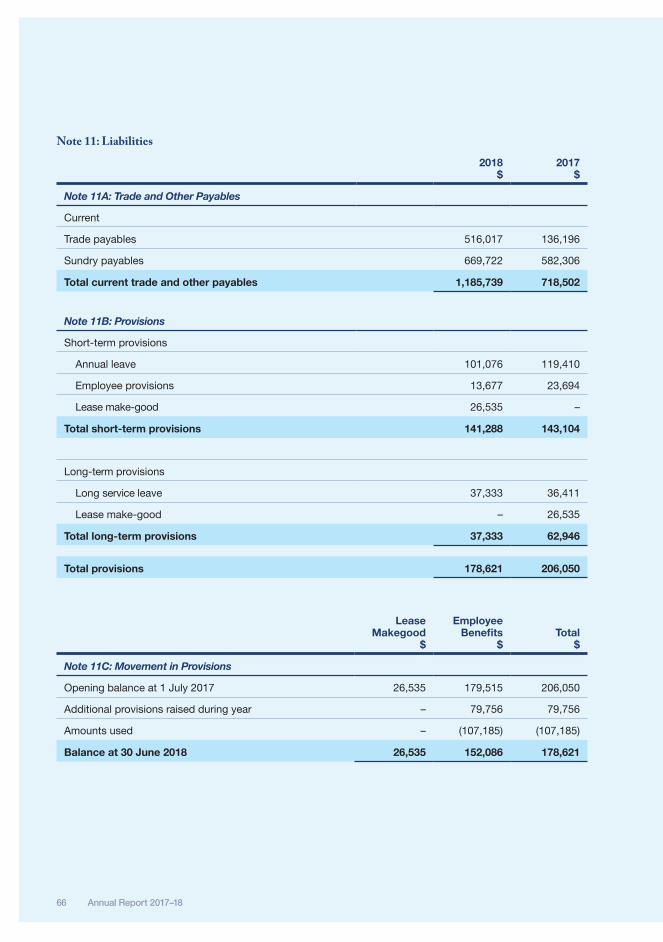
66 Annual Report 2017–18
Note 11: Liabilities
2018 $
2017 $
Note 11A: Trade and Other Payables
Current
Trade payables 516,017 136,196
Sundry payables 669,722 582,306
Total current trade and other payables 1,185,739 718,502
Note 11B: Provisions
Short-term provisions
Annual leave 101,076 119,410
Employee provisions 13,677 23,694
Lease make-good 26,535 –
Total short-term provisions 141,288 143,104
Long-term provisions
Long service leave 37,333 36,411
Lease make-good – 26,535
Total long-term provisions 37,333 62,946
Total provisions 178,621 206,050
Lease Makegood
$
Employee Benefits
$Total
$
Note 11C: Movement in Provisions
Opening balance at 1 July 2017 26,535 179,515 206,050
Additional provisions raised during year – 79,756 79,756
Amounts used – (107,185) (107,185)
Balance at 30 June 2018 26,535 152,086 178,621
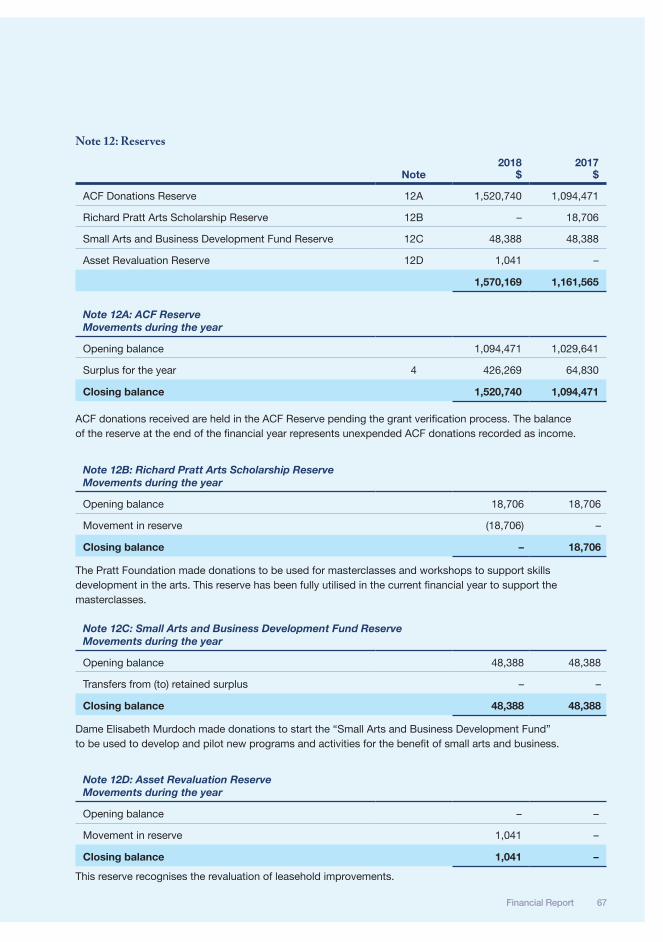
Financial Report 67
Note 12: Reserves
Note2018
$2017
$
ACF Donations Reserve 12A 1,520,740 1,094,471
Richard Pratt Arts Scholarship Reserve 12B – 18,706
Small Arts and Business Development Fund Reserve 12C 48,388 48,388
Asset Revaluation Reserve 12D 1,041 –
1,570,169 1,161,565
Note 12A: ACF Reserve Movements during the year
Opening balance 1,094,471 1,029,641
Surplus for the year 4 426,269 64,830
Closing balance 1,520,740 1,094,471
ACF donations received are held in the ACF Reserve pending the grant verification process. The balance of the reserve at the end of the financial year represents unexpended ACF donations recorded as income.
Note 12B: Richard Pratt Arts Scholarship Reserve Movements during the year
Opening balance 18,706 18,706
Movement in reserve (18,706) –
Closing balance – 18,706
The Pratt Foundation made donations to be used for masterclasses and workshops to support skills development in the arts. This reserve has been fully utilised in the current financial year to support the masterclasses.
Note 12C: Small Arts and Business Development Fund Reserve Movements during the year
Opening balance 48,388 48,388
Transfers from (to) retained surplus – –
Closing balance 48,388 48,388
Dame Elisabeth Murdoch made donations to start the “Small Arts and Business Development Fund” to be used to develop and pilot new programs and activities for the benefit of small arts and business.
Note 12D: Asset Revaluation Reserve Movements during the year
Opening balance – –
Movement in reserve 1,041 –
Closing balance 1,041 –
This reserve recognises the revaluation of leasehold improvements.

68 Annual Report 2017–18
Note 13: CommitmentsOperating Lease CommitmentsNon-cancellable operating leases contracted for but not capitalised in the financial statements
2018 $
2017 $
Payable —One year or less 66,992 114,465
—Later than 12 months but not later then five years 13,398 37,375
80,390 151,840
The operating lease commitment for the financial year ended 30 June 2018 are for the lease of Melbourne, Sydney, Darwin and Perth office accommodation and a photocopier. Commitments are shown exclusive of GST.
There were no other commitments at balance date.
Note 14: Contingent Liabilities and Contingent AssetsAt 30 June 2018, there were no contingent liabilities or contingent assets.
The company has a bank guarantee in favour of the Melbourne property lessors for an amount of $14,950.
Note 15: Members’ GuaranteeThe company is incorporated under the Corporations Act 2001 and is a company limited by guarantee. If the company is wound up, the constitution states that each member is required to contribute a maximum of $50 towards meeting any outstanding obligations of the company. At 30 June 2018, the number of members was 3 (30 June 2017: 3).
Note 16: Events After the Reporting DateThere are no events after the reporting date that have or will materially affect the financial position of the company.

Financial Report 69
Note 17: Financial InstrumentsThe company’s financial assets consist of cash and trade receivables, and financial liabilities consist of trade payables.
Note 17A: Net Gains or Losses on Financial Assets2018
$2017
$
Loans and receivables
interest revenue 26,844 23,874
Net gains on loans and receivables 26,844 23,874
Net gains on financial assets 26,844 23,874
Financial Risk Management Policies
The directors of the company meet on a regular basis to analyse financial risk management strategies and policies in the context of the most recent economic conditions and forecasts to assist the company in meeting its financial targets, whilst minimising potential adverse effects on financial performance.
Note 17B: Credit risk The maximum exposure to credit risk by class of recognised financial assets at the end of the reporting period is equivalent to the carrying value and classification of those financial assets (net of any provisions) as presented in the statement of financial position.
The company does not have any material credit risk exposure to any single receivable or group of receivables under financial instruments entered into by the company.
Credit risk related to balances with banks and other financial institutions is managed by the audit committee in accordance with approved policy.
The following table details the company’s trade and other receivables exposed to credit risk (prior to collateral and other credit enhancements) with ageing analysis and impairment provided for thereon.
The balance of receivables that remain within initial trade terms (as detailed in the table) are considered to be of high credit quality.

70 Annual Report 2017–18
Past due but not impaired (days overdue)
Passed due and
impaired $
Passed due and
impaired $
<30 $
31-60 $
61-90 $
>90 $
Within initial trade terms
$
2018
Trade and other receivables
15,221 – – – – – 15,221
Other receivables – – – – – – –
15,221 – – – – – 15,221
2017
Trade and other receivables
42,368 – – – – – 42,368
Other receivables – – – – – – –
42,368 – – – – – 42,368
The company does not hold any financial assets whose terms have been negotiated, but which would otherwise be past due or impaired.There are no balances within trade receivables that contain assets that are impaired and are past due. It is expected that these balances will be received when due.

Financial Report 71

72 Annual Report 2017–18

Financial Report 73
Creative Partnerships Australia ABN: 88 072 479 835
Published by Creative Partnerships Australia Level 4, 2–4 Kavanagh Street Southbank VIC 3006 October 2018
Also published on creativepartnershipsaustralia.org.au
This publication is copyright. No part may be reproduced by any process except in accordance with the Copyright Act 1968
Design: Aer Design Print: Press Print Cover paper: Monza Satin Recycled Digital Internal paper: Sovereign Offset
Restless Arts by Shane Reid

Contact usLevel 4 2–4 Kavanagh Street Southbank VIC 3006
T +61 3 9616 0300
creativepartnershipsaustralia.org.au
Creative Partnerships A
ustralia A
nnual Report 2017–18

Creative Partnerships A
ustralia A
nnual Report 2017–18