new diagnostic imaging of the loggerhead sea turtle (caretta caretta) · 2020. 1. 24. · 4...
TRANSCRIPT

DIAGNOSTIC IMAGING OF THE LOGGERHEAD
SEA TURTLE (Caretta caretta )
Memoria presentada por
Ana Luisa Schifino Valente
Para optar al grado de Doctor en Veterinaria
Directores
Prof. Dr. Rafaela Cuenca Valera Prof. Dr. Ignasi Marco Sanchez
Dep. de Medicina i Cirurgia Animal – Facultat de Veterinaria
Universitat Autonoma de Barcelona
Bellaterra, 2007
3
AA CC KK NN OO WW LL EE GG MM EE NN TT SS
ACKNOWLEGMENTS (in Spanish)
Una tesis doctoral, a pesar de estar firmada por un solo autor, no es un trabajo individual, sino el fruto de un esfuerzo colectivo que sólo es posible gracias a la colaboración y el apoyo de varias personas, tanto en el aspecto científico e institucional como personal. Por esto, quiero aquí dejar expreso mis agradecimientos a estas personas, algunas de Brasil y otras que han estado a mi lado durante estos cuatro años en Barcelona.
A la Universidade Federal de Pelotas (UFPel - Brasil) por haberme concedido la oportunidad de realizar este
trabajo, estando ausente de mis actividades de enseñanza en esta institución. Al Instituto de Biología y a los colegas del Departamento de Morfología por haber apoyado mi excedencia para cursar el doctorado fuera del país. En especial al Prof. Dr. Althen Teixeira Filho, por apoyarme la excedencia asumiendo la responsabilidad de impartir mis clases en la asignatura de Anatomía de los Animales Domésticos I.
Quería agradecer también al Prof. Luis Fernando Minello (Dep. de Morfología, IB, UFPel), por asumir la
dirección del Núcleo de Reabilitação de Fauna Silvestre y representarme legalmente en la UFPel durante mi ausencia. Al Prof. Dr. Santiago Lavín (Dep. de Medicina i Cirugía Animal, Facultat de Veterinaria de la UAB) por la acogida,
amistad, compañerismo y confianza depositados en mí durante estos cuatro años de convivencia. Al Prof. Dr. Ignasi Marco (Dep. de Medicina i Cirugía Animal, Facultat de Veterinaria de la UAB) por su interés e
incentivo. Por su amistad y orientación en la realización de esta tesis. A mi amiga y directora de tesis Profa. Dra. Rafaela Cuenca (Dept de Medicina i Cirugía Animal, Facultat de
Veterinaria de la UAB). Te agradezco el hacerme sentir capaz, tu perseverancia, cariño e incentivo y sobretodo por los lazos de amistad y confianza que hemos creado.
Al Prof. Dr. Josep Pastor por la amistad, por su paciencia y habitual disponibilidad a ayudar. Por los apoyos
técnicos y los momentos divertidos que compartimos. A la Dra. María Angeles Zamora, neuróloga de Diagnosis Médica (Barcelona), por su dedicación, paciencia y
motivación por este trabajo. Por facilitarnos el acceso a la tomografía computerizada y resonancia magnética, pruebas sin las cuales no podríamos haber desarrollado este trabajo.
Al director del Centro de Recuperación de Animales Marinos, Sr. Ferran Alegre (CRAM), por permitir que
utilizáramos los animales atendidos por el centro.

4
DD II AA GG NN OO SS TT II CC II MM AA GG II NN GG OO FF TT HH EE LL OO GG GG EE RR HH EE AA DD SS EE AA TT UU RR TT LL EE
A la María Luz Parga MSc., veterinaria del CRAM, por su compañerismo, apoyo y por poner a nuestra disposición sus pacientes para la realización de esta tesis. Al biólogo del CRAM, Alex Bartolí, por ayudarnos en el manejo de las tortugas. A los muchos voluntarios del CRAM que ayudaran en algunas de las etapas de este trabajo, por su disponibilidad y entusiasmo.
Al Dr. Jaume Martorell, Clínico de animales exóticos del Hospital Veterinario de la UAB, por su ayuda en la ejecución de las radiografías digitales.
Al Prof. Dr. Jordi Franch (Dep. de Medicina i Cirugía Animal, Facultat Veterinaria de la UAB) por las
sugerencias y apoyo técnico en las radiografías de las tortugas.
A la Profa. Dra. Yvonne Espada (Dep. de Medicina i Cirugía Animal, Facultat Veterinaria de la UAB) por la realización de las ecografías y por su apoyo técnico en este área.
Al Prof. Dr. Francisco Reina (Dep. de Anatomía, Facultat Medicina de la UAB) la realización de los cortes
anatómicos de las tortugas. A los Profs. Drs. Manel López Bejar y Carlos López Plana (Dep. de Sanitat i Anatomia Animal, Facultat
Veterinaria de la UAB) y al Museo de Zoología de Barcelona por poner a nuestra disposición esqueletos de tortuga utilizados como referencia en este estudio.
Al Prof. Dr. Thomas Dellinguer, Universidade da Madeira, Portugal, por aceptar mi propuesta de cooperación en
su proyecto, permitiendo mi estancia de 3 meses en esta Universidad. A los revisores anónimos de los artículos por sus críticas constructivas.
A los amigos del Servicio de Ecopatologia de Fauna Salvaje (SEFaS), Encarna Casas, Gregorio Mentaberre,
Carlo Siracusa, Ester Bach, Francesc (Kiko) Closa, Montse Mesalles, Cintia Mastrorilli, Pancha Alcayaga y Jordi López. En esta corta jornada que es la realización de la tesis, tuvimos momentos para reírnos juntos, llorar, alegrarnos, cansarnos, quejarnos, lamentarnos y consolarnos por los tropiezos de la vida. Os agradezco de todo corazón el cariño con que me recibieron.
A la Dra. Roser Velarde, histopatológa del SEFaS, que a pesar del poco tiempo de convivencia hemos
despertado muchas cosas en común.
5
AA CC KK NN OO WW LL EE GG MM EE NN TT SS
A la Profa. Dra. Teresa Mora por los momentos relajados que pasamos en compañía de Rafi en la hora de la comida y en aquel típico “cafezinho” en la salida del restaurante de la facultad.
A mi amigo Prof. Dr. Luis Carlos Guerreiro (Universidade da Madeira) por el apoyo logistico durante mi estancia
en Funchal, Portugal. A mi amigo Juan García Marqués por su colaboración en la edición de esta tesis. A las señoras María Antonia y
Eulalia Blanch Piera por el cariño de la acogida y por hacer parte de mi familia en España. A mis amigas Ana Paula Albano, Rosa Massaro y Neila Moraes por ser una prolongación mía en Brasil y a
Patricia Vives por ser la segunda madre de mis perros mientras estuve ausente. A mis padres, Nestor Saraiva Valente y Elci Schifino Valente, por soportar mi ausencia en silencio, por desear lo
mejor para mí, aunque que implicase un dolor en sus corazones. Os agradezco por la paciencia de la espera y por apoyar mis ideales incondicionalmente. En memoria a mi tía, Eldi Schifino Fonseca, para quien la espera fue demasiado larga, lamento no haber estado a tu lado en el momento en que nos dejaste. Que Dios esté contigo, donde estés.
A mi pareja Lluís Doutres Blanch por su cariño y amor. Por preocuparse por mí en los momentos críticos de adaptación al cambio de cultura y país. Por su constante estímulo a mi avance y por la comprensión en los momentos que dejé de estar en el hogar por estar en la Universidad. Por fin, me faltarían líneas para explicar cuánto una persona puede ser importante en la vida de otra. A ti cariño, y a nuestras “buppies” (perritas Tosca y Cane) os agradezco por los momentos de felicidad que compartimos.
A aquellos que colaboraron directa o indirectamente en la realización de este trabajo y que por ventura no
fueron mencionados en este apartado, por favor, sepáis que tengo mi profundo reconocimiento. A ti, lector, si terminas la lectura.
7
AA CC KK NN OO WW LL EE GG MM EE NN TT SS
A las tortugas... Sí. A las tortugas... Sin tu sufrimiento no habría el motivo, Sin tu amenaza no habría preocupación en conservarte
Sin tu existencia no habría tesis y… Lo más importante, los océanos no serian tan sabios. Lo siento por retardar tu retorno al mar Tu alma pertenece a las corrientes Pues tu libertad es azul.
Perdóname por transportarte, por sujetarte, pincharte... Ojala podamos redimir tu sufrimiento a través de nuestro auxilio.

9
TT AA BB LL EE OO FF CC OO NN TT EE NN TT SS
1. INTRODUCTION...................................................................................................................................................... 9
1.2. Objectives............................................................................................................................................................ 15 1.3. Literature review.................................................................................................................................................. 15
1.3.1. Evolution of sea turtles ............................................................................................................................. 16 1.3.2. Taxonomy of sea turtles ........................................................................................................................... 16 1.3.3. Morphological features of the Loggerhead sea turtle ............................................................................... 17 1.3.4. Distribution ............................................................................................................................................... 20 1.3.5. Life cycle .................................................................................................................................................. 21 1.3.6. Feeding .................................................................................................................................................... 22 1.3.7. Reproductive aspects ............................................................................................................................... 22 1.3.8. Population trends ..................................................................................................................................... 24 1.3.9. Mortality, conservation, threats to survival and protection ....................................................................... 24 1.3.10. Diagnostic imaging techniques and application in reptilian medicine and biology ................................ 26
1.3.10.1. Radiology................................................................................................................................. 27 1.3.10.2. Ultrasound ............................................................................................................................... 28 1.3.10.3. Computed Tomography........................................................................................................... 29 1.3.10.4. Magnetic Resonance Imaging ................................................................................................. 30
1.4. Cited references.................................................................................................................................................. 32
2. SUMMARY OF RESULTS AND DISCUSSION ..................................................................................................... 39
3. CONCLUSIONS (IN PORTUGUESE).................................................................................................................... 41
4. ARTICLES.............................................................................................................................................................. 48
4.1. Cervical and coelomic radiology of the Loggerhead sea turtle, Caretta caretta.................................................. 51 4.2. Radiographic anatomy of the limbs of the juvenile and subadult Loggerhead sea turtles (Caretta caretta). ...... 59
4.3. Normal ultrasonographic imaging of the Loggerhead sea turtle (Caretta caretta) .............................................. 74 4.4. Computed tomography of the vertebral column and coelomic structures in the normal Loggerhead sea turtle (Caretta caretta) ..................................................................................................................... 90
4.5. Sectional anatomic and magnetic resonance imaging features of coelomic structures of Loggerhead sea turtles............................................................................................................................................. 102
47
13
51
77
93
105
16
41
53
61

10
DD II AA GG NN OO SS TT II CC II MM AA GG II NN GG OO FF TT HH EE LL OO GG GG EE RR HH EE AA DD SS EE AA TT UU RR TT LL EE
5. ANNEXES – ADDITIONAL PAPERS ................................................................................................................... 112
5.1. Evaluation of Doppler ultrasonography for the measurement of blood flow in young Loggerhead sea turtles (Caretta caretta).................................................................................................................. 115
5.2. Ingesta passage and gastric emptying times in Loggerhead sea turtles (Caretta caretta)................................ 125
115
117
127

11
INTRODUCTION

12

13
II NN TT RR OO DD UU CC TT II OO NN
.......................................................................................................................................................................................
1. INTRODUCTION
Human activity causes constant and increasing threats to wildlife. From oil spills and boat strikes to habitat loss and entanglement with potentially fatal debris, marine animals in crisis are a sadly common worldwide feature (IUCN, 2006). The Loggerhead sea turtle (Caretta caretta) in the Mediterranean faces an imminent threat of extinction due to accidental captures and habitat loss (Margaritoulis et al., 2003; Gómez de Segura et al., 2006). Each year, marine rescue centers along the Mediterranean coast have become inundated with juvenile and subadult turtles, the majority of which are injured as a result of human activities. Between 1994 and 2005, 527 Loggerhead sea turtles were rescued in the Centre de Recuperació de Animals Marins de Catalunya (CRAM) in Premià de Mar (Barcelona, Spain), accounting for 88% of the admissions caused by fishery interactions, most of them related with the ingestion of fishhooks (CRAM, 2006). Veterinary Healthcare and Education Programs designed to specifically address the medical and biological issues that accompany reintroduction programs have been performed by this center in scientific agreement with the Servei d’Ecopatologia de Fauna Salvatge of the Universitat Autònoma de Barcelona.
Chelonian medicine represents a great challenge to veterinarians. A major part of the unusual anatomy and physiology of the turtles and tortoises is scarcely known and routine clinical examination usually applied to domestic animals provides little information about their health status (MCarthur et al., 2004). Injured sea turtles usually display few clinical signs of illness and therefore diagnosis in this species is frequently poor. Diagnostic imaging techniques are routinely applied in human medicine and increasingly so in companion animal medicine. However, because of differences in anatomy, physiology, physiopathology, indications, specificity and sensibility of these techniques in sea turtles, the medical references can not be directly deduced from those of dogs/cats or even other reptilian species (Silverman and Jansen, 2006). Specialized medical databases for radiology, ultrasonography, computed tomography and magnetic resonance for Loggerhead sea turtles are needed in order to provide references for image interpretation. These techniques provide a good view of anatomical structures and organs, are non-invasive, and suitable for accurate diagnosis as well as assessing biological data in this endangered species.
The most widely-used imaging techniques in current veterinary medicine are radiography and ultrasonography. Although the use of computed tomography and magnetic resonance imaging are usually limited to specialized facilities, use of them is imperative when dealing with endangered species such as the Loggerhead sea turtle. In this work we have studied Loggerhead sea turtles admitted and kept temporarily at the Centre de Recuperació de Animals Marins de
Catalunya (CRAM) between 2004-2005. The normal parameters for radiology, ultrasound, computed tomography and magnetic resonance of this species were studied and described in the five scientific papers presented in this thesis. Additionally, two other papers concerning the use of Doppler ultrasonography and evaluation of the ingesta passage
14
DD II AA GG NN OO SS TT II CC II MM AA GG II NN GG OO FF TT HH EE LL OO GG GG EE RR HH EE AA DD SS EE AA TT UU RR TT LL EE
times in the Loggerhead sea turtle are also included as annex documents. The last paper, although not related to a specific imaging technique, was included due to the use of specialized radiographic markers required to dog and cat testing. Clinically healthy animals were subjected to radiographic and ultrasonographic examination at the facilities of the Veterinary Hospital of the Universitat Autònoma de Barcelona; the computed tomography and resonance magnetic scans were performed in a private human radio-diagnostic clinic in Barcelona.

15
OO BB JJ EE CC TT II VV EE SS
1.2. OBJECTIVES The aims of this work are:
1. To provide the normal cervical and coelomic radiographic appearance of the Loggerhead sea turtle, in the dorso-ventral view, as well as other useful landmarks, to allow for correlation of shell scutes with internal anatomic structures.
2. To provide the normal radiographic anatomy of the limbs of the Loggerhead sea turtle in combination with data
obtained from computed tomography - osteological, gross anatomical and histological data.
3. To describe the normal ultrasonographic appearance of cervical structures and coelomic organs of the Loggerhead sea turtle, and to provide the respective images of frozen cross-sections for anatomical reference.
4. To provide normal computed tomographic images of the vertebral column and coelomic structures of the
Loggerhead sea turtle, by establishing reference standards for organ size and position in this species; to provide images of virtual tracheo-bronchoscopy and 3D reconstructions of the respiratory tract and bone structures.
5. To provide the normal magnetic resonance imaging (MRI) appearance of coelomic structures of Loggerhead
sea turtles in T1 and T2-weighted scans via comparison with cross-sectional anatomic sections of this species.

16
DD II AA GG NN OO SS TT II CC II MM AA GG II NN GG OO FF TT HH EE LL OO GG GG EE RR HH EE AA DD SS EE AA TT UU RR TT LL EE
1.3. LITERATURE REVIEW
1.3.1. Evolution of sea turtles The oldest turtle fossils found date from the Jurassic period (210 million years ago). Proganochelys is the most
primitive turtle known; it was a heavily-armoured animal with some of the features seen in the turtles today, such as presence of the shell consisting of a large number of bones including the ribs that are fused to form a single solid plate (Gaffney, 1990). In the middle Jurassic period, the main lineage of turtles had split into two branches: the side-neck turtles (pleurodires), which protect the head by folding the neck and head over to one side, and the hidden-neck or arch-neck turtles (cryptodires), which pull the neck into a vertical S-curve and retract the head straight back between the shoulders (Perrine, 2003). The side-necked turtles produced many sea-going species during the Cretaceous period (145 to 65 million years ago), but all of these died out. Modern pleurodires live in freshwater. Sea turtles date from the Cretaceous and belonged to the hidden-neck group, to which the majority of turtles belong today. The hidden-neck group comprised many families, most of which had died out by the early Cretaceous period. Fossil records of chelonioids before the Late Cretaceous have been poorly documented. The Cretaceous sea turtle Archelon ischyros was first recorded based on fossils found in South Dakota, E.U.A. (Wieland, 1896). However, according to Hirayama (1998) the oldest sea turtle known dates from the Early Cretaceous stage (about 110 million years ago), the fossil being found in eastern Brazil. Four important families of hidden-neck sea turtles did survive into the mid-Cretaceous period. Two of these families, the Dermochelyidae and the Cheloniidae, have modern descendants. The genera and eight species of sea turtles known today all originated within the last 60 to 10 million years. The leatherback sea turtle is the only surviving member of the Dermochelyidae. The Loggerhead sea turtle and other remaining modern sea turtles belong to the Cheloniidae.
1.3.2. Taxonomy of sea turtles The eight species of modern sea turtles are found within two families: Dermochelyidae and Cheloniidae. The first
family has only one species: the Leatherback sea turtle (Dermochelys coriacea). The Cheloniidae family comprises six species of sea turtles: the Green turtle (Chelonia mydas), Loggerhead sea turtle (Caretta caretta), Hawksbill turtle (Eretmochelys imbricata), Kemp’s ridley (Lepidochelys kempii), Olive ridley (Lepidochelys olivacea) and the Flatback sea turtle (Natator depressus) (Perrine, 2003).
The name Caretta is a latinized version of the French word ‘caret’, meaning ‘turtle, tortoise, or sea turtle’ (Smith and Smith, 1980). The name ‘caret’ or ‘carey’ (Spanish) is usually associated in colloquial language with the Hawksbill turtle rather than the Loggerhead, and the name probably resulted from Linnaeus' confusion over the identity of these species (Brongersma, 1961; Wallin, 1985).

17
LL II TT EE RR AA TT UU RR EE RR EE VV II EE WW
Taxonomy of the Loggerhead sea turtle Phylum Chordata
Subphylum Vertebrata Superclass Tetrapoda
Class Reptilia Subclass Anapsida
Order Testudines (Linnaeus 1766) Suborder Cryptodira (Gray 1825)
Superfamily Chelonioidae Family Cheloniidae Caretta caretta (Linnaeus, 1758)
1.3.3. Morphological features of the Loggerhead sea turtle
The Loggerhead sea turtle is named for its relatively large and triangular head, which support powerful jaws that enable the species to feed on hard-shelled prey, such as whelks and conch. The neck and flippers are usually brown to reddish, being brown on top and pale yellow on the sides and bottom. Front flippers are short and thick with 2 claws while the rear flippers can have 2 or 3 claws (Brongersma, 1961; Pritchard and Trebbau, 1984).
Some aspects of the external morphology of this species change depending on the size of the specimen. Based on the carapace length, different age categories for Loggerhead turtles have been established (Dood, 1988). Morphological features are different in the hatchlings, in which the external colour pattern varies from light to dark brown to dark gray dorsally. Flippers are dark gray to brown above with white to white-gray margins. The coloration of the plastron is generally yellowish to tan. At emergence, hatchlings average 45 mm in length and weigh approximately 20 g (Caldwell et al., 1955). The category ‘hatching’ includes the turtles from their hatching to the first few weeks of life as they begin rafting on currents for the life stage known as the ‘lost year’ (Carr, 1986). This latter category includes turtles up to 10 cm straight-line carapace length (SLCL) and is characterized by the presence of the umbilical scar (Dood, 1988) (Fig. 1A).
Juveniles are those in the pelagic rafting life stage and have an SLCL of approximately 40 cm. The center of the dorsal scutes is elevated into a sharp keel or spine (Dood, 1988) (Fig. 1B). Subadults are those between the end of the pelagic rafting stage to the onset of sexual maturity (Fig. 1C), which occurs about 70-90 cm SLCL, depending on the population (Dood, 1988). In the Western Atlantic, the adult Loggerhead sea turtle typically has a 73-107cm carapace length and weighs up to 180 kg (Bjorndal et al., 1983). In the Mediterranean sea, adults are smaller than those from the Atlantic, showing a carapace length of about 90 cm and weighing less than 100 Kg (Fig. 1D) (Pritchard and Mortimer, 1999). The size at sexual maturity for males is assumed to be similar to that for females.
18
DD II AA GG NN OO SS TT II CC II MM AA GG II NN GG OO FF TT HH EE LL OO GG GG EE RR HH EE AA DD SS EE AA TT UU RR TT LL EE
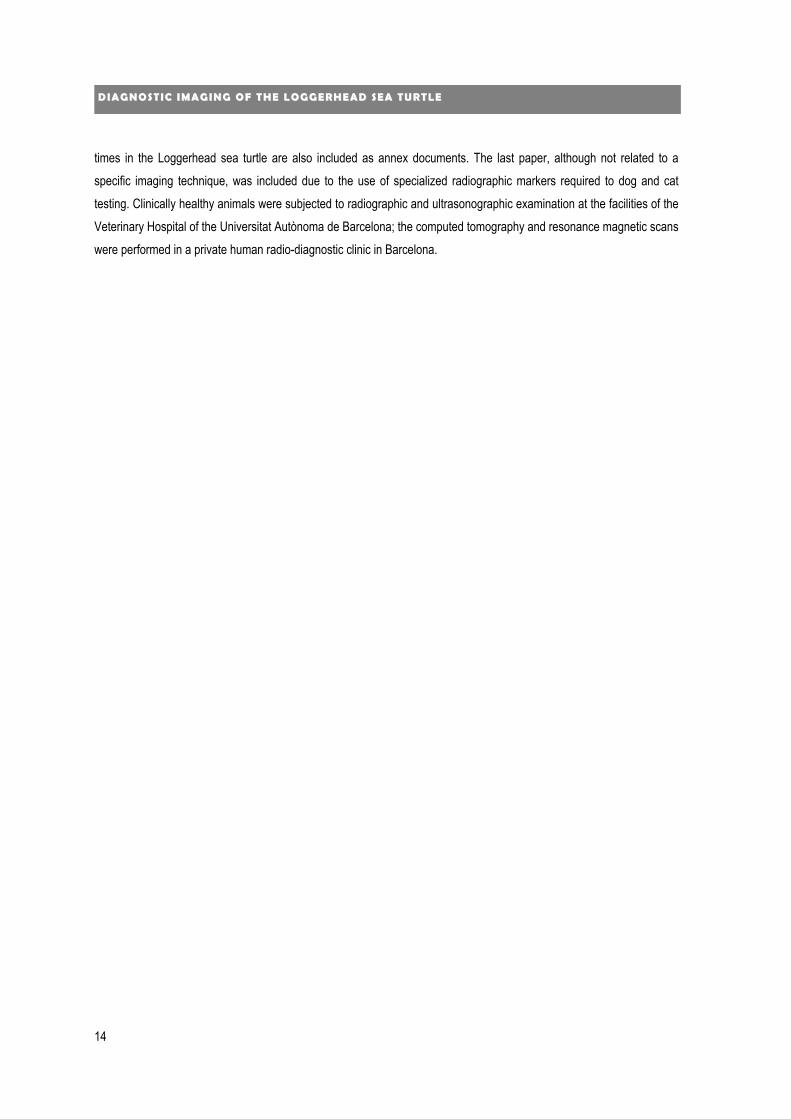
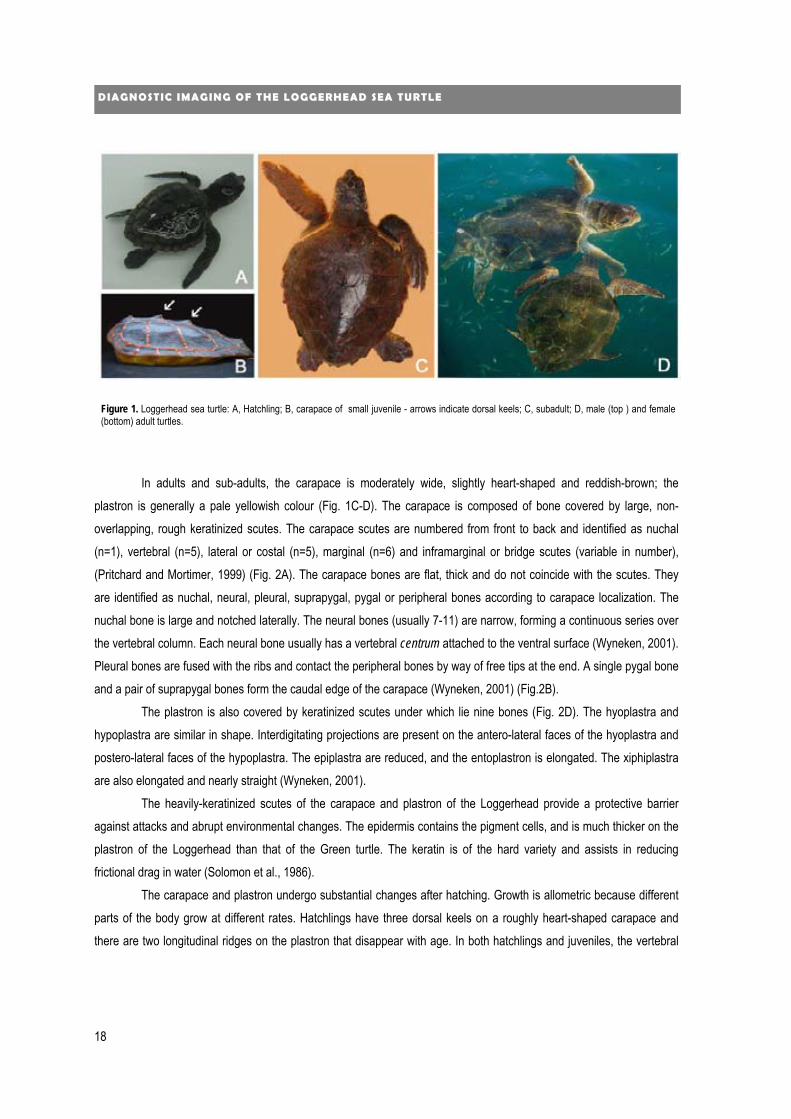
In adults and sub-adults, the carapace is moderately wide, slightly heart-shaped and reddish-brown; the
plastron is generally a pale yellowish colour (Fig. 1C-D). The carapace is composed of bone covered by large, non-overlapping, rough keratinized scutes. The carapace scutes are numbered from front to back and identified as nuchal (n=1), vertebral (n=5), lateral or costal (n=5), marginal (n=6) and inframarginal or bridge scutes (variable in number), (Pritchard and Mortimer, 1999) (Fig. 2A). The carapace bones are flat, thick and do not coincide with the scutes. They are identified as nuchal, neural, pleural, suprapygal, pygal or peripheral bones according to carapace localization. The nuchal bone is large and notched laterally. The neural bones (usually 7-11) are narrow, forming a continuous series over the vertebral column. Each neural bone usually has a vertebral centrum attached to the ventral surface (Wyneken, 2001). Pleural bones are fused with the ribs and contact the peripheral bones by way of free tips at the end. A single pygal bone and a pair of suprapygal bones form the caudal edge of the carapace (Wyneken, 2001) (Fig.2B).
The plastron is also covered by keratinized scutes under which lie nine bones (Fig. 2D). The hyoplastra and hypoplastra are similar in shape. Interdigitating projections are present on the antero-lateral faces of the hyoplastra and postero-lateral faces of the hypoplastra. The epiplastra are reduced, and the entoplastron is elongated. The xiphiplastra are also elongated and nearly straight (Wyneken, 2001).
The heavily-keratinized scutes of the carapace and plastron of the Loggerhead provide a protective barrier against attacks and abrupt environmental changes. The epidermis contains the pigment cells, and is much thicker on the plastron of the Loggerhead than that of the Green turtle. The keratin is of the hard variety and assists in reducing frictional drag in water (Solomon et al., 1986).
The carapace and plastron undergo substantial changes after hatching. Growth is allometric because different parts of the body grow at different rates. Hatchlings have three dorsal keels on a roughly heart-shaped carapace and there are two longitudinal ridges on the plastron that disappear with age. In both hatchlings and juveniles, the vertebral
Figure 1. Loggerhead sea turtle: A, Hatchling; B, carapace of small juvenile - arrows indicate dorsal keels; C, subadult; D, male (top ) and female(bottom) adult turtles.

19
LL II TT EE RR AA TT UU RR EE RR EE VV II EE WW
scutes are wider than they are long, but as the turtle grows, there is greater increase in length relative to width. Although the increase in length does not occur simultaneously in all scutes or at the same rate (Brongersma, 1972) the vertebral scutes V1 to V4 tend to increase length relative to width. The vertebral scutes of juveniles are keeled with a knob-like process on the posterior portion of each keel, which is most distinct on the anterior scutes. At a length of 35.0 cm, the knobs generally disappear although the keels are still present, and at 58.0 cm the keels also disappear (Brongersma, 1972).
Figure 2: Morphology of the carapace and plastron of Loggerhead sea turtles. A, Dorsal view of the carapace; B, Dorsal view of carapace bones; C,Ventral view of plastron; D, Ventral view of plastron bones. Scutes are indicated in the legend. Drawings adapted from Pritchard et al., 1999 andWyneken, 2001.

20
DD II AA GG NN OO SS TT II CC II MM AA GG II NN GG OO FF TT HH EE LL OO GG GG EE RR HH EE AA DD SS EE AA TT UU RR TT LL EE
The bones of the forearm and hand of the Loggerhead sea turtle are illustrated by Walker (1973) and especially the humerus, by Zangerl (1958) and Zug et al. (1986). Rhodin (1985) noted similarities in patterns of skeletal growth between the Loggerhead and freshwater turtles. In both groups, non-calcified cartilage remains avascularised, and a subphyseal plate is formed causing transient isolation of a metaphyseal cartilage cone. However, in the Loggerhead, the central cartilaginous zone does not hypertrophy and remains uncalcified even as the peripheral zone of the subphyseal plate becomes ossified. Also, the basophilic network of Suzuki's tissue is localized in the zone of cartilaginous expansion in the center of the subphyseal plate rather than in the epiphysis (Rhodin, 1985). These modifications may be related to the rapid growth in the uncalcified portion of the subphyseal plate.
There are three comprehensive guides to Loggerhead sea turtle anatomy currently available. Rainey (1981) used black-and-white photographs to illustrate the locations of organ systems in a juvenile male Loggerhead and three other species of sea turtles. Wolke and George (1981) presented a guide for conducting necropsies under field conditions. Line drawings supplement a description of dissection methods, and information on fixatives, equipment, and data forms is provided. In a comprehensive publication, Wyneken (2001) provided a systematic description of sea turtle anatomy which includes the Loggerhead.
The main morphological features of the Loggerhead sea turtle distinguishing it from other sea turtle species are the presence of two pairs of prefrontal scales; elongated carapace, somewhat tapered posteriorly, and thickened above the caudal region; non-imbricated dorsal scutes (except in some young specimens); smooth adult vertebral scutes, although small turtles have projections toward the rear of lateral and vertebral scutes (more conspicuous on the latter); five pairs of pleural scutes, with first contact at the pre-central; usually three or four infra-marginal enlarged and poreless laminae; two claws on each flipper as hatchlings; very broad triangular head with powerful jaws; reddish-brown carapace; yellowish-white to yellowish-brown plastron (Pritchard and Mortimer, 1999). Detailed descriptions are also to be found in Smith and Smith (1980) and Pritchard and Trebbau (1984).
1.3.4. Distribution
Loggerheads are circumglobal, inhabiting continental shelves, bays, lagoons, and estuaries throughout the temperate, subtropical and tropical regions of the Atlantic, Pacific, and Indian oceans as well as the Mediterranean, Red and Black seas. In the Atlantic, the Loggerhead turtle's range extends from Newfoundland (Canada) to as far south as Argentina (Dood, 1988; FAO, 1990). The limit of distribution of the Loggerhead sea turtle is temperature-dependent. The species is widely distributed in coastal tropical and subtropical waters with temperatures between 16°- 20°C. The species rarely survives in water below 10°C. Therefore, in the winter turtles may remain buried in the mud of quite deep water. During warm years they may reach northern waters looking for thermal comfort (e.g. Murmansk and Barents Sea) and in the spring and summer juveniles, sub-adults and some adults are found in feeding grounds (Lutz and Musick, 1996). Adult Loggerheads are known to make extensive migrations between foraging areas and nesting beaches. During the summer, nesting occurs primarily in the subtropics (Dood, 1988).
21
LL II TT EE RR AA TT UU RR EE RR EE VV II EE WW
In the Western Atlantic, during non-nesting years, adult females from U.S. beaches are distributed in waters off the Eastern U.S. and throughout the Gulf of Mexico, Bahamas, Greater Antilles, and Yucatán. Along the Brazilian cost, the species nest from the north of Rio de Janeiro to the state of Sergipe. Areas in southern Brazil are used as feeding grounds (Marcovaldi and Marcovaldi, 2004). In the North-eastern Atlantic, there are widespread records of Loggerheads from Europe, especially from the British Isles. Strandings have been summarized by Brongersma (1972) and are primarily of juvenile and subadult turtles. Loggerheads do not nest anywhere on the Atlantic coast of Europe.
In the Mediterranean, the Loggerhead sea turtle has been recorded from Spain, including the Balearic Islands (Salvador 1978, 1985; Pascual 1985; Carr 1986b), France, Corsica, Italy (including Sicily and Lampedusa Island), Sardinia, Greece, Bulgaria, Turkey, Israel, Cyprus, Egypt, Libya and Tunisia (Dood, 1988). Nestlings occur in the easternmost part of the Mediterranean while the western part consists of feeding areas. Individuals from the Mediterranean and North Atlantic populations congregate annually for feeding in a broad area around the Balearic Islands.
In the Eastern Pacific, Loggerheads have been reported as far north as Alaska, and as far south as Chile. In the United States, occasional sightings are reported from the coasts of Washington and Oregon, but most records are of juveniles off the coast of California. The west coast of Mexico, including the Baja Peninsula, provides critically important developmental habitats for juvenile Loggerheads. In the North Pacific, nesting areas for Loggerheads are found only in southern Japan.
1.3.5. Life cycle
Loggerheads occupy three different ecosystems during their lives: the terrestrial zone, the oceanic zone, and the neritic zone. Loggerheads nest on ocean beaches, generally preferring high energy, relatively narrow, steeply sloped, coarse-grained beaches (Dood, 1988). Immediately after hatchlings emerge from the nest, they begin a period of hyperactivity. During this period, hatchlings move from their nest to the surf, swim and are swept through the surf zone and continue swimming away from land for about one to several days.
After this swim frenzy period, post-hatchling Loggerheads take up residence in areas where surface waters converge to form local downwellings. These areas are often characterized by accumulations of floating material, such as seaweed (e.g., Sargassum). Post-hatchling Loggerheads may remain for months in waters just off the nesting beach or else are carried by ocean currents.
Once individuals are carried further offshore by ocean currents, they enter the oceanic zone. Within the North Atlantic, juvenile Loggerheads have been primarily studied in the waters around the Azores and Madeira (Bolten, 2003). Other populations exist (e.g., in the region of the Grand Banks off Newfoundland), but data on these populations are limited. The juvenile turtles around the Azores and Madeira spend the majority of their time at the top of the water column (depth of 5 m).

22
DD II AA GG NN OO SS TT II CC II MM AA GG II NN GG OO FF TT HH EE LL OO GG GG EE RR HH EE AA DD SS EE AA TT UU RR TT LL EE
Somewhere between the ages of 7 to 12 years (about 40 cm SLCL), oceanic juveniles migrate to near shore coastal areas (neritic zone) and continue maturing until adulthood. In the Western Atlantic, subadult developmental habitats include lagoons, estuaries, and the mouths of bays and rivers, rich in food resources. Adult Loggerheads are best known from shallow coastal waters adjacent to nesting beaches (Dood, 1988).
1.3.6. Feeding
The Loggerhead is primarily carnivorous, feeding on a wide variety of food items, especially molluscs. They eat horseshoe crabs, clams, mussels, and other invertebrates (Plotkin et al., 1993). The broad head and substantial jaw muscles seem particularly well-adapted for crushing hard-shelled prey (Hendrickson, 1980). Adults and juveniles feed in shallow waters of the continental shelves, often in water only a few meters deep. They spend much of their time around reefs, or along the bottom. Adults sometimes travel for thousands of kilometers. Hatchlings and young juveniles do not dive, staying near the surface, often in association with mats of floating seaweed (Dood, 1988).
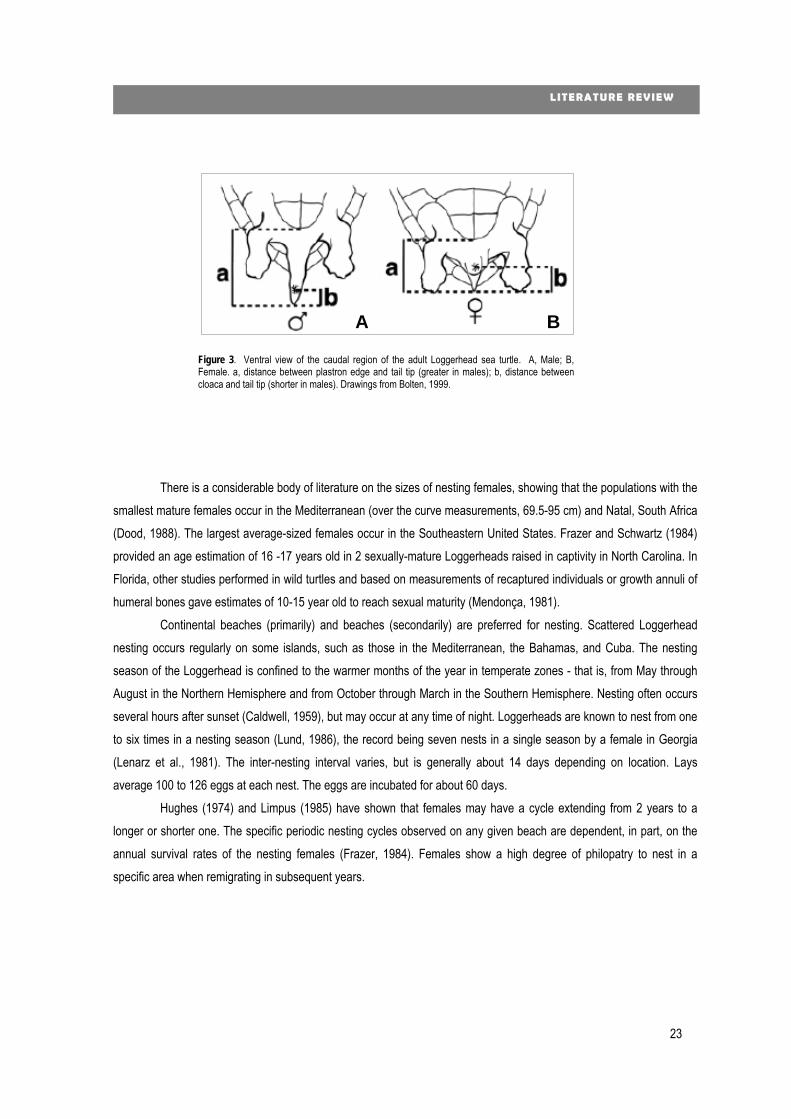
1.3.7. Reproductive aspects Sexual dimorphism is apparent only in adults. Hughes (1974) reported that sexual differentiation begins to become apparent in turtles with SLCL from 60.0 cm to 67.0 cm. Adult males have a longer tail than females and larger, curved claws (Figs. 1D and 3). Males also have a shorter plastron, presumably to accommodate their large muscular tail (Geldiay et al. 1982). Adult females have a more domed carapace than males, but males appear to be wider, and have a more gradually tapering carapace (Carr, 1952). Males also show a tendency to have a wider head (Hughes 1974; Pritchard and Trebbau, 1984). Sexual distinction of hatchlings, juveniles, and the smaller subadults is not possible through external examination; distinction is possible only through dissection, laparoscopy, histological examination, or radioimmunological assays (Owens, 1999; Wyneken, 2000; Brooke, 2005).
Age at first maturity has not been clearly determined yet. Data from researches in captivity indicate ages from 6 to 20 years; the back calculation from capture - recapture data of tagged nesting females in the Southeastern coast of the United States, analyzed through logistic and von Bertalanffy growth curves, produce ranges from 12 to 30 or more years, for minimum (74 cm) and maximum (92 cm) straight carapace lengths (FAO, 1990). However, age at sexual maturity may vary between populations, or even within populations, since growth rates show considerable variation within and between populations (Limpus, 1985).
23
LL II TT EE RR AA TT UU RR EE RR EE VV II EE WW
There is a considerable body of literature on the sizes of nesting females, showing that the populations with the smallest mature females occur in the Mediterranean (over the curve measurements, 69.5-95 cm) and Natal, South Africa (Dood, 1988). The largest average-sized females occur in the Southeastern United States. Frazer and Schwartz (1984) provided an age estimation of 16 -17 years old in 2 sexually-mature Loggerheads raised in captivity in North Carolina. In Florida, other studies performed in wild turtles and based on measurements of recaptured individuals or growth annuli of humeral bones gave estimates of 10-15 year old to reach sexual maturity (Mendonça, 1981). Continental beaches (primarily) and beaches (secondarily) are preferred for nesting. Scattered Loggerhead nesting occurs regularly on some islands, such as those in the Mediterranean, the Bahamas, and Cuba. The nesting season of the Loggerhead is confined to the warmer months of the year in temperate zones - that is, from May through August in the Northern Hemisphere and from October through March in the Southern Hemisphere. Nesting often occurs several hours after sunset (Caldwell, 1959), but may occur at any time of night. Loggerheads are known to nest from one to six times in a nesting season (Lund, 1986), the record being seven nests in a single season by a female in Georgia (Lenarz et al., 1981). The inter-nesting interval varies, but is generally about 14 days depending on location. Lays average 100 to 126 eggs at each nest. The eggs are incubated for about 60 days.
Hughes (1974) and Limpus (1985) have shown that females may have a cycle extending from 2 years to a longer or shorter one. The specific periodic nesting cycles observed on any given beach are dependent, in part, on the annual survival rates of the nesting females (Frazer, 1984). Females show a high degree of philopatry to nest in a specific area when remigrating in subsequent years.
A B
Figure 3. Ventral view of the caudal region of the adult Loggerhead sea turtle. A, Male; B,Female. a, distance between plastron edge and tail tip (greater in males); b, distance betweencloaca and tail tip (shorter in males). Drawings from Bolten, 1999.

24
DD II AA GG NN OO SS TT II CC II MM AA GG II NN GG OO FF TT HH EE LL OO GG GG EE RR HH EE AA DD SS EE AA TT UU RR TT LL EE
1.3.8. Population trends The most recent reviews show that two Loggerhead nesting beaches - South Florida (U.S.) and Masirah Island (Oman) accout for more than 10,000 females nesting per year. The status of the Oman nesting colony has not been evaluated recently. Total estimated nesting in the U.S. is approximately 68,000 to 90,000 nests per year. Recent analyses of nesting data from the Index Nesting Beach Survey Program in Southeast Florida show the population is declining. Similarly, long-term nesting data show that there was no statistical evidence of an increasing or decreasing trend in numbers of clutches laid per year in North Carolina, although a significant decrease in the number of turtles nesting and number of clutches laid per year was found from 1991 (Hawkes et al., 2005). In the Eastern Atlantic, the Cape Verde Islands support an intermediate-sized Loggerhead nesting assemblage. In 2000, researchers tagged over 1,000 nesting females on just 5 km of beach on Boa Vista Island (Ehrhart et al., 2003). In the Western Atlantic (excluding the U.S.), Brazil supports an intermediate-sized Loggerhead nesting assemblage. Reports provide an estimate of about 4,000 nests per year in Brazil (Ehrhart et al., 2003). Loggerhead nesting throughout the Caribbean is sparse.
In the Mediterranean, Loggerhead nesting is confined almost exclusively to the eastern portion of the Mediterranean Sea. The main nesting assemblages occur in Cyprus, Greece, and Turkey. However, small numbers of Loggerhead nests have been recorded in Egypt, Israel, Italy, Libya, Syria, and Tunisia. Based on the recorded number of nests per year in Cyprus, Greece, Israel, Tunisia and Turkey, Loggerhead nesting in the Mediterranean ranges from about 3,300 to 7,000 nests per season (Margaritoulis et al., 2003).
Loggerheads nest throughout the Indian Ocean and, with the exception of Oman, the number of nesting females is small. Most trends in Loggerhead nesting populations in the Indian Ocean are unknown.
Loggerhead populations in Honduras, Mexico, Colombia, Israel, Turkey, Bahamas, Cuba, Greece, Japan, and Panama have been declining. This decline continues and is primarily attributed to incidental capture in fishing gear, directed harvest, coastal development, increased human use of nesting beaches, and pollution (NOAA, 1991).
1.3.9. Mortality, conservation, threats to survival, and protection
Hatchlings of Loggerhead sea turtles are preyed on primarily by ghost crabs, sharks, predatory bony fishes, as well as a variety of mammals, including the water mongoose, genets, raccoons, foxes, dogs, and cats (Heithaus et al., 2002). A variety of birds also take hatchlings that emerge during daylight hours. Mortality from non-predatory animals, including disease, starvation, and cold-stunning undoubtedly occurs, but nothing is known about the effects on specific populations. Juvenile, subadult and adult Loggerheads are preyed on by sharks, particularly tiger sharks (Galeowdo
cuvieri).

25
LL II TT EE RR AA TT UU RR EE RR EE VV II EE WW
In the wild, juveniles, subadult and adult Loggerhead sea turtles are known to be affected by two main diseases - spirorchidiasis and fibropapillomatosis - that may be responsible for significant debilitation and mortality. The latter was first described in captured adult Green turtles but similar tumours have been found in Loggerheads (Lackovich et al., 1999). Externally, the lesions are characterized by small to large multiple areas of minimal to mild epidermal hyperplasia forming arborizing tumours (Jacobson et al., 1989). Internal nodules may be found at multiple visceral sites such as the liver, kidney, lung and gastrointestinal tract. A herpes-like virus has been identified and associated with the tumour occurrence (Jacobson et al., 1991; Lackovich et al., 1999). Although a worldwide disease, its prevalence ranges from 0% to 92% in some areas. The parasitic infection by spirorchids is common in Loggerhead sea turtles, mainly in turtles from the east coast of the United States of America (Wolke et al., 1982). Species representing three genera, Carettacola, Hapalotrema and Neospirorchis have been reported in the heart or blood vessels of the Loggerhead sea turtle (Manter and Larson, 1950). The infected turtles present granulomatous gastritis, enteritis, hepatitis, pneumonitis and nephritis. Acute and chronic vasculitis accompanied by metastasis of eggs is present and severe hepatic hemosiderosis is caused by the anemia (Wolke et al., 1982). Adult parasites may cause endocarditis, arteritis and thrombosis of the blood vessels (Gordon et al., 1998). Recently, Jacobson et al. (2006) have recorded the presence of Neospirorchis associated with neurological disorders in Loggerhead sea turtles found in waters off south Florida. There are no records of fibropapilloma or spirorchidisis in Loggerhead sea turtles in the Mediterranean Sea.
In addition to the natural causes of mortality and typical diseases, sea turtles are widely exploited by man for their eggs, meat and shells. Their survival is seriously threatened by many anthropologic factors such as fishing activities, pollution, loss of nesting sites, and tourism. In the Mediterranean, general anthropogenic degradation has been noted at some significant nesting sites, while some historic host nesting areas have either been lost to turtles (e.g. Malta) or become severely degraded (e.g. Israel). The main anthropogenic threats affecting marine turtle nesting areas include tourism and recreational activities, increasing human presence, vehicular and pedestrian traffic, beachfront lighting and noise, uncontrolled development and construction, beach pollution, marine pollution, planting of vegetation, boat strikes, near-shore fishing and the use of underwater explosives (Margaritoulis et al., 2003). Mediterranean fisheries have an enormous impact on the local Loggerhead sea turtle stock. About 20,000 Loggerhead turtles are estimated as being caught each year by Spanish longline fisheries, with a mortality rate of at least 34% (Aguilar et al., 1995). Fisheries are characterized by: (i) multispecificity; (ii) a high level of interaction between trawls and set gears (both use the same fishing areas and resources); (iii) the major importance of artisanal fisheries, and (iv) the increasing size of tuna fleets. The demersal species of greatest commercial interest are: hake (Merluccius
merluccius), blue whiting (Micromesistius poutassou), red shrimps (Aristeus antennatus), Norway lobster (Nephrops
norvegicus), red mullet (Mullus surmuletus and Mullus barbatus), octopuses (Octopus vulgaris and Eledone cirrhosa) and sole (Solea vulgaris). Of the small pelagic species, sardine (Sardina pilchardus) and anchovy (Engraulis
encrasicolus) are the most significant. Blue-fin tuna (Thunnus thynnus) and swordfish (Xyphias gladius) are the most important large pelagic species and albacore (Thunnus alalunga) ranks third in importance.
26
DD II AA GG NN OO SS TT II CC II MM AA GG II NN GG OO FF TT HH EE LL OO GG GG EE RR HH EE AA DD SS EE AA TT UU RR TT LL EE
The problems related to the interaction between fisheries and turtles in the Mediterranean are common to all fisheries. However, local features can affect reproduction, feeding or wintering populations of turtles differently in different areas (Tudela, 2000). Bottom trawl, surface longline and driftnet, along with coastal gillnet and entangling net fisheries have a large bycatch causing fishery-related mortality (Argano and Baldari, 1983; De Metrio et al., 1983; Deflorio et al., 2005). The Barcelona Convention adopted an Action Plan for the Conservation of Mediterranean Marine Turtles in 1989, acknowledging that catches by fishermen are the most serious threat to the turtles at sea (Tudela, 2000). Loggerhead turtles are protected by various international treaties and agreements as well as national laws. These are listed in Appendix I of the Convention on International Trade in Endangered Species of Wild Flora and Fauna (CITES), which means that international trade of this species is prohibited. Loggerheads are listed in Appendices I and II of the Convention on Migratory Species (CMS) and are protected under the following auspices of CMS: the Memorandum of Understanding on the Conservation and Management of Marine Turtles and their Habitats of the Indian Ocean and South-East Asia (IOSEA) and the Memorandum of Understanding Concerning Conservation Measures for Marine Turtles of the Atlantic Coast of Africa. Loggerheads are also protected under Annex II of the Specially Protected Areas and Wildlife (SPAW) Protocol of the Cartagena Convention. Additionally, the U.S. is a party to the Inter-American Convention for the Protection and Conservation of Sea Turtles (IAC), which is the only binding international treaty dedicated exclusively to marine turtles.
1.3.10. Diagnostic imaging techniques and application to reptilian medicine and biology
Reptilians usually show very poor clinical signs of most diseases, and frequently physical examination does not provide sufficient information for correct diagnosis. Diagnostic imaging techniques such as radiography, ultrasonography, computed tomography (CT) and magnetic resonance (MRI) are reliable techniques for the purposes of accurate diagnosis. These techniques are particularly useful in chelonians, due to the physical limitations imposed by the carapace and plastron, which make traditional methods of clinical examination difficult to use. Although designed primarily for diagnosis in humans, over the past few decades sophisticated techniques such as CT and MRI have been more frequently applied in veterinary medicine, especially in small animals, in which they play an important role in the diagnosis of a range of pathologies.

27
LL II TT EE RR AA TT UU RR EE RR EE VV II EE WW
1.3.10.1. Radiology
Radiology is the most common and inexpensive diagnostic imaging method used in veterinary medicine, providing good overall information about the skeleton and respiratory system. However, in the case of reptiles (particularly chelonians) the overlying shell or epidermal scales normally compromise image quality. Information about restraint and positioning, body systems descriptions, interpretation and clinical findings in reptiles is available in various review articles and book chapters on reptile medicine (Rubel et al., 1991; Beymon et al., 1992; Gaudron et al., 2001; Hernandez-Divers and Hernadez-Divers, 2001; MCarthur et al., 2004; Girling and Raiti, 2004; Mader, 2006). In reptiles, radiographs are very useful for the diagnosis of bone fractures, osteometabolic disturbance, osteomyelitis, urinary bladder calculi, pneumonia and swallowing of foreign bodies. Additionally, the radiograph reveals the presence of the calcified shell of eggs, therefore being an important tool for reproductive studies too (Wilkinson et al., 2004). In turtles, radiographs have been used to verify swallowing of fishhooks (Hyland, 2002; Alegre et al., 2006) and to evaluate the digesta transit time in animals with presumptive diagnosis of intestinal obstruction (Di Bello et al., 2006).
Most high-capacity radiographic units can be set to produce good quality radiographs of reptilian patients. Three standard views are used to examine chelonians: dorso-ventral (top-to-bottom) using a vertical beam, plus lateral (side) and cranio-caudal (head-to-tail) using a horizontal beam. According to Silverman and Janssen (2006) and Gaudron et al. (2001) the dorso-ventral approach using a vertical beam is recommended in reptiles to evaluate the digestive and genitourinary systems, axial and limbs skeleton, and carapace and plastron (in chelonians). Of all reptilian patients, chelonians are the least difficult to restrain for radiography. They tend to lie quietly on the film cassette, offering no resistance (Rübel et al., 1991). The dorso-ventral view is obtained by placing the animal directly onto the film cassette. Since small chelonians tend to move off the cassette, adhesive tape may be attached to the rear edge of the carapace; the head and limbs should be extended out of the shell so that the limb structures are not superimposed on the internal structures (Siverman, 2006). Because chelonians have no diaphragm, in lateral and cranio-ventral views the head of the x-ray machine should be adjusted to give a horizontal beam; this allows the animal to be examined in the upright position, preventing the intestines from descending into the lung area and thus obscuring the view of the lung fields (Silverman and Janssen, 2006).
Mammography radiographic units, which provide better detail and resolution than standard radiographic equipment, may also be used for the radiography of reptiles (Hernandez-Divers and Hernandez-Divers, 2001). De Shaw et al. (1996) compared the use of various radiographic techniques in sand boa (Eryx colubrinus loveridgei), bearded dragon (Pogona vitticeps) and red-eared slider (Trachemys scripta elegans). The authors concluded that film produced using the matched mammography film-screen combination had greater resolution and detail and were superior to standard Bucky and table-top radiographs in the evaluation of bone and soft tissues.
28
DD II AA GG NN OO SS TT II CC II MM AA GG II NN GG OO FF TT HH EE LL OO GG GG EE RR HH EE AA DD SS EE AA TT UU RR TT LL EE
According to Jackson and Sainsbury (1992), when interpreting reptile radiographs, as for any other animal, it is important that the clinician follow a protocol in order to reach a correct diagnosis. The criteria to be considered are:
1. Organ position, shape, size, density and homogeneity. 2. Comparative size of the various organs. 3. State of nutrition of the reptile with respect to the gradation of density between skeleton, muscle mass,
soft tissues, gastrointestinal organs and their contents. Description of the normal radiographic anatomy is scarce for most reptilian species. Mader (2006) presents
some common body forms and a general overview of the various reptilian body parts, including a snake, a common green iguana (Iguana iguana), Malayan water monitor (Varanus salvator) and a non-specified tortoise. A large range of anatomic features may be observed over more than 6,000 reptile species; therefore specialized literature should be made available for each individual species in order to provide normal references and help in radiographic interpretation.
Over the past decade, radiography has also been used in studies of digestive physiology. A set of serial radiographs has been taken to locate radiodense barium-impregnated pills (BIPS®) or solution (barium sulphate or Gastrografin®) travelling with food, so as to evaluate the digestive transit time in dogs and cats. In chelonians, digesta passage time has been calculated using a solution of barium sulphate and Gastrografin® (Di Bello et al., 2006; Meyer, 1998; Taylor et al., 1996), and other markers (Barboza, 1995; Hailey, 1997; Hatt et al., 2002). Digesta passage times in the Loggerhead sea turtle are unknown, and BIPS® to verify transit, retention, and gastric emptying times have never been tested in any other chelonian species.
1.3.10.2. Ultrasound
Ultrasonography is a practical, rapid and non-invasive technique enabling real-time visualization of soft-tissue differentiation. As is the case in mammals, ultrasonography in reptiles has potential applications in the monitoring of reproductive function (Morris et al., 1996; Henen and Hofmeyr, 2003), disease diagnosis as well as being coadjuvant to other diagnostic techniques, such as ultrasound-guided biopsy. Sedation is not usually required to scan reptiles, although several handlers may be necessary to restrain lively large animals (Jackson and Sainsbury, 1992). General information about the application of ultrasonography and image interpretation in some species of reptiles is provided by previous authors (Gaudron et al., 2001; Hernandez-Divers and Hernandez-Divers, 2001; Wilkinson et al., 2006; Mader, 2006). More specifically in reproductive function, the technique is recommended for assessment of ovary activity, and also for distinguishing between pre- and post-ovulatory egg stasis (Casares et al., 1997). Clinically, ultrasonography has not been widely utilized in reptile diagnostics, and in research for a limited number of species only. For disease diagnosis, the liver and gallbladder, kidneys and urinary bladder, any tissue soft mass, ocular and retrobulbar disease and cardiac disease may be accessed (Hernandez-Divers and Hernandez-Divers, 2001). Size limitation plus the physical barrier

29
LL II TT EE RR AA TT UU RR EE RR EE VV II EE WW
imposed by the carapace and plastron is a restriction in the case of chelonians. In these reptiles there are few imaging acoustic windows, the most widely-used being the cervicobrachial and prefemoral. Due to the reduced area of these points of ultrasound beam access, small-tipped probes must be used. In ultrasonographic examinations of small chelonians, 7 – 10MHz sector transducers are normally used (Gaudron et al., 2001), whereas in the large ones 2.5 – 3.5 MHz transducers may be needed (Rostal et al., 1989,1990). Doppler ultrasound is widely used in medicine for measuring blood velocity and is therefore reliable in the diagnosis of cardio-vascular disorders. Use of this technique in reptilians is relatively new, being used mainly in monitoring patients in comatous or anesthetized conditions (Murray, 2006).
In sea turtles, ultrasound examination has been performed almost exclusively to assess the reproductive status. Rostal et al. (1994) concluded that this technique is totally non-invasive and significantly lowers the risk to turtles; it allows accurate measurement of structures such as follicles and eggs, and enables more frequent monitoring of the turtle’s condition without increasing the stress factor. With a view to clinical practice, there is a need for more information about the normal aspect, shape and volume of the coelomic structures viewed through ultrasonography to supplement the current sparsity in the literature. No description of normal ultrasonographic features of coelomic organs and Doppler parameters of blood flow in Loggerhead sea turtle currently exists.
1.3.10.3. Computed Tomography Computed tomography (CT) uses special x-ray equipment to obtain image data from different angles around
the body and then uses computer processing of the information to provide cross-sections of body tissues and organs. A radiographic source and detector rotating around the patient produce the scans that are usually performed in transverse direction, with 1-5mm slice thickness and distance pre-set by the examiner. Computer programs are able to build 3-dimensional models of these slices. Unlike other imaging methods, CT scanning offers detailed views of many types of tissue including the lungs, bones, some soft tissues and blood vessels and therefore has been shown to be a cost-effective imaging tool for wide range of clinical problems. CT examinations are often used to diagnose pulmonary and osseous diseases, plan and properly administer radiation treatment for tumours, guide biopsies and other minimally-invasive procedures, as well as plan surgery and determine surgical respectability.
In reptile medicine, CT has potential application in chelonians because of the limits of physical and ultrasonographic examinations, and superimpositions in the conventional radiographs caused by the shell. As in other areas of veterinary medicine, the high cost of the equipment and restriction of use to large animals (gantry ranges from 60 to 70 cm in diameter) limit its usefulness in exotic and wild animals. CT technology is usually available only in selected medical centers or large referral veterinary hospitals.
Examinations are usually performed rapidly (a few minutes) and in most cases chelonians do not need to be sedated. Horizontal scans are similar to common dorsoventral radiographs. However, lateral recumbency of the animal causes displacement of the inner organs (Gumpenberger and Henninger, 2001).
30
DD II AA GG NN OO SS TT II CC II MM AA GG II NN GG OO FF TT HH EE LL OO GG GG EE RR HH EE AA DD SS EE AA TT UU RR TT LL EE
Since CT enables detailed visualization of bony structures, it is the best technique for diagnosis of skeletal injuries in chelonians. In a gravid Leopard tortoise (Geochelone pardalis pardalis) with metabolic bone disease, the use of CT was imperative to visualize a dystrophic calcification of the left hepatic lobe and the presence of preovulatory follicles (Raiti and Haramati, 1997). Abou-Madi et al. (2004) detected axial and appendicular fractures in a Snapping turtle (Chelydra serpentina) that were not visualized during plain film radiography. Garland et al. (2002) highlighted the application of CT in wild animals and recommended the use of 3D reconstruction with volume rendering for expanding the imaging possibilities in this difficult group of patients. The authors of the study mentioned diagnosed a nodal mass in the chest, granulomas in the lungs and a ball in the stomach in a Hawksbill sea turtle that showed failure to thrive. In a Loggerhead sea turtle with carapace fracture produced by propellers, the use of CT and 3D reconstructions and magnetic resonance imaging of the affected area were decisive in evaluating the extent of vertebral damage and spinal cord section (Parga et al., 2005). Other pathologies diagnosed with CT scan include pneumonia in chelonians; abscesses in cranial lung and mid-coelomic cavity in red-eared sliders (Trachemys scripta elegans); urinary bladder stone in African spurred tortoise (Geochelone sulcata) and secondary hyperparathyroidism in Hermann’s tortoise (Testudo hermanni) (Wilkinson et al., 2004). Arencibia et al. (2006) have described the normal CT images of the head of the Loggerhead sea turtle based on comparison with anatomical cross-sections.
Over the past few years, there have been major technological developments in the field of diagnostic imaging, CT units particularly having been equipped with multiple rows of detector arrays. This new generation technology, called Multidetector Computed Tomography (MDCT), allows for very fast examinations and more precise multiplanar and 3D reconstructions, and is therefore an excellent diagnostic tool also for scientific research into endangered species.
1.3.10.4. Magnetic Resonance Imaging
Like CT, magnetic resonance imaging (MRI), provides cross-sectional images of the body. MRI uses a strong magnetic field to measure the energy released by hydrogen atoms in tissue cell-water. By altering the timing and strength of the radio frequency pulses, it is possible to detect differences in proton characteristics within different parts of the tissue. The most widely used sequence is known as Spin-Echo. Here radio waves released are transmitted to a computer which displays a highly-detailed image showing up any abnormality of anatomy, mass lesions and tissue inflammation. Images are produced using two parameters based on repetition times, called T1 and T2-weighted images. Substances such as fat, proteinaceous fluids and lipid-rich molecules produce a bright (white) image in T1-weighted scans because they show a high signal, with the same bright aspect being produced by water-rich tissues in T2-weighted images. Alterations in the properties of cellular membranes change tissue appearance in T1 and T2-weighted images due to intracellular bulk water. Tumours, inflammation, oedema, pure fluids and cerebro-spinal fluid produce black, T1-weighted image areas (Wilkinson et al., 2004). The primary application of MRI technology had been in the diagnosis

31
LL II TT EE RR AA TT UU RR EE RR EE VV II EE WW
of neurological diseases such as tumours, stroke and inter-vertebral disc injuries. In veterinary practice, MRI has also been valuable in diagnosing musculoskeletal diseases and for mapping and staging tumours prior to surgery.
A number of pathologic disorders that cannot be visualized by standard imaging techniques in reptiles can be diagnosed with MRI (Straub and Jurina, 2001). However, MRI in veterinary is still limited due to its high cost. High noise levels are produced in the gantry during the 30-45 minute examination during which the animal must be immobile, entailing the use of general anaesthesia. Although MRI cannot provide images of calcified tissues, bone marrow, cartilage, or muscle, nonetheless blood vessels and intra-articular fat all show up well, so that it is possible to detect subtle orthopaedic pathologies (Wilkinson et al., 2004). As in mammals, MRI is the best choice for imaging the nervous system, being suitable for evaluation of the chelonian spinal cord for evidence of trauma, infection or tumours (Wilkinson et al., 2004). Image interpretation requires in-depth knowledge of the species’ topographical anatomy and the MRI appearance of each structure in each sequence. Cardiovascular structures, lung fields, liver, kidneys, urinary bladder and intestinal and reproductive tracts have all been imaged in detail in tortoises (Wilkinson et al., 2004). Normal morphological and T1 and T2-weighted images have been reported on mainly in Herman’s, Aldabra and Greek tortoises (Straub and Jurina, 2001; Rübel and Kuoni, 1991; Wilkinson et al., 2004).
In the case of sea turtles, their size limits the application of this technique. Adults do not pass through the gantry. Hidalgo et al. (2006) provided an overview of the normal cross-sectional anatomy of the head of the Loggerhead sea turtle using MR images. Spin-echo T1-weighted MR images of the head have provided details of clinically relevant anatomy and discrimination of both soft and mineralized tissues. In Green turtles, Croft et al. (2004) described the gross sectional anatomy and tested the use of MRI to detect internal tumors in animals with cutaneous fibropapillomatosis. The normal appearance of the coelomic organs of the healthy Loggerhead sea turtle in T1 and T2-weighted images is unknown.

32
DD II AA GG NN OO SS TT II CC II MM AA GG II NN GG OO FF TT HH EE LL OO GG GG EE RR HH EE AA DD SS EE AA TT UU RR TT LL EE
1.4. CITED REFERENCES Abou-Madi, N.; Scrivani, P.; Kollias, G.V. and Hernandez-Divers, S.M. 2004. Diagnosis of skeletal injuries in chelonians using
computed tomography. Journal of Zoo and Wildlife Medicine 35: 226-231. Alegre, F.; Parga, M.; Castillo, C. and Pont, S. 2006. Study on the long-term effect of hooks lodged in the mid-esophagus of sea turtles.
Twenty-sixth Annual Symposium on Sea Turtle Biology and Conservation. April 3-8, Creta, Greece, p. 234 [abstract]. Aguilar, R.; Mas, J. and Pastor, X. 1995. Impact of Spanish swordfish longline fisheries on the loggerhead sea turtle Caretta caretta
population in the Western Mediterranean. In Proceedings of the 12th annual workshop on sea turtle biology and conservation: Richardson, J.I. and Richardson, T.H. (Eds.). NOAA Technical memorandum NMFS-SEFSC-361. Miami. US Department of Commerce. Pp 1-6.
Arencibia, A.; Rivero, M.A.; De Miguel, I.; Contreras, S.; Cabrero, A.; Oros, J. 2006. Computed tomographic anatomy of the head of the loggerhead sea turtle (Caretta caretta). Research in Veterinary Science 2: 165-169.
Argano, R. and Baldari, F. 1983. Status of Western Mediterranean sea turtles. Rapport d’Commission International de la. Mer
Méditerranée 28: 233-235. Barboza, P.S. 1995. Digesta passage and functional anatomy of the digestive tract in the desert tortoise (Xerobates agassizii). Journal
of Comparative Physiology B 165: 193-202. Bjorndal, K.A.; Meylan, A.B. and Turner, B.J. 1983. Sea turtles nestilng at Melbourne beach, Florida, I. Size, growth and reproductive
biology. Biological Conservation 26: 65-77. Bolten, A. B. 1999. Techniques for measuring sea turtles. In: Research and Management Techniques for the Conservation of Sea
Turtles. K. L. Eckert, K. A. Bjorndal, F. A. Abreu-Grobois, M. Donnelly (Editors). IUCN/SSC Marine Turtle Specialist Group Publication 4: 1-5
Bolten, A.B. 2003. Active Swimmers – Passive Drifters: The Oceanic Juvenile Stage of Loggerheads in the Atlantic System. In: Bolten, A.B. and B.E. Witherington (eds). Loggerhead Sea Turtles. Smithsonian Books, Washington D.C. Pp 63-78.
Brongersma, L.D. 1961. Notes upon some sea turtles. Zoologische Verhandelingen (Leiden) 51:1-45. Brooke, L. 2005. Sex determination of loggerhead sea turtles (Caretta caretta) via hormonal analysis by high performance liquid
chromography. Master dissertation, Florida Atlantic University. 66pp. Caldwell, D.K. 1959. The loggerhead turtles of cape Romain, South Carolina. Bulletin of the Florida. State Museun. Biological. Science.
4: 319-348. Caldwell, D.K.; Carr, A. and Hellier, T.R.Jr. 1955. Natural history notes on the Atlantic loggerhead turtle, Caretta caretta. Quarterly
Journal of Florida Academic Science 18: 292-302. Camiñas, J.A. and de la Serna, J.M. 1995. The loggerhead distribution in the Western Mediterranean Sea as deduced from captures
by the Spanish long-line fishery. In: Scientia herpetological. Llorente, G.A., Montori, A.; Santos, X. and Carretero, M.A. (eds). Asociación Herpetologica Española, Barcelona. Pp 316-323.
Carr, A. F. Jr. 1986a. Rips, FADS, and little loggerheads. Bioscience 36: 92-100. Carr, A.F.Jr. 1986b. New perspectivas on the pelagic stage of sea turtle development. NOAA Tech. Mem. NMFS-SEFC-190, 36 pp. Casares, M.; Rübel, A. and Honegger, R.E. (1997) Observations on the female reproductive cycle of captive Giant Tortoises
(Geochelone spp.) using ultrasound scanning. Journal of Zoo and Wildlife Medicine 28: 267-273.

33
CC II TT EE DD RR EE FF EE RR EE NN CC EE SS
Ciampa, M.; Ferreti, L.; Treglia G. and Bentivegna, F. 2006. Treatment of trauma, fractures, wounds and lesions in injured sea turtles. In: 26th Annual Symposium on Sea Turtle Biology and Conservation 2006; Book of Abstracts, International Sea Turtle Society, Crete, Greece. Pp 67-68 [abstract].
CRAM, 2006. Clínica y recuperación. Estadísticas de ingresos. Webpage available in: www.cram.org. Accessed in March 2007. Croft, L.A.; Graham, J.P.; Schaf, S.A. and Jacobson, E.R. 2004. Evaluation of magnetic resonance imaging for detection of internal
tumors in green turtles with cutaneous fibropapillomatosis. Journal of American Veterinary Medical Association 225: 1428-1435. De Metrio, G.; Petrosino, G.; Matarrese, A.; Tursi, A. and Montanaro, C. 1983. Importance of the fishery activities with drift lines on the
populations of Caretta caretta (L.) and Dermochelys coriacea (L.) (Reptilia, Testudines), in the Gulf of Taranto. Oebalia 9: 43-53. Deflorio, M.; Aprea, A.; Corriero, A.; Nicoleta, S. and De Metrio, G. 2005. Incidental captures of sea turtles by swordfish and albacore
longline in the Ionian Sea. Fisheries Science 71: 1010-1018. DeShaw, B.; Schoenfeld, A.; Cook, R.A. and Haramati, N. 1996. Imaging of reptiles: a comparison study of various radiographic
techniques. Journal of Zoo and Wildlife Medicine 27: 364–370. Di Bello, A.; Valastro, C.; Staffieri, F. and Crovace, A. 2006b. Contrast radiography of the gastrointestinal tract in sea turtles.
Veterinary Radiology & Ultrasound 47: 351-354. Dodd, CK Jr. 1988. Synopsis of the biological data on the loggerhead sea turtle Caretta (Linnaeus 1758). U.S. Fish and Wildlife
Service Biological Report 88: 35-82. Ehrhart, L.M.; Bagley, D.A. and Redfoot, W.E. 2003. Loggerhead Sea Turtles in the Atlantic Ocean: Geographic Distribution,
Abundance and Population Status. In: Bolten, A.B. and B.E. Witherington (eds). Loggerhead Sea Turtles. Smithsonian Books, Washington D.C. Pp 157-174.
FAO. 1990. Species catalogue. Sea turtles of the world. Márquez M., R. (ed.) FAO Fisheries Synopsis 125, Vol. 11. Rome. 81 pp. Frazer, N.B. and Schwartz, F.J. 1984. Growth curves for captive loggerheads, Caretta caretta, in North Carolina, USA. Bulletin of
Marine Science 34: 485-489. Frazer, N.B. 1984. A model for assessing mean age-specific fecundity in sea turtle populations. Herpetologica 40: 281-291. Gaffney, E.S. 1990. The comparative osteology of the Triassic turtle Proganochelys. Bulletin of. American Museum of Natural. History.
194: 1-263. Garland, M.R.; Lawler, L.P.; Whitaker, B.R.; Walker, I.D.F.; Corl, F.M. and Fishman, E.K. 2002. Modern CT applications in Veterinary
Medicine. Radiographics 22 : 55-62. Gaudron, C. ; Lignereux, Y. and Ducos de Lahitte, J. 2001. Imagerie médicale appliquée a l’anatomie clinique des chéloniens en
consultation. In: Proceedings of the International Congress on Testudo Genus, Toulosse. Pp 161-179. Geldiay, R.; Koray, T. and Balik, S. 1982. Status of sea turtle populations (Caretta c. caretta and Chelonia m. mydas) in the northern
Mediterranean Sea, Turkey. In: K. Bjorndal (Ed), Biology and Conservation of sea turtles. Smithsonian Institution Press, Washington, DC. Pp 425-434.
Girling, S. and Raiti, P. 2004. BSAVA Manual of Reptiles. British Small Animal Veterinary Association, Kingsley House, Gloucestershire. 350pp.
Gómez de Segura, A.; Tomás, J.; Pedraza, S.N.; Crespo, E.A. and Raga, J.A 2006. Abundance and distribution of the endangered loggerhead turtle in Spanish Mediterranean waters and the conservation implications. Animal Conservation 9: 199-206.
Gordon, A.N.; Kelly, W.R. and Cribb, TH. 1988. Lesions caused by cardiovascular flukes (Digenea: Spirorchidae) in stranded green turtles (Chelonia mydas). Veterinary Pathology 35: 21-30.
Gumpenberger, M. and Henninger, W. 2001. The use of computed tomography in avian and reptile medicine. Seminars in Avian and
Exotic Pet Medicine 10: 174-180.

34
DD II AA GG NN OO SS TT II CC II MM AA GG II NN GG OO FF TT HH EE LL OO GG GG EE RR HH EE AA DD SS EE AA TT UU RR TT LL EE
Hailey, A. 1997. Digestive efficiency and gut morphology of omnivorous and herbivorous African tortoises. Canadian Journal of
Zoology 75: 787-794. Hatt, J.M.; Gisler, R.; Mayes, R.W.; Lechner-Doll, M.; Clauss, M.; Liesegang, A. and Wanner, M. 2002. The use of dosed and herbage
n-alkanes as markers for the determination of intake, digestibility, mean retention time and diet selection in Galapagos tortoises (Geochelone nigra). The Herpetological Journal 12: 45-54.
Hawkes, L.A.; Broderick, A.C., Godfrey, M.H. and Godley, B. 2005. Status of nesting loggerhead turtles Caretta caretta at a Bald Head Island (North Carolina, USA) after 24 years of intensive monitoring and conservation. Oryx 39: 65-72.
Heithaus, M. R.; Frid, A. and Dill, L. M. 2002. Shark-inflicted injury frequencies, escape ability, and habitat use of green and loggerhead turtles. Marine Biology 140: 229-236.
Hendrickson, J.R. 1980. The ecological strategies of sea turtles. American Zoologist 20: 597-608. Henen, B.T. and Hofmeyr, M.D. 2003. Viewing Chelonian Reproductive Ecology through Acoustic Windows: Cranial and Inguinal
Perspectives. Journal of Experimental Zoology 297A: 88-104. Hernandez-Divers, S. and Hernandez-Divers, S. 2001. Diagnostic imaging of reptiles. In Practice july/august: 370-391. Hidalgo, M.R.; Contreras, S.; Orós, J.; Rivero, M.A.; Casal, A.B.; Monagas, P. and Arencibia, A. 2006. Magnetic resonance imaging
anatomy of the head of the loggerhead sea turtle (Caretta caretta). Twenty-sixth Annual Symposium on Sea Turtle Biology and Conservation. April 3-8, Creta, Greece, p. 60 [abstract].
Hirayama, R. 1998. Oldest known sea turtle. Nature 16: 705-708. Hughes, G.R. 1974. The sea turtles of south-east Africa. I. Status, morphology and distributions. Oceanographic Research Institute.
Investigational Report. 35. 144pp. Hyland, R.J. 2002. Surgical removal of a fish hook from the oesophagus of a turtle. Australian Veterinary Journal 80: 54-56. IUCN 2006. IUCN Red List of Threatened Species. <www.iucnredlist.org>. Accessed on 08 March 2007. Jackson, O.F. and Sainsbury, A.W. 1992. Radiological and related investigations. In: P.H. Beynon, Lawton, M.P. and Cooper, J.E.
BSAVA Manual of Reptiles. British Small Animal Veterinary Association, Kingsley Hourse. Gloucestershire. Pp 63-72. Jacobson, E. R.; Buergelt, C.; Williams, B. and Harris, R.K. 1991. Herpesvirus in cutaneous fibropapillomas of the green turtle,
Chelonia mydas. Diseases of Aquatic Organisms 12: 1-6. Jacobson, E.R. 1997. Buoyancy problems in sea turtles: causes and diagnosis. Proceedings 17th Annual Sea Turtle Symposium, 4-8
March, Orlando, Florida. p. 67 [abstract]. Jacobson, E. R.; Mansell, J. L.; Sundberg, J.P.; Hajarr, L.; Reichmann, M.E.; Ehrhart, L.M.; Walsh, M.and Murru. F. 1989. Cutaneous
fibropapillomas of green turtles, Chelonia mydas. Journal of Comparative Pathology. 101: 39-52. Jacobson, E.R.; Homer, B.L.; Stacy, B.A.; Greiner, E.C.; Szabo, N.J.; Chrisman, C.L.; Origgi, F.; Coberley, S.; Foley, A.M.; Landsberg,
J.H., Flewelling, L., Ewing, R.Y.; Moretti, R.; Schaf, S.; Rose, C.; Mader, D.R.; Harman, G.R.; Manire, C.A.; Mettee, N.; Mizisin, A.P. and Shelton, G.D. 2006. Neurological disease in wild loggerhead sea turtles Caretta caretta. Diseases of Aquatic Organisms 70: 139-154.
Lackovich, J. K; Brown, D.R.; Homer, B.L.; Garber, R. L.; Mader, D.R.; Moretti, R.H.; Patterson, A.D.; Herbst, L.H.; Oros, J.; Jacobson, E. R.; Curry, S. S. and Klein, P.A. 1999. Association of herpesvirus with fibropapillomatosis of the green turtle Chelonia mydas
and the loggerhead turtle Caretta caretta in Florida. Diseases of Aquatic Organisms 37: 89-97. Lenarz, M.S.; Frazer, N.B.; Ralston, M.S. and Mast, R.B. 1981. Seven nest recorded for loggerhead turtle (Caretta caretta) in one
season. Herpetological Review 12: 9. Limpus, C.J. 1985. A study of the loggerhead sea turtle, Caretta caretta, in eastern Australia. PhD dissertation. University of
Queensland, St. Lucia, Australia.
35
CC II TT EE DD RR EE FF EE RR EE NN CC EE SS
Lund, F. 1986. Nest production and nesting-site tenacity of the loggerhead sea turtle, Caretta caretta, on Jupiter Island, Florida. M.S. Thesis. University of Florida, Gainesville, 32 pp.
Lutz, P. L. and Musick, J. A. 1996.The Biology of Sea Turtles. CRC Press, Boca Raton, Fla. 432pp. Mader D. 1996. Radiographic anatomy. In: Mader D.R. (ed.). Reptile Medicine and Surgery. W.B. Saunder Co. USA. Pp. 485-489. Mader, D.R. 2006. Reptile Medicine and Surgery. 2nd edition. Elsevier Inc. 1242pp. Manter, H.W. and Larson, M.I. 1950. Two new blood flukes from a marine turtle, Caretta caretta. Journal of Parasitology 21: 274-276. Marcovaldi, M.A.; Marcovaldi, G.G.1999. Marine turtles of Brazil: the history and structure of Projeto TAMAR-IBAMA. Biological
Conservation 91: 35-41. Margaritoulis, D.; Argano, R.; Baran, I.; Bentivegna, F.; Bradai, M.N.; Camiñas, J.A.; Casale, P.; De Metrio, G.; Demetropoulos, A.;
Gerosa, G.; Goodley, B.; Haddoud, D.; Houghton, J.; Laurent, L. and Lazar, B. 2003. Loggerhead turtles in the Mediterranean. Present knowledge and conservation perspectives. In: Bolten, A. y Witherington, B.E. (eds.). Ecology and Conservation of Loggerhead sea turtles. Smithsonian Institution Press. Washington D.C., USA.
MCarthur, S.; Wilkinson, R.; Barrows, M. and Meyer, J. 2004. Introduction. Diagnostic Imaging. In: McArthur, S.; Wilkinson, R. and Meyer, J. (eds.). Medicine and Surgery of tortoises and turtles. Victoria, Australia: Blackell Publishing Ltd. Pp 1-34.
Mendonça, M.T. 1981. Comparative growth rates of wild immature Chelonia mydas and Caretta caretta in Florida. Journal of
Herpetology 15: 447-451. Meyer, J. 1998. Gastrofin as a gastrointestinal contrast agent in the Greek tortoise (Testudo hermanni). Journal of Zoo and Wildlife
Medicine 29: 183-189. Morris, P. J. and Allison, A.C. 1996. Determination of sex in White-throated monitors (Varanus albigularis), Gila monsters (Heloderma
suspectum), and Beaded Lizards (H. horridum) using two-dimensional ultrasound imaging. Journal of Zoo and Wildlife Medicine 27: 371-377.
Murray, M.J. 2006. Cardiology. In: Mader, D.R (Ed.), Reptile Medicine and Surgery. Elsevier Inc., Philadelphia. Pp 181-195. NOAA, 1991. Endangered Species Act Biennial Report. Pp. 33-36. Available on line:
http://www.nmfs.noaa.gov/pr/pdfs/laws/esabiennial1991.pdf Orós, J. and Torrent, A. 2000. Unusual tumors in three loggerhead sea turtles (Caretta caretta) stranded in the Canary Islands, Spain.
Marine Turtle Newsletter 88: 6-7. Orós, J.; Déniz, S. and Calabuig, P. 2004. Digestive pathology of sea turtles stranded in the Canary Islands between 1993 and 2001.
Veterinary Record 155: 169-174. Orós, J.; Torrent, A.; Calabuig, P. and Déniz, S. 2005. Diseases and causes of mortality among sea turtles stranded in the Canary
Islands, Spain (1998-2001). Diseases of Aquatic Organisms 63: 13-24. Owens, D.W. 1999. Reproductive Cycles and Endocrinology. Research and Management Techniques for the Conservation of Sea
Turtles. IUCN/SSC Marine Turtle Specialist Group Publication 4: 1-5. Parga M.L.; Valente, A.L.; Zamora, M.A.; Lavin, S.; Alegre, F.; Cuenca, R. and Marco, I. 2005. Carapace trauma associated with hind
limb paralysis in a loggerhead sea turtle (Caretta caretta). Proccedings of the Spring Meeting of the British Veterinary Zoolological Society. P. 41 [abstract].
Pascual, X. 1985. Contribuición al studio de las Tortugas en las costas Españolas. I. Distribuición. Miscellania Zoologica 9: 287-294. Perrine, D. 2003. Sea Turtles of the World. Voyageur Press. Stillwater, MN. 144pp. Plotkin, P.T.; Wicksten, M.K. and Amos, A.F. 1993. Feeding ecology of the loggerhead sea turtle Caretta caretta in the Northwestern
Gulf Mexico. Marine Biology 115: 1-5.
36
DD II AA GG NN OO SS TT II CC II MM AA GG II NN GG OO FF TT HH EE LL OO GG GG EE RR HH EE AA DD SS EE AA TT UU RR TT LL EE
Pont, S. G. and Alegre, F. N. 2000. Work of the Foundation for the Conservation and Recovery of Marine Life. Marine Turtle
Newsletter 87: 5-7. Pritchard, P.C.H. and Mortimer, J.A. 1999. Taxonomy, External Morphology, and Species Identification. In: K. L. Eckert; Karen, A.;
Bjorndal, F.; Abreu, A. G. and Donnelly, M.A. (eds.). Research and Management Techniques for the Conservation of Sea Turtles. IUCN/SSCMarine Turtle Specialist Group Publ. No. 4. Washington, D.C. Pp 21-38.
Pritchard, P.C.H. and Trebbau, P. 1984. The turtles of Venezuela. SSAR Contribution to Herpetology 2. Pp 1-403 Rainey, W.E. 1981.Guide to sea turtle visceral anatomy. NOAA Tech. Mem. NMFS-SEFC-82. 82pp. Raiti, P. and Haramati, N. 1997. Magnetic Resonance Imaging and Computerized Tomography of a Gravid Leopard Tortoise
(Geochelone pardalis pardalis) with metabolic bone disease. Journal of Zoo and Wildlife Medicine 28: 189-197. Rhodin, A.G.J. 1985. Comparative chondro-osseous development and growth of marine turtles. Copeia 1985: 752-771. Rostal, D.; Robeck, T.; Owens, D.; Louis, E. and Kraemer, D. 1989. Ultrasonic imaging of ovaries and eggs in sea turtles. Proceedings
of the Ninth Annual Symposium on Sea Turtle Biology and Conservation. NOAA Technical Memorandum NMFS-SEFC 232, Georgia, February 7 to 11. Pp 257-258.
Rostal, D.C.; Robeck, T.R.; Owens, D.W. and Kraemer, D.C. 1990. Ultrasound imaging of ovaries and eggs in Kemp's ridley sea turtles (Lepidochelys kempi). Journal of Zoo and Wildlife Medicine 21: 27-35.
Rübel, A.; Kuoni, W. and Frye, F. 1991. Radiology and Imaging. In: F. Frye (ed.). Biomedical and surgical aspects of captive reptile husbandry. Krieger Publishing Co. Florida. Pp.185–208.
Salvador, A. 1985. Guia de campo de los anfibios y reptiles de la Península Iberica, Islas Baleares y Canarias. Unigraf, S.A. Fuenlabrada, Madrid.
Silverman, S. 2006. Dignostic imaging. In: D.R. Mader (ed.). Reptile Medicine and Surgery. W.B. Saunder Co. Pp 471-489. Silverman, S. and Janssen D. 1996. Diagnostic Imaging. In: D.R. Mader (ed.). Reptile Medicine and Surgery. W.B. Saunder Co. Pp
258-264. Smith, H. M. and Smith, R. B. 1980. Synopsis of the Herpetofauna of Mexico. Vol. 6: Guide to Mexican turtles. Bibliographic
addendum III. John Johnson, North Bennington, Vermont. 1044 pp. Solomon, S.E.; Hendrickson, J.R. and Hendrickson, L.P. 1986. The structure of the carapace and plastron of juvenile turtles, Chelonia
mydas (the green turtle) and Caretta caretta (the loggerhead sea turtle). Journal of Anatomy 145: 123-131. Straub, J. and Jurina, K. 2001. Magnetic Resonance Imaging in Chelonians. Seminars in Avian and Exotic Pet Medicine 10: 181-186. Taylor, S.K.; Citino, S.B.; Zdziarski, J.M. and Bush, R.M. 1996. Radiographic anatomy and barium sulphate transit time of the
gastrointestinal tract of the leopard tortoise (Testudo pardalis). Journal of Zoo Wildlife Medicine 27: 180-186. Tudela, S. 2000. Ecosystem effects of fishing in the Mediterranean: an analysis of the major threats of fishing gear and practices to
biodiversity and marine habitats. FAO Project for the preparation of a Strategic Action Plan for the conservation of biological biodiversity in the Mediterranean region. 45 pp.
Walker, W.F. 1973. The locomotor apparatus of Testudines. In: C. Gans and T. Parsons (eds.). Biology of the reptilian IV. Academic Press, New York. Pp 1-100.
Wallin, L. 1985. A survey of Linnaeus’s material of Chelone mydas, Caretta caretta and Eretmochelys imbricata (Reptilia, Chelonidae). Zoological Journal of the Linnaean Society 85: 121-130.
Wieland, G.R. 1896. Archelon ischyros: a new gigantic crytodire testudinate from the Fort Pierre Cretaceous of South Dakota. American Journal of Science 12: 399-412.

37
CC II TT EE DD RR EE FF EE RR EE NN CC EE SS
Wilkinson, R.; Hernandez-Divers, S.; Lafortune, M.; Calvert, I.; Gumpenberger, M. and Mcarthur, S. 2004. Diagnostic Imaging. In: McArthur, S.; Wilkinson, R. and Meyer, J. (eds.). Medicine and Surgery of tortoises and turtles. Victoria, Australia: Blackell Publishing Ltd. Pp 187-238.
Wolke, R.E. and George, A. 1981. Sea turtle necropsy manual. NOAA Tech. Mem. NMFS-SEFC-24, 24pp. Wolke, R.E.; Brooks, D.R. and George, A. 1982. Spirorchidiasis in loggerhead sea turtles (Caretta caretta): Pathology. Journal of
Wildlife Diseases 18: 175-185. Wyneken, J. 2001. The Anatomy of Sea Turtles. U.S. Departament of Commerce NOAA Technical Memorandum NMFS-SEFSC 470:
1-172. Zug, G.R. 1986. Age determination of loggerhead sea turtles, Caretta caretta, by incremental growth marks in the skeleton.
Smithsonian Contribution to Zoology 427: 1-34.

38

39
SUMMARY OF RESULTS AND DISCUSSION

40
41
SS UU MM MM AA RR YY
2. SUMMARY OF RESULTS AND DISCUSSION
Dorsoventral radiographs taken of the neck and body of 30 Loggerhead sea turtles using analog and digital
radiography showed image distortion or superimposition at various points, due to the natural curvature of the neck and the shell which hindered the accuracy of interpretation. The pectoral and pelvic girdles were easily recognized. Important external landmarks included the vertebral and lateral scutes, and important internal landmarks included bronchi, coracoid bones, caudal border of the pulmonary fields, and the acetabulum.
Bones from the distal part of the fore- and hind flippers were seen in detail in radiographs using mammography film-screen combination. Pectoral and pelvic girdles, superimposed by the carapace bones, were better seen on the standard radiographs using rare-earth intensifying screens. Mammographic radiographs of the manus of 5 small juvenile turtles showed active growth zones. Visualization of bone contours on the distal part of the limbs was clearer compared with mammals due to the very low number of superimpositions. The presence of a massive cartilage in the epiphyses produced better visibility of limb-ends.
Ultrasonographically, the fourth and fifth cervical vertebrae, spinal cord, and the venous sinuses of the external jugular vein were clearly seen through the cervical-dorsal acoustic window. From the cervical-ventral acoustic window, the esophagus and the heart were imaged. The stomach was more frequently seen through the left axillary acoustic window. Although the liver could be imaged from both sides, the right axillary acoustic window provided a better view of the gallbladder. The large and small intestines and the kidneys could be seen in the right and left prefemoral acoustic windows; the latter were easily identified due to intense renal vasculature.
Computed tomography provided detailed information mainly of the respiratory system and skeleton. With regard to skeletal structures, multiplanar sagittal reconstruction of the vertebral column enabled evaluation of the vertebrae and vertebral canal. Three-volume reconstruction renderings of the carapace and plastron provided a detailed view of respective bones. Clinically relevant organs including the oesophagus, stomach, trachea, bronchi, lungs, liver, gallbladder, heart, spleen, kidneys were also identified in CT images. In the neck, the topographic relationships between oesophagus and trachea at each cervical vertebra were identified, and the tracheal mucosa could be inspected using virtual bronchoscopy. The morphology of the lungs, bronchi and pulmonary blood vessel could be clearly seen.
As for the MRI study, the general view on the 3 oriented planes (sagittal, dorsal and transverse) provided for good understanding of cross-sectional anatomic features and their identification on T1 and T2-weighted images. Likewise, major anatomic structures such as the esophagus, stomach, lungs, intestine (duodenum and colon), liver, gallbladder, spleen, kidneys, urinary bladder, heart, bronchi, and vessels could be imaged in detail principally in T2-weighted images. It was not possible to recognize the ureters or reproductive tract due to their small size.
The use of diagnostic imaging techniques in Loggerhead sea turtles involves certain aspects that should be considered: they include costs, viability, equipment and logistics, applicability to the diagnosis, time invested and the effects of handling on the patient’s health status. Some imaging techniques, such as conventional/analog radiography,
42
DD II AA GG NN OO SS TT II CC II MM AA GG II NN GG OO FF TT HH EE LL OO GG GG EE RR HH EE AA DD SS EE AA TT UU RR TT LL EE
are often available in small veterinary clinics and even in some rescue centers. A portable x-ray apparatus in this case seems to be most recommended for sea turtles since different views may be obtained by moving the machine around the animal and adjusting the x-ray to provide a vertical, horizontal or oblique beam. In more specialized centers and in some veterinary hospitals radiography has already been improved with the advent of digital systems. In this study we have used two systems (analog and digital). To assess the coelomic cavity structures we have used 55-70Kv and 100 mA with a 0.2-second time exposure. Due to the low respiratory frequency observed in this species, the long exposure did not cause motion artefacts, and provided satisfactory contrasted images. Obtaining the same radiographs with the digital system had the added advantage of enabling adjustment of the brightness and contrast settings on the monitor screen before impression, thus avoiding unnecessary repetition of the x-ray. As to radiographs of the limbs, betters results were observed when the conventional system was performed using mammographic film. Because of the small size, thinness and low bone density of the flippers of juvenile and subadult turtles, mammographic film was more suitable for visualisation of bone structures in detail. Radiography is the cheapest diagnostic imaging method, examination time is short, and no sedation or anaesthesia of the turtle is required. We recommend its routine use in marine rescue centers because it is the best method for detecting the presence of a swallowed fishhook and for evaluating skeleton integrity. The drawback with this method is superimposition of the internal bony structures over the carapace and plastron, which may compromise diagnosis in some cases.
The second most-affordable technique for rescue centers is ultrasonography. Many portable models are available. Ultrasonographic examination of Loggerhead sea turtles was very useful in evaluating soft tissues such as the heart, liver, kidneys and intestines. Once access points to the organs and the topographic anatomy are known (both are reported in this work), examination may proceed easily and rapidly. The method has proved to be safe, with the added advantage of providing an overview of the organs functioning in real time using only physical restraint. More particularly in sea turtles, an ultrasongraphic scan of the gastrointestinal tract provided detailed visualisation of the normal appearance and thickness of layers of the intestinal wall, as well as identification of small and large intestines. This is important since most disorders found in injured sea turtles are fisheries-related and are caused by swallowed fishhooks or monofilament lines in the intestines that produce a range of types of enteritis including intestinal necrotising enteritis associated with intussusception (Orós et al., 2004). Because chelonians have few body parts not covered by the carapace or plastron which are internally limited by the bone of the proximal end of the limbs, the spaces of the acoustic windows are very small, thus limiting the scan to one plane. Other drawbacks include low ultrasound beam penetration in turtles with large amounts of fat in the subcutaneous tela and gas in the lumen of the gastrointestinal tract. In this study we used 5.0, 6.0 and 7.0 MHz sector phased array transducers. To assess internal organs, such as the heart, liver and stomach in large subadult turtles, lower-frequency transducers than those used in juveniles are needed, and in general they produce lower-resolution images. Lungs cannot be examined with this technique.
The use of computed tomography and magnetic resonance requires substantial logistical support, currently unavailable to small veterinary centers because of the price of equipment and the specialized facilities in which to house it. This does not mean that these techniques are not suitable for sea turtles, but rather that the trade-off between the cost and effects of handling and transporting the sick turtle to a specialized center and the need for an accurate diagnosis

43
SS UU MM MM AA RR YY
must be considered. Arrangements between diagnostic imaging and rescue centers may be one way of making examinations financially viable while providing support for scientific research in return. In specialized human centers the two techniques are often available, and if so required may be performed consecutively, entailing less handling of the turtle. In this study we first carried out an MRI scan of the turtles under anaesthesia for as long as 50 minutes. This initial scan was followed by the faster (under 5 minutes) CT examination. Information obtained with MRI is different from that provided by CT, and its use is indicated in special cases in which the diagnosis cannot be established with radiographs or ultrasonography. For instance, a CT scan followed by a MRI examination could be strongly recommended in turtles with carapace fractures displaying neurological symptoms. Carapace fracture - caused by collision with boat propellers - is one of most common causes of sea turtle admissions (Pont and Alegre, 2000; Parga et al., 2005; Ciampa et al., 2006). The multiplanar and 3D reconstruction of the spine in these cases provides detailed indications of the vertebrae affected and the extent of the fracture, whereas T1 and T2-weighted MRI images will show integrity of the spinal cord (Parga et al., 2005). Computed tomography is also indicated in those animals with suspected pulmonary lesions such as those related to abnormal buoyancy, pneumonia, oedema or presence of pulmonary fibropapillomatosis (Orós et al., 2004; Jacobson, 1997; Croft et al., 2004; Garland et al., 2002). Additionally, the oesophageal wall, plus the hepatic, splenic and renal parenchyma and vessels are better visualized using MRI, as has been shown in the present study. This finding could justify the use of this technique in helping in the diagnosis of certain pathologies which to date have been identified only at necropsy, such as necrotising and multifocal granulomatous hepatitis and splenitis, as well as the presence of internal tumours (Orós et al., 2004; Orós and Torrent, 2000; Croft et al., 2004).

44
45
CONCLUSIONS

46
47
CC OO NN CC LL UU SS II OO NN SS
3. CONCLUSIONS (in portuguese)
1. Tanto as radiografias convencionais utilizando filme standart e chassis de terras raras como as radiografias
digitais proporcionam uma boa visualização das estruturas ósseas da região cervical e da cavidade celomática, incluindo os ossos do plastrão e carapaça. No entanto a última permite otimizar o tempo empregado na realização dos exames. Em ambos os casos, a visualização das ultimas vértebras cervicais e dorsais está comprometida pela curvatura normal da carapaça e sobreposição com os ossos pelvianos, respectivamente.
2. A radiografia convencional usando a combinação de filme e chassi para mamografía apresenta melhor
detalhamento das estruturas ósseas da extremidade distal dos membros do que aquela obtida pelo método digital. Ao contrário, a extremidade proximal dos membros é mais bem visualizada em placas standart com chassis de terras raras ou usando a radiografia digital, porem utilizando kv mais altos.
3. A ultrasonografia é o método de eleição para avaliar o funcionamento do coração, parênquima hepático,
vesícula biliar, rins, bexiga e intestino delgado e grosso, através de 4 janelas acústicas, que são: janela acústica cervical-dorsal e cervical-ventral, cervico-braquial, axilar e pré-femoral.
4. A tomografia computadorizada tem grande potencial para diagnosticar patologias que afetam o sistema
respiratório e esqueleto solucionando os problemas de superposição das estruturas esqueléticas que ocorre nas placas radiográficas.
5. A ressonância magnética proporciona imagens excelentes da maioria dos órgãos internos sendo de grande
valor para a inspeção detalhada das estruturas anatômicas. No entanto, a técnica está limitada a tartarugas de tamanho pequeno (até 40 cm de SCLmim), sendo necessário anestesiar o animal.

48

49
ARTICLES

50

51
AA RR TT II CC LL EE SS
4.1. CERVICAL AND COELOMIC RADIOLOGY OF THE LOGGERHEAD SEA TURTLE (CARETTA CARETTA)
Valente, A.L.; Cuenca, R.; Parga, M.L.; Lavín, S.; Franch, J. y Marco, I. (2006). Cervical and coelomic radiology of loggerhead sea turtle (Caretta caretta). Can. J. Vet. Res. 70: 285-290.

52

53

54
DD II AA GG NN OO SS TT II CC II MM AA GG II NN GG OO FF TT HH EE LL OO GG GG EE RR HH EE AA DD SS EE AA TT UU RR TT LL EE

55
AA RR TT II CC LL EE SS

56
DD II AA GG NN OO SS TT II CC II MM AA GG II NN GG OO FF TT HH EE LL OO GG GG EE RR HH EE AA DD SS EE AA TT UU RR TT LL EE
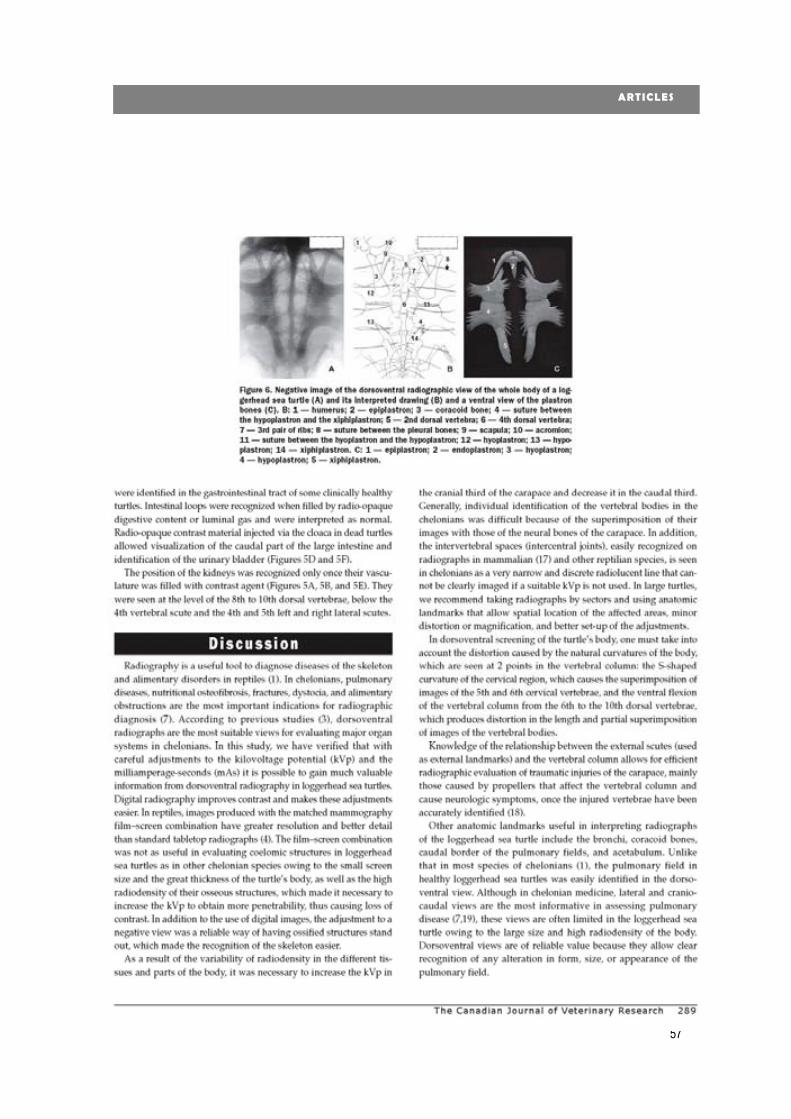
57
AA RR TT II CC LL EE SS

58
DD II AA GG NN OO SS TT II CC II MM AA GG II NN GG OO FF TT HH EE LL OO GG GG EE RR HH EE AA DD SS EE AA TT UU RR TT LL EE

59
AA RR TT II CC LL EE SS
4.2. RADIOGRAPHIC ANATOMY OF THE LIMBS OF THE JUVENILE AND SUBADULT LOGGERHEAD SEA TURTLES (CARETTA CARETTA)
Valente, A.L.; Marco, I; Zamora, M.A.; Parga, M.L.; Lavín, S.; Alegre, F. y Cuenca, R. (2007). Radiographic anatomy of the limbs of the juvenile and subadult loggerhead sea turtles (Caretta caretta). Can. J. Vet. Res. Aceptado para publicación.

60

61
AA RR TT II CC LL EE SS
RADIOGRAPHIC ANATOMY OF THE LIMBS OF THE JUVENILE AND SUBADULT LOGGERHEAD SEA TURTLES (Caretta caretta).
A. L.Valente, I. Marco, M. Zamora, M. L. Parga, S. Lavin, Alegre F. and
R. Cuenca Address of authors: Servei d’Ecopatologia de Fauna Salvatge. Facultat de Veterinària, Universitat Autònoma de Barcelona; 08193-Bellaterra, Barcelona, Spain (Valente, Cuenca, Lavin, Marco). Diagnosis Médica, Córcega, 345, Barcelona, Spain (Zamora) Centre de Recuperació d`Animals Marins; Camí Ral 239, 08330 - Premià de Mar, Barcelona, Spain (Parga, Alegre) Corresponding author: Ana Luisa Valente. Servei d’Ecopatologia de Fauna Salvatge, Facultat de Veterinària, Universitat Autònoma de Barcelona; 08193-Bellaterra, Barcelona, Spain. Telephone number: +34 93 581 19 23; Fax number: +34 93 581 20 06;
Abstract This study aims to provide the normal radiographic anatomy of the limbs of the loggerhead sea turtle (Caretta
caretta). Dorso-palmar (-plantar) radiographs were taken on the fore- and hindlimbs of 15 juvenile and 15 sub-adult loggerhead sea turtles, 17 alive and 13 deceased. Additionally, computed tomography (CT), gross anatomy, osteological and histological studies were performed on the limbs of 5 of them for comparison with radiological findings. Bones from the distal part of the fore- and hind flippers were seen in detail using mammography film-screen combination. Pectoral and pelvic girdles, superimposed by the carapace, were better seen on the standard radiographs using rare-earth intensifying screens. Mammographic radiographs of the manus of 5 small juvenile turtles showed active growth zones. Visualization of bone contours on the distal part of the limbs was clearer compared with mammals due to the very few superimpositions between them. The presence of a significant cartilage in the epiphyses produced better visibility of limb-ends. We have concluded that the use of mammographic film-screen combination is the best mode to evaluate the bony and joint structures of the fore- and hindlimbs of juvenile and subadult sea turtles. Radiographs provided reliable images for clinical purposes. Considering the low cost and logistics of this technique it is one of the more practical ancillary tests that marine animal rehabilitation centres can use.
Keywords: radiographic anatomy, loggerhead sea turtle, Caretta caretta, limbs, diagnostic imaging.
62
DD II AA GG NN OO SS TT II CC II MM AA GG II NN GG OO FF TT HH EE LL OO GG GG EE RR HH EE AA DD SS EE AA TT UU RR TT LL EE
Introduction
Sea turtle populations have declined over the past few decades due to human activity. Boat-strike injuries, entanglement in fishing nets, the swallowing of hooks, fishing lines and crude oil are the main causes of sea turtle mortality around the Canary Islands and in the Western Mediterranean (1, 2). The loggerhead sea turtle (Caretta caretta) is listed as endangered (3) and is the most common species accidentally caught by fishing activities in the Mediterranean Sea. Juveniles and subadults are most commonly caught and most animals rescued from fishing nets have some degree of limb trauma which occurs when turtles become entrapped in nets, leading to strangulation of extremities (2). Once at the rehabilitation centre, proper physical assessment should be performed as should a minimum standard database including blood analysis and radiographs (4).
Different imaging methods are available today for veterinary practice. However, normal radiological parameters are scarce for most free-ranging animals, including sea turtles. Previous authors have reported radiological techniques applied to reptile species (5, 6, 7, 8, 9, 10). However, due to the wide morphologic variety of reptiles, further knowledge of the normal radiographic anatomy in a particular species is required.
This article forms part of a wide-ranging study on diagnostic imaging of the loggerhead sea turtle, its purpose being to provide the normal radiographic anatomy of the limbs of the loggerhead sea turtle. We have combined radiological information with computed tomography, osteological, gross anatomical and histological data of the apendicular skeleton of this species in order to provide useful information for increasing relevant clinical knowledge.
Materials and Methods
Dorso-palmar (-plantar) radiographs were taken on the fore- and hindlimbs of 15 juvenile and 15 sub-adult
loggerhead sea turtles accidentally caught in pelagic longline sets and fishing nets along the North-Western Mediterranean coast. Juvenile turtles were considered to be those with a minimum straight carapace length (SCLmin) of 21 to 40 cm, and sub-adults those with a SCLmin of 41 to 65 cm (11). Seventeen of the animals were alive and thirteen deceased. Live turtles were temporally housed in the rehabilitation facilities of the Rescue Centre for Marine Animals (CRAM) (Premiá de Mar, Barcelona, Spain). Only turtles free of limb damage or skeleton pathology were considered for this study. The turtles were manually restrained in ventral recumbency, the limbs maintained with cellotape in a physiological position. No sedation was required; only the eyes were masked. Table-top images were taken using a Toshiba – Rotanode tm (Model E7239) x-ray tube at a 68-cm film-focal distance. Radiographs were taken using UM- MA hc, 24x30 cm for mammography medical x-ray film, a Fuji AD-MA screen (UM MAMMO fine, Fuji Photo Film Co., Ltd.; Tokyo 106-8620) and Super HR-GB, 30x40 cm film and rare-earth intensifying screens, (Fuji ECD). Using a negatoscope the radiographs were photographed and digitalized at a minimum resolution of 300dpi. Radiographs were evaluated and radiographic anatomy described when found to be consistent.

63
AA RR TT II CC LL EE SS
Multi-detector Computed Tomography (MDCT) of the whole body was performed in four juvenile and one subadult loggerhead sea turtles. Turtles were anaesthetized with the association of intravenous ketamine (15mg/K,
Imalgene® 1000, Merial) and diazepam (0,5mg/Kg, Diazepam, Almirall Proderfarma, Prodes), injected into the dorsal
cervical sinus to prevent flipper movement. Cardiac frequency was verified using a mini-doppler and the animals were carefully kept wet prior to the scan. MDCT studies were obtained by a sixteen-detector row CT scanner (Aquilion 16, Toshiba Medical, Tokyo, Japan) using the following parameters: 120 kVp, 250mA, 16 x 1mm detector configuration and a 512 x 512 matrix. The field of view ranged from 35cm to 52cm and total time examination took between 10-15 seconds, depending on the size of the turtle. The volumetric data of the limbs were reconstructed with a 1mm slice width and
reconstruction interval of 0.8 mm. Three-dimension images were generated on a Vitrea computer workstation (Vitrea®
version 3.0.1., Vital Images, Plymouth, MN). In order to obtain anatomical information of the limbs from the dead turtles, five of them (2 juvenile and 3
subadult) were frozen at -80◦ C, and serial parallel sections from 18 to 20 mm thick were taken in the dorsal plane using an electric bone saw. The limb bones and associated joints were evaluated and samples of epiphyses of the humerus, radius, ulna, femur, tibia, fibula, metacarpal and metatarsal bones and phalanges were collected and fixed in neutral-buffered 10% formalin solution for histological study.
Five loggerhead sea turtle skeletons from the Museo de Zoología de Barcelona and the Departamento de Sanidad y Anatomía, Facultad de Veterinaria of UAB were photographed and radiographed for osteological data.
Radiologically visible structures were compared with those observed on osteological preparations, 3D CT reconstructions, gross anatomical sections and histological samples. All radiographic images were analyzed with Adobe
Photoshop® (Adobe Photoshop® v 5.5, Adobe Systems Incorporated; USA) and normal and inverted (negative) images
were compared. The anatomical terminology used in this study is that of the Nomina Anatomica Veterinaria. In addition, specific
terminology for sea turtles (12) was also applied.
Results
Bones from the distal part of the fore and hind flippers were seen in detail in radiographs using the mammography film-screen. CT reconstructions images showed best definition to examine the cortical bone, density of the matrix and trabeculas. The pectoral and pelvic girdles were better seen in the standard table-top radiographs using rare-earth intensifying screens than the mammographic film-screen combination. These regions will be not described here since they were included in a previous publication on the coelomic cavity (13). Bones from juvenile and subadult loggerhead sea turtles did not differ in form or structure; however some bony features such as the head and greater tuberosity of the humerus and the head and major trochanter of the femur were more pronounced in the subadults.

64
DD II AA GG NN OO SS TT II CC II MM AA GG II NN GG OO FF TT HH EE LL OO GG GG EE RR HH EE AA DD SS EE AA TT UU RR TT LL EE
Radiographically, a large joint space was seen in all synovial joints of the limbs (Fig.1A). In the anatomical sections a thick hyaline cartilage cone plugged each bone forming the great part of the epiphyseal area (Fig. 1B). Mammographic radiographs of 5 small juvenile turtles showed a thin radiolucent line followed by a radiodense longitudinally striated and thicker band (Fig. 2A) mainly in the physes of the metacarpals, metatarsals, phalanges and distal physes of the humerus. Subcondral growth was observed in all bones. These findings were interpreted based on the histological analyses of the same animals, as active growth zones in the epiphyseal plate (Fig. 2D). Long bones consisted primarily of a core of cancellous bone bounded by a thin cortex of compact bone (Fig. 2 B-C). The histological study carried out in 2 juveniles showed that the epiphysis consisted of a mass of undifferentiated cartilage where the cells (condrocytes) of the layer next to the shaft forming the growth zone were flattened and arranged in longitudinal columns, showing different degrees of hypertrophy. Condrocytes nearest to the shaft were more vacuolated than those nearest the end of the epiphyses. In the 3 subadult turtles, the cellular arrangement in the growth area was similar to that observed in the 2 juvenile ones; however the longitudinal columns were not so well-defined. In all cases, mineralization of a cartilage template was observed and endocondral bone was set down on the eroded surface of the cartilage (Fig. 2D).
Figure 1. Dorsoventral radiographic view (A) and dorsal anatomical section (B) of the shoulder joint of a loggerhead sea turtle. 1, Cartilaginous part of humerus head. 2, articular end of the Scapula (cranial fused bone is the Acromion process – 2a); 3, articular end of the coracoid; 4, humerus head; 5, greater tuberosity.
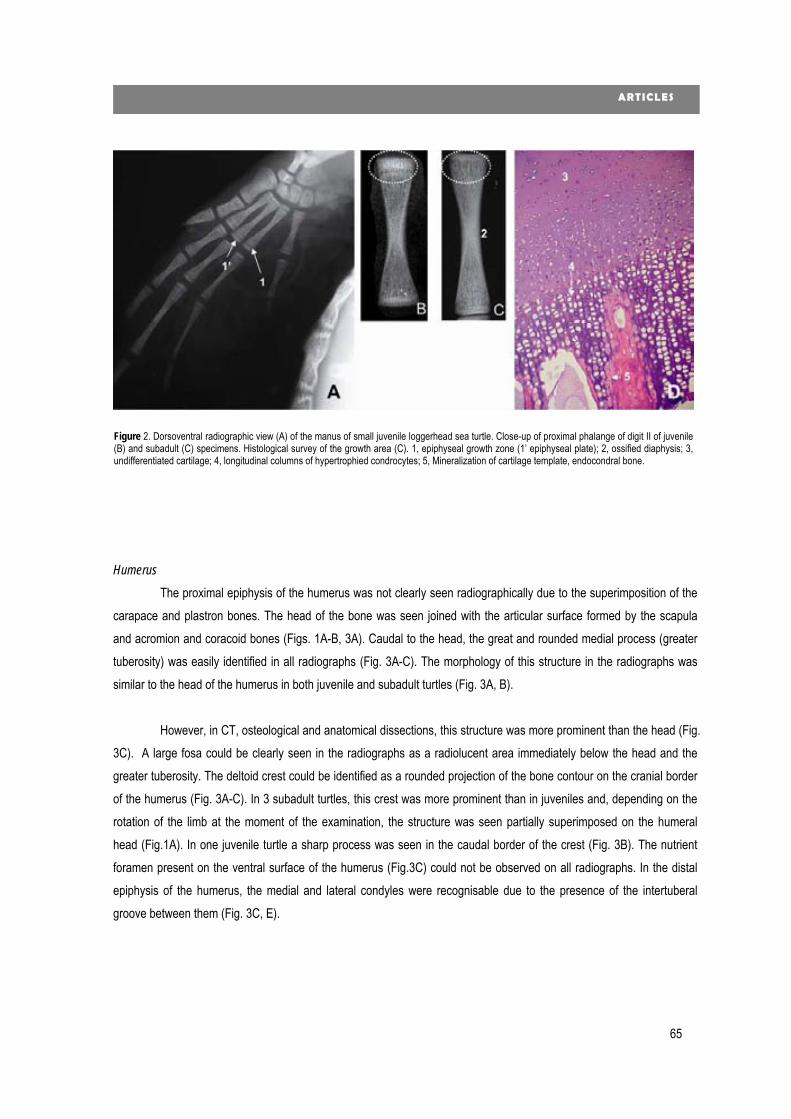
65
AA RR TT II CC LL EE SS
Humerus
The proximal epiphysis of the humerus was not clearly seen radiographically due to the superimposition of the carapace and plastron bones. The head of the bone was seen joined with the articular surface formed by the scapula and acromion and coracoid bones (Figs. 1A-B, 3A). Caudal to the head, the great and rounded medial process (greater tuberosity) was easily identified in all radiographs (Fig. 3A-C). The morphology of this structure in the radiographs was similar to the head of the humerus in both juvenile and subadult turtles (Fig. 3A, B).
However, in CT, osteological and anatomical dissections, this structure was more prominent than the head (Fig.
3C). A large fosa could be clearly seen in the radiographs as a radiolucent area immediately below the head and the greater tuberosity. The deltoid crest could be identified as a rounded projection of the bone contour on the cranial border of the humerus (Fig. 3A-C). In 3 subadult turtles, this crest was more prominent than in juveniles and, depending on the rotation of the limb at the moment of the examination, the structure was seen partially superimposed on the humeral head (Fig.1A). In one juvenile turtle a sharp process was seen in the caudal border of the crest (Fig. 3B). The nutrient foramen present on the ventral surface of the humerus (Fig.3C) could not be observed on all radiographs. In the distal epiphysis of the humerus, the medial and lateral condyles were recognisable due to the presence of the intertuberal groove between them (Fig. 3C, E).
Figure 2. Dorsoventral radiographic view (A) of the manus of small juvenile loggerhead sea turtle. Close-up of proximal phalange of digit II of juvenile (B) and subadult (C) specimens. Histological survey of the growth area (C). 1, epiphyseal growth zone (1’ epiphyseal plate); 2, ossified diaphysis; 3, undifferentiated cartilage; 4, longitudinal columns of hypertrophied condrocytes; 5, Mineralization of cartilage template, endocondral bone.

66
DD II AA GG NN OO SS TT II CC II MM AA GG II NN GG OO FF TT HH EE LL OO GG GG EE RR HH EE AA DD SS EE AA TT UU RR TT LL EE
Radius and ulna
The bones were seen partially superimposed, the radius, shorter than the ulna was seen cranial to it. The radius had a broad and triangular proximal epiphysis and its caudal border showed a concave curvature. The ulna was seen as straight and tubular shaped with its distal end superimposed on the ulnare and radiale carpal bones (Fig. 3E, 4A). No pronounced process or grooves were visualized in either bones and the cortices were markedly thickened in the mid-diaphyseal region but tapered proximally and distally (Figs. 3E, 4A). Carpal bones
The nine carpal bones could be clearly recognized in the carpus due to scant superimposition (Fig. 4A-C). In the proximal row, the radiale was seen as a rectangular bone placed laterally. The ulnare showed a semilunar shape,
Figure 3. Negative image of dorsoventral radiographic view of humerus of sub-adult (A, E) and juvenile (B) loggerhead sea turtles; ventral view of humerus (C) and anatomical section of elbow joint (D). 1, humerus head; 2, greater tuberosity; 3, fossa between humerus head and greater tuberosity; 4, deltoid crest; 5, sharp process on deltoid crest; 6, nutrient foramen; 7, intercondylar sulcus; 8, medial condyle; 9, growth zone; 10, radius; 11, ulna.
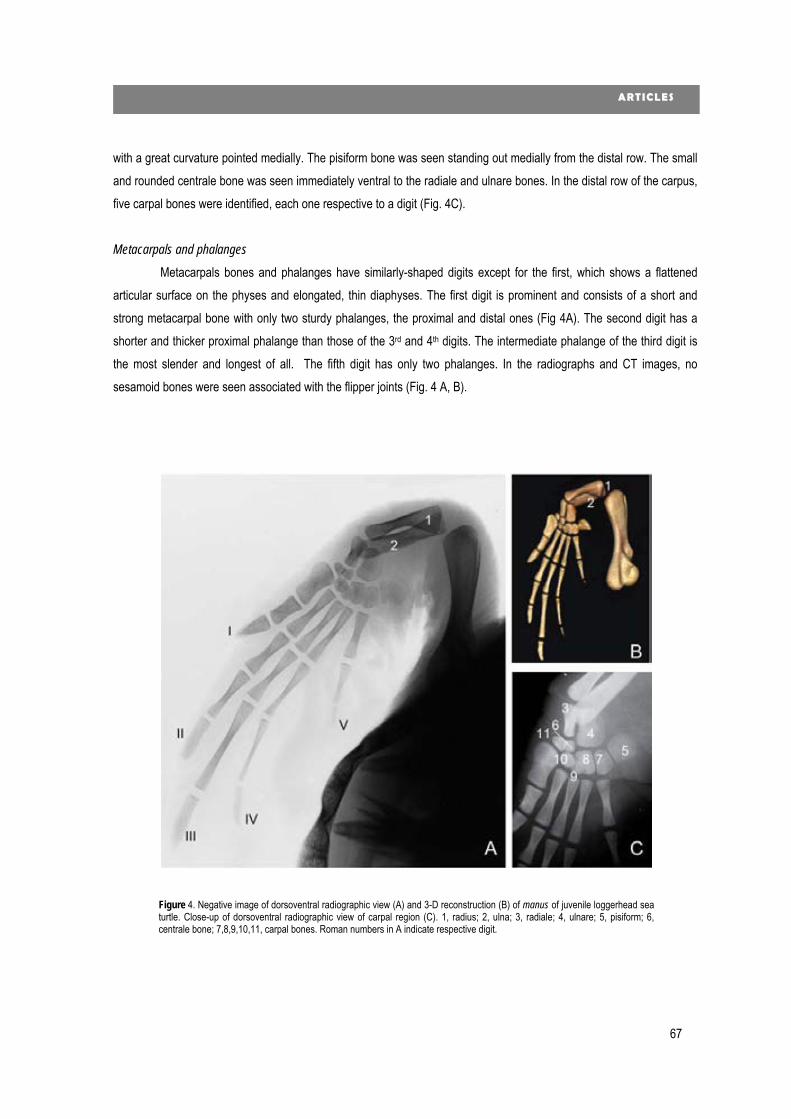
67
AA RR TT II CC LL EE SS
with a great curvature pointed medially. The pisiform bone was seen standing out medially from the distal row. The small and rounded centrale bone was seen immediately ventral to the radiale and ulnare bones. In the distal row of the carpus, five carpal bones were identified, each one respective to a digit (Fig. 4C).
Metacarpals and phalanges
Metacarpals bones and phalanges have similarly-shaped digits except for the first, which shows a flattened articular surface on the physes and elongated, thin diaphyses. The first digit is prominent and consists of a short and strong metacarpal bone with only two sturdy phalanges, the proximal and distal ones (Fig 4A). The second digit has a shorter and thicker proximal phalange than those of the 3rd and 4th digits. The intermediate phalange of the third digit is the most slender and longest of all. The fifth digit has only two phalanges. In the radiographs and CT images, no sesamoid bones were seen associated with the flipper joints (Fig. 4 A, B).
Figure 4. Negative image of dorsoventral radiographic view (A) and 3-D reconstruction (B) of manus of juvenile loggerhead sea turtle. Close-up of dorsoventral radiographic view of carpal region (C). 1, radius; 2, ulna; 3, radiale; 4, ulnare; 5, pisiform; 6, centrale bone; 7,8,9,10,11, carpal bones. Roman numbers in A indicate respective digit.

68
DD II AA GG NN OO SS TT II CC II MM AA GG II NN GG OO FF TT HH EE LL OO GG GG EE RR HH EE AA DD SS EE AA TT UU RR TT LL EE
Femur
The joint of the head of the femur with the acetabulum superimposed on the carapace bones was clearly visible in all radiographs taken using conventional plain film (Fig. 5A, B). In juvenile turtles, most of the head was made up of cartilage. In the subadult animals the ossified head was stouter than in juvenile and was joined to the physes through a thick neck (Fig 5A-E). The prominent major trochanter was seen caudal to the head. The diaphysis was long and slender. The condyles on the distal epiphyses could not be differentiated because the distal epiphysis was superimposed on the marginal bones of the carapace. Neither the patella nor other sesamoid bones were visualized in the stifle joint (Fig. 5A, 6B).
Tibia and fibula
The tibia and fibula could be seen with scant superimposition of epiphyses. The tibia was thicker, cranial to the fibula, and with a convex articular surface at the proximal epiphysis. Both bones were elongated and fairly similar in length (Fig. 6A, B).
Figure 5. Dorsoventral radiographic view of hip joint of sub-adult (A) and juvenile (B) loggerhead sea turtles. Gross anatomy section (C), radiographic view (D) and osteological preparation (E) of proximal epiphysis of femur. 1, femoral head; 2, greater trochanter; 3, pubis; 4, ilium; 5, ischium; 6, growth zone.

69
AA RR TT II CC LL EE SS
Tarsal bones
Six tarsal bones were perfectly visualized in all radiographs. We have identified two rounded and bigger ones and four quite spherical and smaller ones (Fig. 6 A-C). On the proximal row the great astragalus was seen laterally below the tibia, and the calcaneum seen as a small rounded bone positioned medially below the fibula (Fig.6C). In the distal row, the V tarsal bone was articulated with the IV and V metatarsal bones and was prominent because of its heart shape and the large size related to other tarsal bones, which were spherical and positioned just proximal to each respective digit, I, II and III (Fig. 6C). Metatarsals and phalanges
Similar to the forelimb, the first digit consisted of a short, flattened and strong metatarsal bone and only two sturdy phalanges. Digits II to V showed three somewhat proportioned phalanges. The V metatarsal bone is flattened and resembles the I metatarsal bone, though slightly smaller (Fig.6 A, B).
Figure 6. Negative image of dorsoventral radiographic view (A) and 3-D reconstruction (B) of pedis of juvenileloggerhead sea turtle. Close-up of dorsoventral radiographic view of tarsal region (C). 1, tibia; 2, fibula; 3, astragalus; 4,calcaneum; 5, V tarsal bone; 6, 7, 8, tarsal bones; 9, metatarsal bone from digit I; 10, metatarsal bone from digit V.Roman numbers in A indicate respective digit.
70
DD II AA GG NN OO SS TT II CC II MM AA GG II NN GG OO FF TT HH EE LL OO GG GG EE RR HH EE AA DD SS EE AA TT UU RR TT LL EE
Discussion Routine radiography of the limbs is usually performed in at least three views: dorso-palmar (or –plantar), lateral
and oblique (14). The flattened shape and relative thinness of the loggerhead sea turtles’ flippers when compared with the compact and quite cylindrical limbs of the terrestrial vertebrates precludes the use of other views except the dorso-palmar (-plantar). Size or morphological distortion was observed only at the proximal end of the humerus, where the great tuberosity was seen partially superimposed on itself showing an unreal shape in the radiographs. Numerous anatomical differences between the limbs of chelonians and those of mammalians, or even between turtles and other reptiles, make them a unique patient. When comparing radiographs of limbs of sea turtles with those of mammals, such as the dog or cat, there is a clearer visualization of the bone contours due to the scant superimpositions between them. Additionally, the presence of a massive cartilage in the epiphyses produced better visibility of the articular ends. According to previous information (15) these cartilaginous epiphyses become gradually thinner with age because the passage of undifferentiated cells into the growth zone and consequently the articular and growth zones come into close approximation; however growth may be retained even in aged animals. Easy visualization of the bone ends was a finding with practical clinical application because the diagnosis of bone disorders such as fractures, osteomyelitis, osteofibrosis and mainly joint pathologies could be easily made using a conventional and inexpensive x-ray technique.
Previous studies (8) have reported that the matched mammography film-screen combination was superior to standard Buchy and table-top radiographs in the evaluation of bone and soft tissues in small reptiles. The combination results in a resolution of 10-20 line pairs (lp)/mm as opposed to the 5-10 lp/mm resolution in standard radiographic techniques (8), which in this study permitted optimal visualization of the cancellous and compact bone arrangement in the long bones, and the epiphyseal growth areas. The growth areas observed in our animals as a radiopaque band at the end of the long bones were also observed in skeletally immature humans (16), where transverse trabecular bands of increased radiodensity appeared following a temporary slowdown or cessation of rapid longitudinal bone formation. When growth rates were normal, longitudinally-oriented trabeculae with interspersed marrow elements predominated at the zone of transformation of cartilage to bone (16).
Radiological examination of the long bone epiphyses together with evaluation of time of closure have been used as a chronological reference in various species of vertebrates (17, 18). In reptiles this methodology is not suitable because endocondral growth may be life-long (15). On the other hand, turtles and crocodiles do not have isolated ossification centres in the epiphysis (bony epiphysis) such as occurs with squamates (snakes and lizards) and mammals (15). Curiously, in our study only in 5 of 15 juvenile turtles was the presence of epiphyseal plates detected radiographically in the long bones of the manus. We are unaware of the reasons why these areas were not seen in all juvenile animals, as should be expected. Patterns of reptile growth have attracted considerable attention over the past few decades (19, 20, 21). The presence of growth rings in the transverse section of the humerus has been studied in reptiles, including sea turtles (22), as a method to calculate age. Turtles grow at different rates during the ontogenetic period, the rate being influenced quality and quantity of diet (15, 23). In their early years of life, oceanic-stage loggerhead

71
AA RR TT II CC LL EE SS
sea turtles have relatively little control over their geographic position or movements and thus they have an extremely stochastic lifestyle with great variation in food availability and temperature (24). Temporary cessation of growth may occur even in relatively young turtles; it is resumed later, after perforation of the bony plates and renewal of activity by the marrow (15). The environmental variation results in variable growth rates, that could be directly associated with the inconsistent presence of a distinct growth area in the long bones of juvenile turtles of this study.
The shape and structure of bones is governed by many factors - genetic, metabolic and mechanical. In reptiles, the pectoral and pelvic arches appear to have a very anomalous position in the Chelonia, inasmuch as they seem to be situated inside and not outside the skeleton trunk (12). Modifications of the sea turtle pectoral limb into a semi-rigid elongated and flattened flipper for forelimb propulsion has resulted in proportional changes in the limb skeleton and shifts in the distributions of muscle tissue (25). This reduced presence of musculoskeletal elements includes the sesamoid bones, thus accounting for their absence in the radiographs of the present study. Although reptilian compact bone is quite similar to the other vertebrates, we have found the bone cortex to be relatively thinner in the case of turtles, with minor radiographic contrast between bones. Compared to the radiographic anatomy of well-known species such as the dog or cat (26), the diaphysis of turtle bones in general seems to show a smoother surface without pronounced processes, crests or tuberosities. As a result, there is a clearer radiographical image of the bone internal structure, with minimal superimposition of superficial bony elements. The response pattern of the bone to injury in reptiles differs significantly from that found in mammals. New periosteal bone production is less prominent in the former and it is common to see a radiolucent fracture line in clinically stable fractures that have healed with a fibrous callus (10, 27).
Mammographic radiographs and the multiplanar TC reconstructions were observed to provide similar information; the latter also involved greater cost and is a technique not readily available in rehabilitation centers. Also, more time is needed for image manipulation. Three-dimension reconstructions were useful to see the different views of the structures. However, this kind of virtual processing, when applied to extremely tight bone structures, as is the case with carpal or tarsal bones, may produce an artificial effect whereby the structures seems to be joined.
In this study we have concluded that the use of mammographic film-screen combination is the best radiographic modality to evaluate the bone and joint structures of the fore and hindlimbs of juvenile and subadult sea turtles. Radiographs provided reliable images for clinical purposes. Considering the low cost and logistics of this technique it is one of the more practical ancillary tests that marine animal rehabilitation centres can use.
Acknowlegments
The authors would like to thank Professor Dr. Francisco Reina and the laboratory technician Isabel Delgado Calvarro, Facultat de Medicina, UAB, for help with the anatomical sections, and the radio-diagnostic technician Montse March for technical support with the MDCT. Thanks also go to the Museo de Zoología de Barcelona and the Depto. de Sanidad y Anatomía, Facultad de Veterinaria of the UAB for providing the turtle skeletons. We are grateful to Dr. Jordi Franch, Depto de Medicina y Cirugia Animal, Facultad de Veterinaria of the UAB for the review of this paper.

72
DD II AA GG NN OO SS TT II CC II MM AA GG II NN GG OO FF TT HH EE LL OO GG GG EE RR HH EE AA DD SS EE AA TT UU RR TT LL EE
References
1. Orós J, Torrent A, Calabuig P, Déniz S. Diseases and causes of mortality among sea turtles stranded in the Canary Islands, Spain (1998-2001). Dis Aquat Organ 2005;63:13-24.
2. Pont SG, Alegre FN. Work of the Foundation for the Conservation and Recovery of Marine Life. Marine Turtle Newsletter 2000;87:5-7.
3. IUCN. Red List of Threatened Species 2004.www.iucnredlist.org. Accessed February 22, 2006. 4. Wyneken J, Mader DR, Weber III ES, Merigo C. Medical care of sea turtles. In: Mader DR ed. Reptile Medicine and Surgery.
Canada: Elsevier Inc., 2006:972-1007. 5. Wyneken J. Computed tomography and Magnetic resonance imaging anatomy of reptiles. In: Mader DR ed. Reptile Medicine
and Surgery. Canada: Elsevier Inc., 2006:1088-1096. 6. Rübel A, Kuoni W. Radiology and Imaging. In: Frye FL ed. Biomedical and surgical aspects of captive reptile husbandry. 2nd ed.
USA: Krieger Pub. Co., 1991:185-208. 7. Jackson OF, Sainsbury AW. Radiological and related investigations. In: Beynon PH, ed. BSAVA Manual of Reptiles. British
Small Animal Association. Dorset: J. Looker Printers, 1992: 63-72. 8. DeShaw B, Schoenfeld A, Cook RA, Haramati N. Imaging of Reptiles: a comparison study of various radiographic techniques.
J Zoo Wildl Med 1996;27: 364-370. 9. Hernandez-Divers S, Hernandez-Divers S. Diagnostic imaging of reptiles. In Practice 2001; july/august: 370-391. 10. Wilkinson R, Hernandez-Divers S, Lafortune M, Calvert I, Gumpenberger M, MCarthur S. Diagnostic Imaging. In: McArthur S,
Wilkinson R, Meyer J, eds. Medicine and Surgery of tortoises and turtles. Victoria, Australia: Blackell Publishing Ltd., 2004:187-238. 11. Dodd CK Jr. Synopsis of the biological data on the loggerhead sea turtle Caretta (Linnaeus 1758). U.S. Fish and Wildlife
Service Biological Report 1988;88:35-82 12. Wyneken J. The Anatomy of Sea Turtles. U.S. Departament of Commerce NOAA Technical Memorandum NMFS-SEFSC
2001;470:1-172. 13. Valente AL, Cuenca R, Parga ML, Lavin S, Franch J, Marco I. Cervical and coelomic radiology of the Loggerhead Sea turtle,
Caretta caretta. Can J Vet Res (in press). 14. Morgan JP. Techniques of veterinary radiography. Iowa State University Press, Ames, Iowa, 1993. 15. Haines RW. Epiphyses and sesamoids. In: Gans C, d'A Bellairs A, eds. Biology of the Reptilia. New York: Academic
Press,1969:81–115 16. Ogden JA. Growth slowdown and arrest lines. J. Pediatr Orthop 1984;4:409-415. 17. DiGiancamillo M, Rattegni G, Podestà M, Cagnolaro L, Cozzi B, Leonardo L. Postnatal ossification of the thoracic limb in
striped dolphins (Stenella coeruleoalba) (Meyen, 1833) from the Mediterranean Sea. Can J Zool 1998;76:1286-1293. 18. Serrano E, Gállego L, Pérez JM. Ossification of the Appendicular Skeleton in the Spanish Bies Capra pyrenaica Schinz, 1838
(Artiodactyla: Bovidae), with Regard to Determination of Age. Anat Histo. Embryol 2004;33: 33-37. 19. Hailey A, Coulson IM. The growth pattern of the African tortoise Geochelone pardalis and other chelonians. Can J Zool
1999;77:181-193. 20. Bjorndal KA, Bolten AB, Martins HR. Somatic growth model of juvenile loggerhead sea turtles Caretta caretta: duration of
pelagic stage. Mar Ecol Prog Ser 2000;202:265-272.
73
AA RR TT II CC LL EE SS
21. Arcos-García JL, Peralta MAC, Rosales VHR, Martínez GDM, Cerrilla MEO, Sánchez FC. Growth characterization of black iguana (Ctenosaura pectinata) in captivity. Vet Mex 2002;33:409-419.
22. Zug GR, Wynn A, Ruckdeschel C. Age Estimates of Cumberland Island Loggerhead Sea Turtles. Marine Turtle Newsletter 1983; 25:9-11.
23. Spencer RJ. Growth patterns of two distributed freshwater turtles and a comparison of common methods used to estimate age. Aust J Zoo 2002;50:477-490.
24. Bjorndal KA, Bolten AB, Dellinger T, Delgado C, Martins HR. Compensatory growth in oceanic loggerhead sea turtles: response to a stochastic environment. Ecology 2003;84:1237–1249.
25. Wyneken J. Comparative and functional considerations of locomotion in turtles. [PhD dissertation]. Urbana-Champaign. University of Illinois, 1988.
26. Konde LJ. Appendicular Skeleton – Companion Animals. Diseases of the Immature skeleton. In: DE Thrall, ed. Textbook of Veterinary Diagnostic Radiology. Philadelphia: WB Saunders, 1994:94-104.
27. Silverman S. Diagnostic Imaging. In: Mader DR, ed. Reptile Medicine and Surgery. USA: W.B. Saunders, 2006:471-489.

74
75
AA RR TT II CC LL EE SS
4.3. NORMAL ULTRASONOGRAPHIC IMAGING OF THE LOGGERHEAD SEA TURTLE (CARETTA CARETTA)
Valente, A.L.; Parga, M.L.; Espada, Y.; Lavin, S.; Alegre, F.; Marco, I. y Cuenca, R. (2007). Normal ultrasonographic imaging of the loggerhead sea turtle (Caretta caretta). Vet Rec. 160. Aceptado para publicación.

76

77
AA RR TT II CC LL EE SS
NORMAL ULTRASONOGRAPHIC IMAGING OF THE LOGGERHEAD SEA TURTLE
(Caretta caretta) A.L.Valente1, DVM, MSc; M L. Parga2, DVM, MSc; Y. Espada3, DVM, PhD; S. Lavin1, DVM, PhD; F. Alegre2, DVM; I. Marco1, DVM, PhD and R. Cuenca1, DVM, PhD.
Address of authors: 1Servei d’Ecopatologia de Fauna Salvatge. Facultat de Veterinària, Universitat Autònoma de Barcelona, 08193-Bellaterra, Barcelona, Spain. 2Centre de Recuperació d`Animals Marins, Camí Ral, 239 - 08330 Premià de Mar, Barcelona, Spain. 3Departament de Medicina i Cirurgia Animal. Facultat de Veterinària, Universitat Autònoma de Barcelona, 08193-Bellaterra, Barcelona, Spain. Correspondence address: MSc. Ana Luisa Valente. Servei d’Ecopatologia de Fauna Salvatge, Facultat de Veterinària, Universitat Autònoma de Barcelona, 08193-Bellaterra, Barcelona, Spain. Telephone number: +34 93 581 19 23; Fax number: +34 93 581 20 06; e-mail: [email protected].
Summary This work describes the normal ultrasonographic appearance of cervical structures and coelomic organs of loggerhead sea turtles. Twenty live, and five dead juvenile and subadult loggerhead sea turtles were studied. Ten soft-tissue areas of integument were used as acoustic windows: cervical-dorsal and cervical-ventral, left and right cervicobrachial, left and right axillary, left and right prefemoral and left and right postfemoral acoustic windows. Anatomical cross-sections were performed on the dead turtles to provide reference data. The fourth and fifth cervical vertebrae, the spinal cord, and the venous sinuses of the external jugular vein are clearly seen on the cervical-dorsal acoustic window. On the cervical-ventral acoustic window, the esophagus and the heart were imaged. The stomach was more frequently seen through the left axillary acoustic window. Although the liver could be imaged through both sides, the right axillary acoustic window was the most indicated to see the gallbladder. The large and small intestines and the kidneys could be seen in the right and left prefemoral acoustic windows; the latter were easily identified due to the intense renal vasculature. This study shows that ultrasonography is a useful tool for diagnosis in juvenile and subadult loggerhead sea turtles.
Keywords: ultrasound, Loggerhead Sea Turtle, Caretta caretta, echoanatomy, anatomy
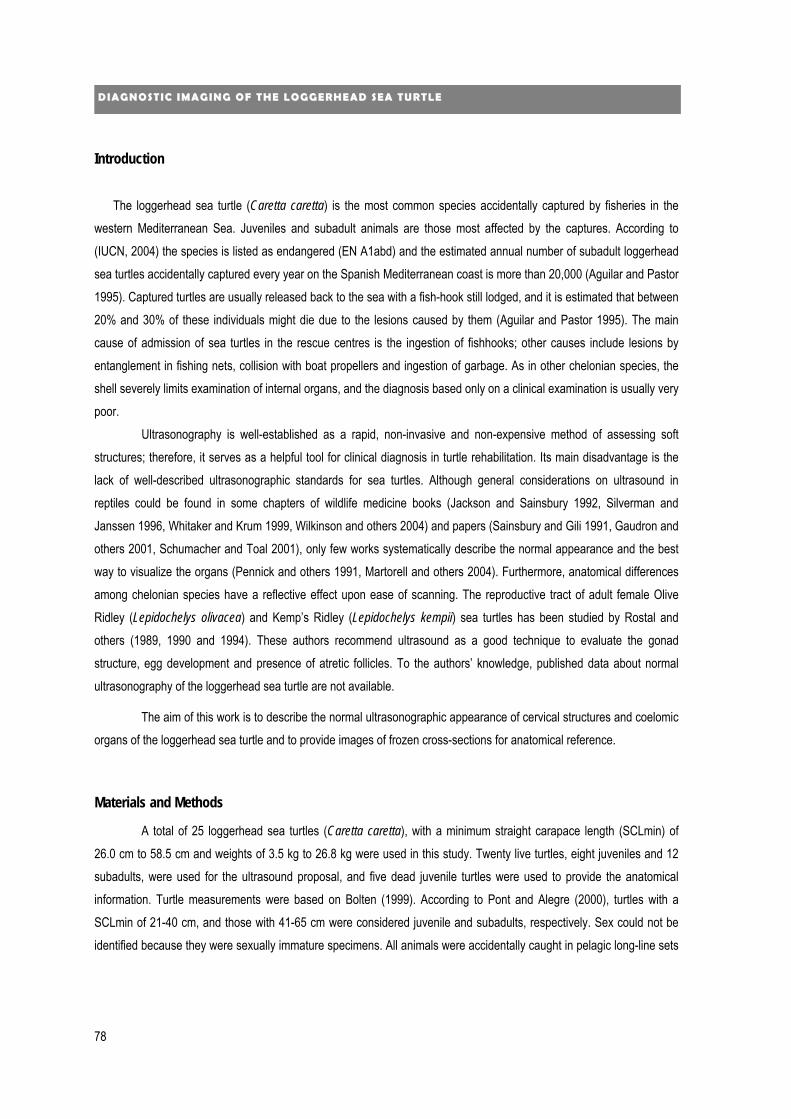
78
DD II AA GG NN OO SS TT II CC II MM AA GG II NN GG OO FF TT HH EE LL OO GG GG EE RR HH EE AA DD SS EE AA TT UU RR TT LL EE
Introduction
The loggerhead sea turtle (Caretta caretta) is the most common species accidentally captured by fisheries in the
western Mediterranean Sea. Juveniles and subadult animals are those most affected by the captures. According to (IUCN, 2004) the species is listed as endangered (EN A1abd) and the estimated annual number of subadult loggerhead sea turtles accidentally captured every year on the Spanish Mediterranean coast is more than 20,000 (Aguilar and Pastor 1995). Captured turtles are usually released back to the sea with a fish-hook still lodged, and it is estimated that between 20% and 30% of these individuals might die due to the lesions caused by them (Aguilar and Pastor 1995). The main cause of admission of sea turtles in the rescue centres is the ingestion of fishhooks; other causes include lesions by entanglement in fishing nets, collision with boat propellers and ingestion of garbage. As in other chelonian species, the shell severely limits examination of internal organs, and the diagnosis based only on a clinical examination is usually very poor.
Ultrasonography is well-established as a rapid, non-invasive and non-expensive method of assessing soft structures; therefore, it serves as a helpful tool for clinical diagnosis in turtle rehabilitation. Its main disadvantage is the lack of well-described ultrasonographic standards for sea turtles. Although general considerations on ultrasound in reptiles could be found in some chapters of wildlife medicine books (Jackson and Sainsbury 1992, Silverman and Janssen 1996, Whitaker and Krum 1999, Wilkinson and others 2004) and papers (Sainsbury and Gili 1991, Gaudron and others 2001, Schumacher and Toal 2001), only few works systematically describe the normal appearance and the best way to visualize the organs (Pennick and others 1991, Martorell and others 2004). Furthermore, anatomical differences among chelonian species have a reflective effect upon ease of scanning. The reproductive tract of adult female Olive Ridley (Lepidochelys olivacea) and Kemp’s Ridley (Lepidochelys kempii) sea turtles has been studied by Rostal and others (1989, 1990 and 1994). These authors recommend ultrasound as a good technique to evaluate the gonad structure, egg development and presence of atretic follicles. To the authors’ knowledge, published data about normal ultrasonography of the loggerhead sea turtle are not available.
The aim of this work is to describe the normal ultrasonographic appearance of cervical structures and coelomic organs of the loggerhead sea turtle and to provide images of frozen cross-sections for anatomical reference.
Materials and Methods
A total of 25 loggerhead sea turtles (Caretta caretta), with a minimum straight carapace length (SCLmin) of 26.0 cm to 58.5 cm and weights of 3.5 kg to 26.8 kg were used in this study. Twenty live turtles, eight juveniles and 12 subadults, were used for the ultrasound proposal, and five dead juvenile turtles were used to provide the anatomical information. Turtle measurements were based on Bolten (1999). According to Pont and Alegre (2000), turtles with a SCLmin of 21-40 cm, and those with 41-65 cm were considered juvenile and subadults, respectively. Sex could not be identified because they were sexually immature specimens. All animals were accidentally caught in pelagic long-line sets

79
AA RR TT II CC LL EE SS
and fishing nets along the northwestern Mediterranean coast (40°31’- 42°26’ N and 0°32’-3°10’ E), Spain, and were temporally housed in the rehabilitation facilities of the Rescue Centre for Marine Animals (CRAM), Premiá de Mar, Barcelona, Spain. Only turtles in good condition, based on physical, radiographic and haematological parameters, were used in this study. From the turtles captured in longlines, we included only those in which the hook was superficially attached in the buccal cavity. During the ultrasonographic examinations, the animals were manually restrained in ventral recumbency on a bucket, high enough to avoid the limbs contacting the table. No sedation was necessary. The head, neck or limbs were extended as needed. Eyes were kept blind through a mask and the body surface was kept wet using a sopping towel. Ten soft-tissue areas of integument were used as acoustic windows: cervical- dorsal and cervical-ventral, left and right cervicobrachial, left and right axillary, left and right prefemoral and left and right postfemoral acoustic windows (Figure 1). Colour and pulsed doppler were applied in the large vessels. Ultrasonographic examinations were performed with a real-time, B-mode scanner (Computed Sonography Siemens 128XP/10, Acuson) using sector electronic transducers and frequencies of 4.0, 5.0 and 7.0 MHz. Coupling gel (Polaris II, GE Medical Systems, Leonhard Lang GmbH, Archenweg 56, A-6020; Innsbruck, Austria) was placed on the surface of the transducer, which was oriented mainly on the horizontal plane (the one oriented parallel to the plastron and carapace). Other planes were not used due to size limitations of the acoustic windows and transducer. Images were recorded using videotapes. Records of the ultrasound images were made with a thermal printer.
Anatomical sections were performed on three frozen turtles, each one in an oriented plane: sagital plane, frontal plane and transverse plane. Two other dead turtles were dissected to improve the morphological data. Anatomical terminology followed Wyneken (2001).
Figure 1. Acoustic-window and echo accesses used for the ultrasound scan of loggerhead sea turtles. The diagram shows only the right side

80
DD II AA GG NN OO SS TT II CC II MM AA GG II NN GG OO FF TT HH EE LL OO GG GG EE RR HH EE AA DD SS EE AA TT UU RR TT LL EE
Results and Discussion
The fourth and fifth cervical vertebrae, the spinal cord, and the venous sinuses of the external jugular vein (also
called cervical-dorsal sinus) were clearly seen in a transverse and transverse-oblique scan on the cervical-dorsal acoustic window (Figure 2, A-C). The ultrasonographic contour of the vertebrae was visible with echogenic borders followed by acoustic shadowing due to the strong reflection from the osseous tissue. The vertebral arch and the spinal cord were clearly recognized and could be used as landmarks to identify the right and left cervical-dorsal sinuses, which lay dorso-lateral to the vertebrae. The sinuses are broad dilatations of the external jugular vein (Figure 2, B-F) and were ultrasonographically identified as superficial, rounded, distensible hypo-echogenic structures connected to the venous vessels. The connection between left and right cervical sinuses was seen through the anastomosis with the vertebral vein, which lay centrally on the vertebral arch (Figure 2: B, D). The echoes of the circular blood flow inside the sinuses were sometimes visible. The dimensions of the sinuses were variable but, in general, relatively greater than those cited by Whitaker and Krum (1999). These authors stated that the dorsal-cervical sinus in 25-kg turtle was about 1 x 2 cm in a transverse section, while we found measurements of about 2.5 x 3.5 cm and 1.8 x 4.2 cm in a 26.8-kg and 58.5-cm SCLmin turtle, and in an 8.6-kg and 39- cm SCLmin turtle, respectively. The disparity could be related to different factors. Because reptiles are ectothermal animals, and the sinuses are vascular structures related to thermo-regulation, changes in their flow and dimensions are expected due to external temperature variation, as occurs in the front flippers (Hochscheid and others 2001). The turtles used in this study were scanned in the summer, and consequently underwent
relatively high temperatures (25°C to 35°C) during the transportation and the procedure. Therefore, an increase in sinus
size could be due to a vasodilatation response. Additionally, the inclination angle of the transverse oblique scan could also be related to the larger size found because of the longitudinally slanted section of the vessels, which could justify the greater length. On the other hand, compared to the anatomical sections, it was observed that the sinuses were not only a single dilation of the jugular vein, but also a complex of small cavities separated by fine membranous walls (Figure 2: D, F), which could not be completely visualized ultrasonographically.
Through the cervical-ventral acoustic window, the heart was dorso-ventrally flattened and located between the two hepatic lobes. The atria, during diastole, could be identified as oval anechogenic-paired structures with a fine echogenic wall (Figure 3, A). The ventricle had a homogenously echogenic appearance, with distinction of a thick wall with trabecular lining (Figure 3: A, B, D). Due to the slow heart rate, the echoes corresponding to blood flow and atrial diastole were easily recognized during ventricular systole. Only an atrioventricular valve was clearly seen as a short horizontal echogenic line centrally placed between the atria and ventricle. In juvenile specimens the best way to see the heart was the cervical-ventral acoustic window. Through this point, all three chambers and the large vessels on the cardiac base could be identified on a horizontal plane. By this access the scan usually passes along the dorsal aspect of the heart, where the pulmonary and subclavian arteries could be seen together with the aortic arches (Figure 3, A-D).

81
AA RR TT II CC LL EE SS
Figure 2: Ultrasound evaluation of the cervical-dorsal structures of the loggerhead sea turtle: a, vertebral vein, anastomosis point to transversal vein; b’-b’’, sinuses of external jugular vein, c, vertebral body; d, spinal cord. A and B: Ultrasound images of a transversal scan. C: Ultrasound image of oblique scan of the venous cervical sinus (b) of the jugular vein. D: anatomical transversal cross-section corresponding to transversal scan. E: illustration showing the transversal and transversal oblique planes preferred for imaging of the cervical venous sinuses (a and b, sinues of the jugular vein). F: Ultrasound image of the complex of jugular sinuses seen in a 45° oblique scan, the black arrow indicates the cervical vertebra.
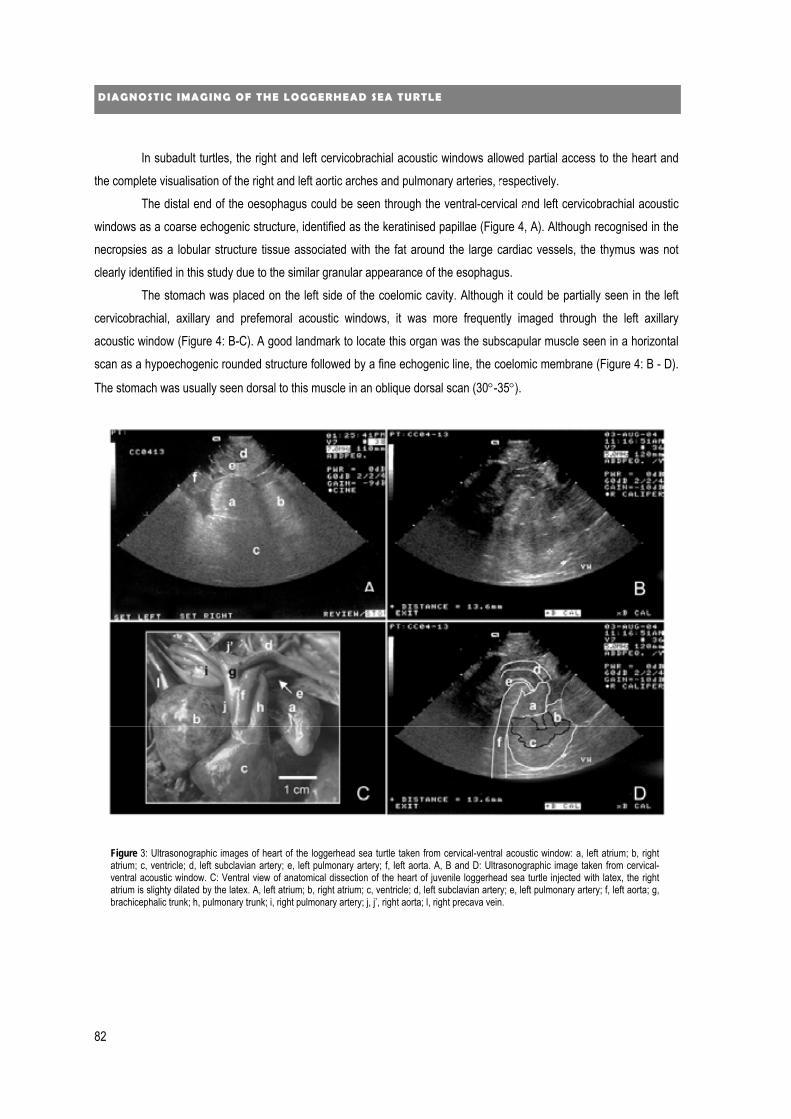
82
DD II AA GG NN OO SS TT II CC II MM AA GG II NN GG OO FF TT HH EE LL OO GG GG EE RR HH EE AA DD SS EE AA TT UU RR TT LL EE
In subadult turtles, the right and left cervicobrachial acoustic windows allowed partial access to the heart and the complete visualisation of the right and left aortic arches and pulmonary arteries, respectively.
The distal end of the oesophagus could be seen through the ventral-cervical and left cervicobrachial acoustic windows as a coarse echogenic structure, identified as the keratinised papillae (Figure 4, A). Although recognised in the necropsies as a lobular structure tissue associated with the fat around the large cardiac vessels, the thymus was not clearly identified in this study due to the similar granular appearance of the esophagus.
The stomach was placed on the left side of the coelomic cavity. Although it could be partially seen in the left cervicobrachial, axillary and prefemoral acoustic windows, it was more frequently imaged through the left axillary acoustic window (Figure 4: B-C). A good landmark to locate this organ was the subscapular muscle seen in a horizontal scan as a hypoechogenic rounded structure followed by a fine echogenic line, the coelomic membrane (Figure 4: B - D).
The stomach was usually seen dorsal to this muscle in an oblique dorsal scan (30°-35°).
a
b
c
d e
f
Figure 3: Ultrasonographic images of heart of the loggerhead sea turtle taken from cervical-ventral acoustic window: a, left atrium; b, right atrium; c, ventricle; d, left subclavian artery; e, left pulmonary artery; f, left aorta. A, B and D: Ultrasonographic image taken from cervical-ventral acoustic window. C: Ventral view of anatomical dissection of the heart of juvenile loggerhead sea turtle injected with latex, the right atrium is slighty dilated by the latex. A, left atrium; b, right atrium; c, ventricle; d, left subclavian artery; e, left pulmonary artery; f, left aorta; g, brachicephalic trunk; h, pulmonary trunk; i, right pulmonary artery; j, j’, right aorta; l, right precava vein.

83
AA RR TT II CC LL EE SS
Figure 4: Ultrasound evaluation of the esophagus and stomach of the loggerhead sea turtle. A: Ultrasound image of esophagus, cross-section scan. B-C: Ultrasound image of stomach taken from left axillary acoustic window: a, stomach lumen; b, subscapular muscle; c, coelomic membrane. D: Illustration showing the oblique image plane preferred for imaging the stomach: a, stomach lumen; b, subscapular muscle; c, coelomic membrane; d, coracoid. E: Corresponding frontal gross anatomical seccion.
84
DD II AA GG NN OO SS TT II CC II MM AA GG II NN GG OO FF TT HH EE LL OO GG GG EE RR HH EE AA DD SS EE AA TT UU RR TT LL EE
In general, the stomach showed a thin wall with folds seen as thin hypoechogenic lines, and produced poor images due to the presence of intraluminal gas and contents (Figure 4: B-C).
The liver was visualised as an echogenic structure with granular parenchyma (Figure 5, A). Hepatic vessels were seen as anechogenic tubular structures either in transverse or longitudinal sections (Figure 5, A). The best accesses to this organ were through the left and right axillary acoustic windows (Figure 5, B). The right axillary acoustic window was the one most indicated to see the gallbladder, which had an anechogenic spherical/oval appearance within the right hepatic lobe (Figure 5: A, C). The postcava (also called right hepatic vein) could be identified on entering the right atrium via the sinus venous valve (Figure 5, D) by this acoustic window.
Figure 5: Ultrasound evaluation of liver of the loggerhead sea turtle: A: Ultrasonographic image taken from right axillary acoustic windows: a, branches of right hepatic vein (Postcava); b, hepatic parenchyma; c, subscapular muscle, d, gallbladder. B: Corresponding frontal gross anatomical seccion: a, right hepatic vein; b, hepatic parenchyma; c, subscapular muscle; d, gallbladder; e, area of the right atrium; f, sinuses of jugular vein. C: Ultrasound image of the hepatic parenchyma: d, cross-section of the gallbladder. D: Ultrasound image of the liver and heart: a, right hepatic vein ( Postcava); b, hepatic parenchyma; c, subscapular muscle; d, right atrium.

85
AA RR TT II CC LL EE SS
The large and small intestines could be seen in the prefemoral acoustic window from both sides. Loops of small intestine were more frequently imaged on the right side. The ultrasonographic image of the intestine was similar to that of mammals (Mattoon and others 2002), and stratification in five layers could be recognised. The wall of the small intestine was thicker than that of the large intestine (Figure 6, A-B). The serose and submucose layers were easily identified as echogenic lines. The muscular layer, between them, had a hypoechoic to anechoic appearance. The mucosa was the thickest hypoechoic layer (Figure 6, C). On the contrary, the wall of the large intestine did not have clearly distinguishable layers.
The kidneys were easily identified due to the intense renal vasculature, which could be used as a landmark.
They could be imaged superficially from the prefemoral acoustic window (Figure 6, D) from the respective side, and showed a uniformly echogenic area, comma like, without a distinct renal pelvis and capsule. The great renal vein was easily seen, cranial to the kidney (Figure 6, A-B).
Figure 6: Ultrasound evaluation of the kidney and intestines of the loggerhead sea turtle. A-B: Ultrasonographic images taken from rightprefemoral acoustic window: a, right kidney; b, cross-section of small intestine; c, cross-section of large intestine; d and d’, blood supply of thekidney. C: Ultrasound image of the kidney (a) and longitudinal section of small intestine (b). D: Illustration showing dorsal view of the imagedarea in a frontal anatomical section: a, kidney; b, loop of small intestine; c, section of large intestine; d, renal vein.
86
DD II AA GG NN OO SS TT II CC II MM AA GG II NN GG OO FF TT HH EE LL OO GG GG EE RR HH EE AA DD SS EE AA TT UU RR TT LL EE
The urinary bladder could be seen, only when it was completely filled, as an anechoeic globular structure (Figure 7: A, C). It was better identified from the left prefemoral acoustic window (Figure 7, B). Echogenic dots were seen floating within and were considered normal. They could be related not only to the presence of urate crystals but also to parasites or fecal material, which could opportunistically enter as a result of its closed connection with the cloaca (Wyneken 2001). Vesical parasites were found in one of the three dissected turtles (unpublished data).
According to Wyneken (2001), sea turtles have two small, accessory urinary bladders connected to the urinary bladder, each located laterally to the neck of the urinary bladder and dorsal to the pubis. In this study, the neck of the urinary bladder could not be imaged due to the acoustic shadow of the pubic bone. These structures were not found in the gross-anatomy detailed dissections of our work (unpublished data).
The reproductive tract, the spleen, pancreas and adrenal glands could not be identified in this study. The pancreas extends as an irregular strip along the duodenum just past the stomach. The spleen has an oval form located below the pancreas. These organs were not ultrasonographically accessible due to their small size, midline location and the artifacts caused by intestinal loops surrounding them. They were also not documented in a previous study in California desert tortoises (Xerobates agassizi) (Penninck and others 1991).
The post-femoral acoustic windows allowed access to the caudal end of the kidney only in a few larger subadult turtles. In juvenile turtles just the femur and muscular mass could be imaged through this point, it was deemed inadequate for the ultrasonographic evaluation of any coelomic structures.
In recent decades ultrasound imaging has been frequently used to evaluate the reproductive status in many reptilian and mammalian species (Küchling 1989, Owens and Kraemer 1990, Casares and others 1997, Rostral and others 1998, Brook and others 2000, Brook and others 2004). Some species of reptiles are not sexually dimorphic, and in these cases the ultrasonographic imaging of the gonads is a reliable and inexpensive method to identify the sex of the animals and select them for reproductive programmes (Morris and Allison 1996). In general, the loggerhead sea turtle do not exhibit differentiated external sexual characteristics until they reach the adult size (SCL>65 cm), which occurs at more than 20 years old (Bjorndal and others 2001). This work reveals that sex identification in subadult turtles can not be performed using ultrasonographic imaging. The small non-developed gonads are mistaken for renal parenchyma, and the tubular structures, such as oviduct and deferent canals, are not visible. The same limitation was found in Kemp’s Ridley sea turtles, where only ovarian follicles with sizes greater than 5 mm in diameter, and oviducts with eggs, were ultrasonographically recognised (Rostal and others 1990).
Knowledge of normal anatomy is essential for the interpretation of diagnostic techniques. Chelonians have well-protected internal viscera, and the few body parts not covered by the carapace or plastron are internally limited by the bone of the proximal end of the limbs (scapular and pelvic girdles), which usually limit scanning to one plane. Poor image quality could also be a consequence of the great size of the turtle in relation to the transducer frequency, the amount of fat tissue and the degree of emptiness of the gastrointestinal tract. High-frequency transducers used in this study (7 MHz) were suitable to assess in detail superficial structures like the cervical venous sinuses, stomach, intestines and kidneys. In juvenile turtles, this probe displayed good images of the kidneys and the heart when the latter was seen through the cervical- ventral acoustic window. In subadult animals the transducer of 5MHz was more frequently used,

87
AA RR TT II CC LL EE SS
and it allowed a good balance between penetration and resolution. The transducer of 4MHz was used infrequently because of its low resolution. Due to the direct access of the kidneys in the prefemoral acoustic windows, as in other chelonian species, this point could be used to perform ultrasound-guided biopsies of this organ. The hepatic and renal parenchymas were easily imaged and could be evaluated for morphologic alteration in shape and size, as well as for the presence of neoplasia, cysts, abscesses and papillomas.
Due to the slow digestive transit time, the presence of food in the gastrointestinal tract in turtles with a fasting
period of 24 to 48h produced multiple artifacts and poor images, mainly of the stomach. Concerning the digestive tract, the diagnosis of obstructive processes due to garbage ingestion or severe mucosal damage caused by fishing hooks (accordion effect) could also be possible.
Although it is known in mammals that low-level echoes are returned from fat in certain areas of the body (Nyland and others 2002), low-resolution images are also obtained from some fat turtles, mainly using the cervicobrachial acoustic windows.
Figure 7: Ultrasound evaluation of the kidney and urinary bladder of the loggerhead sea turtle. A: Ultrasonographic image of urinary bladder (a) and kidney (b). B: Corresponding gross anatomy of the scanned area. C: Full urinary bladder with echogenic dots.
88
DD II AA GG NN OO SS TT II CC II MM AA GG II NN GG OO FF TT HH EE LL OO GG GG EE RR HH EE AA DD SS EE AA TT UU RR TT LL EE
This study shows that ultrasonography can be a useful tool for the diagnosis of different internal lesions in juvenile and subadult loggerhead sea turtles. It is inexpensive, safe and easy to use and with practice, most of the internal organs can be located and examined.
Acknowledgements The authors would like to thank DVM Rosa Novellas and the CRAM volunteers for their help in this work. The English of this manuscript had been corrected by a native English-speaking instructor of English of this University. We also would like to thank the anonymous reviewers.
References
AGUILAR, R. & PASTOR, X. (1995) Impact of Spanish swordfish longline fisheries on the Loggerhead Sea Turtle, Caretta caretta, population in the Western Mediterranean. Proceedings of the Twelfth Annual Symposium on Sea Turtle Biology and Conservation. NOAA Technical Memorandum NMFS-SEFSC 361, Georgia, February 25 to 29, 1992. pp. 1-6.
BJORNDAL, K.A., BOLTEN, A.B., KOIKE, B., SCHROEDER, B.A., SHAVER, D.J., TEAS, W.G. & WITZELL, W.W. (2001) Somatic growth function for immature loggerhead sea turtles, Caretta caretta, in Southeastern U.S. waters. Fishery Bulletin 99: 240-246.
BOLTEN, A. (1999) Techniques for measuring sea turtles. Research and manangement techniques for the conservation of sea turtles. In: IUCN/SSC Marine Specialist Group Publication (4). Eds K. L. Eckert, K. A. Bjorndal, F. A. Abreu-Grobois and M. Donnelly. pp 1-5. http://www.iucn-mtsg.org/Publications/Tech_Manual/Tech_Manual_en/18-bolten.pdf. Accessed February, 2006.
BROOK, F. M., KINOSHITA, R., BROWN, B. & METREWELI, C. (2000) Ultrasonographic imaging of the testis and epididymis of the bottlenose dolphin, Tursiops truncatus aduncus. Journal of Reproduction and Fertility 119, 233-240.
BROOK, F, LIM, E.H.T., CHUA, F.H.C. & MACKAY, B. (2004) Assessment of the reproductive cycle of the Indopacific Humpback dolphin, Sousa chinensis, using ultrasonography. Aquatic Mammals 30, 137-148.
CASARES, M., RÜBEL, A. & HONEGGER, R.E. (1997) Observations on the female reproductive cycle of captive Giant Tortoises (Geochelone spp.) using ultrasound scanning. Journal of Zoo and Wildlife Medicine 28, 267-273.
GAUDRON, C., LIGNEREUX, Y. & DUCOS DE LAHITTE, J. (2001) Imagerie médicale appliquée à l`anatomie clinique des chéloniens en consultation. Proceedings of the Internacional Congreso on Testudo Genus. Toulouse, March 7-10. pp161-182.
HOCHSCHEID, S., BENTIVEGNA, F. & SPEAKMAN, J.R. (2002) Regional Blood Flow in Sea Turtles: Implications for Heat Exchange in an Aquatic Ectotherm. Physiological and Biochemical Zoology 75, 66.
IUCN (2004) Red List of Threatened Species.www.iucnredlist.org. Accessed February 22, 2006. KÜCHLING, G. (1989) Assessment of ovarian follicles and oviductal eggs by ultrasound scanning in live freshwater turtles, Chelodina
oblonga. Herpetologica 45, 89-94. MARTORELL, J., ESPADA, Y. & RUIZ DE GOPEGUI, R. (2004) Normal echoanatomy of the Red-eared slider terrapin (Trachemys
scripta elegans). Veterinary Record 155, 417-420. MATTOON, J.S., AULD, D.M. & NYLAND, T.G. (2002) Abdominal ultrasound scanning techniques. In: Small Animal Diagnostic
Ultrasound. 2nd edn. Ed. Thomas G. Nyland. Philadelphia, W.B. Saunder Co. pp 49-81.

89
AA RR TT II CC LL EE SS
MORRIS, P. J. & ALLISON, A.C. (1996) Determination of sex in White-throated monitors (Varanus albigularis), Gila monsters (Heloderma suspectum), and Beaded Lizards (H. horridum) using two-dimensional ultrasound imaging. Journal of Zoo and Wildlife
Medicine 27, 371-377. NYLAND, T. G., MATTON, J.S., HERRGESELL, E. J. & WISNER, E. R. (2002) Physical principles, instrumentation, and safety of
diagnostic ultrasound. In: Small Animal Diagnostic Ultrasound. 2nd edn. Ed. T.G. Nyland. Philadelphia, W.B. Saunder Co. pp 1-18. OWENS, W. & KRAEMER, D.C. (1990) Ultrasound imaging of reproductive organs and eggs in Galapagos tortoises, Geochelone
elephantopus spp. Zoo Biology 9, 349-359. PENNINCK, D.G., STEWART, J.S., PAUL-MURPHY, J. & PION, P. (1991) Ultrasonography of the California Desert Tortoise
(Xerobates agassizi): Anatomy and Application. Veterinary Radiology 32, 112-116. PONT, S.G. & ALEGRE, F. N. (2000) Work of the Foundation for the Conservation and Recovery of Marine Life. Marine Turtle
Newsletter 87, 5-7. ROSTAL, D., KALB, H., GRUMBLES, J., PLOTKIN, P. & OWENS, D. (1994) Application of ultrasonography to sea turtle reproduction.
Proceedings of the Fourteenth Annual Symposium on Sea Turtle Biology and Conservation. NOAA Technical Memorandum NMFS-SEFSC 351, Texas, March 1 to 5, 1994. p181.
ROSTAL, D.C, OWENS, D. W., GLUMBLES, J.S., MACKENZIE, D. & AMOSS JR., M. S. (1998) Seasonal reproductive cycle of the Kemp’s Ridley sea turtle (Lepidochelys kempi). General and Comparative Endocrinology 109, 232-243.
ROSTAL, D.C., ROBECK, T. R., OWENS, D.W. & KRAEMER, D.C. (1990) Ultrasound imaging of ovaries and eggs in Kemp’s Ridley Sea turtles (Lepidochelys kempi). Journal of Zoo and Wildlife Medicine 21, 27-35.
ROSTAL, D., ROBECK, T., OWENS, D., LOUIS, E. & KRAEMER, D. (1989) Ultrasonic imaging of ovaries and eggs in sea turtles. Proceedings of the Ninth Annual Symposium on Sea Turtle Biology and Conservation. NOAA Technical Memorandum NMFS-SEFC 232, Georgia, February 7 to 11, 1989. p 257-258.
SAINSBURY, A.W. & GILI, C. (1991) Ultrasonographic anatomy and scanning technique of the coelomic organs of the Bosc monitor (Varanus exanthermaticus). Journal of Zoo and Wildlife Medicine 22, 421-433.
SCHUMACHER, J. & TOAL, R.L. (2001) Advanced Radiography and Ultrasonography in Reptiles. Seminars in Avian and Exotic Pet
Medicine 10, 162-168. SILVERMAN, S. & JANSSEN, D. (1996) Diagnostic Imaging. In: Reptile Medicine and Surgery. Ed. D. R. Mader. Philadelphia, W.B.
Saunders Co. pp 258-264 WHITAKER, B.R. & KRUM, H. (1999) Medical Management of sea turtles in aquaria. In: Zoo and Wild Animal Medicine – Currently
therapy, 4rd edn. Eds M. E. Fowller, E. Miller. Philadelphia, W. B. Saunders Co. pp 217-231. WILKINSON, R., HERNANDEZ-DIVERS, S., LAFORTUNE, M., CALVERT, I., GUMPENBERGER, M. & MCARTHUR, S. (2004)
Diagnostic Imaging. In: Medicine and Surgery of tortoises and turtles. Eds S. MCarthur, R. Wilkinson and J. Meyer. Victoria, Blackwell Publishing Ltd. pp187-238.
WYNEKEN, J. (2001) The Anatomy of Sea Turtles. NOAA Technical Memorandum NMFS-SEFSC 470. Miami, U.S. Departament of Commerce, 1-172.

90

91
AA RR TT II CC LL EE SS
4.4. COMPUTED TOMOGRAPHY OF THE VERTEBRAL COLUMN AND COELOMIC STRUCTURES IN THE NORMAL LOGGERHEAD SEA TURTLE (CARETTA CARETTA)
Valente, A.L.; Cuenca, R.; Zamora, M.A.; Parga, M.L.; Lavín, S.; Alegre, F. y Marco, I. (2006). Computed tomography of the vertebral column and coelomic structures in the normal loggerhead sea turtle (Caretta caretta). Vet. J. (2006), doi: 10.1016/j.tvjl.2006.08.018.

92
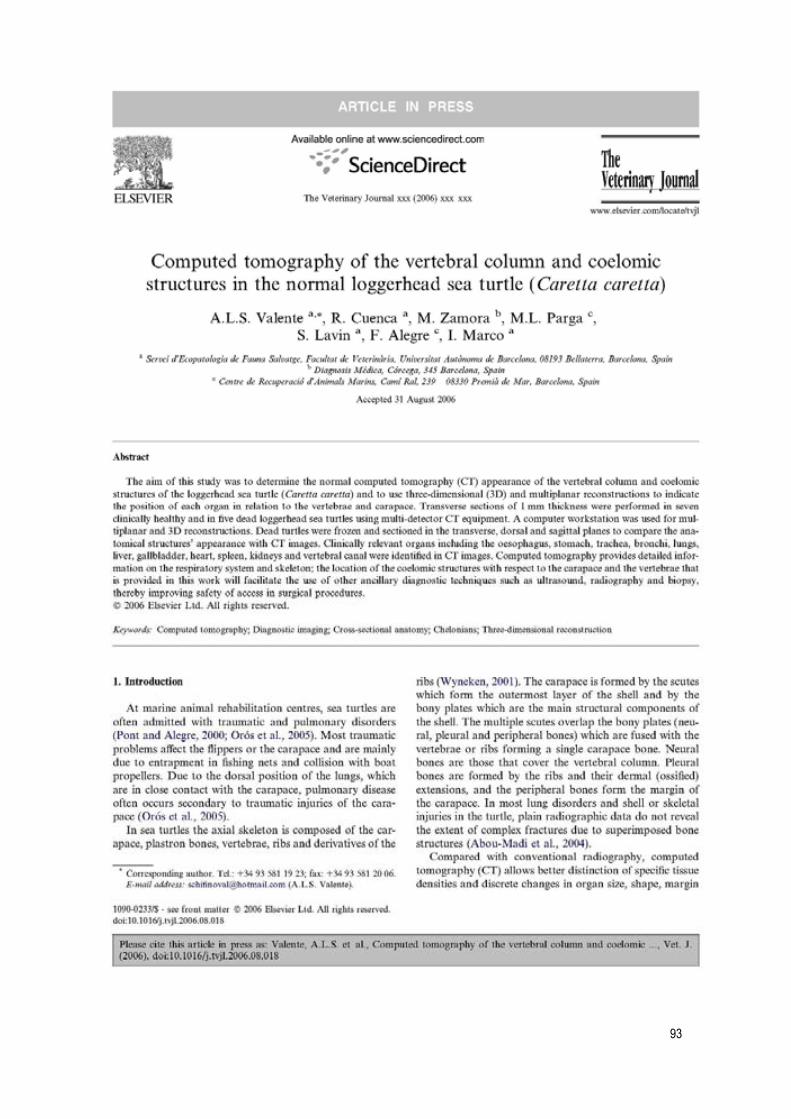
93

94
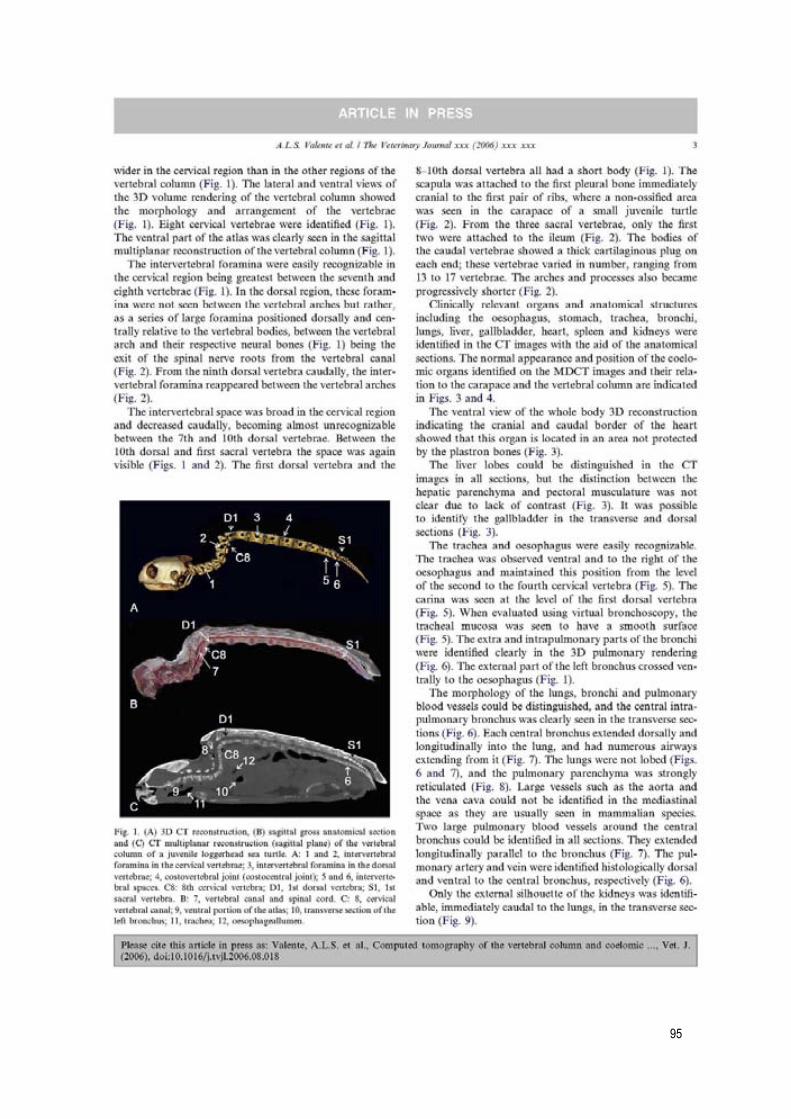
95
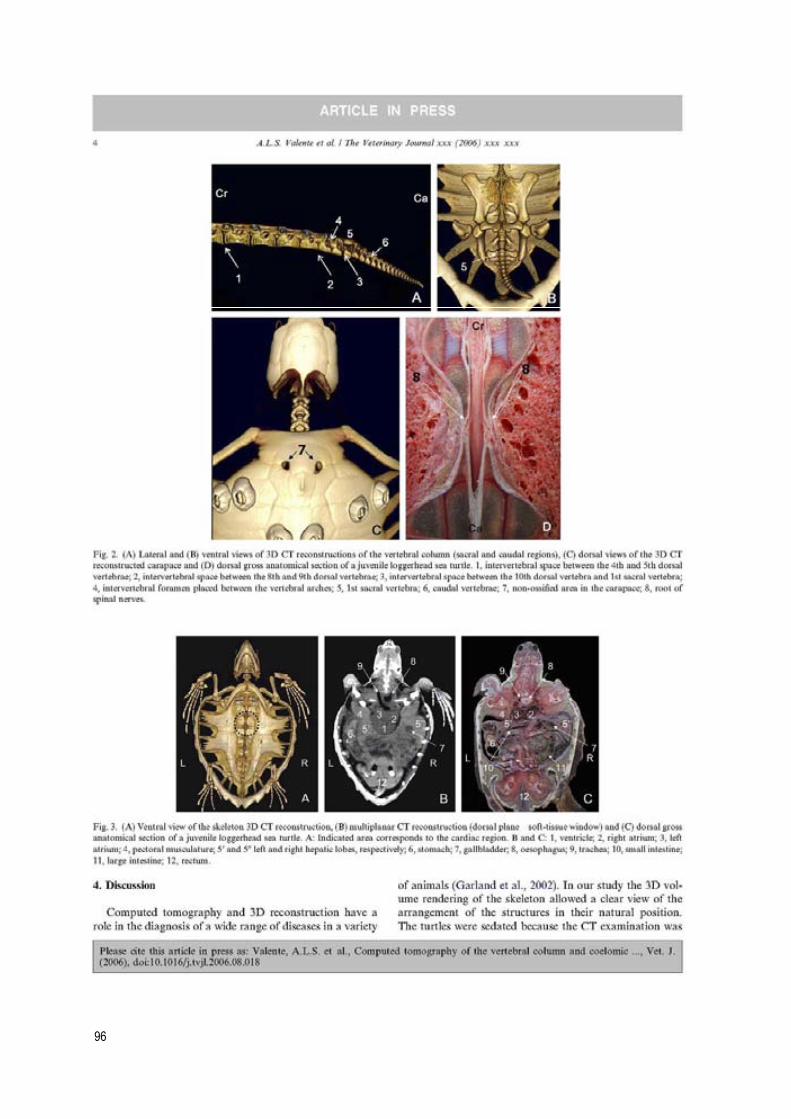
96

97

98

99

100

101

102
103
AA RR TT II CC LL EE SS
4.5. SECTIONAL ANATOMIC AND MAGNETIC RESONANCE IMAGING FEATURES OF COELOMIC STRUCTURES OF LOGGERHEAD SEA TURTLES
Valente, A.L.; Cuenca, R.; Zamora, M.A.; Parga, M.L.; Lavín, S.; Alegre, F. y Marco, I. (2006). Sectional anatomic and magnetic resonance imaging features of coelomic structures of loggerhead sea turtles. Am. J. Vet. Res., 67: 1347-1353.

104
105
AA RR TT II CC LL EE SS
106
DD II AA GG NN OO SS TT II CC II MM AA GG II NN GG OO FF TT HH EE LL OO GG GG EE RR HH EE AA DD SS EE AA TT UU RR TT LL EE

107
AA RR TT II CC LL EE SS

108
DD II AA GG NN OO SS TT II CC II MM AA GG II NN GG OO FF TT HH EE LL OO GG GG EE RR HH EE AA DD SS EE AA TT UU RR TT LL EE

109
AA RR TT II CC LL EE SS
110
DD II AA GG NN OO SS TT II CC II MM AA GG II NN GG OO FF TT HH EE LL OO GG GG EE RR HH EE AA DD SS EE AA TT UU RR TT LL EE

111
AA RR TT II CC LL EE SS

112

113
ANNEXES – ADDITIONAL PAPERS

114

115
AA NN NN EE XX EE SS –– AA DD DD II TT II OO NN AA LL PP AA PP EE RR SS
5. ANNEXES – ADDITIONAL PAPERS 5.1. EVALUATION OF DOPPLER ULTRASONOGRAPHY FOR THE MEASUREMENT OF BLOOD FLOW IN YOUNG LOGGERHEAD SEA TURTLES (CARETTA CARETTA) (IN PRESS)
Valente, A.L.; Parga, M.L.; Espada, Y., Lavin, S.; Alegre, F.; Marco, I. and Cuenca, R. (2007). Evaluation of Doppler ultrasonography for the measurement of blood flow in young loggerhead sea turtles (Caretta caretta). Vet. J. Aceptado para publicación. Doi: 10.1016/j.rvj..2007.03.006

116
117

118

119

120

121

122
123

124

125
AA NN NN EE XX EE SS -- AA DD DD II TT II OO NN AA LL PP AA PP EE RR SS
Valente, A.L.; Marco, I.; Parga, M.L.; Lavin, S.; Alegre, F. and Cuenca, R. (2007). Ingesta passage and gastric emptying times in loggerhead sea turtles (Caretta caretta). Res Vet Sci. Aceptado para publicación.
5.2. INGESTA PASSAGE AND GASTRIC EMPTYING TIMES IN LOGGERHEAD SEA TURTLES (CARETTA CARETTA) (IN PRESS)

126

127
AA NN NN EE XX EE SS –– AA DD DD II TT II OO NN AA LL PP AA PP EE RR SS
INGESTA PASSAGE AND GASTRIC EMPTYING TIMES IN LOGGERHEAD SEA TURTLES (Caretta caretta)
A. L.Valente, I. Marco, M. L. Parga, S. Lavin, Alegre F. and
R. Cuenca Address of authors: Servei d’Ecopatologia de Fauna Salvatge. Facultat de Veterinària, Universitat Autònoma de Barcelona; 08193-Bellaterra, Barcelona, Spain (Valente, Cuenca, Lavin, Marco). Centre de Recuperació d’Animals Marins; Camí Ral 239, 08330 - Premià de Mar, Barcelona, Spain (Parga, Alegre) Corresponding author: Ana Luisa Valente. Servei d’Ecopatologia de Fauna Salvatge, Facultat de Veterinària, Universitat Autònoma de Barcelona; 08193-Bellaterra, Barcelona, Spain. Telephone: +34 93 581 19 23;
Abstract Ingesta passage times of soft flat foam dishes and gastric emptying time of barium-impregnated polyethylene
spheres (BIPS®) were measured in 22 and 8 loggerhead sea turtles (Caretta caretta), respectively. Transit time (T1) was considered as the time between ingestion and first elimination, and retention time (T50) and total transit time (T85) the expulsion time of 50% and 85% of the markers, respectively. The experiments were carried out at different times of the year and water temperature was recorded. A set of dorso-ventral radiographs was taken to locate the BIPS®, and the gastrointestinal anatomy of 5 dead turtles was studied to help with interpretation of the radiographs. No significant correlation was observed between T1, T50,T85 and minimum straight carapace length (SCLmin) or body mass and no statistical difference was found in ingesta passage transit times between juvenile (n=6) and sub-adult turtles (n=16). Mean passage times of the dishes (in days) were: T1=9.05, T50 =12.00 and T85=13.19. Gastric emptying time using
BIPS® was 24 to 48h. . The transit time (T1) for the BIPS® was longer (13.25±4.86 days) than the foam markers
(8.5±2.73 days) in 8 turtles studied simultaneously. Although the total transit time tended to be faster in turtles submitted
to water temperatures between 20° and 23.6°C no significant correlation was observed between T1, T50 and T85 and the temperature.
Keywords: loggerhead sea turtle, Caretta caretta, BIPS®, ingesta passage time, transit time, gastrointestinal tract
morphology.

128
DD II AA GG NN OO SS TT II CC II MM AA GG II NN GG OO FF TT HH EE LL OO GG GG EE RR HH EE AA DD SS EE AA TT UU RR TT LL EE
Introduction
The loggerhead sea turtle (Caretta caretta) is a world-wide endangered species which is highly susceptible to human activity. The accidental ingestion of waste products from oil operations, plastic bags and other kinds of debris is one cause of mortality of this species throughout its distribution (Balazs, 1985; Bjorndal et al. 1994; Tomás et al. 2002; Milton and Lutz, 2003).
In some areas, such as the Mediterranean Sea, gastrointestinal disorders are common due to the ingestion of fishhooks, which cause traumatic injuries to the gastrointestinal tract leading to death (Pont and Alegre, 2000). Most turtles accidentally captured by fishing activities are released without removal of the hook. On admitttance to the marine rescue centres, diagnosis of gastrointestinal disorders in these turtles is very difficult; necropsy findings frequentely reveal severe gastrointestinal injuries such as enteritis followed by necrosis, bowel obstruction and intussusceptions produced by the folding effect of the line pulling through the intestine (Orós et al. 2005, Di Bello et al. 2006 a,b).
In domestic animals, knowledge of the ingesta passage and the normal gastric emptying times are useful in detecting gastrointestinal motility disorders and partial obstructions of the pylorus or small intestine (Manfred and Camilleri, 1992; Guilford, 2001). The digestive passage time of inert and indigestible markers, normally plastic pieces, or their simultaneous use with another type of marker have been used in many species, including chelonians (Lanyon and Marsh 1995; Spencer et al. 1998; Hernot et al. 2006; Hailey, 1997).
Barium sulphate suspension is the most frequently-used technique thanks to its inexpensiveness. However, it is not quantitative and evaluates the gastric emptying rate of the liquid but not the solid fraction of the ingesta (Guilford, 2001). When compared with a scintigram, the latter provides more accurate information (Goggin et al. 1998). Alternatively, barium-impregnated polyethylene spheres (BIPS®) have provided a range of diagnostic options which reduce the need to undertake exploratory surgery on cats and dogs (Nelson et al. 2001; Weber et al. 2002). The BIPS® are inert, white and have a density similar to food, but are sufficiently radiodense to show up clearly on abdominal radiographs.
In reptiles, mainly in herbivorous species, such as the iguana (Iguana iguana), Leopard tortoise (Testudo
pardalis), desert tortoise (Xerobates agassizii), Galapagos Giant tortoise (Geochelone nigra), Greek tortoise (Testudo
hermanii) and the short-necked turtle (Emydura macquarii), digestive studies have been performed to assess the normal transit and retention times and functional anatomy of the digestive tract (Barboza, 1995; Taylor et al., 1996; Meyer, 1998; Spencer et al., 1998; Smith et al., 2001; Hatt et al., 2002). The retention time in the aforementioned chelonians have varied from 7.5 to 14.8 days and were strongly influenced by both temperature and diet. Mean transit time of herbivorous species such as the Greek and Leopard tortoises were 2.6-17.3h and 6-6.91 days, respectively (Taylor et al., 1996; Meyer, 1998). Hailey (1997) compared the digestive efficiency and gut morphology of omnivorous and herbivorous African tortoises (Kinixys spekii and Geochelone pardalis, respectively). The author found the transit time was lower in K.
spekki (2.2 days) than in G. pardalis (3.8 days). As to loggerhead sea turtles, Di Bello et al. (2006b) evaluated the post-enterotomy transit time of barium
sulphate in the intestinal tract of six animals. Gastric emptying times and total digestive transit times were 34-264 h and

129
AA NN NN EE XX EE SS –– AA DD DD II TT II OO NN AA LL PP AA PP EE RR SS
192-960 h, respectively. The authors stated that although often adequate for the diagnosis of obstruction, the procedures were not easily performed on some turtles.
The aim of the current study is to report on ingesta passage times in the healthy loggerhead sea turtles using specific indices such as the transit and retention times. Further, we have added the index T85 as ‘total transit time’ considering the long time of ingesta passage in chelonians. This work aimed to generate baseline data on digestive physiology, and to determine whether the established method of transit time assessment used in dogs and cats using BIPS® could be applied.
Materials and Methods
Twenty-two loggerhead sea turtles (6 juvenile and 16 subadult specimens) accidentally caught in pelagic long line sets and fishing nets off the north-western Mediterranean coast of Spain were used in this study. Only those turtles in which the hook was superficially attached in or near the mouth and easily removed through the oral cavity were included in the study. Turtles showed minimum straight carapace length (SCLmin) of 31.5-54.5 cm and body weight of 4.4-22.2 kg. Juvenile turtles (n=6) were considered to be those with a SCLmin of 21 to 40 cm and sub-adults (n=16) those with a SCLmin of 41 to 65 cm (Dodd, 1988). The turtles were temporarily housed in the rehabilitation facilities of the Rescue Centre for Marine Animals (CRAM), in Premià de Mar, Barcelona, Spain. Complete blood count and serum chemistry values fell within normal limits. Only clinically normal animals were included in this study.
Turtles were accommodated in individual outdoor tanks measuring 100 x 100 x 50 (deep) cm and were kept at the acclimatisation centre for a minimum of 2 weeks prior the study. The photoperiod ranged between 11h/13h and 13h light/11h dark according to season of the year. During the study, all turtles were fed at 48 h intervals with a diet based on hake (Merluccius merluccius) and sardines (Sardina pilchardus sardina) (1:1) in a quantity equivalent to 1.5 – 2.5% of the turtle body mass. No difference in the food intake was observed in the different seasons. Water temperature in the different tanks ranged according to the ambient temperature, and was measured twice daily (morning and afternoon), the mean values for each tank being used in the analyses.
Colour-marker experiments were carried out in 3 periods: early autumn, summer and winter, using 12 (8 subadults and 4 juveniles; mean body mass=11.5kg, mean SCLmin= 41.8cm), 8 (6 subadults and 2 juveniles; mean body mass=14.38kg, mean SCLmin= 45.25cm) and 2 turtles (2 subadults; mean body mass=21.35kg, mean SCLmin= 52.75cm) respectively. We used different animals in each season. Each turtle, depending on its size, was given 10-20 coloured markers made with 5mm of diameter dishes of soft flat foam (Evaland, Evapal®- Palencia, Spain) placed inside the fish at first feeding. The presence of the coloured markers in the faeces or floating in the water was recorded daily.
In the 8 turtles used in the study during the summer, BIPS® (Medical I.D. Systems, Inc.- Michigan, USA) were used simultaneously with the colour markers in the same animals to assess gastric emptying and digesta intestinal transit times. BIPS® capsules with two sphere sizes - 1.5mm (30 units) and 5 mm (10 units) - were used. BIPS® and the colour markers were put inside of a mouth of one sardine that was swallowed by the turtle. Dorso-ventral radiographs

130
DD II AA GG NN OO SS TT II CC II MM AA GG II NN GG OO FF TT HH EE LL OO GG GG EE RR HH EE AA DD SS EE AA TT UU RR TT LL EE
were taken 2h after the test meal to verify that all BIPS® were really swallowed. In the first week, radiographic monitoring was performed each 24h. As no great changes in the position of the BIPS® were observed within the first 24h, we decided to use a 48h interval for subsequent radiographs for the remainder of the 21-day experiment. Lateral radiographs were extremely difficult to interpret because of the displacement and overlapping of the gastrointestinal tract with other soft tissue organs and carapace bony structure. Thus, all results reported are based on dorso-ventral radiographs only.
To determine the arrangement of the intestine and to identify the position of the BIPS® in the radiographs taken during the study, a preliminary anatomical study was performed in 5 dead juvenile turtles. Two cadavers were dissected, the arrangement of the intestines recorded in situ, and intestine length measured. The transition from ileum to colon was identified due to the presence of an iliocecal valve followed by a great enlargement of the colon, macroscopical changes in the colour and texture of the mucosa and a visible decrease in intestinal wall thickness (Wyneken, 2001). Three cadavers were frozen at -80◦ C and sectioned with an electric bone saw in serial parallel sections between 18 and 20 mm thick, each one in an oriented plane (sagittal, dorsal and transverse). Ingesta transit times are defined as follows: Transit time (T1) the time between the ingestion of the coloured markers and the first defecation containing experimental material; Retention time (T50) and Total transit time (T85) as the time required to excrete a minimum of 50% and 85% of ingested markers, respectively. Concerning BIPS®, T1 was assumed once the first large size sphere (5mm) was missing on the radiographs. We have added the index T85 instead T100 as ‘total transit time’ considering the long time of ingesta passage in chelonians. Gastric emptying time was defined as the time between first and last radiograph with BIPS® in the stomach area and was measured when all ten large BIPS® were out of the stomach.
Results - given as means ± sd, n= number of individuals - were analyzed with STATISTICA for Windows (Stat
Soft, Inc.). A Shapiro-Wilk test was used to verify the normality of data distribution. Linear regressions and Pearson’s Correlation were calculated between the T1, T50 and T85 and temperature data, body mass and SCLmin. Graphics were done with Microsoft® Office Excel 2003. The best-fitting tendency line was used. Statistical differences for factors of variation such as kind of markers (colour markers versus BIPS®) and season (early autumn, summer and winter) were analyzed by a one-way ANOVA, a Levene Test for the homogeneity of variances, and a Scheffe test.
Results
The turtle dataset used in this study included some heterogeneous data because different juvenile and subadult turtles were examined in different seasons. Additionally, to evaluate the transit of the BIPS®, 8 turtles experimented in the summer must to be handled each 48h for radiographic examination which might influence in the results. The stress level produced by this handling and how much it influenced the results could not be ascertained.

131
AA NN NN EE XX EE SS –– AA DD DD II TT II OO NN AA LL PP AA PP EE RR SS
The data showed normal distribution. Coloured markers were expelled in several defecations and were easily
visualized and recovered. In the study (using the foam dishes) with the 22 turtles, T1 was 9.05 ±3.05 (5 -16) days, T50
12.00±4.53 (5-20) days and T85 13.19±4.64 (5-21) days. Low and no significant correlation was observed between
ingesta passage times (T1, T50, T85) and SCLmin or body mass (p>0.05). No differences were observed between juveniles and subadults (Table 1).
The mean tank water temperature ranged between 16.27° C (winter) and 23.86° C (summer), with a range
variation of as much as 3° C in a same tank on a single day during summer. No significant correlation was observed
between water temperature and T1, T50 and T85 (T1, r=-0.24 p=0.27; T50, r=-0.16 p=0.5; T85, r=-0.26 p=0.25). No significant difference was observed among T1, T50 and T85 of turtles studied in the three seasons (p>0.05) (Table 2).
The quadratic regression curve was best fitted to the temperature data and ingesta passage times distribution. Total transit time tended to be faster in turtles submitted to water temperatures between 20°C and 23.6°C. The highest determination coefficient was observed when the total transit time (T85) was plotted (Fig. 1).
Table 1. Pearson’s Correlation between of the passage times (T1, T50 and T85) of coloured markers versus body mass (BM) and SCLmin and their comparison between aging groups of loggerhead sea turtles.
n-juv, n-sub: number of juveniles and subadults, respectively.
Table 2. Passages times (T1, T50 and T85) of coloured markers in the digestive tract of loggerhead sea turtles in different year seasons.
mToC = Mean temperature of the water in the pools
Person’s Correlations Aging grouping Passage times (days) BM p SCLmin p juveniles subadults
t df p n-juv n-sub
T1 -0.20 0.38 -0.17 0.46 10.33 8.56 -1.23 20 0.23 6 16
T50 -0.17 0.46 -0.12 0.60 12.83 11.67 -0.52 19 0.61 6 15
T85 0.08 0.72 0.13 0.56 13.00 13.27 0.12 19 0.91 6 15
Seasons Variance Scheffe Test (p values) Passage time
(days) winter autumn summer F-value df p winter
x autumn
winter x
summer
summer x
autumn T1 13±4.24 8.75±2.86 8.5±2.73 2.06 2 0.15 0.19 0.17 0.98
T50 16±5.66 11.91±4.70 11.13±4.12 0.93 2 0.41 0.52 0.42 0.93
T85 20.5±0.71 12.55±4.84 12.25±3.33 3.41 2 0.06 0.07 0.07 0.99
mToC 16.31±0.06 19.60±1.74 23.86±0.76 - - - - - -
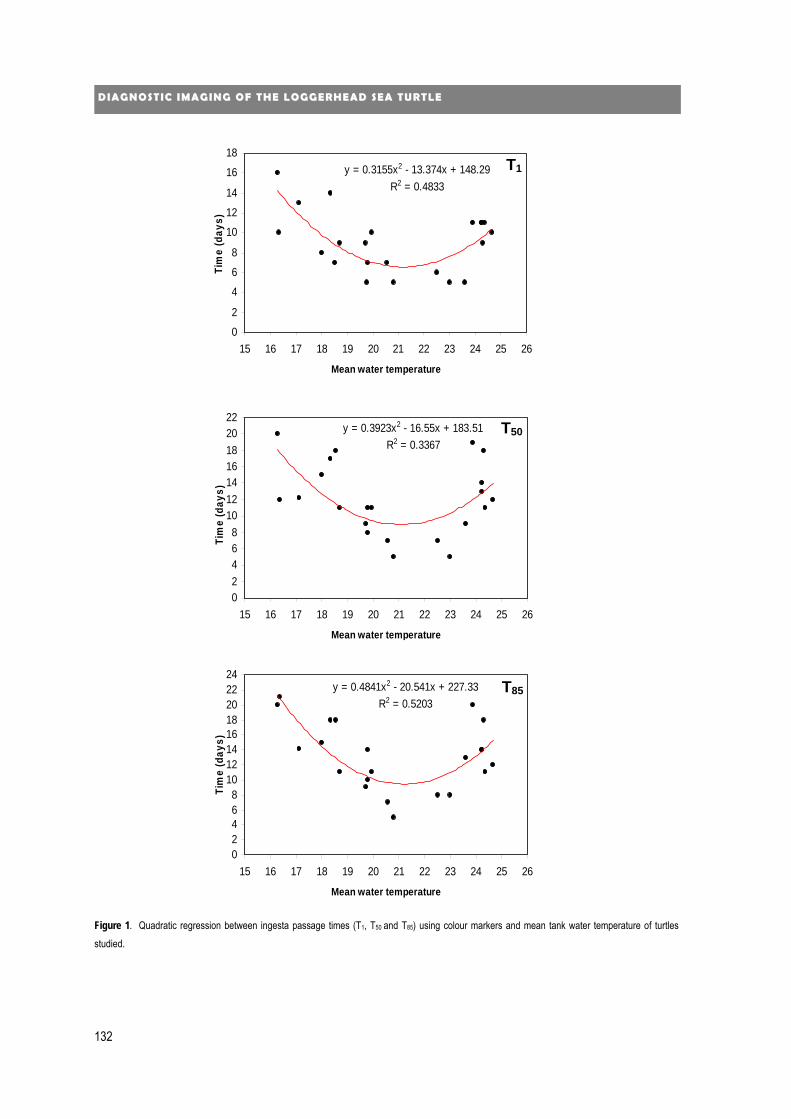
132
DD II AA GG NN OO SS TT II CC II MM AA GG II NN GG OO FF TT HH EE LL OO GG GG EE RR HH EE AA DD SS EE AA TT UU RR TT LL EE
Figure 1. Quadratic regression between ingesta passage times (T1, T50 and T85) using colour markers and mean tank water temperature of turtles studied.
y = 0.3923x2 - 16.55x + 183.51R2 = 0.3367
02468
10121416182022
15 16 17 18 19 20 21 22 23 24 25 26
Mean water temperature
Tim
e (d
ays)
y = 0.3155x2 - 13.374x + 148.29R2 = 0.4833
0
2
4
6
8
10
12
14
16
18
15 16 17 18 19 20 21 22 23 24 25 26
Mean water temperature
Tim
e (d
ays)
y = 0.4841x2 - 20.541x + 227.33R2 = 0.5203
02468
1012141618202224
15 16 17 18 19 20 21 22 23 24 25 26
Mean water temperature
Tim
e (d
ays)
T1
T50
T85

133
AA NN NN EE XX EE SS –– AA DD DD II TT II OO NN AA LL PP AA PP EE RR SS
All turtles showed the BIPS® in the stomach 2h after ingestion. In this period, in 6 of the 8 tested turtles, the BIPS® were seen in the most caudal part of this organ (pyloric part). Gastric emptying time was 24 to 48h. Large and small BIPS® moved in groups in the intestine (Fig. 2). However, in 2 turtles we observed that the BIPS® were retained for 48 h in specific parts of the digestive tract. In the radiographs, the exact positioning of the BIPS® in the intestine could not be identified and the orocolic transit time (usually calculated in dogs) could not be calculated. The superimposition of the
carapace and pelvis with the small BIPS® made quantitative monitoring difficult.
.
Figure 2. Anatomical sagittal section of the juvenile loggerhead sea turtles (A) and drawing of the arrangement of the gastrointestinaltract (B): 1. stomach, 2. cranial part of duodenum, 3. gallbladder, 4. cranial flexure of duodenum, 5. descending duodenum, 6. caudalflexure of duodenum, 7. jejunum, 8. ileum, 9. ileo-colic junction, 10. ascending colon, 11. ventral transverse colon, 12. dorsal transversecolon, 13. descending colon, 14. cloaca, 15. liver. Dorso-ventral radiograph of juvenile loggerhead sea turtle studied with BIPS® (C): 7.Big and small BIPS® travelling in intestine, 8. Loops of ileum
134
DD II AA GG NN OO SS TT II CC II MM AA GG II NN GG OO FF TT HH EE LL OO GG GG EE RR HH EE AA DD SS EE AA TT UU RR TT LL EE
In eight turtles, the BIPS® were expelled all together in T1. In turtles tested simultaneously with BIPS® and
colour markers, T1 of the BIPS® was slower (13.25±4.86 days) than the coloured markers (8.5±2.73 days) (p<0.01, t=-
3.56, df=7). Eight of the twenty-five turtles retained some coloured markers and/or small BIPS® in their digestive tract at the end of the 23-day study period.
The anatomical study of the gastrointestinal tract in juveniles revealed that the small and large intestine were quite equal in length (turtle 1: SLCmin 31cm, small intestine length 164cm, large intestine length 148cm; turtle 2: SLCmin 32 cm, small intestine length 135cm, large intestine length 120cm), with no apendicular cecal dilatation or structure. The large intestine (transverse colon) was divided into a dorsal and ventral part, resembling that of the equine large intestine (Fig. 2).
Discussion
An ideal marker is one that travels at the same rate as the food ingested. However, markers do not always move with the food or nutrients, making choice of marker one of the most important considerations in ingesta passage time studies (Robbins, 1993). Colour markers made from soft flat foam proved to be of great practical use in the sea turtle tanks. The major advantage observed in our study was ease of collection in faeces or in water due to floatability, which made accurate recovery and counting very easy. Sheets of ethyl vinyl acetate are inexpensive and are available in a wide variety of colours, being used widely in children’s games thanks to low toxicity. The material did not lose colour in salt water and the markers could be manufactured using a standard hole punch.
In dogs, age affects T50 and orocecal transit time (OCTT). However, body size does not affect these parameters (Weber et al. 2003). Also, in Gopher and Galapagos Giant tortoises, retention time did not depend significantly on weight or age (Bjorndal, 1987; Hatt et al. 2002). Nevertheless in Galapagos Giant tortoises, it is interesting to note that the solid fraction of the digesta was retained differently in adult and juvenile tortoises (Hatt et al. 2002). In the current study, body mass and size of the turtle showed no significant correlation with the ingesta passage transit times and no differences in T1, T50 and T85 were observed between juvenile and subadult specimens. In the live wild sea turtle, age (aging class) is usually estimated on carapace size and might not represent the real age.
Although described by the manufacturer as being ‘low density’, BIPS® were developed in view of the specific gravity of dry dog food, higher than the food of turtles. This was verified on expulsion in the defecation - the BIPS® sank to the bottom while the colour markers stayed on the water surface together with the faeces. Due to their specific gravity, in sea turtles the BIPS® might travel together with the solid phase of the digesta whereas the very-low-density colour markers might travel with the liquid phase, thus accounting for the difference in evacuation time. In dogs, one set of dorso-ventral and lateral radiographs 6-24 hours after BIPS® administration on an empty stomach is required to establish their position in the gastrointestinal tract. In our study we took radiographs after 2h (to check that all markers were ingested) and after 24 h. As most of the turtles showed no changes in the BIPS® position in the first 24h, we decided to increase radiographic monitoring to every 48h thereafter. The ingesta transit times in the loggerhead sea turtle is longer
135
AA NN NN EE XX EE SS –– AA DD DD II TT II OO NN AA LL PP AA PP EE RR SS
than those reported for dogs and cats for which BIPS® are recommended (Weber et al., 2003). Therefore, in this species this method involves a high number of radiographs for each animal. This fact along with the limitations of the lateral radiographs and difficulties to address the right position of the BIPS® in the intestines don’t justify its use in this species.
In our study, in a concurrent experiment, the transit time of the BIPS® was found to be longer than that of the colour markers. Previous studies comparing methods to evaluate retention time of digesta in lizards and tortoises have highlighted the importance of taking into account differences in the ingesta passage time and phase separation (solid and liquid), especially where transit time is long - an important digestive strategy in reptiles (Hatch and Afik, 1999; Hatt et
al., 2002). A substantial difference in transit time using liquid phase markers has been observed in congeneric species of tortoises such as the Testudo hermanni and T. pardalis studied with gastrofin® and barium sulphate suspension respectively. A very fast transit time (2.6 h at 30.6°C) was observed in Greek tortoises and a relatively slower transit time (about 6 days at 29°C) in Leopard tortoises (Taylor et al. 1996; Meyer, 1998). The slow transit time in the Leopard tortoises could be associated with chemical immobilization carried out before the oral administration of barium.
The total transit time presented by Di Bello et al. (2006b) in six loggerhead sea turtles examined with barium sulphate administration three weeks after surgical procedure varied from 8 to 40 days. The gastric emptying time observed by these authors was much longer than that found in our study with healthy turtles.
The gut passage time is a reflection of gastric motility, in turn a reflection of health status, kind of food and ambient temperature of a reptile (Skoczylas, 1978; Spencer et al. 1998). Kind and frequency of feeding and water temperature of tanks were not mentioned by Di Bello et al. (2006b). The postoperative condition of the turtles in the study mentioned could imply gastric dysrhythmias, accounting for delay in gastric emptying time, as observed in mongrel dogs after undergoing abdominal surgery (Hotokezaka et al., 1997).
Compared with the mean total transit time (mean T85=13.23 days), the gastric emptying time (2 days) found in the loggerhead sea turtle seems to be relatively short. Radiographical and sectional studies in reptilians have shown that in omnivorous and carnivorous species the stomach is where the hold-up is longest, whereas in herbivorous species this appears to be in the caecum and proximal colon (Guard, 1980). Retention times observed in the loggerhead sea turtles in the current study were as long as those found in herbivorous chelonian species, such as the desert and Galapagos tortoises that experienced similar or even higher ambient temperatures (Bjorndal, 1987; Barboza, 1995; Hailey, 1997; Hatt et al., 2002). In reptiles, generally the herbivore intestine is longer than the omnivore intestine, and the omnivore intestine is longer than the carnivore intestine (Diaz-Figueroa and Mitchell, 2006). The ratio of large intestine to small intestine lengths is significantly related to gut retention in omnivorous and herbivorous African tortoises (Hailey, 1997). The high ratio between large and small intestines observed in this study resembles those of tortoises, in which the large intestine is the section of the digestive tract with a great apparent area (Barboza, 1995). This finding could justify the relatively long retention time observed in the loggerhead sea turtles. Further studies concerning on morphology and digestive physiology are need in order to explain the function of the large intestine in this species.
The digesta transit times of turtles studied in different seasons did not show significant differences. These results disagree with those found in other chelonians (Meyer, 1998; Spencer et al. 1998). Concerning sea turtles, green turtles exposed to a laboratory simulation of subtropical winter and summer conditions showed relatively low thermal
136
DD II AA GG NN OO SS TT II CC II MM AA GG II NN GG OO FF TT HH EE LL OO GG GG EE RR HH EE AA DD SS EE AA TT UU RR TT LL EE
dependence of metabolic rate over the range of temperatures from 17 to 26ºC (Southwood et al., 2003). As to loggerhead sea turtles, a previous study performed in the Mid-Atlantic indicated that this species prefers to remain in areas with sea surface temperatures ranging from an average of 19.38 to 25.7 ºC (Thomas and Dabo, 2005). The temperature range at which the turtles of our study tended to show fastest total transit time is placed just in the median of the preferred temperature range for the loggerhead sea turtles and could suggest the optimum or “comfort temperature” for this species.
Since in our study important factors such as acclimatisation, kind, amount and frequency of feeding were standardized, it is important to consider to what extent other captivity conditions could affect metabolism, breaking the positive correlation between temperature and metabolism known in reptiles (Gillolly et al. 2001). The ingesta passage times are proportionally related to the ambient temperature in reptiles (Skoczylas, 1978). Therefore we would expect to find shorter ingesta passage times in turtles experimented in summer than those studied in autumn and winter which was not found in our study. On the one hand, results from winter could be influenced by the little number of animals studied which compromises the statistical results. On the other hand, the absence of differences in the ingesta passage times between summer and autumn could indicate that the water temperature range experimented in these seasons did not affect significantly the turtles’ metabolism. The stress caused by the handling the turtles at much more frequent intervals to perform the radiographs and the rapid water overheating in the summer should be also considered to explain the tendency to increase T85 at higher water temperatures (Fig 1). In this season, wide temperature range was observed in the tanks due to the small volume of water and the major effect of sunlight. The effect of intense heat as a potential stressor in juvenile and subadult sea turtles has not been studied. However, Gregory et al. (1996) found that small loggerhead turtles captured in the summer showed markedly higher corticosterone concentrations than those of large turtles captured in the same season and of all turtles captured during the winter, suggesting that a higher metabolic rate in this aging class due to higher water temperatures may be the basis for the variability of corticosterone between seasons. Sato et al. (1995) found that loggerhead sea turtles maintain body temperature higher than the ambient water temperature while swimming at sea, the difference being about 0.7 – 1.7 ºC. In crocodilians, efficient temperatures for ingestion and digestion are between 25 ºC and 35 ºC; temperatures higher than 35 ºC cause an undue amount of stress and inappetence (Lane, 2006). Like most reptiles, free-ranging sea turtles use behavioural means, such as postural adjustments or movements between different thermal microclimates, to maintain body temperature within a preferred range (Avery, 1982) which in our experiment was restricted by captivity conditions.
We believe that the new information provided in this study of ingesta passage time, the use of coloured ethyl vinyl acetate markers instead of BIPS® and knowledge regarding the effect of a excessive handling and comfort temperature of the loggerhead sea turtle may help rehabilitation centers and aquariums establish better conservation and management strategies, mainly in those turtles with digestive disorders or where there is a suspicion of the digestion of foreign bodies such as fishhooks.
137
AA NN NN EE XX EE SS –– AA DD DD II TT II OO NN AA LL PP AA PP EE RR SS
Acknowledgments
The authors would like to thank the CRAM volunteers for their help in management of the turtles, and Dr. Jesus Piedrafita, Facultat de Veterinaria, UAB, for statistical support. Thanks also go to the anonymous reviewers.
References Avery, R.A. 1982. Field studies of body temperatures and thermoregulation. In: C. Gans and F.H. Pough, eds. Biology of the Reptilia. Vol
12. Academic Press, London. Pp 93-166. Balazs, G.H. 1985. Impact of ocean debris on marine turtles: entanglement and ingestion.. In: R.S. Shomura and H.O. Yoshida (eds.),
Proceedings of the Workshop on the Fate and Impact of Marine Debris. November 27-29, 1984. Honolulu, Hawaii. US Dep. of Comm., NOAA Tech. Memo. NMFS, NOAA-TM-NMFS-SWFC-54. Pp. 387-429.
Barboza, P.S. 1995. Digesta passage and functional anatomy of the digestive tract in the desert tortoise (Xerobates agassizii). Journal of Comparative Physiology B 165, 193-202.
Bjorndal, K.A. 1987. Digestive efficiency in a temperate herbivorous reptile, Gopherus polyphemus. Copeia 3, 714-720. Bjorndal, K.A., Bolton, A.B., Lagueux, C.J. 1994. Ingestion of marine debris by juvenile sea turtles in coastal Florida habitats. Marine
Pollution Bulletin 28, 154-158. Diaz-figueroa, O. and Mitchell, M.A. 2006. Gastrointestinal Anatomy and Physiology. In: D.R. Mader (Ed.). Reptile Medicine and Surgery..
Elsevier Inc. Philadelphia. Pp 145-162. Di Bello, A., Valastro, C. and Staffieri, F. 2006a. Surgical approach to the coelomic cavity through the axillary and inguinal regions in sea
turtles. Journal of American Veterinary Medical Association 228, 922-5. Di Bello, A., Valastro, C., Staffieri, F. and Crovace, A. 2006b. Contrast radiography of the gastrointestinal tract in sea turtles. Veterinary
Radiology & Ultrasound 47, 351-354. Dodd, CK Jr. 1988. Synopsis of the biological data on the loggerhead sea turtle Caretta (Linnaeus 1758). U.S. Fish and Wildlife Service
Biological Report 88, 35-82 Gillooly, J.F., Brown, J.H., West, G.B, Savage, V.M. and Charnov, E.L. 2001. Effects of Size and Temperature on Metabolic Rate. Science
293, 2248-2251 Goggin, J.M., Hoskinson, J.J., Butine, M.D., Foster, L.A. and Myers, N.C.1998. Scintigraphic assessment of gastric emptying of canned and
dry diets in healthy cats. American Journal of Veterinary Research 159, 388-392. Gregory L.F., Gross, T.S., Bolten, A.B. and Bjorndal, K.A. 1996. Plasma corticosterone concentrations associated with acute captivity stress
in wild loggerhead sea turtles (Caretta caretta). General and Comparative Endocrinology 104, 312-320. Guard, C.L. 1980. The reptilian digestive system: general characteristics. In: Schmidt-Nielsen K et al. (eds). Comparative physiology:
primitive mammals. Cambridge University Press, Cambridge. Pp 43-51. Guilford, G. 2001. Pros and cons of radiopaque markers for GI diagnosis. Proceedings of the World Small Animal Veterinary Association,
World Congress, Vancouver 2001. Available:http://www.vin.com/VINDBPub/SearchPB/Proceedings/PR05000/PR00129.htm Hailey, A. 1997. Digestive efficiency and gut morphology of omnivorous and herbivorous African tortoises. Canadian Journal of Zoology 75,
787-794.
138
DD II AA GG NN OO SS TT II CC II MM AA GG II NN GG OO FF TT HH EE LL OO GG GG EE RR HH EE AA DD SS EE AA TT UU RR TT LL EE
Hatch KA and Afik D. 1999. Retention time of digesta in insectivorous lizards – a comparison of methods and species. Comparative Biochemistry and Physiology Part A 124, 89-92.
Hatt, J.M, Gisler R., Mayes, R.W., Lechner-Doll, M., Clauss, M., Liesegang, A. and Wanner, M. 2002. The use of dosed and herbage n-alkanes as markers for the determination of intake, digestibility, mean retention time and diet selection in Galapagos tortoises (Geochelone nigra). The Herpetological Journal 12, 45-54.
Hernot, D.C., Biourge, V.C., Martin, L.J., Dumon, H.J. and Nguyen, P.G. 2005 Relationship between total transit time and faecal quality in adult dogs differing in body size. Journal of Animal Physiology and Animal Nutrition 89,189-193.
Hernot D.C., Dumon, H.J., Biourge, V.C., Martin, L.J., Nguyen, P.G. 2006. Evaluation of association between body size and large intestinal transit time in healthy dogs. American Journal of Veterinary Research 67, 342-347.
Hotokezaka, M., Mentis, E.P., Patel, S.P., Combs, M.J., Teates, C.D. and Schirmer, B.D. 1997. Recovery of gastrointestinal tract motility and myoelectric activity change after abdominal surgery. Archives of Surgery 132, 410- 417.
Lane T. 2006. Crocodilians – Digestive System. In: D.R. Mader (ed). Reptile Medicine and Surgery. Elsiever Inc. Philadelphia. Pp 107-108. Lanyon, J.M. and Marsh, H.1995. Digesta Passage Times in the Dugong. Australian Journal of Zoology 43, 119 – 127 Manfred, R. and Camilleri, M. 1992. Measurement of small bowel and colonic transit: Indications and methods. Clinic Proccedings 67, 1169-
1179. Meyer, J. 1998. Gastrofin as a gastrointestinal contrast agent in the Greek tortoise (Testudo hermanni). Journal of Zoo and Wildlife
Medicine 29, 183-189. Milton S. and Lutz, P. 2003. Natural and human impacts on sea turtles.. In: Gary Shigenaka (Ed.). Oil and sea turtles. Biology, planning,
and response. NOAA OR&R technical document. Pp 27-34. Available on: http://archive.orr.noaa.gov/oilaids/turtles/turtles.html Nelson, O.L., Jergens, A.E., Miles, K.G. and Christensen, W.F. 2001. Gastric emptying as assessed by barium-impregnated polyethylene
spheres in healthy dogs consuming a commercial kibble ration Journal of the American Animal Hospital Association 37, 444-452. Orós J., Torrent, A., Calabuig, P., Déniz, S. 2005. Diseases and causes of mortality among sea turtles stranded in the Canary Islands,
Spain (1998-2001). Diseases of Aquatic Organisms 63, 13-24. Pont S.G., Alegre, F. N. 2000. Work of the Foundation for the Conservation and Recovery of Marine Life. Marine Turtle Newsletter 87, 5-7. Robbins CT. 1993. Wildlife Feeding and Nutrition. New York: Academic Press.352pp. Sato, K., Matsuzawa, Y., Tanaka, H., Bando, T., Minamika-wa, S., Sakamoto, W., Naito, Y., 1998. Internesting intervals for loggerhead
turtles, Caretta caretta, and green turtles, Chelonia mydas, are affected by temperature. Canadian Journal of Zoology 76, 1651–1662. Skoczylas, R. 1978. Physiology of the digestive tract. In: C. Gans (Ed). Biology of the Reptilia.. Vol. 8, Physiol B. Academic press. Pp 589-
717 Smith, D., Dobson, H. and Spence, E. 2001. Gastrointestinal studies in the green iguana: technique and reference values. Veterinary
Radiology and Ultrasound 42, 515-520. Southwood, A.L., Darveau, C.A. and Jones, D.R. 2003. Metabolic and cardiovascular adjustments of juvenile green turtles to seasonal
changes in temperature and photoperiod. The Journal of Experimental Biology 206, 4521-4531. Spencer, R., Thompson, M.B. and Hume, I.D. 1998. The diet and digestive energetics of an Autralian short-necked turtle, Emydura
macquarii. Comparative Biochemistry and physiology Part A 121, 341-349. Taylor S.K., Citino, S.B., Zdziarski, M.Z. and Bush, M. 1996. Radiographic anatomy and barium sulphate transit time of the gastrointestinal
tract of the Leopard tortoise (Testudo pardalis). Journal of Zoo and Wildlife Medicine 27, 180-186.
139
AA NN NN EE XX EE SS –– AA DD DD II TT II OO NN AA LL PP AA PP EE RR SS
Thomas, C.A. and Dabo S. 2005. Determining the correlation between sea surface temperature, chlorophyll concentration, QuikSCAT wind data and the presence of Caretta caretta and Chelonia mydas in the Mid-Atlantic. Undergraduate Research Experience in Ocean, Marine and Space Science. Center for Excellence in Remote Sensing Education and Research. Available in: http://nia.ecsu.edu/ureoms2005/sp/thomas/index.htm
Tomás, J., Guitart, R., Mateo, R. and Raga, J.A. 2002. Marine debris ingestion in loggerhead sea turtles, Caretta caretta, from the Western Mediterranean. Marine Pollution Bulletin 44, 211-216.
Weber, M.P., Martin, L.J., Biourge, V.C., Nguyen, P.G., Dumon, H.J. 2003. Influence of age and body size on orocecal transit time as assessed by use of the sulfasalazine method in healthy dogs. American Journal of Veterinary Research 64, 1105-9.
Weber, M.P., Stambouli, F., Martin, L.J., Dumon, H.J., Biourge, V.C., Nguyen, P.G. 2002. Influence of age and body size on gastrointestinal transit time of radiopaque markers in healthy dogs. American Journal of Veterinary Research 63, 677–682.