new mexico air service marketing strategy
TRANSCRIPT

1 | P a g e
Embark Aviation
New Mexico Air Service Marketing Strategy
Prepared for New Mexico Department of Transportation and New Mexico Department of Tourism
2 | P a g e
Table of Contents
SECTION 1: INTRODUCTION .............................................................................................................................. 4
SECTION 2: AIRLINES IN NEW MEXICO AND THEIR BUSINESS MODELS ..................................................... 5
AIRLINE INDUSTRY HISTORY ....................................................................................................................................... 5 AIRLINE BUSINESS MODELS ......................................................................................................................................... 7 AIRLINE SERVICES ACROSS NEW MEXICO ................................................................................................................... 7 IMPACT OF COVID-19 PANDEMIC .............................................................................................................................. 12
Opportunities of Covid-19 Pandemic ............................................................................................................ 16
SECTION 3: AIR SERVICE MARKETING APPROACH ...................................................................................... 22
OWNED CHANNELS ................................................................................................................................................... 23 COMMUNITY ENGAGEMENT ....................................................................................................................................... 23 PAID MEDIA .............................................................................................................................................................. 24 PR/EARNED MEDIA .................................................................................................................................................. 30 AIRLINE ENGAGEMENT .............................................................................................................................................. 31
SECTION 4: INCENTIVE PROGRAMS ............................................................................................................... 33
ESSENTIAL AIR SERVICE ........................................................................................................................................... 34 SMALL COMMUNITY AIR SERVICE DEVELOPMENT GRANTS ........................................................................................ 35 OTHER PROGRAMS AS MODELS ................................................................................................................................ 36 BUILDING AN EFFECTIVE INCENTIVE PROGRAM .......................................................................................................... 41
Owned Assets ................................................................................................................................................... 42 Paid Assets ........................................................................................................................................................ 43 Risk Mitigation................................................................................................................................................... 44 Minimum Revenue Guarantees Revisited ....................................................................................................... 44 Air Travel Bank Programs ................................................................................................................................ 45 Bulk Ticketing Agreements .............................................................................................................................. 46
SECTION 5: AIR SERVICE DEVELOPMENT ...................................................................................................... 47
AIR SERVICE DEVELOPMENT AT ALBUQUERQUE INTERNATIONAL SUNPORT ................................................................ 49 Review of Top Air Service Markets ................................................................................................................. 51 Previously Served Markets from ABQ ............................................................................................................. 55 International Air Service Development ........................................................................................................... 57 Part-135 On Demand Carrier Opportunities ................................................................................................... 61 ULCC Focus-City Development ........................................................................................................................ 62
AIR SERVICE DEVELOPMENT AT REGIONAL AIRPORTS ............................................................................................... 64 Transition of Intra-State Markets to Regional Hubs ...................................................................................... 64 Part 135 Scheduled Carrier Intrastate Network ............................................................................................. 69 Ground Transportation Challenges ................................................................................................................. 71
SECTION 6: RECOMMENDATIONS .................................................................................................................. 72
MARKETING RECOMMENDATIONS ............................................................................................................................. 72 Air Service Improvement Tax ........................................................................................................................... 72 Owned Channel Messaging ............................................................................................................................. 73 Community Engagement .................................................................................................................................. 74 Paid Media ......................................................................................................................................................... 75 Funding Considerations ................................................................................................................................... 76

3 | P a g e
Media Planning Considerations ...................................................................................................................... 78 RECOMMENDED MARKETING STRATEGIES ................................................................................................................. 80
Develop regional marketing programs ........................................................................................................... 81 Immediate Regional Opportunities ................................................................................................................. 82 International Market Development .................................................................................................................. 84 Space Tourism/Las Cruces Development ...................................................................................................... 86
INCENTIVE RECOMMENDATIONS ................................................................................................................................ 88 Air Service Improvement Tax ........................................................................................................................... 90
AIR SERVICE DEVELOPMENT RECOMMENDATIONS ..................................................................................................... 91 Create a State-supported CPA Program for Rural Markets .......................................................................... 92 Recruit Ultra-Low-Cost-Carrier Service ........................................................................................................... 98 Establish an International Air Service Plan .................................................................................................... 98 Estimated Economic Impact of Service Recommendations ........................................................................ 99
CONCLUSION .......................................................................................................................................................... 100
SECTION 7: APPENDIX ................................................................................................................................... 101
APPENDIX 1: ECONOMIC IMPACT STUDIES .............................................................................................................. 101 APPENDIX 2: AIR SERVICE TOOLKIT CONTENT ........................................................................................................ 103
4 | P a g e
Section 1: Introduction
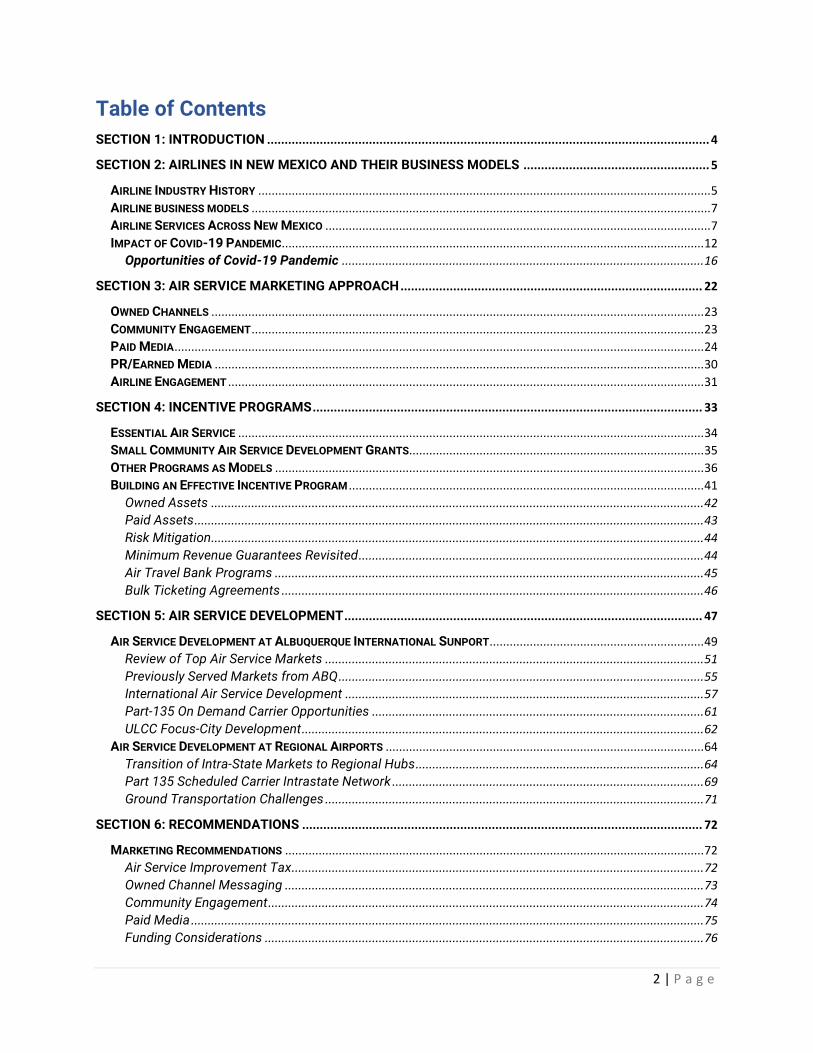
Effective Air Service Marketing is the integration of three core components to form an Air
Service Market Strategy. Air service marketing is one of three components that supports the air
service ecosystem. The second component supports incentive programs used to attract and, in
some cases, retain air service. The third component supports air service development and
includes identifying the best market opportunities and matching them with the airline that can
best fit the mission. Air Service Development (ASD) is arguably the most critical of the three. For
air service marketing to be successful and incentives to generate an ROI, there must be a solid,
economically viable market. ASD ensures markets are identified, vetted, forecasted, and
presented in a way to 1) ensures a pathway for success and 2) instills confidence in the target
airline being pursued for the service. It will be critical that New Mexico have an ASD expert on
staff, or more traditionally, contracted out to a firm to execute.
Figure 1: Topics Explored
The figure above highlights the areas explored in this document and provides insight on how
New Mexico can leverage these to create an innovative air service market – integral for
maintaining, growing, and attracting new air service to the State.
5 | P a g e
Section 2: Airlines in New Mexico and their Business Models
Airline Industry History
The modern air transportation system in the U.S. was formed because of the Airline
Deregulation Act of 1978. Prior to deregulation, all marketplace decisions made by the airlines,
including routes flown and fares offered, were regulated by the federal government. There were
numerous, small airlines, each largely related to a certain role, be it a trunk carrier, a local-
service provider, or only international flights in the case of Pan American. For many itineraries,
it was common to switch airlines during a connection, with some marketed as interchanges. To
the extent that airlines competed, it was based on speed and on-board service. Prior to
deregulation, air travel was a high-cost luxury good, enjoyed by relatively few people.
Deregulation brought with it sweeping changes. The airlines were now free to enter or exit any
market they chose, with an exception for the last carrier to exit a community. New airlines,
derived from intra-state examples in California and Texas, demonstrated volume could be
increased with low fares. The low fares were supported by low costs, largely based on the new
airlines having no underlying structures where relatively high costs were supported by regulated
high fares. The legacy airlines rearranged their flight networks into a hub-and-spoke model,
implemented frequent flyer programs and limited low fare seats to try and remain competitive.
In the years that followed, airlines grew substantially, bringing air travel to the masses as low
fares spread; the average realized fare declined year after year for decades. As a group, the
legacy airlines struggled, as fares declined, and costs increased. In the best of times, some
airlines were marginally profitable. When recessions hit, both legacy and start-up airlines failed
with regularity, going bankrupt and often abruptly ending services altogether and without
warning. To shore up finances (and create national networks and economies of scale) surviving
carriers combined through mergers and asset acquisitions. The U.S. was left with fewer airlines
after each economic cycle, as this pattern repeated.
In the 1990’s three major developments added to the cycle driven success and failure of
airlines. First, the concept of deregulation spread across the globe. Highly regulated
international services were liberalized (although much more slowly than the domestic market).
This allowed for U.S. carriers to cooperate more specifically with certain international airlines,
6 | P a g e
versus the general cooperation among all airlines in the regulated environment. Partnerships
which formed the basis of today’s modern airline alliances were formed.
The second development was widespread adoption of regional jets. During the 1980’s, hub
carriers developed networks of independent turboprop airlines in franchise agreements to feed
their new and growing hubs. With the introduction of the regional jet, the major airlines
assumed the financial risk of these operations, converting the former commuter airlines into
operating entities through Capacity Purchase Agreements, where the commuter agreed to
operate flights dictated to it by the major carrier.
Lastly, the advent of the internet revolutionized the way airline tickets were sold, creating new
direct-to-consumer sales methods. Airlines were among the first industries to adopt
computerization in the 1960’s and were likewise early adopters of sales via the internet. Prior to
the internet, travel was largely arranged by travel agents, people who were specialists in
packaging components of travel and experts in the complex and private reservations systems
that sold travel. As the airlines and other travel providers developed more direct-to-customer
sales channels, travel agents evolved online into the websites like expedia.com.
Additional developments in the last decade have shaped todays airlines. First, innovative airline
managers identified and exploited a new low-cost niche. New ‘Ultra-Low Cost Carriers’ (ULCC’s)
have evolved, by exploiting a specific combination of even lower costs and traffic stimulation.
On the cost side, these carriers understand large single aisle aircraft offer the best possible unit
economics. Therefore, they commit their business models to only using certain aircraft types.
To drive new industry revenue, they have employed tactics such as ‘unbundling’ formerly
included services like advanced seat selection and checked baggage from the minimum fare.
They also break the tradition of offering daily service on a route, to ensure small markets
generate enough volume to be profitable. This strategy has worked exceptionally well
connecting smaller communities to large leisure destinations like Las Vegas and Orlando.
Second, the airlines have become profitable, as group, for the first time since deregulation. The
consolidation of the airline industry has allowed for capacity to be most closely aligned to
demand. Further, the advent of ULCC’s has allowed the airlines to become segmented along
target customer lines (i.e. full-service, value, and bare-bones offerings) versus geography in the

7 | P a g e
past. Prior to the Covid-19 pandemic, this well-balanced but evolved mix of marketplace supply
and demand has allowed virtually all airlines to remain profitable for nearly a decade.
Airline business models
The evolution of the airline industry has led to several specific types of airlines, with unique
customer propositions and characteristics, all of which are found in New Mexico. Of course,
each type of airline has specific roles in the marketplace that influences its air service offerings
and are unlikely to change for the benefit of a single destination or region. Even so, because
each type of airline has distinct advantages, air service initiatives should be targeted
accordingly.
Figure 2: Types of Air Carriers
Airline Services Across New Mexico
Each of the five business models outlined have influence across New Mexico. Albuquerque
International Sunport (ABQ), by far the largest commercial airport in the state, is home to almost
every service provider type, including low-cost/value and ultra-low-cost carriers, providing a
broad range of options to consumers. Roswell, Santa Fe Regional Airport and Lea County
Regional Airport in Hobbs each host the regional affiliates of the network carriers. The
remaining commercial service airports in New Mexico are serviced by Part 135 carriers, with
additional support structures.

8 | P a g e
Albuquerque Network Composition
Figure 3: Albuquerque Network
As the primary commercial service airport in New Mexico, ABQ hosts a broad range of services.
Each of the three major network carriers, American, Delta, and United, host robust service from
ABQ to several hubs, providing access for one-stop connections to every major market
worldwide, and even deeper access via their airline alliances OneWorld, Sky Team, and Star.
Combined, the network carriers garner about 44% of market share at ABQ.
The value segment has the highest share, at 54%, due primarily to the fact that category leader
Southwest Airlines has maintain a large presence at ABQ for years, and commands 48% market
share on its own, with Alaska and JetBlue accounting for the remaining 6%.
There are several factors leading to the ULCC segment having little market share at ABQ. First,
is the fact that the ULCC’s tend to focus on two different market types which do not apply to
mid-sized ABQ: 1) They focus on very large and competitive markets where capturing just a
fraction of demand is successful or 2) They focus on very small markets, where they create the
demand with low fares, and capture nearly all of it. Because of the very strong market share
and brand affinity of Southwest, generally supported by fare levels considered a good value, the
ULCC’s cannot generate enough new passengers in specific markets to warrant adding flights,
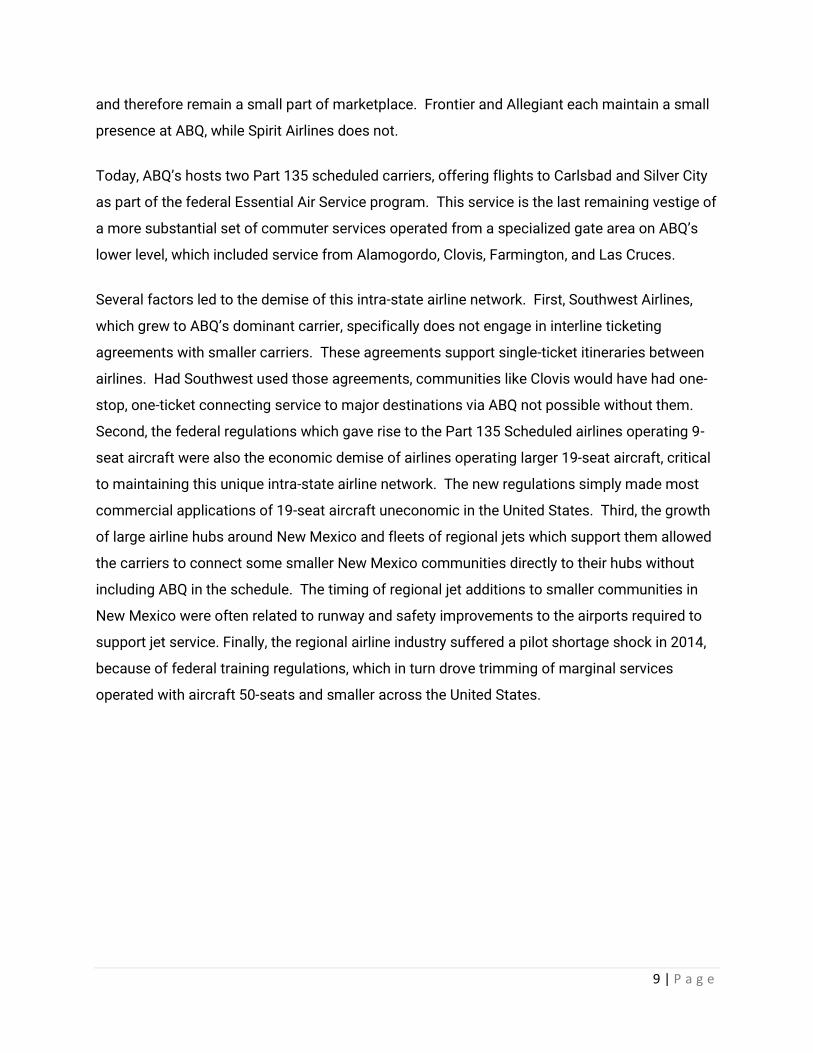
9 | P a g e
and therefore remain a small part of marketplace. Frontier and Allegiant each maintain a small
presence at ABQ, while Spirit Airlines does not.
Today, ABQ’s hosts two Part 135 scheduled carriers, offering flights to Carlsbad and Silver City
as part of the federal Essential Air Service program. This service is the last remaining vestige of
a more substantial set of commuter services operated from a specialized gate area on ABQ’s
lower level, which included service from Alamogordo, Clovis, Farmington, and Las Cruces.
Several factors led to the demise of this intra-state airline network. First, Southwest Airlines,
which grew to ABQ’s dominant carrier, specifically does not engage in interline ticketing
agreements with smaller carriers. These agreements support single-ticket itineraries between
airlines. Had Southwest used those agreements, communities like Clovis would have had one-
stop, one-ticket connecting service to major destinations via ABQ not possible without them.
Second, the federal regulations which gave rise to the Part 135 Scheduled airlines operating 9-
seat aircraft were also the economic demise of airlines operating larger 19-seat aircraft, critical
to maintaining this unique intra-state airline network. The new regulations simply made most
commercial applications of 19-seat aircraft uneconomic in the United States. Third, the growth
of large airline hubs around New Mexico and fleets of regional jets which support them allowed
the carriers to connect some smaller New Mexico communities directly to their hubs without
including ABQ in the schedule. The timing of regional jet additions to smaller communities in
New Mexico were often related to runway and safety improvements to the airports required to
support jet service. Finally, the regional airline industry suffered a pilot shortage shock in 2014,
because of federal training regulations, which in turn drove trimming of marginal services
operated with aircraft 50-seats and smaller across the United States.
10 | P a g e
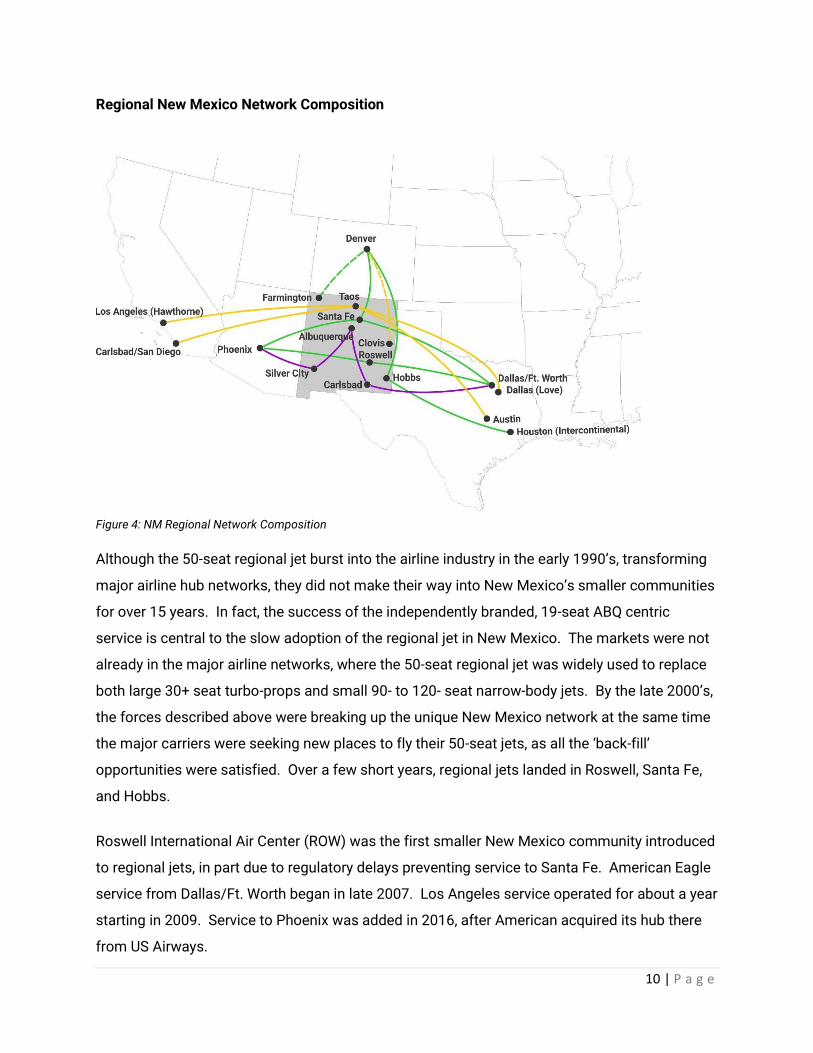
Regional New Mexico Network Composition
Figure 4: NM Regional Network Composition
Although the 50-seat regional jet burst into the airline industry in the early 1990’s, transforming
major airline hub networks, they did not make their way into New Mexico’s smaller communities
for over 15 years. In fact, the success of the independently branded, 19-seat ABQ centric
service is central to the slow adoption of the regional jet in New Mexico. The markets were not
already in the major airline networks, where the 50-seat regional jet was widely used to replace
both large 30+ seat turbo-props and small 90- to 120- seat narrow-body jets. By the late 2000’s,
the forces described above were breaking up the unique New Mexico network at the same time
the major carriers were seeking new places to fly their 50-seat jets, as all the ‘back-fill’
opportunities were satisfied. Over a few short years, regional jets landed in Roswell, Santa Fe,
and Hobbs.
Roswell International Air Center (ROW) was the first smaller New Mexico community introduced
to regional jets, in part due to regulatory delays preventing service to Santa Fe. American Eagle
service from Dallas/Ft. Worth began in late 2007. Los Angeles service operated for about a year
starting in 2009. Service to Phoenix was added in 2016, after American acquired its hub there
from US Airways.
11 | P a g e
American Eagle started its first regional jet service at Santa Fe Regional Airport (SAF) from
Dallas/Ft. Worth in the Summer of 2009, followed by Los Angeles later that year. By 2017, the
Los Angeles flights were replaced with service from Phoenix. Prior to the Covid-19 pandemic,
American Eagle has scheduled up to six daily flights from Santa Fe.
Lea County Regional Airport (HOB) at Hobbs gained regional jet service to Houston-
Intercontinental Airport with the addition of Continental Express in 2011. These services were
transitioned to the United Express brand following the merger of the major carriers Continental
and United in 2012. United briefly introduced service between Hobbs and Denver in late 2019,
although this effort was thwarted by the Covid-19 pandemic (service is expected to resume
once post-Covid travel demand returns). Santa Fe’s United Express service from Denver started
in 2013, rarely scheduled with more than two daily roundtrips prior to 2018.
Farmington’s Four Corners Regional Airport (FMN), once the headquarters for Mesa Airlines,
enjoyed fairly robust service levels until 2013. Farmington’s size and geography, and business
interests of Mesa Airlines generally allowed for service from FMN to maintain service to
Albuquerque, Denver, and Phoenix over the years, albeit with 19-seat turbo-prop aircraft. The
same factors described above in the reduction of intra-state service led to the complete
cessation of these turbo-prop services from FMN in 2017.
Commercial airline service to Four Corners Regional Airport was planned to restart in the midst
of the Covid-19 pandemic in October 2020. Although FMN is not eligible for complete service
subsidy under the Essential Air Service (EAS) program for reasons described below, the
community was been able to utilize the Small Community Air Service Development (SCASD)
program and excess airline capacity driven by the pandemic to lead to this service restoration.
The community has received a grant of $850k in addition to $300k raised locally to support the
return of United Express service to Denver, in partnership with SkyWest Airlines.
SkyWest is unique among CPA carriers in that it can take certain independent commercial risks,
leveraging the brands of its major carrier partners. Further, SkyWest has a history of
undertaking successful service launches when combined with SCASD funds. The SCASD funds
will limit SkyWest’s financial risk with marketing support, fee waivers, and a pool of funds to
mitigate short-term losses while re-launching service. However, the flights will need to attain a
12 | P a g e
satisfactory (and likely unknowable by the community) level of profitability over the longer term
in order for service to continue beyond the time provided for in the SCASD project.
New Mexico hosts two types of Part 135 carriers. Under the Essential Air Service program, Part
135 Scheduled carriers Boutique Air and Advanced Airlines provide service to Carlsbad and
Silver City respectively. These services are subsidized by the federal government via a bi-annual
award process where service operators, destinations, and schedules may change substantially.
Boutique’s service to Carlsbad includes nonstop flights from Dallas/Ft. Worth and Albuquerque
while Advanced Airlines’ Silver City flights operate to Phoenix and Albuquerque.
Service is provided to Clovis and Taos via Part 135 On-Demand carriers. These carriers can
operate aircraft up to 30-seats including jets. However, regulations require that these services
be sold as public charters by a third party other than the operating carrier. Thus, these services
are coordinated between public charter sponsors and Part 135 On Demand operators through
regulations under Part 380 which govern public charters. These regulations mean the operators
must conduct their commercial business slightly differently than normal commercial airlines,
even though the differences are rarely noticed by passengers.
Under provisions of Essential Air Service, Key Lime Air operates service from Clovis to Denver,
marketed by Denver Air Connection – a public charter company formed to fulfill Denver-centric
Essential Air Service awards. The Taos service is operated by Advanced Airlines in partnership
with Taos Air, a public charter service created by the Taos Ski Valley and Town of Taos with
seasonal services to airports in Southern California and Texas.
Impact of Covid-19 Pandemic
The Covid-19 pandemic has been completely enmeshed with travel from its inception.
Immediately, most travelers canceled plans, driven by calls for social distancing and other
changes to daily life, including a work-from-home culture that appeared overnight. By the end of
April, security screenings at U.S. airports as measured by the Transportation and Security
Administration (TSA), which have become a daily indicator of travel demand, was just 5% of
normal demand as defined by the same dates a year ago. In other words, 95% of normal travel
demand disappeared.

13 | P a g e
Reaction from the airlines was exceedingly fast, by airline industry standards. Every airline
eliminated change and cancelation penalties, and slashed schedules to bare minimums. Via the
CARES Act and payroll protection plans, the federal government sent $25 billion to the airlines.
For the airlines to accept these funds, the federal government only mandated a couple of
restrictions:
1) Funding was to be used to pay employees, thus no employee furloughs would be
allowed until October 1, 2020
2) Although services could be reduced, every airline was mandated to continue flying a
minimum level of service to every community served prior to the pandemic. The airlines
were also offered up to $25 billion in loans, although several carriers have already
decided not to participate in this part of the program.
Figure 5: TSA Checkpoint Passengers by Day
By the end of October, airline demand had returned to 36% of 2019 levels. Dramatically
fluctuating schedules have become commonplace. Further, each airline has begun to chart its
own course through the pandemic, with every airline recognizing the multi-year nature of the
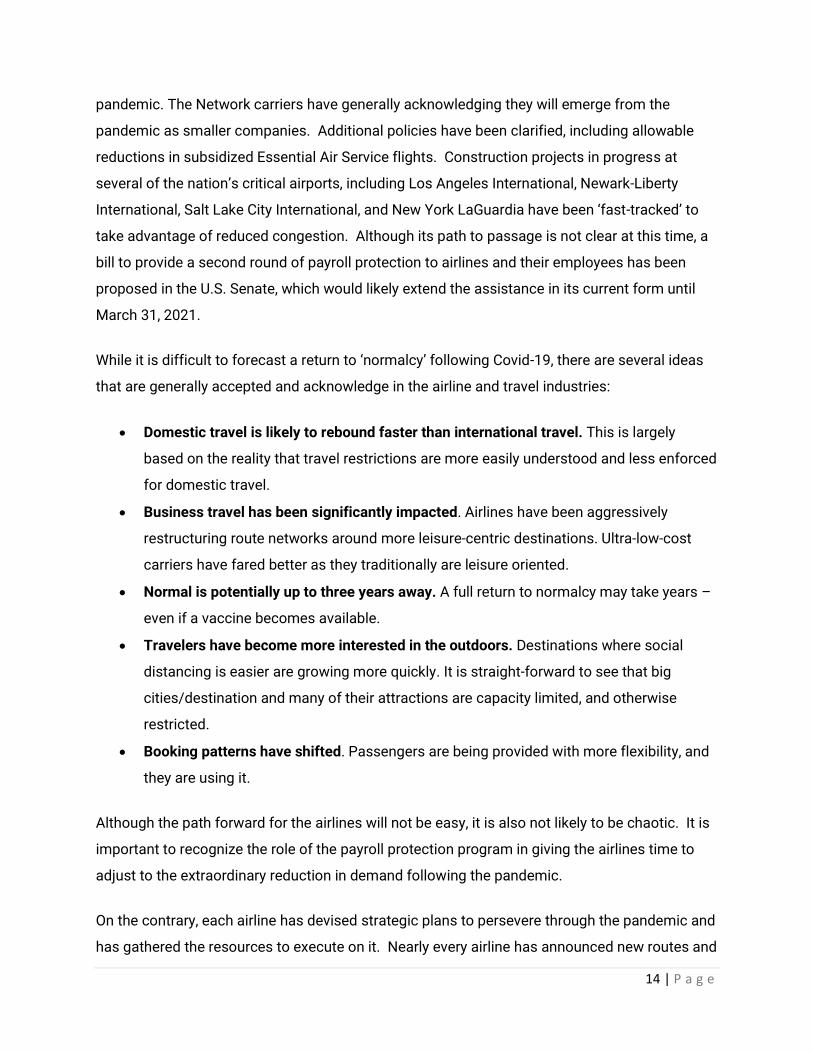
14 | P a g e
pandemic. The Network carriers have generally acknowledging they will emerge from the
pandemic as smaller companies. Additional policies have been clarified, including allowable
reductions in subsidized Essential Air Service flights. Construction projects in progress at
several of the nation’s critical airports, including Los Angeles International, Newark-Liberty
International, Salt Lake City International, and New York LaGuardia have been ‘fast-tracked’ to
take advantage of reduced congestion. Although its path to passage is not clear at this time, a
bill to provide a second round of payroll protection to airlines and their employees has been
proposed in the U.S. Senate, which would likely extend the assistance in its current form until
March 31, 2021.
While it is difficult to forecast a return to ‘normalcy’ following Covid-19, there are several ideas
that are generally accepted and acknowledge in the airline and travel industries:
• Domestic travel is likely to rebound faster than international travel. This is largely
based on the reality that travel restrictions are more easily understood and less enforced
for domestic travel.
• Business travel has been significantly impacted. Airlines have been aggressively
restructuring route networks around more leisure-centric destinations. Ultra-low-cost
carriers have fared better as they traditionally are leisure oriented.
• Normal is potentially up to three years away. A full return to normalcy may take years –
even if a vaccine becomes available.
• Travelers have become more interested in the outdoors. Destinations where social
distancing is easier are growing more quickly. It is straight-forward to see that big
cities/destination and many of their attractions are capacity limited, and otherwise
restricted.
• Booking patterns have shifted. Passengers are being provided with more flexibility, and
they are using it.
Although the path forward for the airlines will not be easy, it is also not likely to be chaotic. It is
important to recognize the role of the payroll protection program in giving the airlines time to
adjust to the extraordinary reduction in demand following the pandemic.
On the contrary, each airline has devised strategic plans to persevere through the pandemic and
has gathered the resources to execute on it. Nearly every airline has announced new routes and
15 | P a g e
destinations, often breaking with their historic business models and practices. Carriers have
moved forward with strategic structural changes, including American introducing codeshare
relationships with both Alaska Airlines and JetBlue, JetBlue moving its Long Beach base to Los
Angeles, and Delta continuing ahead with its international alliance with LATAM. The airlines are
also driving towards greater efficiencies in operations, demonstrated by Delta’s plans to
simplify their fleet and United’s realignment of United Express operating carriers.
Meanwhile, the airlines are doing their part to encourage travel. The airlines have continued to
compete, keeping fares low to stimulate travel interest. Every carrier has developed and
communicated its Covid-related customer experience expectations, including minimizing in-
person customer interactions, pre-flight cleaning programs, on-board and in airport social
distancing protocols, and middle-seat blocking and other efforts to limit passengers below full
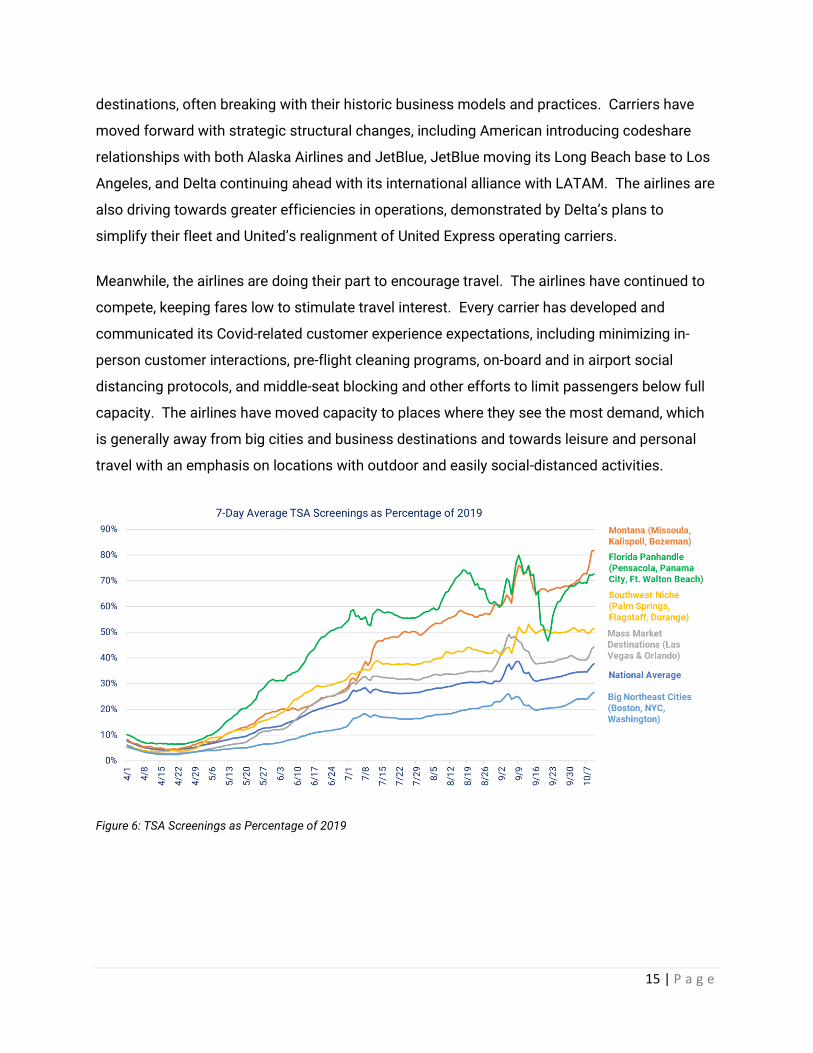
capacity. The airlines have moved capacity to places where they see the most demand, which
is generally away from big cities and business destinations and towards leisure and personal
travel with an emphasis on locations with outdoor and easily social-distanced activities.
Figure 6: TSA Screenings as Percentage of 2019
16 | P a g e
Opportunities of Covid-19 Pandemic
Although the impact of the pandemic on the travel industry has been overwhelmingly negative,
there are some upsides that certain kinds of destinations common in New Mexico can and
should position themselves to benefit from. This includes:
• A surplus of regional jets. As airlines look for new forms of growth, this inventory of jets
can be redeployed to develop new markets.
• Pilot shortage has ended. With the furlough of thousands of airline professionals across
the industry, the primary limit to growth that once existed is now gone. For the next few
years, airlines will have a steady pool of pilots for growth.
• Outdoor recreation destinations growing. Given New Mexico’s strategic priority to grow
an outdoor recreation economy, now is the time for New Mexico to invest heavily in this
space. Plus, given the State’s seasonality, New Mexico has time to develop a strategy
going into the 2021 Summer/Autumn season.
• Work from ___________. The work from home culture shift is likely to stay, creating an
exodus of high income wage earners to smaller cities and towns. Plus, with the ability to
work from essentially anywhere, creating ‘bleisure’ (work/leisure blended) trips are on
the rise as well as second homeownership.
50 Seat Jet Surplus
On September 30, 2020, ExpressJet ceased operations after United Airlines chose not to renew
their contract to operate United Express services. ExpressJet was one of the largest operators
of 50 seat jets in the United States, second only to SkyWest. As discussed in section 2.1, over
the course of the last decade significant amounts of service between smaller markets in New
Mexico and out-of-state destinations have been added, enabled by the economics of the 50-seat
platform. The availability of a large fleet of parked 50-seat jets is likely to make similar services
even more attractive as equipment costs decline.

17 | P a g e
Figure 7: 50-seat Jet Count by Operator
Source: planespotters.net
End of the pilot shortage
For decades now it has been common knowledge in the aviation industry that there is a
shortage of airline pilots, driven by a combination of older pilots reaching retirement age and
increased regulatory and cost barriers to entry into the profession. The passenger demand
shock created by Covid-19 is likely to have both short and long-term impacts on the demand for
pilots. For example, in its October 2020 Pilot and Technician Outlook for 2020-2039, Boeing
forecast 5% lower demand for pilots for at least the next three years. The current situation is
(for the first time in decades) a surplus of qualified pilots. COVID-related furloughs and layoffs
cut many early-career and regional airline pilots. Consequently, in the very short-term labor
costs are likely to decline.
There are three factors that will determine to what extent a shortage returns after passenger
traffic rebounds: retirements, training programs, and gauge changes. In the Boeing report and
elsewhere there is an expectation of a large wave of retirements as they approach the
mandatory retirement age. If there are not enough new pilots trained before then, the state of
the market could return to the pre-COVID shortage. However, prior to the downturn many
58 60
7
63
37
131
47
101
42
82
0
20
40
60
80
100
120
140
160
180
200
AirWisconsin CommutAir Endeavor Envoy ExpressJet GoJet Piedmont SkyWest
50-Seat Jet Count by Operator
American United Delta
18 | P a g e
airlines expanded training programs; given the average of two years it takes to acquire a
commercial pilot license, if the airlines can maintain these programs at sufficient scale during
the three year critical period, there is a possibility of overcoming or at least reducing the
shortage.
The third factor, gauge changes, is yet uncertain. The major airlines have indicated shifts away
from smaller aircraft, with Delta eliminating its 50-seat fleet, United reducing usage of 50 seat
jets, and Southwest favoring its 175-seat fleet over its older fleet of 143-seaters. By itself this
could indicate a shift towards flying fewer, higher-capacity flights which would reduce the
overall demand for pilots. However, scope clause limitations in agreements with the pilots’
union restrict the ability of the major airlines to pursue that strategy to its fullest extent.
In any case, there is now and will be for the next few years a surplus of pilots. Given the
availability of 50 seat jets discussed in section 2.4.2.1, the combination of low equipment costs
and downward pressure on pilot compensation will reduce startup costs for communities
interested in new or expanded service.
Generally strong appetite for risk-mitigated opportunities
At present, and likely to continue well into 2021, passenger demand is at historic lows, hovering
around 40% YoY. Although we anticipate a gradual recovery, it will be a long time before
demand returns to levels that will support traditional at-risk route expansion in many markets,
and even longer until demand returns to pre-COVID levels. In the interim, airlines will look for
ways to profitably utilize parked fleets and furloughed pilots. They are likely, therefore, to be
more receptive than usual to risk-mitigated opportunities. This presents an opportunity for win-
win deals: local communities can offer risk-mitigation at lower costs than pre-COVID, and
airlines are more likely to be interested than when they faced equipment and personnel
constraints.
Shift to smaller cities and destinations anchored to outdoor recreation
Not all travel markets were impacted in the same way by COVID-19. As previously discussed,
business travel markets, big city tourism destinations, and mass-market tourism destinations
took the biggest hits, while outdoor recreation destinations such as Montana, the Florida
Panhandle, and the Southwest recovered at a much higher rate. These kinds of destinations

19 | P a g e
benefit from a comparative advantage: it is easy to social distance on beaches and mountain
trails, so vacationers still feel comfortable visiting in a way that they largely do not in Las Vegas
or Disneyland. New Mexico, with its wide array of popular hiking and skiing destinations, has
the potential to be one of the largest beneficiaries of this trend if it can establish a COVID-
restriction structure that allows tourism, for example by exempting visitors who test negative
from quarantine requirements.
Work from home culture shift
As of June 2020, the Stanford Institute for Economic Policy Research found that an
unprecedented 42% of employed workers in the United States were working from home full
time, which is the vast majority of the 51% of jobs they estimate could be done by a full-time
worker from home with at least 80% efficiency. Bureau of Labor Statistics reports from the
same time show results of a similar scale and indicate that working from home is mostly
concentrated among higher-earners. Furthermore, polling conducted in October 2020 by
Upwork found that upwards of 14 million Americans are considering relocation as a direct result
of the new work-from-home environment. Of those who indicated they were expecting to
relocate, 20.6% said they were planning to relocate beyond normal commuting distances,
signaling confidence in a permanent shift towards a greater share of working from home even
after the pandemic is over.
In general, real estate data reported by Redfin in October 2020 shows a shift in demand away
from high-cost metropolitan areas such as the Bay Area, Los Angeles, and Seattle and toward
lower-cost Sunbelt metros such as Phoenix and Las Vegas. A September 2020 analysis by
Bloomberg CityLab found similar results. A shift in migration away from high-cost major
metropolitan areas and toward lower-cost secondary cities has the potential to bring
considerable benefits to New Mexico which features both traditional second-home destinations
such as Taos and the comparatively low-cost Albuquerque and Santa Fe metropolitan areas.
Places that receive remote worker migrations are likely to see significant economic benefits, as
studies on remote workers consistently found that workers who expect to be able to continue
working from home post-COVID are among the highest-earning groups; these are the people
most likely to relocate beyond commuting distance of their old workplaces.
20 | P a g e
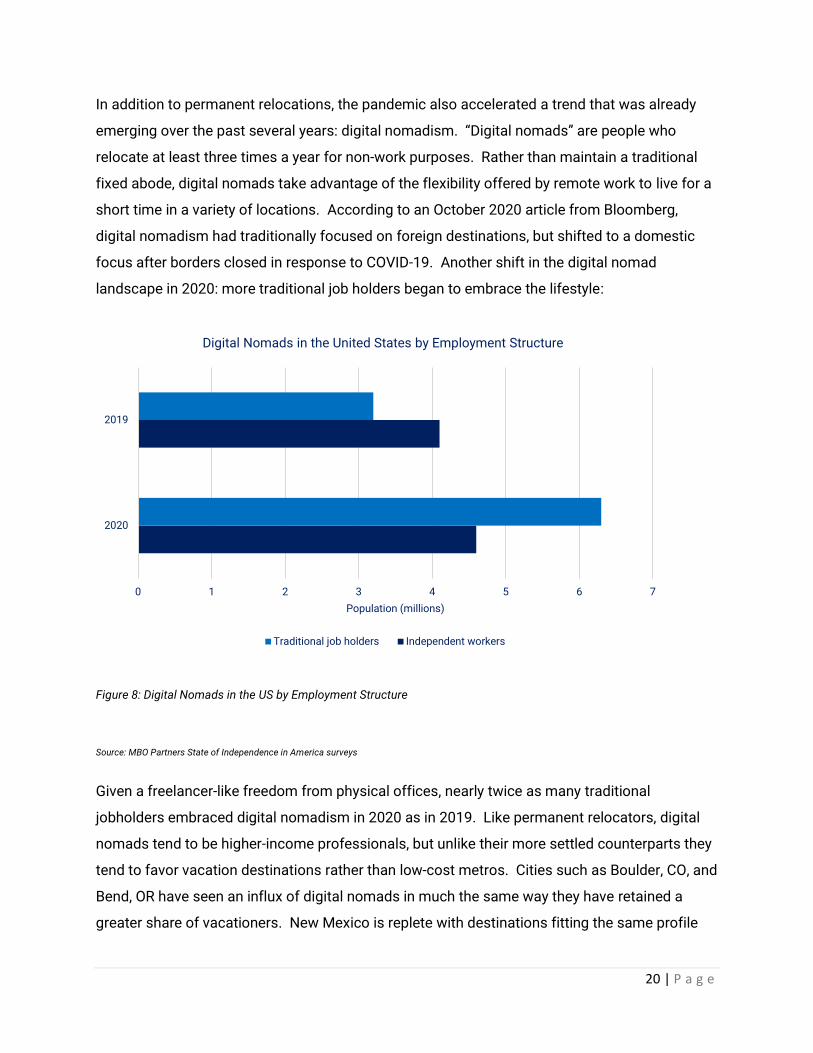
In addition to permanent relocations, the pandemic also accelerated a trend that was already
emerging over the past several years: digital nomadism. “Digital nomads” are people who
relocate at least three times a year for non-work purposes. Rather than maintain a traditional
fixed abode, digital nomads take advantage of the flexibility offered by remote work to live for a
short time in a variety of locations. According to an October 2020 article from Bloomberg,
digital nomadism had traditionally focused on foreign destinations, but shifted to a domestic
focus after borders closed in response to COVID-19. Another shift in the digital nomad
landscape in 2020: more traditional job holders began to embrace the lifestyle:
Figure 8: Digital Nomads in the US by Employment Structure
Source: MBO Partners State of Independence in America surveys
Given a freelancer-like freedom from physical offices, nearly twice as many traditional
jobholders embraced digital nomadism in 2020 as in 2019. Like permanent relocators, digital
nomads tend to be higher-income professionals, but unlike their more settled counterparts they
tend to favor vacation destinations rather than low-cost metros. Cities such as Boulder, CO, and
Bend, OR have seen an influx of digital nomads in much the same way they have retained a
greater share of vacationers. New Mexico is replete with destinations fitting the same profile
0 1 2 3 4 5 6 7
2020
2019
Population (millions)
Digital Nomads in the United States by Employment Structure
Traditional job holders Independent workers

21 | P a g e
and attracting digital nomads can provide the same kind of economic boost as tourism
sustained over a longer period.
22 | P a g e
Section 3: Air Service Marketing Approach
While it seems counter-intuitive, most airlines do not invest marketing dollars into individual air
service markets. This is for a variety of reasons, the largest being cost. Airlines are intense cost
driven businesses, with relatively low margins, and marketing is generally not well capitalized.
Given the limited budgets, airlines focus marketing spend at a National level or in their primary
hubs or focus cities. From an air service development perspective, this makes developing new,
speculative routes very difficult and has disproportionately disadvantaged smaller communities
trying to improve air service. Unfortunately, the onus on promoting air service then falls on the
community. One might ask, “why is it our community’s responsibility to advertise for the airline?”
The simple answer is economic benefit. When a community has well connected airline service,
it generates significant economic impact for the community. Everything from attracting
essential workers, to businesses and industry, to tourism. If a community has well established
air service, it has an economic engine for growth. The amount invested in air service marketing
(and development) will arguably always generate a positive ROI given the millions of dollars in
economic activity generated.
Case in point, Taos and Taos Ski Valley compete with dozens of more accessible resort
destinations in Colorado, Wyoming, and Montana. Securing air service was critical to competing
in this space. During the 2018-19 Winter period, Taos Ski Valley and Taos partnered to create
Taos Air, providing winter only service between Austin, Dallas, and Taos. During the short, 15-
week period, air service generated a total estimated economic impact of spending in the study
area and during the study period of $1.1 million. The availability of direct flights between
Austin/Dallas and Taos had an influence on respondents’ decisions to visit communities in the
study area that otherwise would have spent money in other communities. Given the enormous
economic benefit, every community that has air service should plan to invest in its marketing
and development.
Air service marketing uses similar tactics and targeting that are used for destination marketing.
Like destination marketing, the focus on air service typically involves the destination, but with a
primary emphasis on how to ‘get to’ the destination. The State and several local DMOs are doing
an exceptional job, so making air service a more prominent message should be relatively easy
first step.
23 | P a g e
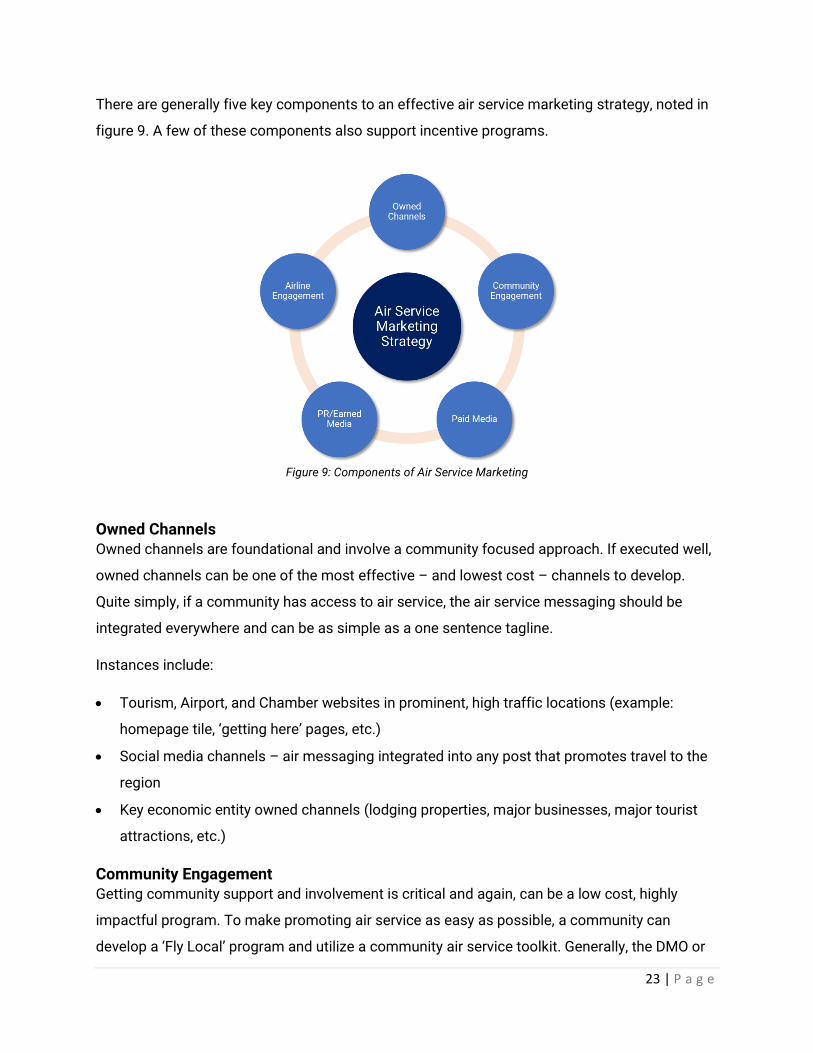
There are generally five key components to an effective air service marketing strategy, noted in
figure 9. A few of these components also support incentive programs.
Figure 9: Components of Air Service Marketing
Owned Channels Owned channels are foundational and involve a community focused approach. If executed well,
owned channels can be one of the most effective – and lowest cost – channels to develop.
Quite simply, if a community has access to air service, the air service messaging should be
integrated everywhere and can be as simple as a one sentence tagline.
Instances include:
• Tourism, Airport, and Chamber websites in prominent, high traffic locations (example:
homepage tile, ‘getting here’ pages, etc.)
• Social media channels – air messaging integrated into any post that promotes travel to the
region
• Key economic entity owned channels (lodging properties, major businesses, major tourist
attractions, etc.)
Community Engagement Getting community support and involvement is critical and again, can be a low cost, highly
impactful program. To make promoting air service as easy as possible, a community can
develop a ‘Fly Local’ program and utilize a community air service toolkit. Generally, the DMO or
24 | P a g e
Chamber will manage the Fly Local program and solicit support from businesses, hotels,
resorts, and any other entity that can stimulate awareness of air service. It starts with
developing a webpage that houses a variety of assets for the community to leverage. Most
DMOs have something already built with community tourism assets, so expanding to include air
service content should be relatively easy. The web page should include digital banner ads (to
match current campaign creative with air message), a photo library, and language
recommendations and instructions for messaging air service in various communication
channels. Once these assets are built, the DMO solicits support from local businesses and
organizations to promote ‘flying local’. Ideally the community or DMO also has a working
relationship with the air carriers to support and align with the program. This could include the
airline providing content for the program (logos or branding, tickets for promotions,
coordination on fare sales or other price messaging, etc.)
Paid Media Paid media focuses on developing an advertising plan that targets air service markets. Air
service marketing should be budgeted and approached in two ways:
1) Build awareness and consideration for new air service, and
2) Maintain awareness and increase conversion of existing air service
A budget should be established for each of these approaches. The first is primarily used when
new service is introduced (or existing service expanded), and optimized for duration, reach, and
frequency – and with focus on building awareness. Advertising should focus on air service as
the primary message. The second, more of a lower funnel maintenance budget, leverages
conversion tactics and other targeted advertising media that the DMO can place the air service
message in as a secondary message or ‘tag line’. Figure 10 illustrates an example of how one
community organizes its paid advertising efforts. We describe each component below.
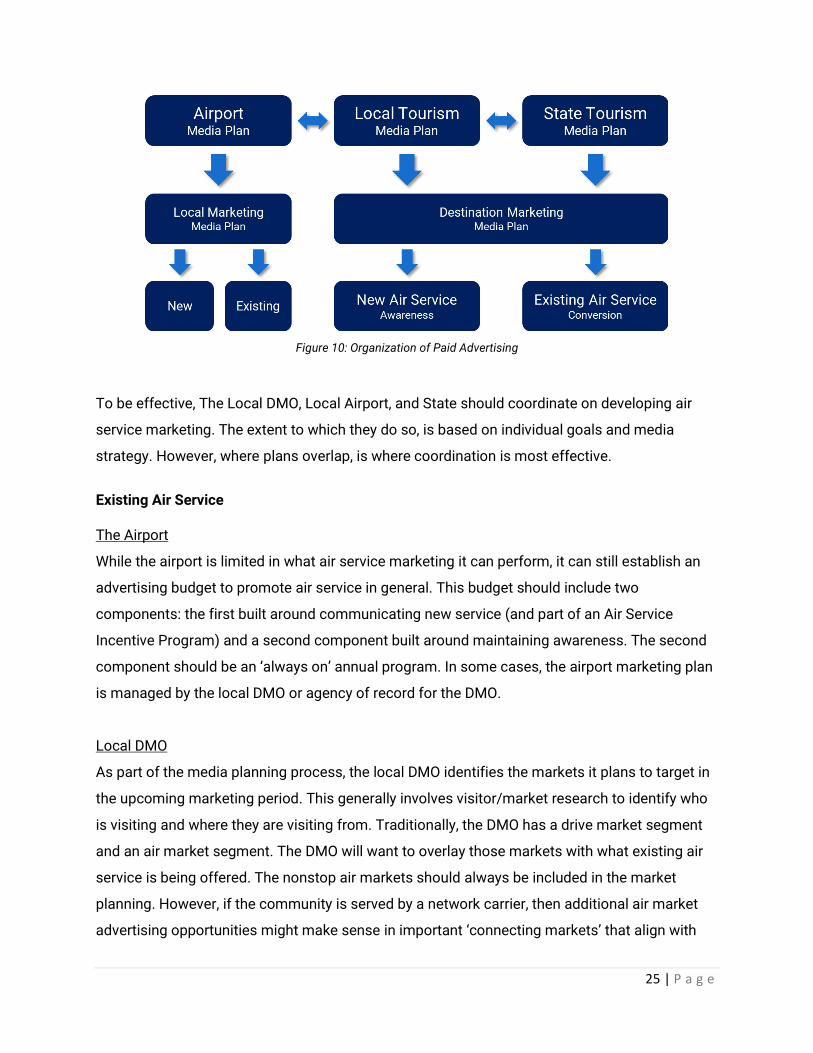
25 | P a g e
Figure 10: Organization of Paid Advertising
To be effective, The Local DMO, Local Airport, and State should coordinate on developing air
service marketing. The extent to which they do so, is based on individual goals and media
strategy. However, where plans overlap, is where coordination is most effective.
Existing Air Service The Airport
While the airport is limited in what air service marketing it can perform, it can still establish an
advertising budget to promote air service in general. This budget should include two
components: the first built around communicating new service (and part of an Air Service
Incentive Program) and a second component built around maintaining awareness. The second
component should be an ‘always on’ annual program. In some cases, the airport marketing plan
is managed by the local DMO or agency of record for the DMO.
Local DMO
As part of the media planning process, the local DMO identifies the markets it plans to target in
the upcoming marketing period. This generally involves visitor/market research to identify who
is visiting and where they are visiting from. Traditionally, the DMO has a drive market segment
and an air market segment. The DMO will want to overlay those markets with what existing air
service is being offered. The nonstop air markets should always be included in the market
planning. However, if the community is served by a network carrier, then additional air market
advertising opportunities might make sense in important ‘connecting markets’ that align with
26 | P a g e
the plan. This is particularly valuable if a connecting market is a strong candidate for future non-
stop service. To help identify the best air markets for their community, the DMO or airport can
solicit the services from an air service development consultant to provide an analysis of the
opportunities.
There will likely be overlap between the DMO media markets and the air markets. With this is in
mind, the DMO creates two message priorities: one developed for air markets and the other
based on the drive market or brand campaign. If a media market is served by air, the call to
action should include a flight message, but still maintain the integrity of the overall DMO
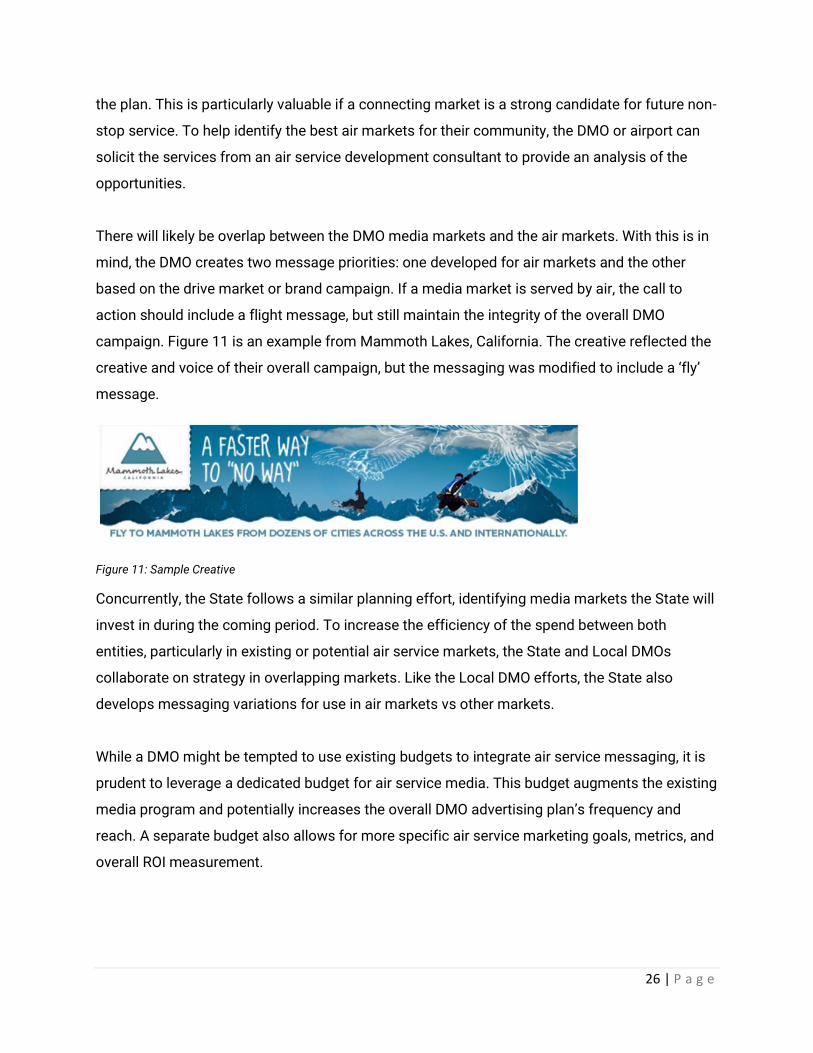
campaign. Figure 11 is an example from Mammoth Lakes, California. The creative reflected the
creative and voice of their overall campaign, but the messaging was modified to include a ‘fly’
message.
Figure 11: Sample Creative
Concurrently, the State follows a similar planning effort, identifying media markets the State will
invest in during the coming period. To increase the efficiency of the spend between both
entities, particularly in existing or potential air service markets, the State and Local DMOs
collaborate on strategy in overlapping markets. Like the Local DMO efforts, the State also
develops messaging variations for use in air markets vs other markets.
While a DMO might be tempted to use existing budgets to integrate air service messaging, it is
prudent to leverage a dedicated budget for air service media. This budget augments the existing
media program and potentially increases the overall DMO advertising plan’s frequency and
reach. A separate budget also allows for more specific air service marketing goals, metrics, and
overall ROI measurement.
27 | P a g e
New Air Service Approach
While existing air markets can leverage a budget that is geared more towards maintenance and
leverages a strong community engagement program, a separate budget designed for building
awareness and consideration for new markets is critical for success. This is particularly
important in markets that are (or have been) traditionally drive markets. Since the market is
likely ‘conditioned’ to drive, it takes a significant amount of time, effort, and money to change
those behaviors and shift to flying. In many cases, new air service stimulates new demand and
an entirely different demographic segment. When the destination is more accessible, it is easier
to compete with other destinations and convert new visitors. Since air travelers tend to have
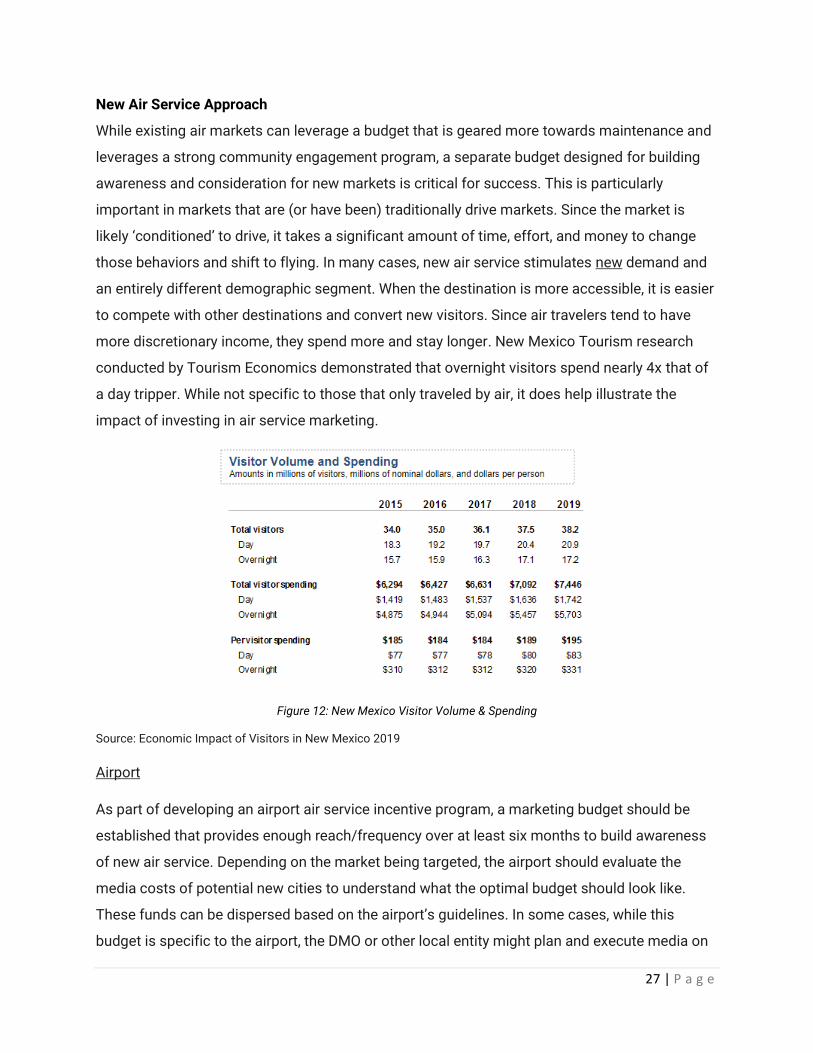
more discretionary income, they spend more and stay longer. New Mexico Tourism research
conducted by Tourism Economics demonstrated that overnight visitors spend nearly 4x that of
a day tripper. While not specific to those that only traveled by air, it does help illustrate the
impact of investing in air service marketing.
Figure 12: New Mexico Visitor Volume & Spending
Source: Economic Impact of Visitors in New Mexico 2019
Airport
As part of developing an airport air service incentive program, a marketing budget should be
established that provides enough reach/frequency over at least six months to build awareness
of new air service. Depending on the market being targeted, the airport should evaluate the
media costs of potential new cities to understand what the optimal budget should look like.
These funds can be dispersed based on the airport’s guidelines. In some cases, while this
budget is specific to the airport, the DMO or other local entity might plan and execute media on
28 | P a g e
behalf of the airport. In some cases, if the airport lacks funding from PFCs, General fund, or
other tenants to create a budget, the Chamber or DMO will also assume the marketing
responsibility.
Local DMO
In addition to a budget to support existing service, the local DMO should plan a budget that can
support new air service marketing. This can be the same program executed for the airport
incentive program, or a separate budget to augment the airport plan. Depending on the
community structure, this could be an exercise that is developed in cooperation with the airport
to ensure the most efficient budget and use of resources.
State
Similar in approach to existing markets, if new air service is being introduced in a community,
the State will want to ensure any planned advertising spend that targeted that region includes
air service messaging.
New Mexico DOT’s current air service marketing grant program does an exceptional job of
creating an opportunity for communities to develop robust marketing incentives. With matches
up to $200K per cycle, this program helps ensure an effective level of spend is in place to
achieve awareness and consideration goals. Community match can be leveraged with existing
airport marketing budgets as well as tourism related advertising spend geared for air service
messaging.
Funding Considerations
The above example represents a more mature air service market that has developed a funding
mechanism to invest in air service retention and development. Starting a new program will
require upfront investment and commitment to developing air service. Consider the following
steps for developing a program.
1. Identify Optimum Budget. Based on best practice, a budget of $100,000 for new service
and $50,000/year for maintaining and growing existing service has produced the best
results. However, this can vary based on the market, type of service, amount of air
service, and local engagement.

29 | P a g e
The community will want to identify the optimum budget for each category – beginning
with developing the owned and community engagement channels first. These can
largely be free and have significant impact.
2. Identify Funding Mechanism. This can be a very collaborative, regional approach with
contributions from various organizations. The economic impact from air service is not
just felt in the community with the airport, but region wide. Identify key regional partners
that will benefit from air service and solicit support.
Figure 13: Funding Mechanisms
Examples:
• Airport Sources. Budgets generated from general operating budget, reallocation of
existing budget, or funded through revenues generated by airport activities (it cannot
be funded from funds received by the FAA).
• Community Sources. Lodgers Tax, new tax initiatives, reallocation of Lodgers Tax
from other non-tourism related programs, community operating budgets, and
economic development organizations.
• Regional Sources. This largely involves other communities that will benefit from air
service access and includes allocating a percentage of community sources.
• Private Businesses. This includes entities that drive significant economic activity in
the region, including major tourism attractions and businesses. It can also include
Real Estate transactions, Homeowners dues collections, etc.
• Existing Budgets. As discussed, since air service marketing is similar to destination
marketing, simply rotating in air service messaging into existing marketing budgets
30 | P a g e
throughout the year or expanding existing SEM campaigns to include air service key
words can have a considerable impact.
• State Grants. The New Mexico Department of Transportation provides a grant
program under the New Mexico Air Service Assistance Program that provides
matching funding up to $200,000/year for air service marketing.
• Destination Incentives. In addition to local sources, there will likely be marketing
incentives available in the destination market. While these funds are generally
provided as incentives for the airline, the community representative managing the
airline marketing program may consider working with the airline to collaboratively
use the funds and build out a campaign.
3. Build Program. Identify who will own air service marketing in the community, generally
this is managed by the DMO. The program owner will develop the program, identify
funding, and execute the plan.
PR/Earned Media One of the easiest ways to promote air service is to ensure an air service ‘message tag’ is
always included in all PR content. Long form content can be as simple as:
Getting to Santa Fe is convenient and easy with daily flights from Dallas/Ft Worth, Denver,
and Phoenix - Fly to Santa Fe and connect from hundreds of cities worldwide.
Depending on the channel, this content can be reduced to fit the requirements of the media. In
general, most communities should consider the following as part their Air Service PR strategy:
• Press Release message tags
• Air Service materials in Media/PR Kits (simple flyer covering air service options, group travel,
etc.)
• Air inclusion in all FAMs (media writers, influencers, group/conference travel agencies, etc.)
• Partnership with air carrier for promotions
• Dedicated Press Releases for new service at local and potentially State level (distributed to
Local/State/National levels as well as partner networks)
• Sales missions
31 | P a g e
• Pitch to Media through organizations such as IMM (international media marketplace) or
conferences and events like the media day at IPW.
Airline Engagement In some cases, airlines will also collaborate on marketing efforts. This is more likely to occur
when a new route is announced, or is still developmental, and likely tied to co-operative
marketing programs or ASIPs. A coordinated effort between the community and the airline can
help ensure the community has the tools to market the service effectively. This can include co-
operation on promotions (trip giveaways, sweepstakes, etc.), retail advertising (airline fare
sales), or inclusion in airline’s owned channels (Social Media, Email, website, etc.).
If the community has an air service marketing program in place, the community can also
coordinate with the airline marketing department on new market advertising campaigns. This
could include the marketing incentives the community provides the airline for new service, but
also any incentives that are available in the destination city. The community might suggest
developing a comprehensive advertising campaign for both the local and destination markets,
leveraging the incentives of both regions. This will depend on how the marketing incentives are
structured in the destination city, but airlines have historically preferred this approach.
Developing a ‘hook’ that provides value to the community and airline customer can help secure
more support from the airline, but also provide a strong value proposition for the campaign –
and even foster a regional partnership.
Washington Wine Country Case Study
Walla Walla, Washington is the hub of the Washington Wine country. The region is served by
three airports: Walla Walla (ALW), Pasco/Tri-cities (PSC), and Yakima (YKM). Most airline
passengers leverage PSC or drive from Seattle which was three to four hours away. With Air
service to ALW, waning and at risk of being reduced or terminated, the community reached out
to Alaska Airlines for support. Working together, Walla Walla created the ‘Taste and Tote’
program that included free tastings at dozens of wineries. Alaska partnered to provide baggage
fee waivers to check a case of wine for free on Alaska Airlines flights. With a strong value
proposition, Walla Walla tourism promoted the program through PR, owned channels, and paid
channels. Conversely Alaska Airlines had a viable offer to provide to their customers and
promoted through their channels. This ‘hook’ also helped create a campaign that Walla Walla
tourism used to develop a nationwide campaign using local and grant funds. Again, Alaska
32 | P a g e
partnered with Walla Walla and leveraged their agency resources to help plan and execute the
advertising program. The result was significantly higher awareness of Walla Walla (around the
globe) and a substantial increase in passenger traffic that eventually led to more flights. Given
the success, it was expanded to include YKM and PSC, encompassing the entire Washington
Wine Country. Hertz also joined the program and waived drop off fees from any of the three
airports, allowing a visitor to fly into one airport and out of another (a benefit of the Hertz
franchisee owning franchises in all three communities).
The region benefited from a coordinated approach to tourism development, ultimately
increasing visitation around the region and longer trip stays. Alaska benefited from increased
passenger traffic and a competitive advantage (the other airlines serving the region do not
waive baggage fees for wine).
33 | P a g e
Section 4: Incentive Programs
Note: Anti-donation Clause of New Mexico Constitution (Art.IX, Sec. 14) restricts the use of
some incentive programs or initiatives and may need to be adapted to reflect law:
Neither the state, nor any county, school district, or municipality ... shall directly or indirectly
lend or pledge its credit or make any donation to or in aid of any person, association, or public or
private corporation ...
Although airlines have few regulations surrounding their generation and expenditure of money
driven by the Airline Deregulation Act, the same is not true of airports. In the United States,
nearly every commercial service airport, many general aviation airports and their owners,
operators, and sponsors in are subject to airport grant assurances. These specific numbered
assurances are conditions agreed to in the process of receiving federal funding to build airport
facilities.
For air service development, there are four pertinent assurances: Economic Nondiscrimination,
Exclusive Rights, Fee and Rental Structures, and Airport Revenues. Collectively, these
assurances mean the airport and their owners, operators, and sponsors, agree in the process of
taking federal funds that the facilities will be administered as public assets, without
discrimination among users. Therefore, an airport is not allowed to pay an airline to operate
flights to a specific desired location, nor is an airport allowed to charge one airline different
rates vs. another based upon volume of flights, and other similar restrictions. These
assurances ensure all qualified operators access to an airport but limit the airport’s ability to
play a role in regional economic development driven by its presence.
There are a few common exceptions from the assurances as related to air service development.
Airports, their owners, and sponsors can offer fee and facility rental waivers for a period of up to
two years to carriers that provide new services. These waivers must be available to any carrier
willing to provide the service. Airports which provide such incentives typically have a published
procedure to ensure they meet their grant assurances. These restrictions apply only to the
airport and its owners and operators – other organizations, including government entities and
corporations which did not accept federal funding related to airport construction and grant
assurances are under no such restriction.
34 | P a g e
Because of the restrictions above, various programs to promote new air service and enhance
existing services have been developed over the years. There are two federal programs which
promote air service at airports under certain conditions. Several states, including New Mexico,
have local air service development programs as well. In several specific and specialized cases,
corporations and other private entities participate in the process of developing air service.
Essential Air Service
The modern air transportation system in the U.S. was formed because of the Airline
Deregulation Act of 1978. Prior to deregulation, all marketplace decisions made by the airlines,
including routes and fares offered were subject to approval of the federal government via the
Civil Aeronautics Board. Understanding that a significant number of communities faced losing
their air service under deregulation, regulators included the Essential Air Service (“EAS”)
program with airline deregulation. In short, this regulation prohibited the last carrier at an
airport from terminating service without first affording the federal government the opportunity
to replace that air service, on a subsidized basis. The program was initially legislated with a
sunset after 10 years but was extended in 1989 and made permanent in 1996.
The program works as a series of 2-4-year grants where selected airlines respond to Requests
for Proposals from the U.S. Department of Transportation. The airline proposals include
specific service and subsidy details. The DOT consults with the communities to determine the
best airline service offer. Subsidies, as provided, are based on a loss-plus model, where airlines
proposing service estimate their revenue and costs to provide service, and request from the
program a subsidy to compensate for projected losses plus a modest profit. Typically, EAS
providers are selected for a period of two-years and are provided a subsidy per flight on
estimated and averaged costs and revenue, not actual figures.
Over the years, additional regulations were imposed on the EAS program to manage the budget
and scope of the program. Minimum distance from defined larger airports, minimum passenger
count, and dollars of subsidy per passenger were the primary mechanisms used to remove
subsidy eligibility from communities.
35 | P a g e
Today, carriers serving three airports in New Mexico receive almost $11 million in subsidies
under the Essential Air Service program: Cavern City Air Terminal (CNM) near Carlsbad, Clovis
Municipal Airport (CVN), and Grant County Airport (SVC) at Silver City.
Small Community Air Service Development Grants
The Small Community Air Service Development Program (SCASDP) was established in 2000 as
a pilot program by the Wendell H. Ford Aviation Investment and Reform Act for the 21st Century
(AIR-21) as a three-year pilot program. First implemented in 2002, the program has been
periodically reauthorized and refunded. The program is also administered by the U.S. DOT.
SCASDP is substantially different from EAS. It is a project-based competitive grant program
designed to address specific air service development concerns at Small Hub and Non-Hub
airports as defined by the FAA in 1997. SCASDP is not designed for long-term service
subsidies, but instead encourages eligible communities to seek assistance with a variety of
short-term projects aimed to improve specific deficiencies. A variety of projects can be eligible
for SCASDP funding, including projects to encourage initiation of new services, such as airline
minimum revenue guarantees, start-up cost offsets and research studies to identify and
quantify air service deficiencies. Projects may also support existing services through general
airport or route-specific marketing, and support for aircraft upgrades. Selected projects
typically receive between $200,000 and $1.5 million of funding from the SCASDP program and
range up to $2 million projects with local funding elements included.
Since the SCASDP began, airports in New Mexico have been awarded nearly $7.5 million over 12
grants. Recent grants include a 2017 award to Farmington to support the resumption of
commercial services with the service to Denver operated by United Express partner SkyWest.
This service has been delayed until Spring 2021 in response to the pandemic. Similarly, a 2016
SCASDP grant to Santa Fe assisted the community in replacing lost American Eagle service to
Los Angeles with new service to Phoenix. Earlier this year, Roswell was awarded $750,000 in
federal funding to assist in recruitment of United Express service to Denver (currently delayed
until post-Covid 19 demand begins to return to normal levels.
36 | P a g e
Other Programs as Models
There are several examples of other air service development programs across the United
States, with potential applications in New Mexico. This document will touch on five such
programs.
Reno Air Service Corporation (RASC) – Reno/Tahoe, CA/NV
The Reno Air Service began as a marketing committee in 2001. In 2015 the non-profit
corporation was formed to develop and sign risk mitigation contracts for air service
development at the Reno/Tahoe Airport. Given the previously mentioned restrictions on airports,
RNO works closely with RASC and handles most air service development research. When a
strong air service candidate is identified and a carrier is interested in serving the region, RNO
than refers the airline to RASC for review.
RASC is managed by a board from various privately funded entities, including: CVBs, Reno
Chamber, Tahoe Ski Areas, Reno area casinos, and Ski Lake Tahoe. Participation on the board
comes through entry fees and investment in board votes.
Funds are largely used for two purposes. The first, air service marketing both on the local level
and in target fly markets. Significant effort is spent on new or development markets to ensure
their success, especially if supported by minimum revenue guarantee. The second purpose is
used to support minimum revenue guarantees to offset the risk for new air service until the
service reaches maturity and becomes profitable.
The RNO airport also participates with air service incentives tied to landing fee waivers and
other cost abatements at the airport for a 1-2-year period.
Fly Sun Valley Alliance (FSVA) – Sun Valley, Idaho
The Sun Valley air service program initially was funded (marketing and MRG) solely by the Sun
Valley Resort to attract air service to the region. As tourism became a larger influence, the
model switched to a 50/50 cost sharing model with the community.
37 | P a g e
Today, the Fly Sun Valley Alliance (FSVA) is an Idaho non-profit 501c(6) corporation. The
volunteer board of directors includes private sector business members and public-sector
representatives from Friedman Memorial Airport, Hailey, Ketchum, Sun Valley and Blaine
County.
The air service development work of Fly Sun Valley Alliance is funded through investment
partnerships with both public and private sector entities. Public sector investment is provided
through annual contracts with Sun Valley Air Service Board through 1% for Air Local Option
Sales Tax revenues. Private sector investment is provided through local business partner
programs such as Realtors for Air, Air Support Business Ski Passes and Ski for Air Service Day.
The Sun Valley Ski Resort also contributes significantly to support minimum revenue
guarantees for airline service.
Funds of the 1% Sales Tax are used for local and fly market advertising (up to $1 million),
minimum revenue guarantees, air service development research, and program administration
costs. The tax raises approximately $2.5-3 million each year and roughly $1-1.4 million is used
for revenue guarantees. The Sun Valley Resort also matches that amount to create a $2-2.8
million annual program. Admin costs are roughly $150 thousand and cover consulting fees and
administrative fees. The FVSA does not have any full-time employees and services are
contracted. There were no real upfront costs to set up the program, just the time and consulting
resources.
Guarantees are reconciled at different intervals with the airlines throughout the guarantee
period. If there is a revenue shortfall, the airlines invoice FSVA for the difference. FSVA holds the
contracts with the airlines and FSVA reimburses the airlines from the fund. The FSVA has a
separate contract with Sun Valley Resort to share in these costs (50/50 split).
Steamboat Springs, Colorado
The program in Steamboat Springs Colorado comprise two partners: Steamboat Resort and the
City of Steamboat Springs. The Resort is responsible for air service development that includes
maintaining existing partners and identifying new air service opportunities. The Resort is also
responsible for negotiating and setting the MRG levels, payout caps, and annual MRG budget.
The Steamboat program is largely used for developing minimum revenue guarantees.

38 | P a g e
The City of Steamboat leverages a local marketing district board that comprises of members
form the local market district that collects a 2% lodging tax. The 5-person board is appointed by
the City Council. Members of the board must live and operate a business within the local market
district to be eligible.
The funds are used for administration, marketing, and minimum revenue guarantees. Roughly
2/3 of the MRGs are supported by the local marketing district and 1/3 by Steamboat Resort. The
program usually costs between $1.2-$1.5 million a year in revenue guarantee payouts to the
airlines. However, the program is subject to a payout cap that is much higher, usually around $4
million. Given this cap, the program is funded up to the $4 million level and the funds are held in
reserve if not used. Since the Resort maintains the contracts with the airlines, the airlines will bill
the Resort at the negotiated time of settlement and the resort processes the payments to the
airlines. The Resort then has a contract with the board and is reimbursed for the payouts using
the lodging tax funds. The lodging tax funds also cover roughly $100,000 in administrative costs
to manage the program.
In the past, Steamboat had a third funding source tied to a .25% sales tax that required voter
approval. The sales tax initiative failed to pass in the last election cycle and politically was hard
to gain approval. With a sales tax, the local population was helping to fund air service, which
locals felt benefit tourists more than the community. The County/Airport do not participate in
any way in terms of air service incentives to offset costs for new air service.
Wyoming Department of Transportation
The Wyoming Departure of Transportation originally developed a $3 million program called the
Air Service Enhancement Program (ASEP) in 2003 ear marked for airport improvements,
revenue guarantees, and marketing grants. This program was funded by a bill through the State
legislature. The program funding has been reduced over the years and today is funded at $1.3
million to support the State’s growth markets.
After the demise of Great Lakes Aviation (the State’s primary rural air service provider) and the
end of essential air service eligibility, the State formed a partnership with Denver Air Connection
(operated by Key Lime). Denver Air Connection (DAC) provided non-stop jet service to Denver
from Sheridan and Riverton. While DAC developed an interline relationship with United, and to be
39 | P a g e
eligible for state funds, service for the “critical” need airports was transitioned to SkyWest under
the CPA.
To develop a truly seamless and convenient air service solution, the State of Wyoming
developed a new program (to augment the original) that created a State funded Capacity
Purchase Agreement (CPA). The CPA program specifically covers service to communities that
are most at-risk to lose air service connectivity. The CPA included four communities connected
to one hub and one network carrier, in this case Denver with United Express (operated by
SkyWest). The CPA is based on a negotiated block hour rate plus fuel costs and the State pays
only for the flights (hours) that were operated through the term. It includes a ‘cost not to exceed’
annual cap for each community to limit risk. SkyWest tracks the total ticket revenue and if that
exceeds the costs, then the State retains the profits (as credits for service within the
agreement) and split between the community and the State 40/60 respectively. SkyWest
invoices the State for the flying, the State pays the entirety of the invoice, and then invoices the
local community 40% of the airline invoice.
Funding for the CPA program was a one-time $15 million appropriation and does not include the
local match contributions from the four communities. Both programs combined, have about
$200,000 in overhead (salaries, consultation, and data purchases). There was also about
$100,000 spent on four air improvement council meetings around the State.
The State worked with a task force that was created across the State to develop the CPA
program and get broad based community support for the air service options that were selected.
Developing this task force (or air improvement council) was critical not only for the
Stakeholders involved, but to help educate other communities that might not be directly
participating in the program. The council included elected officials, business leaders, and other
key constituents to craft the CPA program.
WYDOT manages all the administrative components of the program and retains a consultant to
help with commercial elements of the program (including fare studies, leakage reports,
advanced bookings, etc.) The State also manages and administers the RFP process.
Participating communities then negotiate specifics within each community. The State spends a
lot of time working with political leaders, community constituents, and others to educate and
onboard communities into the program. Each participant is required to provide a 40% ‘match’ of

40 | P a g e
the State funding and is generally split between different government entities. In the case of
Sheridan, this is split between the County and City. Like the State, the communities also
developed local air service task forces to ensure the air service best fits the needs of the
community. To fund the 40% match, the communities have largely leveraged an option tax of 1%
on Sales Tax (in addition to the 1% option tax, one community added a .5% tax that was specific
to economic development). The option tax is divided across different areas on a four-year cycle
and includes air service development.
Lea County – Hobbs, New Mexico
Currently, Lea County/Hobbs New Mexico is the only region within the State with an active
minimum revenue guarantee program. The program was developed after Hobbs lost it’s EAS
eligibility and the community needed access to the air transportation network to support the oil
and gas industry. Working with the County, City, and local private businesses, the community
gained regional jet service to Houston-Intercontinental Airport with the addition of Continental
Express in 2011. These services were transitioned to the United Express brand following the
merger of the major carriers Continental and United in 2012. United briefly introduced service
between Hobbs and Denver in late 2019, although this effort was thwarted by the Covid-19
pandemic (service is expected to resume once post-Covid travel demand returns).
The Economic Development Corporation (EDC) holds the contract with FlyHobbs and United
Airlines. The program funding is split 50/50 with the City and County and generally totals $2
million annually. There are no administrative costs for the program outside of the staff time to
manage it. It took approximately 1.5 years to develop the program and raise the funds to begin
the program and establish the air service. The EDC developed a competitive RFP process that is
solicited every two years to potential airline candidates. Proposals received by the EDC are then
reviewed by the EDC, airport, and ASD consultant, as well as other key members of the
community to ensure the needs are being met by the proposed service.
The amount of the MRG fluctuates over the years and is cyclical with the oil industry. The
amount is not based on the full cost of the service but based on a profit/loss forecast created
based on current market conditions. This implies that the carrier is assuming some risk based
on external environmental factors that cannot be controlled (high fuel costs, depression in
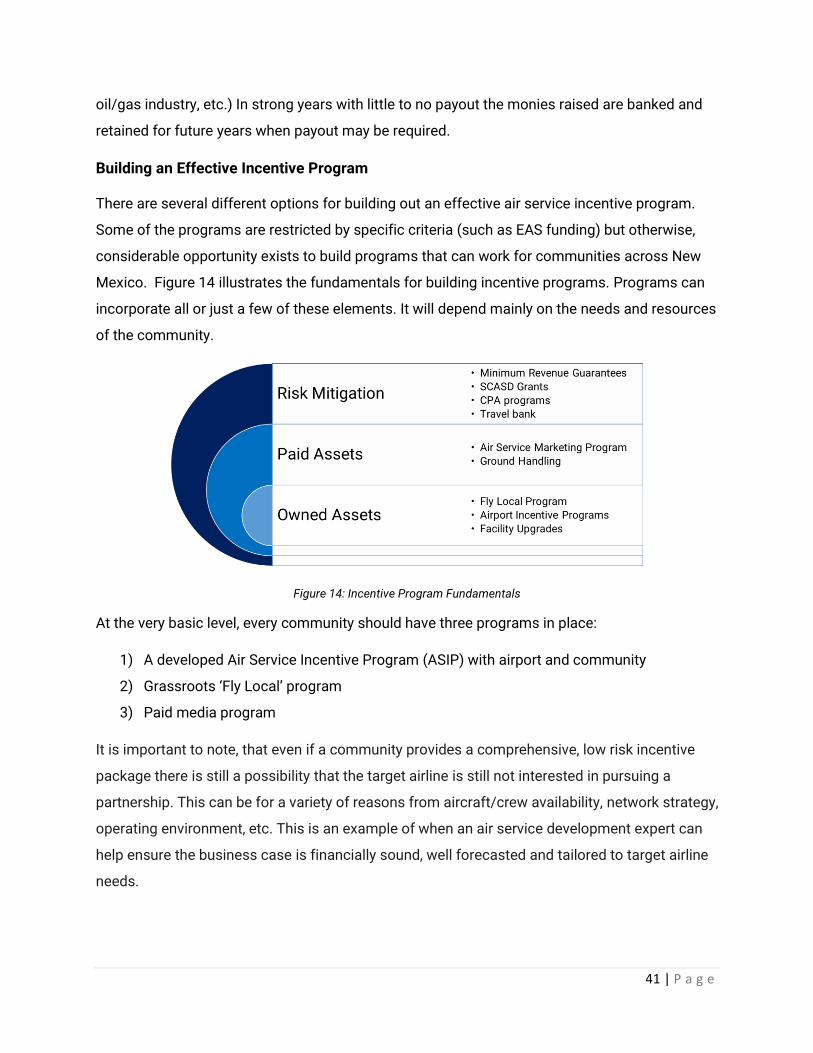
41 | P a g e
oil/gas industry, etc.) In strong years with little to no payout the monies raised are banked and
retained for future years when payout may be required.
Building an Effective Incentive Program
There are several different options for building out an effective air service incentive program.
Some of the programs are restricted by specific criteria (such as EAS funding) but otherwise,
considerable opportunity exists to build programs that can work for communities across New
Mexico. Figure 14 illustrates the fundamentals for building incentive programs. Programs can
incorporate all or just a few of these elements. It will depend mainly on the needs and resources
of the community.
Figure 14: Incentive Program Fundamentals
At the very basic level, every community should have three programs in place:
1) A developed Air Service Incentive Program (ASIP) with airport and community
2) Grassroots ‘Fly Local’ program
3) Paid media program
It is important to note, that even if a community provides a comprehensive, low risk incentive
package there is still a possibility that the target airline is still not interested in pursuing a
partnership. This can be for a variety of reasons from aircraft/crew availability, network strategy,
operating environment, etc. This is an example of when an air service development expert can
help ensure the business case is financially sound, well forecasted and tailored to target airline
needs.
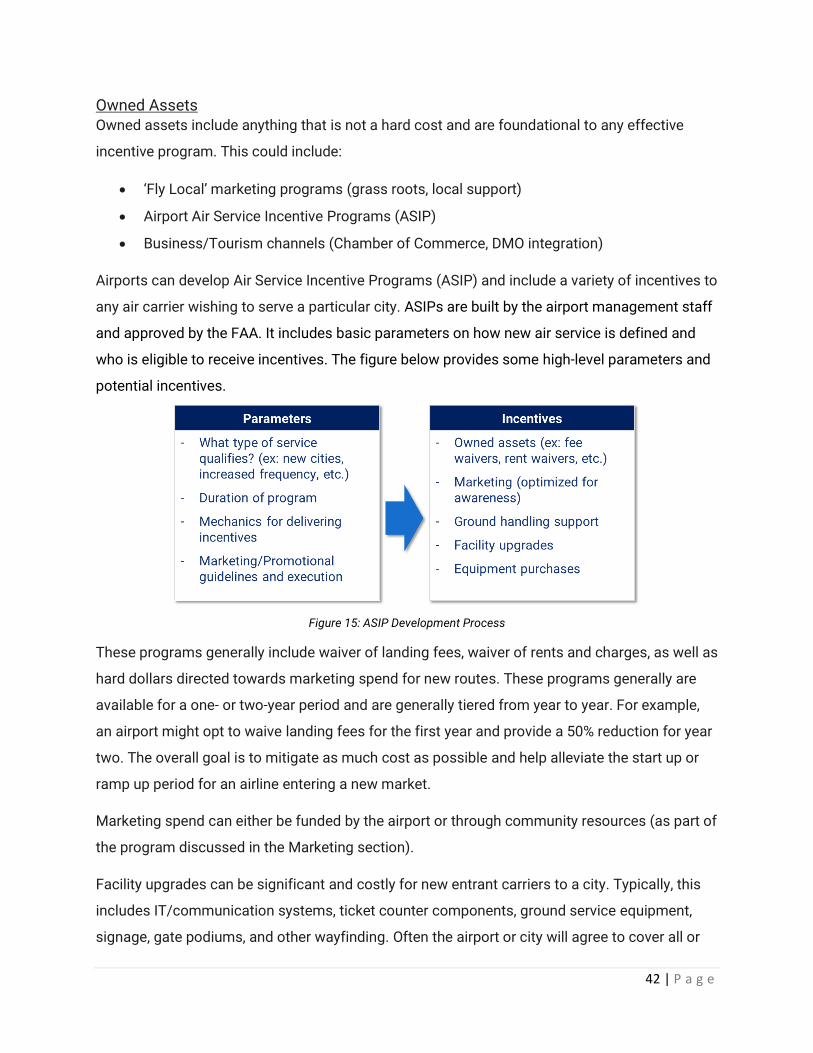
42 | P a g e
Owned Assets Owned assets include anything that is not a hard cost and are foundational to any effective
incentive program. This could include:
• ‘Fly Local’ marketing programs (grass roots, local support)
• Airport Air Service Incentive Programs (ASIP)
• Business/Tourism channels (Chamber of Commerce, DMO integration)
Airports can develop Air Service Incentive Programs (ASIP) and include a variety of incentives to
any air carrier wishing to serve a particular city. ASIPs are built by the airport management staff
and approved by the FAA. It includes basic parameters on how new air service is defined and
who is eligible to receive incentives. The figure below provides some high-level parameters and
potential incentives.
Figure 15: ASIP Development Process
These programs generally include waiver of landing fees, waiver of rents and charges, as well as
hard dollars directed towards marketing spend for new routes. These programs generally are
available for a one- or two-year period and are generally tiered from year to year. For example,
an airport might opt to waive landing fees for the first year and provide a 50% reduction for year
two. The overall goal is to mitigate as much cost as possible and help alleviate the start up or
ramp up period for an airline entering a new market.
Marketing spend can either be funded by the airport or through community resources (as part of
the program discussed in the Marketing section).
Facility upgrades can be significant and costly for new entrant carriers to a city. Typically, this
includes IT/communication systems, ticket counter components, ground service equipment,
signage, gate podiums, and other wayfinding. Often the airport or city will agree to cover all or

43 | P a g e
part of these facility upgrades. This may also include the cost of transporting and airline’s
equipment from other locations to the new airport.
Paid Assets Paid assets include anything that is a hard cost to the airport or community. Traditionally, this
includes comprehensive marketing support to adequately build awareness of the new air
service over an extended period. As a pre-planning exercise, the community will want to
understand local media costs and develop a budget that can adequately build awareness with
the optimum level of reach and frequency. This will vary from city to city depending on
population and other economic factors. The community or airport may want to retain the
services of an advertising agency (or leverage the agency of record with the DMO) to effectively
plan and execute advertising programs.
Some airports or communities create a marketing incentive that allows the airline to spend the
funds to fit their marketing or media strategies. Unfortunately, this flat sum is traditionally,
arbitrarily set based on budget constraints. For example, one West Coast airport in a major
metropolitan area provides only $25,000 in marketing support; well below what is required to
adequately build awareness of new service in that region. While another airport located in the
region, offers at least $100,000 in marketing support, which is better aligned with the cost of an
effective program for that region. The general rule of thumb is to build a budget that provides
effective reach and frequency (over a four to six-month period) required to build awareness.
Depending on what type of demographic utilizes air service in the community, it may require
advertising in the local market as well as the destination market. It is also important to set
specific requirements around the budget and ensure that the funds are leveraged for advertising
and promotion of the new service. It is also important to note that larger airlines typically do not
have the resources to effectively develop and execute advertising programs in smaller markets.
The larger network airline advertising strategies are focused on more national, brand campaigns
vs. specific destination marketing. Going unused, the city risks the service not developing as
quickly as it could, or worse, the airline discontinues service. With that in mind, the airport or
community might opt to build out the new air service campaigns on behalf of the airline
leveraging their own marketing agency resources. While matching funds generally help commit
an airline to market the service, these can be a deterrent to using the marketing incentives and
generally are not well received by airlines. The community should plan to dedicate their own
resources to marketing the new service through their air service marketing programs.
44 | P a g e
While facility upgrades can also be factored into this category, other hard costs can include the
purchase of ground handling equipment (i.e. baggage carts, tugs, deicing vehicles, etc.) as well
as the ground handling itself. Ground handling includes the manpower used by the airline to
service the aircraft at the airport. At smaller airports with limited frequencies, these costs can
be particularly high. A growing number of airports are now sourcing these services for the airline
and covering the cost. This significantly reduces the airline operating costs at the airport and
makes the service more compelling for the airline.
Risk Mitigation
Risk mitigation can be by far the most complex of incentives offered, but if structured well, can
significantly increase the chances of securing air service. Risk mitigation can be used for
‘target’ markets that have strong historical demand patterns, visitor patterns, and consensus
through a local air service advisory council. Additionally, these markets need to be economically
viable, commonly becoming self-sufficient over a two to three-year period. Airports and
communities should consider retaining air service development specialists to help forecast and
evaluate top target market opportunities, as well as engage potential airlines to provide the
service.
Risk mitigation programs cannot be funded by the airport or with federal dollars allocated for
the airport. Given the high cost to maintain these programs, they generally require public/private
partnership and a funding mechanism. There are a wide variety of ways to construct a risk
mitigation program and are dependent on the needs and resources of the community. While risk
mitigation traditionally takes the form of minimum revenue guarantees (MRG) it can also
include a mix of other sources. In addition to MRGs, these can include travel bank or block seat
purchase programs.
Minimum Revenue Guarantees Revisited
This type of program will guarantee a specific amount of revenue to an airline over the course of
a contracted period. If the airline does not meet this guaranteed amount, then the community
makes a cash payment to cover the difference. How this is structured is negotiable. Some
carriers will require a guarantee that matches the full cost of the operation, plus a margin –
essentially assuming no risk. This is more common with markets that have no air service
history. Typically, however, the amount is based on a revenue forecast defined by both the
airline and the community. This allows some risk sharing between the airline and the
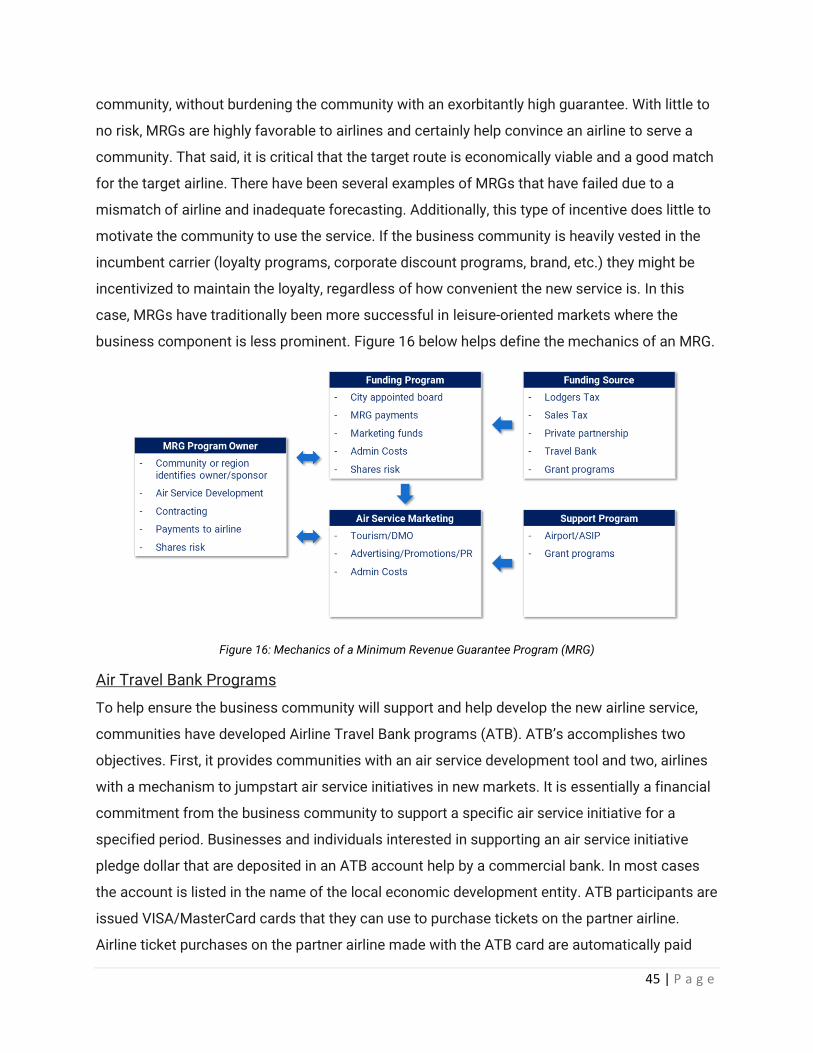
45 | P a g e
community, without burdening the community with an exorbitantly high guarantee. With little to
no risk, MRGs are highly favorable to airlines and certainly help convince an airline to serve a
community. That said, it is critical that the target route is economically viable and a good match
for the target airline. There have been several examples of MRGs that have failed due to a
mismatch of airline and inadequate forecasting. Additionally, this type of incentive does little to
motivate the community to use the service. If the business community is heavily vested in the
incumbent carrier (loyalty programs, corporate discount programs, brand, etc.) they might be
incentivized to maintain the loyalty, regardless of how convenient the new service is. In this
case, MRGs have traditionally been more successful in leisure-oriented markets where the
business component is less prominent. Figure 16 below helps define the mechanics of an MRG.
Figure 16: Mechanics of a Minimum Revenue Guarantee Program (MRG)
Air Travel Bank Programs
To help ensure the business community will support and help develop the new airline service,
communities have developed Airline Travel Bank programs (ATB). ATB’s accomplishes two
objectives. First, it provides communities with an air service development tool and two, airlines
with a mechanism to jumpstart air service initiatives in new markets. It is essentially a financial
commitment from the business community to support a specific air service initiative for a
specified period. Businesses and individuals interested in supporting an air service initiative
pledge dollar that are deposited in an ATB account help by a commercial bank. In most cases
the account is listed in the name of the local economic development entity. ATB participants are
issued VISA/MasterCard cards that they can use to purchase tickets on the partner airline.
Airline ticket purchases on the partner airline made with the ATB card are automatically paid

46 | P a g e
from business/individual ATB deposits. ATB funds are electronically restricted to payment for
tickets on the partner airline. ATBs are highly favored by airlines as they typically ‘commit’ the
business community to the service and ensure the service will be used.
Bulk Ticketing Agreements
Like ATBs, a bulk ticket agreement is a contract the airline maintains with businesses in the
community to commit to a certain level of spend over a given period. The airline will guarantee
the seats for the business and ‘block’ them. The business then uses the block of seats over the
period (generally based on monthly allotments) and pre-pays for the seats. If the business does
not use the seats, the business forfeits the pre-payment. Usually, these seats are priced at a
negotiated level to provide incentive for the business, but also guarantee revenues for the
airline. As the air service develops and demand materializes, the seat block program can be
minimized and ultimately discontinued. Although, in most cases the businesses will still be
offered the negotiated fares if volume targets are maintained. Like an ATB, this helps commit
the business community to the service, but provides a more flexible option without a large
upfront commitment.
47 | P a g e
Section 5: Air Service Development
Air Service Development (ASD) is one of the most critical elements in the overall Air Service
Market Strategy. ASD encompasses leveraging airline data, external industry data, and other
economic trends to develop a profitable market strategy. ASD planners then forecast these
market opportunities - modeling expected changes in demand, fare, competitive capacity,
connectivity, or the macro environment. Once the network strategy is identified and forecasted,
ASD planners and the community will begin outreach with airline candidates and secure the air
service. The ASD forecasts are then used to forecast potential risk mitigation costs or minimum
revenue guarantee payouts and help to develop effective marketing plans.
Impact of Covid Pandemic
Given the events of 2020, the top priority for air service development must be a restoration of
service levels to pre-pandemic levels. However, until travel Covid-related restrictions are eased,
efforts to materially increase air service will be difficult. Demand for air service from New
Mexico compared to last year began to materially worsen versus the national average following
Independence Day. By August, a pattern of demand being down 10 points versus the national
average was established. The airlines reacted by scheduling less seats from New Mexico
starting after Labor Day. Prior to Labor Day, year-over-year capacity levels to New Mexico were
at or above the national average. By Labor Day, the airlines responded to that reduced demand
by supplying less capacity year-over-year than the national average, at the same negative 10-
point gap. The gap between the New Mexico and the national average is set to worsen
throughout the rest of 2020. Simply put, it is illogical for airlines to add capacity to New Mexico
when demand is suppressed by travel restrictions.
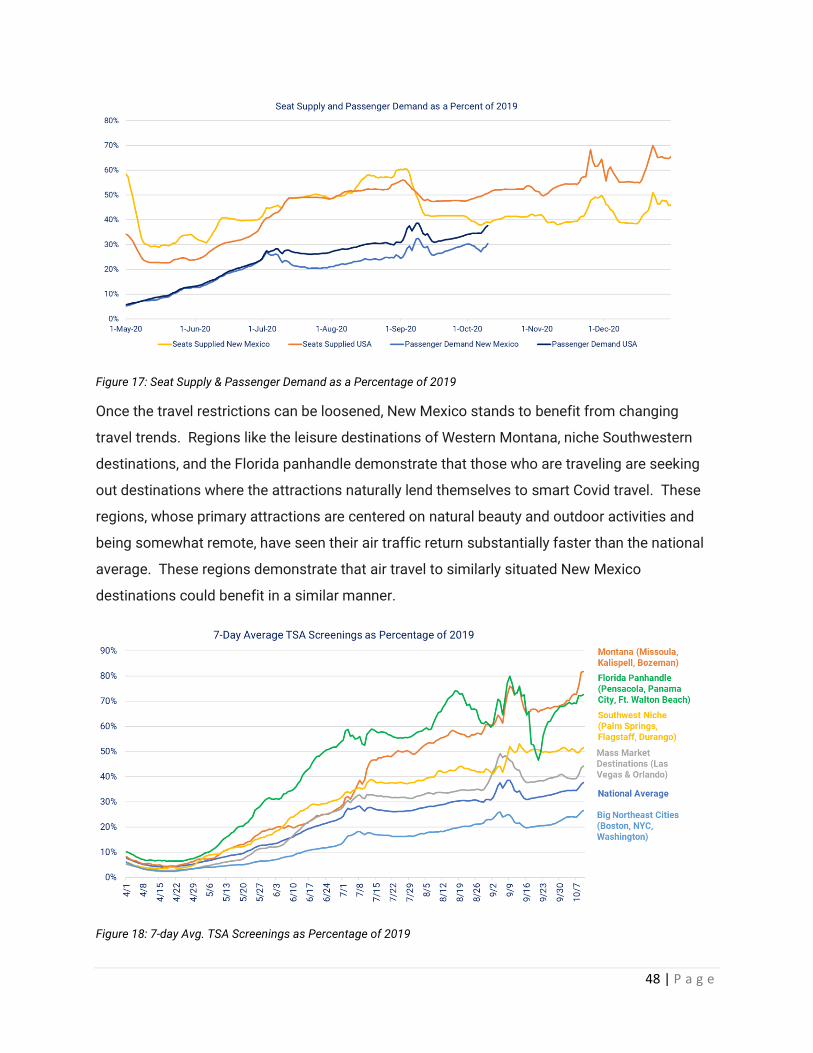
48 | P a g e
Figure 17: Seat Supply & Passenger Demand as a Percentage of 2019
Once the travel restrictions can be loosened, New Mexico stands to benefit from changing
travel trends. Regions like the leisure destinations of Western Montana, niche Southwestern
destinations, and the Florida panhandle demonstrate that those who are traveling are seeking
out destinations where the attractions naturally lend themselves to smart Covid travel. These
regions, whose primary attractions are centered on natural beauty and outdoor activities and
being somewhat remote, have seen their air traffic return substantially faster than the national
average. These regions demonstrate that air travel to similarly situated New Mexico
destinations could benefit in a similar manner.
Figure 18: 7-day Avg. TSA Screenings as Percentage of 2019
49 | P a g e
Air Service Development at Albuquerque International Sunport
The Sunport has been the gateway to New Mexico for decades. This position was entrenched
by Southwest Airlines and the ‘Southwest Effect’ – an airline industry term that refers to
Southwest’s once unique ability to gather passengers from a wide area around the airport it
served, encouraging some to drive long distances in exchange for low fares. Southwest’s focus
on developing of a point-to-point network, instead of large hubs, also benefited ABQ with
additional air service for years. Markets like Amarillo, Tucson, and Midland/Odessa, which did
not have enough volume to warrant nonstop jet flights on their own, became sustainable when
combined with low fares stimulating local markets and connections through ABQ to places
beyond to ensure flights attained satisfactory load factors.
After September 11th, 2001, demand for short-haul air travel declined significantly. New and
lengthy airport security procedures discouraged air travel in markets where other transportation
options exist, like road and rail. Around the same time, the convenience of road transportation
increased. Continuous development and maintenance of highway systems led to increased
speed limits – reducing travel times. Meanwhile, increasing safety and comfort features, and
improved fuel efficiency in cars made long drives more tolerable. Increasing costs, larger
aircraft, political and competitive shifts led Southwest to develop of hub-like structures at larger
airports all around ABQ, including Phoenix Sky Harbor International Airport, Denver International
Airport, and Dallas Love Airport. The Ultra-Low Cost Carrier model, pioneered in 2007 by
Allegiant and Spirit, pushed Southwest away from being THE national fare leader and towards a
high-value but not always lowest price offering, driving a new category of airline we have
defined as Value Carriers.
Although Southwest remains ABQ’s most dominant and influential airline, these developments
over the last twenty years have resulted in the termination of Southwest’s most unique services
from the Sunport. Its flights to places like Amarillo, Tucson, Tampa Bay, Midland/Odessa, St,
Louis, and El Paso have been suspended years ago as Southwest’s changing model more
efficiently flows traffic that once passed through ABQ via other airports, and the remaining local
traffic to Albuquerque lacked volume to fill the increasing average capacity of Southwest’s
aircraft. In fact, the only long-term sustainable services added by Southwest was Denver, added
in 2007 to support the carrier’s long-term development there.
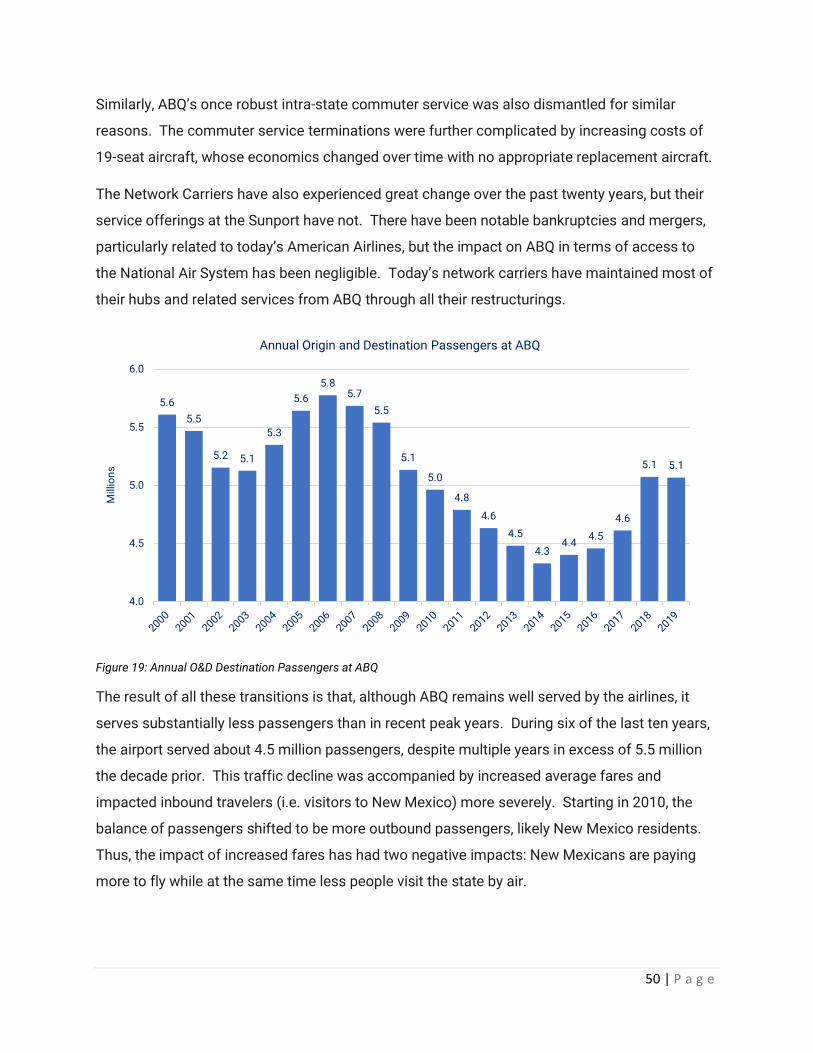
50 | P a g e
Similarly, ABQ’s once robust intra-state commuter service was also dismantled for similar
reasons. The commuter service terminations were further complicated by increasing costs of
19-seat aircraft, whose economics changed over time with no appropriate replacement aircraft.
The Network Carriers have also experienced great change over the past twenty years, but their
service offerings at the Sunport have not. There have been notable bankruptcies and mergers,
particularly related to today’s American Airlines, but the impact on ABQ in terms of access to
the National Air System has been negligible. Today’s network carriers have maintained most of
their hubs and related services from ABQ through all their restructurings.
Figure 19: Annual O&D Destination Passengers at ABQ
The result of all these transitions is that, although ABQ remains well served by the airlines, it
serves substantially less passengers than in recent peak years. During six of the last ten years,
the airport served about 4.5 million passengers, despite multiple years in excess of 5.5 million
the decade prior. This traffic decline was accompanied by increased average fares and
impacted inbound travelers (i.e. visitors to New Mexico) more severely. Starting in 2010, the
balance of passengers shifted to be more outbound passengers, likely New Mexico residents.
Thus, the impact of increased fares has had two negative impacts: New Mexicans are paying
more to fly while at the same time less people visit the state by air.
5.6
5.5
5.2 5.1
5.3
5.6
5.85.7
5.5
5.1
5.0
4.8
4.6
4.5
4.34.4
4.5
4.6
5.1 5.1
4.0
4.5
5.0
5.5
6.0
Mill
ion
s
Annual Origin and Destination Passengers at ABQ

51 | P a g e
Figure 20: Albuquerque Traffic vs. Fare Trend
This review of ABQ’s air service will focus on strategies to increase air service at the Sunport
through several types of initiatives. The resumption of previously sustained markets by
realigning market need and carrier business model will be reviewed. We will examine the
potential for growth of markets with existing service as well as efforts to develop air service to
international locations.
Review of Top Air Service Markets Air Service Development needs assessments begin with a review of top origin and destination
markets and a review of the related air services. The top markets from ABQ are well served. 18
of the Top 20 markets, as defined by Neilsen Designated Market Areas (DMA’s) have nonstop
flights, with many markets being served by more than one carrier and multiple carrier types. Of
the 18 markets with more than 100 Passengers per Day Each Way (PDEW), 16 receive nonstop
flights. The two holdouts on both lists are Washington, DC, and Boston. The lack of nonstop
Washington service is influenced by nonstop flights and traffic to Baltimore, widely understood
as an effective alternative to the two DC airports despite being in a separate DMA.
2,500
2,700
2,900
3,100
3,300
3,500
3,700
3,900
4,100
150
160
170
180
190
200
210
220
2004 2005 2006 2007 2008 2009 2010 2011 2012 2013 2014 2015 2016 2017 2018 2019
Pa
ss
en
ge
rs p
er
Da
y
Ave
rag
e F
are
(2
01
9 $
)Albuquerue Traffic vs. Fare Trend
Average Fare (Adjusted to 2019) Inbound Passengers Outbound Passengers

52 | P a g e
Albuquerque's Top Air Service Markets Nonstop Flights by Carrier Type
RK DMA/Country PDEW Inbound Percent
Inbound PDEW
Fare Network Value ULCC
1 Los Angeles 566 47% 268 $130
2 San Francisco-Oakland 422 51% 214 $146
3 Phoenix 386 51% 198 $129
4 Dallas-Ft. Worth 329 57% 189 $167
5 Las Vegas 300 24% 72 $112
6 Denver 293 52% 153 $115
7 New York 273 51% 139 $184
8 San Diego 239 40% 96 $105
9 Seattle 222 52% 115 $146
10 Houston 206 57% 117 $182
11 Chicago 197 51% 100 $203
12 Washington, DC 169 47% 79 $244
13 Austin 165 57% 94 $115
14 Baltimore 142 54% 76 $226
15 Portland, OR 141 54% 76 $153
16 Orlando 129 32% 41 $166
17 Atlanta 111 56% 61 $219
18 Boston 109 51% 56 $227
19 Salt Lake City 98 53% 52 $203
20 Minneapolis-St. Paul 83 56% 47 $206
21 Kansas City 82 51% 42 $197
22 San Antonio 77 49% 38 $153
23 Honolulu 76 20% 15 $310
24 Miami-Ft. Lauderdale 73 38% 28 $209
25 Philadelphia 66 55% 36 $234
26 Sacramento 63 58% 37 $180
27 Tampa-St. Petersburg 61 48% 29 $191
28 Mexico - Resorts 61 12% 7 $210
29 Nashville 57 46% 27 $189
30 New Orleans 49 36% 18 $171
Figure 21: ABQ's Top Air Service Markets
While air service development typically focuses on the top unserved markets, matching the
carrier business model to market needs will increase the likelihood of long-term success. Each
of the top 20 unserved markets have been evaluated for the likeliness of successful service
addition by a carrier in each the three carrier type groups to determine air service priorities and
carrier targets. Each potential market – carrier type combination was evaluated against the
following criteria:
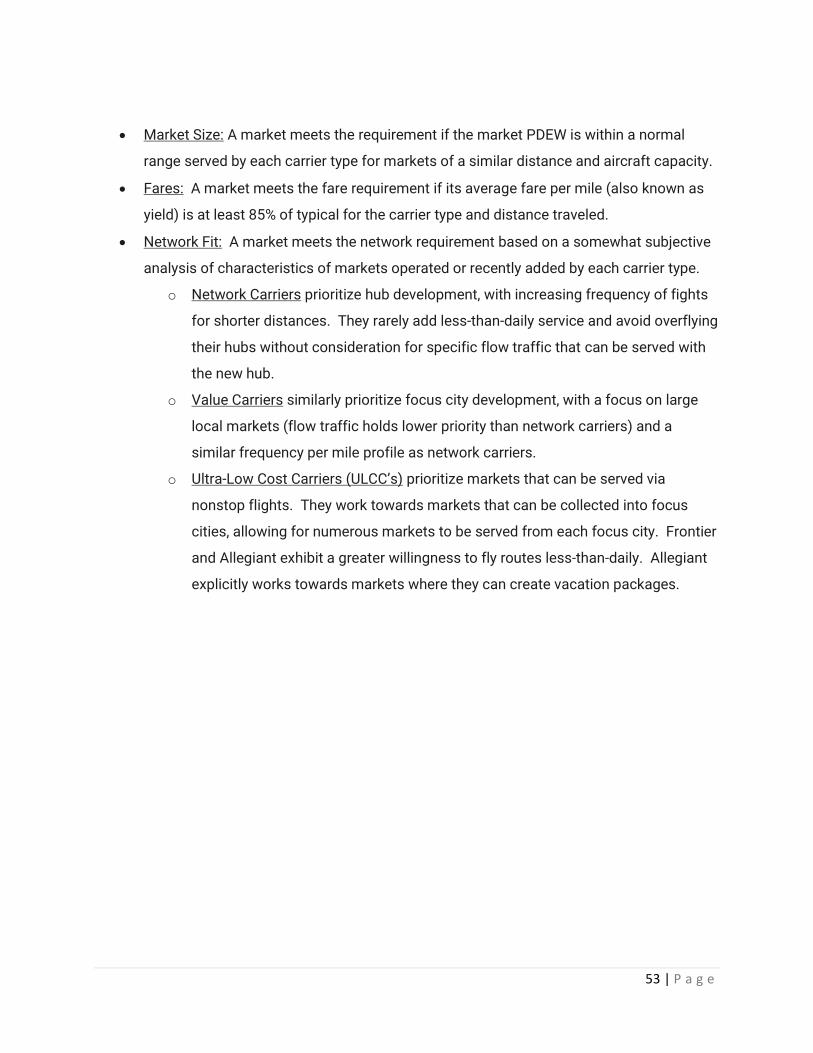
53 | P a g e
• Market Size: A market meets the requirement if the market PDEW is within a normal
range served by each carrier type for markets of a similar distance and aircraft capacity.
• Fares: A market meets the fare requirement if its average fare per mile (also known as
yield) is at least 85% of typical for the carrier type and distance traveled.
• Network Fit: A market meets the network requirement based on a somewhat subjective
analysis of characteristics of markets operated or recently added by each carrier type.
o Network Carriers prioritize hub development, with increasing frequency of fights
for shorter distances. They rarely add less-than-daily service and avoid overflying
their hubs without consideration for specific flow traffic that can be served with
the new hub.
o Value Carriers similarly prioritize focus city development, with a focus on large
local markets (flow traffic holds lower priority than network carriers) and a
similar frequency per mile profile as network carriers.
o Ultra-Low Cost Carriers (ULCC’s) prioritize markets that can be served via
nonstop flights. They work towards markets that can be collected into focus
cities, allowing for numerous markets to be served from each focus city. Frontier
and Allegiant exhibit a greater willingness to fly routes less-than-daily. Allegiant
explicitly works towards markets where they can create vacation packages.
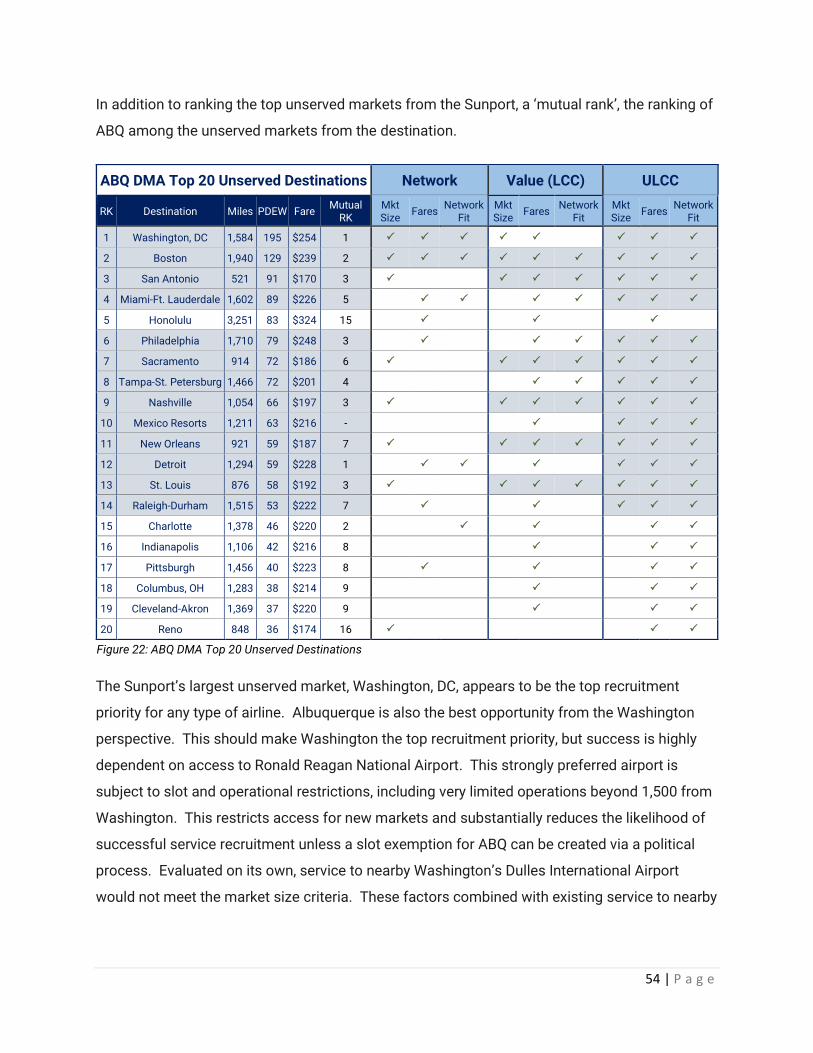
54 | P a g e
In addition to ranking the top unserved markets from the Sunport, a ‘mutual rank’, the ranking of
ABQ among the unserved markets from the destination.
The Sunport’s largest unserved market, Washington, DC, appears to be the top recruitment
priority for any type of airline. Albuquerque is also the best opportunity from the Washington
perspective. This should make Washington the top recruitment priority, but success is highly
dependent on access to Ronald Reagan National Airport. This strongly preferred airport is
subject to slot and operational restrictions, including very limited operations beyond 1,500 from
Washington. This restricts access for new markets and substantially reduces the likelihood of
successful service recruitment unless a slot exemption for ABQ can be created via a political
process. Evaluated on its own, service to nearby Washington’s Dulles International Airport
would not meet the market size criteria. These factors combined with existing service to nearby
ABQ DMA Top 20 Unserved Destinations Network Value (LCC) ULCC RK Destination Miles PDEW Fare Mutual
RK Mkt Size Fares Network
Fit Mkt Size Fares Network
Fit Mkt Size Fares Network
Fit 1 Washington, DC 1,584 195 $254 1
2 Boston 1,940 129 $239 2
3 San Antonio 521 91 $170 3
4 Miami-Ft. Lauderdale 1,602 89 $226 5
5 Honolulu 3,251 83 $324 15
6 Philadelphia 1,710 79 $248 3
7 Sacramento 914 72 $186 6
8 Tampa-St. Petersburg 1,466 72 $201 4
9 Nashville 1,054 66 $197 3
10 Mexico Resorts 1,211 63 $216 -
11 New Orleans 921 59 $187 7
12 Detroit 1,294 59 $228 1
13 St. Louis 876 58 $192 3
14 Raleigh-Durham 1,515 53 $222 7
15 Charlotte 1,378 46 $220 2
16 Indianapolis 1,106 42 $216 8
17 Pittsburgh 1,456 40 $223 8
18 Columbus, OH 1,283 38 $214 9
19 Cleveland-Akron 1,369 37 $220 9
20 Reno 848 36 $174 16
Figure 22: ABQ DMA Top 20 Unserved Destinations

55 | P a g e
Baltimore-Washington International Airport combine to make what seems like the highest
priority less likely and only a conditional target.
Given the challenges with recruiting Washington service, the top priorities for value carriers
become adding Boston, San Antonio, Nashville, and Sacramento, which are most likely to be
successful this Value Carriers. Twelve of the top thirteen unserved markets are appropriate for
the ULCC group, driven by their general willingness to consider markets with less-than-daily
frequency.
St. Louis is an interesting case, as it was previously served as part of the historic hub of TWA
and American Airlines operated there, and more recently as served by value carrier Southwest
Airlines. Later, we will discuss how mismatches between market characteristics and carrier
business models has resulted in service reductions, which occurred with St. Louis. In the short
term, only ULCC’s meet the criteria for a successful service launch, and the fact that value
carrier Southwest no longer serves this market validates this approach. However, as
Southwest’s focus city in St. Louis adds destinations and connecting opportunities, a future
return of Southwest to this market could be warranted.
Previously Served Markets from ABQ
Because of the unique history at ABQ, markets which were previously served but which have
been discontinued can be reexamined to determine the level to which a mismatch between
business model and market developed. In 2004, the nonstop flights offered to Tucson, El Paso,
and St. Louis were partially responsible for their inclusion in ABQ’s Top 30 Origin and
Destination (O&D) markets. Subsequent service suspensions from Tucson and El Paso were
directly related to evolved mismatch between the market needs and Southwest’s business
model, as were suspensions in smaller west Texas markets of Amarillo, Lubbock, and Midland-
Odessa. The St. Louis and Cincinnati service suspensions were related to network carrier hub
closures by American and Delta, respectively. Southwest backfilled American’s 2001 St. Louis
reduction until 2012, when its service stopped being viable.
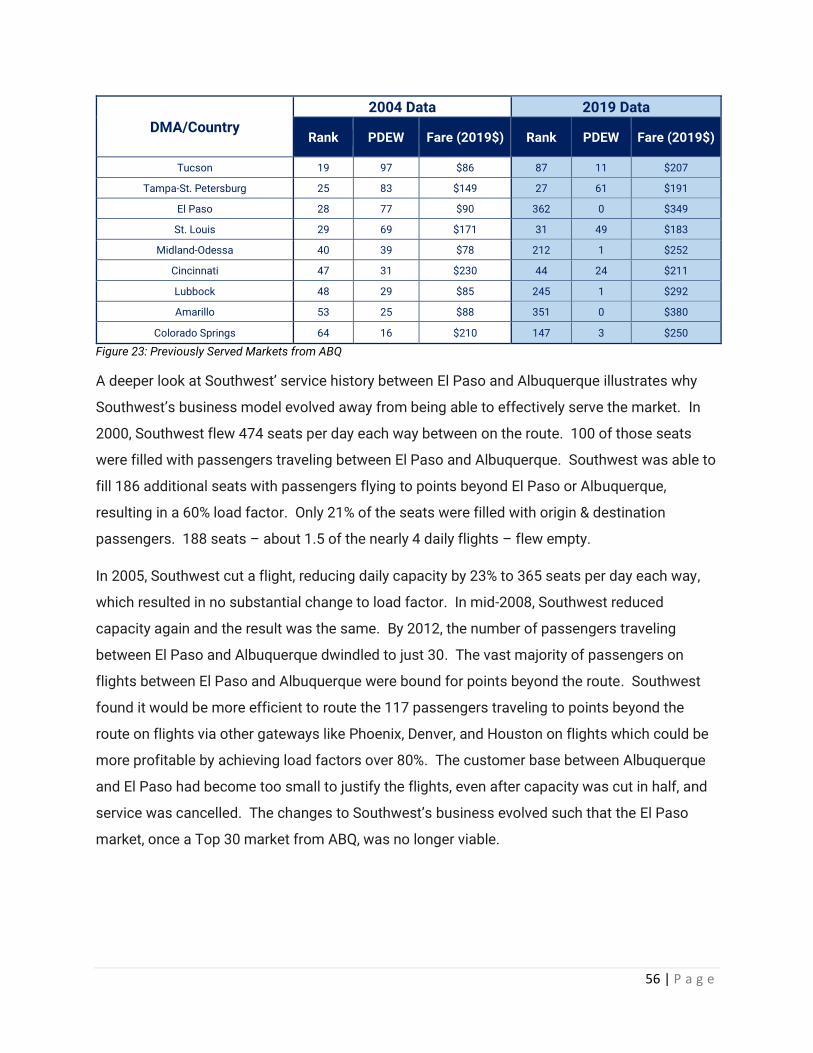
56 | P a g e
DMA/Country
2004 Data 2019 Data
Rank PDEW Fare (2019$) Rank PDEW Fare (2019$)
Tucson 19 97 $86 87 11 $207
Tampa-St. Petersburg 25 83 $149 27 61 $191
El Paso 28 77 $90 362 0 $349
St. Louis 29 69 $171 31 49 $183
Midland-Odessa 40 39 $78 212 1 $252
Cincinnati 47 31 $230 44 24 $211
Lubbock 48 29 $85 245 1 $292
Amarillo 53 25 $88 351 0 $380
Colorado Springs 64 16 $210 147 3 $250
Figure 23: Previously Served Markets from ABQ
A deeper look at Southwest’ service history between El Paso and Albuquerque illustrates why
Southwest’s business model evolved away from being able to effectively serve the market. In
2000, Southwest flew 474 seats per day each way between on the route. 100 of those seats
were filled with passengers traveling between El Paso and Albuquerque. Southwest was able to
fill 186 additional seats with passengers flying to points beyond El Paso or Albuquerque,
resulting in a 60% load factor. Only 21% of the seats were filled with origin & destination
passengers. 188 seats – about 1.5 of the nearly 4 daily flights – flew empty.
In 2005, Southwest cut a flight, reducing daily capacity by 23% to 365 seats per day each way,
which resulted in no substantial change to load factor. In mid-2008, Southwest reduced
capacity again and the result was the same. By 2012, the number of passengers traveling
between El Paso and Albuquerque dwindled to just 30. The vast majority of passengers on
flights between El Paso and Albuquerque were bound for points beyond the route. Southwest
found it would be more efficient to route the 117 passengers traveling to points beyond the
route on flights via other gateways like Phoenix, Denver, and Houston on flights which could be
more profitable by achieving load factors over 80%. The customer base between Albuquerque
and El Paso had become too small to justify the flights, even after capacity was cut in half, and
service was cancelled. The changes to Southwest’s business evolved such that the El Paso
market, once a Top 30 market from ABQ, was no longer viable.
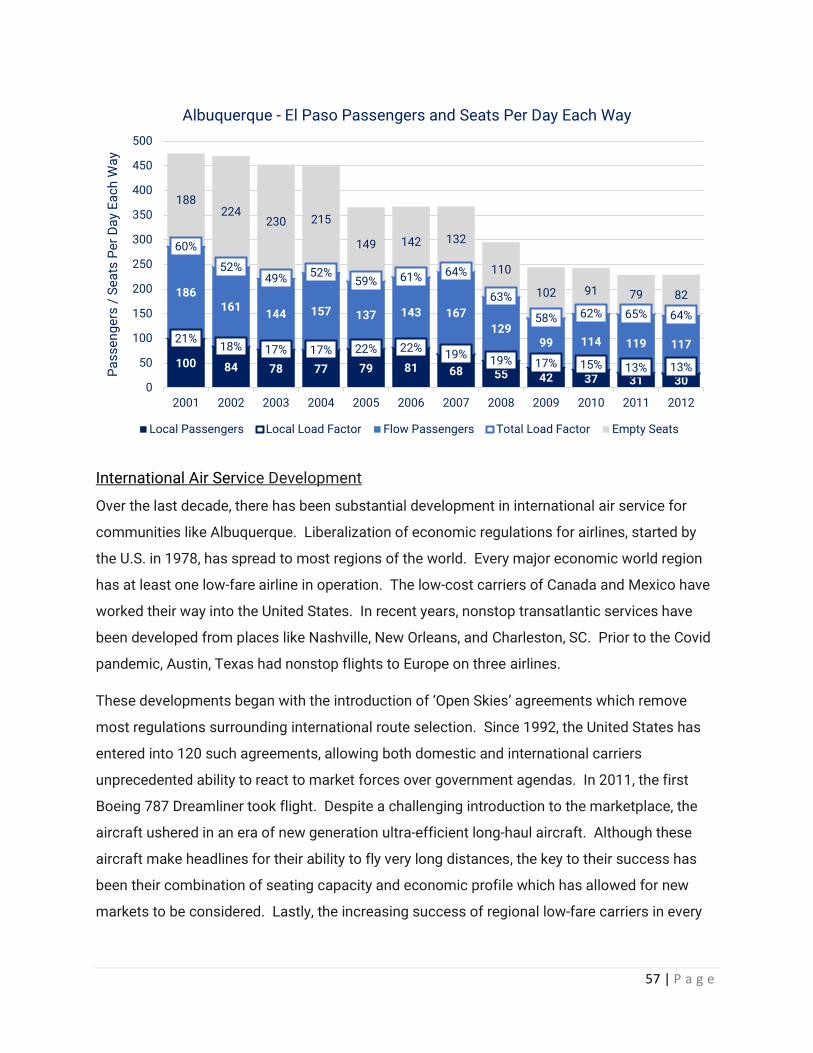
57 | P a g e
International Air Service Development
Over the last decade, there has been substantial development in international air service for
communities like Albuquerque. Liberalization of economic regulations for airlines, started by
the U.S. in 1978, has spread to most regions of the world. Every major economic world region
has at least one low-fare airline in operation. The low-cost carriers of Canada and Mexico have
worked their way into the United States. In recent years, nonstop transatlantic services have
been developed from places like Nashville, New Orleans, and Charleston, SC. Prior to the Covid
pandemic, Austin, Texas had nonstop flights to Europe on three airlines.
These developments began with the introduction of ‘Open Skies’ agreements which remove
most regulations surrounding international route selection. Since 1992, the United States has
entered into 120 such agreements, allowing both domestic and international carriers
unprecedented ability to react to market forces over government agendas. In 2011, the first
Boeing 787 Dreamliner took flight. Despite a challenging introduction to the marketplace, the
aircraft ushered in an era of new generation ultra-efficient long-haul aircraft. Although these
aircraft make headlines for their ability to fly very long distances, the key to their success has
been their combination of seating capacity and economic profile which has allowed for new
markets to be considered. Lastly, the increasing success of regional low-fare carriers in every
100 84 78 77 79 81 68 55 42 37 31 30
21%18% 17% 17% 22% 22%
19%19% 17% 15% 13% 13%
186161
144 157 137 143 167
12999 114 119 117
60%
52%49% 52%
59% 61% 64%
63%
58% 62% 65% 64%
188224
230 215
149 142 132
110
102 91 79 82
0
50
100
150
200
250
300
350
400
450
500
2001 2002 2003 2004 2005 2006 2007 2008 2009 2010 2011 2012
Pa
ss
en
ge
rs /
Se
ats
Pe
r D
ay
Ea
ch
Wa
yAlbuquerque - El Paso Passengers and Seats Per Day Each Way
Local Passengers Local Load Factor Flow Passengers Total Load Factor Empty Seats

58 | P a g e
developed region of the world, has led most to grow into countries neighboring their home and a
few into transoceanic services.
Figure 24: ABQ & SAF Intl. PDEW by Region
Today, the largest market for international air travel from ABQ is Europe, followed by Mexico, the
rest of Latin America, and Canada. Within Europe, the travel demand is quite dispersed, with the
four largest countries only accounting for slightly more than 50% of current demand. Although
the market for Mexico is large, over 70% of the air travel demand is leisure demand to resort
locations, such as Cabo San Lucas, Puerto Vallarta, and Cancun.
4034
20 16 146 2
81
25 37 71
51
8 6
0
20
40
60
80
100
120
140
Europe Canada EastAsia/South
Pacific
Mexico LatAm/Carib(ex Mexico)
MiddleEast/Central
Asia
Africa
Pa
ss
en
ge
rs p
er
Da
y
ABQ and SAF International Passengers per Day Each Way by Region
Outbound
Inbound
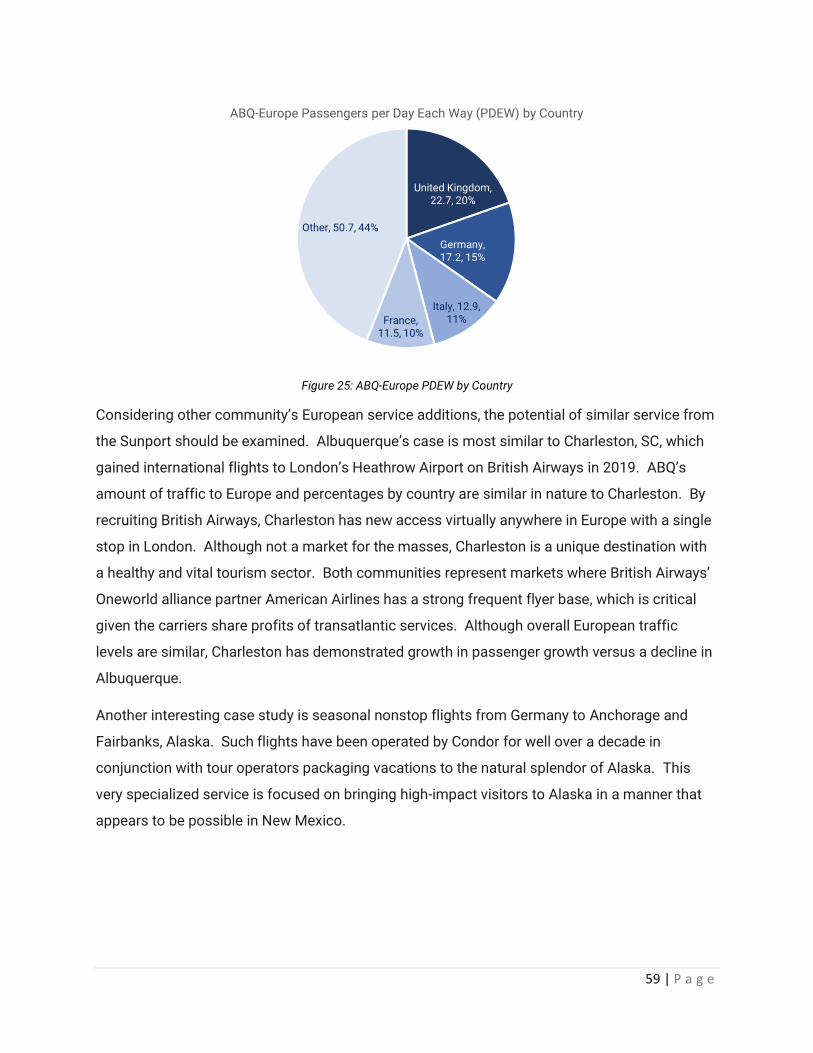
59 | P a g e
Figure 25: ABQ-Europe PDEW by Country
Considering other community’s European service additions, the potential of similar service from
the Sunport should be examined. Albuquerque’s case is most similar to Charleston, SC, which
gained international flights to London’s Heathrow Airport on British Airways in 2019. ABQ’s
amount of traffic to Europe and percentages by country are similar in nature to Charleston. By
recruiting British Airways, Charleston has new access virtually anywhere in Europe with a single
stop in London. Although not a market for the masses, Charleston is a unique destination with
a healthy and vital tourism sector. Both communities represent markets where British Airways’
Oneworld alliance partner American Airlines has a strong frequent flyer base, which is critical
given the carriers share profits of transatlantic services. Although overall European traffic
levels are similar, Charleston has demonstrated growth in passenger growth versus a decline in
Albuquerque.
Another interesting case study is seasonal nonstop flights from Germany to Anchorage and
Fairbanks, Alaska. Such flights have been operated by Condor for well over a decade in
conjunction with tour operators packaging vacations to the natural splendor of Alaska. This
very specialized service is focused on bringing high-impact visitors to Alaska in a manner that
appears to be possible in New Mexico.
United Kingdom, 22.7, 20%
Germany, 17.2, 15%
Italy, 12.9, 11%France,
11.5, 10%
Other, 50.7, 44%
ABQ-Europe Passengers per Day Each Way (PDEW) by Country
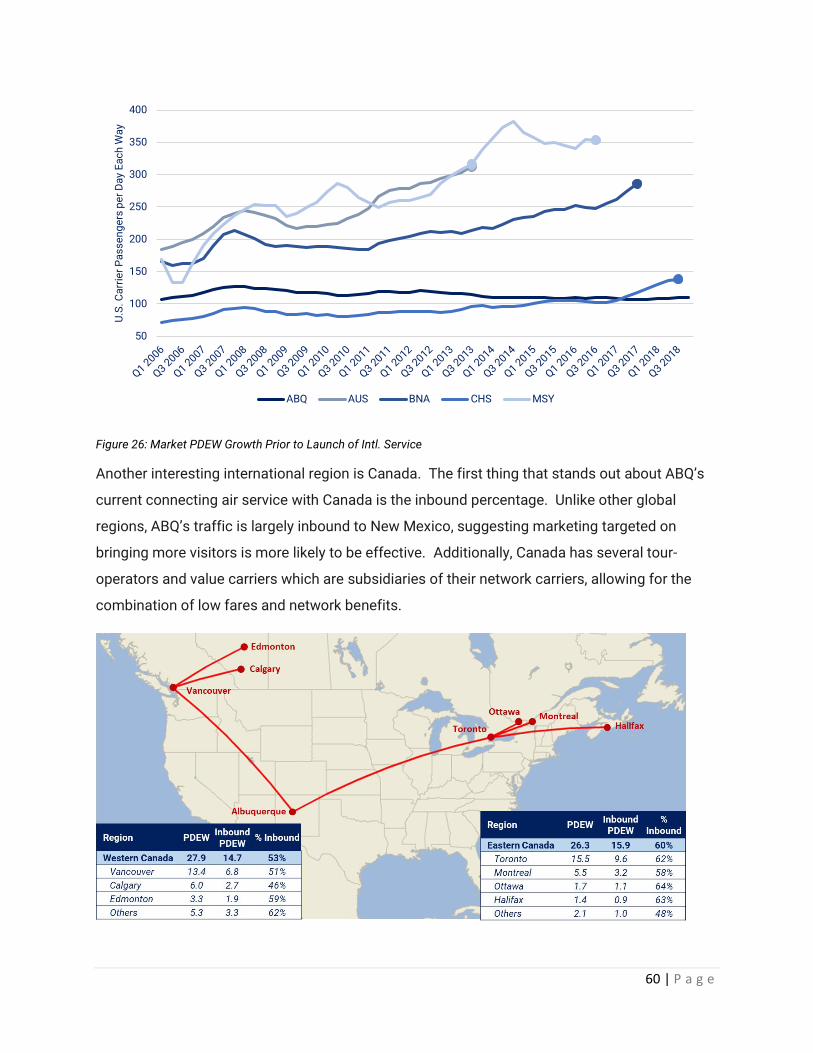
60 | P a g e
Figure 26: Market PDEW Growth Prior to Launch of Intl. Service
Another interesting international region is Canada. The first thing that stands out about ABQ’s
current connecting air service with Canada is the inbound percentage. Unlike other global
regions, ABQ’s traffic is largely inbound to New Mexico, suggesting marketing targeted on
bringing more visitors is more likely to be effective. Additionally, Canada has several tour-
operators and value carriers which are subsidiaries of their network carriers, allowing for the
combination of low fares and network benefits.
50
100
150
200
250
300
350
400U
.S. C
arr
ier
Pa
ss
en
ge
rs p
er
Da
y E
ac
h W
ay
ABQ AUS BNA CHS MSY

61 | P a g e
Part-135 On Demand Carrier Opportunities
When viewed through the lens of airline business models, efforts to attract and retain air service
can be refined to target the best matches between service need and provider. Further,
opportunities which merit individual consideration can be packaged together to create a larger
opportunity for potential carriers and a faster impact on the state.
One such package of markets involves short-haul non-hub routes from the Sunport. Markets
like El Paso no longer fit any of the big carrier business models. The network carriers have the
most appropriately sized aircraft to create the right service offering but are remain focused on
hub and focus-city development. Absent being considered in that view, network carriers are
unlikely to give any consideration to these types of markets. From the ULCC perspective, the
markets are too small, even with substantial low-fare stimulation, for the ULCC aircraft size.
These markets also require specific business-friendly departure times to be successful, often
ignored by the ULCC’s in favor of keeping costs low.
However, this situation is the exact niche of Part-135 On Demand Carriers. Some Part-135
carriers, including Contour Airlines and JSX, specifically seek these types of specialized
markets. By packaging opportunities together, the carrier gains efficiencies across fixed costs,
such as airport rentals and aircraft rents, being shared across markets. Further, it creates the
ability for such opportunities to be a semi-autonomous network, with lowered need to connect
to the carriers existing network and greater ability to justify investment in local resources such
as crew and maintenance bases.
Consider the following four markets from the Sunport: El Paso, Midland-Odessa, San Antonio,
and Tucson. Each is a market worthy of consideration on its own merits. Each is a market
which was previously served from ABQ or is a top unserved opportunity. In fact, we estimate
that each market could support one roundtrip flight per day utilizing 30-seat regional jets typical
of this business model, with long-term potential to grow. Because of the higher seat costs of
the smaller jets, historic traffic levels will not be attained as higher fare levels are required for
carrier profitability. Even so, the historic demand suggests each market has potential for
sufficient demand at required fare levels for success. Thus, these markets should be marketed
as individual opportunities to carriers in this category.

62 | P a g e
Forecast for Top 4 Regional Markets from ABQ
Destination Average
Fare PDEW
Annual Passengers
Revenue Potential
Daily Roundtrips
Load Factor
Tucson $169 18.8 13,735 $2,321,173 0.9 73%
El Paso $159 25.6 18,695 $2,972,560 1.0 85%
Midland/Odessa $159 14.4 10,477 $1,665,768 0.6 84%
San Antonio $174 24.3 17,761 $3,090,339 1.0 81%
Network $166 83.1 60,667 $10,049,840 3.4 81%
Figure 27: Market Forecast: Top 4 Regional ABQ Markets
Each of the markets has short-term potential to produce over 10,000 annual passengers at
profitable fare levels and healthy load factors. For carriers with operations at the Sunport or the
destination airports, adding a route to ‘connect-the-dots’ would be a top growth consideration.
Unfortunately, none of the Part 135 On-Demand operators currently operate at ABQ or the other
airports. Therefore, the ability to present and market them as a package of potential markets
with $10 mil in revenue potential is important.
Figure 28: Forecasted Regional ABQ Routes
ULCC Focus-City Development
Another option to structurally improve air access to New Mexico is to work with the ULCC’s
towards the development of a base at ABQ. All three of the ULCC’s have developed their
networks around focus cities – airports where they offer a range of flights which both increases
their marketplace relevance and keeps costs low. Focus cities are generally commercial in
nature, but often also support operational bases. An operational base may include domiciles
63 | P a g e
for pilots and/or flight attendants, maintenance services, and other operational support
functions for the airline.
Allegiant has a somewhat unique structure among the ULCC’s in this regard. Its commercial
focus on packaging air travel with hotel, ground transportation, and destination activities lead it
to form its initial focus cities in large destinations. Because they saw the potential to serve
dozens of locations from the focus city, they also created operational bases in at the same
airport to keep costs low. In recent years, Allegiant has developed smaller focus cities and
bases, where the host communities experience economic benefits from both the additional
visitors and increased local work force.
The other ULCC’s can generate similar focus-city visitor impact but are less likely to create a
multi-functional base in the same manner as Allegiant. However, as a single function base (e.g.,
aircraft maintenance) may be developed over time.
The key component to local ULCC employment bases is first establishing long-term viable ULCC
air service at the Sunport. Fortunately, ABQ has strong potential for ULCC development, as only
two of the three major ULCC’s currently land at the airport offering less than two daily flights
total. As reviewed earlier, thirteen of the top twenty unserved markets show indications that
new ULCC service can be achieved and successful. Similarly, nine of the markets which are
currently served nonstop from the Sunport have potential for service to be added by a ULCC.
Like the analysis of top unserved markets, each market with service from ABQ was analyzed for
the conditions in which an additional carrier of each business model would the market. These
conditions included an evaluation of the market size, fare environment, and network fit of
potential new flights. Eight of the top ten ABQ markets with service are candidates for ULCC
flights, two of which already receive them. Consider the case of Phoenix, which is a larger
market than Denver situated a similar distance from Albuquerque. Average fare to Denver is
slightly lower, thanks to the ULCC service provided by Frontier in that market. If ULCC service
were to be added to Phoenix, average fare would decline while adding traffic, potentially
returning Phoenix to the top market from ABQ as it had been in the past.
When combined, the ULCC opportunities among the top unserved markets and markets with
other carrier types represents a substantial opportunity for New Mexico and the carriers that
choose to service the markets. With 22 markets showing potential for ULCC service from the
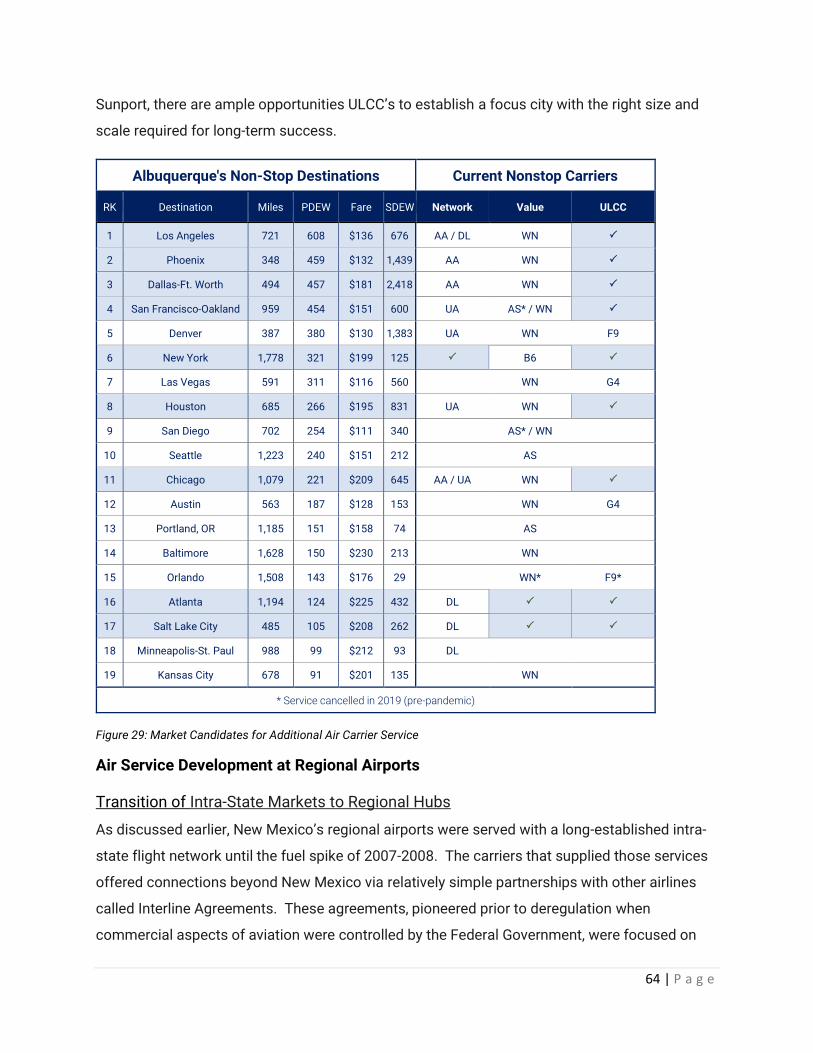
64 | P a g e
Sunport, there are ample opportunities ULCC’s to establish a focus city with the right size and
scale required for long-term success.
Albuquerque's Non-Stop Destinations Current Nonstop Carriers RK Destination Miles PDEW Fare SDEW Network Value ULCC 1 Los Angeles 721 608 $136 676 AA / DL WN 2 Phoenix 348 459 $132 1,439 AA WN 3 Dallas-Ft. Worth 494 457 $181 2,418 AA WN 4 San Francisco-Oakland 959 454 $151 600 UA AS* / WN 5 Denver 387 380 $130 1,383 UA WN F9 6 New York 1,778 321 $199 125 B6 7 Las Vegas 591 311 $116 560 WN G4 8 Houston 685 266 $195 831 UA WN 9 San Diego 702 254 $111 340 AS* / WN
10 Seattle 1,223 240 $151 212 AS
11 Chicago 1,079 221 $209 645 AA / UA WN 12 Austin 563 187 $128 153 WN G4 13 Portland, OR 1,185 151 $158 74 AS
14 Baltimore 1,628 150 $230 213 WN
15 Orlando 1,508 143 $176 29 WN* F9* 16 Atlanta 1,194 124 $225 432 DL 17 Salt Lake City 485 105 $208 262 DL 18 Minneapolis-St. Paul 988 99 $212 93 DL
19 Kansas City 678 91 $201 135 WN
* Service cancelled in 2019 (pre-pandemic) Figure 29: Market Candidates for Additional Air Carrier Service
Air Service Development at Regional Airports
Transition of Intra-State Markets to Regional Hubs
As discussed earlier, New Mexico’s regional airports were served with a long-established intra-
state flight network until the fuel spike of 2007-2008. The carriers that supplied those services
offered connections beyond New Mexico via relatively simple partnerships with other airlines
called Interline Agreements. These agreements, pioneered prior to deregulation when
commercial aspects of aviation were controlled by the Federal Government, were focused on
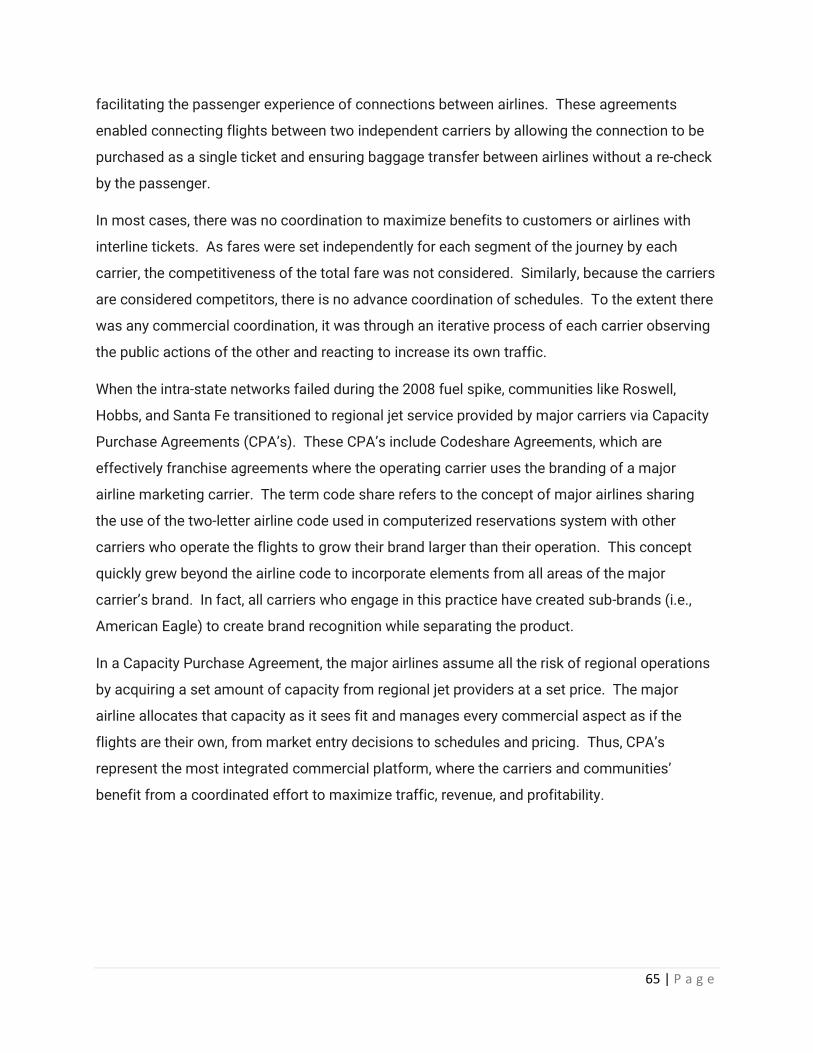
65 | P a g e
facilitating the passenger experience of connections between airlines. These agreements
enabled connecting flights between two independent carriers by allowing the connection to be
purchased as a single ticket and ensuring baggage transfer between airlines without a re-check
by the passenger.
In most cases, there was no coordination to maximize benefits to customers or airlines with
interline tickets. As fares were set independently for each segment of the journey by each
carrier, the competitiveness of the total fare was not considered. Similarly, because the carriers
are considered competitors, there is no advance coordination of schedules. To the extent there
was any commercial coordination, it was through an iterative process of each carrier observing
the public actions of the other and reacting to increase its own traffic.
When the intra-state networks failed during the 2008 fuel spike, communities like Roswell,
Hobbs, and Santa Fe transitioned to regional jet service provided by major carriers via Capacity
Purchase Agreements (CPA’s). These CPA’s include Codeshare Agreements, which are
effectively franchise agreements where the operating carrier uses the branding of a major
airline marketing carrier. The term code share refers to the concept of major airlines sharing
the use of the two-letter airline code used in computerized reservations system with other
carriers who operate the flights to grow their brand larger than their operation. This concept
quickly grew beyond the airline code to incorporate elements from all areas of the major
carrier’s brand. In fact, all carriers who engage in this practice have created sub-brands (i.e.,
American Eagle) to create brand recognition while separating the product.
In a Capacity Purchase Agreement, the major airlines assume all the risk of regional operations
by acquiring a set amount of capacity from regional jet providers at a set price. The major
airline allocates that capacity as it sees fit and manages every commercial aspect as if the
flights are their own, from market entry decisions to schedules and pricing. Thus, CPA’s
represent the most integrated commercial platform, where the carriers and communities’
benefit from a coordinated effort to maximize traffic, revenue, and profitability.
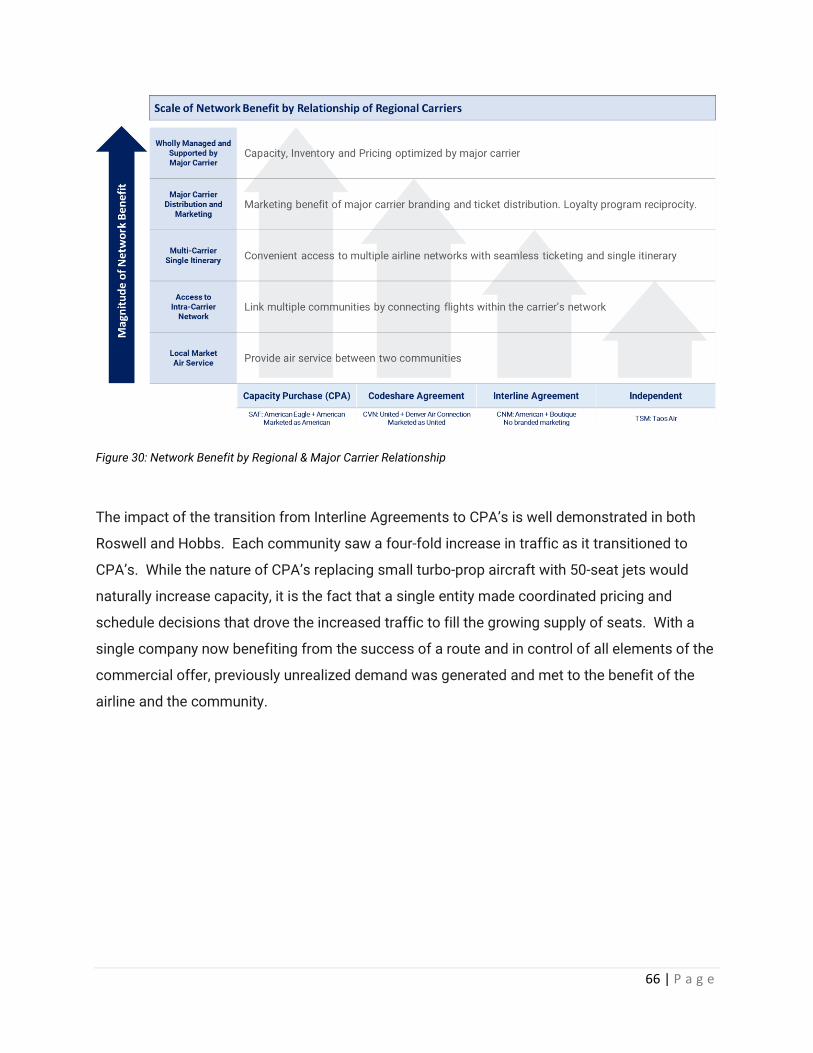
66 | P a g e
Figure 30: Network Benefit by Regional & Major Carrier Relationship
The impact of the transition from Interline Agreements to CPA’s is well demonstrated in both
Roswell and Hobbs. Each community saw a four-fold increase in traffic as it transitioned to
CPA’s. While the nature of CPA’s replacing small turbo-prop aircraft with 50-seat jets would
naturally increase capacity, it is the fact that a single entity made coordinated pricing and
schedule decisions that drove the increased traffic to fill the growing supply of seats. With a
single company now benefiting from the success of a route and in control of all elements of the
commercial offer, previously unrealized demand was generated and met to the benefit of the
airline and the community.
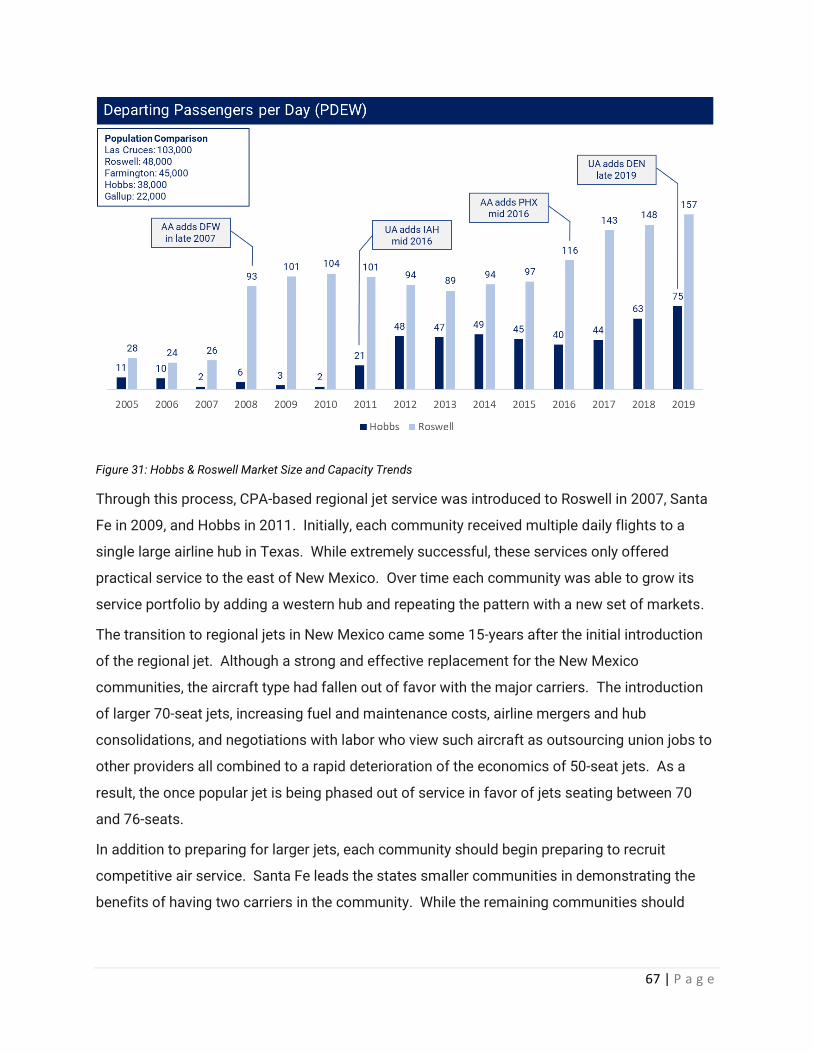
67 | P a g e
Figure 31: Hobbs & Roswell Market Size and Capacity Trends
Through this process, CPA-based regional jet service was introduced to Roswell in 2007, Santa
Fe in 2009, and Hobbs in 2011. Initially, each community received multiple daily flights to a
single large airline hub in Texas. While extremely successful, these services only offered
practical service to the east of New Mexico. Over time each community was able to grow its
service portfolio by adding a western hub and repeating the pattern with a new set of markets.
The transition to regional jets in New Mexico came some 15-years after the initial introduction
of the regional jet. Although a strong and effective replacement for the New Mexico
communities, the aircraft type had fallen out of favor with the major carriers. The introduction
of larger 70-seat jets, increasing fuel and maintenance costs, airline mergers and hub
consolidations, and negotiations with labor who view such aircraft as outsourcing union jobs to
other providers all combined to a rapid deterioration of the economics of 50-seat jets. As a
result, the once popular jet is being phased out of service in favor of jets seating between 70
and 76-seats.
In addition to preparing for larger jets, each community should begin preparing to recruit
competitive air service. Santa Fe leads the states smaller communities in demonstrating the
benefits of having two carriers in the community. While the remaining communities should

68 | P a g e
seek to emulate Santa Fe’s service to at least Phoenix, Denver, and one hub in Texas, Santa Fe
can likely develop services beyond those hubs.
Essential Air Service Markets
In New Mexico, air service to the communities of Clovis, Carlsbad, and Silver City are subsidized
through the Essential Air Service (EAS) program administered by the U.S. Department of
Transportation. The existence of the EAS program is continually challenged by funding and
legislative concerns. Thus, each community and the State need to be prepared for the air travel
needs should this program be materially changed.
Until 2005, the New Mexico EAS communities made up a portion of the intra-state network
operated by Mesa Airlines. Although only three communities were subsidized, the programs’
contribution to covering the fixed cost base of Mesa’s ABQ network benefited every New
Mexico community. Through the DOT’s normal competitive bid process, the EAS markets were
awarded to Great Lakes Aviation in 2006. As fuel spiked in 2007-2008, Mesa terminated the
remaining ‘at-risk’ intra-state markets as reviewed earlier. Had Mesa remained the EAS carrier,
more of the intra-state network may have made the transition to Part 135 carriers.
Like the transition of ‘at-risk’ markets to 50-seat jets discussed above, EAS communities across
the U.S. demonstrate the potential for codeshare and CPA services within the program (see
Figure 32). Numerous EAS communities have successfully transitions to jets while also
reducing the need for subsidization. In fact, some EAS communities such as Joplin, MO and
Manhattan, KS have achieved commercial success and been removed from the program.
Figure 32: Essential Air Service Transitions
69 | P a g e
The potential to adjust EAS in southern New Mexico is high. The current traffic base from Silver
City and Carlsbad is like other markets throughout the country which have moved into 50-seat
jets in CPA or codeshare programs with major carriers that have generated substantial traffic
growth. Further, coordination between the communities would allow for a single carrier to
combine both markets into a combined service where each community receives service to two
hubs to the east and west.
Restoration of Air Services
Since the intra-state network was dissolved in 2007, several communities have lost air service
altogether. Each of these communities has significant tourism assets under long-term
development and suffer from being difficult to reach. Farmington, Gallup, Taos, and Las Cruces
should be prioritized for restoration of air service. The Part 135 carriers, potentially in
partnership with the state, are likely the best to demonstrate market potential over time.
Although Farmington has recently had flights from Denver restored, it is likely to remain
underserved compared to its historic traffic levels. In the short term, SkyWest operating as a
codeshare service will only offer 73,000 seats per year – roughly half the number of passengers
who flew through Four Corners Regional Airport in 1996. Further, we know that implementation
of codeshare-based regional jet service grows demand. While initial demand will be defined in
the coming months, we anticipate it will demonstrate greater potential for FMN, including the
pattern of adding a second service to the service offering at the airport.
Taos Air represents a unique project to restore air service in northern New Mexico. The
developers of Taos Ski Valley have recognized the importance of air access and have therefore
created a virtual airline. Although Taos Air is designed to specifically to support the resort in the
short-term, it is also intended to assist traditional long-term air service development by
demonstrating that demand for air travel exists today and create passenger data for use by
traditional airlines over time. Anecdotally, we know the impact of Taos Air goes further than
Taos Ski Valley, with use by visitors to reach other areas of the Enchanted Circle and by area
residents.
Part 135 Scheduled Carrier Intrastate Network
From the mid 1980’s until 2007, Farmington-based Mesa Air Shuttle and its corporate
successors flew at-risk and federally subsidized Essential Air Service flights from ABQ to
communities across New Mexico. As recently as 2004, that network generated nearly 50,000
passengers. In 2006, the Essential Air Service communities of Carlsbad and Clovis selected
70 | P a g e
Great Lakes Aviation to replace Mesa subsidiary Air Midwest as their provider. Mesa continued
forward with its at-risk markets until the end of 2007, when broader issues caused Mesa to
closedown Air Midwest including the cancellation of all flights within New Mexico. Mesa cited
soaring fuel costs (which reached a record high in 2008) and increasing maintenance costs of
its 19-seat Beech 1900 fleet.
Following the termination of services by Air Midwest, Roswell quickly recruited American Eagle
flights to Dallas/Ft. Worth. Great Lakes continued with its Essential Air Services from ABQ as
well as Farmington service to Denver it had started a few years earlier. Other communities,
including Hobbs, simply went without air service for a time. As the fuel price crisis subsided, no
carrier showed any interest in resuming the former Mesa at-risk network. Although Great Lakes
had the highest potential to replace the service, having already secured the subsidized Essential
Air Service, its financial situation had also deteriorated and faced similar challenges to Mesa’s
subsidiary. Ultimately, Great Lakes ceased operations after failing to adapt to new pilot training,
rest, and experience regulations which drove a shortage of regional airline pilots.
Despite all the challenges of the operators, the intrastate routes of Mesa and Great Lakes
generated nearly 50,000 passengers as recently as 2005. A decade earlier, the intrastate
operation supported over 180,000 annual passengers. As most communities did not have
service outside of New Mexico, substantial numbers of those passengers were likely continuing
beyond Albuquerque in a manner we cannot calculate as there is no proper public data source.
Farmington, however, helps illustrate the potential of an intrastate network. In 2006, Mesa
carried nearly 10,000 passengers to and from Albuquerque despite Farmington’s other services
to Phoenix and Denver. Although we cannot demonstrate exact traffic, this suggests there was
significant demand for air travel to Albuquerque.
While it is difficult to separate historic regional airport traffic destined to the Sunport versus
continuing to the world beyond, there are new mechanisms to estimate such traffic. Surveys
which geo-target cells phone and similar devices can help define the total number of people
from rural New Mexico traveling to Albuquerque. Further, this technology may be able to help
identify new travel trends, such as the amount of rural New Mexico travel to Santa Fe.
Further, today’s Part 135 Scheduled carriers are quite different from the commuter carriers they
have replaced. By operating 9-seat aircraft, these unique carriers can offer the same capacity
with double the flights per day, increasing schedule convenience to passengers. They can
71 | P a g e
invest in new aircraft technology such as the Tecnam P2012 Traveler and experimental electric-
powered Grand Caravans. Because they fall under different pilot regulations, Part 135 carriers
able to be a part of the solution to the recent regional pilot shortages instead of the victim.
Ground Transportation Challenges
In three communities air service development is severely handicapped by a lack of reliable
ground transportation options. Before developing air service marketing programs, a ground
transportation solution will need to be realized in Carlsbad, Silver City, and eventually Las
Cruces. The Grant County airport serving Silver City is located roughly 20 miles away from the
nearest car rental office. Historically, the airport supported an onsite rental car office, however,
existing passenger demand has made that uneconomical.
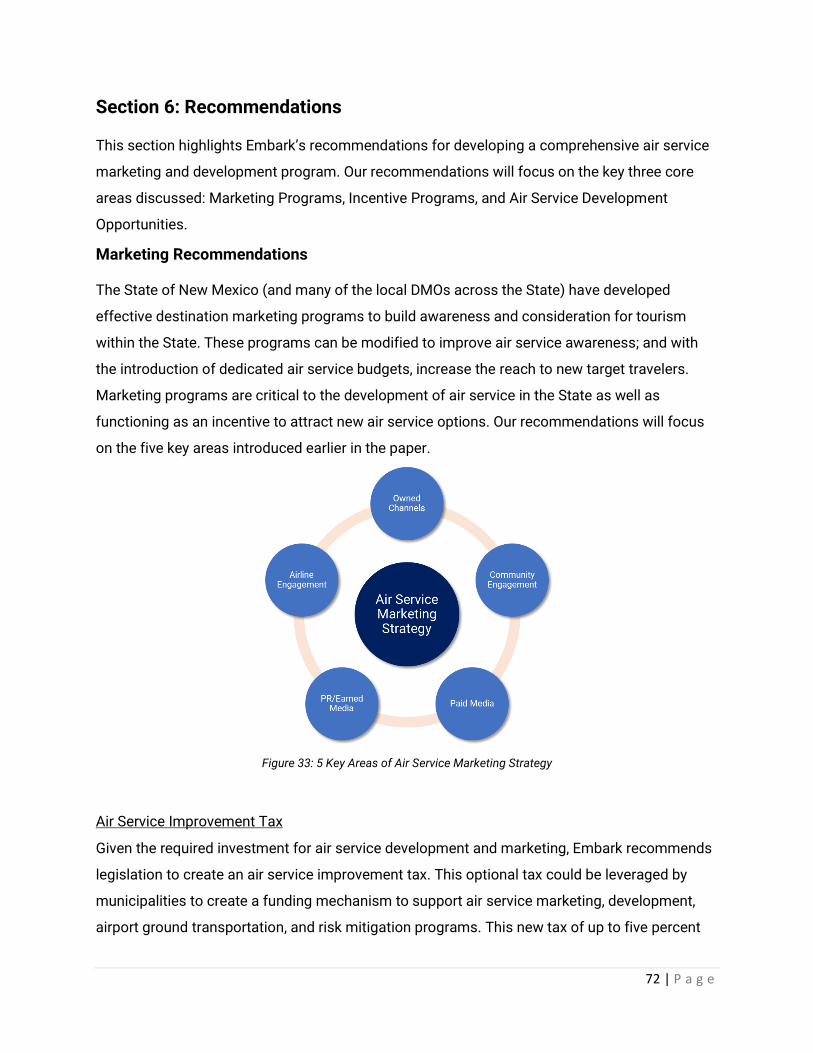
72 | P a g e
Section 6: Recommendations
This section highlights Embark’s recommendations for developing a comprehensive air service
marketing and development program. Our recommendations will focus on the key three core
areas discussed: Marketing Programs, Incentive Programs, and Air Service Development
Opportunities.
Marketing Recommendations
The State of New Mexico (and many of the local DMOs across the State) have developed
effective destination marketing programs to build awareness and consideration for tourism
within the State. These programs can be modified to improve air service awareness; and with
the introduction of dedicated air service budgets, increase the reach to new target travelers.
Marketing programs are critical to the development of air service in the State as well as
functioning as an incentive to attract new air service options. Our recommendations will focus
on the five key areas introduced earlier in the paper.
Figure 33: 5 Key Areas of Air Service Marketing Strategy
Air Service Improvement Tax
Given the required investment for air service development and marketing, Embark recommends
legislation to create an air service improvement tax. This optional tax could be leveraged by
municipalities to create a funding mechanism to support air service marketing, development,
airport ground transportation, and risk mitigation programs. This new tax of up to five percent

73 | P a g e
(on goods and services to be determined) would be developed based on forecasted program
costs for air service marketing, development, airport ground transportation, and risk mitigation
programs. These additional funding mechanisms could require matching contributions from
other funding sources in the public and private sector to ensure local support from the
communities. Regional communities that surround an air service community could also be
eligible for this optional tax if a regional air service marketing organization is formed to support
air service.
While these taxes may seem excessively high, air service will stimulate significantly more
visitors then realized today and will likely stay multiple nights. Additionally, air travel visitors
have larger discretionary income, so they will spend more in the community. While it may
appear uncomfortable today, air service will drive higher demand for accommodations, tourism
activities, restaurants, shopping, and other economic activities.
Owned Channel Messaging
The State and each community with airline service should complete an audit of all owned
channel materials. This would include City, Tourism, Chamber of Commerce, Economic
Development, or any other relevant channel. Any material that discusses ‘how to get to’ the
community should lead with air service messaging. Prominent home page or other website
placements should also be added to promote air service access. Sample messaging can
include:
Fly non-stop to Silver City on Advanced Airlines from Albuquerque or Phoenix. Easy connections are available at Albuquerque to cities worldwide. Book your flights to Silver City at www.advancedairlines.com, your preferred travel agency, Expedia, Travelocity, or Orbitz.
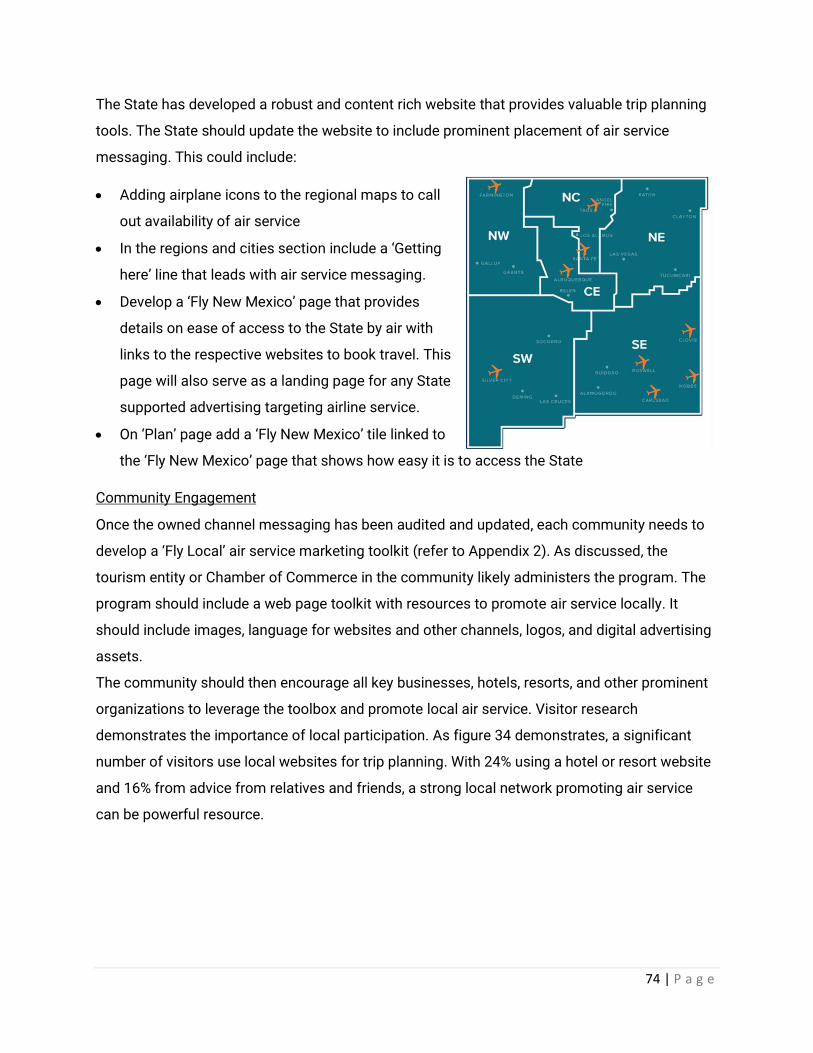
74 | P a g e
The State has developed a robust and content rich website that provides valuable trip planning
tools. The State should update the website to include prominent placement of air service
messaging. This could include:
• Adding airplane icons to the regional maps to call
out availability of air service
• In the regions and cities section include a ‘Getting
here’ line that leads with air service messaging.
• Develop a ‘Fly New Mexico’ page that provides
details on ease of access to the State by air with
links to the respective websites to book travel. This
page will also serve as a landing page for any State
supported advertising targeting airline service.
• On ‘Plan’ page add a ‘Fly New Mexico’ tile linked to
the ‘Fly New Mexico’ page that shows how easy it is to access the State
Community Engagement
Once the owned channel messaging has been audited and updated, each community needs to
develop a ‘Fly Local’ air service marketing toolkit (refer to Appendix 2). As discussed, the
tourism entity or Chamber of Commerce in the community likely administers the program. The
program should include a web page toolkit with resources to promote air service locally. It
should include images, language for websites and other channels, logos, and digital advertising
assets.
The community should then encourage all key businesses, hotels, resorts, and other prominent
organizations to leverage the toolbox and promote local air service. Visitor research
demonstrates the importance of local participation. As figure 34 demonstrates, a significant
number of visitors use local websites for trip planning. With 24% using a hotel or resort website
and 16% from advice from relatives and friends, a strong local network promoting air service
can be powerful resource.

75 | P a g e
Figure 34: Trip Planning Information Sources
To incentivize participation, the State could develop a grant program that matches the value of
air service in-kind marketing efforts with State funds that can be used for air service marketing
initiatives in a community.
Paid Media
Embark recommends developing paid advertising programs in communities that have
established air service. In addition to being used to expand and develop existing services, these
advertising programs will be critical components for a robust airline incentive program.
Since the DMO already has marketing programs in place to attract visitors, Embark
recommends the DMO initially own air service marketing for the community. This will include
planning for both the inbound market, the local market, and assisting the airport in the
development of an Air Service Incentive Program. While this seems counter intuitive at the local
level, the DMO likely has the planning and agency resources to more efficiently and cost
effectively deliver a program. From a funding perspective, additional funding allocations will
need to be resourced to accommodate spend focused on air service, especially since dollars
will need to be focused locally. That said, if the community has well developed owned channel
and community engagement programs in place, local spend can be quite nominal.
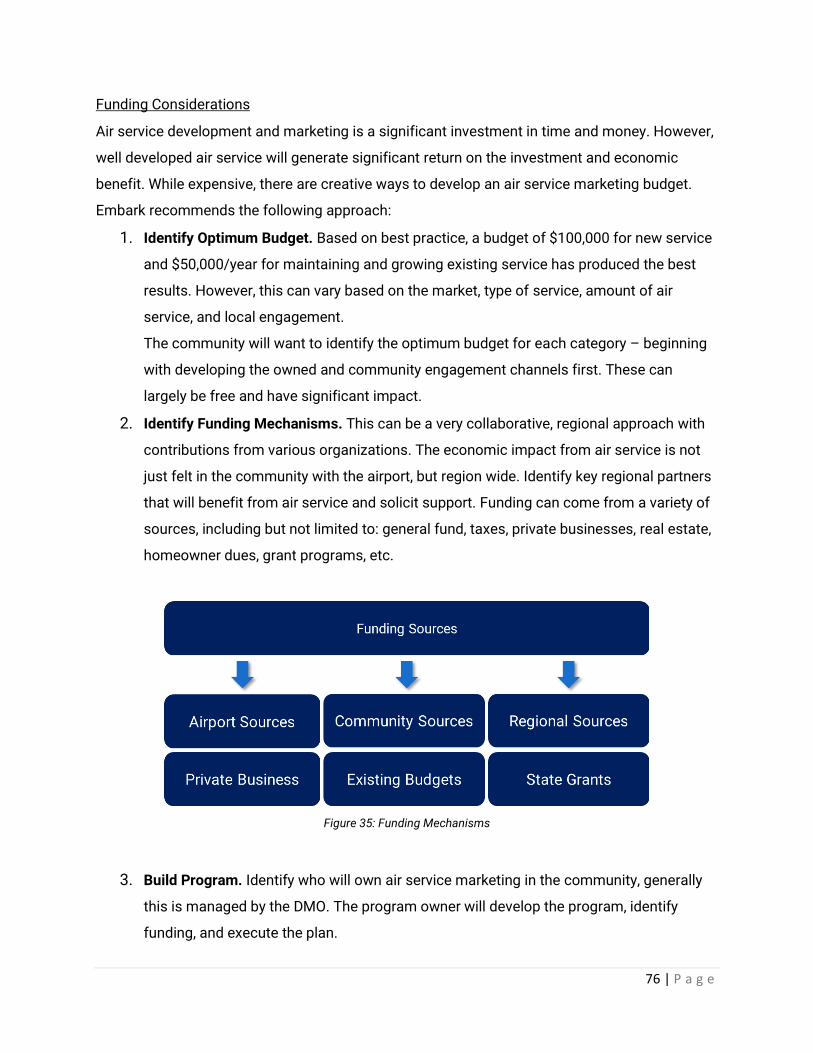
76 | P a g e
Funding Considerations
Air service development and marketing is a significant investment in time and money. However,
well developed air service will generate significant return on the investment and economic
benefit. While expensive, there are creative ways to develop an air service marketing budget.
Embark recommends the following approach:
1. Identify Optimum Budget. Based on best practice, a budget of $100,000 for new service
and $50,000/year for maintaining and growing existing service has produced the best
results. However, this can vary based on the market, type of service, amount of air
service, and local engagement.
The community will want to identify the optimum budget for each category – beginning
with developing the owned and community engagement channels first. These can
largely be free and have significant impact.
2. Identify Funding Mechanisms. This can be a very collaborative, regional approach with
contributions from various organizations. The economic impact from air service is not
just felt in the community with the airport, but region wide. Identify key regional partners
that will benefit from air service and solicit support. Funding can come from a variety of
sources, including but not limited to: general fund, taxes, private businesses, real estate,
homeowner dues, grant programs, etc.
Figure 35: Funding Mechanisms
3. Build Program. Identify who will own air service marketing in the community, generally
this is managed by the DMO. The program owner will develop the program, identify
funding, and execute the plan.
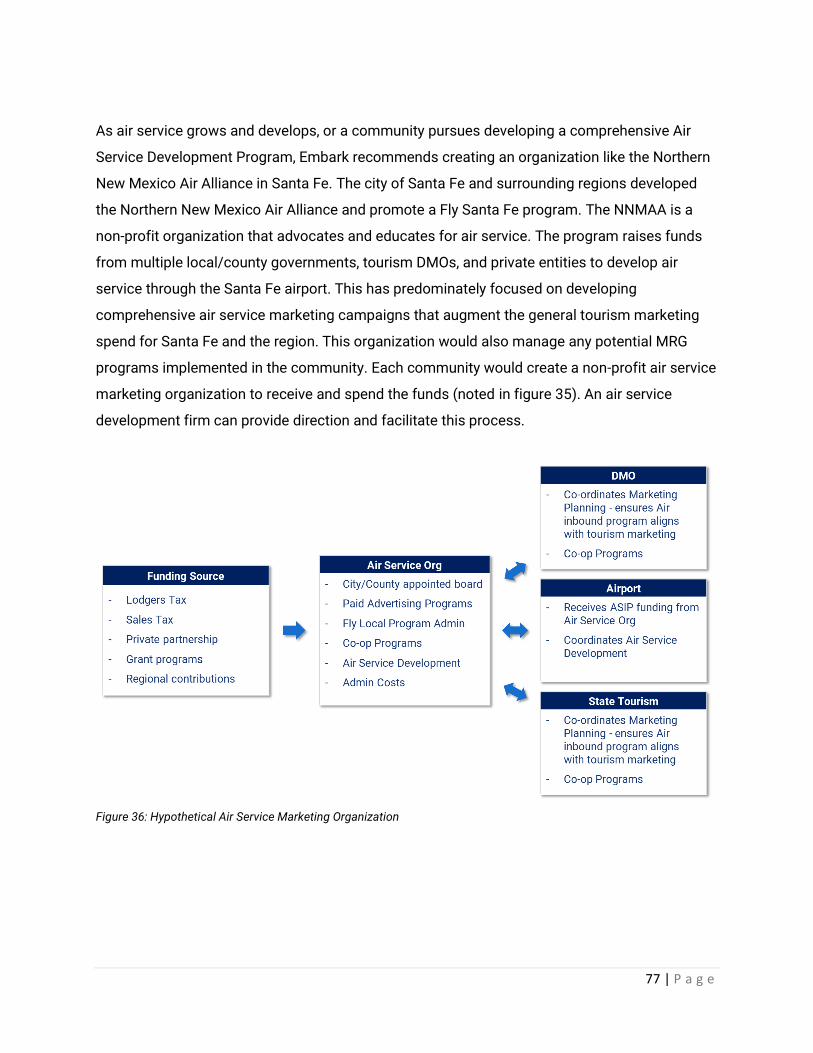
77 | P a g e
As air service grows and develops, or a community pursues developing a comprehensive Air
Service Development Program, Embark recommends creating an organization like the Northern
New Mexico Air Alliance in Santa Fe. The city of Santa Fe and surrounding regions developed
the Northern New Mexico Air Alliance and promote a Fly Santa Fe program. The NNMAA is a
non-profit organization that advocates and educates for air service. The program raises funds
from multiple local/county governments, tourism DMOs, and private entities to develop air
service through the Santa Fe airport. This has predominately focused on developing
comprehensive air service marketing campaigns that augment the general tourism marketing
spend for Santa Fe and the region. This organization would also manage any potential MRG
programs implemented in the community. Each community would create a non-profit air service
marketing organization to receive and spend the funds (noted in figure 35). An air service
development firm can provide direction and facilitate this process.
Figure 36: Hypothetical Air Service Marketing Organization
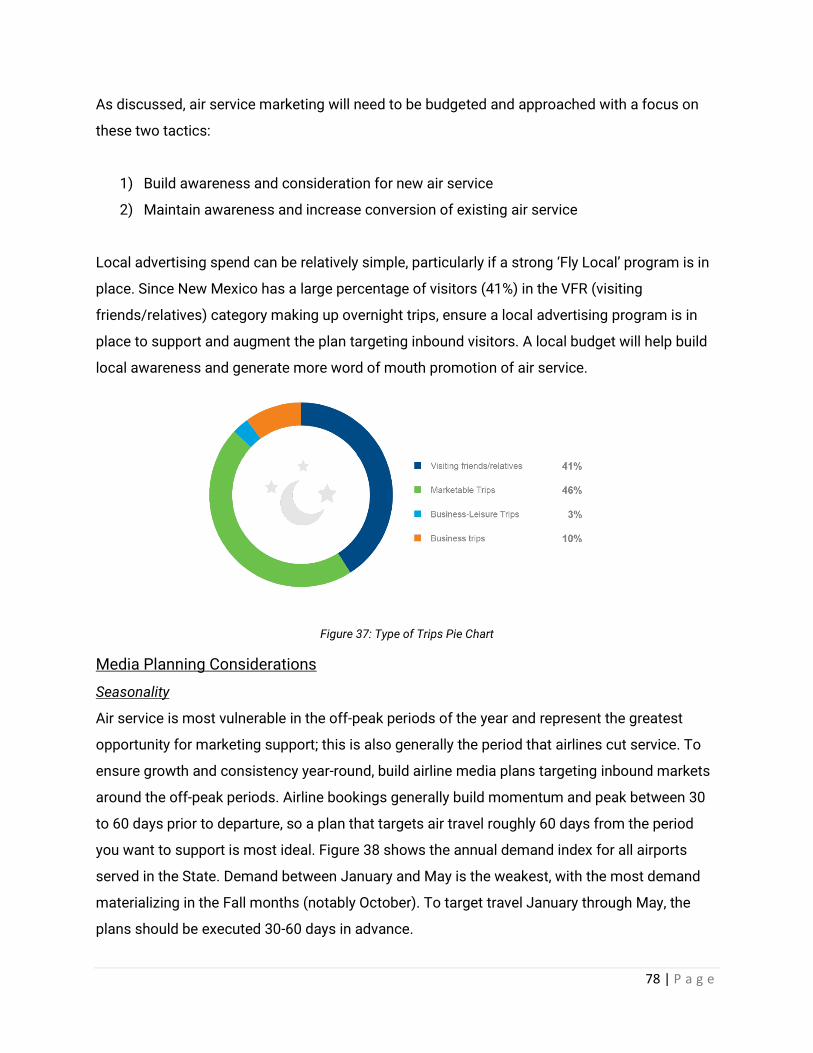
78 | P a g e
As discussed, air service marketing will need to be budgeted and approached with a focus on
these two tactics:
1) Build awareness and consideration for new air service
2) Maintain awareness and increase conversion of existing air service
Local advertising spend can be relatively simple, particularly if a strong ‘Fly Local’ program is in
place. Since New Mexico has a large percentage of visitors (41%) in the VFR (visiting
friends/relatives) category making up overnight trips, ensure a local advertising program is in
place to support and augment the plan targeting inbound visitors. A local budget will help build
local awareness and generate more word of mouth promotion of air service.
Figure 37: Type of Trips Pie Chart
Media Planning Considerations
Seasonality
Air service is most vulnerable in the off-peak periods of the year and represent the greatest
opportunity for marketing support; this is also generally the period that airlines cut service. To
ensure growth and consistency year-round, build airline media plans targeting inbound markets
around the off-peak periods. Airline bookings generally build momentum and peak between 30
to 60 days prior to departure, so a plan that targets air travel roughly 60 days from the period
you want to support is most ideal. Figure 38 shows the annual demand index for all airports
served in the State. Demand between January and May is the weakest, with the most demand
materializing in the Fall months (notably October). To target travel January through May, the
plans should be executed 30-60 days in advance.
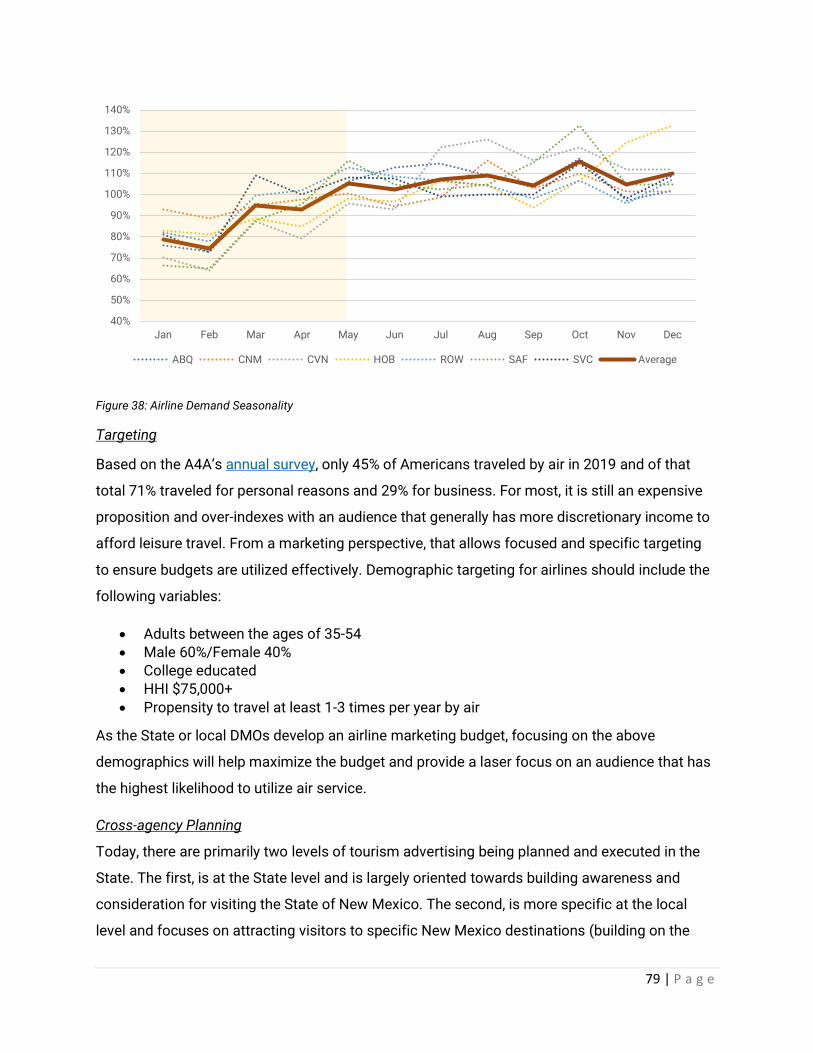
79 | P a g e
Figure 38: Airline Demand Seasonality
Targeting
Based on the A4A’s annual survey, only 45% of Americans traveled by air in 2019 and of that
total 71% traveled for personal reasons and 29% for business. For most, it is still an expensive
proposition and over-indexes with an audience that generally has more discretionary income to
afford leisure travel. From a marketing perspective, that allows focused and specific targeting
to ensure budgets are utilized effectively. Demographic targeting for airlines should include the
following variables:
• Adults between the ages of 35-54
• Male 60%/Female 40% • College educated
• HHI $75,000+
• Propensity to travel at least 1-3 times per year by air
As the State or local DMOs develop an airline marketing budget, focusing on the above
demographics will help maximize the budget and provide a laser focus on an audience that has
the highest likelihood to utilize air service.
Cross-agency Planning
Today, there are primarily two levels of tourism advertising being planned and executed in the
State. The first, is at the State level and is largely oriented towards building awareness and
consideration for visiting the State of New Mexico. The second, is more specific at the local
level and focuses on attracting visitors to specific New Mexico destinations (building on the
40%
50%
60%
70%
80%
90%
100%
110%
120%
130%
140%
Jan Feb Mar Apr May Jun Jul Aug Sep Oct Nov Dec
ABQ CNM CVN HOB ROW SAF SVC Average

80 | P a g e
efforts of the State). In some cases, the messaging overlaps and even can ‘compete’ with each
other. Once a community has identified and planned their air service marketing programs, they
should collaborate with the State and Regional DMOs to ensure plan alignment.
Recommended Marketing Strategies
As the State and local Communities build out marketing programs, Embark recommends the
following strategies going into 2021.
Post-Covid Travel
While it is difficult to forecast a return to ‘normalcy’ following Covid-19, we do know that outdoor
leisure destinations are recovering more quickly and will likely accelerate once a vaccine is
introduced in early 2021 (see figure 39).
Figure 39: 7-day Avg. TSA Screenings as Percentage of 2019
Given New Mexico’s focus on outdoor recreation, the State and local DMO’s should aggressively
implement campaigns immediately upon the Governor lifting quarantine restrictions and
consider a higher budget than 2019 given the pent-up demand across the country. With lodger
tax receipts significantly lower than 2019, and other funding likely a challenge to raise, the State
should consider a Covid-19 grant program to close the gap for communities across the State
based on 2019 fiscal year spending.
81 | P a g e
Airline traffic peaks between August and December (figure 38), this timing gives New Mexico an
advantage for planning and executing effective campaigns leading up to the 2021 peak season,
especially if vaccines are more widely deployed by late Spring. This could include the following
tactics:
• Work from ____________. Develop campaigns around the emerging ‘digital nomad’ culture
and shift from office to work from home. Working from home is likely now here to stay
for a lot of businesses, with some planning to forgo their corporate office facilities
completely. This emerging dynamic is creating a whole new segment of ‘bleisure’
traveler – mixing work with play. With business travel not likely to return to normal for as
much as four years, partnership from hotels and resorts deeply discounting mid-week
stays could help incentivize travel.
• Small Town USA. Travel is shifting away from large cities and crowded tourist
attractions and moving to smaller cities with authentic experiences. This is also
materializing in the form of more second home purchases in popular leisure
destinations.
• Travelers have become more interested in the outdoors. Aggressively target popular
outdoor destinations in New Mexico’s competitive set. This should include moving share
from Arizona, Colorado, and Montana. Programmatic ad buys should target these
destinations and potentially intercept visitors. This can be particularly effective in OTA or
Kayak advertising platforms.
Develop regional marketing programs
New Mexico markets six distinct regions across the State and while this concept is not new,
reinvigorating regional marketing programs that integrate air and ground components can help
create longer stays and broader awareness of air service options. Increasing connectivity both
in the regional markets as well as through an intra-State system could significantly impact
tourism growth in regions outside the North Central and Central regions, with specific
opportunity in the Southeast and Southwest regions. However, these regions are currently
largely under-developed in terms of air service marketing and regional cooperation. As indicated
in the 2019 Travel USA New Mexico Visitor Study, outside the Central and North Central regions,
the remaining regions have significantly fewer overnight visitor volumes. By collaborating at a
regional level, DMOs can create multi-day itineraries that will lead to extended stays and

82 | P a g e
increased economic activity throughout the region. Regional collaboration would also create
more funding flexibility across multiple budgets.
Figure 40: Overnight Visitor Volume by Region - Source: 2019 Travel USA Visitor Profile
Immediate Regional Opportunities
Embark identified two potential concepts (one North and one South) that can be developed into
regional partnerships.
Arts and Adventure
Airports: Santa Fe and Taos
Communities: Santa Fe, Taos, and Enchanted Circle region
Non-community partners: Taos Air, American Airlines, Car Rental partner
Target Markets: Austin, Los Angeles
Concept: Fly/Drive promotion that allows visitor to fly into one airport and out of another. The
car rental partner could waive drop off fees for cars on either end. Participating communities
would provide value added offers when they show their Taos Air or American boarding pass
with Taos or Santa Fe as the airport destination. American provides a wide range of one-way
pricing options from Los Angeles, Dallas, and Austin. The best DMA marketing opportunity
would be Los Angeles or Austin since both airlines use of the same airport in Austin or are near
Los Angeles (LAX) or Long Beach for Uber.
83 | P a g e
Marketing: Historically, these communities have worked together through the Northern New
Mexico Air Alliance. While the NNMAA was designed to stimulate travel through the Santa Fe
airport, this regional, satellite approach could encourage longer stays and increase airline traffic
for both airports. The NNMAA, Taos, Enchanted Circle DMOs would collaborate to develop the
program and campaign and promote through owned and paid channels. Paid media would be
targeted in the Austin or Los Angeles DMAs. Given the high cost of media in Los Angeles, State
marketing funds could be used to match the media plan, or existing State plans in those
geographies adjusted to promote the campaign.
Parks and Peaks
Airports: Carlsbad and Roswell
Communities: Carlsbad, Roswell, Ruidoso, National Park Gateway Communities
Non-community partners: Boutique, American Airlines, Car rental partner
Target Markets: Dallas and key visitor markets throughout U.S.
Concept: Fly/Drive promotion that allows visitor to fly into one airport and out of another. The
car rental partner could waive drop off fees for cars on either end. Participating communities
would provide value added offers when they show their Boutique or American boarding pass
with Carlsbad or Roswell as the destination. Since Boutique has an interline agreement with
American and American serves Roswell, there are a significant number of marketing
opportunities. Further collaboration between American and Boutique could create more
favorable interline pricing for the Carlsbad segment.
Marketing: These communities have not collaborated since non-stop flights were launched
from Roswell to Dallas/Ft Worth. This program may take a little longer to develop until a
regional organizational structure is created. This program provides a lot of flexibility for media
targeting. Starting with Dallas, media would also target key visitor origin markets that are
available by way of connections on American Airlines. Since flights will need to be purchased
through an Online Travel Agency (Expedia, Travelocity, etc.) partnering with an OTA as the
distribution channel may also provide value. State marketing funds could be used to match the
media plan, or existing State plans in those geographies adjusted to promote the campaign.
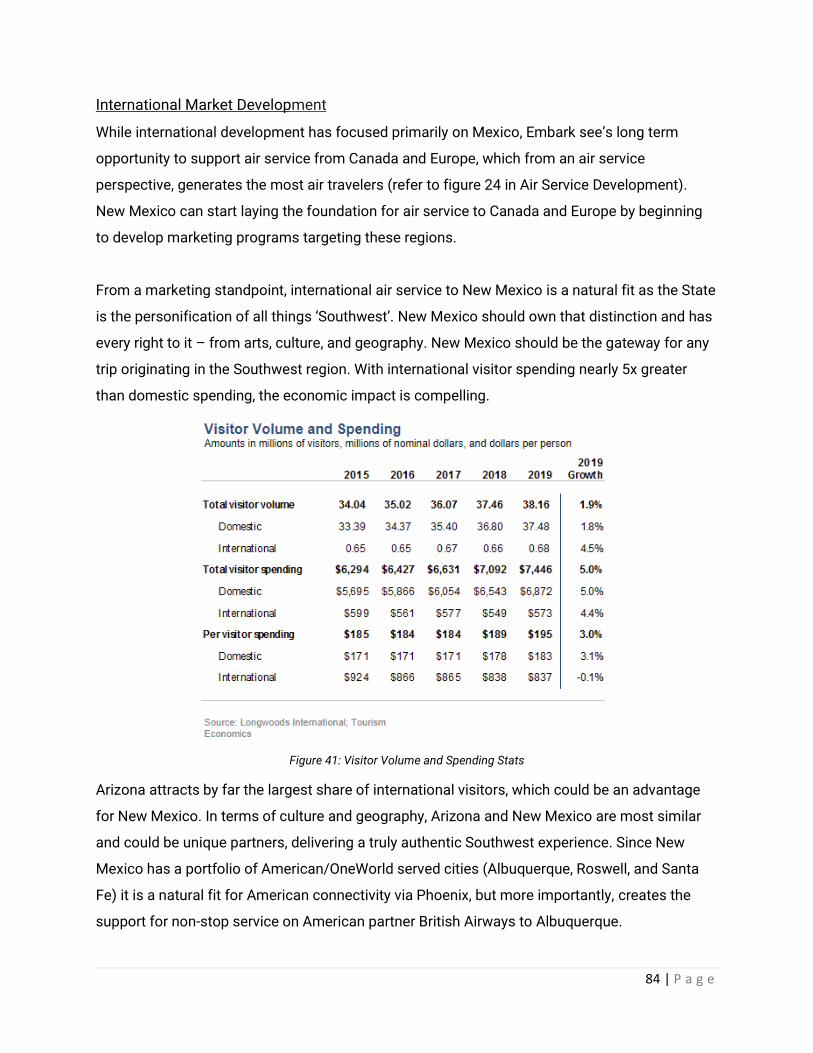
84 | P a g e
International Market Development
While international development has focused primarily on Mexico, Embark see’s long term
opportunity to support air service from Canada and Europe, which from an air service
perspective, generates the most air travelers (refer to figure 24 in Air Service Development).
New Mexico can start laying the foundation for air service to Canada and Europe by beginning
to develop marketing programs targeting these regions.
From a marketing standpoint, international air service to New Mexico is a natural fit as the State
is the personification of all things ‘Southwest’. New Mexico should own that distinction and has
every right to it – from arts, culture, and geography. New Mexico should be the gateway for any
trip originating in the Southwest region. With international visitor spending nearly 5x greater
than domestic spending, the economic impact is compelling.
Figure 41: Visitor Volume and Spending Stats
Arizona attracts by far the largest share of international visitors, which could be an advantage
for New Mexico. In terms of culture and geography, Arizona and New Mexico are most similar
and could be unique partners, delivering a truly authentic Southwest experience. Since New
Mexico has a portfolio of American/OneWorld served cities (Albuquerque, Roswell, and Santa
Fe) it is a natural fit for American connectivity via Phoenix, but more importantly, creates the
support for non-stop service on American partner British Airways to Albuquerque.

85 | P a g e
Figure 42: International Visitor Stats by State
Marketing Considerations
• Mexico Maintenance. The size and strength of the drive market today requires
maintaining a marketing program targeting this region.
• European Expansion. Given the impact of Covid-19, travel from international gateways is
not likely to recover for at least two years. This gives New Mexico Tourism time to
develop a budget; and target investing in Europe beginning Summer/Fall of 2022.
Normally, it takes over a year to establish solid links to critical tour operators and other
sales agents. Partnering with American/British Airways in the UK and other European
cities to develop marketing programs, sales missions and media familiarization trips
would be valuable in 2021.
• Northern Neighbors. Vancouver and Toronto are key markets to develop and have the
strongest potential for service in the future. Like Europe, partnering with United/Air
Canada to develop marketing programs would begin to lay the foundation for future
service.
• Regional Partnership. Since Santa Fe also attracts a significant number of international
visitors that mirrors ABQ, partnering with SAF on European and Canadian efforts will
help increase traffic for both cities and create a more compelling value proposition.
86 | P a g e
Space Tourism/Las Cruces Development
With the development of Spaceport America near Truth or Consequences, New Mexico has an
opportunity to develop a space tourism industry. Broward County in Florida (home to the
Kennedy Space Center) has developed a successful program for marketing the region. Known
as the ‘Space Coast’ it provides a variety of trip planning tools to view rocket launches
throughout the year. With the growth of SpaceX, these launches are now even more frequent
and are contributing to growth along the ‘Space Coast’. While the primary ‘event’ is a rocket
launch and a visit to Kennedy Space Center, much of the content for visitors is geared around
other activities and attractions (including beaches, boating, and theme parks). New Mexico’s
rich military and space history create an opportunity to develop a much deeper and immersive
experience by tying other regional space exploration attractions into a ‘Space-cation.’
Infrastructure
While Spaceport America is closest to Truth or Consequences, Las Cruces is the closest major
city that can support the infrastructure and visitor volumes for space tourism. This is required
for two different segments of space tourism, the first being those training as astronauts and
traveling into space. The second segment are launch spectators or interested in exploring the
facility.
Las Cruces currently has a large inventory of rooms across several hotel brands and chains. It is
anchored on the luxury end with the Hotel Encando de Las Cruces which has been designated
as the official hotel of Virgin Galactic for Spaceport America. The region also provides a wide
array of restaurants and other amenities that make it the perfect hub for space tourism and the
astronauts participating.
Resumption of air service is critical to providing the most convenient and competitive link to the
region. While only an hour from El Paso International Airport (the closest airport to Las Cruces)
direct service to LRU ensures visitors are generating an immediate economic impact to the
State. If served by a major network brand such as American Airlines, it provides seamless
access to the World, making Las Cruces and the region more accessible. While close to El Paso,
the population, tourism, and business community can likely support limited air service and begin
to develop an air service niche like Santa Fe (which is roughly the same travel time to ABQ).
87 | P a g e
While the ‘hub’ for astronaut training, it can also serve as the hub for spectators and those
interested in space exploration.
Ultimate Space-cation
While the opportunity to train as an astronaut and experience space travel is limited to a wealthy
minority today, the region can still exploit the Spaceport to develop a ‘Space-cation’. Working
with other communities in the region, the Space-cation includes developing a multi-day itinerary
leveraging Las Cruces as the hub, or if part of a fly/drive program, could include Roswell as a
gateway airport.
Itinerary components:
• Launch parties. When launches are planned, the Space-cation marketing entity will publish
the launch calendar and develop exclusive launch parties or viewing areas for each launch.
• Ride the Space Highway. Regional integration of activities that serve as the core space-
cation experience:
1. Spaceport astronaut training and ‘certification’
2. Post training exploration of Truth or Consequences (hot springs, recreation, more
‘eclectic’ experience)
3. Visit to White Sands National Park and White Sands Missile Museum
4. Alamogordo activities at the NM Museum of Space History and the Sunspot
Astronomy and Visitor Center
5. While further away to accomplish a day trip, integrating Roswell and its world-
famous UFO Museum and ‘site’ tours would be a fantastic component. Incorporating
Roswell would be a good fit for inclusion in fly/drive itineraries where visitors fly into
Las Cruces and out of Roswell, or vice versa.
Embark recommends creating an air service development program in Las Cruces and begin to
lay the groundwork for attracting and securing air service. Concurrently, the region can begin
forming a regional partnership with other communities to develop and structure the Space-
cation experience. While not as preferred, Las Cruces can initially leverage the El Paso Airport
as the ‘gateway’ airport (60 minutes away). While retaining all dollars in New Mexico is ideal, the
nearest major gateway is Albuquerque over three hours away, which makes the space-cation
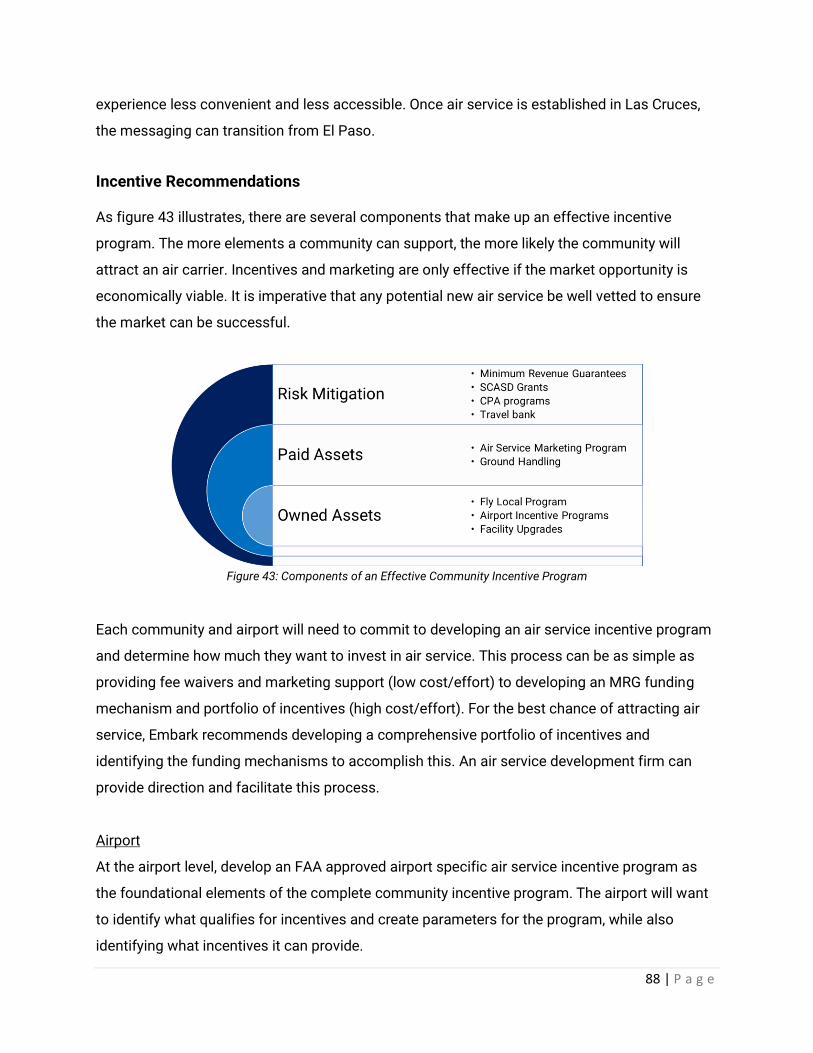
88 | P a g e
experience less convenient and less accessible. Once air service is established in Las Cruces,
the messaging can transition from El Paso.
Incentive Recommendations
As figure 43 illustrates, there are several components that make up an effective incentive
program. The more elements a community can support, the more likely the community will
attract an air carrier. Incentives and marketing are only effective if the market opportunity is
economically viable. It is imperative that any potential new air service be well vetted to ensure
the market can be successful.
Figure 43: Components of an Effective Community Incentive Program
Each community and airport will need to commit to developing an air service incentive program
and determine how much they want to invest in air service. This process can be as simple as
providing fee waivers and marketing support (low cost/effort) to developing an MRG funding
mechanism and portfolio of incentives (high cost/effort). For the best chance of attracting air
service, Embark recommends developing a comprehensive portfolio of incentives and
identifying the funding mechanisms to accomplish this. An air service development firm can
provide direction and facilitate this process.
Airport
At the airport level, develop an FAA approved airport specific air service incentive program as
the foundational elements of the complete community incentive program. The airport will want
to identify what qualifies for incentives and create parameters for the program, while also
identifying what incentives it can provide.
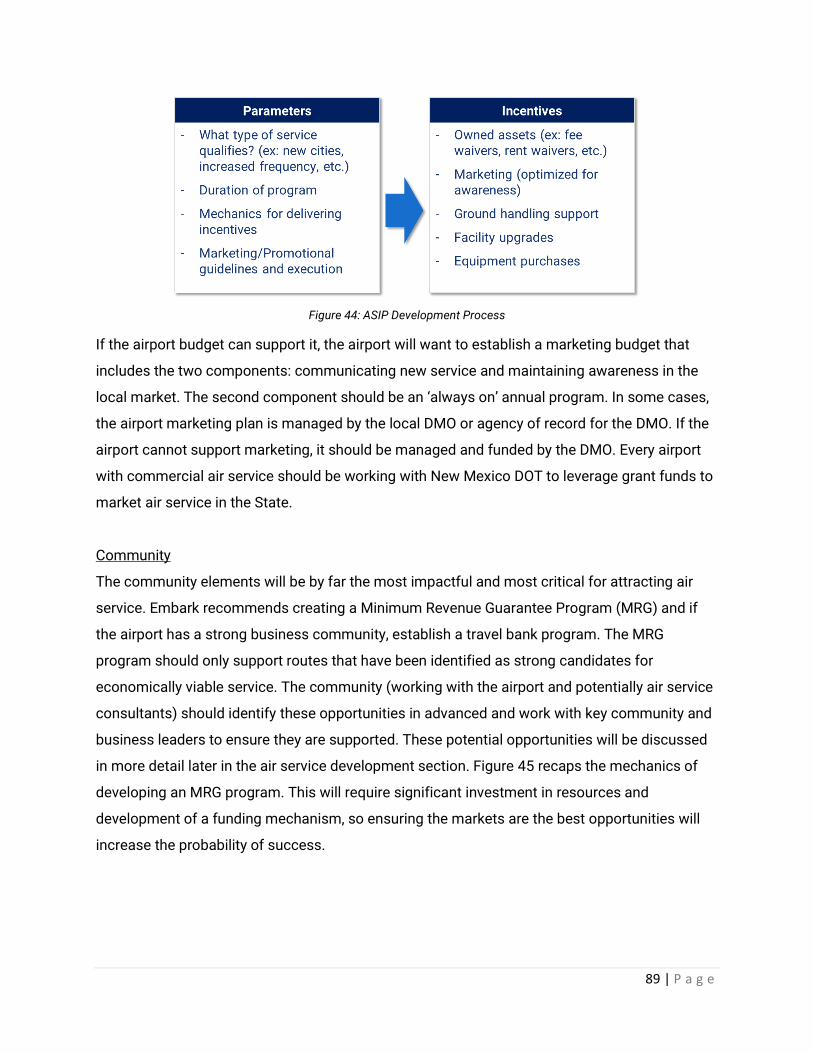
89 | P a g e
Figure 44: ASIP Development Process
If the airport budget can support it, the airport will want to establish a marketing budget that
includes the two components: communicating new service and maintaining awareness in the
local market. The second component should be an ‘always on’ annual program. In some cases,
the airport marketing plan is managed by the local DMO or agency of record for the DMO. If the
airport cannot support marketing, it should be managed and funded by the DMO. Every airport
with commercial air service should be working with New Mexico DOT to leverage grant funds to
market air service in the State.
Community
The community elements will be by far the most impactful and most critical for attracting air
service. Embark recommends creating a Minimum Revenue Guarantee Program (MRG) and if
the airport has a strong business community, establish a travel bank program. The MRG
program should only support routes that have been identified as strong candidates for
economically viable service. The community (working with the airport and potentially air service
consultants) should identify these opportunities in advanced and work with key community and
business leaders to ensure they are supported. These potential opportunities will be discussed
in more detail later in the air service development section. Figure 45 recaps the mechanics of
developing an MRG program. This will require significant investment in resources and
development of a funding mechanism, so ensuring the markets are the best opportunities will
increase the probability of success.
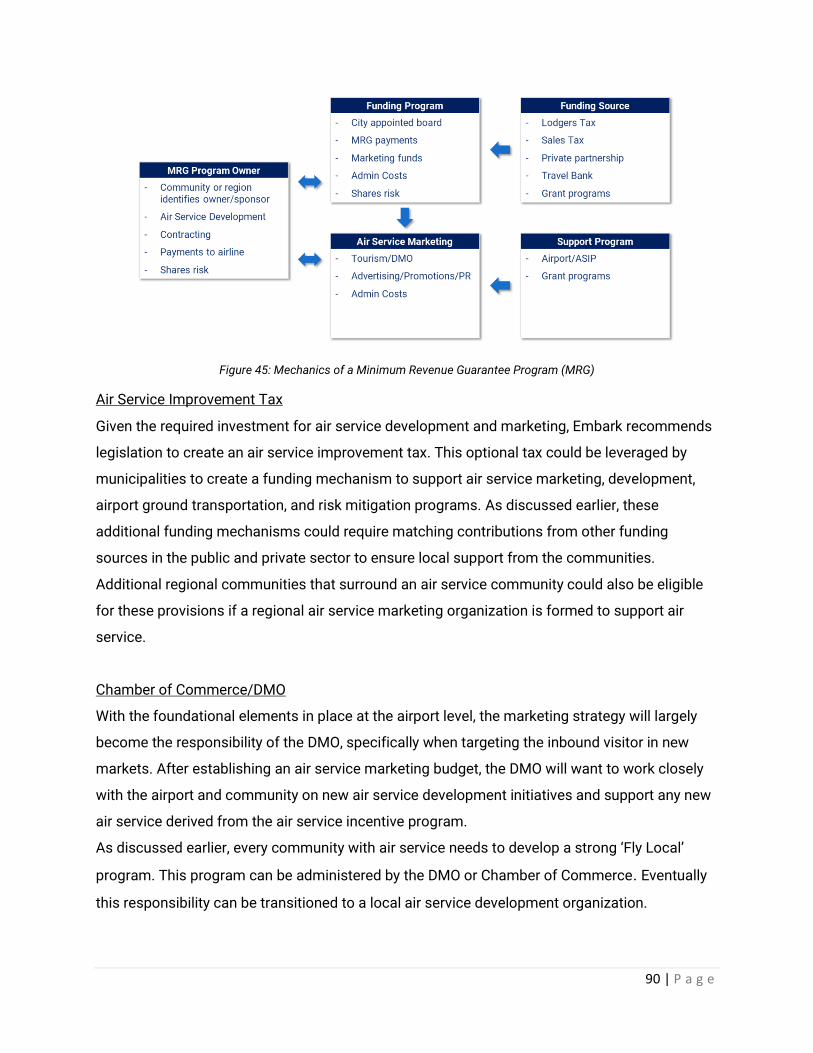
90 | P a g e
Figure 45: Mechanics of a Minimum Revenue Guarantee Program (MRG)
Air Service Improvement Tax
Given the required investment for air service development and marketing, Embark recommends
legislation to create an air service improvement tax. This optional tax could be leveraged by
municipalities to create a funding mechanism to support air service marketing, development,
airport ground transportation, and risk mitigation programs. As discussed earlier, these
additional funding mechanisms could require matching contributions from other funding
sources in the public and private sector to ensure local support from the communities.
Additional regional communities that surround an air service community could also be eligible
for these provisions if a regional air service marketing organization is formed to support air
service.
Chamber of Commerce/DMO
With the foundational elements in place at the airport level, the marketing strategy will largely
become the responsibility of the DMO, specifically when targeting the inbound visitor in new
markets. After establishing an air service marketing budget, the DMO will want to work closely
with the airport and community on new air service development initiatives and support any new
air service derived from the air service incentive program.
As discussed earlier, every community with air service needs to develop a strong ‘Fly Local’
program. This program can be administered by the DMO or Chamber of Commerce. Eventually
this responsibility can be transitioned to a local air service development organization.
91 | P a g e
Air Service Development Recommendations
Goals for Albuquerque International Sunport Air Service Development
• Continue to recruit service to top unserved markets with a focus on matching
opportunity to carrier business model.
• Restoration of previously served markets by matching opportunity to business model
likely to be successful in the future.
• Package and market groups of complimentary opportunities to assist target carriers in
justifying fixed costs of service additions while minimizing financial risk to the carriers.
• Drive increased international traffic through marketing in a long-term effort to recruit
nonstop international flights
Goals for Regional Airport Air Service Development
• Restore air service to previously served airports, including Gallup and Las Cruces
• Each regional jet airport should be served by two major airline brands, with American
and United being most logical based on hub proximity
• Each regional jet airport should maintain service to Phoenix, Denver, and either Dallas/Ft.
Worth or Houston-Bush Intercontinental Airports
• Reestablish intra-state airline network
Adjust Air Service Development Priorities for Covid-19
Destinations that offer abundant outdoor and socially distanced activities are recovering at a
faster rate. These communities may benefit longer-term from increased exposure now and
further development of outdoor recreation for tourism. This requires a concerted effort from
interested parties across the state to allow visitors to enter the state in a manner safe for them
and residents alike.
State to Lead Ground Transportation Coordination
A substantial challenge to developing regional air service across the state is a lack of focus on
ground transportation. Some regional airports simply lack car rental vendors. Regional airports
that do have car rental vendors often have different vendors than neighboring airports. These
challenges create difficulties for travelers and tourists who want to fly directly to more remote
92 | P a g e
parts of New Mexico but find ground transportation options incompatible with their overall
travel plans.
Embark recommends exploring different strategies to close the ground transportation gap. The
state can lead an effort to ensure all regional airports have sufficient car rental options,
including at least one brand with a location at every regional airport with commercial service.
By doing so, regional airports will be able to better meet the complete need of travelers, which
will allow traffic to grow.
1. Establish a relationship Enterprise. Currently, Enterprise is the largest operator in the
State and located in every existing air service community. New Mexico DOT could
begin a dialogue with the franchise or corporate office to collaborate on accessibility
options and potential costs.
2. Establish a grant program or incentives. The State or Community may need to
develop a grant program to encourage establishment of a branch at the airports until
air service creates sustainable rental car business. This could include reimbursing
the participating agency for moving staff/vehicles to airport to facilitate rental,
waiving rent at the airport for rental car facility and vehicle parking, or local/State tax
rebates based on volume of cars rented at regional airports.
3. Establish transit link. Alternatively, each community has a transit system that could
be extended to the airport during flight arrival/departure times. This would allow
visitors to access car rental facilities downtown.
Create a State-supported CPA Program for Rural Markets
Embark recommends exploring the development of two CPA programs to support rural New
Mexico markets. The first is focused on building on the success of air service models in Hobbs,
Roswell, and Santa Fe. As demonstrated in the Air Service Development section, we believe air
service to nearby hubs is crucial for success. To attract long-term major airline interest, an
opportunity exists to develop air service in Farmington, Gallup, Taos, and Las Cruces through a
CPA-like arrangement to a nearby hub. The second explores establishing a CPA program that
develops an intra-State network.
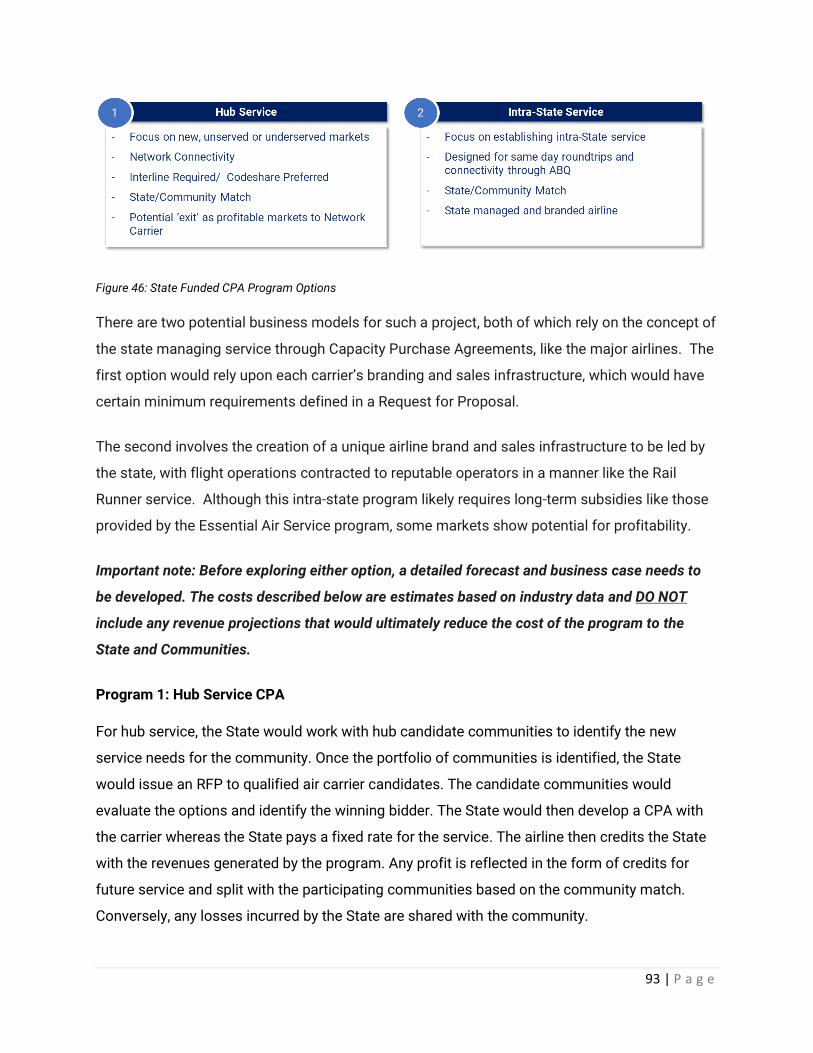
93 | P a g e
Figure 46: State Funded CPA Program Options
There are two potential business models for such a project, both of which rely on the concept of
the state managing service through Capacity Purchase Agreements, like the major airlines. The
first option would rely upon each carrier’s branding and sales infrastructure, which would have
certain minimum requirements defined in a Request for Proposal.
The second involves the creation of a unique airline brand and sales infrastructure to be led by
the state, with flight operations contracted to reputable operators in a manner like the Rail
Runner service. Although this intra-state program likely requires long-term subsidies like those
provided by the Essential Air Service program, some markets show potential for profitability.
Important note: Before exploring either option, a detailed forecast and business case needs to
be developed. The costs described below are estimates based on industry data and DO NOT
include any revenue projections that would ultimately reduce the cost of the program to the
State and Communities.
Program 1: Hub Service CPA
For hub service, the State would work with hub candidate communities to identify the new
service needs for the community. Once the portfolio of communities is identified, the State
would issue an RFP to qualified air carrier candidates. The candidate communities would
evaluate the options and identify the winning bidder. The State would then develop a CPA with
the carrier whereas the State pays a fixed rate for the service. The airline then credits the State
with the revenues generated by the program. Any profit is reflected in the form of credits for
future service and split with the participating communities based on the community match.
Conversely, any losses incurred by the State are shared with the community.
94 | P a g e
Hub service candidates:
Phase 1: Phoenix: Farmington, Gallup, Taos, and Las Cruces
Phase 2: Denver: Gallup, Taos, Las Cruces, Roswell
Phase 3: Houston: Las Cruces, Roswell, Santa Fe
Embark initially recommends a phased approach, beginning with Phoenix.
1) The market candidates have the greatest need with no, or limited airline service.
2) Phoenix is the closest hub, which would limit the overall cost exposure to the State and
participating communities. Phoenix (and Arizona in general) is also a key origin market
for visitors.
3) There are two potential regional jet operators that can provide network connectivity. The
first being American Airlines with seamless connections, one fare, and loyalty program
participation. It also complements the existing American services in other New Mexico
communities. Contour Airlines also is a compelling option. While Contour does not
codeshare with American, it does have an interline agreement with the ability to book
Contour/American itineraries and baggage transfers through aa.com and OTAs.
As the program matures and markets become profitable, the State can then focus on future
phases of support and remove profitable markets from the program.
Any shortfall in either of the two the program revenues is covered by the State and matching
funds from each participating community. Conversely, profits would be shared at the same rate.
Matching support would be based on tiered market need and funded through local sources
(examples: sales tax initiative, a State air service improvement tax, private partnership, etc.)
Tier 1 - No Air Service: No air service in a commercially viable market (match: 20%)
Tier 2 - Limited Air Service: 1-2 routes, non-Network hub access, seasonal (match: 40%)
Tier 3 - Established Service: Multi-hub access, multi-carrier options (match: 60%)

95 | P a g e
Other requirements:
• Municipalities or counties shall have a minimum population of fifty thousand persons
residing within a fifty-mile radius of the airport unless the municipality or county has existing
air service
• Air carrier must operate regional jet equipment and have at minimum an interline agreement
with the dominant hub carrier, or most preferred, a codeshare or CPA relationship with the
dominant hub carrier
• Airline operator will be required to meet minimum service levels based on USDOT
established metrics for schedule completion and on time performance
• Routes to be served by the program shall be new air routes that were not served prior to
program or previously served routes that were discontinued within the past twelve months;
and
• Program needs to be in place for a minimum of three years to adequately develop the
markets.
Cost Detail
Figure 47: Estimated Annual Cost of Hub CPA Service
Costs assume operation utilizing an Embraer 135 regional jet aircraft configured to 30 seats.
Additionally, we assumed one of the daily roundtrips between Phoenix and Farmington1 has an
intermediate stop in Gallup2. This would help limit the cost exposure for both Gallup and
Farmington and as the markets developed, would eventually be separated. Taos3 estimate
based on Summer and Winter service.
96 | P a g e
Based on the success of regional jet programs in Hobbs, Roswell, and Santa Fe (refer to figure
31), Embark is confident that regional jet service is feasible in Las Cruces, Farmington, and
Gallup and will largely offset the costs of the State run program.
Program 2: Intra-State CPA
The State would identify one (or more) airlines to operate the intra-State service on behalf of the
State for a fixed rate each month. The State would then be responsible for managing the
commercial functions of the airline, including distribution, revenue accounting and collection of
all revenues. Revenue shortfalls/profits would be invoiced or credited to the community based
on the State/Community risk sharing model at the end of each fiscal operating year. A
percentage of the profits could also be retained to support other State air service initiatives.
Using a model developed for Taos, the State could bid the management of the airline out to an
airline management firm. In addition to managing the day-to-day commercial entity, the firm
would also work with various local and State entities to help develop and market the air service.
In this scenario, the intra-State airline service would follow a model like the structure of the Rail
Runner program.
Potential Intra-State candidates:
Farmington, Taos, Las Cruces, Roswell, Hobbs, Carlsbad, and Silver City.
(Bold indicates cities subsidized by the federal EAS program – any inclusion in an intra-state CPA
program would require coordination with the federal program to ensure eligibility in that program is
maintained.)
Any shortfall is covered by the State and matching funds from each participating community.
Matching support would be based on tiered market need and funded through local sources
(examples: sales tax initiative, a State air service improvement tax, private partnership, etc.)
Tier 1 - No Air Service: No air service in a commercially viable market (match: 20%)
Tier 2 - Limited Air Service: 1-2 routes, non-Network hub access, seasonal (match: 40%)
Tier 3 - Established Service: Multi-hub access, multi-carrier options (match: 60%)
Other requirements
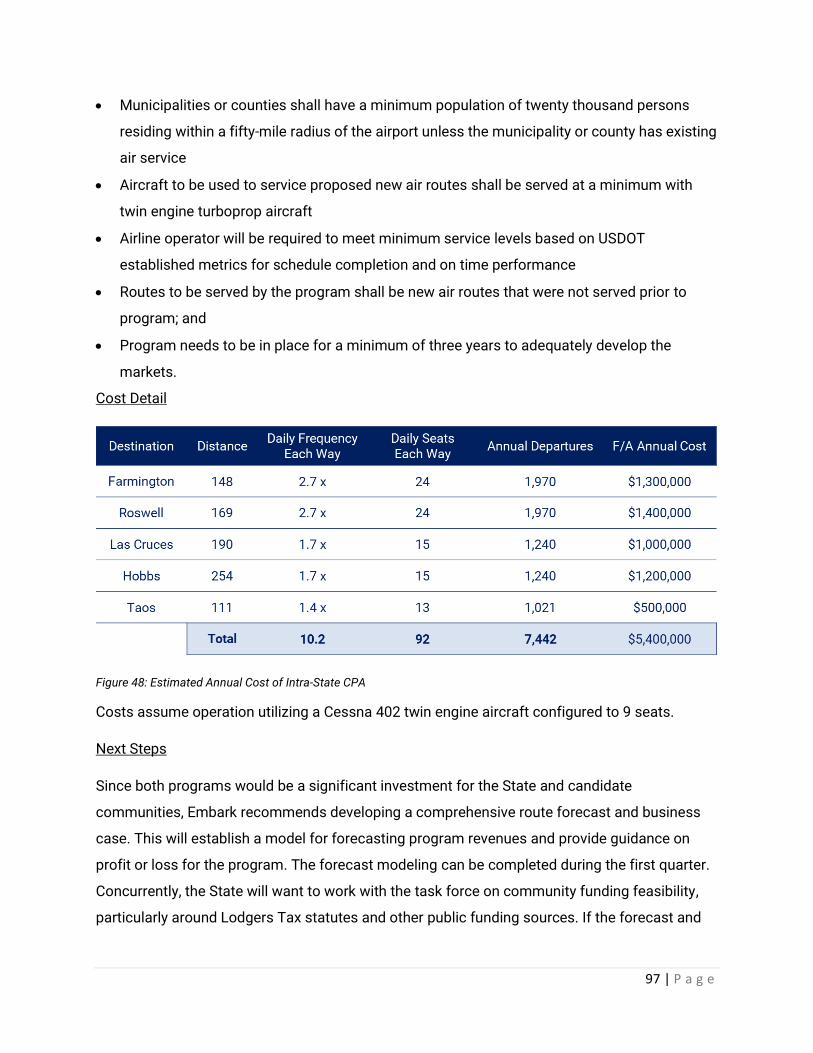
97 | P a g e
• Municipalities or counties shall have a minimum population of twenty thousand persons
residing within a fifty-mile radius of the airport unless the municipality or county has existing
air service
• Aircraft to be used to service proposed new air routes shall be served at a minimum with
twin engine turboprop aircraft
• Airline operator will be required to meet minimum service levels based on USDOT
established metrics for schedule completion and on time performance
• Routes to be served by the program shall be new air routes that were not served prior to
program; and
• Program needs to be in place for a minimum of three years to adequately develop the
markets.
Cost Detail
Figure 48: Estimated Annual Cost of Intra-State CPA
Costs assume operation utilizing a Cessna 402 twin engine aircraft configured to 9 seats.
Next Steps
Since both programs would be a significant investment for the State and candidate
communities, Embark recommends developing a comprehensive route forecast and business
case. This will establish a model for forecasting program revenues and provide guidance on
profit or loss for the program. The forecast modeling can be completed during the first quarter.
Concurrently, the State will want to work with the task force on community funding feasibility,
particularly around Lodgers Tax statutes and other public funding sources. If the forecast and

98 | P a g e
business case are promising, the State could identify potential airline operators and target a
Fall/Winter 2021 program launch.
Given the larger economic impact to the State, Embark recommends focusing on the Hub CPA
program first and potentially adding intra-State service the following year.
Finally, since aircraft are highly mobile assets, the state’s interests in creating intra-state air
service and restoring flights to unserved communities through access to nearby hubs can be
combined. In fact, combining the effort will create a larger opportunity for potential airlines,
increase economies of scale across fixed costs, and minimize risk for the carrier, thus
enhancing the potential for success of such a program.
Recruit Ultra-Low-Cost-Carrier Service
The conditions at Albuquerque International Sunport are ideal for the expansion of service from
existing ULCC’s, as there are several markets that appear ready to respond should service be
added. A partnership with New Mexico Department of Tourism or Visit Albuquerque would
amplify the potential to develop a destination focus city with a carrier like Allegiant that
explicitly works to develop packaged vacations in addition to low-fare airline service. Such a
partnership has high likelihood for success in the near-term as leisure travel shifts to niche,
outdoors, and easily socially distanced destinations like New Mexico, should Covid-related
travel restrictions be eased. Efforts to establish ULCC service can be followed with a longer-
term effort to drive additional New Mexico employment through local fulfillment of airline
support services.
Additional forecasting work is required to firmly define the top ULCC opportunities and the best
target carriers for each. It will also be important to review and ensure that the existing ASIP for
the ABQ airport has a compelling package of incentives that can significantly offset operating
costs. The city may also consider developing a risk mitigation program to support this and other
new market opportunities.
Establish an International Air Service Plan
Given the success of multiple communities with strong but unique tourism sectors to develop
international air service, New Mexico should immediately begin work to recruit such service.
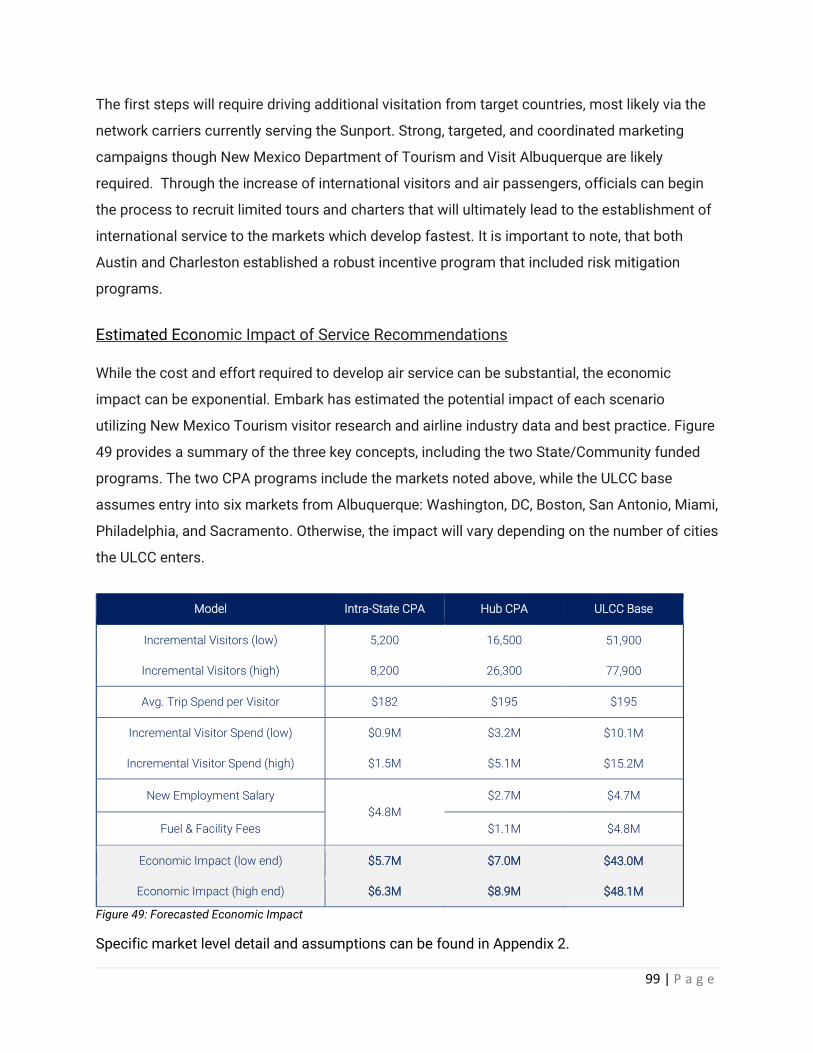
99 | P a g e
The first steps will require driving additional visitation from target countries, most likely via the
network carriers currently serving the Sunport. Strong, targeted, and coordinated marketing
campaigns though New Mexico Department of Tourism and Visit Albuquerque are likely
required. Through the increase of international visitors and air passengers, officials can begin
the process to recruit limited tours and charters that will ultimately lead to the establishment of
international service to the markets which develop fastest. It is important to note, that both
Austin and Charleston established a robust incentive program that included risk mitigation
programs.
Estimated Economic Impact of Service Recommendations
While the cost and effort required to develop air service can be substantial, the economic
impact can be exponential. Embark has estimated the potential impact of each scenario
utilizing New Mexico Tourism visitor research and airline industry data and best practice. Figure
49 provides a summary of the three key concepts, including the two State/Community funded
programs. The two CPA programs include the markets noted above, while the ULCC base
assumes entry into six markets from Albuquerque: Washington, DC, Boston, San Antonio, Miami,
Philadelphia, and Sacramento. Otherwise, the impact will vary depending on the number of cities
the ULCC enters.
Model Intra-State CPA Hub CPA ULCC Base
Incremental Visitors (low) 5,200 16,500 51,900
Incremental Visitors (high) 8,200 26,300 77,900
Avg. Trip Spend per Visitor $182 $195 $195
Incremental Visitor Spend (low) $0.9M $3.2M $10.1M
Incremental Visitor Spend (high) $1.5M $5.1M $15.2M
New Employment Salary
$4.8M
$2.7M $4.7M
Fuel & Facility Fees $1.1M $4.8M
Economic Impact (low end) $5.7M $7.0M $43.0M
Economic Impact (high end) $6.3M $8.9M $48.1M
Figure 49: Forecasted Economic Impact
Specific market level detail and assumptions can be found in Appendix 2.

100 | P a g e
Conclusion
New Mexico has a diversified and unique mix of air service and is well positioned for growth.
While air service development can be a daunting and expensive task, the economic impact
derived from these efforts can be exponential. By developing comprehensive Marketing,
Incentive, and Air Service Development programs at the State and Local level, New Mexico can
be well positioned to attract and retain air service from a variety of air carriers. Opportunity
exists to develop air service in new communities, reestablish an intra-State network, and
broaden reach to existing markets. While 2020 has been an incredibly challenging time, New
Mexico should leverage 2021 to lay the foundation for an air service renaissance and position
the State for years of growth.
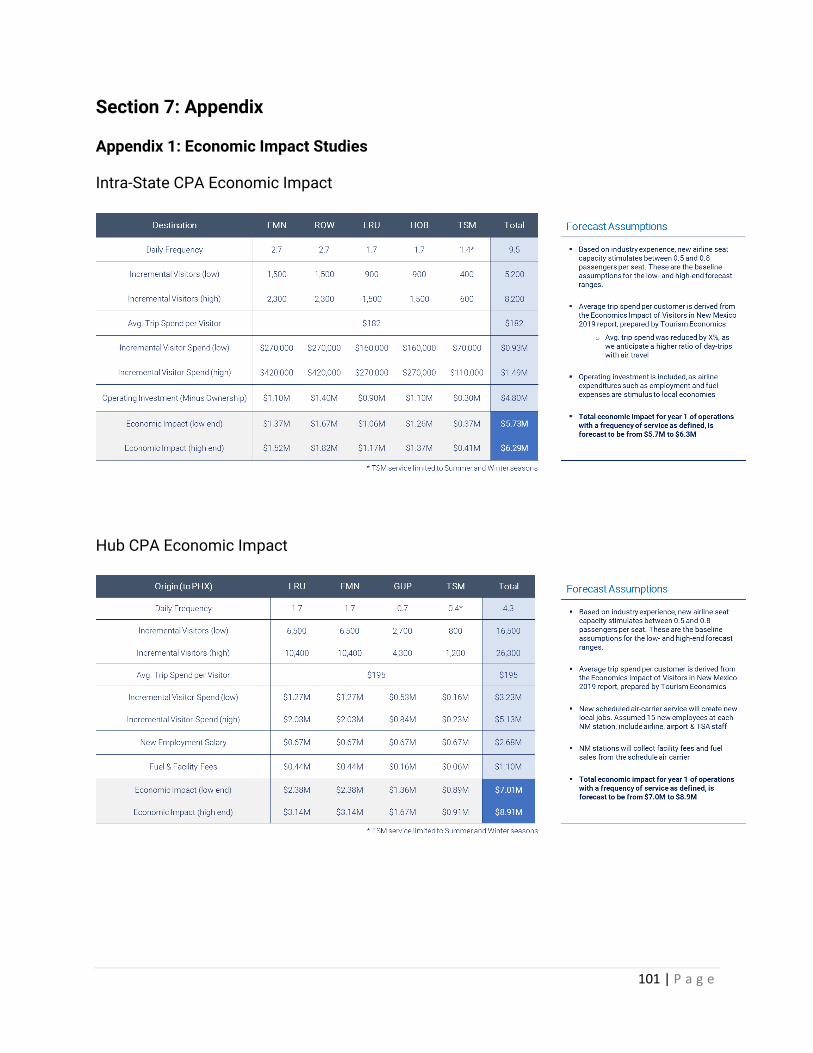
101 | P a g e
Section 7: Appendix
Appendix 1: Economic Impact Studies
Intra-State CPA Economic Impact
Hub CPA Economic Impact
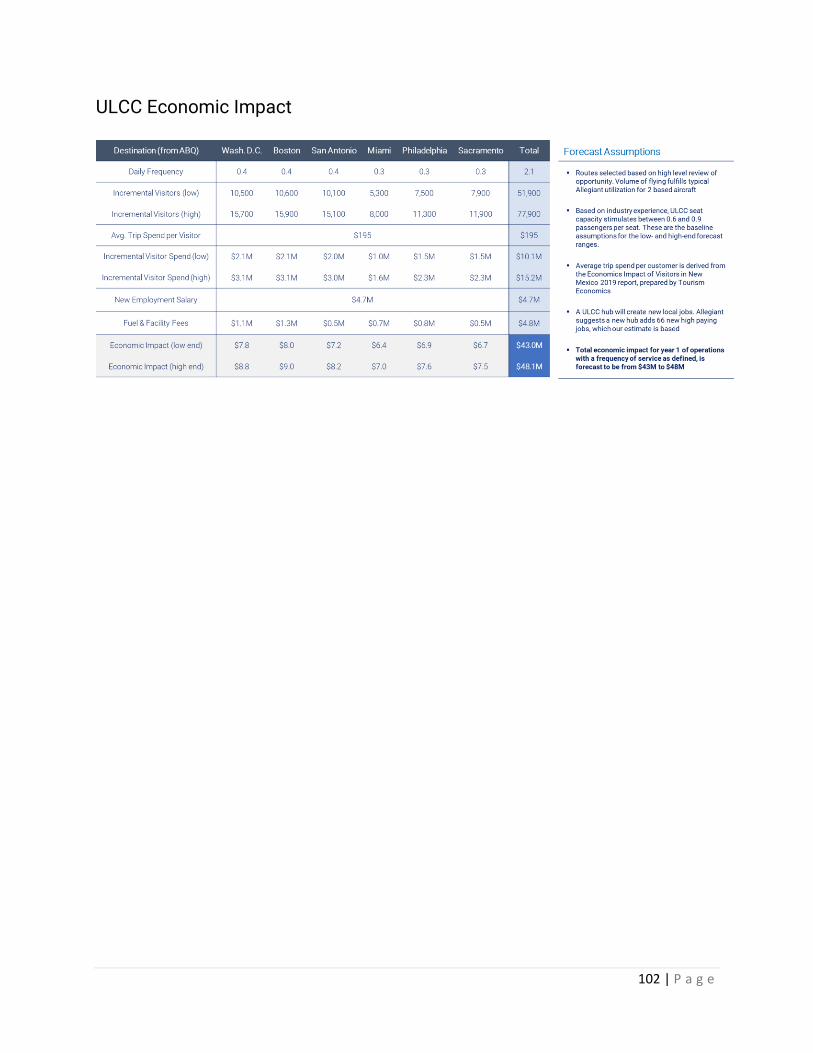
102 | P a g e
ULCC Economic Impact
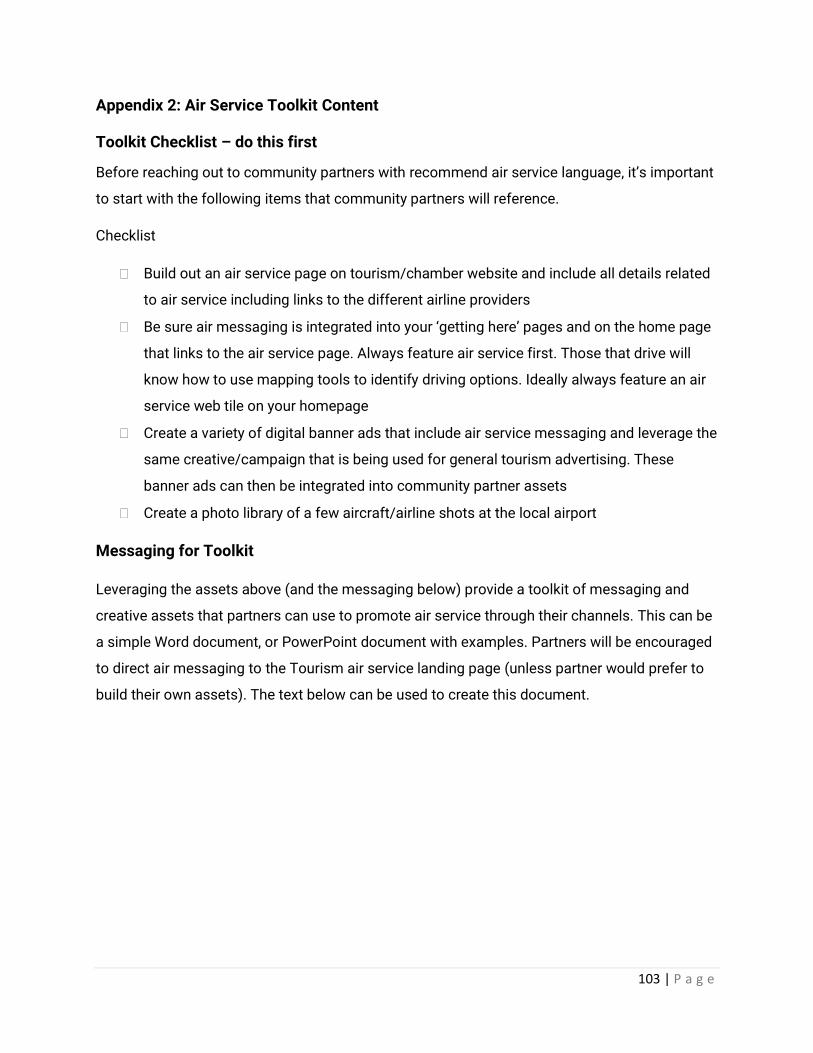
103 | P a g e
Appendix 2: Air Service Toolkit Content
Toolkit Checklist – do this first
Before reaching out to community partners with recommend air service language, it’s important
to start with the following items that community partners will reference.
Checklist
Build out an air service page on tourism/chamber website and include all details related
to air service including links to the different airline providers
Be sure air messaging is integrated into your ‘getting here’ pages and on the home page
that links to the air service page. Always feature air service first. Those that drive will
know how to use mapping tools to identify driving options. Ideally always feature an air
service web tile on your homepage
Create a variety of digital banner ads that include air service messaging and leverage the
same creative/campaign that is being used for general tourism advertising. These
banner ads can then be integrated into community partner assets
Create a photo library of a few aircraft/airline shots at the local airport
Messaging for Toolkit
Leveraging the assets above (and the messaging below) provide a toolkit of messaging and
creative assets that partners can use to promote air service through their channels. This can be
a simple Word document, or PowerPoint document with examples. Partners will be encouraged
to direct air messaging to the Tourism air service landing page (unless partner would prefer to
build their own assets). The text below can be used to create this document.
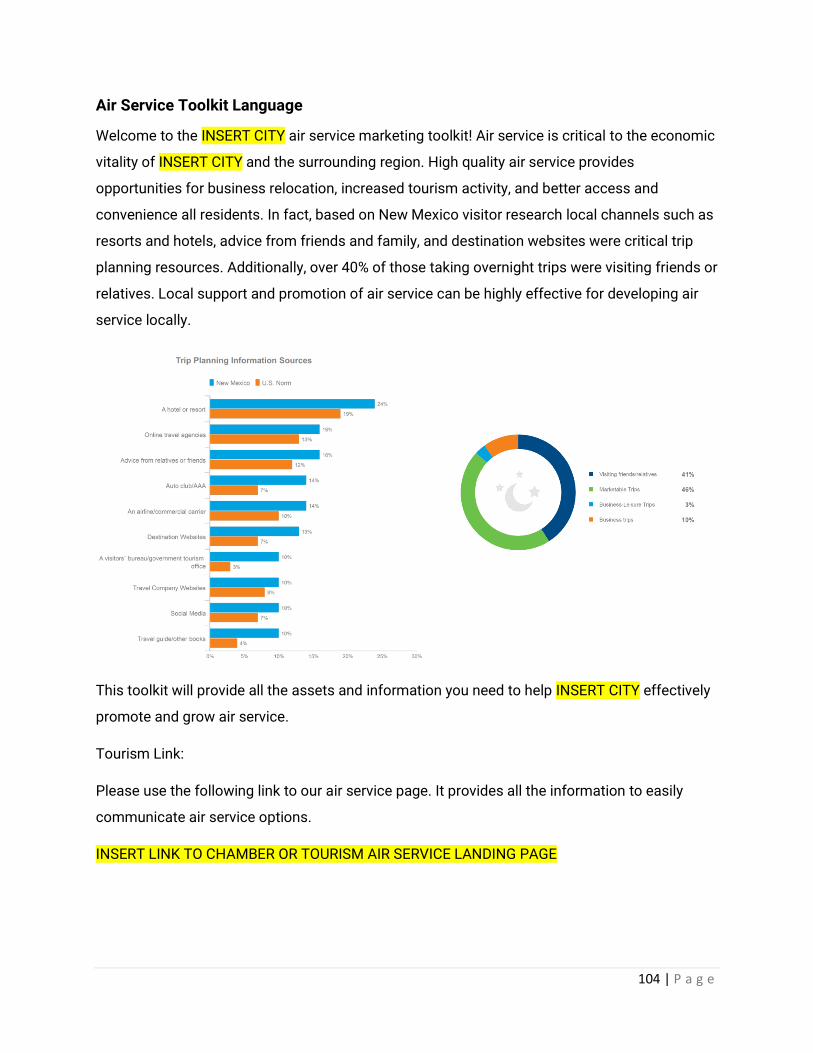
104 | P a g e
Air Service Toolkit Language
Welcome to the INSERT CITY air service marketing toolkit! Air service is critical to the economic
vitality of INSERT CITY and the surrounding region. High quality air service provides
opportunities for business relocation, increased tourism activity, and better access and
convenience all residents. In fact, based on New Mexico visitor research local channels such as
resorts and hotels, advice from friends and family, and destination websites were critical trip
planning resources. Additionally, over 40% of those taking overnight trips were visiting friends or
relatives. Local support and promotion of air service can be highly effective for developing air
service locally.
This toolkit will provide all the assets and information you need to help INSERT CITY effectively
promote and grow air service.
Tourism Link:
Please use the following link to our air service page. It provides all the information to easily
communicate air service options.
INSERT LINK TO CHAMBER OR TOURISM AIR SERVICE LANDING PAGE
105 | P a g e
Homepage placement:
Air service should be promoted in a prominent location on your website. Ideally, this can include
two primary elements:
1) Banner Ads
2) Textual messages with links
Digital Banners:
Use digital banner assets found in the toolkit on your home page and other prominent web
pages to ‘link’ to your transportation or ‘Getting Here’ page.
IDEALLY THE CHAMBER/TOURISM ENTITY WILL CREATE A FEW STANDARDIZED AIR SERVICE
BANNERS FOR USE THROUGH PARTNER CHANNELS – THESE SHOULD REFLECT THE
TOURISM MARKETING BRAND/MESSAGING
Textual messages:
If you prefer textual messages instead of digital banners, here a few options to choose from:
Generic:
Getting here is easy with daily flights from CITY to CITY - Fly to CITY on AIRLINE (use ‘Air
Service Page’ link above)
‘Getting here’ Placement
“Getting here’ or ‘Transportation’ placements are key areas to promote and build awareness of
air service messaging. Ensure that air messaging is the prominent, ‘headline’ message before
other options. You can follow the same copy/creative direction found under ‘homepage
placement’, but here is some additional copy that may be helpful:
Non-stop messaging examples:
You can reach Taos non-stop from Los Angeles, Carlsbad/San Diego, Austin, and Dallas/Love
Field during the Winter season on Taos Air.
Airport shuttles and car rental agencies are available at the Taos Regional Airport.
(Use ‘Air Service Page’ link above)
106 | P a g e
Non-stop and connecting market messaging example:
You can reach Roswell from over 100 cities worldwide – including Las Vegas, Orlando, Los
Angeles, Chicago, and Houston. Enjoy convenient year-round flights on American Airlines to
Roswell from Dallas/Ft Worth and Phoenix.
You can use your airports top connecting markets in this example, or if Tourism is focused on key
feeder markets, use those.
Learn more (use ‘Air Service Page’ link above)
Groups/Meetings Product
Most airlines provide group and meeting rates. In some cases, these airlines will negotiate
generous discounts for large groups depending on time of day, day of week, and season. You
can use the following information to promote and communicate group travel options: Traveling
with a group or planning a meeting? Find attractive group pricing options for parties of 10 or
more.
Learn more (use ‘Air Service Page’ link above)
Call hold Messaging
If your property has hold messaging for callers, consider adding a hold message to promote air
service to CITY.
Sample Message:
Non-stop messaging examples:
You can reach Taos non-stop from Los Angeles, Carlsbad/San Diego, Austin, and Dallas/Love
Field during the Winter season on Taos Air.
Ask our customer service representative for more details
Non-stop and connecting market messaging example:
You can reach Roswell from over 100 cities worldwide – including Las Vegas, Orlando, Los
Angeles, Chicago, and Houston. Enjoy convenient year-round flights on American Airlines to
Roswell from Dallas/Ft Worth and Phoenix.
Ask our customer service representative for more details
107 | P a g e
Confirmation Page Link:
One of the easiest ways to build awareness of air service is by creating messaging on your
confirmation page (the page your guest ends a booking transaction) with link to book air. Like
the ‘homepage messaging’, these messages would be ideal for placement on confirmation
pages:
A) NON-STOP: Getting here is easy with daily flights from Carlsbad to Albuquerque and
Dallas/Ft Worth - Fly to Carlsbad on Boutique Air (use ‘Air Service Page’ link above)
OR
B) NON-STOP/CONNECTING: Getting here is easy with daily flights from Dallas/Ft Worth,
Denver, and Phoenix to Santa Fe - Fly to Santa Fe and connect from hundreds of cities
worldwide (use ‘Air Service Page’ link above)
Alternatively, you can use digital banner assets found in the toolkit and link to the link options
above.
Phone Reservations Messaging:
After a customer books a reservation over the phone, customer service representatives could
cross-sell air after booking.
Sample script:
“Thank you for staying at xxxx. Just a reminder, you can fly to Santa Fe. Flights operate year-
round via Dallas/Ft Worth, Denver, and Phoenix – or connect from hundreds of other cities
worldwide.”
If your hotel property provides free airport transfers, this could also be integrated into the
messaging.
Email Channels:
Email channels include web banners, copy, and links. Like the ‘homepage’ placements,
these messages work well in email content as well as email signature ‘sign-offs’:
One-line, simple options:
A) NON-STOP: Getting here is easy with daily flights from Phoenix to Silver City - Fly to
Silver City on Advanced Airlines (use ‘Air Service Page’ link above)
108 | P a g e
B) NON-STOP/CONNECTING: Getting here is easy with daily flights from Hobbs to
Houston/IAH - Fly to Hobbs on United Airlines – or connect to Hobbs from over 100
cities worldwide (use ‘Air Service Page’ link above)
Social media channels:
With any reference to ‘getting to’ Mammoth Lakes, always sign off with air.
General Air Messaging:
Like the home page messaging, these messages would be ideal for Twitter
Twitter Copy:
A) Getting here is easy with daily flights from Phoenix to Silver City - Fly to Silver City on
Advanced Airlines (use ‘Air Service Page’ link above)
B) Getting here is easy with flights from Hobbs to IAH - Fly to Hobbs on United and connect
to Hobbs from hundreds of cities worldwide (use ‘Air Service Page’ link above)
Facebook Copy:
At the end of your post, add an air call to action:
A) NON-STOP: Getting here is easy with daily flights from Carlsbad to Albuquerque and
Dallas/Ft Worth - Fly to Carlsbad on Boutique Air (use ‘Air Service Page’ link above)
OR
B) NON-STOP/CONNECTING: Getting here is easy with daily flights from Dallas/Ft Worth,
Denver, and Phoenix to Santa Fe - Fly to Santa Fe and connect from hundreds of cities
worldwide (use ‘Air Service Page’ link above)
Facebook (ads):
• Text: Fly to Taos
• Image: Recommended size is 1200x627. Not supposed to have any text overlay.
• Headline: Flights to Taos
• Description: Enjoy the fastest route to the Rockies – Fly from private terminals with transfer
to the resort and ski rentals included.
Blog stories or Editorial Content:
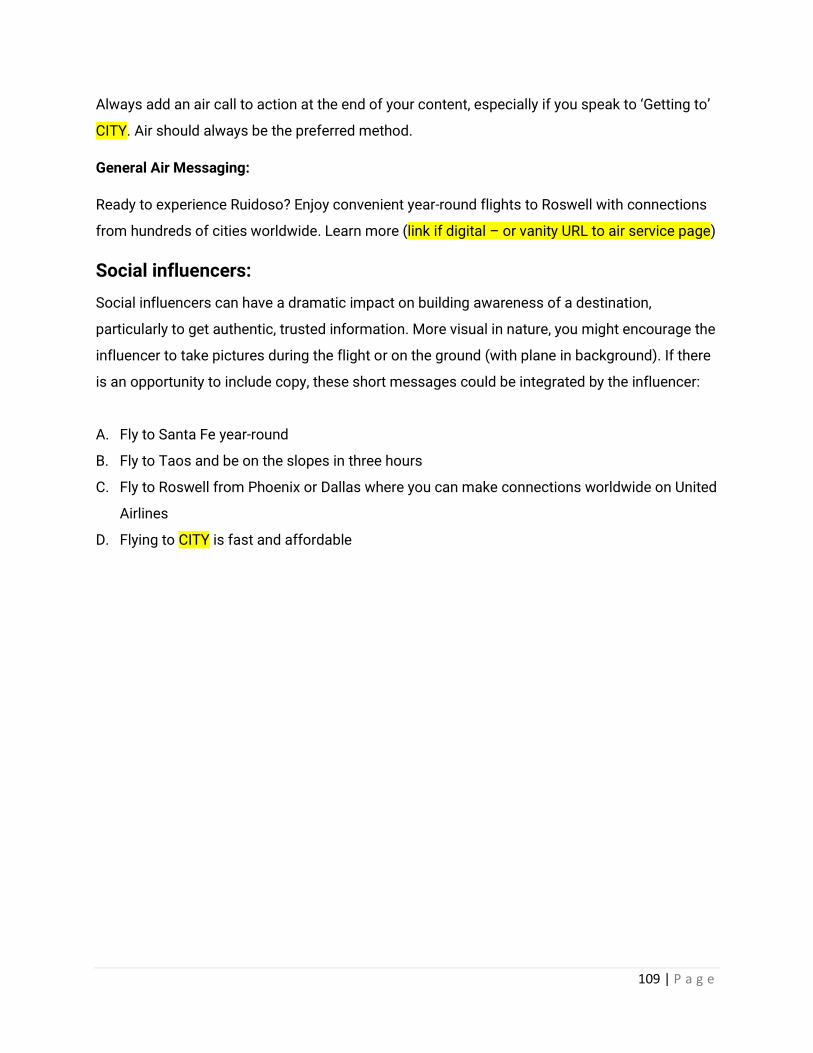
109 | P a g e
Always add an air call to action at the end of your content, especially if you speak to ‘Getting to’
CITY. Air should always be the preferred method.
General Air Messaging:
Ready to experience Ruidoso? Enjoy convenient year-round flights to Roswell with connections
from hundreds of cities worldwide. Learn more (link if digital – or vanity URL to air service page)
Social influencers:
Social influencers can have a dramatic impact on building awareness of a destination,
particularly to get authentic, trusted information. More visual in nature, you might encourage the
influencer to take pictures during the flight or on the ground (with plane in background). If there
is an opportunity to include copy, these short messages could be integrated by the influencer:
A. Fly to Santa Fe year-round
B. Fly to Taos and be on the slopes in three hours
C. Fly to Roswell from Phoenix or Dallas where you can make connections worldwide on United
Airlines
D. Flying to CITY is fast and affordable

110 | P a g e
FAM Trips or Travel Writers:
Travel writers or other influencers hosted by the region can have a dramatic impact on building
awareness of a destination, particularly to get authentic, trusted information. As a rule of thumb,
always recommend and provide air transportation to CITY and build air service into the
narrative. Like the influencers, encourage this group to take pictures during the flight or on the
ground (with plane in background). In terms of copy, build air service into the itinerary and
suggest inclusion in editorial content.
Short content:
A. Fly to Santa Fe year-round
B. Fly to Taos and be on the slopes in three hours
C. Fly to Roswell from Phoenix or Dallas where you can make connections worldwide on
American Airlines
D. Flying to CITY is fast and affordable
Longer content:
General Air Messaging:
A) NON-STOP: Ready to experience all that the Carlsbad region has to offer? Getting here is
easy with daily flights from Carlsbad to Albuquerque and Dallas/Ft Worth - Fly to
Carlsbad on Boutique Air (use ‘Air Service Page’ link above)
OR
B) NON-STOP/CONNECTING: Getting to Santa Fe is convenient and easy with daily flights
from Dallas/Ft Worth, Denver, and Phoenix to Santa Fe - Fly to Santa Fe and connect
from hundreds of cities worldwide (use ‘Air Service Page’ link above)