new york state report on sepsis care improvement
TRANSCRIPT

New York State Report on Sepsis Care Improvement Initiative:
Hospital Quality Performance
Office of the Medical Director Office of Quality and Patient Safety
April 2021
2018

Page Intentionally Left Blank
Table of Contents
Introduction................................................................................................................................................. 5
The New York State Sepsis Care Improvement Initiative .......................................................................... 6
Data Collection ........................................................................................................................................... 6
Patient Population .......................................................................................................................... 6
Data Source and Data Submission ................................................................................................ 7
Quality Measures ........................................................................................................................... 7
Statewide Incidence and Trends ................................................................................................................ 9
Early Intervention Bundles .......................................................................................................... 11
Outcome Measures ..................................................................................................................... 18
Hospital Performance ............................................................................................................................... 20
Performance Data – Adults ......................................................................................................... 23
Performance Data – Pediatrics .................................................................................................. 35
Hospital Performance Over Time …………………………………………………………………….37
Risk Adjusted Mortality ............................................................................................................................. 40
Risk Adjusted Mortality Performance Over Time……………………………………………………49
Relationship Between Process Measures on Risk Adjusted Mortality……………………………50
New York State Quality Improvement Efforts .......................................................................................... 51
Sepsis Advisory Group................................................................................................................ 51
IPRO, Implementation Business Partner .................................................................................... 52
Krasnoff Quality Management Institute ....................................................................................... 52
Partnership for Patients (P4P) ................................................................................................... 52
New York State Hospitals ........................................................................................................... 52
The Rory Staunton Foundation ................................................................................................... 53
Support for Research .................................................................................................................. 53
Next Steps ................................................................................................................................................ 54
Definitions of Key Terms .......................................................................................................................... 54
Technical Appendix A .............................................................................................................................. 56
Technical Appendix B .............................................................................................................................. 59
Technical Appendix C .............................................................................................................................. 64

Page Intentionally Left Blank

5
Introduction Sepsis is a life-threatening condition that requires early detection and timely, appropriate interventions to improve the chances of survival and optimize outcomes for patients of all ages. A continuum of severity from sepsis to severe sepsis and septic shock exists. Since 2014, the New York State (NYS) Sepsis Care Improvement Initiative has been a resource for quality improvement in sepsis care with the goal to improve early detection of severe sepsis and septic shock, initiate timely interventions, and reduce overall mortality. Severe sepsis and septic shock impact approximately 50,000 patients in NYS each year, and on average almost 30% of patients died from this syndrome prior to the implementation of this initiative. In addition, many more may experience lifelong impairments because of the broad impact that sepsis may have on organ and tissue function.
This report builds upon the NYS Department of Health’s (the Department) long history of data-driven quality improvement activities. It is consistent with the Department’s mission to protect and promote the health of New Yorkers through prevention, science, and the assurance of quality health care delivery. The Department is pleased to present this fourth annual public report of updated data from the NYS Sepsis Care Improvement Initiative. This report contains results from 2018 for hospitals’ use of sepsis protocols to identify and treat adults and children with severe sepsis and septic shock. The report details data collection on adult and pediatric cases of severe sepsis and septic shock, sepsis quality measures and outcomes on which hospitals are compared, statewide trends for key quality measures and outcomes, and key ongoing collaborations between the Department and external partners. The report represents considerable efforts by NYS hospitals and clinicians, over the past five years, to measure and improve care and outcomes for individuals with this common, complex, and lethal condition. Special Note About the 2018 Report and Future Reports The annual ‘New York State Report on Sepsis Care Improvement Initiative: Hospital Quality Performance’ is typically drafted and posted publicly by the Department approximately one year after the close of the final quarter in a year and upon the completion of an extensive data cleaning, audit and follow-up process with hospitals, and the development of a risk-adjusted mortality model for the year. The authors of this report joined efforts to respond to the COVID-19 Pandemic in early 2020 and this report is uncharacteristically late as a result. The Department strives to provide data and feedback to NYS hospitals through this report in a way that is timely and actionable for the purpose of improving sepsis care in NYS. To that end, the Department will make every effort to deliver timely reports for future years, including a combined 2019-2020 report and a new report for Sepsis/Covid-19 Digitalized data collection beginning in 2021. Purpose of this Report
The purpose of this public report is to provide actionable information to hospitals to support their ongoing quality improvement efforts; to inform new initiatives surrounding sepsis care; and to educate patients and caregivers as part of a statewide initiative to reduce the impact of this deadly condition by improving early detection and intervention for patients with sepsis, focused on the deadliest forms – severe sepsis and septic shock. The overall observed decrease in adult mortality and concomitant improvement in processes of care measures demonstrates continued improvement in sepsis care across the State since implementation of the NYS Sepsis

6
Care Improvement Initiative. While the Department is optimistic about this improvement and about the future of sepsis care in NYS, there is still additional room for improvement. This report aims to highlight the areas for improvement to assist hospitals and clinicians in focusing their efforts.

7
The New York State Sepsis Care Improvement Initiative The NYS Sepsis Care Improvement Initiative began in 2014 with a goal to reduce sepsis-related mortality in NYS. The initiative, by amendment of Title 10 of the NYS Codes, Rules and Regulations (Sections 405.2 and 405.4), requires each acute care hospital in NYS that provides care to patients with sepsis to develop and implement evidence-informed sepsis protocols, which describe their approach to both early recognition and treatment of sepsis patients. In addition, hospitals are required to report data on all diagnosed cases of severe sepsis or septic shock, regardless of billing code designation, to the Department. Cases diagnosed as sepsis but that do not meet criteria for severe sepsis or septic shock are not submitted. These data are used to evaluate each hospital’s performance on key process measures of early treatment and outcomes measures (i.e., risk-adjusted mortality rates). The Department uses clinical information submitted by each hospital to develop a methodology to evaluate ‘risk-adjusted’ mortality rates (RAMR) for each hospital. Risk adjustment takes into consideration the different mix of characteristics and comorbid conditions, including sepsis severity of patients cared for within each hospital and permits comparison of hospital performance.
Data Collection Patient Population
For the purpose of data collection in the NYS Sepsis Care Improvement Initiative, sepsis is defined as a life-threatening medical emergency that requires early recognition and intervention. Sepsis means confirmed or suspected infection accompanied by two systemic inflammatory response syndrome (SIRS) criteria; severe sepsis shall mean sepsis complicated by organ dysfunction[s]; and for adults, septic shock shall mean sepsis-induced hypotension persisting despite adequate IV fluid resuscitation and/or evidence of tissue hypo perfusion. This is based on the current nationally recognized Sepsis-2 definition. In 2016, a task force convened by national societies including the Society of Critical Care Medicine (SCCM) and the European Society of Intensive Care Medicine (ESICM) proposed a new definition of sepsis, termed Sepsis-3. The Department consulted with the NYS Sepsis Advisory Group and decided that due to the complexity of the method, the lack of requisite data for many patients at presentation, and concerns that it may result in later identification of patients who might have sepsis, that the Sepsis-3 definition is impractical for the purpose of identification and data collection in the NYS Sepsis Care Improvement Initiative. Therefore, the Department has decided to continue use of the Sepsis-2 definition in the NYS Sepsis Care Improvement Initiative. This report presents hospital-reported data for adult and pediatric patients with a diagnosis of severe sepsis or septic shock evaluated at NYS hospitals from the first quarter (Q1) of 2015 through the fourth quarter (Q4) of 2018. However, in this report, the terms ‘sepsis’ and ‘severe sepsis or septic shock’ are used interchangeably to refer to these patients. Patient cohorts within this broader population differ across various sections and measures in this report. These differences reflect the Department’s intent to understand care for all patients with sepsis while also conducting fair comparisons of hospitals’ care processes and outcomes. In the first section, aggregate data from all reporting hospitals are used to present statewide trends and includes all patients diagnosed with severe sepsis or septic shock, with limited exceptions, regardless of whether the patient presented with severe sepsis or septic shock in the emergency department or an inpatient unit. The next section describes hospital-specific data, which includes all patients for measures that are relevant to all hospitals, while other measure populations are limited to patients who are not transferred. These differences are fully described in each section.

8
In 2018, high-volume hospitals with large numbers of sepsis patients had the option of reporting on a representative random sample of 400 sepsis patients for the calendar year, rather than reporting on their entire population of sepsis patients. Thirty (30) hospitals opted to report a sample of patients. For these hospitals, the selected sample was compared to the eligible population with regard to key patient characteristics, and results demonstrated that the sample did not differ significantly from the hospital’s whole eligible population (see appendix on details about sampling).
In this report, adult patients are defined as those age 18 years or older and pediatric patients are those aged younger than 18 years. Data in this report are presented through 2018 to align with risk-adjusted mortality data, which are available for calendar year 2018.
The sepsis population excludes those patients with advance directives that precluded implementing sepsis care interventions, patients who refused sepsis care interventions, and neonates who were not discharged from the neonatal intensive care unit (NICU).
Data Source and Data Submission
The primary data source for this report is the Sepsis Clinical Database (SCD). The SCD is comprised of demographic and clinical data abstracted from the hospital medical record by hospital staff. These abstracted data are submitted electronically to a secure web portal hosted by Island Peer Review Organization (IPRO), the Medicaid External Quality Review Organization for New York State, for validation. IPRO conducts an independent audit of a sample of medical records for each hospital to ensure data integrity and accuracy.
Quality Measures
Quality measures including process and outcome measures are calculated for reporting both statewide rates and trends and hospital-specific rates and trends. The Adult NYS sepsis process of care measures were developed using a National Quality Forum (NQF) measure for guidance: NQF #500 Severe Sepsis and Septic Shock: Management Bundle. The Pediatric NYS sepsis process of care measures are aligned with Surviving Sepsis Campaign International Guidelines for Management of Severe Sepsis and Septic Shock 2012. These measures, reported as statewide and hospital-specific rates, reflect several key processes of care that can increase the probability of surviving an episode of sepsis.
The start time for care process measures is the time at which patients presented with severe sepsis or septic shock. Presentation is defined as the time at which all criteria for severe sepsis or septic shock were met, or a clinician documented a diagnosis of severe sepsis or septic shock. Explicit criteria for severe sepsis presentation and septic shock presentation are defined in a publicly available data dictionary. These criteria include a combination of infection, signs of SIRS, and organ dysfunction for severe sepsis. Septic shock was defined as severe sepsis plus persistent hypotension and/or inadequate tissue perfusion as evidenced by elevated lactate level.
For the 30 hospitals that opted to sample in 2018, adult measure performance is calculated using a representative random sample of cases and serves as an estimate of actual performance. For all remaining hospitals, and all pediatric measures, the actual observed performance is reported. More information on sampling and how the adult measures are calculated for these hospitals can be found in Appendix A.

9
Two mortality outcome measures are presented in the 2018 report. Statewide trends over time for both the adult and pediatric populations are presented using crude in-hospital mortality, consistent with previous reports. Mortality in this measure includes all cases of severe sepsis or septic shock who expired in the hospital, regardless of length of stay. In contrast, risk-adjusted mortality utilizes 30-day post-presentation mortality. This measure includes all severe sepsis patient deaths that occurred within 30 days of the presentation of severe sepsis, including patients who were discharged alive from the hospital but expired within 30 days of presentation and excluding patients who died in the hospital but expired more than 30 days post presentation. More information regarding the risk adjustment methodology can be found in Appendix B.
Limitations
There are some limitations to the data presented in this report. The data in this report reflect medical record documentation, and it is possible that elements of care were provided but not documented. It is also possible that some patient characteristics that were not collected, such as uncommon comorbid conditions, are not reflected in the measures but may have impacted outcomes. The start time in the prior reports, which was the time of initiation of the hospital’s protocol, may not be aligned with the start time in this report, which is the time of severe sepsis and septic shock presentation. This difference should be considered in interpreting year over year comparisons.

10
Statewide Incidence and Trends Statewide rates and rate trends are reported using data for all patients diagnosed with severe sepsis or septic shock. The denominator for population rates uses 2015-2018 Claritas small-area NYS population data. Only NYS residents are included in calculating population rates. Tables 1 and 2 display calendar year incidence rates of severe sepsis or septic shock for adult (age >=18) and pediatric (age <18) patients by age and sex. In 2018, there were approximately 417 sepsis cases per 100,000 adults and about 14 sepsis cases per 100,000 children. Among adults, males had a higher incidence of sepsis compared to females (461 vs. 377 cases per 100,000). Sepsis incidence among adults generally increased with age, with adults age 80 and older having the highest incidence of sepsis (about 2,500 sepsis cases per 100,000). Among children, females had higher incidence of sepsis compared to males (15 vs. 13 cases per 100,000). Sepsis incidence was highest among infants under one year (36 cases per 100,000) and lowest among children ages 6-11 (8 cases per 100,000).
Table 1. Adult Severe Sepsis or Septic Shock Cases by Sex and Age, 2018
Characteristic Level Cases (N) Cases (%) Cases per 100,000
Sex Female 30,653 47% 377.0 Male 34,500 53% 461.2
Age Group 18-29 1,676 3% 50.5 30-39 2,294 4% 85.7 40-49 3,670 6% 146.7 50-59 8,370 13% 306.6 60-69 13,552 21% 592.7 70-79 15,481 24% 1192.9 80+ 20,110 31% 2505.9
Total Total Adults 65,153 100% 417.3
Table 2. Pediatric Severe Sepsis or Septic Shock Cases by Sex and Age, 2018
Characteristic Level Cases (N) Cases (%) Cases per 100,000
Sex Female 298 52% 14.6 Male 272 48% 12.7
Age < 1 year 82 14% 35.8 1-2 110 19% 23.6 3-5 80 14% 11.4 6-11 116 20% 8.4 12-17 182 32% 13.0
Total Total Children 570 100% 13.6

11
Figures 1 and 2 show trends in overall incidence of severe sepsis and septic shock by quarter from Q1 2016- Q4 2018 for adult and pediatric patients. The population denominator used for each quarter is the calendar year population for that year and quarterly rates presented here are not comparable to the yearly rates presented above. Among adults, sepsis incidence has increased from about 93 cases per 100,000 at the beginning of 2016 to 107 cases per 100,000 at the end of 2018; though this increase may be due to better detection or better reporting rather than a true increase in incidence. There is also a seasonal pattern to sepsis cases, such that highest incidence of sepsis incidence occurs in the first quarter (January to March) of each year. Among children, sepsis cases have decreased from 4.7 cases per 100,000 at the beginning of 2016 to 4.1 cases at the end of 2018.
Figure 1. Adult Sepsis Cases per 100,000 by Quarter 2016-18
Figure 2. Pediatric Sepsis Cases per 100,000 by Quarter 2016-18
92.985.0 82.5
89.396.0 92.5 89.8
96.4
109.099.4 101.8
107.1
0.0
20.0
40.0
60.0
80.0
100.0
120.0
Seps
is C
ases
Per
100
,000
Quarter
4.7
3.93.5
3.8 3.9 3.9
3.4 3.33.7
3.0 2.9
4.1
0.0
1.0
2.0
3.0
4.0
5.0
Seps
is C
ases
Per
100
,000
Quarter

12
Statewide Trends Statewide rates and trends are reported using data for all patients diagnosed with severe sepsis or septic shock submitted to the Department for measure calculation, with measure-specific exclusions as noted below. The measures calculated using aggregate data from all hospitals for statewide reporting are briefly summarized below. Adult Specific Measure Descriptions: • Adult Early Intervention Bundle: The percentage of adult patients with severe sepsis or
septic shock who received blood cultures and lactate measurement within three (3) hours of start time and broad-spectrum antibiotics up to 24 hours before and within three (3) hours of start time. Start time for this measure is the date and time of presentation of severe sepsis. This measure is not calculated for patients who were excluded from the hospital’s protocol or from specific care interventions, or who died within three (3) hours of start time
• Individual Bundle Component Rates: Timely Antibiotics: The percentage of adult patients with severe sepsis or septic shock who received broad spectrum antibiotics within three (3) hours of severe sepsis start time and up to 24 hours before start time.
• Adult Composite Bundle: The percentage of adult patients with septic shock who received
all the recommended interventions in the six-hour early management composite bundle, including interventions in the three-hour early management bundle within three hours of severe sepsis presentation, a repeat lactate level within six hours of severe sepsis start time if initial lactate level is elevated, resuscitation with crystalloid fluids within three hours of septic shock start time, fluid status assessment within six hours of septic shock start time, and vasopressor therapy within six hours of septic shock start time if persistent hypotension after fluid resuscitation is present. This measure is not calculated for patients who were excluded from the hospital’s protocol or from specific care interventions, or who died within six hours of start time.
Outcome Measure: • Adult In-Hospital Mortality: The percentage of adult patients with severe sepsis or septic
shock with in-hospital mortality.
Pediatric Specific Measures Descriptions: Pediatric Early Intervention Bundle: The percentage of pediatric patients with severe sepsis or septic shock who received all the recommended early interventions within one (1) hour of severe sepsis or septic shock start time. This measure is not calculated for patients who were excluded from the hospital’s protocol or from specific care interventions, or who died within one (1) hour of start time. • Individual Bundle Components: The percentage of pediatric patients with severe sepsis
or septic shock who received antibiotics within one (1) hour of severe sepsis presentation and not more than 24 hours prior to presentation (start time).

13
Outcome Measure: • Pediatric In-Hospital Mortality: The percentage of pediatric patients with severe sepsis or
septic shock with in-hospital mortality.
Early Intervention Bundle Results: Timely intervention for severe sepsis and septic shock is critical. Current guidelines recommend timely collection of blood cultures and lactate level and early administration of antibiotics for patients with severe sepsis or septic shock. Delay in bundle completion and delay in antibiotic administration for sepsis have been associated with a higher risk of mortality. Repeat lactate levels, fluids, and vasopressors for blood pressure support are recommended for a subset of patients with certain manifestations of severe sepsis or septic shock.
Figures 3-6 depict trend analyses based on aggregated data submitted by hospitals from First Quarter (Q1) 2015 through Fourth Quarter (Q4) 2018. For the measures with specified time parameters in the trend graphs for this section (Figures 3-7) , ‘start time’ is defined as the presentation time of severe sepsis (Figures 3, 5-7) or septic shock (Figures 4) for calendar year (CY) 2017 and 2018, while in previous years, start time was defined as the date and time when each hospital determined that its protocol had been initiated for each patient. Although initiation of a hospital’s sepsis protocol would likely coincide with the presentation of sepsis, the potential difference is a limitation and should be considered in interpretation of measure rate trends. Beginning in 2017, statewide measures for adults are weighted by total adult case volume within sampling hospitals.

14
Figure 3 shows the percentage of adult patients (age ≥ 18) with severe sepsis or septic shock for whom all the recommended early interventions in the three-hour early management bundle were administered within the recommended timeframe. These interventions include measurement of lactate level, blood culture collection prior to antibiotics, and antibiotic administration. Patients who died within three hours of start time and those with clinical contraindications to any of the recommended interventions are excluded from this measure bundle. At the onset of the initiative, 48.5% of eligible patients with severe sepsis or septic shock received all three interventions within the recommended timeframe, while by Q4 2018 the percentage increased to 71.4%.
Figure 3. Adult Early Intervention (3-Hour Early Management Bundle): Quarter One,
2015 through Quarter Four, 2018*
(*) excludes patients with clinical contraindications for protocol interventions or who died within three hours
48.5% 50.4% 50.4% 54.1% 53.0% 55.8% 56.8% 59.5% 62.8% 65.7% 65.3% 66.1% 67.3% 69.6% 69.4% 71.4%
0.0%
10.0%
20.0%
30.0%
40.0%
50.0%
60.0%
70.0%
80.0%
90.0%
100.0%
Perc
enta
ge
Quarter

15
Figure 4 shows the percentage of adult patients (age ≥ 18) with severe sepsis or septic shock for whom all the recommended early interventions in the composite early management bundle were administered within the recommended timeframe. It should be noted that the variable Repeat Volume Status and Tissue Perfusion Reassessment was included in the Composite Early Management Bundle for the first time in 2017. The addition of this variable appeared to suppress the Composite Bundle rates in 2017 and trends should therefore be interpreted with caution.
Figure 4. Adult Early Intervention (Composite Early Management Bundle): Quarter One,
2015 through Quarter Four, 2018*
(*) excludes patients with clinical contraindications for protocol interventions or who died within six hours
28.0% 30.5% 30.6% 33.1% 34.1% 35.6% 36.8% 39.7%32.3% 35.5% 35.9% 36.1% 37.3% 40.4% 41.5% 43.8%
0.0%
10.0%
20.0%
30.0%
40.0%
50.0%
60.0%
70.0%
80.0%
90.0%
100.0%
Perc
enta
ge
Quarter

16
Figure 5 shows the percentage of pediatric patients (age < 18) with severe sepsis or septic shock who received all interventions in the early management bundle within one hour.
Figure 5. Pediatric Early Intervention (1-Hour Early Management Bundle): Quarter One,
2015 through Quarter Four, 2018*
(*) excludes patients with clinical contraindications for protocol interventions or who died within one hour
16.7%22.0%19.9%
28.3%24.1%25.0%19.2%21.7%
30.4%
42.9%41.6%
29.0%32.7%41.4%37.7%
56.4%
0.0%10.0%20.0%30.0%40.0%50.0%60.0%70.0%80.0%90.0%
100.0%
Perc
enta
ge
Quarter

17
The percentage of adult patients (age > 18) with severe sepsis or septic shock that received broad spectrum antibiotics is presented in Figure 6 independently from the bundle results.
Figure 6. Adult Early Intervention (Timely Administration of Broad-Spectrum
Antibiotics): Quarter One, 2015 through Quarter Four, 2018*
(*) excludes patients with clinical contraindications for protocol interventions or who died within three hours
The percentage of pediatric patients (age < 18) with severe sepsis or septic shock that received broad spectrum antibiotics is presented in Figure 7 independently from the bundle results.
66% 68% 68% 70% 69% 70% 70% 72%
84% 83% 85% 86% 86% 87% 88% 89%
0%
10%
20%
30%
40%
50%
60%
70%
80%
90%
100%
Perc
enta
ge
Quarter

18
Figure 7. Pediatric Early Intervention (Timely Administration of Broad-Spectrum
Antibiotics): Quarter One, 2015 through Quarter Four, 2018*
(*) excludes patients with clinical contraindications for protocol interventions or who died within one hour
29%33%
47%
19%
29% 28%
39% 41%
70% 70%74% 72% 69%
75%
64%
80%
0%
10%
20%
30%
40%
50%
60%
70%
80%
90%
100%
Perc
enta
ge
Quarter

19
In-Hospital Mortality To evaluate the impact of the NYS Sepsis Care Improvement Initiative on the outcomes of patients with severe sepsis and septic shock, the percentage of sepsis patients with in-hospital mortality is calculated. Trends in overall mortality from severe sepsis or septic shock are presented in Figures 8 and 9. All patients with severe sepsis or septic shock submitted to the Department are included in the mortality calculation and, beginning in 2017, statewide in-hospital mortality for adults is weighted by total adult case volume within sampling hospitals. Figure 8 shows the percentage of adult patients (age > 18) with severe sepsis or septic shock who died during their hospital stay. The overall mortality continued to decrease in 2018, from 32% in Q1 2015 to 23.5% in Q4 2018.
Figure 8. Adult In-Hospital Mortality: Quarter One, 2015 through Quarter Four, 2018
32.0% 28.4% 27.9% 27.3% 28.1% 26.4% 25.8% 26.0% 26.5% 24.2% 24.0% 24.4% 25.0% 22.6% 23.0% 23.5%
0.0%
10.0%
20.0%
30.0%
40.0%
50.0%
60.0%
70.0%
80.0%
90.0%
100.0%
Perc
enta
ge
Quarter

20
Figure 9 shows the percentage of pediatric patients with severe sepsis or septic shock (age < 18) who died during their hospital stay. The percentages of mortality for pediatric patients fluctuated across quarters, with mortality of 8.5% reported in Q4 2018. In-hospital mortality ranged from a low of 6.5% reported in Q3 2015 to the highest percentage of 15.3% reported in Q1 2015. The fluctuation in percentages is likely influenced by the low volume of pediatric cases in each quarter. The number of pediatric cases per quarter in 2018 ranged from a low of 124 in Q3 2018 to a high of 176 in Q4 2018. Figure 9. Pediatric In-Hospital Mortality: Quarter One, 2015 through Quarter Four, 2018
15.3%8.8% 6.5% 8.6% 9.7% 6.9%
11.8%10.5% 8.2% 7.0% 7.5% 9.3% 12.5%7.1% 8.1% 8.5%
0.0%
10.0%
20.0%
30.0%
40.0%
50.0%
60.0%
70.0%
80.0%
90.0%
100.0%
Perc
enta
ge
Quarter

21
Hospital Performance The hospital-specific measures are described below. Process of care measures that are presented for hospital performance comparison include all patients with severe sepsis or septic shock in the measures, except for those excluded from protocols for clinical contraindications or other valid reasons. For hospital-specific processes of care measures transferred patients are additionally excluded, since they have received care at more than one hospital.
Hospital Specific Measure Descriptions: • Adult Broad-Spectrum Antibiotic Administration: The percentage of adult patients with
severe sepsis or septic shock who receive broad spectrum antibiotics within three hours of presentation and up to 24 hours before presentation, a critical early intervention, is presented independent of early management bundle completion.
• Adult Early Intervention Bundle: The percentage of adult patients with severe sepsis or septic shock who received all the recommended early interventions in the three-hour early management bundle within three (3) hours of severe sepsis presentation. The three-hour bundle includes measurement of a blood lactate level, collection of blood cultures, and administration of broad-spectrum antibiotics. Patients with clinical exclusions for any of the interventions and patients who have been transferred from or to another acute care hospital are excluded from this measure.
• Adult Composite Bundle: The percentage of adult patients with septic shock treated with the hospital’s sepsis protocol who received all the recommended early interventions in the six-hour early management bundle for which they were eligible within three hours of severe sepsis presentation (repeat lactate level) or within six hours of septic shock presentation (all other six-hour bundle elements). The six-hour bundle includes the interventions in the three-hour bundle plus fluid administration, fluid status assessment, vasopressors, and remeasurement of lactate for eligible patients. Patients with clinical contraindications to any of the interventions and patients who have been transferred from or to another acute care hospital are excluded from this measure.
• Pediatric Broad-Spectrum Antibiotic Administration: The percentage of pediatric patients with severe sepsis or septic shock who received broad spectrum antibiotics within one hour of presentation and up to 24 hours before presentation, a critical early intervention, is presented independent of early management bundle completion.
• Pediatric Early Intervention Bundle: The percentage of pediatric patients with sepsis treated with the hospital’s sepsis protocol who received all the recommended pediatric early interventions within one (1) hour of presentation of severe sepsis or septic shock. The pediatric one-hour bundle includes blood culture collection, antibiotic administration, and fluid administration. Patients with clinical exclusions and patients who have been transferred from or to another acute care hospital are excluded from this measure.
Hospital Performance Data – Adults Hospital-reported data were used to calculate the hospital-specific performance measures described above. Hospitals with 10 or fewer sepsis cases are not included in hospital comparisons in this report. Table 3 shows how hospitals were categorized and ranked according to performance on the measures. After calculating the performance measures for

22
each hospital, the data for each individual measure were ordered from the lowest percentage to the highest percentage achieved and divided into quintiles. Each hospital was assigned to a “performance level” category based on the quintile into which their percentage fell for a given measure. Those hospitals ranked in quintile 1 are the lowest performers and those hospitals ranked in quintile 5 are the highest performers. Table 3 shows the quintiles, category assignment, and the range of percentages represented in each category for adult timely administration of broad-spectrum antibiotics, three-hour bundle, and six-hour bundle.
Table 3. Category Assignment for the Adult Sepsis Performance Measures, 2018
Quintile Category Summary
Table Symbol
Ranking Percentiles
Timely Antibiotics
(%)
3-Hour Bundle
(%)
Composite Bundle (%) (Performance
Level)
Quintile 5 Highest 80th – 100th 93.31 - 97.70 79.61 - 91.60 55.01 - 81.80
Quintile 4 High 60th – 80th 90.11 - 93.30 74.41 - 79.60 45.71 - 55.00
Quintile 3 Middle 40th – 60th 87.71 - 90.10 70.51 - 74.40 35.81 - 45.70
Quintile 2 Low 20th – 40th 84.31 - 87.70 62.81 - 70.50 27.01 - 35.80
Quintile 1 Lowest 0th – 20th 64.30 - 84.30 29.00 - 62.80 0.00 - 27.00
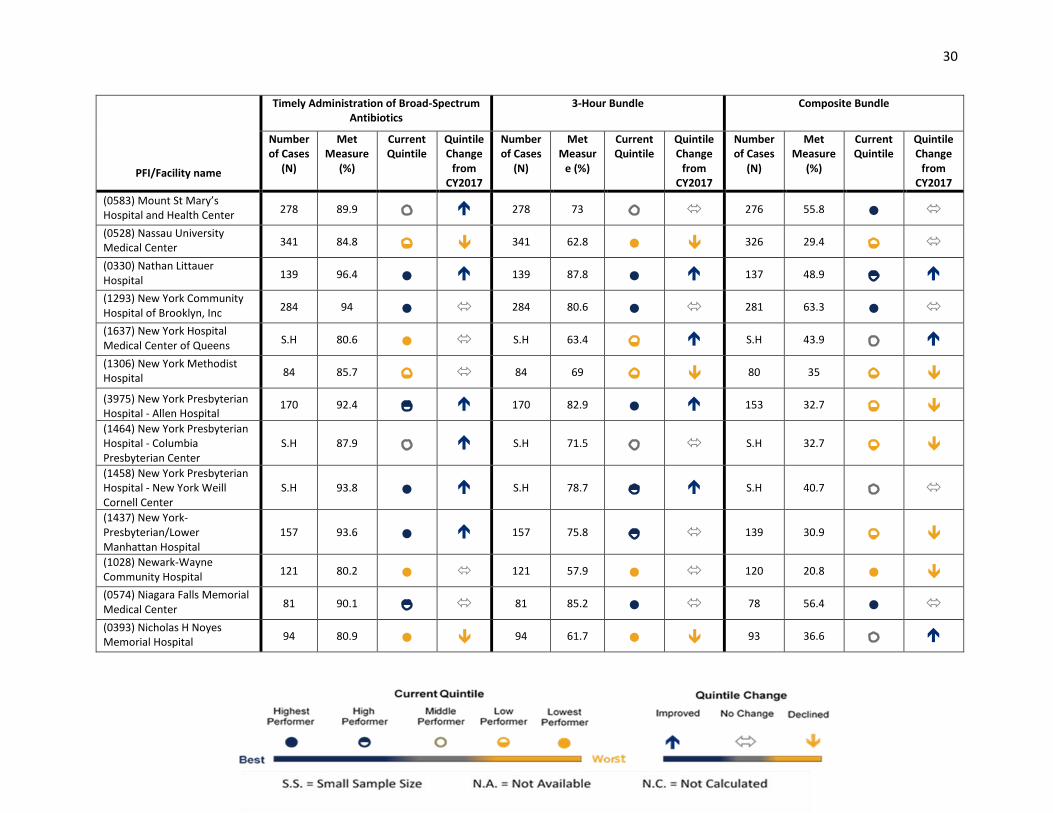
Hospitals’ performance on adult timely administration of broad-spectrum antibiotics, three-hour, and six-hour bundle measures are presented in Table 4. The interventions within these measures collectively have been demonstrated to help direct appropriate care. This measure is only reported for those hospitals with greater than 10 adult sepsis cases in 2018. For hospitals that participated in sampling for 2018, the measure result reported here is an estimate drawn from a representative subset of their sepsis population. The 95% confidence intervals associated with these estimates appear in Appendix A. Since actual observed counts of measure numerators and denominators are unknown among sampling hospitals, statewide measure volume is not reported. Cells containing an S.H. indicate hospitals that participated in sampling for 2018.
In addition to the hospital’s performance level by quintile, the change in the hospital’s performance level between 2017 and 2018 is presented, reflecting whether the hospitals’ performance category improved, declined or remained unchanged. The cells that contain an S.S. indicate that the data were suppressed due to low counts (fewer than 10 sepsis cases). The cells that contain an N.C. indicate that the measure was not calculated because the hospital did not have any patients that satisfied the criteria for inclusion in the measure. The
Best
Worst

23
cells that contain an N.A. indicate that a measure result was not available for that hospital in at least one of the years compared.

24
Table 4. Adult Sepsis Measure Summary Report by Hospital, 2018
PFI/Facility name
Timely Administration of Broad-Spectrum Antibiotics
3-Hour Bundle Composite Bundle
Number of Cases
(N)
Met Measure
(%)
Current Quintile
Quintile Change
from CY2017
Number of Cases
(N)
Met Measur
e (%)
Current Quintile
Quintile Change
from CY2017
Number of Cases
(N)
Met Measure
(%)
Current Quintile
Quintile Change
from CY2017
(0324) Adirondack Medical Center-Saranac Lake Site 35 80 ●
➔ 35 51.4 ●
➔ 34 26.5 ●
(0001) Albany Medical Center Hospital
S.H 74.5 ● S.H 33.4 ● S.H 5.1 ●
(0004) Albany Memorial Hospital
96 87.5 ➔
96 67.7 ➔
93 57 ● ➔
(0325) Alice Hyde Medical Center
52 86.5
➔ 52 51.9 ● ➔ 51 27.5
➔
(0116) Arnot Ogden Medical Center
275 86.2 275 74.9 ➔
268 31.3 ➔
(0085) Auburn Community Hospital
195 88.7 ➔
195 62.1 ● 192 41.1 ➔
(0739) Aurelia Osborn Fox Memorial Hospital 81 95.1 ● ➔
81 81.5 ● ➔
80 36.3
➔
(1438) Bellevue Hospital Center
375 91.5
➔ 375 73.9 371 47.7
(0708) Bon Secours Community Hospital
113 94.7 ● 113 85.8 ● 111 55
➔
(1178) Bronx-Lebanon Hospital Center-Concourse Division
S.H 91.4 S.H 74.5 ➔
S.H 58.2 ● ➔
(1286) Brookdale Hospital Medical Center
143 67.1 ● 143 42 ● 142 12 ●
(0885) Brookhaven Memorial Hospital Medical Center Inc
S.H 96.8 ● S.H 76.8
➔ S.H 64.7 ●
(1288) Brooklyn Hospital Center - Downtown Campus
527 85.6 527 65.3
➔ 522 33
➔
(0098) Brooks Memorial Hospital
88 94.3 ● 88 80.7 ● 86 58.1 ●

25
PFI/Facility name
Timely Administration of Broad-Spectrum Antibiotics
3-Hour Bundle Composite Bundle
Number of Cases
(N)
Met Measure
(%)
Current Quintile
Quintile Change
from CY2017
Number of Cases
(N)
Met Measur
e (%)
Current Quintile
Quintile Change
from CY2017
Number of Cases
(N)
Met Measure
(%)
Current Quintile
Quintile Change
from CY2017
(0207) Buffalo General Medical Center 692 72 ● 692 60.3 ● 681 31.4
(0815) Canton-Potsdam Hospital
71 95.8 ● ➔
71 74.6 ➔
71 40.8
➔
(0379) Carthage Area Hospital Inc
65 67.7 ● N.A. 65 52.3 ● N.A. 65 7.7 ● N.A.
(0971) Catskill Regional Medical Center 96 91.7 ➔
96 71.9 96 27.1
(0977) Cayuga Medical Center at Ithaca 326 84.7 326 57.4 ● 323 31.6
➔
(0135) Champlain Valley Physicians Hospital Medical Center
246 91.9 246 76.4 ➔
242 30.6
➔
(0128) Chenango Memorial Hospital Inc 21 85.7 ➔
21 76.2 N.A. 21 61.9 ● N.A.
(0798) Claxton-Hepburn Medical Center 86 89.5
➔ 86 80.2 ● ➔
86 53.5 ➔
(0676) Clifton Springs Hospital and Clinic 18 88.9
➔ 18 61.1 ●
➔ 18 27.8
➔
(0146) Columbia Memorial Hospital
16 93.8 ● 16 81.3 ● 16 25 ●
(1294) Coney Island Hospital 420 86
➔ 420 58.3 ● 413 12.3 ●
➔
(0866) Corning Hospital 74 81.1 ● 74 70.3 74 27 ●
➔
(0158) Cortland Regional Medical Center Inc 300 92.7 ➔
300 79.7 ● ➔
298 62.1 ● ➔

26
PFI/Facility name
Timely Administration of Broad-Spectrum Antibiotics
3-Hour Bundle Composite Bundle
Number of Cases
(N)
Met Measure
(%)
Current Quintile
Quintile Change
from CY2017
Number of Cases
(N)
Met Measur
e (%)
Current Quintile
Quintile Change
from CY2017
Number of Cases
(N)
Met Measure
(%)
Current Quintile
Quintile Change
from CY2017
(0636) Crouse Hospital 217 91.2 ➔
217 69.1 ➔
214 32.2 ➔
(0891) Eastern Long Island Hospital
36 97.2 ● 36 83.3 ● 36 33.3
➔
(0565) Eastern Niagara Hospital - Lockport Division
11 72.7 ● 11 54.5 ● 11 0 ●
➔
(0829) Ellis Hospital 322 83.2 ●
➔ 322 65.2
➔ 316 43
➔
(1626) Elmhurst Hospital Center S.H 86.7
➔ S.H 66.6 ➔ S.H 31.5
➔
(0210) Erie County Medical Center
177 80.2 ● 177 58.2 ● ➔ 177 28.2
(0678) F F Thompson Hospital 171 84.2 ● 171 67.8 168 34.5 ➔
(0599) Faxton-St Luke’s Healthcare St Luke’s Division
286 91.6 ➔
286 73.8 ➔
281 21 ●
➔
(1628) Flushing Hospital Medical Center 250 90.8 250 73.6
➔ 248 33.1
➔
(1638) Forest Hills Hospital S.H 84.3 S.H 68.2 S.H 29.6 ➔
(0518) Franklin Hospital 265 89.1 ➔
265 72.5 ➔
259 37.1 ➔
(0671) Geneva General Hospital 69 82.6 ●
➔ 69 62.3 ●
➔ 67 25.4 ●
➔
(0490) Glen Cove Hospital 245 95.9 ● 245 84.5 ● 237 61.2 ● ➔

27
PFI/Facility name
Timely Administration of Broad-Spectrum Antibiotics
3-Hour Bundle Composite Bundle
Number of Cases
(N)
Met Measure
(%)
Current Quintile
Quintile Change
from CY2017
Number of Cases
(N)
Met Measur
e (%)
Current Quintile
Quintile Change
from CY2017
Number of Cases
(N)
Met Measure
(%)
Current Quintile
Quintile Change
from CY2017
(1005) Glens Falls Hospital 332 87
➔ 332 70.5
➔ 329 39.5
(0925) Good Samaritan Hospital Medical Center
S.H 87.7 S.H 75.5 S.H 60.8 ●
(0779) Good Samaritan Hospital of Suffern
366 92.1 366 75.4 361 28.3
(1445) Harlem Hospital Center 172 83.1 ● 172 76.7 ➔
165 40.6 ➔
(0990) HealthAlliance Hospital Broadway Campus 230 95.2 ● ➔
230 84.3 ● ➔
228 45.6
➔
(0409) Highland Hospital S.H 90.3 S.H 75.2 ➔
S.H 40.2 ➔
(1039) Hudson Valley Hospital Center
507 91.9 507 76.9
➔ 501 58.5 ●
(0913) Huntington Hospital 484 92.8 ➔
484 80 ● ➔
476 54 ➔
(1309) Interfaith Medical Center 95 91.6 95 78.9 ➔
95 51.6 ➔
(1165) Jacobi Medical Center 383 95.3 ● ➔
383 78.9 375 48.8 ➔
(1629) Jamaica Hospital Medical Center 377 91.2 ➔
377 70.8 ➔
366 35.2
➔
(0895) John T Mather Memorial Hospital of Port Jefferson New York Inc
438 88.4 ➔
438 71 ➔
429 49.7 ➔
(0267) Kenmore Mercy Hospital 332 91 ➔
332 72.3
➔
327 51.4
(1301) Kings County Hospital Center
276 82.6 ●
➔ 276 64.5
➔ 270 22.2 ●
➔

28
PFI/Facility name
Timely Administration of Broad-Spectrum Antibiotics
3-Hour Bundle Composite Bundle
Number of Cases
(N)
Met Measure
(%)
Current Quintile
Quintile Change
from CY2017
Number of Cases
(N)
Met Measur
e (%)
Current Quintile
Quintile Change
from CY2017
Number of Cases
(N)
Met Measure
(%)
Current Quintile
Quintile Change
from CY2017
(1315) Kingsbrook Jewish Medical Center
312 88.5 312 74 303 40.6 ➔
(1122) Lawrence Hospital Center 346 87.9 346 73.7
➔ 338 41.4
➔
(1450) Lenox Hill Hospital S.H 89.7
➔ S.H 66.5 S.H 47.8
(0383) Lewis County General Hospital
39 87.2
➔ 39 71.8 ➔ 39 53.8
(1172) Lincoln Medical & Mental Health Center 396 94.9 ● ➔
396 65.4 ➔
395 22.5 ●
(0362) Little Falls Hospital 23 87 23 69.6
➔ 21 47.6
➔
(1630) Long Island Jewish Medical Center
S.H 84.5 S.H 64.7
➔ S.H 20.9 ●
➔
(1305) Maimonides Medical Center
611 93 611 76.8
➔ 610 37
(0746) Mary Imogene Bassett Hospital 111 88.3 111 70.3
➔ 109 35.8
➔
(0804) Massena Memorial Hospital
20 95 ● ➔
20 70 ➔
19 47.4 ➔
(0039) Memorial Hosp of Wm F & Gertrude F Jones A/K/A Jones Memorial Hosp
30 96.7 ● ➔
30 83.3 ● 30 56.7 ● ➔
(1453) Memorial Hospital for Cancer and Allied Diseases 467 92.3 ➔
467 70.7 ➔
455 38.9 ➔
(0213) Mercy Hospital S.H 86.4 ➔
S.H 71.1 ➔
S.H 41.6

29
PFI/ Facility name
Timely Administration of Broad-Spectrum Antibiotics
3-Hour Bundle Composite Bundle
Number of Cases
(N)
Met Measure
(%)
Current Quintile
Quintile Change
from CY2017
Number of Cases
(N)
Met Measur
e (%)
Current Quintile
Quintile Change
from CY2017
Number of Cases
(N)
Met Measure
(%)
Current Quintile
Quintile Change
from CY2017
(0513) Mercy Medical Center 269 96.3 ● 269 87.4 ● 264 71.2 ●
(1454) Metropolitan Hospital Center
82 85.4
➔ 82 70.7 82 32.9
(3067) Millard Fillmore Suburban Hospital 414 76.1 ● 414 58.7 ●
➔ 407 24.6 ●
➔
(3058) Montefiore Med Center - Jack D Weiler Hosp of Einstein College Division
943 71.2 ● 943 31.3 ● 941 11.6 ●
(1169) Montefiore Medical Center - Henry & Lucy Moses Division
860 72.7 ● 860 29 ● 856 10.9 ●
(1168) Montefiore Medical Center-Wakefield Hospital
363 75.2 ● 363 37.5 ● 360 17.8 ●
(1061) Montefiore Mount Vernon Hospital 35 82.9 ● 35 62.9 ➔
35 31.4
➔
(1072) Montefiore New Rochelle Hospital 166 87.3 ➔
166 77.1 ➔
162 46.9 ➔
(1439) Mount Sinai Beth Israel S.H 90.2 ➔
S.H 74.2
➔ S.H 49.6
(1324) Mount Sinai Beth Israel Brooklyn 219 92.7
➔ 219 74
➔ 212 43.4
➔
(1456) Mount Sinai Hospital S.H 88.2 ➔ S.H 62.6 ●
➔ S.H 29.5
(1639) Mount Sinai Hospital - Mount Sinai Hospital of Queens
284 93 ➔ 284 72.5 279 41.6
➔
(1466) Mount Sinai Roosevelt S.H 88.5 S.H 73.9
➔ S.H 43.5
➔
(1469) Mount Sinai St. Luke’s S.H 87.8
➔ S.H 66.4
➔ S.H 39.6
➔
30
PFI/Facility name
Timely Administration of Broad-Spectrum Antibiotics
3-Hour Bundle Composite Bundle
Number of Cases
(N)
Met Measure
(%)
Current Quintile
Quintile Change
from CY2017
Number of Cases
(N)
Met Measur
e (%)
Current Quintile
Quintile Change
from CY2017
Number of Cases
(N)
Met Measure
(%)
Current Quintile
Quintile Change
from CY2017
(0583) Mount St Mary’s Hospital and Health Center 278 89.9 ➔
278 73 276 55.8 ●
(0528) Nassau University Medical Center 341 84.8
➔ 341 62.8 ●
➔ 326 29.4
(0330) Nathan Littauer Hospital
139 96.4 ● ➔
139 87.8 ● ➔
137 48.9 ➔
(1293) New York Community Hospital of Brooklyn, Inc
284 94 ● 284 80.6 ● 281 63.3 ●
(1637) New York Hospital Medical Center of Queens S.H 80.6 ● S.H 63.4 ➔
S.H 43.9 ➔
(1306) New York Methodist Hospital
84 85.7 84 69 ➔ 80 35
➔
(3975) New York Presbyterian Hospital - Allen Hospital
170 92.4 ➔
170 82.9 ● ➔
153 32.7
➔
(1464) New York Presbyterian Hospital - Columbia Presbyterian Center
S.H 87.9 ➔
S.H 71.5 S.H 32.7
➔
(1458) New York Presbyterian Hospital - New York Weill Cornell Center
S.H 93.8 ● ➔
S.H 78.7 ➔
S.H 40.7
(1437) New York-Presbyterian/Lower Manhattan Hospital
157 93.6 ● ➔
157 75.8 139 30.9
➔
(1028) Newark-Wayne Community Hospital 121 80.2 ● 121 57.9 ● 120 20.8 ●
➔
(0574) Niagara Falls Memorial Medical Center 81 90.1 81 85.2 ● 78 56.4 ●
(0393) Nicholas H Noyes Memorial Hospital 94 80.9 ●
➔ 94 61.7 ●
➔ 93 36.6 ➔

31
PFI/Facility name
Timely Administration of Broad-Spectrum Antibiotics
3-Hour Bundle Composite Bundle
Number of Cases
(N)
Met Measure
(%)
Current Quintile
Quintile Change
from CY2017
Number of Cases
(N)
Met Measur
e (%)
Current Quintile
Quintile Change
from CY2017
Number of Cases
(N)
Met Measure
(%)
Current Quintile
Quintile Change
from CY2017
(1186) North Central Bronx Hospital
90 93.3 ● 90 77.8
➔ 90 50
(0541) North Shore University Hospital
1,067 84.7 1,067 64.8 ➔
1,042 24.1 ●
(0192) Northern Dutchess Hospital
65 90.8
➔ 65 73.8
➔ 64 51.6
➔
(1117) Northern Westchester Hospital 251 94.8 ● ➔
251 79.3 243 56.8 ●
(0776) Nyack Hospital 374 88
➔ 374 74.6
➔ 370 47
(1304) NYU Langone-Brooklyn S.H 97.1 ● S.H 90.9 ● S.H 81.8 ●
(1463) NYU Langone Hospitals S.H 97.3 ● S.H 88.3 ● S.H 72.8 ●
(0511) NYU Winthrop Hospital S.H 91.7 ➔
S.H 80.7 ● ➔
S.H 59.5 ● ➔
(0066) Olean General Hospital 366 74.9 ● 366 58.2 ● 364 20.3 ●
➔
(0397) Oneida Healthcare 41 87.8
➔ 41 73.2
➔ 40 57.5 ● ➔
(0699) Orange Regional Medical Ctr-Goshen Campus
S.H 85.5
➔ S.H 73.8
➔ S.H 42.9
➔
(0727) Oswego Hospital 217 84.3
➔ 217 73.7
➔ 214 57.5 ●
(0043) Our Lady of Lourdes Memorial Hospital Inc 128 93.8 ● 128 72.7
➔ 125 33.6
➔
(0938) Peconic Bay Medical Center
169 81.1 ● ➔ 169 55.6 ● 166 17.5 ●
➔
(1129) Phelps Memorial Hospital Assn
294 95.6 ● 294 77.6 ➔
289 67.5 ●
(0552) Plainview Hospital 279 88.9 279 73.5 ➔
273 37.7 ➔
(0752) Putnam Hospital Center 352 94.6 ● 352 84.7 ● ➔
350 69.1 ●

32
PFI/Facility name
Timely Administration of Broad-Spectrum Antibiotics
3-Hour Bundle Composite Bundle
Number of Cases
(N)
Met Measure
(%)
Current Quintile
Quintile Change
from CY2017
Number of Cases
(N)
Met Measur
e (%)
Current Quintile
Quintile Change
from CY2017
Number of Cases
(N)
Met Measure
(%)
Current Quintile
Quintile Change
from CY2017
(1633) Queens Hospital Center 562 89.3 562 75.6 ➔
553 33.3 ➔
(1738) Richmond University Medical Center
408 88.2 ➔
408 53.4 ● 403 22.8 ●
(0411) Rochester General Hospital
S.H 80.8 ● S.H 61.8 ●
➔ S.H 26.9 ●
➔
(0589) Rome Memorial Hospital, Inc
130 90 ➔
130 83.8 ● ➔
129 50.4 ➔
(0216) Roswell Park Cancer Institute
56 64.3 ● 56 41.1 ● 56 12.5 ●
(0756) Samaritan Hospital 223 93.3 ● 223 76.2
➔ 220 61.8 ● ➔
(0367) Samaritan Medical Center
208 87
➔ 208 73.6
➔ 207 44.4
(0818) Saratoga Hospital 414 92.8
➔ 414 78.7 410 62.4 ● ➔
(1176) SBH Health System 218 79.4 ●
➔ 218 49.5 ● 217 12.4 ●
➔
(0218) Sisters of Charity Hospital 149 89.9 ➔
149 74.5 ➔
148 50.7 ➔
(0292) Sisters of Charity Hospital - St Joseph Campus 69 88.4 ➔
69 73.9 67 35.8
➔
(1097) SJRH - Andrus Pavilion 205 86.8 205 67.3 197 33.5
➔
(0527) South Nassau Communities Hospital
S.H 85.3 ➔ S.H 75.3 S.H 52.5 ➔

33
PFI/Facility name
Timely Administration of Broad-Spectrum Antibiotics
3-Hour Bundle Composite Bundle
Number of Cases
(N)
Met Measure
(%)
Current Quintile
Quintile Change
from CY2017
Number of Cases
(N)
Met Measur
e (%)
Current Quintile
Quintile Change
from CY2017
Number of Cases
(N)
Met Measure
(%)
Current Quintile
Quintile Change
from CY2017
(0889) Southampton Hospital 137 86.1
➔ 137 79.6
➔ 137 47.4 ➔
(0924) Southside Hospital 311 90
➔ 311 72 302 40.7
(0704) St Anthony Community Hospital 43 97.7 ● 43 86 ● 43 48.8
(0943) St Catherine of Siena Hospital
S.H 95.2 ● S.H 91.6 ● S.H 80.8 ●
(0896) St Charles Hospital 256 91.8
➔ 256 83.6 ● 254 72.8 ●
(0598) St Elizabeth Medical Center
204 90.7 ➔
204 68.6 202 21.8 ●
(0563) St Francis Hospital 377 89.9
➔ 377 79
➔ 368 52.4
➔
(0180) St Francis Hospital – Poughkeepsie
76 96.1 ● ➔
76 86.8 ● ➔
75 72 ●
(0870) St James Mercy Hospital
12 91.7 ➔
12 83.3 ● N.A. 12 25 ● N.A.
(1635) St John’s Episcopal Hospital So Shore
298 85.9 298 59.7 ●
➔ 293 22.9 ●
(0630) St Joseph’s Hospital Health Center S.H 85.2
➔ S.H 66.7 S.H 33.9
(1098) St Joseph’s Medical Center 143 93
➔ 143 83.2 ● 141 70.9 ●
(0694) St Luke’s Cornwall Hospital/Newburgh 188 94.7 ● 188 88.8 ● 181 67.4 ●
(0005) St Peter’s Hospital S.H 88.6 ➔
S.H 62.9 ➔
S.H 40.4 ➔

34
PFI/Facility name
Timely Administration of Broad-Spectrum Antibiotics
3-Hour Bundle Composite Bundle
Number of Cases
(N)
Met Measure
(%)
Current Quintile
Quintile Change
from CY2017
Number of Cases
(N)
Met Measur
e (%)
Current Quintile
Quintile Change
from CY2017
Number of Cases
(N)
Met Measure
(%)
Current Quintile
Quintile Change
from CY2017
(0551) St. Joseph Hospital S.H 93.3 ● ➔
S.H 79.8 ● ➔
S.H 60.3 ●
(0484) St. Mary’s Healthcare 114 86.8
➔ 114 72.8
➔ 114 29.8 ➔
(1740) Staten Island University Hosp-North
S.H 83.6 ● S.H 50.1 ● S.H 18.8 ●
(1737) Staten Island University Hosp-South S.H 88.8 ➔
S.H 46.1 ● S.H 16.1 ●
(0413) Strong Memorial Hospital S.H 94.2 ● ➔
S.H 82.5 ● ➔
S.H 42.7
➔
(0550) Syosset Hospital 95 87.4
➔ 95 74.7 ➔
93 41.9
(0471) The Unity Hospital of Rochester
456 79.6 ●
➔ 456 65.8 451 26.8 ●
➔
(0042) United Health Services Hospitals Inc. - Binghamton General Hospital
61 78.7 ●
➔ 61 65.6
➔ 61 54.1
➔
(0058) United Health Services Hospitals Inc. - Wilson Medical Center
398 89.4 398 75.4 395 49.6
➔
(0339) United Memorial Medical Center North Street Campus
113 92.9 ➔
113 76.1 ➔
112 50.9 ➔
(0245) University Hospital S.H 89 ➔
S.H 74.1
➔ S.H 47.5
(1320) University Hospital of Brooklyn
191 88 ➔
191 69.1 ➔
189 37 ➔
(0635) University Hospital SUNY Health Science Center
400 85
➔ 400 62.5 ●
➔ 394 27.7

35
PFI/Facility name
Timely Administration of Broad-Spectrum Antibiotics
3-Hour Bundle Composite Bundle
Number of Cases
(N)
Met Measure
(%)
Current Quintile
Quintile Change
from CY2017
Number of Cases
(N)
Met Measur
e (%)
Current Quintile
Quintile Change
from CY2017
Number of Cases
(N)
Met Measure
(%)
Current Quintile
Quintile Change
from CY2017
(0628) Upstate University Hospital at Community General
81 85.2
➔ 81 67.9 80 36.3
(0181) Vassar Brothers Medical Center S.H 89.6 S.H 76.9 S.H 57.9 ●
(1139) Westchester Medical Center
217 89.9 ➔
217 69.1
➔ 215 49.3 ➔
(1045) White Plains Hospital Center
351 85.2 351 67
➔ 341 45.7
(0103) Woman’s Christian Association
112 77.7 ●
➔ 112 62.5 ● 107 17.8 ●
(1692) Woodhull Medical & Mental Health Center 270 91.9 ➔
270 74.4 269 47.2 ➔
(1318) Wyckoff Heights Medical Center
194 91.2
➔ 194 80.9 ● ➔
191 51.3 ➔
(1153) Wyoming County Community Hospital
20 85 ➔
20 70 20 50 ➔

36
Hospital Performance Data – Pediatrics Table 5 shows the quintiles, category assignment, and the percentages assigned to each category for the two pediatric measures – timely administration of broad-spectrum antibiotics and the one-hour bundle.
Table 5. Category Assignment for the Pediatric Sepsis Performance Measures
Quintile Category Summary
Table Symbol
Percentiles Included
Timely Antibiotics
(%)
1-Hour Bundle (%) (Performance
Level)
Quintile 5 Highest 80th – 100th 80.81 - 87.500 48.61 - 71.40
Quintile 4 High 60th – 80th 78.61 - 80.80 47.61 - 48.60
Quintile 3 Middle 40th – 60th 73.01 - 78.60 44.41 - 47.60
Quintile 2 Low 20th – 40th 57.91 - 73.00 28.61 - 44.40
Quintile 1 Lowest 0th – 20th 56.30 - 57.90 12.50 - 28.60
Table 6 shows the percentage of pediatric patients (age <18) with severe sepsis or septic shock who received all interventions in the early management bundle within one hour and who received timely administration of broad-spectrum antibiotics within one hour, regardless of other interventions received. For pediatric patients, these timely interventions include blood cultures, antibiotics, and the administration of 20 cc/kg of crystalloid fluid. Pediatric patients who died within one hour of start time or who have clinical contraindications to any of the interventions are excluded from both the bundle and antibiotic administration measure. Only hospitals with greater than 10 cases reported in at least one of the measure denominators are reported here.
Best
Worst

37
Table 6. Pediatric Sepsis Measure Summary Report by Hospital, 2018
PFI/Facility Name
Timely Administration of Broad-Spectrum Antibiotics
1-Hour Bundle
Number of Cases
(N)
Met Measure
(%)
Current Quintile
Quintile Change
from CY2017
Number of Cases
(N)
Met Measure
(%)
Current Quintile
Quintile Change
from CY2017
(0001) Albany Medical Center Hospital 14 78.6 ➔
14 28.6 ●
(1178) Bronx-Lebanon Hospital Center - Concourse Division
21 61.9 21 47.6
➔
(1301) Kings County Hospital Center 13 76.9 ➔ 13 30.8
(3376) Long Island Jewish Schneider Children's Hospital Division
21 57.1 ● ➔ 21 47.6 ➔
(1305) Maimonides Medical Center 19 57.9
➔ 19 47.4 N.A.
(1453) Memorial Hospital for Cancer and Allied Diseases
18 83.3 ● ➔
18 44.4 ➔
(1169) Montefiore Medical Center - Henry & Lucy Moses Division
32 56.3 ● 32 12.5 ●
(1464) New York Presbyterian Hospital - Columbia Presbyterian Center
52 80.8 ● ➔
52 48.1
(0511) NYU Winthrop Hospital 16 87.5 ● 16 68.8 ● N.A.
(0413) Strong Memorial Hospital 37 73 ➔
37 48.6 ➔
(0245) University Hospital 14 78.6 14 71.4 ●
(1139) Westchester Medical Center 13 69.2
➔ 13 15.4 ● N.A.
(0208) Women and Children’s Hospital of Buffalo
36 80.6 ➔
36 38.9
➔
Statewide 375 72.5 375 42.7
38
Hospital Performance Over Time
Data from the years 2015 to 2018 allows us to look at hospital performance over time. Figure 10 is a depiction of hospital performance data from 2015 to 2018, charting hospitals’ adult three-hour bundle performance, measured as the percentage of adult patients who received all the recommended early interventions within three hours of severe sepsis presentation. Each line represents one hospital and the color of the line represents its three-hour bundle performance quintile in 2018. Hospitals in the top two quintiles are shown in the top half of the figure while hospitals in the bottom three quintiles are shown in the bottom half of the figure. In general, hospitals have improved their three-hour bundle performance across time, and the rate of increase was greater among hospitals in the top two quintiles compared to the bottom three quintiles.

39
Figure 10. Percent of Adult Patients Receiving 3-Hour Bundle by Hospital, 2015-181
1Each line represents one hospital; 144 hospitals included.

40
Table 7 summarizes how NYS hospitals’ performance changed from 2017 to 2018 among the inpatient adult (age ≥ 18) and pediatric (age < 18) sepsis care quality measures: three-hour bundle, composite bundle, and one-hour bundle. Facilities in the ‘Higher Measure Result’ category had a higher absolute measure result in 2018 relative to 2017, while facilities in the ‘Lower Measure Result’ category had a lower absolute measure result in 2018. Only facilities with a calculated measure result in both 2017 and 2018 are included in this table. Table 7 demonstrates that while many facilities did not change in relative measure performance as measured by quintiles in Tables 4 and 6, virtually no facilities maintain the same absolute measure of performance from 2017 to 2018. However, these results should be interpreted with caution, as measure results are sensitive to specification changes and other methodological factors. More information on hospital measure performance over time can be found in Appendix C.
Table 7. Facility Changes in Sepsis Process Measures from 2017 to 2018
Measure Change
3-Hour Bundle (Adult)
Composite Bundle (Adult)
1-Hour Bundle (Pediatric)
Hospitals (N)
Hospitals (%)
Hospitals (N)
Hospitals (%)
Hospitals (N)
Hospitals (%)
Higher Measure Result
100 64.1 107 68.59 6 60
Same Measure Result 1 0.64 0 0 0 0
Lower Measure Result
55 35.26 49 31.41 4 40
Total 156 100 156 100 10 100

41
Risk-Adjusted Mortality Hospital performance on management of sepsis is a key factor that directly relates to patient outcomes. The use of sepsis protocols and measures of protocol adherence are important to patients because of their impact on improvement in the probability of survival. It is difficult, however, to compare outcomes among hospitals when assessing performance, because different hospitals treat different types of patients. Hospitals with sicker patients may have higher rates of mortality than other hospitals.
In order to more fairly compare hospitals on the critical outcome of survival, risk adjustment was used to account for differences in the characteristics of the hospitals’ populations of sepsis patients, since patient characteristics can impact the risk of dying from sepsis. Risk adjustment takes into account accompanying chronic illnesses that can complicate treatment and outcomes for patients with sepsis, patient demographic factors such as age, and the severity of sepsis for each patient. It should be noted that there may be risk factors, such as some medical comorbidities and social determinants of health, that were not accounted for in this risk adjustment model but may have impacted the risk-adjusted rates. The RAMR represents the best estimate, after accounting for these available factors, of what the hospital’s mortality rate would have been if the hospital had a mix of patients identical to the statewide mix. Risk-adjusted mortality describes the ‘risk-adjusted’ percentage of all patients with sepsis at each hospital who expired. For 2018, our mortality outcome includes all patients who died within 30 days following the presentation of severe sepsis. More detail regarding the risk adjustment methodology can be found in Technical Appendix B.
Pediatric risk-adjusted sepsis mortality rates were not calculated due to the significantly smaller volume of cases for each hospital compared to adult cases and the current lack of a standardized, validated risk adjustment model for the pediatric sepsis population.
Adult risk-adjusted sepsis mortality rates for each hospital are presented in Table 8. All adult patients with severe sepsis or septic shock submitted to the Department are included in the risk-adjusted mortality measure, except for those who are transfer patients, those who were admitted from hospice, those who have advance directives that restricted the use of any protocol interventions, or those who refused any of the protocol interventions. Hospitals with significantly lower observed mortality rates than expected based on their patient population’s characteristics are identified as high performers, while hospitals with significantly higher observed mortality rates than expected are identified as low performers.
Hospitals’ change in RAMR performance status relative to the previous year is presented in Table 8 as well. This change does not necessarily indicate an increase or decrease in RAMR, but rather represents hospital movement between the high, middle, and low performance statuses across years and should be interpreted with caution given the differences in RAMR methodology between the two years.

42
Table 8. Adult Sepsis Risk Adjusted Mortality Rate (RAMR) Summary Report by Hospital, 2018
PFI/Facility Name Number of
Cases (N)
Number of
Outcomes (N) RAMR
High/Low
Performer
Performance
Change from
CY2017
(0324) Adirondack Medical Center-
Saranac Lake Site 35 13 30.94
(0001) Albany Medical Center Hospital 231 73 27.58
(0004) Albany Memorial Hospital 97 16 23.25
(0325) Alice Hyde Medical Center 53 13 27.00
(0116) Arnot Ogden Medical Center 286 67 26.00
(0085) Auburn Community Hospital 198 57 29.57 ➔
(0739) Aurelia Osborn Fox Memorial
Hospital 80 14 17.61
(1438) Bellevue Hospital Center 374 71 25.20
➔
(0708) Bon Secours Community
Hospital 113 17 18.06
➔
(1178) Bronx-Lebanon Hospital Center
- Concourse Division 346 75 26.60
(1286) Brookdale Hospital Medical
Center 143 55 32.81
(0885) Brookhaven Memorial Hospital
Medical Center Inc 379 91 19.86
(1288) Brooklyn Hospital Center -
Downtown Campus 426 142 27.96
➔
(0098) Brooks Memorial Hospital 74 11 19.49
(0207) Buffalo General Medical Center 720 259 33.38
(0815) Canton-Potsdam Hospital 73 17 27.58
(0379) Carthage Area Hospital Inc 55 4 9.79 N.C.
(0971) Catskill Regional Medical
Center 43 12 25.56
(0977) Cayuga Medical Center at
Ithaca 277 32 16.32
(0135) Champlain Valley Physicians
Hospital Medical Center 125 37 24.38
➔
(0128) Chenango Memorial Hospital
Inc 19 9 39.54
(0798) Claxton-Hepburn Medical
Center 85 12 15.98 ➔
(0676) Clifton Springs Hospital and
Clinic 16 5 31.48

43
PFI/Facility Name Number of
Cases (N)
Number of
Outcomes (N) RAMR
High/Low
Performer
Performance
Change from
CY2017
(0851) Cobleskill Regional Hospital S.S. S.S. S.S. S.S. N.A.
(0146) Columbia Memorial Hospital 17 9 46.86
➔
(0401) Community Memorial Hospital
Inc S.S. S.S. S.S. S.S. N.A.
(1294) Coney Island Hospital 400 146 23.84 ➔
(0866) Corning Hospital 71 29 37.82
➔
(0158) Cortland Regional Medical
Center Inc 295 30 11.58
(0636) Crouse Hospital 193 66 32.11
(0581) Degraff Memorial Hospital S.S. S.S. S.S. S.S. N.A.
(0891) Eastern Long Island Hospital 28 6 18.52
➔
(0565) Eastern Niagara Hospital -
Lockport Division 11 8 47.63
➔
(0303) Elizabethtown Community
Hospital S.S. S.S. S.S. S.S. N.A.
(0829) Ellis Hospital 329 101 28.04
(1626) Elmhurst Hospital Center 367 85 22.57 ➔
(0210) Erie County Medical Center 145 38 23.44
(0678) F F Thompson Hospital 169 32 17.99 ➔
(0599) Faxton-St Lukes Healthcare St
Lukes Division 283 106 27.72
(1628) Flushing Hospital Medical
Center 220 97 29.82 ➔
(1638) Forest Hills Hospital 333 110 27.47
(0518) Franklin Hospital 253 81 26.79
(0671) Geneva General Hospital 75 25 38.97
➔
(0490) Glen Cove Hospital 230 46 20.57 ➔
(1005) Glens Falls Hospital 315 84 28.59
(0925) Good Samaritan Hospital
Medical Center 372 96 27.70
(0779) Good Samaritan Hospital of
Suffern 390 143 26.72
(0812) Gouverneur Hospital S.S. S.S. S.S. S.S. N.A.

44
PFI/Facility Name Number of
Cases (N)
Number of
Outcomes (N) RAMR
High/Low
Performer
Performance
Change from
CY2017
(1445) Harlem Hospital Center 157 34 22.26
(0990) HealthAlliance Hospital
Broadway Campus 229 58 24.43
➔
(0409) Highland Hospital 333 84 24.06
(1447) Hospital for Special Surgery S.S. S.S. S.S. S.S. N.A.
(1039) Hudson Valley Hospital Center 512 130 23.26
(0913) Huntington Hospital 466 101 21.08 ➔
(1309) Interfaith Medical Center 68 1 1.42 ➔
(0873) Ira Davenport Memorial
Hospital Inc S.S. S.S. S.S. S.S. N.A.
(1165) Jacobi Medical Center 412 111 19.41
(1629) Jamaica Hospital Medical
Center 341 143 29.01 ➔
(0895) John T Mather Memorial
Hospital of Port Jefferson New York
Inc
430 103 24.66
➔
(0267) Kenmore Mercy Hospital 339 103 31.73
(1301) Kings County Hospital Center 276 93 30.86
(1315) Kingsbrook Jewish Medical
Center 311 124 22.97 ➔
(1122) Lawrence Hospital Center 328 78 22.76
➔
(1450) Lenox Hill Hospital 338 76 23.12
➔
(0383) Lewis County General Hospital 38 10 35.18
(1172) Lincoln Medical & Mental
Health Center 368 91 26.46
(0362) Little Falls Hospital 22 3 13.81
➔
(1630) Long Island Jewish Medical
Center 348 87 25.09
(3376) Long Island Jewish Schneiders
Children's Hospital Division S.S. S.S. S.S. S.S. N.A.
(1305) Maimonides Medical Center 618 163 23.02
(0746) Mary Imogene Bassett Hospital 111 36 29.16
(0718) Medina Memorial Health Care
System S.S. S.S. S.S. S.S. N.A.

45
PFI/Facility Name Number of
Cases (N)
Number of
Outcomes (N) RAMR
High/Low
Performer
Performance
Change from
CY2017
(0039) Memorial Hosp of Wm F &
Gertrude F Jones A/K/A Jones
Memorial Hosp
14 1 6.41
(1453) Memorial Hospital for Cancer
and Allied Diseases 439 157 24.45
(0213) Mercy Hospital 342 117 34.16
(0513) Mercy Medical Center 282 98 31.18
(1454) Metropolitan Hospital Center 70 14 20.79
(3067) Millard Fillmore Suburban
Hospital 429 164 37.23
➔
(3058) Montefiore Med Center - Jack
D Weiler Hosp of A Einstein College
Div
869 288 32.88
(1168) Montefiore Medical Center-
Wakefield Hospital 317 89 29.00 ➔
(1169) Montefiore Medical Center -
Henry & Lucy Moses Div 761 238 34.23
(1061) Montefiore Mount Vernon
Hospital 41 13 22.31
(1072) Montefiore New Rochelle
Hospital 176 75 27.07
(0309) Moses-Ludington Hospital S.S. S.S. S.S. S.S. N.A.
(1439) Mount Sinai Beth Israel 338 73 22.00
(1324) Mount Sinai Beth Israel
Brooklyn 230 79 27.31
(1456) Mount Sinai Hospital 299 68 21.35 ➔
(1639) Mount Sinai Hospital - Mount
Sinai Hospital of Queens 288 93 32.15
➔
(1466) Mount Sinai Roosevelt 370 65 18.70
(1469) Mount Sinai St. Lukes 357 81 20.96
(0583) Mount St Marys Hospital and
Health Center 275 66 27.28
(0528) Nassau University Medical
Center 326 101 27.55
(0330) Nathan Littauer Hospital 139 35 26.66
(1437) New York-Presbyterian/Lower
Manhattan Hospital 156 43 27.86

46
PFI/Facility Name Number of
Cases (N)
Number of
Outcomes (N) RAMR
High/Low
Performer
Performance
Change from
CY2017
(1293) New York Community Hospital
of Brooklyn, Inc 280 86 25.54
(1637) New York Hospital Medical
Center of Queens 294 59 18.56
(1306) New York Methodist Hospital 83 30 28.96
➔
(3975) New York Presbyterian Hospital
- Allen Hospital 179 65 24.80
(1464) New York Presbyterian Hospital
- Columbia Presbyterian Center 259 74 26.28
(1458) New York Presbyterian Hospital
- New York Weill Cornell Center 247 92 31.22
(1028) Newark-Wayne Community
Hospital 116 27 24.93
(0574) Niagara Falls Memorial Medical
Center 83 28 31.12
(0393) Nicholas H Noyes Memorial
Hospital 98 15 16.39 ➔
(1186) North Central Bronx Hospital 92 8 14.93
(0541) North Shore University Hospital 1067 277 23.62 ➔
(0192) Northern Dutchess Hospital 64 20 35.46
(1117) Northern Westchester Hospital 255 42 20.85
➔
(0776) Nyack Hospital 364 115 26.73
➔
(1304) NYU Langone-Brooklyn 342 75 22.13 ➔
(1463) NYU Langone Hospitals 337 76 21.17
(1446) NYU Langone Orthopedic
Hospital S.S. S.S. S.S. S.S. N.A.
(0511) NYU Winthrop Hospital 365 96 29.22
➔
(0066) Olean General Hospital 372 95 25.39
(0397) Oneida Healthcare 41 14 33.65
(0699) Orange Regional Medical Ctr-
Goshen Campus 206 51 26.24
(0727) Oswego Hospital 211 34 20.34
➔
(0043) Our Lady of Lourdes Memorial
Hospital Inc 104 30 26.78
(0938) Peconic Bay Medical Center 172 74 38.26
➔

47
PFI/Facility Name Number of
Cases (N)
Number of
Outcomes (N) RAMR
High/Low
Performer
Performance
Change from
CY2017
(1129) Phelps Memorial Hospital Assn 304 53 18.14
(0552) Plainview Hospital 270 72 24.77
(0752) Putnam Hospital Center 346 57 19.16
(1633) Queens Hospital Center 566 112 20.77
(1738) Richmond University Medical
Center 410 163 27.18 ➔
(0377) River Hospital, Inc. S.S. S.S. S.S. S.S. N.A.
(0411) Rochester General Hospital 321 94 32.43
➔
(0589) Rome Memorial Hospital, Inc 136 39 24.80
➔
(0216) Roswell Park Cancer Institute 51 13 34.18
(0756) Samaritan Hospital 245 78 25.43
(0367) Samaritan Medical Center 204 33 16.37 ➔
(0818) Saratoga Hospital 407 99 29.23
(1176) SBH Health System 171 54 26.55
➔
(0218) Sisters of Charity Hospital 149 47 31.95
(0292) Sisters of Charity Hospital - St
Joseph Campus 69 30 43.63
➔
(1097) SJRH - Andrus Pavilion 200 60 24.64
➔
(1124) SJRH - Dobbs Ferry Pavilion S.S. S.S. S.S. S.S. N.A.
(0527) South Nassau Communities
Hospital 359 126 28.56
(0889) Southampton Hospital 131 32 21.42
(0924) Southside Hospital 296 104 30.27
(0704) St Anthony Community
Hospital 46 12 26.16
(0943) St Catherine of Siena Hospital 355 79 20.83
(0896) St Charles Hospital 291 52 25.43
(0598) St Elizabeth Medical Center 210 70 31.07 ➔
(0563) St Francis Hospital 450 162 27.72

48
PFI/Facility Name Number of
Cases (N)
Number of
Outcomes (N) RAMR
High/Low
Performer
Performance
Change from
CY2017
(0180) St Francis Hospital -
Poughkeepsie 56 0 0.00 ➔
(0870) St James Mercy Hospital 11 2 26.16
(1635) St John’s Episcopal Hospital So
Shore 288 132 29.47
(0118) St Joseph’s Hospital S.S. S.S. S.S. S.S. N.A.
(0630) St Joseph’s Hospital Health
Center 349 101 23.58
(1098) St Joseph’s Medical Center 143 44 23.52
(0694) St Luke’s Cornwall
Hospital/Newburgh 198 66 24.80
(0005) St Peter’s Hospital 341 83 23.91
(0551) St. Joseph Hospital 412 106 23.59
(0484) St. Mary’s Healthcare 122 25 17.36
(1740) Staten Island University Hosp-
North 386 108 24.65
(1737) Staten Island University Hosp-
South 172 43 27.20
(0413) Strong Memorial Hospital 286 57 18.57 ➔
(0550) Syosset Hospital 90 39 29.97
(0471) The Unity Hospital of Rochester 441 130 31.66
➔
(0042) United Health Services
Hospitals Inc. - Binghamton General
Hospital
59 11 23.93
➔
(0058) United Health Services
Hospitals Inc. - Wilson Medical Center 383 98 29.13
(0339) United Memorial Medical
Center North Street Campus 115 29 27.73
➔
(0245) University Hospital 280 74 26.87
➔
(1320) University Hospital of Brooklyn 160 58 28.91
(0635) University Hospital SUNY
Health Science Center 413 128 29.52
(0628) Upstate University Hospital at
Community General 71 18 24.13
(0181) Vassar Brothers Medical Center 356 104 27.39
➔

49
PFI/Facility Name Number of
Cases (N)
Number of
Outcomes (N) RAMR
High/Low
Performer
Performance
Change from
CY2017
(1139) Westchester Medical Center 282 70 25.97 ➔
(1045) White Plains Hospital Center 336 109 28.75 ➔
(0103) Woman’s Christian Association 109 37 34.53
(0208) Women and Children’s Hospital
Of Buffalo S.S. S.S. S.S. S.S. N.A.
(1692) Woodhull Medical & Mental
Health Center 259 67 27.93
(1318) Wyckoff Heights Medical
Center 198 65 30.67 ➔
(1153) Wyoming County Community
Hospital 16 4 21.79
➔
Statewide 1 27.00
1Statewide numerator and denominator are not presented as the statewide rate is weighted based on sampling hospitals
reported total cases.

50
Risk Adjusted Mortality Performance Over Time
Figure 11 charts the year over year movement of hospital RAMR performance, represented by hospitals’ RAMR performance status. Each arm in this chart represents the movement of hospitals within and across performance statuses from year to year. The size of each arm in this chart is proportional to the number of hospitals represented by that movement.
Figure 11. Adult Sepsis Risk Adjusted Mortality Performance Trends: 2016 through 2018

51
Figure 12. Adult Sepsis 3-Hour Bundle Performance and Risk Adjusted Mortality Rate

52
New York State Quality Improvement Efforts
The development and implementation of the NYS Sepsis Care Improvement Initiative are the result of ongoing Department collaboration with federal, State, private initiatives, and hospital partners to improve sepsis awareness, advance sepsis care, and to make maximal use of the data collected from hospitals to better understand which clinical practices are influencing survival and other important outcomes for patients. Several of these collaborations to improve sepsis care are described below. Sepsis Advisory Group
The Department convenes a group of clinicians from across NYS who assisted with the development and implementation of the initiative since 2013. This diverse expert group includes both adult and pediatric specialists who treat patients with sepsis. The advisory group has provided key input into the structure of on-going quarterly performance reports presented to each hospital on their protocol use, protocol adherence, and mortality results compared to statewide averages as well as trended over time. These interim feedback performance reports have provided information for hospitals to target implementation of the improvements we have seen over time.
In addition to providing input in the refinement of our data collection and measurement process, the Sepsis Advisory Group advises the Department on new developments and interventions for patients with sepsis, including treatments and processes of care delivery, that show promise for improving outcomes for patients with sepsis throughout NYS. The advisory group will focus increasingly on data evaluation for identifying and disseminating promising clinical interventions and system improvements from those hospitals with exceptional results.
Pediatric Sepsis Advisory Group The Pediatric Sepsis Advisory Group, comprised of pediatric critical care experts, developed revised definitions for pediatric severe sepsis and septic shock, which provided clarity to ensure reliable data abstraction and comparable eligible populations reported by each hospital. The Pediatric Sepsis Advisory Group was instrumental in contributing to the development of a dedicated Pediatric Data Dictionary as the Department determined the need to devote a data dictionary each to the adult and pediatric population.
Data Subcommittee The data subcommittee, which includes clinicians, statisticians, and experts in clinical measurement, provided feedback and comments on questions related to data collection and offered expert opinions on the risk adjustment model for this report. Data Optimization Subcommittee The data optimization subcommittee, which is also comprised of clinicians, statisticians and experts in clinical measurement, met on three separate occasions to identify ways to improve sepsis data collection from hospitals while reducing burden on hospitals. This subcommittee identified several challenges and offered proposals to address those challenges. The proposals highlighted by the subcommittee continue to be explored within the Department.

53
CMS Alignment Subcommittee The Department formed a Centers for Medicare and Medicaid Services (CMS) Alignment Subcommittee to discuss the challenges surrounding a possible CMS/Department data reporting alignment to support efforts to reduce hospital reporting burden. The subcommittee ultimately identified operational, contractual, and data challenges related to CMS alignment. The subcommittee determined that a proposed alignment is not currently feasible; however, much of what was learned from the efforts of the subcommittee will continue to be used in other similar efforts from the Department to manage hospital reporting burden.
IPRO, Implementation Business Partner
IPRO assisted the Department throughout the initiative, including the review of hospital sepsis protocols, development of the data dictionary, feedback reports, validation, and analyses. Key activities included the streamlining of electronic data collection, ensuring data integrity, customizing reports, providing webinars, and helpdesk support to hospitals. Krasnoff Quality Management Institute The Krasnoff Quality Management Institute (KQMI) partnered with the Department and IPRO to develop and pilot a new, interactive Tableau-based quarterly sepsis dashboard report to allow hospitals enhanced insight into their clinical sepsis data. After a collaborative development process, KQMI piloted the new dashboard within Northwell Hospitals for additional refinement. The Department subsequently enrolled 33 additional hospitals across the State in a voluntary pilot to solicit additional feedback for improvement of the dashboard with the goal of making the new report format available to all hospitals in NYS. Partnership for Patients (P4P)
The New York State Partnership for Patients (NYSPFP), a collaboration of the Healthcare Association of New York State (HANYS) and the Greater New York Hospital Association (GNYHA), continues to support NYS hospitals to achieve the CMS goal of reducing hospital-acquired conditions by 20%. NYSPFP’s sepsis initiative aims to help hospitals improve their sepsis care processes and outcomes by supporting front-line staff adherence to their protocols.
In 2019, NYSPFP’s customized hospital support included several approaches. A small cohort of hospitals, identified by analyzing Area Deprivation Index (ADI) data and Department sepsis data, participated in a rapid cycle improvement program aimed to improve sepsis bundle compliance adherence and reduce disparities. Rural and critical access hospitals (CAH) focused on sepsis improvement efforts with the support of a dedicated NYSPFP project manager who provided coaching and technical assistance to meet the unique needs and challenges of these small hospitals. Additionally, statewide programming was provided which focused on early identification of sepsis patients and sustaining best practices.
New York State Hospitals
In 2018, the Department surveyed participating hospitals and convened meetings of staff involved in sepsis reporting to identify challenges and best practices, quality improvement initiatives, and hospitals’ data needs. The Department obtained information from a statewide hospital survey and from continuous in-person meetings where data abstraction, burden of

54
reporting, and other issues were discussed. These efforts continued throughout 2019 and gave the Department valuable insight into the continued improvements to data definitions and specifications and planning for data sharing with hospitals to facilitate future quality improvement initiatives.
The Rory Staunton Foundation
Several private foundations, including the Rory Staunton Foundation, have provided support and assistance in raising public awareness regarding sepsis, which has amplified the work of the initiative in NYS. The mission of the Rory Staunton Foundation is to reduce the catastrophic impact of sepsis through education, awareness, and improved sepsis policies in hospitals and other medical environments. It has been instrumental in advocating for the existing regulations (‘Rory’s Regulations’) in New York and now, in other states as well, which provide for the rapid diagnosis and treatment of sepsis.
In 2019, the Rory Staunton Foundation for Sepsis Prevention was awarded a major federal contract intended to better understand and combat maternal sepsis, a leading cause of pregnancy-related and postpartum deaths in the United States. Despite being the world's richest country, the United States has the highest rate of maternal mortality in the developed world. The maternal sepsis initiative will be funded in part by the Biomedical Advanced Research and Development Authority (BARDA) Division of Research, Innovation, and Ventures (DRIVe), part of the United States Department of Health and Human Services (HHS) Office of the Assistant Secretary for Preparedness and Response.
Through the initiative, the risk factors associated with maternal sepsis will be identified and analyzed, including the demographic characteristics, co-morbidities, and obstetric procedures that may place some women at higher risk of developing the condition. A comprehensive dataset will be produced at the conclusion of the 18-month contract, which can be used to inform public policies and improve delivery of care to new and expectant parents. A limited, deidentified dataset will also be made publicly available as part of this initiative.
Additionally, the Rory Staunton Foundation will engage a multisector coalition of state and federal organizations invested in reducing maternal mortality rates. A series of audience-specific tools and materials designed to educate maternal care providers, patients, policymakers, and other key stakeholders will be developed and disseminated.
The Foundation will be joined in this endeavor by the Department's Office of Quality and Patient Safety and Northwell Health System's Department of Obstetrics and Gynecology.
Data Support for Research
The Department has continued to support research related to the early detection and treatment of sepsis. The Department recognizes the value of the data collected through the Sepsis Care Improvement Initiative and has developed a process for researchers interested in requesting data for research purposes. To facilitate the process, a Sepsis Clinical Data, Data Use Agreement is now available on the Department’s website at the following link: https://www.health.ny.gov/diseases/conditions/sepsis/docs/external_dua.pdf.
55
Next Steps The Department plans to continue working with partners to improve identification and care of sepsis patients to optimize outcomes.
Data Collection Improvement and Alignment
The Department will:
- continue to work with CMS and hospitals to refine the sepsis data dictionary to ensure complete and accurate data collection;
- continue to align measure specifications and data element definitions where possible with CMS for severe sepsis and septic shock to reduce hospital burden;
- develop methodology for linking and reporting episodes of care for patients who are transferred between acute care facilities, and for reporting patients who are transferred to hospice following an episode of sepsis; and
- continue work with the Pediatric Sepsis Advisory Group to refine pediatric data definitions.
Facilitation of Quality Improvement
The Department will: - investigate ways to share data with hospitals that can be used to identify opportunities
for improvement and to identify high-risk populations that can benefit from targeted interventions;
- continue to provide a mechanism for sharing of best practices among hospitals for early identification of sepsis patients and ensuring timely, appropriate treatment;
- continue to explore the potential for new outcomes-focused measures that can drive quality improvement; and
- continue to conduct research and collaborate with leading organizations to better understand and inform the public about the early detection and management of sepsis for all populations, including those impacted by maternal sepsis.
Alignment with Current Guidelines The Department will continue to work with the Sepsis Advisory Group and Pediatric Sepsis Advisory Group to monitor the evolving evidence and guidelines for identification and management of sepsis and to ensure that data collection and reports align with the latest evidence. Definitions of Key Terms • Sepsis - a clinical syndrome in which patients have an infection that is accompanied by an
extreme systemic response to the infection. • Severe sepsis (adult) - proven or suspected infection, two or more manifestations of
systemic inflammatory response to infection, and organ dysfunction. • Severe sepsis (pediatric) - proven or suspected infection, abnormal temperature or white
blood cell count and one other manifestation of systemic inflammatory response to infection, and organ dysfunction.
• Septic shock (adult) - severe sepsis and hypotension persisting despite adequate IV fluid resuscitation or severe sepsis and evidence of tissue hypoperfusion.

56
• Septic shock (pediatric) - sepsis and cardiovascular organ dysfunction despite 20cc/kg of crystalloid fluid administration.
• Protocol initiation - patients in each hospital who received care consistent with the initiation of their formal protocol, excluding those cases with identified (and justified) clinical or advanced directive exceptions.
• Start Time - the start time for reported bundle measures. For aggregated data and hospital specific measures, start time is defined as the time that the patient presented with severe sepsis or septic shock, either by meeting all defining criteria or documentation of the condition by a clinician.
• 3-hour bundle (adult) - composite measure for patients with severe sepsis or septic shock that includes receipt of measurement of blood lactate level, blood culture collection prior to antibiotics, and broad-spectrum antibiotic administration within three hours or up to 24 hours before “start time” for patients with severe sepsis and septic shock. Patients who were excluded from the hospital’s protocol or from specific care interventions, or who died within 3 hours of start time are excluded from this measure.
• 6-hour bundle (adult) - composite measure that includes receipt of the 3-hour bundle within three hours of severe sepsis presentation, a repeat lactate level within 6 hours of severe sepsis start time if initial lactate level is elevated, resuscitation with crystalloid fluids within 3 hours of septic shock start time, fluid status assessment within 6 hours of septic shock start time, and vasopressor therapy within 6 hours of septic shock start time if persistent hypotension after fluid resuscitation is present. This measure represents the percentage of patients with septic shock (a subset of all patients) that received all of the 3-hour bundle interventions as well as the additional interventions described in this section. Patients who were excluded from the hospital’s protocol or from specific care interventions, or who died within 6 hours of start time are excluded from this measure.
• 1-hour bundle (pediatric) - composite measure for pediatric patients with severe sepsis or septic shock that includes receipt of parenteral fluids, blood cultures, and antibiotics within one hour of their presentation. Patients who were excluded from the hospital’s protocol or from specific care interventions, or who died within 1 hour of start time are excluded from this measure.

57
Technical Appendix A: Adult Sepsis Sampling Hospitals
Beginning in 2017, the Department began to accept submission of a random sample of adult sepsis cases from high volume hospitals to fulfill reporting requirements regarding sepsis data collection. Pediatric sepsis cases are not eligible for sampling. A high-volume hospital is defined as one which submitted more than 400 cases to the sepsis clinical database for calendar year of data submission two years prior to the current year. Hospitals that meet this case volume requirement have the option to opt-in to a sampling approach to send a complete list of adult sepsis cases for sample selection on a monthly or quarterly basis. A random sample of these cases within each hospital are then selected by the Department and returned to the hospital for full data abstraction and submission, for a total of 400 adult cases submitted to the sepsis clinical database by each sampling hospital.
For sampling hospitals, measure performance is calculated based on each hospital’s performance in their representative sample of cases. This result is then weighted by calculating the estimated numerator and denominator on a quarterly basis from the sample performance and the number of cases in each quarter the hospital would have reported had it not sampled, based on the full adult case list submitted for sampling. Measure performance for sampling hospitals then is presented as an estimate based on a representative sample of cases rather than observed performance, and therefore carries a level of uncertainly in the accuracy of this estimate. This uncertainty is represented in this appendix by 95% Confidence Intervals; representing the highest and lowest bounds between which we would expect the point estimate to lie in 95% of random samples of the adult sepsis cases for each sampling hospital.
Measure estimates and 95% confidence intervals for all 30 hospitals that participated in sampling for CY2018 data submission are presented in Table A1. The denominator of the measure represents the number of cases estimated to be in the denominator of the measure based on the full adult case list submitted for sampling, and thus will be larger than the total number of cases submitted to the clinical data portal.

58
Table A1. Adult Sepsis Measure Summary Report for Sampling Hospitals
PFI/ Facility Name
Timely Administration of Broad-Spectrum Antibiotics
3-Hour Bundle Composite Bundle
Number of Cases
(N)
Met Measure
(%)
95% CI Lower Bound
(%)
95% CI Upper Bound
(%)
Number of Cases
(N)
Met Measure
(%)
95% CI Lower Bound
(%)
95% CI Upper Bound
(%)
Number of Cases
(N)
Met Measure
(%)
95% CI Lower Bound
(%)
95% CI Upper Bound
(%)
(0001) Albany Medical Center Hospital
443 74.5 74.0 75.0 443 33.4 32.8 34.0 435 5.1 4.8 5.3
(1178) Bronx-Lebanon Hospital Center - Concourse Division 651 91.4 91.1 91.7 651 74.5 74.0 75.0 641 58.2 57.6 58.8
(0885) Brookhaven Memorial Hospital Medical Center Inc
436 96.8 96.7 96.9 436 76.8 76.6 77.0 428 64.7 64.5 65.0
(1626) Elmhurst Hospital Center 542 86.7 86.5 86.9 542 66.6 66.3 66.9 542 31.5 31.2 31.9
(1638) Forest Hills Hospital 381 84.3 84.2 84.3 381 68.2 68.1 68.4 372 29.6 29.4 29.7
(0925) Good Samaritan Hospital Medical Center
1,093 87.7 87.4 88.1 1,093 75.5 75.0 75.9 1,087 60.8 60.3 61.3
(0409) Highland Hospital 524 90.3 90.0 90.5 524 75.2 74.9 75.5 513 40.2 39.8 40.5
(1450) Lenox Hill Hospital 662 89.7 89.5 90.0 662 66.5 66.1 66.9 651 47.8 47.4 48.2
(1630) Long Island Jewish Medical Center
685 84.5 84.2 84.8 685 64.7 64.3 65.0 685 20.9 20.6 21.2
(0213) Mercy Hospital 588 86.4 86.1 86.7 588 71.1 70.7 71.4 579 41.6 41.2 42.0
(1439) Mount Sinai Beth Israel 613 90.2 90.0 90.5 613 74.2 73.9 74.6 587 49.6 49.1 50.0
(1456) Mount Sinai Hospital 1,197 88.2 87.7 88.7 1,197 62.6 61.8 63.3 1,191 29.5 28.8 30.2
(1466) Mount Sinai Roosevelt 590 88.5 88.3 88.7 590 73.9 73.6 74.2 584 43.5 43.2 43.8
(1469) Mount Sinai St. Luke’s 980 87.8 87.5 88.0 980 66.4 66.0 66.8 969 39.6 39.2 40.0
(1637) New York Hospital Medical Center of Queens
1,917 80.6 80.2 81.0 1,917 63.4 62.9 63.9 1,834 43.9 43.4 44.4
(1464) New York Presbyterian Hospital - Columbia Presbyterian Center
555 87.9 87.4 88.4 555 71.5 70.8 72.2 520 32.7 31.9 33.4
(1458) New York Presbyterian Hospital - New York Weill Cornell Center
403 93.8 93.5 94.1 403 78.7 78.1 79.2 376 40.7 40.0 41.1
(1304) NYU Langone-Brooklyn 417 97.1 97.0 97.2 417 90.9 90.7 91.0 412 81.8 81.6 82.0
(1463) NYU Langone Hospitals 588 97.3 97.1 97.4 588 88.3 87.9 88.6 585 72.8 72.4 73.3
(0511) NYU Winthrop Hospital 976 91.7 91.5 91.9 976 80.7 80.4 81.1 960 59.5 59.0 59.9

59
PFI/Facility Name
Timely Administration of Broad-Spectrum Antibiotics
3-Hour Bundle Composite Bundle
Number of Cases
(N)
Met Measure
(%)
95% CI Lower Bound
(%)
95% CI Upper Bound
(%)
Number of Cases
(N)
Met Measure
(%)
95% CI Lower Bound
(%)
95% CI Upper Bound
(%)
Number of Cases
(N)
Met Measure
(%)
95% CI Lower Bound
(%)
95% CI Upper Bound
(%)
(0699) Orange Regional Medical Ctr-Goshen Campus
774 85.5 85.2 85.8 774 73.8 73.4 74.1 765 42.9 42.5 43.3
(0411) Rochester General Hospital 756 80.8 80.4 81.2 756 61.8 61.3 62.2 756 26.9 26.4 27.3
(0527) South Nassau Communities Hospital
837 85.3 85.0 85.6 837 75.3 74.9 75.7 807 52.5 52.1 53.0
(0943) St Catherine of Siena Hospital
809 95.2 95.0 95.4 809 91.6 91.4 91.8 788 80.8 80.5 81.2
(0630) St Joseph’s Hospital Health Center
574 85.2 84.9 85.5 574 66.7 66.4 67.1 566 33.9 33.5 34.3
(0005) St Peter’s Hospital 728 88.6 88.3 88.9 728 62.9 62.5 63.3 712 40.4 40.0 40.9
(1740) Staten Island University Hosp-North
685 83.6 83.4 83.9 685 50.1 49.7 50.4 676 18.8 18.5 19.1
(0413) Strong Memorial Hospital 1,194 94.2 93.9 94.6 1,194 82.5 82.0 83.0 1,178 42.7 42.0 43.4
(0245) University Hospital 882 89.0 88.7 89.3 882 74.1 73.7 74.6 855 47.5 47.0 48.0
(0181) Vassar Brothers Medical Center
758 89.6 89.3 89.8 758 76.9 76.6 77.3 744 57.9 57.5 58.4
Statewide 87.53 87.20 87.77 69.54 69.09 69.87 41.11 40.39 41.23

60
Technical Appendix B: Risk Adjustment Methodology
The objective of the risk adjustment process is to assess hospital performance in preventing severe sepsis related mortality after accounting for differences in patient case mix among hospitals. The 2018 risk-adjusted mortality outcome includes all severe sepsis patient deaths that occurred within 30 days of the presentation of severe sepsis, including patients who were discharged alive from the hospital but expired within 30 days of presentation. Measurement of this outcome is facilitated by a match of sepsis clinical data to NYS vital statistics. For the purposes of this section, ‘mortality’ will be used to describe this outcome. In the first part of the risk adjustment process, a mortality model estimates the probability of mortality for each patient with severe sepsis. This estimate is based on patient demographic, comorbidity, and severity of illness characteristics. Multivariable logistic regression was used to determine which variables are important and accurate in estimating the probability of mortality for each patient. Table B1 contains the patient demographic, comorbidity, and severity of illness variables included in this analysis.
The risk-adjusted model in this report makes use of the most recent complete and audited data from four quarters of patient data submission in 2018. All patients who were discharged and transferred from one hospital to another or who were admitted from hospice care were excluded from model development and the application of the model to each hospital’s result. Patients with advance care directives in place prior to the episode of sepsis, who declined sepsis protocol interventions, or who refused sepsis protocol interventions at the time of presentation, were removed from the data set. Patients admitted more than once in 2018 for sepsis are represented only once for purposes of development of the risk-adjusted model (using their last admission only); for purposes of evaluating each hospital’s performance, each admission is included.
To assess hospital performance, the probability of mortality is calculated for every patient from that hospital using the logistic regression model. These probabilities are summed over all the patients treated at that hospital to calculate the expected number of deaths for that hospital. The actual number of deaths is determined for all patients in that hospital as well. The ‘standardized’ mortality ratio (SMR) is calculated by dividing the observed by the expected number of deaths among patients treated in each hospital. The SMR was then multiplied by the statewide mortality rate to obtain a risk-adjusted mortality rate (RAMR) and a 95% confidence interval for the RAMR. The RAMR provides the best estimate of what each hospital’s mortality rate would have been if they had a case mix that was identical to the average case mix across all hospitals in the state. If the confidence interval for a hospital’s RAMR is entirely below the statewide rate, the hospital performed significantly better than the state average. If the hospital’s confidence interval was entirely above the statewide rate the hospital performed significantly worse than the statewide rate. Figure B1 contains a plot showing the RAMR and confidence interval for each hospital. The highest performing hospitals are displayed in blue and the lowest performing hospitals are displayed in gold.
There are limitations associated with the risk-adjusted mortality model. These are largely related to factors associated with sepsis mortality that are not currently collected in the sepsis clinical database, and therefore not included in the risk adjustment model. These include significant comorbidities associated with sepsis mortality, including cardiac arrest and burns, as well as social determinates of health, including socio-economic status and access to health care. While these data are not currently collected in the sepsis clinical database, an effort to

61
identify and capture more of the relevant covariates is underway and should improve the performance of the risk adjustment model. Variability in the measured outcome may also be considered a limitation of this model. In the 2018 methodology, patients discharged alive from the hospital who expire within 30 days of presentation are included in the outcome, which may include patients who expired for reasons unrelated to sepsis. However, the 30-day post-presentation mortality approach is expected to be a more realistic representation of sepsis mortality compared to using discharge status and this benefit outweighs potential error associated with this outcome methodology.

62
Table B1. Variables in the Risk-Adjusted Mortality Rate (RAMR) model
Main Effects or Interactions Level of Effects % Coef. Odds Ratio (95%
CI) p-
value Intercept -6.12 <.001 Sex - Main Effect Male 52.6% Reference category Female 47.4% 0.09 1.09 (1.04-1.16) 0.001 Race/Ethnicity- Main Effect White, Non-Hispanic 61.4% Reference category Black, Non-Hispanic 15.9% -0.07 0.93 (0.86-1.00) 0.062 Hispanic 11.3% -0.14 0.87 (0.79-0.95) 0.003 Other, Non-Hispanic 9.6% -0.16 0.86 (0.78-0.94) 0.002 Other/Unknown Ethnicity 1.9% 0.08 1.09 (0.89-1.33) 0.400 Source of Admission- Main Effect Non-Health Facility, POA 76.0% Reference category Clinic 3.1% -0.34 0.081 SNF/ICF 19.4% 0.81 <.001
Another Health Care Facility 0.8% -0.44 0.143
Between Unit Transfer 0.3% 0.31 0.535 Other 0.4% -0.92 0.164 Platelet Count- Main Effect No 76.8% Reference category Yes 23.2% 0.36 1.44 (1.35-1.53) <.001 Altered Mental Status- Main Effect No 59.0% Reference category Yes 41.0% 0.52 1.67 (1.58-1.77) <.001 Lower Respiratory Infection- Main Effect No 54.4% Reference category Yes 45.6% 0.35 <.001 Septic Shock Present- Main Effect Severe Sepsis 56.8% Reference category Septic Shock 43.2% 0.37 1.45 (1.37-1.54) <.001 Site of Infection - Main Effect Skin 8.2% Reference category Urinary 23.3% -0.38 0.69 (0.61-0.78) <.001 Respiratory 42.3% 0.15 1.17 (1.03-1.32) 0.015 Gastrointestinal 10.8% 0.15 1.16 (1.01-1.33) 0.031 Central Nervous System 0.5% 0.26 1.30 (0.85-1.98) 0.222 Other/Unknown 15.0% 0.28 1.32 (1.17-1.50) <.001 Mechanical Ventilation Prior to Presentation of Severe Sepsis - Main Effect
No 86.0% Reference category
Yes 14.0% 0.45 <.001 Chronic Respiratory Failure- Main Effect No 91.9% Reference category Yes 8.1% -0.31 0.73 (0.66-0.81) <.001 Metastatic Cancer- Main Effect No 90.8% Reference category Yes 9.2% 2.19 <.001 Lymphoma Leukemia Multiple Myeloma - Main Effect
No 95.5% Reference category Yes 4.5% 0.16 1.18 (1.04-1.34) 0.012
Immune Modifying Medications - Main Effect
No 83.2% Reference category Yes 16.8% -0.35 0.71 (0.65-0.77) <.001
Chronic Liver Disease - Main Effect No 94.7% Reference category Yes 5.3% 0.26 1.30 (1.15-1.47) <.001 Diabetes - Main Effect No 62.9% Reference category Yes 37.1% -1.11 <.001 Age - Main Effect 0.05 <.001 Lactate - Main Effect 0.15 1.16 (1.15-1.17) <.001 Comorbidity Count (square root) - Main Effect 1.43 <.001
No, Yes 49.7%

63
Main Effects or Interactions Level of Effects % Coef. Odds Ratio (95%
CI) p-
value Lower Respiratory Infection * Mechanical Ventilation Prior to Presentation of Severe Sepsis No, No 4.7% Yes, No 36.3% Yes, Yes 9.3% -0.39 <.001 Age * Metastatic Cancer -0.02 <.001 Age * Comorbidity Count -0.01 <.001 Comorbidity Count * Diabetes Yes 0.44 <.001 Comorbidity Count * Source of Admission Clinic 0.31 0.024 SNF/ICF -0.19 <.001
Another Health Care Facility 0.54 0.023
Between Unit Transfer 0.34 0.367 Other 0.24 0.627 c statistic: 0.7820

64
Figure B1. RAMR and 95% Confidence Interval by Hospital

65
Technical Appendix C: Comparisons Over Time
The following tables and figures show statewide comparisons of performance and outcome measures for inpatient sepsis care for NYS between 2015 and 2018.
Table C1 contains statewide sepsis care compliance and outcome measure results for adults (age ≥ 18) and compliance measure results for pediatric (age < 18) sepsis patients in NYS from 2015 to 2018. This table includes the statewide crude in-hospital death rates per 100 sepsis patients along with the three-hour bundle, and composite bundle quality measures for adults, and presents the one-hour bundle sepsis care measure for pediatric patients. Patient eligibility and completion criteria for each measure follows the guidelines in place for each individual calendar year. All eligible cases are included in the calculation of the statewide measure results, regardless of the number of cases at the individual hospital where the patient was seen.
Figure C1 charts the year over year movement of relative hospital composite (six-hour) bundle performance, represented by yearly quintiles. Each arm in this chart represents the movement of hospitals within and across quintiles of bundle performance from year to year. The size of each arm in this chart is proportional to the number of hospitals represented by that movement.
Table C1. Adult Sepsis Compliance and Outcome Measures and Pediatric Sepsis Compliance Measures Calendar Year (CY) Comparison
Year Crude Death Rate (Adult)
3-Hour Bundle Completion
(Adult)
Composite Bundle
Completion (Adult)
1-Hour Bundle Completion (Pediatric)
2018 23.41 69.54 41.11 42.67
2017 23.70 64.97 34.96 35.94
2016 25.45 56.88 36.38 8.16
2015 27.33 54.07 31.53 7.88
Difference (CY16-CY15) -1.88 2.81 4.85 0.28
Difference (CY17-CY16) -1.75 8.09 -1.42 27.78
Difference (CY17-CY18) -0.29 4.56 6.15 6.73

66
Figure C1. Adult Sepsis 6-Hour Bundle Performance Trends: 2016 through 2018

67
Report Contributors
The New York State Report on Sepsis Care Improvement Initiative: Hospital Quality Performance – 2018 Report is published by:
New York State Department of Health Office of Quality and Patient Safety
Anne Schettine, Director Jay Cooper, Deputy Director
Office of the Medical Director
Dr. Marcus Friedrich, Chief Medical Officer Dr. Jeanne Alicandro, Medical Director
Dr. Alda Osinaga, Medical Director Lauren Orciuoli, Associate Health Planner
George Stathidis, Associate Health Planner
Division of Information and Statistics Mary Beth Conroy, Director
Natalie Helbig, Deputy Director
Bureau of Vital and Health Statistics Tatiana Ledneva, Director
Stephen Goins, Research Scientist Megan Lemmon, Research Scientist
Zouleikha Moumen Seridi, Senior Healthcare Program Specialist The authors would like to acknowledge the members of the Sepsis Advisory Group and the Pediatric Sepsis Advisory Group for their contributions to this report.
Sepsis Advisory Group Members John Babineau, MD Associate Chief Quality Officer New York Presbyterian Hospital New York, NY
Mohamed Mansour, MD, FCCP Director, Medical ICU Pulmonary & Critical Care Medicine Stony Brook University Medical Center Stony Brook, NY
Christopher C. Battaglia, MD Medical Director, Intermediate Care Unit Assistant Professor of Oncology and Critical Care Roswell Park Cancer Institute, Department of Anesthesiology Buffalo, NY
Karen McKenna, MS, RN, ACNS-BC, CCRN Clinical Quality Nurse Coordinator Mount Sinai St. Luke’s – West New York, NY
Gregory Briddick, BSN, RN, CCRN, TCRN Sepsis Program Coordinator
Paul Murphy Quality Management Practitioner

68
Quality Services SUNY Upstate University Hospital Syracuse, NY
Stony Brook University Hospital East Setauket, NY
David H. Chong, MD Director of Critical Care, NYP at CUMC Columbia University Medical Center New York, NY
Mohammed Nakeshbandi, MD Assistant Professor of Medicine and Infectious Diseases Director, Antimicrobial Stewardship Program Director, Internal Medicine Inpatient Private Service SUNY Downstate Medical Center Brooklyn, NY
Edward E. Conway Jr., M.D., M.S., FAAP, FCCM Professor of Pediatrics Division Chief Pediatric Critical Care Associate Vice-Chairman Department of Pediatrics Jacobi Medical Center
Robert J. Panzer, MD Chief Quality Officer Associate VP, Patient Care Quality & Safety Georgia & Thomas Gosnell Professor in Quality & Safety University of Rochester Medical Center Rochester, NY
Art Cooper, MD, MS, FACS, FAAP, FCCM, FAHA, FAADM, FAEMS Professor Emeritus and Special Lecturer in Surgery Vagelos College of Physicians & Surgeons of Columbia University Director of Pediatric Surgical and Trauma Services New York City Health+ Hospitals | Harlem New York, New York
Margaret M. Parker, MD, MCCM Professor of Pediatrics Stony Brook Children’s Stony Brook, NY
Christine Cunningham, RN, BSN, MPA Director, Clinical Quality Improvement Project Management NYU Langone Health New York, NY
Maria Lyn Quintos-Alagheband, MD, FAAP Associate Professor of Pediatrics and Director of Health Systems Science NYU Long Island School of Medicine Chief Quality Officer for Children's Services at NYU Winthrop Hospital NYU Langone Health
Elizabeth Deda, RN Quality Management Specialist New York Presbyterian Hospital
Kathleen Rauch Senior Director, Quality Health Association of New York State Rensselaer, NY
Clifford Deutschman, MS, MD, MCCM Vice Chair, Research Department of Pediatrics
Beth Raucher, MD, SM, FACP Vice Chair, Internal Medicine Quality & Clinical Affairs Professor of Medicine

69
Professor of Pediatrics and Molecular Medicine Hofstra-Northwell School of Medicine Steven and Alexandra Cohen Children's Medical Center Hofstra-Northwell School of Medicine New Hyde Park, NY
Mount Sinai Health System New York, NY
Martin E. Doerfler, MD Senior Vice President, Clinical Strategy and Development Associate Chief Medical Officer Northwell Health New Hyde Park, NY
Tamara Rudich, MPH Core Measures Manager New York Presbyterian New York, NY
Laura Evans, MD, MSc Associate Professor, New York University School of Medicine Medical Director, Bellevue Hospital Center New York, NY
Rafael Ruiz, PhD, ScM Director, Performance Informatics Montefiore Medical Center Yonkers, NY
Pamela Feuer, MD Pediatric Critical Care Medicine Harlem Hospital Center New York, NY
Lorraine Ryan, Esq. Senior Vice President, Legal, Regulatory and Professional Affairs Greater New York Health Association New York, NY
Cara Fleming, AGPCNP-BC, OCN Clinical Program Manager, Sepsis Memorial Sloan Kettering Cancer Center New Hyde Park, NY
Melissa Schafer, MD Pediatric Quality Officer, Hospitalist Upstate Golisano Children’s Hospital Syracuse, NY
Isabel M. Friedman Director of Clinical Initiatives Northwell Health New Hyde Park
Rachael Schneider, RN, MBA Clinical Sepsis Coordinator Mount Sinai St. Luke’s West New York, NY
Marcus Friedrich, MD, MBA, FACP Chief Medical Officer New York State Department of Health Albany, NY
Zeynep Sumer-King Vice President, Regulatory and Professional Affairs Greater New York Hospital Association New York, NY
Allison Glasser, BSPT, MBA Senior Director Clinical Excellence Mount Sinai Health System New York, NY
Kate Tayban, ACNP-BC, GNP-BC Clinical Program Manager, Informatics Memorial Sloan Kettering Cancer Center New York, NY
Philip L. Graham, III, MD MSc Hospital Epidemiologist New York Presbyterian
Kathy Terry, PhD Senior Director IPRO

70
New York, NY Lake Success, NY Kay Hale, MD, FCCP Assistant Attending Anesthesia & Critical Care Medicine Memorial Sloan Kettering Cancer Center New York, NY
Amit Uppal, MD Director MICU Associate Chief of Medicine Bellevue Hospital New York, NY
Justin Hamilton Quality Management Specialist New York Presbyterian Hospital New York, NY
Kristin Vinson, NP-C Patient Safety and Quality Specialist New York University Winthrop Mineola, NY
Marina Keller, MD System Epidemiologist, Infectious Disease Physician Greater Hudson Valley Hospital System Middletown, NY
Patti G. Weinberg, PA, MPS Vice President, Medicaid State Healthcare Assessment, IPRO Lake Success, NY
Jennifer R. Kelly, RN, BSN Quality Management Specialist New York Presbyterian New York, NY
Anne Wetzold, MBA, BSN, RN Senior Quality Improvement Project Manager New York University Langone Health New York, NY
Nancy Landor Senior Director Health Association of New York State Rensselaer, NY
Loretta Willis, RN, BS, CPHQ, CCM Vice President, Quality Advocacy, Research & Innovation Health Association of New York State Rensselaer, NY
Mitchell M. Levy, MD, MCCM, FCCP Director, Medical Intensive Care Unit Rhode Island Hospital Providence, RI
William Zhou, MPH Informatics Specialist Memorial Sloan Kettering Cancer Center New York, NY
Michael Lucchesi, MD, MS Chief Medical Officer Chairman, Dept. of Emergency Medicine SUNY Downstate Medical Center Brooklyn, NY
Pediatric Sepsis Advisory Group Members Yasir Al-Qaqaa, MD Assistant Professor of Pediatrics NYU School of Medicine Medical Director, Pediatric Critical Care Medicine NYU Langone Medical Center New York, New York
Maria Lyn Quintos-Alagheband, MD, FAAP Associate Professor of Pediatrics and Director of Health Systems Science NYU Long Island School of Medicine Chief Quality Officer for Children's Services at NYU Winthrop Hospital NYU Langone Health

71
Jeanne Alicandro, MD, MPH Medical Director New York State Department of Health Albany, New York
Rafael Ruiz, PhD, ScM Director, Performance Informatics Montefiore Medical Center Yonkers, New York
Edward E. Conway Jr., M.D., M.S., FAAP, FCCM Professor of Pediatrics Division Chief Pediatric Critical Care Associate Vice-Chairman Department of Pediatrics Jacobi Medical Center
Melissa Schafer, MD Pediatric Quality Officer, Hospitalist Upstate Golisano Children’s Hospital Syracuse, New York
Art Cooper, MD, MS, FACS, FAAP, FCCM, FAHA, FAADM, FAEMS Professor Emeritus and Special Lecturer in Surgery Vagelos College of Physicians & Surgeons of Columbia University Director of Pediatric Surgical and Trauma Services New York City Health+ Hospitals | Harlem New York, New York
Vikas Shah, MD Director, Pediatric Intensive Care New York City Health + Hospital/ Kings County Brooklyn, New York
Pamela Feuer, MD Pediatric Critical Care Medicine Harlem Hospital Center New York, New York
Kathy Terry, PhD Senior Director IPRO Lake Success, New York
Marcus Friedrich, MD, MBA, FACP Chief Medical Officer New York State Department of Health Albany, New York
Elise W. van der Jagt, MD, MPH, FAAP, SFHM Professor of Pediatrics and Critical Care Chief, Pediatric Hospital Medicine University of Rochester Medical Center Rochester, New York
Amanda Hassinger, MD, MS Director of Quality & Patient Safety, Pediatric Critical Care Oishei Children’s Hospital, University of Buffalo Jacobs School of Medicine and Biomedical Sciences Buffalo, New York
Scott Weiss, MD MSCE Assistant Professor Children’s Hospital of Philadelphia Philadelphia, Pennsylvania
Niranjan "Tex" Kissoon, MB BS, FRCP(C), FAAP, MCCM, FACPE Vice President Medical Affairs BC Children's Hospital and Sunny Hill Health Centre
Steven Yung, MD Medical Director, Pediatric Quality and Safety Kravis Children’s at Mount Sinai Hospital New York, New York
72
UBC and BCCH Professor in Acute and Critical Care - Global Child Health Vancouver, British Columbia Uchechi Oddiri, MD, FAAP Assistant Professor of Clinical Pediatrics Stony Brook Children’s, Division of Pediatric Critical Care Medicine Stony Brook, New York
Jerry J. Zimmerman, MS, PhD, FCCM Faculty, Pediatric Critical Care Medicine Seattle Children’s Hospital: Harborview Medical Center, University of Washington School of Medicine Seattle, Washington
Margaret M. Parker, MD, MCCM Professor of Pediatrics Stony Brook Children’s Stony Brook, New York