newalta corporation
DESCRIPTION
Newalta provides cost-effective solutions to industrial customers to improve their environmental performance with a focus on recycling and recovery of products from industrial residues. These services are provided through our network of more than 80 facilities across Canada and at our customers’ facilities where we mobilize our equipment and people to process material directly onsite. We have established an industry leading position with talented people, efficient and safe operations, innovative approaches and high ethical standards.TRANSCRIPT

SPINE
GoiNG BIG
GROWTHAR2010

GOING BIGNewalta provides cost-effective solutions to industrial customers
to improve their environmental performance with a focus on
recycling and recovery of products from industrial residues.
These services are provided through our network of more than
80 facilities across Canada and at our customers’ facilities
where we mobilize our equipment and people to process material
directly onsite. We have established an industry leading position
with talented people, efficient and safe operations, innovative
approaches and high ethical standards. Newalta trades on the
TSX as NAL and NAL.DB.
For more information, visit newalta.com
aBOut NEWalta
GOING BIGNewalta has always thought big and acted big. Now we’re Going Big with
a continuous improvement plan to build on our track record of profitable
growth and increased diversification.
Going Big means greater expertise and more value created from more
waste streams. Going Big means the best is yet to come.
Contents 4 Financial Highlights
6 Facilities
8 Onsite
10 President’s Message
12 Newalta Officers
14 Management’s Discussion and analysis
51 Management and auditors’ reports
53 Financial Statements
57 Notes to the Consolidated Financial Statements
IBC Corporate Information
aR20103

INVESTMENTGrande prairie, alberta
� Western Facilities 47%
� Eastern Facilities 22%
� Ville Ste. Catherine 31%
Facilities Business Units -2010 Revenue
Onsite Business Units -2010 Revenue
� Western Onsite 39%
� Eastern Onsite 26%
� Heavy Oil 35%
Revenue ($ millions)
2010 20092008 2010 20092008
2010 20092008
2010 20092008
Adjusted EBITDA(1)
($ millions)
Facilities Revenue($ millions)
20092008 2010
2010 2009200820092008 2010
Facilities Net Margin(1)
($ millions)
Onsite Revenue($ millions)
Onsite Net Margin(1)
($ millions)
Funds from Operations(1)
($ millions)
0
90
180
270
360
450
0
20
40
80
120
100
60
0
50
100
150
200
0
10
20
30
40
0
100
200
300
400
500
600
0
30
60
90
120
150
0
20
40
60
80
100
FINaNCIal rESultS aND HIGHlIGHtS• Revenue increased 19% to $576.2
million, while Adjusted EBITDA(1)
climbed 45% to $118.8 million
• Funds from operations(1) increased
56% to $95.1 million
• Strong funds from operations supported
a 30% dividend increase and $47
million in growth capital investments(1)
• Total return to shareholders in 2010
was 50%, bringing total returns over
the past two years to 100%
(1) these financial measures do not have any standardized meaning prescribed by Canadian Generally accepted accounting
Principles (“GaaP”), and are therefore unlikely to be comparable to similar measures presented by other issuers.
Non-GaaP financial measures are identified and defined throughout Management’s Discussion and analysis.
Newalta4
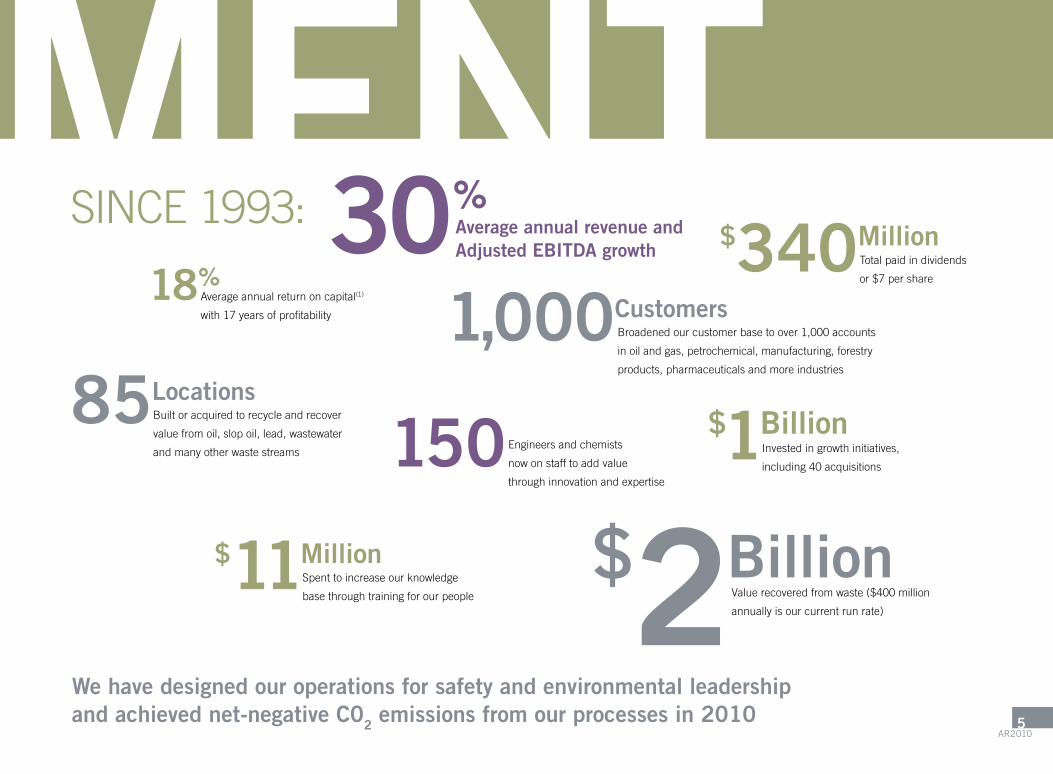
INVESTMENTSINCE 1993:
18%average annual return on capital(1)
with 17 years of profitability
150 Engineers and chemists
now on staff to add value
through innovation and expertise
85Locations Built or acquired to recycle and recover
value from oil, slop oil, lead, wastewater
and many other waste streams
1,000CustomersBroadened our customer base to over 1,000 accounts
in oil and gas, petrochemical, manufacturing, forestry
products, pharmaceuticals and more industries
Spent to increase our knowledge
base through training for our people
$11Million
total paid in dividends
or $7 per share
$340Million
Invested in growth initiatives,
including 40 acquisitions
$1Billion
Value recovered from waste ($400 million
annually is our current run rate)
$2Billion
Average annual revenue and Adjusted EBITDA growth30%
We have designed our operations for safety and environmental leadership and achieved net-negative C02 emissions from our processes in 2010
aR20105

TX
PAWY
BC AB
NT NU
SK MB
ON
QC
NB
NL
NS
CREATE VALUENewalta’s North American locations
above right: Ville Ste. Catherine, Québec
lead recycling facility
Right: North Vancouver, British Columbia
used oil re-refinery
� Western Facilities 47%
� Eastern Facilities 22%
� Ville Ste. Catherine 31%
Facilities Business Units -2010 Revenue
Onsite Business Units -2010 Revenue
� Western Onsite 39%
� Eastern Onsite 26%
� Heavy Oil 35%
Revenue ($ millions)
2010 20092008 2010 20092008
2010 20092008
2010 20092008
Adjusted EBITDA(1)
($ millions)
Facilities Revenue($ millions)
20092008 2010
2010 2009200820092008 2010
Facilities Net Margin(1)
($ millions)
Onsite Revenue($ millions)
Onsite Net Margin(1)
($ millions)
Funds from Operations(1)
($ millions)
0
90
180
270
360
450
0
20
40
80
120
100
60
0
50
100
150
200
0
10
20
30
40
0
100
200
300
400
500
600
0
30
60
90
120
150
0
20
40
60
80
100
Newalta6

CREATE VALUEFaCIlItIESOver almost two decades, we built a network of more than 80 facilities and
achieved a portfolio of almost 300 permits and licenses to operate, including
90 certificates of approval for facilities and transportation. This network and
our operating permits are not only difficult to duplicate, they form a strong
competitive advantage. Now that our Canadian infrastructure is built out,
we can profitably serve an expanding customer base.
During the economic recession of 2009, Facilities experienced a decline in
customer activity levels and a dramatic reduction in prices for our recovered
products. In 2010, the early stage economic recovery led to stronger performance,
and we expect 2011 will bring continued improvement. as we demonstrated in
2010, Facilities can generate strong incremental margins on increased revenues
as capacity utilization improves.
In 2010, Facilities grew again as it:
• Increasedrevenue20percentyear-over-year
• Achievednetmarginprofitabilityof45percentonadditionalrevenue
• Improvednetmarginby43percentto$98.6million,from$68.7millionin2009
• Benefittedfrom$50.9millioningrowthinvestmentsmadein2008-2009
• Droveimprovementfromhigheractivitylevelsacrossallthreebusinessunits
� Western Facilities 47%
� Eastern Facilities 22%
� Ville Ste. Catherine 31%
Facilities Business Units -2010 Revenue
Onsite Business Units -2010 Revenue
� Western Onsite 39%
� Eastern Onsite 26%
� Heavy Oil 35%
Revenue ($ millions)
2010 20092008 2010 20092008
2010 20092008
2010 20092008
Adjusted EBITDA(1)
($ millions)
Facilities Revenue($ millions)
20092008 2010
2010 2009200820092008 2010
Facilities Net Margin(1)
($ millions)
Onsite Revenue($ millions)
Onsite Net Margin(1)
($ millions)
Funds from Operations(1)
($ millions)
0
90
180
270
360
450
0
20
40
80
120
100
60
0
50
100
150
200
0
10
20
30
40
0
100
200
300
400
500
600
0
30
60
90
120
150
0
20
40
60
80
100
aR20107
CREATE VALUE
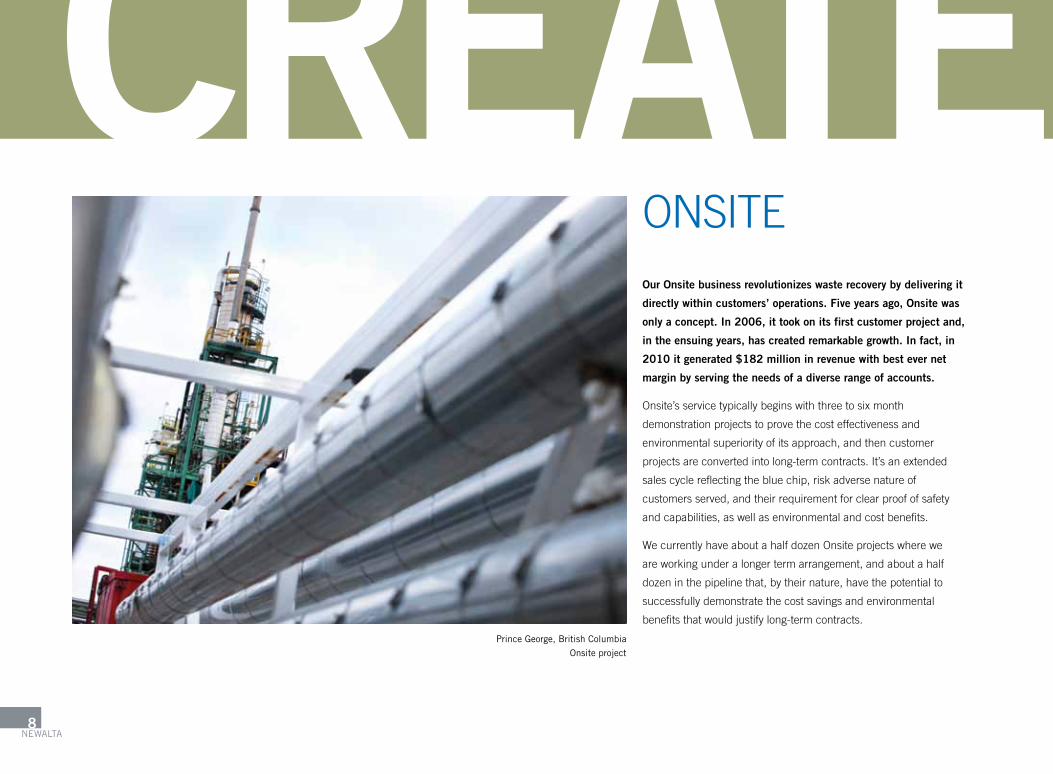
prince George, British Columbia
onsite project
ONSItEOur Onsite business revolutionizes waste recovery by delivering it
directly within customers’ operations. Five years ago, Onsite was
only a concept. In 2006, it took on its first customer project and,
in the ensuing years, has created remarkable growth. In fact, in
2010 it generated $182 million in revenue with best ever net
margin by serving the needs of a diverse range of accounts.
Onsite’s service typically begins with three to six month
demonstration projects to prove the cost effectiveness and
environmental superiority of its approach, and then customer
projects are converted into long-term contracts. It’s an extended
sales cycle reflecting the blue chip, risk adverse nature of
customers served, and their requirement for clear proof of safety
and capabilities, as well as environmental and cost benefits.
We currently have about a half dozen Onsite projects where we
are working under a longer term arrangement, and about a half
dozen in the pipeline that, by their nature, have the potential to
successfully demonstrate the cost savings and environmental
benefits that would justify long-term contracts.
Newalta8

CREATE VALUEWhile its capabilities take time to prove out,
Onsite is gaining momentum with a backlog
of opportunities in all markets, and we’re only
scratching the surface of the potential for
these services.
In 2010, Onsite grew again as it:
• Increasedrevenue16percentover2009
• Improvedprofitabilitywitha41percent
year-over-year increase in net margin, surpassing
our previous record
• Deliveredstrongperformanceasaresultofincreased
demand for drill site services, higher onsite project
activity and stronger crude oil prices
• Benefittedfrom$52.2millioningrowthinvestments
made in the 2008-2009 period
� Western Facilities 47%
� Eastern Facilities 22%
� Ville Ste. Catherine 31%
Facilities Business Units -2010 Revenue
Onsite Business Units -2010 Revenue
� Western Onsite 39%
� Eastern Onsite 26%
� Heavy Oil 35%
Revenue ($ millions)
2010 20092008 2010 20092008
2010 20092008
2010 20092008
Adjusted EBITDA(1)
($ millions)
Facilities Revenue($ millions)
20092008 2010
2010 2009200820092008 2010
Facilities Net Margin(1)
($ millions)
Onsite Revenue($ millions)
Onsite Net Margin(1)
($ millions)
Funds from Operations(1)
($ millions)
0
90
180
270
360
450
0
20
40
80
120
100
60
0
50
100
150
200
0
10
20
30
40
0
100
200
300
400
500
600
0
30
60
90
120
150
0
20
40
60
80
100
aR20109

PrESIDENt’S MESSaGE tO SHarEHOlDErS
Alan P. Cadotte
president and
Chief executive officer
Newalta delivered a 50 percent return to our shareholders in 2010, bringing total returns to 100
percent since we converted to a corporation from an income trust just two years ago. With resurgent
customer activity creating renewed demand for our solutions, higher recovered product prices and
2010 growth capital investments in place, we expect strong bottom-line growth which will drive
excellent returns for our shareholders in 2011.
Fellow Shareholders:
Newalta had a much better year in 2010 compared to the severe
contraction that we experienced in 2009. Compared to last year,
revenue increased $93 million, or 19 percent, adjusted EBItDa
climbed $37 million, or 45 percent, and funds from operations
increased 56 percent.
Strong funds from operations supported a 30 percent dividend
increase and $76 million in capital investments.
Both divisions contributed by adding new customers, better serving
existing customers as demand grew, and continuing to improve
productivity and profitability.
Facilities Division revenue and net margin increased 20 and 43
percent, respectively, as we took advantage of the early-stage
economic recovery. Onsite Division delivered strong performance,
with revenue and net margin up 16 and 41 percent.
Cost savings initiatives and productivity improvements made in
2009, and held in 2010, also contributed to strong bottom-line
performance. From mid 2008 until the end of 2009, we invested
roughly $87 million in growth capital, which contributed to EBItDa
growth in 2010.
return on capital improved to 13 percent from nine percent in 2009.
Even though this is a significant improvement, we expect 2011 return
on capital to move closer to our historical average of 18 percent.
We also significantly improved our financial flexibility. We issued
$125 million in unsecured seven year debentures and amended our
credit facility, extending the maturity to 2013. the total Secured and
unsecured Debt to adjusted EBItDa ratio continues to improve and
was 2.65 at year end.
Of the many initiatives underway to grow our business, one of the
most exciting is the work of our technical Development team. Its
mandate is to search the world for new methods to increase the
scope of wastes that we process and the products that we recover.
this team has identified and is evaluating more than 500
technologies. In 2011, we expect to do pilot scale testing on those
with the best potential to cost-effectively solve our customers’ Newalta10
FORWARD
environmental challenges. Few companies of our size have the
capabilities, expertise and capacity to stage this type of development
effort. We believe it will lead to impressive gains for Newalta as we
continue to transform our industry in the years ahead.
We also delivered excellent performance in safety. Our Sustainability
report contains details on all aspects of our safety record, yet this
point stands above all others: total reportable injury frequency was
reduced to 2.2 from 2.6 in 2009.
We recover so much value across so many waste streams that
we achieved net-negative CO2 emissions from our key processes in
2010 - a remarkable accomplishment given the size and scope of
our operations.
We are proud of 2010 accomplishments and our 17-year track
record of profitable growth. Newalta is now about 60 times larger
than we were in 1993 based on revenue, cash flow and assets.
We’re also much stronger as a result of recruitment and training
investments to drive the constant advancement of our business.
the initiatives taken to strengthen our organization last year,
including recruiting new talent and training programs, will enable us
to be a stronger and better organization than ever before and fully
prepared for the challenges ahead.
In just five years, we’ve transformed our company from 900 people
in western Canada with 80 percent of our revenue coming from the
oil and gas industry, to a national business with 2,000 people and
more than half our revenue generated outside the energy industry.
at the same time, our revenue has more than doubled. this growth
illustrates that our proven methods of waste recovery are gaining
traction with our national and multinational customers. We are also
more diversified, adding stability to our performance.
Newalta is a forward-looking growth company and will prove it again
based on the very positive outlook for our business in 2011.
Our markets are stronger and the prices of our recovered products
are higher than in 2010. the $62 million in growth capital
investments committed in 2010 will make a significant contribution
to 2011 performance. We have a healthy balance sheet and good
financial flexibility.
In 2011, we will invest $100 million to drive growth in 2012.
Maintenance capital expenditures will be approximately $27 million.
Growth capital expenditures of $73 million will be directed towards a
broad range of low-risk, high return, exciting investment opportunities.
In 2011, we will focus on revitalizing our organization to improve our
agility and cohesion and to strengthen our customer relationships
to prepare us for strong growth in the years ahead.
I am very proud of our organization for all the work that they do
and their commitment to excellence in all aspects of our business.
I thank our Board of Directors for sharing their knowledge and
business judgement.
Most especially, I thank our customers and shareholders for the
confidence they have shown.
ron Sifton retired in 2010 after 27 years with Newalta. ron’s
contributions in acquisitions, finance, It, investor communications
and investment banking were fundamental to the company we
are today.
In 2010, we delivered a 50 percent return to shareholders.
We remain well positioned to deliver very attractive returns in 2011
as we continue to build on our performance record.
yours sincerely,
alan P. Cadotte
President and Chief Executive Officer
Newalta is a forward-looking
growth company and will
prove it again based on the
very positive outlook for our
business in 2011.
aR201011

LeadershipAlan P. Cadotte
president and
Chief executive officer
Michael A. Borys Senior Vice president and
Chief Financial officer
J. Craig Wilkie executive Vice president
Peter A. Dugandzic executive Vice president
NEWalta OFFICErS
Newalta12

LeadershipTerry P. Donaleshen Senior Vice president,
organization Development
Doug Pecharsky Senior Vice president,
onsite operations
Took Whiteley Senior Vice president,
Business Development and
General Counsel
Jim McClimans Vice president,
Finance
Harry Wells Vice president,
technical Development
aR201013

MaNaGEMENt’S DISCuSSION aND aNalySIS
MD+AThree months and year ended December 31, 2010 and 2009
Certain statements contained in this document constitute “forward-looking statements”. When used in this document, the words “may”,
“would”, “could”, “will”, “intend”, “plan”, “anticipate”, “believe”, “estimate”, “expect” and similar expressions, as they relate to Newalta
Corporation and the subsidiaries of Newalta Corporation, or their management, are intended to identify forward-looking statements.
In particular, forward-looking statements included or incorporated by reference in this document include statements with respect to:
• futureoperatingandfinancialresults;
• anticipatedindustryactivitylevels;
• expecteddemandforourservices;
• businessprospectsandstrategy;
• capitalexpenditureprogramsandotherexpenditures;
• theamountofdividendsdeclaredorpayableinthefuture;
• realizationofanticipatedbenefitsofacquisitions,growthcapitalinvestmentsandourtechnicaldevelopmentinitiatives;
• ourprojectedcoststructure;and
• expectationsandimplicationsofchangesinlegislation.
Such statements reflect our current views with respect to future events and are subject to certain risks, uncertainties and assumptions, including, without limitation:
• generalmarketconditionsoftheindustriesweservice;
• strengthoftheoilandgasindustry,includingdrillingactivity;
• fluctuationsincommoditypricesforoilandlead;
• fluctuationsininterestratesandexchangerates;
• supplyofwasteleadacidbatteriesasfeedstocktosupportdirectleadsales;
• demandforourfinishedleadproductsbythebatterymanufacturingindustry;
• ourabilitytosecurefuturecapitaltosupportanddevelopourbusiness,includingtheissuanceofadditionalcommonshares;
• dependenceonourseniormanagementteamandotheroperationsmanagementpersonnelwithwasteindustryexperience;
• theseasonalnatureofouroperations;
• successofourgrowth,acquisitionandtechnicaldevelopmentstrategiesincludingintegrationofbusinessesandprocessesintoouroperationsandpotentialliabilitiesfromacquisitions;
• thehighlyregulatednatureofthewastemanagementandenvironmentalservicesbusinessinwhichweoperate;
• costsassociatedwithoperatingourlandfillsandrelianceonthirdpartywastevolumes;
• thecompetitiveenvironmentofourindustryinCanadaandtheU.S.;
• riskofpendingandfuturelegalproceedings;
• ourabilitytoattractandretainskilledemployeesandmaintainpositivelabourunionrelationships;
• fluctuationsinthecostsandavailabilityoffuelforouroperations;
• openaccessfornewindustryentrantsandthegeneralunprotectednatureoftechnologyusedinthewasteindustry;
• obtaininginsuranceforvariouspotentialrisksandhazardsonreasonablefinancialterms;
Newalta14
• possiblevolatilityofthepriceof,andthemarketfor,ourcommonshares;
• thenatureof,andmarketfor,ourdebentures;and
• suchotherrisksorfactorsdescribedfromtimetotimeinreportswefilewithsecuritiesregulatoryauthorities.
By their nature, forward-looking statements involve numerous assumptions, known and unknown risks and uncertainties, both general and specific, that contribute to the possibility
that the predictions, forecasts, projections and other forward-looking statements will not occur. Many other factors could also cause actual results, performance or achievements to
be materially different from any future results, performance or achievements that may be expressed or implied by such forward-looking statements and readers are cautioned that the
foregoing list of factors is not exhaustive. Should one or more of these risks or uncertainties materialize, or should assumptions underlying the forward-looking statements prove incorrect,
actual results may vary materially from those described herein as intended, planned, anticipated, believed, estimated or expected. Furthermore, the forward-looking statements contained
in this document are made as of the date of this document and the forward-looking statements in this document are expressly qualified by this cautionary statement.
unless otherwise required by law, we do not intend, or assume any obligation, to update these forward-looking statements.
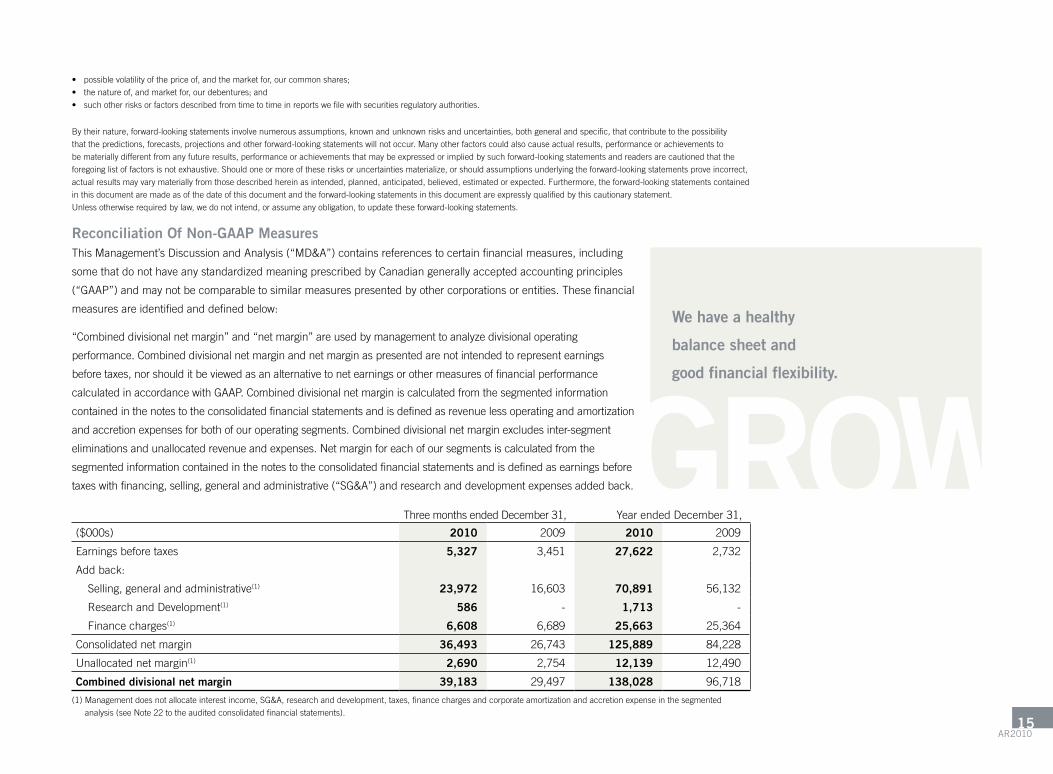
Reconciliation Of Non-GAAP Measuresthis Management’s Discussion and analysis (“MD&a”) contains references to certain financial measures, including
some that do not have any standardized meaning prescribed by Canadian generally accepted accounting principles
(“GaaP”) and may not be comparable to similar measures presented by other corporations or entities. these financial
measures are identified and defined below:
“Combined divisional net margin” and “net margin” are used by management to analyze divisional operating
performance. Combined divisional net margin and net margin as presented are not intended to represent earnings
before taxes, nor should it be viewed as an alternative to net earnings or other measures of financial performance
calculated in accordance with GaaP. Combined divisional net margin is calculated from the segmented information
contained in the notes to the consolidated financial statements and is defined as revenue less operating and amortization
and accretion expenses for both of our operating segments. Combined divisional net margin excludes inter-segment
eliminations and unallocated revenue and expenses. Net margin for each of our segments is calculated from the
segmented information contained in the notes to the consolidated financial statements and is defined as earnings before
taxes with financing, selling, general and administrative (“SG&a”) and research and development expenses added back.
three months ended December 31, year ended December 31,
($000s) 2010 2009 2010 2009
Earnings before taxes 5,327 3,451 27,622 2,732
add back:
Selling, general and administrative(1) 23,972 16,603 70,891 56,132
research and Development(1) 586 - 1,713 -
Finance charges(1) 6,608 6,689 25,663 25,364
Consolidated net margin 36,493 26,743 125,889 84,228
unallocated net margin(1) 2,690 2,754 12,139 12,490
Combined divisional net margin 39,183 29,497 138,028 96,718
(1) Management does not allocate interest income, SG&a, research and development, taxes, finance charges and corporate amortization and accretion expense in the segmented
analysis (see Note 22 to the audited consolidated financial statements).
We have a healthy
balance sheet and
good financial flexibility.
GROW
aR201015
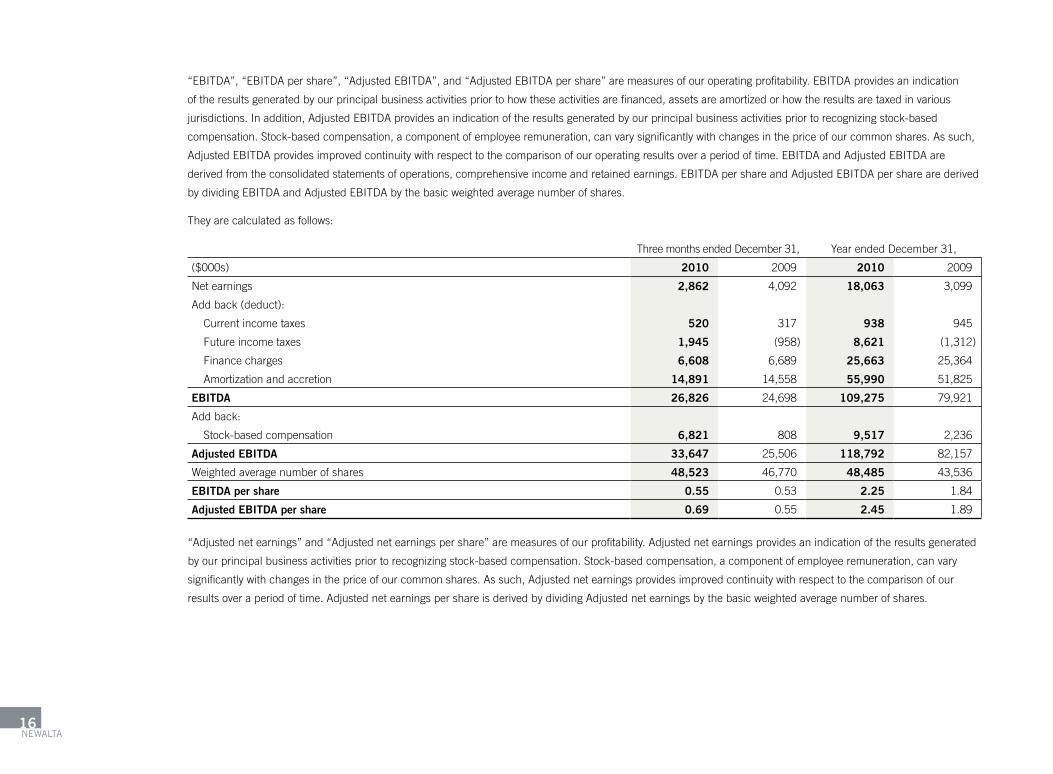
“EBItDa”, “EBItDa per share”, “adjusted EBItDa”, and “adjusted EBItDa per share” are measures of our operating profitability. EBItDa provides an indication
of the results generated by our principal business activities prior to how these activities are financed, assets are amortized or how the results are taxed in various
jurisdictions. In addition, adjusted EBItDa provides an indication of the results generated by our principal business activities prior to recognizing stock-based
compensation. Stock-based compensation, a component of employee remuneration, can vary significantly with changes in the price of our common shares. as such,
adjusted EBItDa provides improved continuity with respect to the comparison of our operating results over a period of time. EBItDa and adjusted EBItDa are
derived from the consolidated statements of operations, comprehensive income and retained earnings. EBItDa per share and adjusted EBItDa per share are derived
by dividing EBItDa and adjusted EBItDa by the basic weighted average number of shares.
they are calculated as follows:
three months ended December 31, year ended December 31,
($000s) 2010 2009 2010 2009
Net earnings 2,862 4,092 18,063 3,099
add back (deduct):
Current income taxes 520 317 938 945
Future income taxes 1,945 (958) 8,621 (1,312)
Finance charges 6,608 6,689 25,663 25,364
amortization and accretion 14,891 14,558 55,990 51,825
EBITDA 26,826 24,698 109,275 79,921
add back:
Stock-based compensation 6,821 808 9,517 2,236
Adjusted EBITDA 33,647 25,506 118,792 82,157
Weighted average number of shares 48,523 46,770 48,485 43,536
EBITDA per share 0.55 0.53 2.25 1.84
Adjusted EBITDA per share 0.69 0.55 2.45 1.89
“adjusted net earnings” and “adjusted net earnings per share” are measures of our profitability. adjusted net earnings provides an indication of the results generated
by our principal business activities prior to recognizing stock-based compensation. Stock-based compensation, a component of employee remuneration, can vary
significantly with changes in the price of our common shares. as such, adjusted net earnings provides improved continuity with respect to the comparison of our
results over a period of time. adjusted net earnings per share is derived by dividing adjusted net earnings by the basic weighted average number of shares.
Newalta16

three months ended December 31, year ended December 31,
($000s) 2010 2009 2010 2009
Net earnings 2,862 4,092 18,063 3,099
add back (deduct):
Stock-based compensation 6,821 808 9,517 2,236
Adjusted net earnings 9,683 4,900 27,580 5,335
Adjusted net earnings per share 0.20 0.10 0.57 0.12
“Funds from operations” is used to assist management and investors in analyzing cash flow and leverage. Funds from operations as presented is not intended to
represent operating funds from operations or operating profits for the period, nor should it be viewed as an alternative to cash flow from operating activities, net
earnings or other measures of financial performance calculated in accordance with GaaP. Funds from operations is derived from the consolidated statements of
cash flows and is calculated as follows:
three months ended December 31, year ended December 31,
($000s) 2010 2009 2010 2009
Cash from operations 48,007 19,165 95,348 83,518
add back (deduct):
Changes in non-cash working capital (21,760) (298) (2,383) (23,599)
asset retirement costs incurred 1,126 318 2,184 1,024
Funds from operations 27,373 19,185 95,149 60,943
Weighted average number of shares 48,523 46,770 48,485 43,536
Funds from operations per share 0.56 0.41 1.96 1.40
“return on capital” is used to assist management and investors in measuring the returns realized from the capital employed.
year ended December 31,
($000s) 2010 2009 2008
adjusted EBItDa 118,792 82,157 125,890
total assets 1,028,724 993,730 1,051,910
Current liabilities (121,370) (92,614) (117,258)
Capital Employed 907,354 901,116 934,652
2-year Net assets average 904,235 917,884 921,331
Return on Capital (%) 13.1 9.0 13.7
references to Combined divisional net margin, net margin, EBItDa, EBItDa per share, adjusted EBItDa, adjusted EBItDa per share, Funds from operations and
return on Capital throughout this document have the meanings set out above.aR2010
17

On December 31, 2009, the sole unitholder of Newalta Income Fund (the “Fund”) approved the wind-up of the Fund. Subsequent to year end, on January 1, 2010,
Newalta Inc. was amalgamated with its wholly-owned operating subsidiary, Newalta Corporation, to form Newalta Corporation.
the following discussion and analysis should be read in conjunction with (i) the consolidated financial statements of Newalta, and the notes thereto for the year
ended December 31, 2010, (ii) the consolidated financial statements of Newalta and notes thereto and MD&a of Newalta for the year ended December 31, 2009,
(iii) the most recently filed annual Information Form of Newalta and (iv) the consolidated interim financial statements of Newalta and the notes thereto, and MD&a
for the quarters ended March 31, 2010, June 30, 2010 and September 30, 2010. this information is available at SEDar (www.sedar.com). Information for the year
ended December 31, 2010, along with comparative information for 2009, is provided.
this MD&a is dated March 3, 2011, and takes into consideration information available up to that date. throughout this document, unless otherwise stated, all
currency is stated in Canadian dollars, Mt is defined as “tonnes” or “metric tons”.
Financial Results and Highlights($000s except per share data) 2010 2009 2008
revenue 576,196 483,401 597,035
Net earnings 18,063 3,099 58,882
- per share ($) – basic 0.37 0.07 1.40
- per share ($) – basic adjusted 0.57 0.12 1.46
- per share ($) – diluted 0.37 0.07 1.40
EBItDa 109,275 79,921 125,753
- per share ($) 2.25 1.84 3.00
adjusted EBItDa 118,792 82,157 125,890
- per share ($) 2.45 1.89 3.00
Cash from operations 95,348 83,518 128,922
- per share ($) 1.97 1.92 3.07
Funds from operations 95,149 60,943 98,306
- per share ($) 1.96 1.40 2.34
total assets 1,028,724 993,730 1,051,910
Maintenance capital expenditures 28,668 8,589 20,762
Growth capital expenditures 47,077 18,696 104,440
Senior long-term debt – net of issue costs 51,689 188,123 263,251
Senior unsecured debentures – principal amount 125,000 - -
Convertible debentures – principal amount 115,000 115,000 115,000
Dividends/Distributions declared 11,152 8,141 93,180
- per share ($) 0.23 0.20 2.22
(1) these financial measures do not have any standardized meaning prescribed by Canadian generally accepted accounting principles (“GaaP”), and are therefore unlikely to be comparable to similar measures presented
by other issuers. Non-GaaP financial measures are identified and defined throughout the attached MD&a.Newalta18

NEWALTAWe provide cost-effective environmentally superior solutions to our customers’ complex environmental needs. We leverage our existing talent and asset base to provide
cost-effective solutions which reduce environmental impacts through recycling, recovery and reuse. these services are provided both through our network of more
than 80 facilities across Canada and at our customers’ facilities where we mobilize our equipment and people to process material directly onsite. Our customers
operate in a broad range of industries including the oil and gas, petrochemical, refining, lead, manufacturing and mining industries. Newalta has delivered strong,
profitable growth for over 15 years and has established a leadership position in the industry with talented people, efficient and safe operations, innovative approaches
and high ethical standards.
Our StrategyIn connection with the ongoing development of our strategy, the following are our principal strategic objectives, as well as the key underlying risks related thereto.
Strategic objectives Initiatives
1. Maximize Facilities Profitability • Drive higher returns on existing assets
• Execute organic growth capital projects
• Expand Facilities service offering
2. Recovery at Source • Increase market share in short-term projects nationally
• Identify short-term projects with long-term potential
• transition to long-term contract service arrangements
3. Process Commercialization • Evaluate technologies for commercial application
• advance identified technologies to the development and demonstration phase
• utilize facility network to expedite commercialization
Several initiatives were successfully completed in 2010 to establish the foundation for continued growth. In addition to enhancing our capital structure to ensure
sufficient financial flexibility to meet future growth needs, we:
• Respondedtorecoveringmarketsdrivingimprovedreturnsonexistingassetsof13%upfrom9%in2009;
• Completeda$47milliongrowthcapitalprogram;
• CreatedtheorganizationalframeworkforOnsite’snationalservice;
• ExecutedonsiteprojectsineasternCanada,whilealsobuildingourcustomerbaseinwesternCanada;
• ExpandedHeavyOilonsiteserviceatexistingshort-termandlong-termcontracts;and
• EstablishedtheTechnicalDevelopmentteam.
aR201019
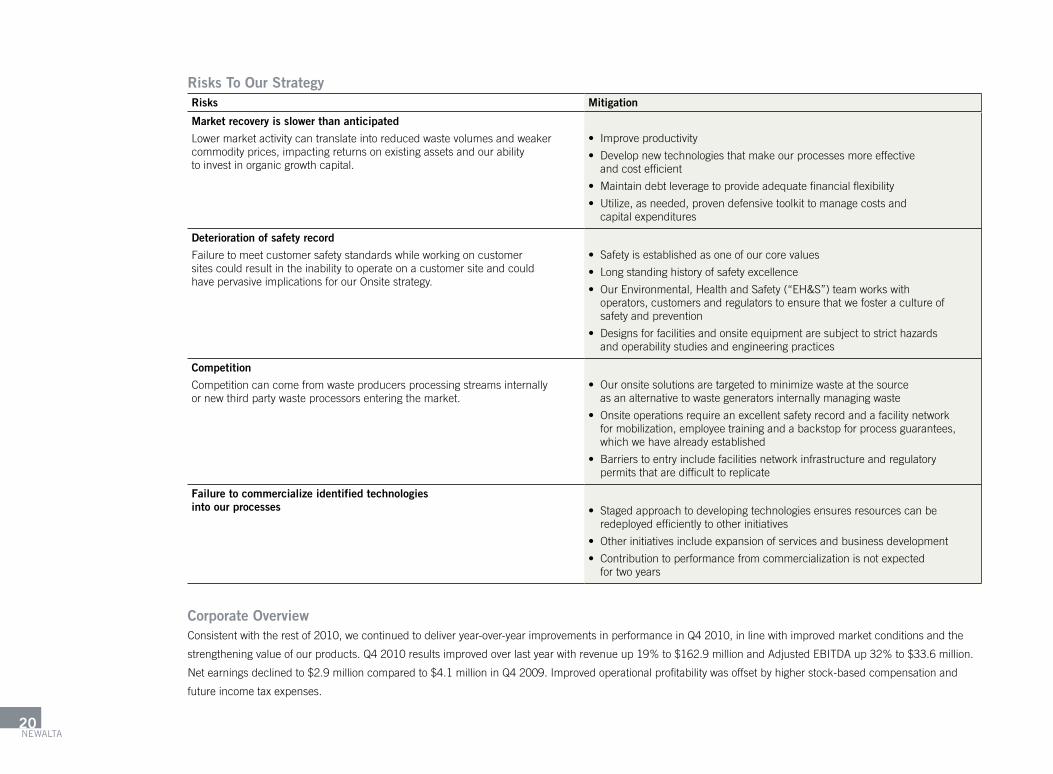
Risks To Our StrategyRisks Mitigation
Market recovery is slower than anticipated
lower market activity can translate into reduced waste volumes and weaker commodity prices, impacting returns on existing assets and our ability to invest in organic growth capital.
• Improve productivity
• Develop new technologies that make our processes more effective and cost efficient
• Maintain debt leverage to provide adequate financial flexibility
• utilize, as needed, proven defensive toolkit to manage costs and capital expenditures
Deterioration of safety record
Failure to meet customer safety standards while working on customer sites could result in the inability to operate on a customer site and could have pervasive implications for our Onsite strategy.
• Safety is established as one of our core values
• long standing history of safety excellence
• Our Environmental, Health and Safety (“EH&S”) team works with operators, customers and regulators to ensure that we foster a culture of safety and prevention
• Designs for facilities and onsite equipment are subject to strict hazards and operability studies and engineering practices
Competition
Competition can come from waste producers processing streams internally or new third party waste processors entering the market.
• Our onsite solutions are targeted to minimize waste at the source as an alternative to waste generators internally managing waste
• Onsite operations require an excellent safety record and a facility network for mobilization, employee training and a backstop for process guarantees, which we have already established
• Barriers to entry include facilities network infrastructure and regulatory permits that are difficult to replicate
Failure to commercialize identified technologies into our processes • Staged approach to developing technologies ensures resources can be
redeployed efficiently to other initiatives
• Other initiatives include expansion of services and business development
• Contribution to performance from commercialization is not expected for two years
Corporate OverviewConsistent with the rest of 2010, we continued to deliver year-over-year improvements in performance in Q4 2010, in line with improved market conditions and the
strengtheningvalueofourproducts.Q42010resultsimprovedoverlastyearwithrevenueup19%to$162.9millionandAdjustedEBITDAup32%to$33.6million.
Net earnings declined to $2.9 million compared to $4.1 million in Q4 2009. Improved operational profitability was offset by higher stock-based compensation and
future income tax expenses.
Newalta20
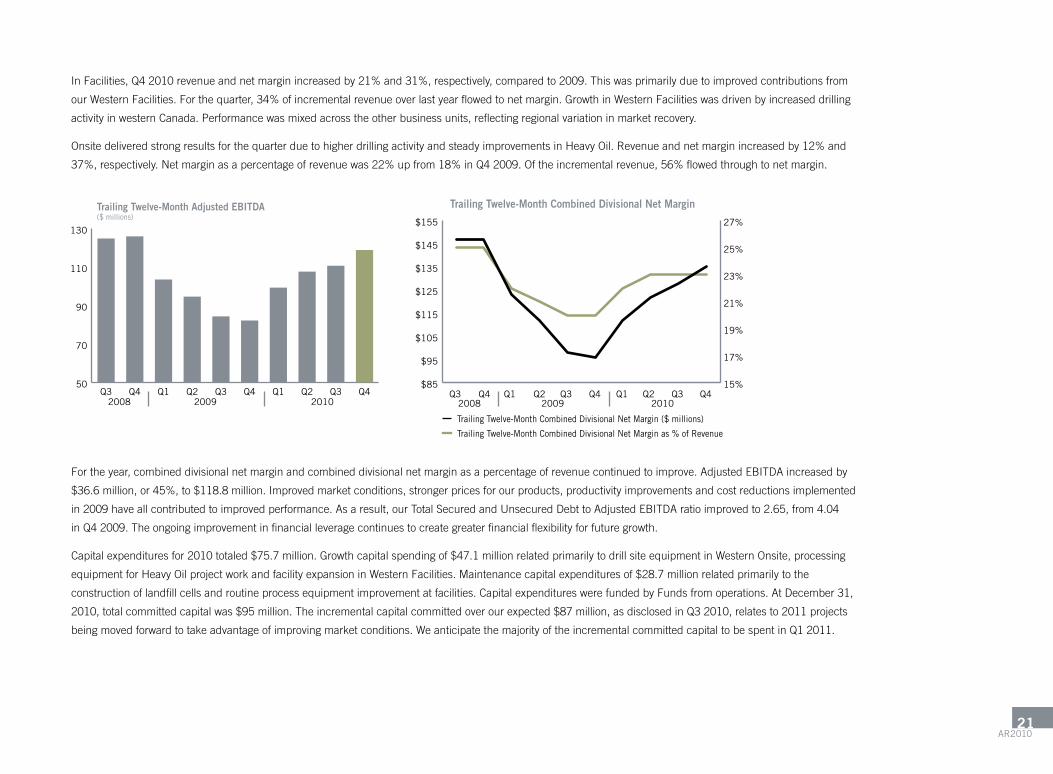
InFacilities,Q42010revenueandnetmarginincreasedby21%and31%,respectively,comparedto2009.Thiswasprimarilyduetoimprovedcontributionsfrom
ourWesternFacilities.Forthequarter,34%ofincrementalrevenueoverlastyearflowedtonetmargin.GrowthinWesternFacilitieswasdrivenbyincreaseddrilling
activity in western Canada. Performance was mixed across the other business units, reflecting regional variation in market recovery.
OnsitedeliveredstrongresultsforthequarterduetohigherdrillingactivityandsteadyimprovementsinHeavyOil.Revenueandnetmarginincreasedby12%and
37%,respectively.Netmarginasapercentageofrevenuewas22%upfrom18%inQ42009.Oftheincrementalrevenue,56%flowedthroughtonetmargin.
Trailing Twelve-Month Combined Divisional Net Margin
2009 20102008
Trailing Twelve-Month Combined Divisional Net Margin ($ millions)
Trailing Twelve-Month Combined Divisional Net Margin as % of Revenue
15%
17%
19%
21%
23%
25%
27%
$85
$95
$105
$115
$125
$135
$145
$155
Q3 Q4 Q1 Q2 Q3 Q4 Q1 Q2 Q3 Q450
70
90
110
130
Q4Q3Q2Q1Q4Q3Q2Q1Q4Q3
Trailing Twelve-Month Adjusted EBITDA($ millions)
2008 2009 2010
For the year, combined divisional net margin and combined divisional net margin as a percentage of revenue continued to improve. adjusted EBItDa increased by
$36.6million,or45%,to$118.8million.Improvedmarketconditions,strongerpricesforourproducts,productivityimprovementsandcostreductionsimplemented
in 2009 have all contributed to improved performance. as a result, our total Secured and unsecured Debt to adjusted EBItDa ratio improved to 2.65, from 4.04
in Q4 2009. the ongoing improvement in financial leverage continues to create greater financial flexibility for future growth.
Capital expenditures for 2010 totaled $75.7 million. Growth capital spending of $47.1 million related primarily to drill site equipment in Western Onsite, processing
equipment for Heavy Oil project work and facility expansion in Western Facilities. Maintenance capital expenditures of $28.7 million related primarily to the
construction of landfill cells and routine process equipment improvement at facilities. Capital expenditures were funded by Funds from operations. at December 31,
2010, total committed capital was $95 million. the incremental capital committed over our expected $87 million, as disclosed in Q3 2010, relates to 2011 projects
being moved forward to take advantage of improving market conditions. We anticipate the majority of the incremental committed capital to be spent in Q1 2011.
aR201021

OnNovember23,2010,weissued$125millionSeniorUnsecuredDebentureswithaseven-yearterm,bearinginterestattherateof7.625%perannum.Proceeds
from the offering were used to repay outstanding debt on our credit facility. In connection with this offering, effective December 17, 2010, we amended our credit
facility to a three-year maturity ending December 17, 2013, with annual extensions available at Newalta’s option. as a result of the successful senior unsecured
debenture offering and current cash forecast needs, we elected to reduce the amount available under the credit facility from $350 million to $200 million. these
initiatives will strengthen our balance sheet, achieve better alignment with our long-term assets and provide increased financial flexibility to meet the demands of
future growth.
Revenue($ millions)
Adjusted EBITDA($ millions)
Q4Q3Q2Q10
5
10
15
20
25
30
35
40
Q4Q3Q2Q10
25
50
75
100
125
150
175
� 2008 � 2009 � 2010 � 2008 � 2009 � 2010
During the first half of 2010, we launched our technical Development team. We enter 2011 with a group of 15 professionals comprised of engineers, chemists
and business analysts leading our technical development initiatives with an operating budget of $3 million and $5 million of budgeted capital expenditures. Capital
expenditures are anticipated to include the purchase of equipment and licenses to use technologies. In 2011, we will move into the next phase of testing and
assessing the most promising opportunities while continuing the global search for technologies that started in 2010. We anticipate our investments in technical
development will start contributing to our performance in approximately two years.
OutlookIn Q1 2011, we expect improved results compared to both the prior year and Q4 2010. Crude oil and lead prices for Q1 are trending higher than Q4 2010 and our
key markets continue to strengthen. Oil and gas drilling activity is expected to continue to strengthen with the average Q1 2011 rig count in western Canada forecast
to be up over Q4 2010 levels. We anticipate volumes at VSC will be approximately 17,000 Mt. SCl volumes are anticipated to be approximately 150,000 Mt. In
Onsite, we expect continued gains from the increased demand for drill site equipment in the u.S. Overall, we expect continued year-over-year growth in the quarters
ahead as our markets strengthen and we realize returns from our 2010 growth investments.
Newalta22

Capital expenditures in 2011 are budgeted at $100 million. Growth capital expenditures of $73 million are comprised of $26 million for Facilities, $35 million for
Onsite, $5 million for technical Development and $7 million for corporate investments. Maintenance capital expenditures are expected to be $27 million. Capital
expenditureswillbefundedbyFundsfromoperations,withapproximately40%expectedtobespentinthefirsthalfof2011.
We enter 2011 with more robust markets which will drive improved performance. We expect return on capital to continue to climb toward our historical average of
18%.Weareconfidentthatwewilldeliverattractivereturnstoourshareholdersinthequartersahead.
Results Of Operations – Facilities DivisionOverview
Facilities includes an integrated network of more than 55 facilities located to service key market areas across Canada employing over 900 people. this division
features Canada’s largest lead-acid battery recycling facility, located in Ville Ste-Catherine, Québec (“VSC”), an engineered non-hazardous solid waste landfill located
in Stoney Creek, Ontario (“SCl”), and over 25 oilfield facilities throughout western Canada. Facilities is organized into the Western Facilities, Eastern Facilities and
VSC business units.
the business units contributed the following to division revenue:
three months ended December 31, year ended December 31,
2010 2009 2010 2009
Western Facilities 45% 39% 47% 46%
Eastern Facilities 21% 23% 22% 23%
VSC 34% 38% 31% 31%
Facilities Revenue($ millions)
Facilities Net Margin($ millions)
0
20
40
60
80
100
120
0
5
10
15
20
25
30
35
40
Q3Q2Q1 Q4Q3Q2Q1 Q4
� 2008 � 2009 � 2010 � 2008 � 2009 � 2010
aR201023

the following table compares Facilities’ results for the periods indicated:
three months ended December 31, year ended December 31,
($000s) 2010 2009 %change 2010 2009 %change
revenue(1) 115,193 94,932 21 394,539 327,484 20
Operating costs 77,843 65,039 20 265,153 230,845 15
amortization and accretion 8,827 8,161 8 30,813 27,919 10
Net margin 28,523 21,732 31 98,573 68,720 43
Netmarginas%ofrevenue 25% 23% 9 25% 21% 19
Maintenance capital 6,882 2,479 178 21,791 6,240 249
Growth capital 7,237 1,676 332 11,700 7,860 49
assets employed(2) 569,950 561,315 2
(1) Includes $104,000 and $589,000 in internal revenue in Q4 2010 and 2010 year-to-date, respectively, and $295,000 and $1,203,000 in Q4 2009 and 2009 year-to-date, respectively.
(2) “assets employed” is provided to assist management and investors in determining the effectiveness of the use of the assets at a divisional level. assets employed is the sum of capital assets, intangible assets and
goodwill allocated to each division.
throughout 2010, performance for the trailing twelve months from the Facilities division
improved steadily.
ComparedtoQ42009,revenueandnetmargingrewby21%and31%,respectively,due
primarily to contributions from our Western Facilities. Performance was consistent with
improved oil and gas industry activity and stronger prices for our recovered products.
Forthequarter,34%ofincrementalrevenueoverlastyearflowedtonetmargin.Increased
drilling activity in western Canada significantly improved volume receipts for Western
Facilities. Performance was mixed across the other business units. Compared to Q4 2009,
volumes at SCl increased due to higher event-based business while performance at VSC
was impacted by higher lead procurement costs. However, VSC performance improved
compared to Q3 2010 in line with strengthening market conditions.
Revenueandnetmarginfortheyearincreasedby20%and43%,respectively.Activity
levels were up across all business units, highlighted by stronger drilling activity, higher
event-based business at SCl and increased volumes at VSC. the impact of commodity
prices for 2010 compared to 2009 was insignificant on annual Facilities performance.
Facilities Trailing Twelve-Month
Trailing Twelve-Month Net Margin ($ millions)
Trailing Twelve-Month Net Margin as % of Revenue
15%
17%
19%
21%
23%
25%
27%
29%
$40
$50
$60
$70
$80
$90
$100
$110
$120
2009 20102008Q3 Q4 Q1 Q2 Q3 Q4 Q1 Q2 Q3 Q4
Newalta24

Western Facilities
Western Facilities are located in British Columbia, alberta and Saskatchewan and generate revenue from:
• theprocessingofindustrialandoilfield-generatedwastes,includingcollection,treatment,waterdisposal,cleanoilterminalling,customtreatingandlandfilling;
• saleofrecoveredcrudeoilforouraccount;and
• oilrecycling,includingthecollectionandprocessingofwastelubeoilsandthesaleoffinishedproducts.
Western Facilities draws its revenue primarily from industrial waste generators and the oil and gas industry. Waste generated by the oil and gas industry is affected by
volatility in the price of crude oil and natural gas and drilling activity. Drilling activity will impact the volume of waste received and the makeup of that waste. Changes
inthewastemixwillimpacttheamountofcrudeoilrecoveredtoouraccount.Historically,foroilfieldfacilities,approximately75%ofourwastevolumerelatesto
ongoing production resulting in a fairly stable revenue base. Volatility in the price of crude oil impacts crude oil revenue. Fluctuations in the Canadian/u.S. dollar
exchangerateimpactU.S.dollarsales,whichaccountforapproximately15%ofWesternFacilitiesrevenue.ChangesinenvironmentalregulationsinwesternCanada
also impact our business. there is no new legislation proposed that is expected to have a material impact on our business and, regardless, we tend to have a positive
bias to change in environmental regulations.
WesternFacilitiesQ42010revenueincreasedby42%comparedtoQ42009largelyduetoincreaseddrillingactivity.Wellsandmetresdrilledincreasedby59%
and45%,respectively,comparedtoQ42009.Asaresult,wasteprocessingandrecoveredcrudeoilvolumesincreasedby65%and45%,respectively.Crudeoil
recovered as a percentage of the waste processing volumes decreased due to a change in the waste mix. Substantially all of the increase in revenue was attributable
to higher oil and gas activity.
Revenuefortheyearincreasedby24%comparedto2009duetohigherdrillingactivitycombinedwithhighercrudeoilpricesandcrudeoilrecoveryvolumes.
three months ended December 31, year ended December 31,
2010 2009 %change 2010 2009 %change
Waste processing volumes (‘000 m3) 152 92 65 486 310 57
recovered crude oil (‘000 bbl)(1) 61 42 45 223 190 17
average crude oil price received (CDN$/bbl) 76.27 71.69 6 73.48 59.61 23
recovered crude oil sales ($ millions) 4.6 3.0 53 16.4 11.3 45
Edmonton par price (CDN$/bbl)(2) 80.21 75.92 6 77.34 65.70 18
(1) represents the total crude oil recovered and sold for our account.
(2) Edmonton par is an industry benchmark for conventional crude oil.
aR201025

Waste Processing Volumes - Western Facilities(’000m3)
Recovered Crude - Western Facilities
2008Q2 Q3 Q4 Q1
2009Q2 Q3 Q4 Q1
2010Q2 Q3 Q4Q1
2008Q1 Q2 Q3 Q4
2009Q1 Q2 Q3 Q4
2010Q1 Q2 Q3 Q4
0
20
40
60
80
100
120
140
160
�� Recovered crude oil (’000 bbl)
Average crude oil price received (CDN$/bbl)
0
10
20
30
40
50
60
70
$0
$20
$40
$60
$80
$100
$120
Eastern Facilities
Eastern Facilities is comprised of facilities in Ontario, Québec and atlantic Canada and includes an engineered non-hazardous solid waste landfill located in Stoney
Creek, Ontario. Eastern revenue is primarily derived from:
• theprocessingofindustrialwastes,includingcollection,treatment,anddisposal;and
• SCL,anengineerednon-hazardoussolidwastelandfillwithanannualpermittedcapacityof750,000MTofwasteperyear.
Eastern Facilities draws its revenue from the following industries in eastern Canada and the bordering u.S. states: automotive, construction, forestry, manufacturing,
mining,oilandgas,petrochemical,pulpandpaper,refining,steel,andtransportationservice.Thebroadcustomerandindustrybasehelpstodiversifyrisk;however,
the state of the economy as a whole will affect these industries. In addition, Eastern Facilities is sensitive to changing environmental regulations regarding waste
treatment and disposal. at present, there are no environmental regulatory reviews underway that are expected to have a material effect on Newalta and, regardless,
we tend to have a positive bias to change in environmental regulations.
InQ42010,thegeneralstateoftheeconomyineasternCanadashowedpositivesignsofrecovery.Revenuegrewby6%inQ42010comparedtolastyear,dueto
improvedevent-basedactivityatSCL.Forthequarter,SCLvolumeswere211,000MT,up11%overQ42009.ExcludingtheimpactofSCL,theremainderofthe
business was flat year-over-year.
Fortheyear,revenueimprovedby15%duetohigherevent-basedprojectsatSCL.SCLannualvolumefor2010wasabovethethree-yearannualaverageof
600,000 Mt. We anticipate that Q1 2011 landfill volumes will be in line with the historical average of 150,000 Mt.
Newalta26
three months ended December 31, year ended December 31,
2010 2009 %change 2010 2009 %change
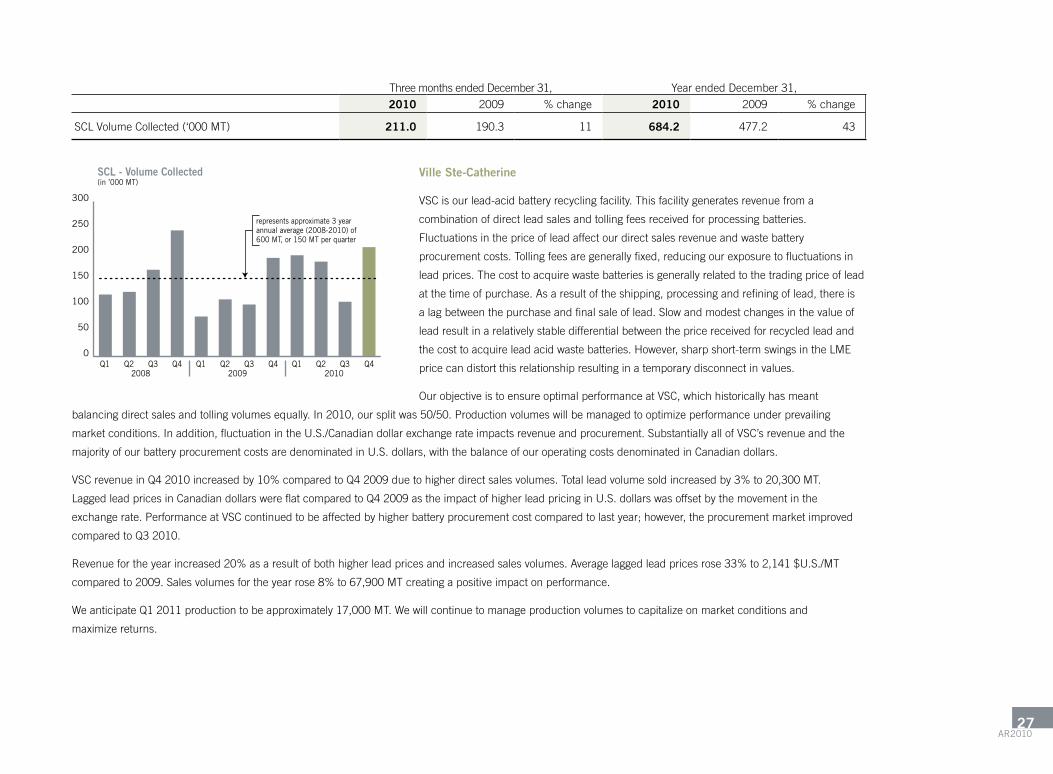
SCl Volume Collected (‘000 Mt) 211.0 190.3 11 684.2 477.2 43
Ville Ste-Catherine
VSC is our lead-acid battery recycling facility. this facility generates revenue from a
combination of direct lead sales and tolling fees received for processing batteries.
Fluctuations in the price of lead affect our direct sales revenue and waste battery
procurement costs. tolling fees are generally fixed, reducing our exposure to fluctuations in
lead prices. the cost to acquire waste batteries is generally related to the trading price of lead
at the time of purchase. as a result of the shipping, processing and refining of lead, there is
a lag between the purchase and final sale of lead. Slow and modest changes in the value of
lead result in a relatively stable differential between the price received for recycled lead and
the cost to acquire lead acid waste batteries. However, sharp short-term swings in the lME
price can distort this relationship resulting in a temporary disconnect in values.
Our objective is to ensure optimal performance at VSC, which historically has meant
balancing direct sales and tolling volumes equally. In 2010, our split was 50/50. Production volumes will be managed to optimize performance under prevailing
market conditions. In addition, fluctuation in the u.S./Canadian dollar exchange rate impacts revenue and procurement. Substantially all of VSC’s revenue and the
majority of our battery procurement costs are denominated in u.S. dollars, with the balance of our operating costs denominated in Canadian dollars.
VSCrevenueinQ42010increasedby10%comparedtoQ42009duetohigherdirectsalesvolumes.Totalleadvolumesoldincreasedby3%to20,300MT.
lagged lead prices in Canadian dollars were flat compared to Q4 2009 as the impact of higher lead pricing in u.S. dollars was offset by the movement in the
exchangerate.PerformanceatVSCcontinuedtobeaffectedbyhigherbatteryprocurementcostcomparedtolastyear;however,theprocurementmarketimproved
compared to Q3 2010.
Revenuefortheyearincreased20%asaresultofbothhigherleadpricesandincreasedsalesvolumes.Averagelaggedleadpricesrose33%to2,141$U.S./MT
comparedto2009.Salesvolumesfortheyearrose8%to67,900MTcreatingapositiveimpactonperformance.
We anticipate Q1 2011 production to be approximately 17,000 Mt. We will continue to manage production volumes to capitalize on market conditions and
maximize returns.
SCL - Volume Collected(in ’000 MT)
0
50
100
150
200
250
300
2008Q1 Q2 Q3 Q4
2009Q1 Q2 Q3 Q4
2010Q1 Q2 Q3 Q4
represents approximate 3 yearannual average (2008-2010) of600 MT, or 150 MT per quarter
aR201027

Results Of Operations – Onsite DivisionOverview
Onsite includes a network of 25 facilities with over 400 employees across Canada and the u.S. Onsite services involves the mobilization of equipment and our
people to manage industrial by-products at our customer sites. Onsite includes: the processing of oilfield-generated wastes and the sale of recovered crude oil for
ouraccount;industrialcleaning;siteremediation;dredginganddewateringanddrillsiteprocessingincludingsolidscontrolanddrillcuttingsmanagement.
Onsite includes the Western Onsite, Eastern Onsite and Heavy Oil business units.
Our Onsite business units generally follow a similar sales cycle. We establish our market position through the execution of short-term projects, or event-based projects
which lead to longer term contracts. the cycle to establish longer term contracts can be between 18 months to three years. longer term contracts are not sensitive
to commodity prices and provide a more stable cash flow. In addition, Onsite performance is affected by the customer’s requirement for Newalta to maintain a strong
safety record. to address this requirement, our EH&S team works with our people and our customers to develop an EH&S culture and prevention strategy owned by
operators to ensure we maintain our strong record.
the business units contributed the following to division revenue:
three months ended December 31, year ended December 31,
2010 2009 2010 2009
Western Onsite 44% 25% 39% 26%
Eastern Onsite 23% 40% 26% 37%
Heavy Oil 33% 35% 35% 37%
Onsite Revenue($ millions)
Onsite Net Margin($ millions)
0
10
20
30
40
50
60
0
2
4
6
8
10
12
14
� 2008 � 2009 � 2010
Q3Q2Q1 Q4
� 2008 � 2009 � 2010
Q3 Q2Q1 Q4
Newalta28
the following table compares Onsite’s results for the periods indicated:
three months ended December 31, year ended December 31,
($000s) 2010 2009 %change 2010 2009 %change
revenue – external 47,838 42,671 12 182,246 157,120 16
Operating costs 33,804 31,263 8 129,753 117,706 10
amortization and accretion 3,374 3,643 (7) 13,038 11,416 14
Net margin 10,660 7,765 37 39,455 27,998 41
Netmarginas%ofrevenue 22% 18% 22 22% 18% 22
Maintenance capital 866 823 5 4,833 2,150 125
Growth capital 11,817 3,773 213 27,903 7,719 261
assets employed(1) 252,262 240,793 5
(1) “assets employed” is provided to assist management and investors in determining the effectiveness of the use of the assets at a divisional level. assets employed is the sum of capital assets, intangible assets and
goodwill allocated to each division.
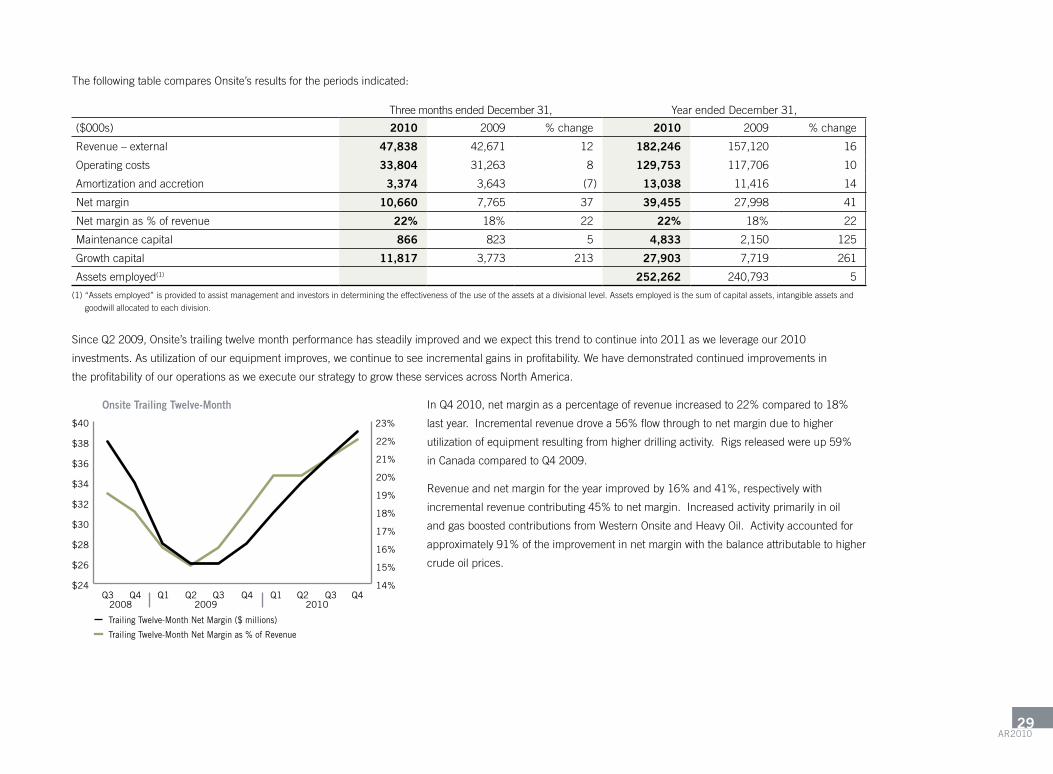
Since Q2 2009, Onsite’s trailing twelve month performance has steadily improved and we expect this trend to continue into 2011 as we leverage our 2010
investments. as utilization of our equipment improves, we continue to see incremental gains in profitability. We have demonstrated continued improvements in
the profitability of our operations as we execute our strategy to grow these services across North america.
InQ42010,netmarginasapercentageofrevenueincreasedto22%comparedto18%
lastyear.Incrementalrevenuedrovea56%flowthroughtonetmarginduetohigher
utilizationofequipmentresultingfromhigherdrillingactivity.Rigsreleasedwereup59%
in Canada compared to Q4 2009.
Revenueandnetmarginfortheyearimprovedby16%and41%,respectivelywith
incrementalrevenuecontributing45%tonetmargin.Increasedactivityprimarilyinoil
and gas boosted contributions from Western Onsite and Heavy Oil. activity accounted for
approximately91%oftheimprovementinnetmarginwiththebalanceattributabletohigher
crude oil prices.
Onsite Trailing Twelve-Month
2009 20102008
Trailing Twelve-Month Net Margin ($ millions)
Trailing Twelve-Month Net Margin as % of Revenue
14%
15%
16%
17%
18%
19%
20%
21%
22%
23%
$24
$26
$28
$30
$32
$34
$36
$38
$40
Q3 Q4 Q1 Q2 Q3 Q4 Q1 Q2 Q3 Q4
aR201029
Western Onsite
revenue is primarily generated from:
• thesupplyandoperationofdrillsiteprocessingequipment,includingequipmentforsolidscontrolanddrillcuttingsmanagementthroughoutwesternCanada
andtheU.S.;
• onsiteserviceinwesternCanada(excludingservicesprovidedbyHeavyOil)includes:industrialcleaning;siteremediation;centrifugationanddredging
anddewatering;and
• environmentalservicesservingprimarilyoilandgascustomers.
Western Onsite performance is primarily affected by fluctuations in drilling activity in western Canada and the u.S. We can also be impacted by the competitive
environment. to address these risks, we have developed a strong customer partnership approach and service differentiation to secure Newalta brand loyalty. Other
onsite services for this business unit are in the early stages of development. We are currently engaged primarily in short-term, or event-based projects, which will
vary from quarter-to-quarter. Western Onsite is also affected by various other industries including pulp and paper, refining, mining and municipal dewatering.
Q42010WesternOnsiterevenueimprovedby94%comparedtoQ42009,consistentwithincreaseddrillingactivityinbothwesternCanadaandtheU.S.Our
utilizationratefordrillsiteequipmentroseto57%from26%inQ42009.ImprovedutilizationwasdrivenbyhigherdemandinboththeU.S.andCanadawith
utilizationratesforQ42010of64%and48%,respectively.IncreasedactivityintheMarcellusandFayettevilleshalegasplaysstrengthenedU.S.demandwhile
increasing activity in the Cardium oil play drove recovery in Canadian demand.
Fortheyear,revenueimprovedby77%comparedto2009duetothesamefactorsimpactingQ42010results.BalancingourfleetequallybetweentheU.S.and
Canadian markets enabled us to capitalize on increased demand in both regions. In addition, increased demand for onsite project work due to higher industrial
activity in western Canada contributed to improved results.
We anticipate continued growth year-over-year in this business unit consistent with increased drilling activity in both Canada and the u.S. and additional onsite
project work.
Eastern Onsite
Eastern Onsite revenue is derived from:
• onsiteserviceineasternCanada,including:industrialcleaning;centrifugationanddredginganddewatering
• afleetofspecializedvehiclesandequipmentforemergencyresponseandonsiteprocessing
EasternOnsiteservicesabroadrangeofindustriesineasternCanada;however,theseindustriesaresensitivetothestateoftheeconomyintheseregions.Eastern
Onsite is in the early stage of development as we have only been developing this business unit for one year. We are currently engaged primarily in short-term, or event-
based projects, which will vary from quarter–to–quarter.
ComparedtoQ42009,EasternOnsiterevenuedecreasedby37%,duetolowerthananticipatedprojectactivityinallregions.
Revenuefortheyeardecreasedby20%comparedto2009.DramaticallyreducedprojectactivityinAtlanticCanadawaspartiallyoffsetbygainsinOntariofromthe
petrochemical industry.
Newalta30
Heavy Oil
Our heavy oil services business began 15 years ago with facilities at Hughenden and Elk Point, alberta. this business has expanded from processing heavy oil in our
facility network to operating equipment on customers’ sites. leveraging our facilities as staging areas, we deliver a broad range of specialized services at numerous
customer sites under short and long-term arrangements. revenue from onsite services is generally based on processing volumes and is not directly susceptible to
fluctuations in crude oil pricing.
Heavy Oil business unit revenue is generated from three main activities:
• specializedonsiteservicesforheavyoilproducersundershortandlong-termarrangements;
• processinganddisposalofoilfield-generatedwastes,includingwaterdisposal,andlandfilling;and
• saleofrecoveredcrudeoilforouraccount
Heavy Oil revenue streams are essentially driven by two sources: waste received at facilities and contract revenue from specialized onsite services. Facility revenue has
anestablishedcustomerbase;however,performanceisaffectedbytheamountofwastegeneratedbyproducersandthesaleofcrudeoilrecoveredtoouraccount.
these streams vary due to volatility in the price of heavy oil and drilling activity. to address this volatility, over the past four years we have worked with customers
to develop specialized onsite services where revenue is based on processed volumes, eliminating our exposure to crude oil prices for these services. Growth in the
business unit will come from our ability to attract and retain customers with new SaGD projects coming on stream.
Q42010HeavyOilrevenueincreasedby8%comparedtoQ42009.Thiswasduetohigherwastereceiptsandcrudeoilrecoveredatourheavyoilfacilities.SAGD
onsite projects were stable and continued to perform as expected. In Q4 2010, we completed the first phase of a project to use our centrifuge processing capabilities
on mature fine tailings, or MFt. this project is expected to resume in the spring of 2011.
Q42010wasteprocessingandrecoveredcrudeoilvolumestoouraccountincreasedby36%and31%,respectively,duetoincreasedwastevolumesfromthearea
served by our Heavy Oil facilities as well as higher volumes from SaGD operations.
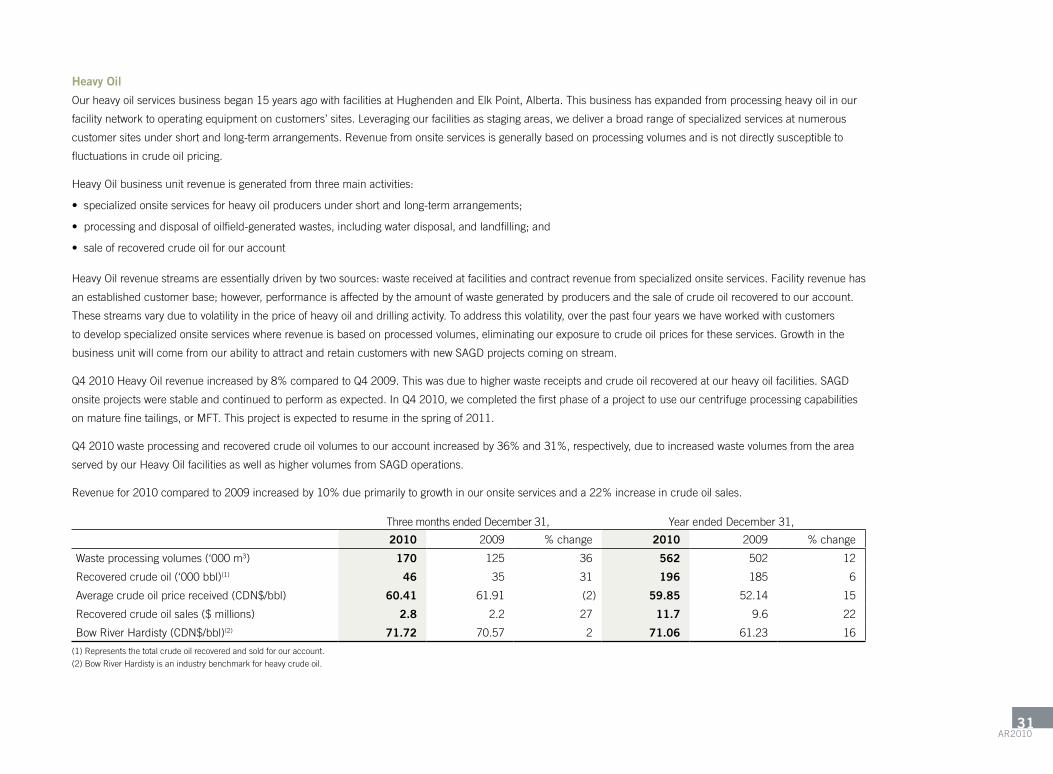
Revenuefor2010comparedto2009increasedby10%dueprimarilytogrowthinouronsiteservicesanda22%increaseincrudeoilsales.
three months ended December 31, year ended December 31,
2010 2009 %change 2010 2009 %change
Waste processing volumes (‘000 m3) 170 125 36 562 502 12
recovered crude oil (‘000 bbl)(1) 46 35 31 196 185 6
average crude oil price received (CDN$/bbl) 60.41 61.91 (2) 59.85 52.14 15
recovered crude oil sales ($ millions) 2.8 2.2 27 11.7 9.6 22
Bow river Hardisty (CDN$/bbl)(2) 71.72 70.57 2 71.06 61.23 16
(1) represents the total crude oil recovered and sold for our account.
(2) Bow river Hardisty is an industry benchmark for heavy crude oil.
aR201031
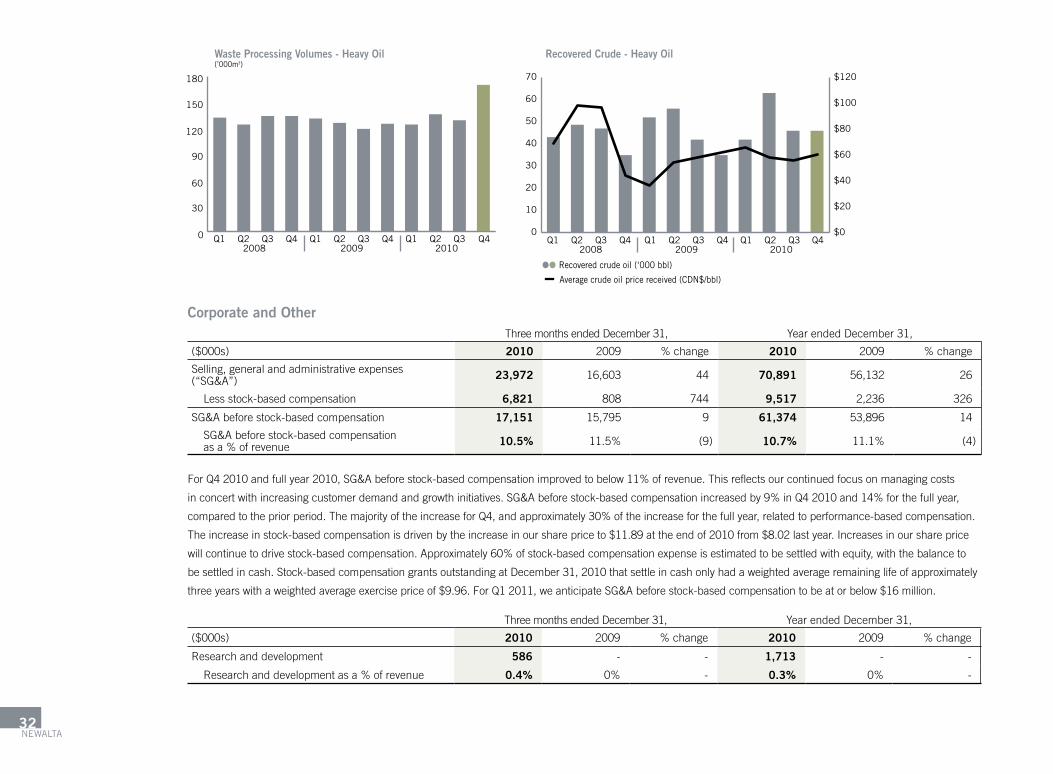
Waste Processing Volumes - Heavy Oil(’000m3)
Recovered Crude - Heavy Oil
0
30
60
90
120
150
180
2008 2009 2010Q4Q1 Q2 Q3 Q4 Q1 Q2 Q3 Q4 Q1 Q2 Q3
2008Q1 Q2 Q3 Q4
2009Q1 Q2 Q3 Q4
2010Q1 Q2 Q3 Q4
0
10
20
30
40
50
60
70
�� Recovered crude oil (‘000 bbl)
Average crude oil price received (CDN$/bbl)
$0
$20
$40
$60
$80
$100
$120
Corporate and Otherthree months ended December 31, year ended December 31,
($000s) 2010 2009 %change 2010 2009 %change
Selling, general and administrative expenses (“SG&a”) 23,972 16,603 44 70,891 56,132 26
less stock-based compensation 6,821 808 744 9,517 2,236 326
SG&a before stock-based compensation 17,151 15,795 9 61,374 53,896 14
SG&a before stock-based compensation asa%ofrevenue 10.5% 11.5% (9) 10.7% 11.1% (4)
ForQ42010andfullyear2010,SG&Abeforestock-basedcompensationimprovedtobelow11%ofrevenue.Thisreflectsourcontinuedfocusonmanagingcosts
inconcertwithincreasingcustomerdemandandgrowthinitiatives.SG&Abeforestock-basedcompensationincreasedby9%inQ42010and14%forthefullyear,
comparedtothepriorperiod.ThemajorityoftheincreaseforQ4,andapproximately30%oftheincreaseforthefullyear,relatedtoperformance-basedcompensation.
the increase in stock-based compensation is driven by the increase in our share price to $11.89 at the end of 2010 from $8.02 last year. Increases in our share price
willcontinuetodrivestock-basedcompensation.Approximately60%ofstock-basedcompensationexpenseisestimatedtobesettledwithequity,withthebalanceto
be settled in cash. Stock-based compensation grants outstanding at December 31, 2010 that settle in cash only had a weighted average remaining life of approximately
three years with a weighted average exercise price of $9.96. For Q1 2011, we anticipate SG&a before stock-based compensation to be at or below $16 million.
three months ended December 31, year ended December 31,
($000s) 2010 2009 %change 2010 2009 %change
research and development 586 - - 1,713 - -
Researchanddevelopmentasa%ofrevenue 0.4% 0% - 0.3% 0% -
Newalta32

research and development expenses for the year are related to the technical Development group which was launched in 2010. By the end of 2010, a team of 15
people comprising engineers, chemists and business analysts was in place and charged with identifying new technologies and finding innovative ways of applying
them to our business. In 2011, technical Development has an operating budget of $3 million to develop and commercialize technologies into our operations. to date,
a significant number of technologies have been identified and are now being prioritized for development.
three months ended December 31, year ended December 31,
($000s) 2010 2009 %change 2010 2009 %change
amortization and accretion 14,891 14,558 2 55,990 51,825 8
Amortizationandaccretionasa%ofrevenue 9.1% 10.6% (14) 9.7% 10.7% (9)
amortization and accretion for the year includes a $1.4 million net loss on disposal of assets compared to a $1.6 million net loss in 2009. Compared to Q4 2009,
amortization and accretion increased due to higher depreciation for assets amortized on a unit of production basis driven by higher utilization.
three months ended December 31, year ended December 31,
($000s) 2010 2009 %change 2010 2009 %change
Bank fees and interest 4,243 4,353 (3) 16,248 16,059 1
Debentures interest and accretion of issue costs(1) 2,365 2,336 1 9,415 9,305 1
Finance charges 6,608 6,689 (1) 25,663 25,364 1
(1) Includes convertible debentures and senior unsecured debentures.
Finance charges for the quarter and the year were relatively flat to the same periods in 2009 primarily due to lower average senior debt. the average interest rate
onthecreditfacilityforQ42010improvedto5.2%from5.7%inQ42009.Fortheyear,theaverageinterestrateonthecreditfacilityincreasedto5.2%from
4.5%in2009.FinancechargesassociatedwiththeConvertibleDebenturesincludeanannualcouponrateof7%,theaccretionofissuecostsanddiscountonthe
debtportionoftheConvertibleDebentures.FinancechargesassociatedwiththeSeniorUnsecuredDebenturesincludeanannualcouponrateof7.625%andthe
accretion of issue costs. the Senior unsecured Debentures were issued November 23, 2010. See “liquidity and Capital resources” in this MD&a for discussion of
our long-term borrowings.
three months ended December 31, year ended December 31,
($000s) 2010 2009 %change 2010 2009 %change
Current tax 520 317 64 938 945 (1)
Future income tax 1,945 (958) 303 8,621 (1,312) 757
Provision for (recovery of) income taxes 2,465 (641) 485 9,559 (367) 2,705
aR201033
the increase in future income tax expense for the quarter and year compared to 2009 is primarily due to higher taxable income. the effective tax rate for the year
increasedto34.6%in2010comparedtoa13.4%recoveryin2009.Theincreaseintheeffectivetaxrateresultedfromhighernon-deductiblecostsrelatedtostock
options in 2010. additionally, in 2009, our effective tax rate was unusually low due to the recognition of reductions to Federal and Provincial tax rates in Canada and
the increase in the value of certain tax assets on the wind-up of Newalta Income Fund. loss carry forwards are approximately $177 million at December 31, 2010.
Other than provincial capital taxes and u.S. state and federal income taxes, we do not anticipate paying significant income tax for at least three years. See “Critical
accounting Estimates – Income taxes” on page 42 of the MD&a for the year ended December 31, 2010 for further discussion.
Liquidity And Capital Resourcesthe term liquidity refers to the speed with which a company’s assets can be converted into cash, as well as cash on hand. Our liquidity risk may arise from general
day-to-day cash requirements and in the management of our assets, liabilities and capital resources. liquidity risk is managed against our financial leverage to meet
obligations and commitments in a balanced manner. For further information on our risk management, refer to Note 20 to the consolidated financial statements for
the year ended December 31, 2010.
Our debt capital structure is as follows:
($000s) December 31, 2010 December 31, 2009
use of Credit Facility:
amount drawn on Credit Facility(1) 53,860 195,199
Senior unsecured Debentures 125,000 -
letters of credit 21,477 22,137
total Debt a 200,337 217,336
unused Credit Facility capacity(2) 124,663 132,664
Convertible Debentures B 115,000 115,000
total Secured and unsecured Debt =a+B 315,337 332,336
(1) See Note 9 to the consolidated financial statements for the quarter and year ended December 31, 2010. the net senior secured debt at December 31, 2010 was $52 million.
(2) Management elected to reduce our borrowing capacity to $200 million on December 17, 2010 from $350 million.
We continue to focus on managing our working capital accounts while supporting our growth. Working capital at December 31, 2010 decreased to $19.2 million from
$31.0 million at December 31, 2009, due to increased activity levels and timing of receipts and payments. Cash from operations was similarly impacted. Days’ sales
outstanding in receivables has been maintained at levels consistent with prior year and accounts receivable over 90 days of $2.2 million has increased in line with
increased activity.
at current activity levels, working capital is expected to be sufficient to meet our ongoing commitments and operational requirements of the business. We will continue
to manage working capital prudently with increasing activity levels.
For further information on credit risk management, please refer to Note 20 to the consolidated financial statements.
Newalta34
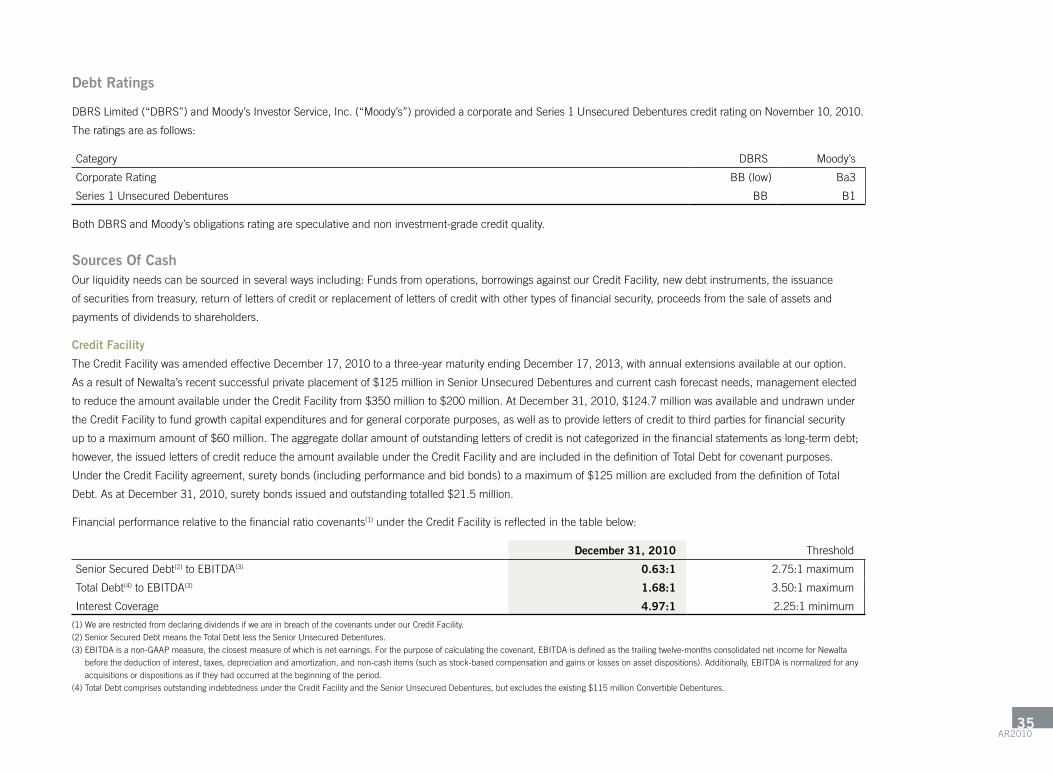
Debt Ratings
DBrS limited (“DBrS”) and Moody’s Investor Service, Inc. (“Moody’s”) provided a corporate and Series 1 unsecured Debentures credit rating on November 10, 2010.
the ratings are as follows:
Category DBrS Moody’s
Corporate rating BB (low) Ba3
Series 1 unsecured Debentures BB B1
Both DBrS and Moody’s obligations rating are speculative and non investment-grade credit quality.
Sources Of CashOur liquidity needs can be sourced in several ways including: Funds from operations, borrowings against our Credit Facility, new debt instruments, the issuance
of securities from treasury, return of letters of credit or replacement of letters of credit with other types of financial security, proceeds from the sale of assets and
payments of dividends to shareholders.
Credit Facility
the Credit Facility was amended effective December 17, 2010 to a three-year maturity ending December 17, 2013, with annual extensions available at our option.
as a result of Newalta’s recent successful private placement of $125 million in Senior unsecured Debentures and current cash forecast needs, management elected
to reduce the amount available under the Credit Facility from $350 million to $200 million. at December 31, 2010, $124.7 million was available and undrawn under
the Credit Facility to fund growth capital expenditures and for general corporate purposes, as well as to provide letters of credit to third parties for financial security
uptoamaximumamountof$60million.Theaggregatedollaramountofoutstandinglettersofcreditisnotcategorizedinthefinancialstatementsaslong-termdebt;
however, the issued letters of credit reduce the amount available under the Credit Facility and are included in the definition of total Debt for covenant purposes.
under the Credit Facility agreement, surety bonds (including performance and bid bonds) to a maximum of $125 million are excluded from the definition of total
Debt. as at December 31, 2010, surety bonds issued and outstanding totalled $21.5 million.
Financial performance relative to the financial ratio covenants(1) under the Credit Facility is reflected in the table below:
December 31, 2010 threshold
Senior Secured Debt(2) to EBItDa(3) 0.63:1 2.75:1 maximum
total Debt(4) to EBItDa(3) 1.68:1 3.50:1 maximum
Interest Coverage 4.97:1 2.25:1 minimum
(1) We are restricted from declaring dividends if we are in breach of the covenants under our Credit Facility.
(2) Senior Secured Debt means the total Debt less the Senior unsecured Debentures.
(3) EBItDa is a non-GaaP measure, the closest measure of which is net earnings. For the purpose of calculating the covenant, EBItDa is defined as the trailing twelve-months consolidated net income for Newalta
before the deduction of interest, taxes, depreciation and amortization, and non-cash items (such as stock-based compensation and gains or losses on asset dispositions). additionally, EBItDa is normalized for any
acquisitions or dispositions as if they had occurred at the beginning of the period.
(4) total Debt comprises outstanding indebtedness under the Credit Facility and the Senior unsecured Debentures, but excludes the existing $115 million Convertible Debentures.
aR201035
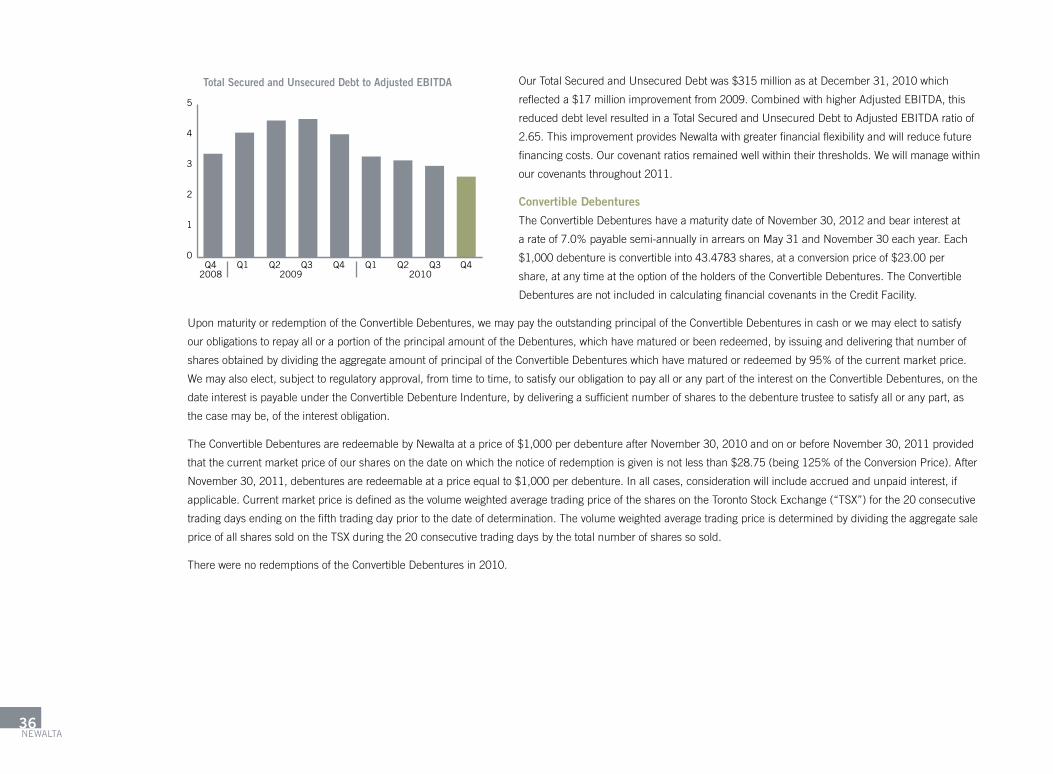
Our total Secured and unsecured Debt was $315 million as at December 31, 2010 which
reflected a $17 million improvement from 2009. Combined with higher adjusted EBItDa, this
reduced debt level resulted in a total Secured and unsecured Debt to adjusted EBItDa ratio of
2.65. this improvement provides Newalta with greater financial flexibility and will reduce future
financing costs. Our covenant ratios remained well within their thresholds. We will manage within
our covenants throughout 2011.
Convertible Debentures
the Convertible Debentures have a maturity date of November 30, 2012 and bear interest at
arateof7.0%payablesemi-annuallyinarrearsonMay31andNovember30eachyear.Each
$1,000 debenture is convertible into 43.4783 shares, at a conversion price of $23.00 per
share, at any time at the option of the holders of the Convertible Debentures. the Convertible
Debentures are not included in calculating financial covenants in the Credit Facility.
upon maturity or redemption of the Convertible Debentures, we may pay the outstanding principal of the Convertible Debentures in cash or we may elect to satisfy
our obligations to repay all or a portion of the principal amount of the Debentures, which have matured or been redeemed, by issuing and delivering that number of
sharesobtainedbydividingtheaggregateamountofprincipaloftheConvertibleDebentureswhichhavematuredorredeemedby95%ofthecurrentmarketprice.
We may also elect, subject to regulatory approval, from time to time, to satisfy our obligation to pay all or any part of the interest on the Convertible Debentures, on the
date interest is payable under the Convertible Debenture Indenture, by delivering a sufficient number of shares to the debenture trustee to satisfy all or any part, as
the case may be, of the interest obligation.
the Convertible Debentures are redeemable by Newalta at a price of $1,000 per debenture after November 30, 2010 and on or before November 30, 2011 provided
thatthecurrentmarketpriceofoursharesonthedateonwhichthenoticeofredemptionisgivenisnotlessthan$28.75(being125%oftheConversionPrice).After
November 30, 2011, debentures are redeemable at a price equal to $1,000 per debenture. In all cases, consideration will include accrued and unpaid interest, if
applicable. Current market price is defined as the volume weighted average trading price of the shares on the toronto Stock Exchange (“tSX”) for the 20 consecutive
trading days ending on the fifth trading day prior to the date of determination. the volume weighted average trading price is determined by dividing the aggregate sale
price of all shares sold on the tSX during the 20 consecutive trading days by the total number of shares so sold.
there were no redemptions of the Convertible Debentures in 2010.
Total Secured and Unsecured Debt to Adjusted EBITDA
2008Q4Q4
2009Q1 Q2 Q3 Q4
2010Q1 Q2 Q3
0
1
2
3
4
5
Newalta36

Senior Unsecured Debentures
OnNovember23,2010,Newaltaissued$125.0millionof7.625%Series1UnsecuredDebentures(the“SeniorUnsecuredDebentures”).TheSeniorUnsecured
DebenturesmatureonNovember23,2017.TheSeniorUnsecuredDebenturesbearinterestat7.625%perannumandsuchinterestispayableinequalinstalments
semi-annually in arrears on May 23 and November 23 in each year, commencing on May 23, 2011. the Senior unsecured Debentures are unsecured senior
obligations and rank equally with all other existing and future unsecured senior debt and senior to any subordinated debt that may be issued by Newalta or any of its
subsidiaries. the Senior unsecured Debentures are effectively subordinated to all secured debt to the extent of collateral on such debt.
Prior to November 23, 2013, Newalta may on one or more occasions:
• Redeemupto35%oftheaggregateprincipalamountofSeniorUnsecuredDebentures,withthenetcashproceedsofoneormorepublicequityofferingsata
redemptionpriceequalto107.625%oftheprincipalamount,plusaccruedandunpaidinteresttothedateofredemption.
• RedeemtheSeniorUnsecuredDebentures,inwholeorinpart,ataredemptionpricewhichisequaltothegreaterof(a)theCanadaYieldPrice(asdefinedinthe
trustindenture)and(b)101%oftheaggregateprincipalamountofSeniorUnsecuredDebenturesredeemed,plus,ineachcase,accruedandunpaidinterestto
the redemption date.
after November 23, 2013, the Senior unsecured Debentures are redeemable at the option of Newalta, in whole or in part, at redemption prices expressed as
percentages of the principal amount, plus in each case accrued interest to the redemption date, if redeemed during the twelve month period beginning on
November23oftheyearsasfollows:Year2013–103.813%;Year2014–102.542%;Year2015–101.906%;Year2016andthereafter–100%.
During the three and twelve months ended December 31, 2010, financing fees of $3.0 million were incurred in connection with the issuance of the Senior unsecured
Debentures. these fees have been recorded as deferred financing costs and are being amortized using the effective interest method over the term of the Senior
unsecured Debentures.
the trust indenture under which the Senior unsecured Debentures have been issued also requires Newalta to be in compliance with certain covenants on an annual
basis. at December 31, 2010, Newalta was in compliance with all covenants.
Uses Of CashOur primary uses of funds include maintenance and growth capital expenditures as well as acquisitions, payment of dividends, operating and SG&a expenses and the
repayment of debt.
Capital Expenditures
“Growth capital expenditures” or “growth and acquisition capital expenditures” are capital expenditures that are intended to improve our efficiency and productivity,
allow us to access new markets and diversify our business. Growth capital, or growth and acquisition capital, are reported separately from maintenance capital
because these types of expenditures are discretionary. “Maintenance capital expenditures” are capital expenditures to replace and maintain depreciable assets at
current service levels. Maintenance capital expenditures are reported separately from growth activity because these types of expenditures are not discretionary and
are required to maintain current operating levels.
aR201037
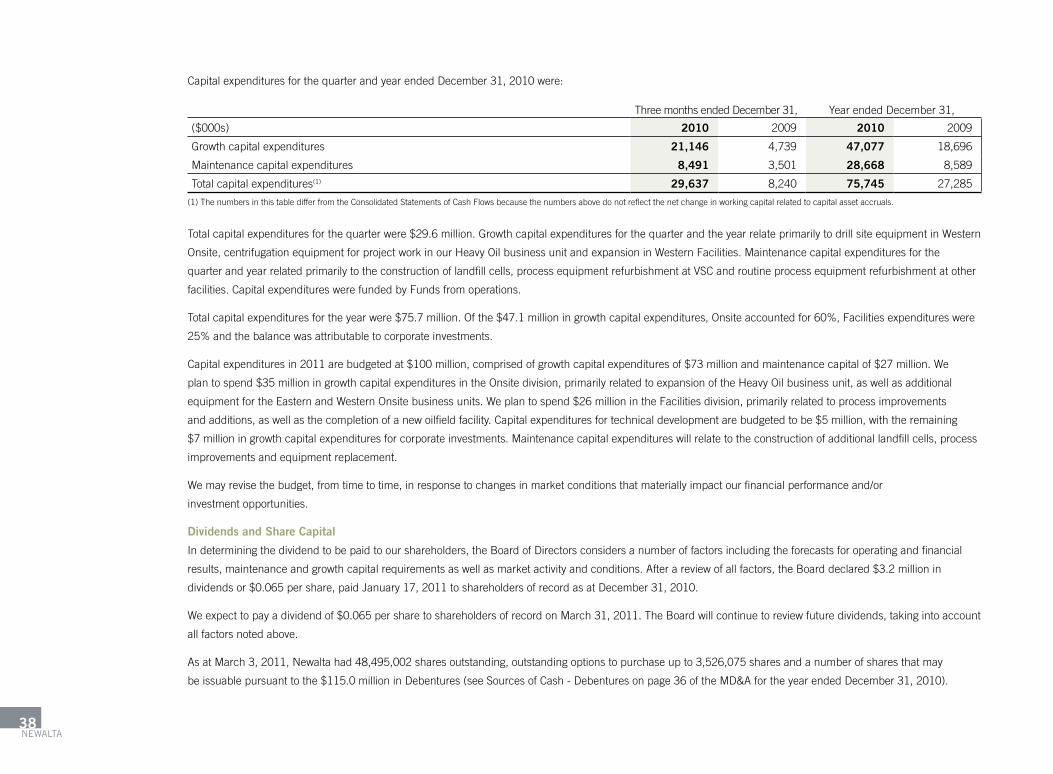
Capital expenditures for the quarter and year ended December 31, 2010 were:
three months ended December 31, year ended December 31,
($000s) 2010 2009 2010 2009
Growth capital expenditures 21,146 4,739 47,077 18,696
Maintenance capital expenditures 8,491 3,501 28,668 8,589
total capital expenditures(1) 29,637 8,240 75,745 27,285
(1) the numbers in this table differ from the Consolidated Statements of Cash Flows because the numbers above do not reflect the net change in working capital related to capital asset accruals.
total capital expenditures for the quarter were $29.6 million. Growth capital expenditures for the quarter and the year relate primarily to drill site equipment in Western
Onsite, centrifugation equipment for project work in our Heavy Oil business unit and expansion in Western Facilities. Maintenance capital expenditures for the
quarter and year related primarily to the construction of landfill cells, process equipment refurbishment at VSC and routine process equipment refurbishment at other
facilities. Capital expenditures were funded by Funds from operations.
Totalcapitalexpendituresfortheyearwere$75.7million.Ofthe$47.1millioningrowthcapitalexpenditures,Onsiteaccountedfor60%,Facilitiesexpenditureswere
25%andthebalancewasattributabletocorporateinvestments.
Capital expenditures in 2011 are budgeted at $100 million, comprised of growth capital expenditures of $73 million and maintenance capital of $27 million. We
plan to spend $35 million in growth capital expenditures in the Onsite division, primarily related to expansion of the Heavy Oil business unit, as well as additional
equipment for the Eastern and Western Onsite business units. We plan to spend $26 million in the Facilities division, primarily related to process improvements
and additions, as well as the completion of a new oilfield facility. Capital expenditures for technical development are budgeted to be $5 million, with the remaining
$7 million in growth capital expenditures for corporate investments. Maintenance capital expenditures will relate to the construction of additional landfill cells, process
improvements and equipment replacement.
We may revise the budget, from time to time, in response to changes in market conditions that materially impact our financial performance and/or
investment opportunities.
Dividends and Share Capital
In determining the dividend to be paid to our shareholders, the Board of Directors considers a number of factors including the forecasts for operating and financial
results, maintenance and growth capital requirements as well as market activity and conditions. after a review of all factors, the Board declared $3.2 million in
dividends or $0.065 per share, paid January 17, 2011 to shareholders of record as at December 31, 2010.
We expect to pay a dividend of $0.065 per share to shareholders of record on March 31, 2011. the Board will continue to review future dividends, taking into account
all factors noted above.
as at March 3, 2011, Newalta had 48,495,002 shares outstanding, outstanding options to purchase up to 3,526,075 shares and a number of shares that may
be issuable pursuant to the $115.0 million in Debentures (see Sources of Cash - Debentures on page 36 of the MD&a for the year ended December 31, 2010).
Newalta38

Contractual ObligationsOur contractual obligations, as at December 31, 2010, were:
($000s) totalless than one year 1-3 years 4-5 years thereafter
Office leases 64,138 7,676 14,830 13,870 27,762
Operating leases(1) 15,229 9,025 5,774 430 -
Surface leases 3,387 1,135 1,447 580 225
Convertible Debentures 130,429 8,050 122,379 - -
Senior long-term debt(2) 54,028 - 54,028 - -
Senior unsecured Debentures 190,726 9,531 19,063 19,062 143,070
Total commitments 457,937 35,417 217,521 33,942 171,057
(1) Operating leases relate to our vehicle fleet with terms ranging between 3 and 5 years.
(2) Senior long-term debt is gross of transaction costs. Interest payments are not included.
Summary Of Quarterly Results($000s except per share data) 2010 2009
Q4 Q3 Q2 Q1 Q4 Q3 Q2 Q1
revenue 162,927 145,124 136,905 131,240 137,308 122,169 111,386 112,538
Earnings (loss) before taxes 5,327 9,364 4,918 8,013 3,451 5,936 (293) (6,362)
Net earnings (loss) 2,862 6,324 3,155 5,722 4,092 3,567 (179) (4,381)
Earnings (loss) per share ($) 0.06 0.13 0.07 0.12 0.09 0.08 - (0.10)
Diluted earnings (loss) per share ($) 0.06 0.13 0.06 0.12 0.09 0.08 - (0.10)
Weighted average shares – basic 48,523 48,487 48,487 48,480 46,770 42,438 42,450 42,402
Weighted average shares – diluted 48,934 48,909 48,844 48,826 47,049 42,610 42,450 42,402
EBItDa 26,826 28,769 26,310 27,370 24,698 25,253 17,940 12,030
adjusted EBItDa 33,647 29,706 26,573 28,866 25,506 26,606 18,253 11,792
Quarterly performance is affected by, among other things, weather conditions, timing of onsite projects, commodity prices, foreign exchange rates, market demand
and the timing of our growth capital investments, as well as acquisitions and the contributions from those investments. Growth capital investments completed in the
first half of the year will tend to strengthen the second half financial performance. revenue from certain business units is impacted by seasonality. However, due to the
diversity of our business, the impact is limited on a consolidated basis. For example, waste volumes received at our oilfield facilities decline in the second quarter due
to road bans which restrict drilling activity. this decline is offset by increased activity in our Eastern Onsite business unit due to the aqueous nature of work performed,
as well as potentially by fluctuations in commodity prices or event-based waste receipts at SCl. as experienced over the last eight quarters, fluctuations in commodity
prices can dramatically impact our results.
aR201039
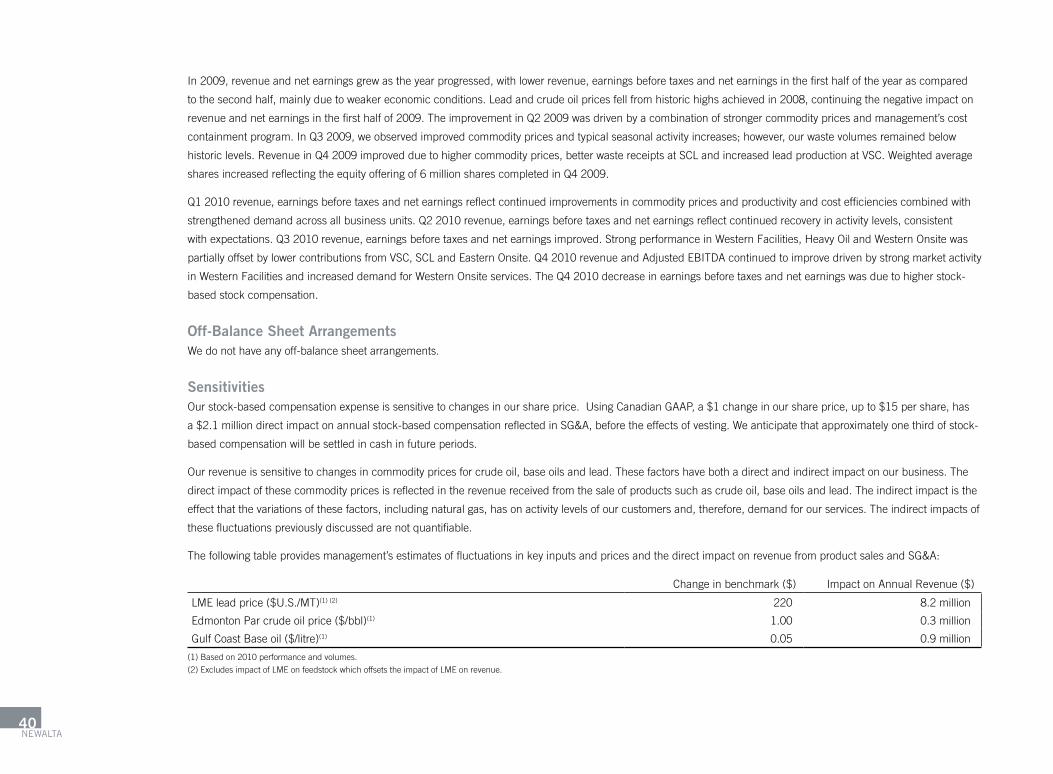
In 2009, revenue and net earnings grew as the year progressed, with lower revenue, earnings before taxes and net earnings in the first half of the year as compared
to the second half, mainly due to weaker economic conditions. lead and crude oil prices fell from historic highs achieved in 2008, continuing the negative impact on
revenue and net earnings in the first half of 2009. the improvement in Q2 2009 was driven by a combination of stronger commodity prices and management’s cost
containmentprogram.InQ32009,weobservedimprovedcommoditypricesandtypicalseasonalactivityincreases;however,ourwastevolumesremainedbelow
historic levels. revenue in Q4 2009 improved due to higher commodity prices, better waste receipts at SCl and increased lead production at VSC. Weighted average
shares increased reflecting the equity offering of 6 million shares completed in Q4 2009.
Q1 2010 revenue, earnings before taxes and net earnings reflect continued improvements in commodity prices and productivity and cost efficiencies combined with
strengthened demand across all business units. Q2 2010 revenue, earnings before taxes and net earnings reflect continued recovery in activity levels, consistent
with expectations. Q3 2010 revenue, earnings before taxes and net earnings improved. Strong performance in Western Facilities, Heavy Oil and Western Onsite was
partially offset by lower contributions from VSC, SCl and Eastern Onsite. Q4 2010 revenue and adjusted EBItDa continued to improve driven by strong market activity
in Western Facilities and increased demand for Western Onsite services. the Q4 2010 decrease in earnings before taxes and net earnings was due to higher stock-
based stock compensation.
Off-Balance Sheet ArrangementsWe do not have any off-balance sheet arrangements.
SensitivitiesOur stock-based compensation expense is sensitive to changes in our share price. using Canadian GaaP, a $1 change in our share price, up to $15 per share, has
a $2.1 million direct impact on annual stock-based compensation reflected in SG&a, before the effects of vesting. We anticipate that approximately one third of stock-
based compensation will be settled in cash in future periods.
Our revenue is sensitive to changes in commodity prices for crude oil, base oils and lead. these factors have both a direct and indirect impact on our business. the
direct impact of these commodity prices is reflected in the revenue received from the sale of products such as crude oil, base oils and lead. the indirect impact is the
effect that the variations of these factors, including natural gas, has on activity levels of our customers and, therefore, demand for our services. the indirect impacts of
these fluctuations previously discussed are not quantifiable.
the following table provides management’s estimates of fluctuations in key inputs and prices and the direct impact on revenue from product sales and SG&a:
Change in benchmark ($) Impact on annual revenue ($)
lME lead price ($u.S./Mt)(1) (2) 220 8.2 million
Edmonton Par crude oil price ($/bbl)(1) 1.00 0.3 million
Gulf Coast Base oil ($/litre)(1) 0.05 0.9 million
(1) Based on 2010 performance and volumes.
(2) Excludes impact of lME on feedstock which offsets the impact of lME on revenue.
Newalta40

Selected Quarterly Information($000s) For the three months ended December 31, 2010
Facilities Onsite Inter-
segment Unallocated(3)Consolidated
Total
External revenue 115,089 47,838 - - 162,927
Inter-segment revenue(1) 104 - (104) - -
Operating expense 77,843 33,804 (104) - 111,543
amortization and accretion expense 8,827 3,374 - 2,690 14,891
Net margin 28,523 10,660 - (2,690) 36,493
Selling, general and administrative - - - 23,972 23,972
research and development - - - 586 586
Finance charges - - - 6,608 6,608
Earnings before taxes 28,523 10,660 - (33,856) 5,327
Capital expenditures and acquisitions(2) 14,119 12,683 - 2,835 29,637
Goodwill 44,381 58,516 - - 102,897
total assets 647,426 300,951 - 80,347 1,028,724
($000s) For the three months ended December 31, 2009
Facilities Onsite Inter-
segment unallocated(3)Consolidated
total
External revenue 94,637 42,671 - - 137,308
Inter-segment revenue(1) 295 - (295) - -
Operating expense 65,039 31,263 (295) - 96,007
amortization and accretion expense 8,161 3,643 - 2,754 14,558
Net margin 21,732 7,765 - (2,754) 26,743
Selling, general and administrative - - - 16,603 16,603
research and development - - - - -
Finance charges - - - 6,689 6,689
Earnings before taxes 21,732 7,765 - (26,046) 3,451
Capital expenditures and acquisitions(2) 4,155 4,596 - (511) 8,240
Goodwill 44,381 59,216 - - 103,597
total assets 648,960 271,588 - 73,182 993,730
(1) Inter-segment revenue is recorded at market, less the costs of serving external customers.
(2) Includes capital asset additions and the purchase price of acquisitions.
(3) Management does not allocate selling, general and administrative, taxes and interest costs in the segment analysis.
aR201041
Critical Accounting Estimatesthe preparation of the financial statements in accordance with GaaP requires management to make estimates with regard to the reported amounts of revenue and
expenses and the carrying values of assets and liabilities. these estimates are based on historical experience and other factors determined by management. Because
this involves varying degrees of judgment and uncertainty, the amounts currently reported in the financial statements could, in the future, prove to be inaccurate.
Amortization and Accretion
amortization of capital assets and intangible assets incorporates estimates of useful lives and residual values. these estimates may change as more experience is
obtained or as general market conditions change impacting the operation of plant and equipment. accretion expense is the increase in the asset retirement obligation
over time. the asset retirement obligation is based on estimates that may change as more experience is obtained or as general market conditions change impacting
the future cost of abandoning our facilities. amortization of capital assets and intangible assets incorporates estimates of useful lives and residual values. the
estimates may change as more experience is obtained or as general market conditions change impacting the operating of plant and equipment.
Asset Retirement Obligations
asset retirement obligations are estimated by management based on the anticipated costs to abandon and reclaim all our facilities and landfills as well as the
projected timing of the costs to be incurred in future periods. Management, in consultation with Newalta’s engineers, estimates these costs based on current
regulations, costs, technology and industry standards. the fair value estimate is capitalized as part of the cost of the related asset and amortized to expense over the
asset’s useful life. the useful lives of the assets and the long-term commitments of certain sites range from 20 to 300 years. the total estimated future cost for asset
retirementobligationsatDecember31,2010was$9.7billion.Thenetpresentvalueofthisamount,$21.7million(usingadiscountrateof8%),hasbeenaccrued
on the consolidated balance sheet at December 31, 2010. the majority of the undiscounted future asset retirement obligations relates to SCl in Ontario, which are
expected to be incurred over the next 300 years. Excluding SCl, the total undiscounted future costs are $36.2 million. there were no significant changes in the
estimates used to prepare the asset retirement obligation in 2010 compared to 2009.
Goodwill
We perform a test for goodwill impairment annually and whenever events or circumstances make it possible that impairment may have occurred. Determining whether
impairment has occurred requires a valuation of the respective segment, based on its future discounted cash flows. In applying this methodology, we rely on a number
of factors, including actual operating results, future business plans, economic projections and market data. We test the valuation of goodwill as at September 30 of
each year to determine whether or not any impairment in the goodwill balance recorded exists. In addition, on a quarterly basis, we assess the reasonableness of
assumptions used for the valuation to determine if further impairment testing is required.
Our determination as at September 30, 2010 and December 31, 2010 was that goodwill was not impaired.
Income Taxes
Current income tax expense predominantly represents capital taxes paid in eastern Canada, federal and provincial income taxes and u.S. taxation imposed on the
u.S. subsidiary. tax losses generated under the income fund structure are expected to provide shelter from any significant corporate current tax exposure for a
minimum of three years.
Newalta42

Future income taxes are estimated based on temporary differences between the book value and tax value of assets and liabilities using the applicable future income
tax rates under current law. the change in these temporary differences results in a future income tax expense or recovery. the applicable future income tax rate for
each entity is calculated based on provincial allocation calculations and the expected timing of reversal of temporary differences. Changes in the assumptions used to
derive the future income tax rate could have a material impact on the future income tax expense or recovery incurred in the period.
Permits and other intangibles
Permits and other intangibles represent the book value of expiring permits and rights, indefinite permits and non-competition contracts. the intrinsic value of the
permits relates to the breadth of the terms and conditions and the types of waste we are able to process. In today’s regulatory environment, management believes
an operator would be unable to obtain similar permits with the same scope of operations. therefore, management estimates that the value of our permits could be
greater than its book value.
Stock-Based Compensation
We have three share-based compensation plans, the 2003 Option Plan (the “2003 Plan”), the 2006 Option Plan (the “2006 Plan”) and the 2008 Option Plan (the
“2008Plan”).Undertheoptionplans,wemaygranttodirectors,officers,employeesandconsultantsofNewaltaoranyofitsaffiliates,optionstoacquireupto10%
of the issued and outstanding shares. Newalta uses the fair value method to account for the options granted pursuant to the 2003 Plan and recognizes the share-
based compensation expense over the vesting period of the options, with a corresponding increase to contributed surplus. When options are exercised, the proceeds,
together with the amount recorded in contributed surplus, are transferred to shareholders’ capital. Forfeitures are accounted for as incurred. Determining the fair
value of stock-based awards at the grant date requires judgment, including estimating the expected term of the options, the expected volatility of the underlying
security and the expected dividends.
the 2006 Plan and the 2008 Plan are accounted for as stock appreciation rights since they allow for individuals to settle their rights in cash. accordingly, we use
the intrinsic value method to account for these rights. the intrinsic value reflects the net cash liability calculated as the difference between the market value of the
shares and the exercise price of the right. this is re-measured at each reporting date and stock-based compensation expense is increased or decreased accordingly.
Decreases or reversals of stock-based compensation expense are limited to previously recognized stock-based compensation expense.
Newalta may also grant stock appreciation rights (“Sars”) to directors, officers, employees and consultants of Newalta Corporation or any of its affiliates. Sars entitle
the holder thereof to receive cash from Newalta in an amount equal to the positive difference between the grant price and the trading price of our common shares on
the exercise date. the grant price is calculated based on the five-day volume weighted average trading price of our common shares on the tSX. Sars generally expire
five years after they have been granted and the vesting period is determined by the Board of Directors of Newalta. Newalta uses the intrinsic value method to account
for Sars. the intrinsic value reflects the net liability calculated as the difference between the market value of the shares and the exercise price of the Sar. this is
re-measured at each reporting date and stock-based compensation expense is increased or decreased accordingly. Decreases or reversals of stock-based
compensation expense are limited to previously recognized stock-based compensation expense.
Newalta has a deferred share unit (“DSu”) Plan, which is described in Note 12 to the consolidated financial statements. DSus are settled in cash and are recorded as
liabilities. the measurement of the compensation expense and corresponding liability for these awards is based on the intrinsic value of the award, and is recorded as
a charge to SG&a expense over the vesting period of the award. at the end of each financial period, changes in the Company’s payment obligation due to changes in
aR201043

the market value of Newalta’s shares are recorded as a charge to SG&a expense. Dividend equivalent grants, if any, are recorded as a charge to SG&a expense in
the period the dividend is paid.
Future Accounting Policy ChangesInformation regarding our changes in accounting policies is included in Note 3 to the consolidated financial statements.
International Financial Reporting Standards (“IFRS”)
In February 2008, the Canadian accounting Standards Board (“acSB”) confirmed that Canadian publicly accountable enterprises would be required to adopt IFrS
for fiscal years beginning on or after January 1, 2011. IFrS uses a conceptual framework similar to GaaP, but there are differences in recognition, measurement
and disclosures.
Management established a project team to plan for and achieve a smooth transition to IFrS. an external resource was also engaged in an advisory capacity. the
audit Committee of the Board of Directors regularly receives progress reports on the status of the IFrS implementation project.
the following table summarizes our key activities, related milestones and accomplishments to date.
Key Activity Milestones Status
Accounting Policies and Procedures:
• Identification of differences between IFrS and the company’s existing policies and procedures
• accounting policy choices under IFrS
• Financial statement impact
• Opening balances
• Financial policies and procedures
• Identification of areas that may have a significant impact
• Finalize accounting policy choices under IFrS
• Finalize opening balances
• Complete new financial policies and procedures manual addressing IFrS requirements
We have completed our internal review of differences between IFrS and current policies and procedures, and have made assessments of accounting policy choices. We are in the process of confirming and finalizing these assessments and their financial statement impacts with our consultants and auditors.
the review of opening balances is in progress and is expected to be completed during the first quarter of 2011. Communication of financial impacts will follow review completion.
Financial Statement Preparation:
• Prepare financial statements and note disclosures in compliance with IFrS
• Quantify the effects of converting to IFrS
• Prepare first-time adoption reconciliations required under IFrS 1
• Senior management approval and audit Committee review of pro forma financial statements and disclosures
a preliminary pro forma financial statement and note disclosure structure was presented to senior management and the audit Committee in early 2009.
updated pro forma financial statement and note disclosure structures continue to be presented to senior management and the audit Committee on a regular basis and will be finalized during the first quarter of 2011.
Newalta44

Key Activity Milestones Status
IT Infrastructure:
Identify key changes in the following areas:
• It system changes and upgrades
• Systemic process changes for data collection for G/l, disclosures, and consolidation
• One-time processes due to IFrS 1
• Ensure readiness for parallel processing of 2010 financial results and IFrS-compliant reporting in 2011
• Identify and recommend systemic process changes
• testing phase
• ErP parallel run
required system upgrades and changes have been made.
Parallel ErP system is operational.
Control Environment:
Internal control over financial reporting
• accounting policy changes and approval
• Changes to certification process
Disclosure controls and procedures
• MD&a communications package
• IFrS adjustments to GaaP statements (2010)
• 2011 financial statement presentation
• Complete final signoff and review of accounting policy changes by Q4 2010
• update certification process by Q4 2010
• Publish material changes in policies and known impacts of IFrS in the MD&a throughout 2009 & 2010
• Publish impact of conversion (with reconciliation to GaaP) on key measures (Q1 2011)
• Publish disclosure of 2010 comparative information (with reconciliation to GaaP) in the interim and annual financial statements (Q1 2011)
Internal assessment, control implementation and independent assessment will be ongoing throughout 2011 to ensure appropriate controls are effective.
No material changes were made to the certification process during 2010, nor are they expected for 2011.
Our disclosure procedures ensure that key impacts due to IFrS are adequately disclosed. Disclosure requirements relating to IFrS will be independently reviewed and tested throughout 2011 to determine effectiveness.
Material changes in policies are discussed in the MD&a. Financial impacts will be communicated as they are finalized and confirmed.
Training, Communication and Other:
• Provide training to key stakeholders
• address impacts to operations due to IFrS
• Investor relations
• Financial covenants
• Compensation packages
• Develop working groups and training to implement changes for significant impact items
• Develop investor relations communication plan (Q3 2009)
review of:
• Financial covenants (by Q3 2010)
• Compensation packages (by Q3 2010)
Issue specific training sessions were delivered throughout 2010 and will continue during the first quarter of 2011.
Key communication continues to be provided through the MD&a. assessment of requirements for further communication is ongoing.
We have structured our Credit Facility and the Senior unsecured Debenture Indenture, in order to minimize the impact of IFrS on our financial covenants. We will continue to assess the impact on our compensation packages.
Key stakeholder communications will continue throughout the first quarter of 2011.
aR201045

Management is in the final stages of the transition to IFrS and is focused on working with our external auditors to achieve agreement on conclusions. a summary
of the key areas where changes in accounting policies are expected to impact our consolidated financial statements are listed below. this summary should not be
regarded as a complete list of the changes that will result from the transition to IFrS. rather, it is intended to highlight those areas management currently believes
to be the most significant.
Most adjustments required on transition to IFrS will be made retrospectively against opening retained earnings as of January 1, 2010 (“transition date”). transitional
adjustments relating to those standards where comparative figures are not required to be restated will only be made as of the first day of the year of adoption.
First-Time Adoption of IFRS
the First-time adoption of International Financial reporting Standard (“IFrS 1”) provides entities adopting IFrS for the first time with a number of optional
exemptions and mandatory exceptions, to the general requirement for full retrospective application of IFrS.
the most significant IFrS 1 exemptions applying to Newalta are summarized below.
Area of IFRS Summary of Exemption Available
Business Combinations an entity may elect, on transition to IFrS, not to retrospectively apply IFrS 3, “Business Combinations” to past business combinations. this election is allowed subject to specific requirements (an entity must maintain the classification of the acquirer and acquiree, recognize/derecognize certain assets or liabilities as required under IFrS and remeasure certain assets and liabilities at fair value).
Newalta has elected on transition to IFrS to apply this exemption and not restate business combinations prior to the transition date.
Property, Plant and Equipment (Capital assets)
an elective exemption exists whereby an entity may elect to revalue, as the new cost basis for property, plant and equipment, its fair value at the date of transition. the exemption can be applied on an asset-by-asset basis.
Newalta has chosen not to take this election to revalue any of its assets at transition date, and will continue to measure its property, plant and equipment at historical cost.
Share-Based Payments an entity may elect not to apply IFrS 2, “Share-based Payments” to equity instruments granted on or before November 7, 2002, or which vested prior to transition to IFrS, and may also elect not to apply IFrS 2 to liabilities arising from share-based payment transactions which settled before the date of transition to IFrS.
Newalta has elected, on transition to IFrS, to take this exemption and not apply IFrS 2 to equity instruments and liabilities as described above.
Decommissioning liabilities (asset retirement Obligations)
In accounting for changes in obligations to dismantle, remove and restore items of property, plant and equipment, IFrS guidance requires changes in such obligations to be added to or deducted from the cost of the asset to which it relates. the adjusted depreciable amount of the asset is then depreciated prospectively over its remaining useful life. rather than recalculating the effect of all such changes throughout the life of the obligation, an entity may elect to measure the liability and the related depreciation effects at the date of transition to IFrS.
Newalta has elected to measure any decommissioning liabilities and the related depreciation effects at the date of transition to IFrS.
Newalta46
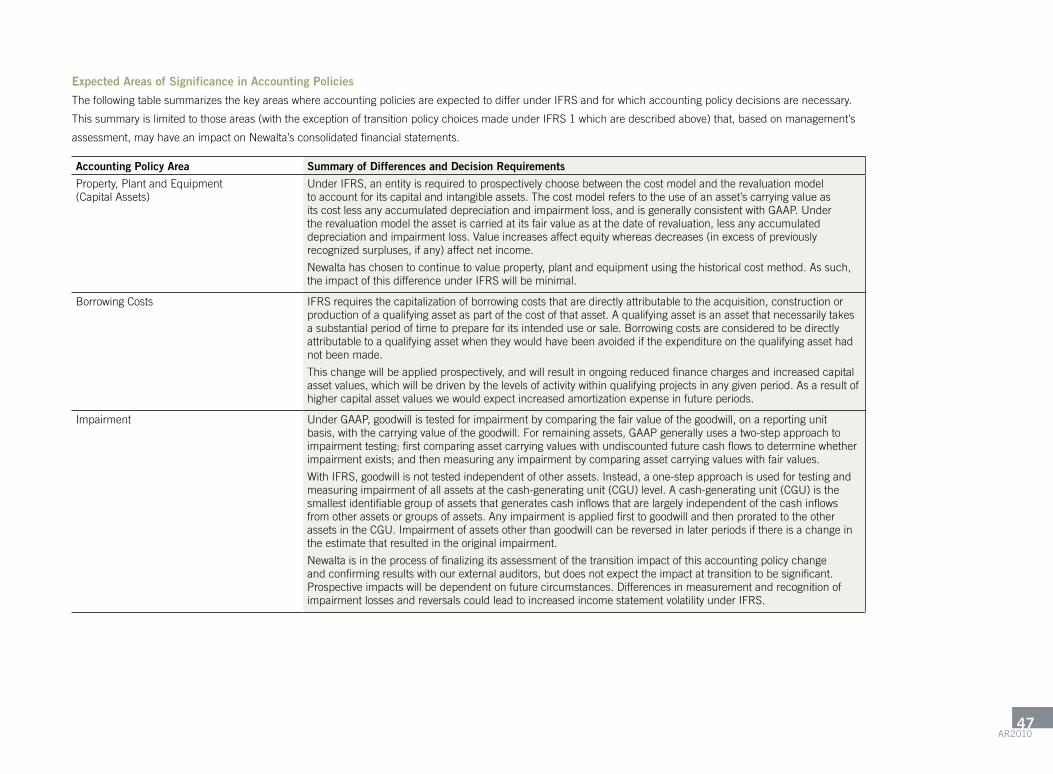
Expected Areas of Significance in Accounting Policies
the following table summarizes the key areas where accounting policies are expected to differ under IFrS and for which accounting policy decisions are necessary.
this summary is limited to those areas (with the exception of transition policy choices made under IFrS 1 which are described above) that, based on management’s
assessment, may have an impact on Newalta’s consolidated financial statements.
Accounting Policy Area Summary of Differences and Decision Requirements
Property, Plant and Equipment (Capital assets)
under IFrS, an entity is required to prospectively choose between the cost model and the revaluation model to account for its capital and intangible assets. the cost model refers to the use of an asset’s carrying value as its cost less any accumulated depreciation and impairment loss, and is generally consistent with GaaP. under the revaluation model the asset is carried at its fair value as at the date of revaluation, less any accumulated depreciation and impairment loss. Value increases affect equity whereas decreases (in excess of previously recognized surpluses, if any) affect net income.
Newalta has chosen to continue to value property, plant and equipment using the historical cost method. as such, the impact of this difference under IFrS will be minimal.
Borrowing Costs IFrS requires the capitalization of borrowing costs that are directly attributable to the acquisition, construction or production of a qualifying asset as part of the cost of that asset. a qualifying asset is an asset that necessarily takes a substantial period of time to prepare for its intended use or sale. Borrowing costs are considered to be directly attributable to a qualifying asset when they would have been avoided if the expenditure on the qualifying asset had not been made.
this change will be applied prospectively, and will result in ongoing reduced finance charges and increased capital asset values, which will be driven by the levels of activity within qualifying projects in any given period. as a result of higher capital asset values we would expect increased amortization expense in future periods.
Impairment under GaaP, goodwill is tested for impairment by comparing the fair value of the goodwill, on a reporting unit basis, with the carrying value of the goodwill. For remaining assets, GaaP generally uses a two-step approach to impairment testing: first comparing asset carrying values with undiscounted future cash flows to determine whether impairmentexists;andthenmeasuringanyimpairmentbycomparingassetcarryingvalueswithfairvalues.
With IFrS, goodwill is not tested independent of other assets. Instead, a one-step approach is used for testing and measuring impairment of all assets at the cash-generating unit (CGu) level. a cash-generating unit (CGu) is the smallest identifiable group of assets that generates cash inflows that are largely independent of the cash inflows from other assets or groups of assets. any impairment is applied first to goodwill and then prorated to the other assets in the CGu. Impairment of assets other than goodwill can be reversed in later periods if there is a change in the estimate that resulted in the original impairment.
Newalta is in the process of finalizing its assessment of the transition impact of this accounting policy change and confirming results with our external auditors, but does not expect the impact at transition to be significant. Prospective impacts will be dependent on future circumstances. Differences in measurement and recognition of impairment losses and reversals could lead to increased income statement volatility under IFrS.
aR201047

Accounting Policy Area Summary of Differences and Decision Requirements
Provisions including Decommissioning liabilities (asset retirement Obligations) and Constructive Obligations
IFrS requires a provision to be recognized when: there is a present obligation as a result of a past transaction or event;itisprobablethatanoutflowofresourceswillberequiredtosettletheobligation;andareliableestimatecanbe made of the obligation. “Probable” in this context means more likely than not. under GaaP, the criterion for recognition in the financial statement is “likely”, which is a higher threshold than “probable”. therefore it is possible that there may be some contingent liabilities which would meet the criteria for recognition under IFrS that would not have been recognized under GaaP.
Other differences between IFrS and GaaP exist in relation to the measurement of provisions, such as the methodology for determining the best estimate where there is a range of equally possible outcomes (IFrS uses the mid-point of the range, whereas GaaP uses the low end of the range), and the requirement under IFrS for provisions to be discounted where material.
In measuring the Decommissioning liability, the IFrS requirement is based on management’s best estimate of cash flows discounted to present value using a discount rate which is based on the risks specific to the liability (unless those risks have been built into the cash flow estimates). GaaP uses fair value of the obligation and cash flows discounted using a credit adjusted risk-free rate to discount cash flow estimates.
under IFrS, Newalta’s cash flow assumptions incorporate liability-specific risks and so a risk-free discount rate is used to determine the Decommissioning liability. use of this lower discount rate (risk free under IFrS versus credit adjusted under Canadian GaaP) will drive an increase to the Decommissioning liability and a lesser increase to Capital assets, with an offsetting decrease to retained Earnings. Prospectively, we will see an increase to finance charges and amortization. the assessment of the transition and ongoing impact of this accounting policy change is in the process of being finalized and confirmed with our external auditors.
Share-Based Payments under GaaP, cash settled transactions and transactions containing settlement alternatives are measured and re-measured at each reporting date using the intrinsic value method. IFrS requires initial and subsequent measurement of fair value by applying an option pricing model. the difference will impact the accounting measurement of awards of share appreciation rights and options granted under Newalta’s option plans adopted in 2006 and 2008.
Newalta is in the process of finalizing its assessment of the transition impact of this accounting policy change. Due to the change in valuation methodology, management expects that there will be an increase to Other long-term liabilities with a corresponding decrease to retained earnings on transition, but does not expect the impact to be significant. Future differences between the fair value and intrinsic value of outstanding Sars and options plans will result in different share-based liability and expense measurements under IFrS and GaaP.
Income taxes IFrS requires that deferred tax assets and liabilities must be classified as non-current in the statement of financial position. under GaaP, future income taxes are classified as current and non-current based on the classification of the underlying assets or liabilities to which they relate, or, if there is no underlying recognized asset or liability, based on the expected reversal of the temporary difference.
GaaP, like IFrS, current tax represents the amount of income taxes payable (recoverable) based on taxable profit (tax loss) for the period and is measured based on tax rates and laws that are enacted or substantively enacted at the reporting date. However, the interpretation of “substantively enacted” under GaaP may differ from IFrS.
Newalta is in the process of finalizing its assessment of the impact of this accounting policy change and confirming it with our auditors. the impact at transition and for future periods is not expected to be significant.
Newalta48
the above list and related summaries should not be regarded as a complete list of changes that will result from transition to IFrS. It is intended to highlight those
areas we believe to be most significant based on our assessments at this time. However, several of our assessments of the impacts of certain differences remain in
process and will be finalized during the first quarter of 2011. Moreover, until our first full set of financial statements under IFrS has been prepared, management will
not be able to determine or precisely quantify all of the impacts that will result from converting to IFrS.
there are significant ongoing International accounting Standards Board (“IaSB”) projects that could affect the ultimate differences between GaaP and IFrS and their
impact on Newalta’s consolidated financial statements in future years. In particular, there may be additional new or revised IFrS standards in relation to income taxes,
liabilities, leases, related party disclosures, and financial instruments. We have processes in place to ensure that such potential changes are monitored and evaluated.
the future impacts of IFrS will also depend on the particular circumstances prevailing in those years. the differences described are those existing based on GaaP
and IFrS as of February 24, 2011.
Business RisksOur business is subject to certain risks and uncertainties. Prior to making any investment decision regarding Newalta, investors should carefully consider, among other
things, the risks described herein (including the risks and uncertainties listed on the front page of this MD&a and throughout this MD&a) and the risk factors set forth
in the most recently filed annual Information Form of Newalta which are incorporated by reference herein.
the annual Information Form is available through the internet on the Canadian System for Electronic Document analysis and retrieval (“SEDar”) which can be
accessed at www.sedar.com. Copies of the annual Information Form may be obtained, on request without charge, from Newalta Corporation at 211 – 11th avenue S.W.,
Calgary, alberta t2r 0C6, or by facsimile at (403) 806-7032.
Financial And Other Instrumentsthe carrying values of accounts receivable and accounts payable approximate the fair value of these financial instruments due to their short-term maturities. Our
creditriskfromourcustomersismitigatedbyourbroadcustomerbaseanddiverseproductlines.Ourtop20customersgenerateapproximately40%ofourtotal
revenue,with20%ofthesecustomershavingacreditratingofAorhigherand70%ofthesecustomershavingratingsofBBBorhigher.Inthenormalcourseof
operations, we are exposed to movements in u.S. dollar exchange rates relative to the Canadian dollar. the foreign exchange risk arises primarily from u.S. dollar
denominated long-term debt and working capital. We have not entered into any financial derivatives to manage the risk for the foreign currency exposure as at
December 31, 2010. In Q4 2010, our exposure to foreign exchange was mitigated by the rise in commodity prices, as well as our u.S. dollar denominated long-term
debt, which served as a natural hedge, reducing our balance sheet exposure.
aR201049

the floating interest rate profile of our long-term debt exposes us to interest rate risk. We do not use hedging instruments to mitigate this risk. the carrying value of the
long-term debt approximates fair value due to its floating interest rates. For further information regarding our financial and other instruments, please refer to Note 20
to the consolidated financial statements for the three and twelve months ended December 31, 2010.
In January 2010, we invested $4 million in shares and warrants in BioteQ Environmental technologies Inc. the portion of the investment allocated to shares has
been classified as available for sale and the portion of the investment allocated to warrants is a derivative accounted for much like held-for-trading investments. the
investment is re-valued each quarter. the unrealized gain or loss on the shares is reflected on the Statements of Comprehensive Income and accumulated Other
Comprehensive Income, whereas the unrealized gain or loss for warrants is reflected on the Consolidated Statement of Operations under Finance charges.
Disclosure Controls And Procedures And Internal Control Over Financial Reportingthe Chief Executive Officer and the Chief Financial Officer (collectively the “Certifying Officers”) have evaluated the design and effectiveness of our disclosure controls
and procedures as of December 31, 2010, and have concluded that such disclosure controls and procedures were effective. In addition, the Certifying Officers have
evaluated the design and effectiveness of our internal control over financial reporting as of December 31, 2010, and have concluded that such internal controls over
financial reporting were effective. there have not been any changes in the internal control over financial reporting in Q4 of 2010 that have materially affected, or are
reasonably likely to materially affect, our internal control over financial reporting.
Additional Informationadditional information relating to Newalta, including the annual Information Form, is available through the internet on the Canadian SEDar, which can be accessed
at www.sedar.com. Copies of the annual Information Form of Newalta may be obtained from Newalta Corporation on the internet at www.newalta.com, by mail at
211 – 11th avenue S.W., Calgary, alberta t2r 0C6, or by facsimile at (403) 806-7032.
Newalta50
Management Report
Management is responsible for the preparation of the consolidated financial statements in accordance with Canadian generally accepted accounting principles,
and for the consistency therewith of all other financial and operating data presented in this annual report.
Management maintains a system of internal controls to provide reasonable assurance that all assets are safeguarded, and to facilitate the preparation of relevant,
reliable and timely financial and management information.
External auditors appointed by the shareholders have examined the consolidated financial statements. the audit Committee, consisting of three non-management
directors, has reviewed these statements with management and the auditors, and has reported to the Board of Directors. the Board has approved the consolidated
financial statements.
Michael A. Borys
Senior Vice President and Chief Financial Officer
March 3, 2011
aR201051
Independent Auditors’ Report
To the Shareholders of Newalta Corporation
We have audited the accompanying consolidated financial statements of Newalta Corporation, which comprise the consolidated balance sheets as at
December 31, 2010 and 2009, and the consolidated statements of operations and retained earnings (deficit) and consolidated statements of comprehensive
income and accumulated other comprehensive income and cash flows for the years then ended, and a summary of significant accounting policies and other
explanatory information.
Management’s Responsibility for the Consolidated Financial Statements
Management is responsible for the preparation and fair presentation of these consolidated financial statements in accordance with Canadian generally accepted
accounting principles, and for such internal control as management determines is necessary to enable the preparation of consolidated financial statements that
are free from material misstatement, whether due to fraud or error.
Auditors’ Responsibility
Our responsibility is to express an opinion on these consolidated financial statements based on our audits. We conducted our audits in accordance with Canadian
generally accepted auditing standards. those standards require that we comply with ethical requirements and plan and perform the audit to obtain reasonable
assurance about whether the consolidated financial statements are free from material misstatement.
an audit involves performing procedures to obtain audit evidence about the amounts and disclosures in the consolidated financial statements. the procedures
selected depend on the auditor’s judgment, including the assessment of the risks of material misstatement of the consolidated financial statements, whether due to
fraud or error. In making those risk assessments, the auditor considers internal control relevant to the entity’s preparation and fair presentation of the consolidated
financial statements in order to design audit procedures that are appropriate in the circumstances, but not for the purpose of expressing an opinion on the
effectiveness of the entity’s internal control. an audit also includes evaluating the appropriateness of accounting policies used and the reasonableness of accounting
estimates made by management, as well as evaluating the overall presentation of the consolidated financial statements.
We believe that the audit evidence we have obtained in our audits is sufficient and appropriate to provide a basis for our audit opinion.
Opinion
In our opinion, the consolidated financial statements present fairly, in all material respects, the financial position of Newalta Corporation as at December 31, 2010 and
2009 and the results of its operations and its cash flows for the years then ended in accordance with Canadian generally accepted accounting principles.
Deloitte & Touche LLP
Chartered accountants
Calgary, alberta
March 3, 2011Newalta52

Consolidated Balance Sheets($000s) December 31, 2010 December 31, 2009
AssetsCurrent assets
accounts receivable 102,378 84,317
Inventories (Note 4) 26,645 33,148
Investment (Note 5) 4,274 -
Prepaid expenses and other 7,292 6,183
140,589 123,648
Note receivable (Note 6) 890 978
Capital assets (Note 7) 722,840 701,884
Permits and other intangible assets (Note 8) 60,579 61,935
Goodwill 102,897 103,597
Future income taxes (Note 13) 929 1,688
1,028,724 993,730
LiabilitiesCurrent liabilities
accounts payable and accrued liabilities 118,218 90,191
Dividends payable (Note 17) 3,152 2,423
121,370 92,614
Senior secured debt (Note 9) 51,689 188,123
Convertible debentures – debt portion (Note 10) 112,073 110,708
Senior unsecured debentures (Note 11) 122,050 -
Other long-term liabilities (Note 12) 5,063 1,218
Future income taxes (Note 13) 47,183 39,164
asset retirement obligations (Note 14) 21,700 21,903
481,128 453,730
Shareholders’ Equity (Notes 15 and 17)
Shareholders’ capital 552,969 552,871
Convertible debentures – equity portion 1,850 1,850
Contributed surplus 1,679 1,679
retained earnings (deficit) (9,489) (16,400)
accumulated other comprehensive income 587 -
547,596 540,000
1,028,724 993,730
R.H. (Dick) Pinder
Director
Barry D. Stewart
Director
approved by the Board
aR201053

Consolidated Statements of Operations and Retained Earnings (Deficit)
($000s except earnings per share data) For the year ended December 31,
2010 2009
revenue 576,196 483,401
Expenses
Operating (Note 4) 394,317 347,348
Selling, general and administrative 70,891 56,132
research and development 1,713 -
Finance charges 25,663 25,364
amortization and accretion (Notes 7 and 14) 55,990 51,825
548,574 480,669
Earnings before taxes 27,622 2,732
Provision for (recovery of) income taxes (Note 13)
Current 938 945
Future 8,621 (1,312)
9,559 (367)
Net earnings 18,063 3,099
retained earnings (deficit), beginning of year (16,400) (11,358)
Dividends (Note 17) (11,152) (8,141)
retained earnings (deficit), end of year (9,489) (16,400)
Net earnings per share (Note 16) 0.37 0.07
Diluted earnings per share (Note 16) 0.37 0.07
Newalta54
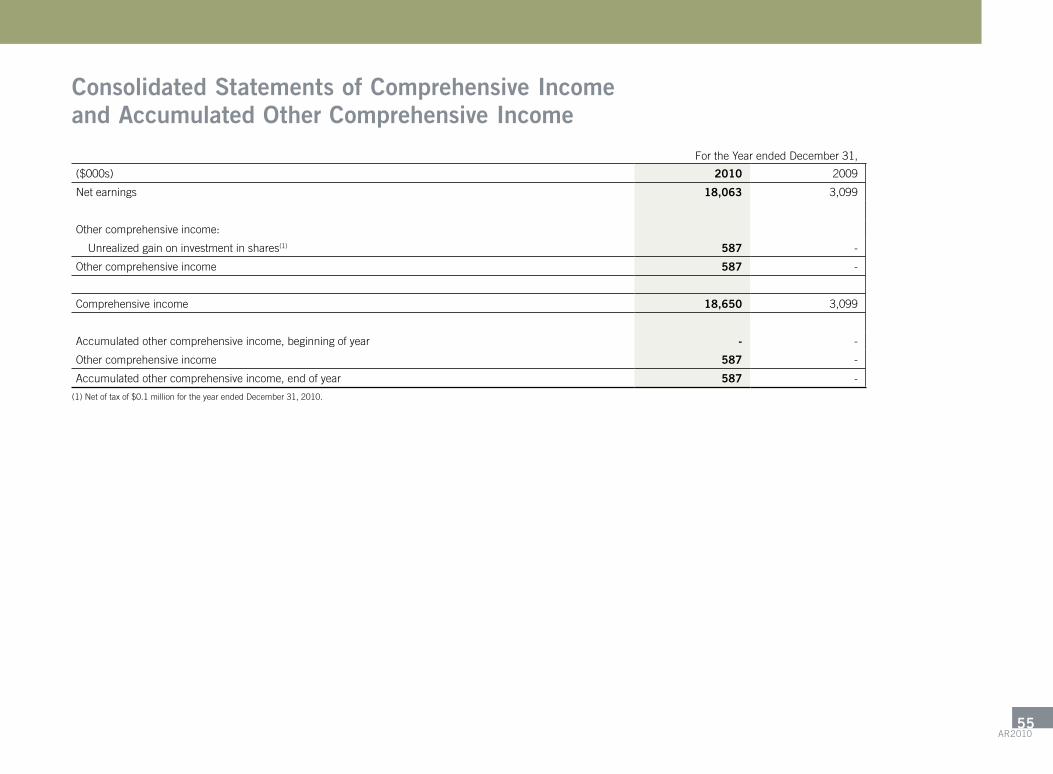
Consolidated Statements of Comprehensive Income and Accumulated Other Comprehensive Income
For the year ended December 31,
($000s) 2010 2009
Net earnings 18,063 3,099
Other comprehensive income:
unrealized gain on investment in shares(1) 587 -
Other comprehensive income 587 -
Comprehensive income 18,650 3,099
accumulated other comprehensive income, beginning of year - -
Other comprehensive income 587 -
accumulated other comprehensive income, end of year 587 -
(1) Net of tax of $0.1 million for the year ended December 31, 2010.
aR201055
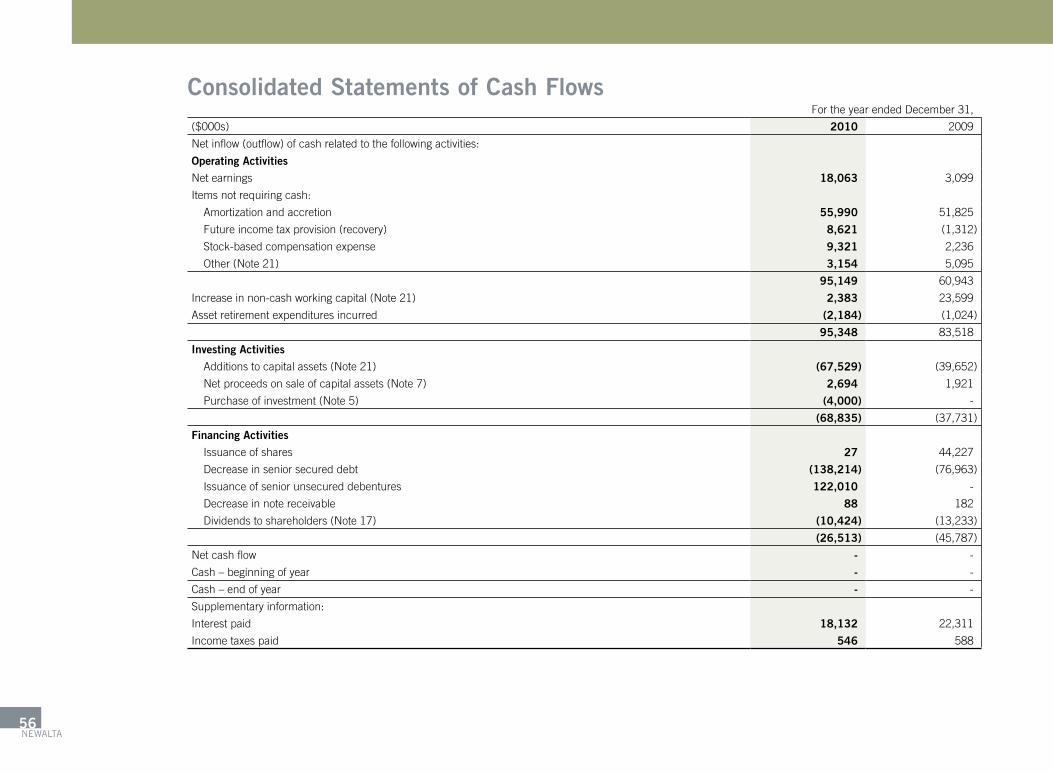
Consolidated Statements of Cash FlowsFor the year ended December 31,
($000s) 2010 2009
Net inflow (outflow) of cash related to the following activities:
Operating ActivitiesNet earnings 18,063 3,099
Items not requiring cash:
amortization and accretion 55,990 51,825
Future income tax provision (recovery) 8,621 (1,312)
Stock-based compensation expense 9,321 2,236
Other (Note 21) 3,154 5,095
95,149 60,943
Increase in non-cash working capital (Note 21) 2,383 23,599
asset retirement expenditures incurred (2,184) (1,024)
95,348 83,518
Investing Activities additions to capital assets (Note 21) (67,529) (39,652)
Net proceeds on sale of capital assets (Note 7) 2,694 1,921
Purchase of investment (Note 5) (4,000) -
(68,835) (37,731)
Financing Activities Issuance of shares 27 44,227
Decrease in senior secured debt (138,214) (76,963)
Issuance of senior unsecured debentures 122,010 -
Decrease in note receivable 88 182
Dividends to shareholders (Note 17) (10,424) (13,233)
(26,513) (45,787)
Net cash flow - -
Cash – beginning of year - -
Cash – end of year - -
Supplementary information:
Interest paid 18,132 22,311
Income taxes paid 546 588
Newalta56

Notes to the Consolidated Financial StatementsFor the years ended December 31, 2010 and 2009
(all tabular data in $000s except per share and ratio data)
Note 1. Corporate StructureNewalta Corporation (the “Corporation” or “Newalta”) was incorporated on October 29, 2008, pursuant to the laws of the Province of alberta. Newalta completed
an internal reorganization resulting in a name change from Newalta Inc. to Newalta Corporation effective January 1, 2010. Newalta provides cost-effective solutions
to industrial customers to improve their environmental performance with a focus on recycling and recovery of products from industrial residues. these services are
provided both through our network of more than 80 facilities across Canada and at our customers’ facilities where we mobilize our equipment and people to process
material directly onsite. Our customers operate in a broad range of industries including the oil and gas, petrochemical, refining, lead, manufacturing and mining
industries.
Note 2. Basis Of Presentationthe consolidated financial statements include the accounts of Newalta and its wholly-owned subsidiaries. the consolidated financial statements have been prepared
by management in accordance with Canadian generally accepted accounting principles (“GaaP”) and include the following significant accounting policies:
a) Cash and cash equivalents
Cash is defined as cash and short-term deposits with maturities of three months or less, when purchased.
b) Inventory
Inventory is comprised of oil, lead and other recycled products, spare parts and supplies, and is recorded at the lower of cost and net realizable value. Cost of finished
goods includes the laid down cost of materials plus the cost of direct labour applied to the product and the applicable share of overhead expense. Cost of other items
of inventory comprises the laid down cost.
c) Capital and intangible assets
Capital and intangible assets are stated at cost, less accumulated amortization. amortization rates are calculated to amortize the costs, net of salvage value, over the
assets’estimatedusefullives.Plantandequipmentisprincipallydepreciatedatratesof5-10%ofthedecliningbalance(buildings,siteimprovements,tanksand
mobile equipment) or from 5-14 years straight line (vehicles, computer hardware and software and leasehold improvements), depending on the expected life of the
asset. Some equipment is depreciated based on utilization rates. the utilization rate is determined by dividing the cost of the asset (net of estimated salvage value) by
the estimated future hours of service.
aR201057
landfill assets represent the costs of landfill available space, including original acquisition cost, incurred landfill construction and development costs, including
gas collection systems installed during the operating life of the site, and capitalized landfill closure and post-closure costs. the cost of landfill assets, together with
projected landfill construction and development costs for permitted capacity, is amortized on a per-unit basis as landfill space is consumed. Management annually
updates landfill capacity estimates, based on survey information provided by independent engineers, and projected landfill construction and development costs.
the impact on annual amortization expense of changes in estimated capacity and construction costs is accounted for prospectively.
the carrying values of capital assets are reviewed at least annually to determine if the value of any asset is impaired. any amount so determined is written off in the
year of impairment. as at December 31, 2010, there was no impairment in the value of capital assets.
Intangible assets consist of certain production processes, trademarks, permits and agreements, which are amortized over the period of the contractual benefit of
8 to 20 years, straight line. Certain permits are deemed to have indefinite lives and therefore are not amortized. there are nominal fees to renew these permits
provided that Newalta remains in good standing with regulatory authorities.
the carrying values of both definite and indefinite life intangibles are reviewed at least annually whereby management reviews any changes in the regulatory
environment that could cause impairment in the value ascribed to these permits. any amount so determined is written off in the year of impairment. as at December
31, 2010, there was no impairment in the value of these permits.
d) Goodwill
Goodwill represents the excess of the purchase price over the fair value of the net identifiable assets of acquired businesses. Newalta, at least annually, on September 30,
assesses goodwill and its potential impairment, on a reporting unit basis by determining whether the balance of goodwill can be recovered through the estimated
discounted operating cash flows of each reporting unit over their remaining lives. Management’s determination as at September 30, 2010 and December 31, 2010
was that goodwill was not impaired.
e) Asset retirement obligations
Newalta provides for estimated future asset retirement costs for all its facilities based on the useful lives of the assets and the long-term commitments of certain sites
(20 to 300 years). Over this period, Newalta recognizes the liability for the future retirement obligations associated with capital assets. these obligations are initially
measured at fair value, which is the discounted future value of the liability. this fair value is capitalized as part of the cost of the related asset and amortized to
expense over the asset’s useful life. the balance of the liability accretes until the date of expected settlement of the retirement obligations. the accretion expense has
been included in amortization and accretion expense. asset retirement costs are estimated by management, in consultation with Newalta’s engineers, on the basis of
current regulations, costs, technology and industry standards. actual asset retirement costs are charged against the provision as incurred.
Newalta58

f) Revenue recognition
revenues are recognized in the period products are delivered or services provided and when collection is reasonably assured.
the major sources of revenue relate to the processing of waste material and the sale of recycled products recovered from the waste. revenue is recognized when
waste material is received and a liability is assumed for the waste. revenue on recycled products is recognized when products are delivered to customers or pipelines.
For construction projects and well abandonment work, revenue is recognized on a percentage of completion basis. For onsite projects, revenue is recognized on a
per-day fee basis.
g) Research and development
research and development costs are incurred in the design, testing and commercialization of Newalta’s products and services. research costs, other than capital
expenditures, are expensed as incurred. the costs incurred in developing new technologies are expensed as incurred unless they meet the criteria under Canadian
GaaP for deferral and amortization. these costs will be amortized over the estimated useful life of the product, commencing with commercial production. In the event
that a product program for which costs have been deferred is modified or cancelled, the Company will assess the recoverability of the deferred costs and if considered
unrecoverable, will expense the costs in the period the assessment is made. No development costs have been deferred to date.
h) Income taxes
Newalta and its wholly owned subsidiaries follow the liability method of accounting for income taxes. Future income tax assets and liabilities are measured based upon
temporary differences between the carrying values of assets and liabilities and their tax basis. Future income tax expense is computed based on the change during
the year in the future income tax assets and liabilities. Effects of changes in tax laws and tax rates are recognized when substantively enacted.
Income tax assets are also recognized for the benefits from tax losses and deductions with no accounting basis, provided those benefits are more likely than not to be
realized. Future income tax assets and liabilities are determined based on the tax laws and rates that are anticipated to apply in the period of estimated realization.
i) Earnings per share
Basic earnings per share is calculated using the weighted average number of shares outstanding during the year. Diluted earnings per share is calculated by adding
the weighted average number of shares outstanding during the year to the additional shares that would have been outstanding if potentially dilutive shares had been
issued, using the “treasury stock” method and the “if converted” method for the convertible debentures.
aR201059
j) Incentive plans
Newalta has three share-based compensation plans, the 2003 Option Plan (the “2003 Plan”), the 2006 Option Plan (the “2006 Plan”) and the 2008 Option Plan (the
“2008 Plan”). under the option plans, Newalta Corporation may grant to directors, officers, employees and consultants of Newalta Corporation or any of its affiliates,
rightstoacquireupto10%oftheissuedandoutstandingshares.NewaltaCorporationusesthefairvaluemethodtoaccountfortheoptionsgrantedpursuanttothe
2003 Plan and recognizes the share-based compensation expense over the vesting period of the options, with a corresponding increase to contributed surplus. When
options are exercised, the proceeds, together with the amount recorded in contributed surplus, are transferred to shareholders’ capital. Forfeitures are accounted for
as incurred.
the 2006 Plan and the 2008 Plan allow for individuals to settle their options in cash. accordingly, Newalta Corporation uses the intrinsic value method to account
for these options. the intrinsic value reflects the net liability, calculated as the difference between the market value of the shares and the exercise price of the option.
this is re-measured at each reporting date and stock-based compensation expense is increased or decreased accordingly. Decreases or reversals of stock-based
compensation expense are limited to previously recognized stock-based compensation expense.
Newalta may also grant stock appreciation rights (“Sars”) to directors, officers, employees and consultants of Newalta Corporation or any of its affiliates. Sars entitle
the holder thereof to receive cash from Newalta in an amount equal to the positive difference between the grant price and the trading price of our common shares on
the exercise date. the grant price is calculated based on the five-day volume weighted average trading price of our common shares on the tSX. Sars generally expire
five years after they have been granted and the vesting period is determined by the Board of Directors of Newalta. Newalta uses the intrinsic value method to account
for Sars. the intrinsic value reflects the net liability calculated as the difference between the market value of the shares and the exercise price of the Sar. this is re-
measured at each reporting date and stock-based compensation expense is increased or decreased accordingly. Decreases or reversals of stock-based compensation
expense are limited to previously recognized stock-based compensation expense.
Newalta has a deferred share unit (“DSu”) Plan, which is described in Note 12 d). DSus are settled in cash and are recorded as liabilities. the measurement of the
compensation expense and corresponding liability for these awards is based on the intrinsic value of the award, and is recorded as a charge to selling, general and
administrative (“SG&a”) expense over the vesting period of the award. at the end of each financial period, changes in Newalta’s payment obligation due to changes in
the market value of Newalta’s shares are recorded as a charge to SG&a expense. Dividend equivalent grants, if any, are recorded as a charge to SG&a expense in the
period the dividend is paid.
Newalta60

k) Financial instruments
Classification
all financial instruments are classified into one of five categories and are initially recognized at fair value and subsequently measured as noted in the table below.
Category Subsequent Measurement
Held-for-trading Fair value and changes in fair value are recognized in net earnings
Held-to-maturity amortized cost, using the effective interest method
loans and receivables amortized cost, using the effective interest method
available-for-sale financial assets Fair value and changes in fair value are recorded in other comprehensive income until the instrument is derecognized or impaired
Other financial liabilities amortized cost, using the effective interest method
accounts receivable and note receivable are classified as loans and receivables. the portion of the investment allocated to shares has been classified as available
for sale and the portion of the investment allocated to warrants is a derivative accounted for much like held-for-trading investments. Senior long-term debt, senior
unsecured debentures (“Senior unsecured Debentures”), convertible debentures (“Convertible Debentures”), accounts payable and accrued liabilities and dividends
payable are classified as other financial liabilities.
Convertible Debentures
Newalta presents outstanding Convertible Debentures in their debt and equity component parts on the consolidated balance sheets. the debt component represents
the total discounted present value of the semi-annual interest obligations to be satisfied by cash and the principal payment due at maturity, using the rate of interest
that would have been applicable to a non-convertible debt instrument of comparable term and risk at the date of issue. typically, this results in an accounting value
assigned to the debt component of the Convertible Debentures which is less than the principal amount due at maturity. the debt component presented on the
consolidated balance sheets increases over the term of the relevant debenture to the full face value of the outstanding debentures at maturity. the difference is
reflected as increased interest expense with the result that adjusted interest expense reflects the effective yield of the debt component of the Convertible Debentures.
the equity component of the Convertible Debentures is presented under Shareholders’ Equity on the consolidated balance sheets. the equity component represents
the value ascribed to the conversion right granted to the holder, which remains a fixed amount over the term of the related debenture. upon conversion of the
Convertible Debentures into shares by the holders, a proportionate amount of both the debt and equity components are transferred to Shareholders’ Capital. accretion
and interest expense for the Convertible Debentures are reflected as finance charges on the consolidated statements of operations, comprehensive income and
retained earnings (deficit).
Transaction Costs
transaction costs associated with other financial liabilities are netted against the related liability.
aR201061
l) Measurement uncertainty
the preparation of Newalta’s financial statements in a timely manner and in accordance with Canadian GaaP requires the use of estimates, assumptions and
judgment regarding assets, liabilities, revenue and expenses. Such estimates relate to unsettled transactions and events as of the date of the financial statements.
accordingly, actual results may differ from estimated amounts as transactions are settled in the future. amounts recorded for amortization, accretion, future asset
retirement obligations, future income taxes, the equity component of convertible debentures, valuation of warrants and impairment calculations are based on
estimates. By their nature, these estimates are subject to measurement uncertainty, and the impact of the difference between the actual and the estimated costs
on the financial statements of future periods could be material.
Note 3. Accounting ChangesIn February 2009, the Canadian accounting Standards Board (“acSB”) confirmed that Canadian publicly accountable enterprises would be required to adopt
International Financial reporting Standards (“IFrS”) for fiscal years beginning on or after January 1, 2011. IFrS uses a conceptual framework similar to GaaP,
but there are differences in recognition, measurement and disclosures.
Section 1582, Business Combinations. this new section will be applicable to business combinations for which the acquisition date is on or after interim and fiscal
periods beginning January 1, 2011, with prospective application. Early adoption is permitted. this section improves the relevance, reliability and comparability of the
information that a reporting entity provides in its financial statements about a business combination and its effects. the adoption of this new section would not have a
material impact on Newalta’s financial statements.
Section 1601, Consolidated Financial Statements. this new section will be applicable to financial statements relating to interim and fiscal periods beginning on or after
January 1, 2011, with prospective application. Early adoption is permitted. this section establishes standards for the preparation of consolidated financial statements.
the adoption of this new section would not have a material impact on Newalta’s financial statements.
Section 1602, Non-Controlling Interests. this new section will be applicable to financial statements relating to interim and fiscal periods beginning on or after
January 1, 2011, with prospective application. Early adoption is permitted. this section establishes standards for accounting for a non-controlling interest in a
subsidiary in consolidated financial statements subsequent to a business combination. the adoption of this new section would not have a material impact on
Newalta’s financial statements.
Newalta62
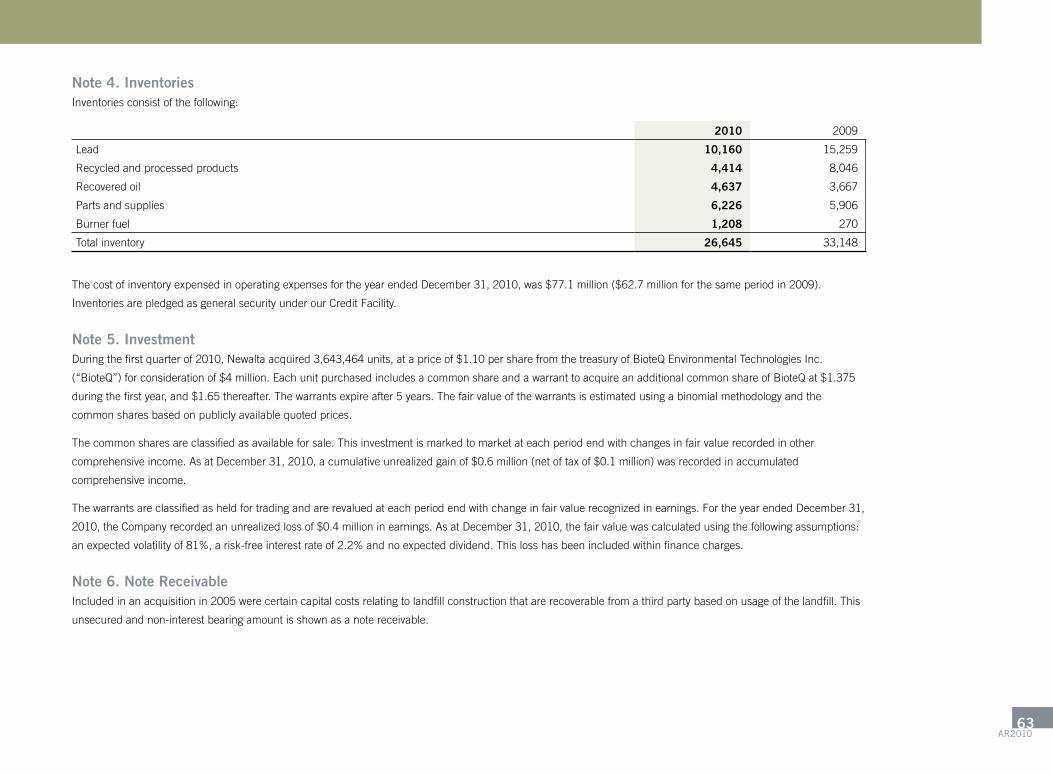
Note 4. InventoriesInventories consist of the following:
2010 2009
lead 10,160 15,259
recycled and processed products 4,414 8,046
recovered oil 4,637 3,667
Parts and supplies 6,226 5,906
Burner fuel 1,208 270
total inventory 26,645 33,148
the cost of inventory expensed in operating expenses for the year ended December 31, 2010, was $77.1 million ($62.7 million for the same period in 2009).
Inventories are pledged as general security under our Credit Facility.
Note 5. InvestmentDuring the first quarter of 2010, Newalta acquired 3,643,464 units, at a price of $1.10 per share from the treasury of BioteQ Environmental technologies Inc.
(“BioteQ”) for consideration of $4 million. Each unit purchased includes a common share and a warrant to acquire an additional common share of BioteQ at $1.375
during the first year, and $1.65 thereafter. the warrants expire after 5 years. the fair value of the warrants is estimated using a binomial methodology and the
common shares based on publicly available quoted prices.
the common shares are classified as available for sale. this investment is marked to market at each period end with changes in fair value recorded in other
comprehensive income. as at December 31, 2010, a cumulative unrealized gain of $0.6 million (net of tax of $0.1 million) was recorded in accumulated
comprehensive income.
the warrants are classified as held for trading and are revalued at each period end with change in fair value recognized in earnings. For the year ended December 31,
2010, the Company recorded an unrealized loss of $0.4 million in earnings. as at December 31, 2010, the fair value was calculated using the following assumptions:
anexpectedvolatilityof81%,arisk-freeinterestrateof2.2%andnoexpecteddividend.Thislosshasbeenincludedwithinfinancecharges.
Note 6. Note ReceivableIncluded in an acquisition in 2005 were certain capital costs relating to landfill construction that are recoverable from a third party based on usage of the landfill. this
unsecured and non-interest bearing amount is shown as a note receivable.
aR201063

Note 7. Capital Assetsa) Capital assets consist of the following:
2010 2009
CostAccumulatedAmortization Net Book Value Cost
accumulatedamortization Net Book Value
land 14,696 - 14,696 14,813 - 14,813
Plant and equipment 891,627 (254,338) 637,289 835,621 (213,991) 621,630
landfill 117,202 (46,347) 70,855 103,264 (37,823) 65,441
total 1,023,525 (300,685) 722,840 953,698 (251,814) 701,884
b) Disposal of capital assets
During the year ended December 31, 2010, Newalta disposed of certain land, transport vehicles, building assets and associated goodwill with a net book value of
$4.1 million for proceeds of $2.7 million. the resulting net loss of $1.4 million, including the disposal of goodwill having a carrying value of $0.7 million, is included in
amortization and accretion in the Consolidated Statements of Operations and retained Earnings (Deficit).
During the year ended December 31, 2009, Newalta disposed of certain transport vehicles, equipment, land and buildings with a net book value of $3.5 million for
proceeds of $1.9 million. the resulting net loss of $1.6 million is included in amortization and accretion in the Consolidated Statements of Operations, comprehensive
income and retained earnings (deficit).
Note 8. Permits And Other Intangible Assets2010 2009
CostAccumulatedAmortization Net Book Value Cost
accumulatedamortization Net Book Value
Indefinite permits 53,037 - 53,037 53,012 - 53,012
Definite life permits/rights 14,650 (7,108) 7,542 14,650 (6,338) 8,312
Non-competition contracts 6,020 (6,020) - 6,020 (5,409) 611
total 73,707 (13,128) 60,579 73,682 (11,747) 61,935
Note 9. Senior Secured DebtOn December 17, 2010, Newalta entered into an amended and restated extendible revolving credit facility (“Credit Facility”). the maturity of this Credit Facility is
December 17, 2013. at the election of Newalta, the principal borrowing amount was reduced from $350 million to $200 million. the Credit Facility is available to fund
growth capital expenditures and for general corporate purposes as well as to provide letters of credit to third parties for financial security up to a maximum amount of
$60.0million.Theaggregatedollaramountofoutstandinglettersofcreditisnotpresentedinthefinancialstatementsaslong-termdebt;however,theissuedletters
of credit reduce the amount available under the Credit Facility. Interest on the facilities is subject to certain conditions and may be charged at prime, u.S. base rate,
Bankers’ acceptance (“Ba”) or lIBOr, at the option of the Corporation. the Credit Facility bears interest at a market rate plus an increment (depending on certain
criteria) as follows:
Newalta64

Base Rate Type Range of Increment
Prime rate 1.00%to2.50%
u.S. Base rate 1.00%to2.50%
Ba rate 2.25%to3.75%
lIBOr 2.25%to3.75%
TheincrementalBAinterestrateasatDecember31,2010was2.5%(2009-4.5%).
the Credit Facility is secured by a fixed and floating charge debenture to the lenders on the assets of the Corporation and material subsidiaries, an unlimited
subsidiary guarantee from each material subsidiary of the Corporation and an assignment of insurance naming the lenders as first loss payee in relation to business
interruption, property and inventory insurance.
Newalta may, at its option, request an extension of the Credit Facility on an annual basis. If no request to extend the Credit Facility is made by Newalta, the entire
amount of the outstanding indebtedness would be due in full on December 17, 2013. the facility also requires Newalta to be in compliance with certain covenants.
at December 31, 2010, Newalta was in compliance with all covenants.
December 31, 2010 December 31, 2009
amount drawn on credit facility 54,028 191,280
Issue costs (2,339) (3,157)
Senior secured debt 51,689 188,123
Note 10. Convertible DebenturesIn November 2007, Newalta issued $115.0 million of convertible unsecured subordinated debentures. the Convertible Debentures have a maturity date of November
30,2012andbearinterestatarateof7.0%payablesemi-annuallyinarrearsonMay31andNovember30eachyearbeginningMay31,2008.Each$1,000
debenture is convertible into 43.4783 shares (or a conversion price of $23.00 per share) at any time at the option of the holders of the Convertible Debentures. as
subordinated debt, the issuance of the Convertible Debentures does not affect the borrowing capacity on the Credit Facility. On the consolidated balance sheets, the
Convertible Debentures are presented net of the costs to issue. the equity portion of the Convertible Debentures will be reclassified into Shareholders’ Capital as the
debentures are converted into shares.
the Convertible Debentures are redeemable by Newalta after November 30, 2010 and on or before November 30, 2011 if the current market price of the shares on
the notice date is greater than $28.75 and may be redeemed after November 30, 2011 for a redemption price of $1,000 per debenture with 30-60 days notice. the
obligation may be settled in cash or shares at the discretion of Newalta.
aR201065
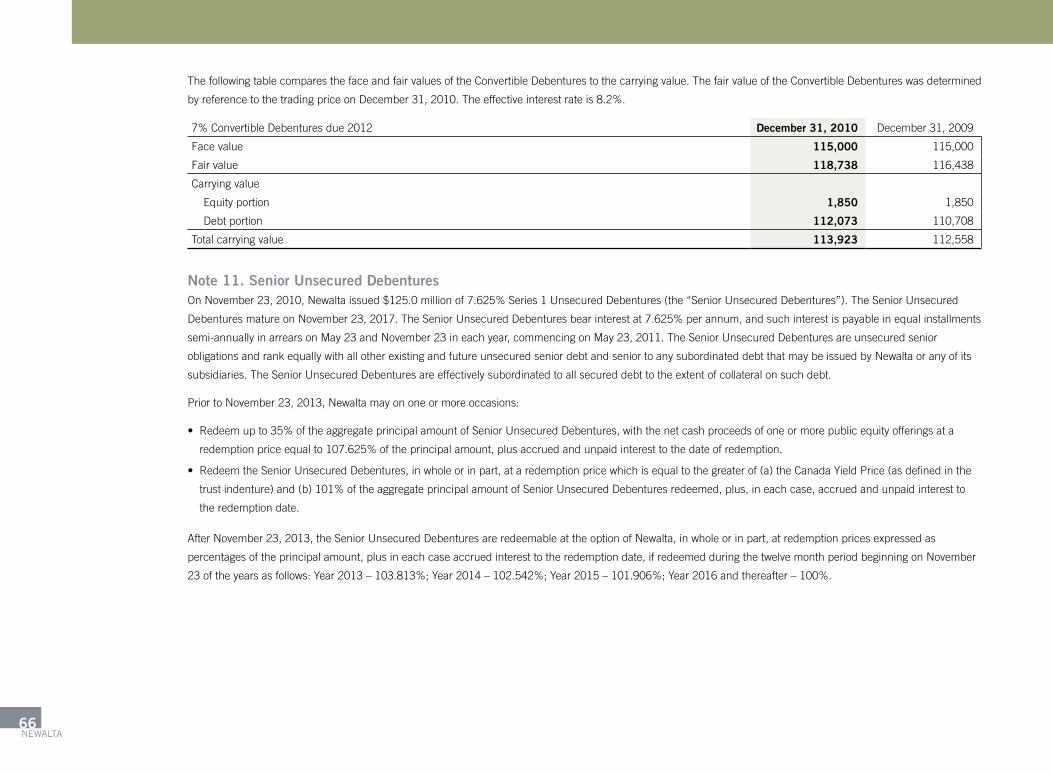
the following table compares the face and fair values of the Convertible Debentures to the carrying value. the fair value of the Convertible Debentures was determined
byreferencetothetradingpriceonDecember31,2010.Theeffectiveinterestrateis8.2%.
7%ConvertibleDebenturesdue2012 December 31, 2010 December 31, 2009
Face value 115,000 115,000
Fair value 118,738 116,438
Carrying value
Equity portion 1,850 1,850
Debt portion 112,073 110,708
total carrying value 113,923 112,558
Note 11. Senior Unsecured DebenturesOnNovember23,2010,Newaltaissued$125.0millionof7.625%Series1UnsecuredDebentures(the“SeniorUnsecuredDebentures”).TheSeniorUnsecured
DebenturesmatureonNovember23,2017.TheSeniorUnsecuredDebenturesbearinterestat7.625%perannum,andsuchinterestispayableinequalinstallments
semi-annually in arrears on May 23 and November 23 in each year, commencing on May 23, 2011. the Senior unsecured Debentures are unsecured senior
obligations and rank equally with all other existing and future unsecured senior debt and senior to any subordinated debt that may be issued by Newalta or any of its
subsidiaries. the Senior unsecured Debentures are effectively subordinated to all secured debt to the extent of collateral on such debt.
Prior to November 23, 2013, Newalta may on one or more occasions:
• Redeemupto35%oftheaggregateprincipalamountofSeniorUnsecuredDebentures,withthenetcashproceedsofoneormorepublicequityofferingsata
redemptionpriceequalto107.625%oftheprincipalamount,plusaccruedandunpaidinteresttothedateofredemption.
• RedeemtheSeniorUnsecuredDebentures,inwholeorinpart,ataredemptionpricewhichisequaltothegreaterof(a)theCanadaYieldPrice(asdefinedinthe
trustindenture)and(b)101%oftheaggregateprincipalamountofSeniorUnsecuredDebenturesredeemed,plus,ineachcase,accruedandunpaidinterestto
the redemption date.
after November 23, 2013, the Senior unsecured Debentures are redeemable at the option of Newalta, in whole or in part, at redemption prices expressed as
percentages of the principal amount, plus in each case accrued interest to the redemption date, if redeemed during the twelve month period beginning on November
23oftheyearsasfollows:Year2013–103.813%;Year2014–102.542%;Year2015–101.906%;Year2016andthereafter–100%.
Newalta66

If a change of control occurs, Newalta will be required to offer to purchase all or a portion of each debenture holder’s Senior unsecured Debentures, at a purchase
priceincashequalto101%oftheprincipalamountoftheSeniorUnsecuredDebenturesofferedforrepurchaseplusaccruedinteresttothedateofpurchase.
During the three and twelve months ended December 31, 2010, financing fees of $3.0 million were incurred in connection with the issuance of the Senior unsecured
Debentures. these fees have been recorded as deferred financing costs and are being amortized using the effective interest method over the term of the Senior
unsecured Debentures.
the trust indenture under which the Senior unsecured Debentures have been issued also requires Newalta to be in compliance with certain covenants on an annual
basis. at December 31, 2010, Newalta was in compliance with all covenants.
Note 12. Long-Term Incentive Plansa) The 2008 Option Plan
On January 4, 2010 a total of 842,500 options were granted to certain directors, officers and employees of the Corporation. the options were granted at the market
price of $8.07 per share. Each tranche of the options vest over a three-year period (with a five-year life), and the holder of the option can exercise the option for either
a share of Newalta or an amount of cash equal to the difference between the exercise price and the market price at the time of exercise. the options granted under
the 2008 Plan have therefore been accounted for as stock appreciation options and the total compensation expense for these options was $5.2 million for the year
ended December 31, 2010 ($1.2 million in 2009). During 2010, an aggregate of 45,000 options to acquire common shares were forfeited under the 2008 Option
Plan (nil in 2009).
b) The 2006 Option Plan
the options granted under the 2006 Plan have been accounted for as stock appreciation options and the total compensation expense for these options was nil for the
year ended December 31, 2010 (nil for 2009). During 2010, an aggregate of 10,000 options to acquire common shares were forfeited (nil in 2009). During 2009, an
aggregate of 1,565,000 options to acquire common shares were cancelled (nil in 2010).
c) The 2003 Option Plan
the options granted under the 2003 Plan have been accounted for as stock options and the total compensation expense for these options was nil for the year ended
December 31, 2010 (nil for 2009). During 2010, an aggregate of 12,500 options to acquire common shares were cancelled (245,050 in 2009).
aR201067
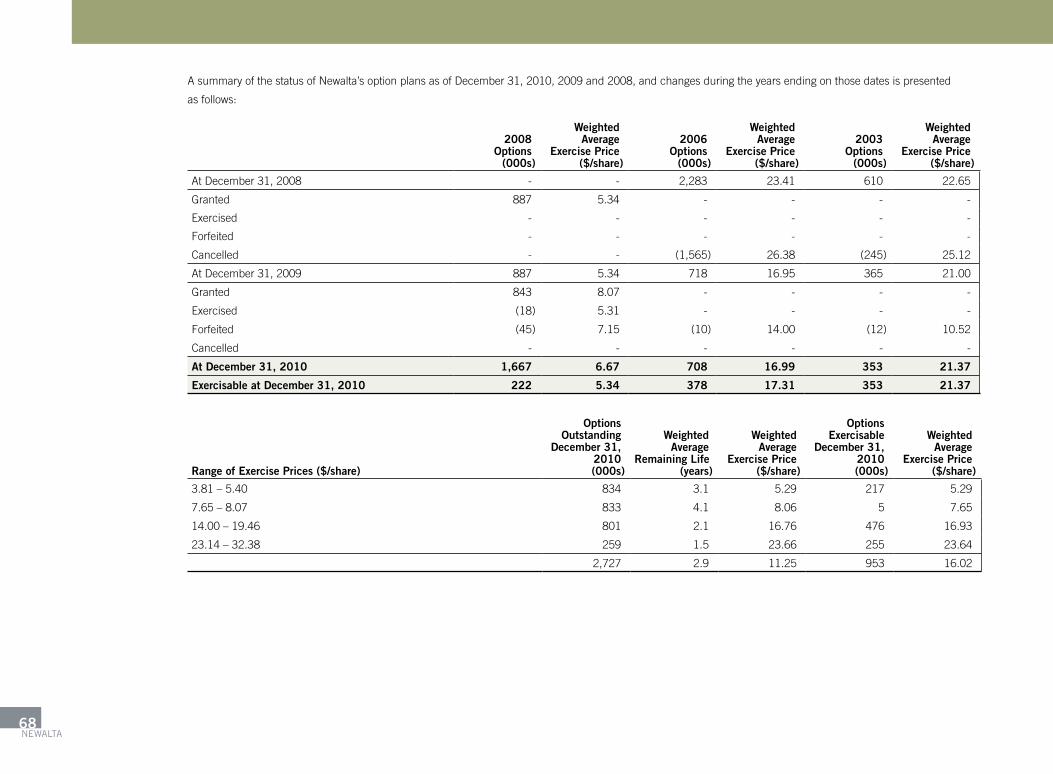
a summary of the status of Newalta’s option plans as of December 31, 2010, 2009 and 2008, and changes during the years ending on those dates is presented
as follows:
2008Options
(000s)
WeightedAverage
Exercise Price($/share)
2006Options
(000s)
WeightedAverage
Exercise Price($/share)
2003Options
(000s)
WeightedAverage
Exercise Price($/share)
at December 31, 2008 - - 2,283 23.41 610 22.65
Granted 887 5.34 - - - -
Exercised - - - - - -
Forfeited - - - - - -
Cancelled - - (1,565) 26.38 (245) 25.12
at December 31, 2009 887 5.34 718 16.95 365 21.00
Granted 843 8.07 - - - -
Exercised (18) 5.31 - - - -
Forfeited (45) 7.15 (10) 14.00 (12) 10.52
Cancelled - - - - - -
At December 31, 2010 1,667 6.67 708 16.99 353 21.37
Exercisable at December 31, 2010 222 5.34 378 17.31 353 21.37
Range of Exercise Prices ($/share)
OptionsOutstanding
December 31,2010(000s)
WeightedAverage
Remaining Life(years)
WeightedAverage
Exercise Price($/share)
OptionsExercisable
December 31,2010(000s)
WeightedAverage
Exercise Price($/share)
3.81 – 5.40 834 3.1 5.29 217 5.29
7.65 – 8.07 833 4.1 8.06 5 7.65
14.00 – 19.46 801 2.1 16.76 476 16.93
23.14 – 32.38 259 1.5 23.66 255 23.64
2,727 2.9 11.25 953 16.02
Newalta68

d) Share Appreciation Rights (SARs)
On January 4, 2010, 490,000 share appreciation rights were granted to certain employees of the Corporation at the market price of $8.07. On March 11, 2010,
40,000 share appreciation rights were granted to an Officer of the Corporation at the market price of $8.70. On august 16, 2010, 80,000 share appreciation rights
were granted to certain employees of the Corporation at the market price of $8.76. Each tranche of these rights vests over a three-year period (with a five-year life).
On March 11, 2010, the expiry date of 155,000 rights previously granted to an Officer, was amended such that the expiry date of such rights be five years from the
initial grant date.
the holder of a share appreciation right has the option to exercise the right for an amount of cash equal to the difference between the exercise price and the market
price at the time of exercise. the rights granted have been accounted for as stock appreciation rights. total compensation expense for these rights was $4.0 million
for the year ended December 31, 2010 ($1.1 million in 2009). During 2010, an aggregate of 22,500 rights were forfeited (61,375 in 2009).
a summary of the status of Newalta’s share appreciation rights plans as of December 31, 2010, 2009 and 2008, and changes during the years ending on those dates
is presented as follows:
SARs(000s)
Weighted AverageExercise Price
($/right)
at December 31, 2008 125 16.65
Granted 812 5.18
Exercised - -
Forfeited (61) 5.31
Cancelled - -
at December 31, 2009 876 6.99
Granted 610 8.20
Exercised (36) 5.31
Forfeited (23) 8.07
Cancelled - -
At December 31, 2010 1,427 7.53
Exercisable at December 31, 2010 307 9.96
aR201069
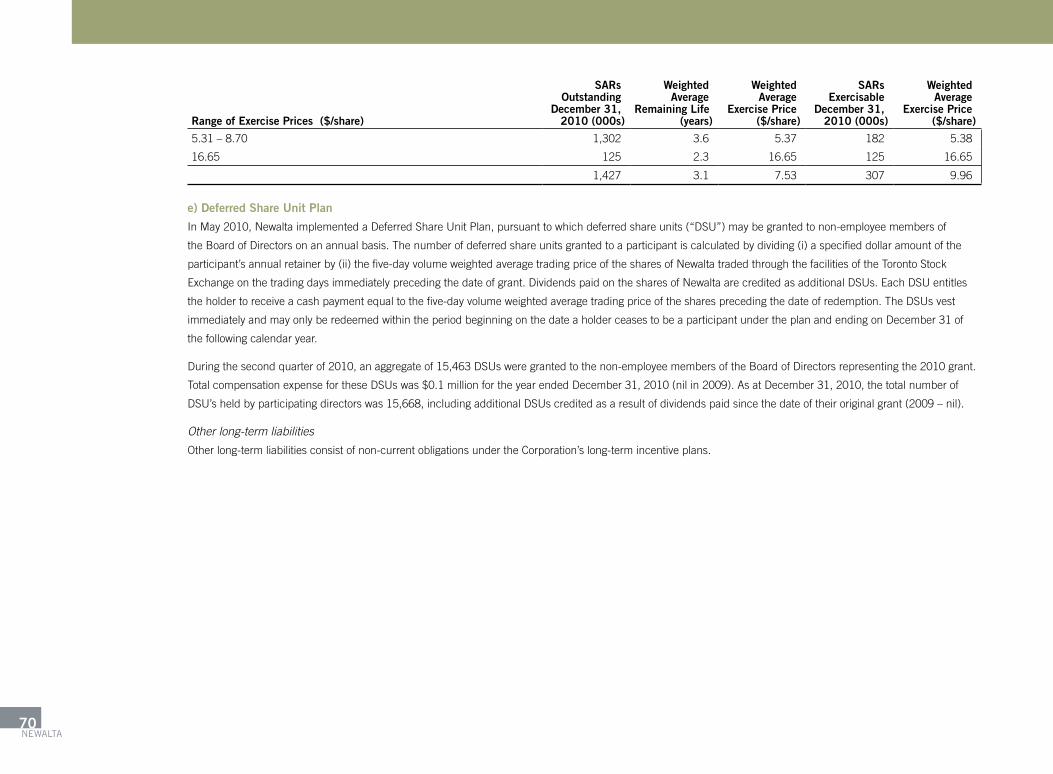
Range of Exercise Prices ($/share)
SARsOutstanding
December 31,2010 (000s)
WeightedAverage
Remaining Life(years)
WeightedAverage
Exercise Price($/share)
SARsExercisable
December 31,2010 (000s)
WeightedAverage
Exercise Price($/share)
5.31 – 8.70 1,302 3.6 5.37 182 5.38
16.65 125 2.3 16.65 125 16.65
1,427 3.1 7.53 307 9.96
e) Deferred Share Unit Plan
In May 2010, Newalta implemented a Deferred Share unit Plan, pursuant to which deferred share units (“DSu”) may be granted to non-employee members of
the Board of Directors on an annual basis. the number of deferred share units granted to a participant is calculated by dividing (i) a specified dollar amount of the
participant’s annual retainer by (ii) the five-day volume weighted average trading price of the shares of Newalta traded through the facilities of the toronto Stock
Exchange on the trading days immediately preceding the date of grant. Dividends paid on the shares of Newalta are credited as additional DSus. Each DSu entitles
the holder to receive a cash payment equal to the five-day volume weighted average trading price of the shares preceding the date of redemption. the DSus vest
immediately and may only be redeemed within the period beginning on the date a holder ceases to be a participant under the plan and ending on December 31 of
the following calendar year.
During the second quarter of 2010, an aggregate of 15,463 DSus were granted to the non-employee members of the Board of Directors representing the 2010 grant.
total compensation expense for these DSus was $0.1 million for the year ended December 31, 2010 (nil in 2009). as at December 31, 2010, the total number of
DSu’s held by participating directors was 15,668, including additional DSus credited as a result of dividends paid since the date of their original grant (2009 – nil).
Other long-term liabilities
Other long-term liabilities consist of non-current obligations under the Corporation’s long-term incentive plans.
Newalta70

Note 13. Income TaxFuture income taxes reflect the net tax effects of temporary differences between the carrying amounts of assets and liabilities for financial reporting purposes and the
amounts used for income tax purposes. Significant components of the Corporation’s future income tax liabilities and assets are as follows:
Canadian Tax Jurisdiction:
2010 2009
Future income tax liabilities:
Capital assets 95,003 91,858
Intangible assets 11,799 11,946
Deferred financing costs 2,024 1,902
108,826 105,706
Future income tax assets:
Non-capital loss carry forwards 44,056 46,502
Goodwill 5,448 6,557
asset retirement obligation 5,542 5,594
Equity issuance costs 2,332 3,023
Deferred revenue 941 2,362
Deferred expense 3,282 1,930
Other – donations, allowance for doubtful accounts 42 574
61,643 66,542
Net future income tax liability 47,183 39,164
U.S. Tax Jurisdiction:
2010 2009
Future income tax assets:
Non-capital loss carry forwards 929 1,688
Net future income tax asset from u.S. operations 929 1,688
aR201071

Non-capital loss carry forwards relating to Canadian operations total $175.9 million and relating to our u.S. operations total $2.6 million. these losses will begin
expiring in 2026.
the income tax expense differs from the amount computed by applying Canadian statutory rates to operating income for the following reasons:
2010 2009
Consolidated earnings of Newalta Corporation before taxes and distributions to shareholders 27,622 2,732
Current statutory income tax rate 29.13% 30.45%
Computed tax expense at statutory rate 8,046 832
Increase (decrease) in taxes resulting from:
Capital taxes 509 945
Non-deductible costs 1,796 592
Other (791) (2,736)
reported income tax expense (recovery) 9,560 (367)
Note 14. Asset Retirement Obligationsthe total future asset retirement obligations were estimated by management based on the anticipated costs to abandon and reclaim facilities and wells, and
the projected timing of these expenditures. the net present value of this amount, $21.7 million ($21.9 million at December 31, 2009) has been accrued on the
consolidated balance sheets at December 31, 2010. the total estimated future cost for asset retirement obligations at December 31, 2010 was $9.7 billion. the
majority of the undiscounted future asset retirement obligations relate to the Stoney Creek landfill in Ontario, which are expected to be incurred over the next 300
years.Excludingthelandfill,thetotalundiscountedfuturecostis$36.2million.Newaltausesadiscountrateof8%andaninflationrateof2%tocalculatethe
present value of the asset retirement obligations.
year ended December 31,
2010 2009
asset retirement obligations, beginning of year 21,903 21,094
Expenditures incurred to fulfill obligations (2,184) (1,024)
accretion 1,981 1,833
asset retirement obligations, end of year 21,700 21,903
Newalta72

Note 15. Shareholders’ Capitala) Shareholders’ capital
authorized capital of Newalta consists of an unlimited number of common shares and an unlimited number of preferred shares issuable in series.
On June 29, 2009, an aggregate of 60,483 common shares were cancelled and returned to treasury. under the terms of the March 1, 2003 Plan of arrangement,
Newalta Corporation (a predecessor entity) converted from a corporate structure to Newalta Income Fund (the “Fund”), a trust structure. the Plan of arrangement
provided that certificates formerly representing common shares of Newalta Corporation that were not deposited with the required documentation on or before March
1, 2009 ceased to represent a right or claim of any kind or nature and the right of the holder of such common shares to receive certificates representing trust units
of the Fund or cash payments pursuant to the Plan of arrangement, as the case may be, were deemed to be surrendered together with all dividends or distributions
thereon held for such holder. these shares were valued at $11.99 each using the average carrying amount of shares outstanding prior to their return. as a result
$0.7 million was transferred from Share Capital to Contributed Surplus.
On October 27, 2009, Newalta issued 6.0 million shares pursuant to a bought deal equity financing at a price of $7.65 per share. Proceeds, net of issuance costs,
were $43.8 million.
the following table is a summary of the changes in Shareholders’ capital during the period:
(000s) Shares (#) amount ($)
Shares outstanding as at December 31, 2008 42,400 509,369
Shares issued (net of issues costs) 6,136 44,227
Shares cancelled and returned to treasury (60) (725)
Shares outstanding as at December 31, 2009 48,476 552,871
Shares issued (net of issuance costs) 16 98
Shares outstanding as at December 31, 2010 48,492 552,969
b) Retained earnings (deficit) and contributed surplus
the following table provides a breakdown of the components of retained earnings (deficit):
2010 2009
accumulated earnings 381,243 363,180
accumulated cash dividends (390,732) (379,580)
retained Earnings (Deficit) (9,489) (16,400)
aR201073
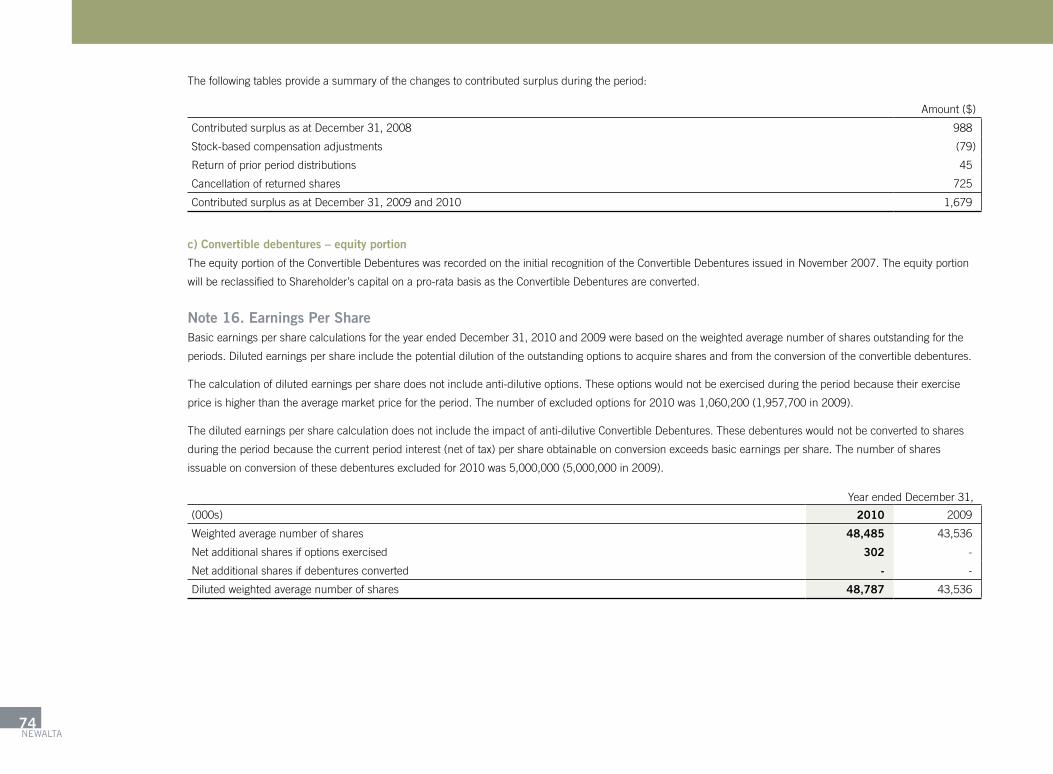
the following tables provide a summary of the changes to contributed surplus during the period:
amount ($)
Contributed surplus as at December 31, 2008 988
Stock-based compensation adjustments (79)
return of prior period distributions 45
Cancellation of returned shares 725
Contributed surplus as at December 31, 2009 and 2010 1,679
c) Convertible debentures – equity portion
the equity portion of the Convertible Debentures was recorded on the initial recognition of the Convertible Debentures issued in November 2007. the equity portion
will be reclassified to Shareholder’s capital on a pro-rata basis as the Convertible Debentures are converted.
Note 16. Earnings Per ShareBasic earnings per share calculations for the year ended December 31, 2010 and 2009 were based on the weighted average number of shares outstanding for the
periods. Diluted earnings per share include the potential dilution of the outstanding options to acquire shares and from the conversion of the convertible debentures.
the calculation of diluted earnings per share does not include anti-dilutive options. these options would not be exercised during the period because their exercise
price is higher than the average market price for the period. the number of excluded options for 2010 was 1,060,200 (1,957,700 in 2009).
the diluted earnings per share calculation does not include the impact of anti-dilutive Convertible Debentures. these debentures would not be converted to shares
during the period because the current period interest (net of tax) per share obtainable on conversion exceeds basic earnings per share. the number of shares
issuable on conversion of these debentures excluded for 2010 was 5,000,000 (5,000,000 in 2009).
year ended December 31,
(000s) 2010 2009
Weighted average number of shares 48,485 43,536
Net additional shares if options exercised 302 -
Net additional shares if debentures converted - -
Diluted weighted average number of shares 48,787 43,536
Newalta74

Note 17. Shareholder Dividends DeclaredDuring the year ended December 31, 2010, Newalta declared quarterly dividends of $0.05 per share on each of March 15 and July 15, and quarterly dividends of
$0.065 on each of September 15 and December 15.
Note 18. Capital DisclosuresNewalta’s capital structure currently consists of:
2010 2009
amount drawn on credit facility(1) 54,028 191,280
letters of credit issued as financial security to third parties 21,477 42,283
Convertible debentures, debt portion 112,073 110,708
Senior unsecured debentures(1) 125,000 -
Shareholders’ equity 547,596 540,000
860,174 884,271
(1) Gross of transaction costs.
the objectives in managing the capital structure are to:
• UtilizeanappropriateamountofleveragetomaximizereturnonShareholders’equity;and
• ToprovideforborrowingcapacityandfinancialflexibilitytosupportNewalta’soperations.
Management and the Board of Directors review and assess Newalta’s capital structure and dividend/distribution policy at least at each regularly scheduled board
meeting which are held at a minimum four times annually. the financial strategy may be adjusted based on the current outlook of the underlying business, the capital
requirements to fund growth initiatives and the state of the debt and equity capital markets. In order to maintain or adjust the capital structure, Newalta may:
• Issuesharesfromtreasury;
• Issuenewdebtsecurities;
• Causethereturnoflettersofcreditwithnoadditionalfinancialsecurityrequirements;
• Replaceoutstandinglettersofcreditwithbondsorothertypesoffinancialsecurity;
• Amend,revise,reneworextendthetermsofitsthenexistinglong-termdebtfacilities;
• Enterintonewagreementsestablishingnewcreditfacilities;
• Adjusttheamountofdividendspaidtoshareholders;and/or
• Sellidle,redundantornon-coreassets.
Management monitors the capital structure based on measures required pursuant to the Credit Facility agreement which restricts Newalta from declaring dividends
and distributing cash if the Corporation is in breach of a covenant under the Credit Facility. these measures include:
aR201075

ratio December 31, 2010 threshold
Senior Secured Debt(1) to EBItDa(2) 0.63:1 2.75:1 maximum
total Debt(3) to EBItDa(2) 1.68:1 3.50:1 maximum
Interest Coverage 4.97:1 2.25:1 minimum
(1) Senior Secured Debt means the total Debt less the Senior unsecured Debentures.
(2) EBItDa is a non-GaaP measure, the closest measure of which is net earnings. For the purpose of calculating the covenant, EBItDa is defined as the trailing twelve-months consolidated net income for Newalta
before the deduction of interest, taxes, depreciation and amortization, and non-cash items (such as stock-based compensation and gains or losses on asset dispositions). additionally, EBItDa is normalized for any
acquisitions or dispositions as if they had occurred at the beginning of the period.
(3) total Debt comprises outstanding indebtedness under the credit facility and the senior unsecured debentures, but excludes the existing $115 million convertible debentures.
the trust indenture under which the Senior unsecured Debentures have been issued also contains certain restrictions and covenants that, subject to certain
exceptions, limit our ability to incur additional indebtedness, pay dividends, make certain loans or investments and sell or otherwise dispose of certain assets subject
to certain conditions, among other limitations.
ratio December 31, 2010 threshold
Senior Secured Debt including letters of credit 75,336 $245,000 maximum
Cumulative capital lease obligations nil $25,000 maximum
Consolidated Fixed Charge Coverage 4.97:1 2.00:1 minimum
Period end surplus for restricted payments 17,284 Not to exceed surplus
Note 19. Commitmentsa) Debt and Lease CommitmentsNewalta has annual commitments for senior long-term debt, debentures, leased property and equipment and short-term amounts payable as follows:
2011 2012 2013 2014 2015 Thereafter Total
amount drawn on credit facility(1)
(Note 9) - - 54,028 - - - 54,028
Convertible debentures (Note 10) 8,050 122,379 - - - - 130,429
Senior unsecured debentures (Note 11) 9,531 9,531 9,531 9,531 9,531 143,070 190,726
total debt commitments 17,581 131,910 63,559 9,531 9,531 143,070 375,182
Office leases 7,676 7,453 7,377 6,988 6,882 27,762 64,138
Operating leases 9,025 4,560 1,214 382 48 - 15,229
Surface leases 1,135 1,157 290 290 290 225 3,387
accounts payable and accrued liabilities 118,218 - - - - - 118,218
Dividends payable 3,152 - - - - - 3,152
total debt and other commitments 156,787 145,080 72,440 17,191 16,751 171,057 579,306
(1) Gross of transaction costs. Interest payments are not reflected.Newalta76
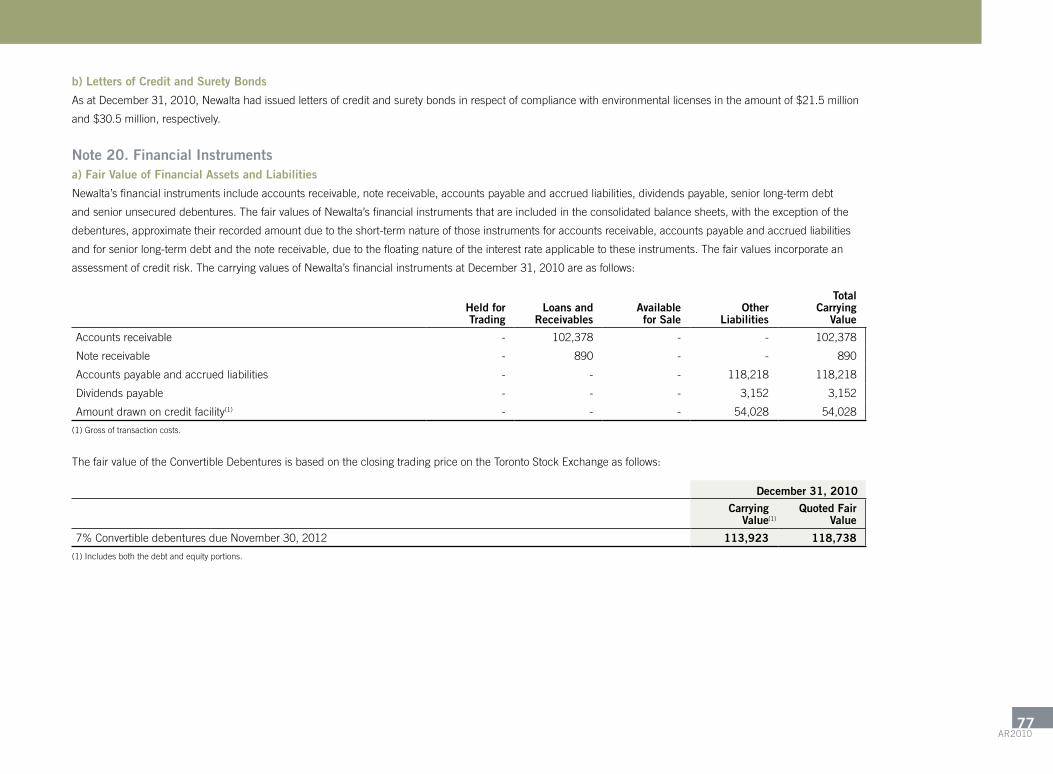
b) Letters of Credit and Surety Bonds
as at December 31, 2010, Newalta had issued letters of credit and surety bonds in respect of compliance with environmental licenses in the amount of $21.5 million
and $30.5 million, respectively.
Note 20. Financial Instrumentsa) Fair Value of Financial Assets and Liabilities
Newalta’s financial instruments include accounts receivable, note receivable, accounts payable and accrued liabilities, dividends payable, senior long-term debt
and senior unsecured debentures. the fair values of Newalta’s financial instruments that are included in the consolidated balance sheets, with the exception of the
debentures, approximate their recorded amount due to the short-term nature of those instruments for accounts receivable, accounts payable and accrued liabilities
and for senior long-term debt and the note receivable, due to the floating nature of the interest rate applicable to these instruments. the fair values incorporate an
assessment of credit risk. the carrying values of Newalta’s financial instruments at December 31, 2010 are as follows:
Held forTrading
Loans andReceivables
Availablefor Sale
OtherLiabilities
Total Carrying
Value
accounts receivable - 102,378 - - 102,378
Note receivable - 890 - - 890
accounts payable and accrued liabilities - - - 118,218 118,218
Dividends payable - - - 3,152 3,152
amount drawn on credit facility(1) - - - 54,028 54,028
(1) Gross of transaction costs.
the fair value of the Convertible Debentures is based on the closing trading price on the toronto Stock Exchange as follows:
December 31, 2010
CarryingValue
Quoted FairValue
7%ConvertibledebenturesdueNovember30,2012 113,923 118,738
(1) Includes both the debt and equity portions.
(1)
aR201077
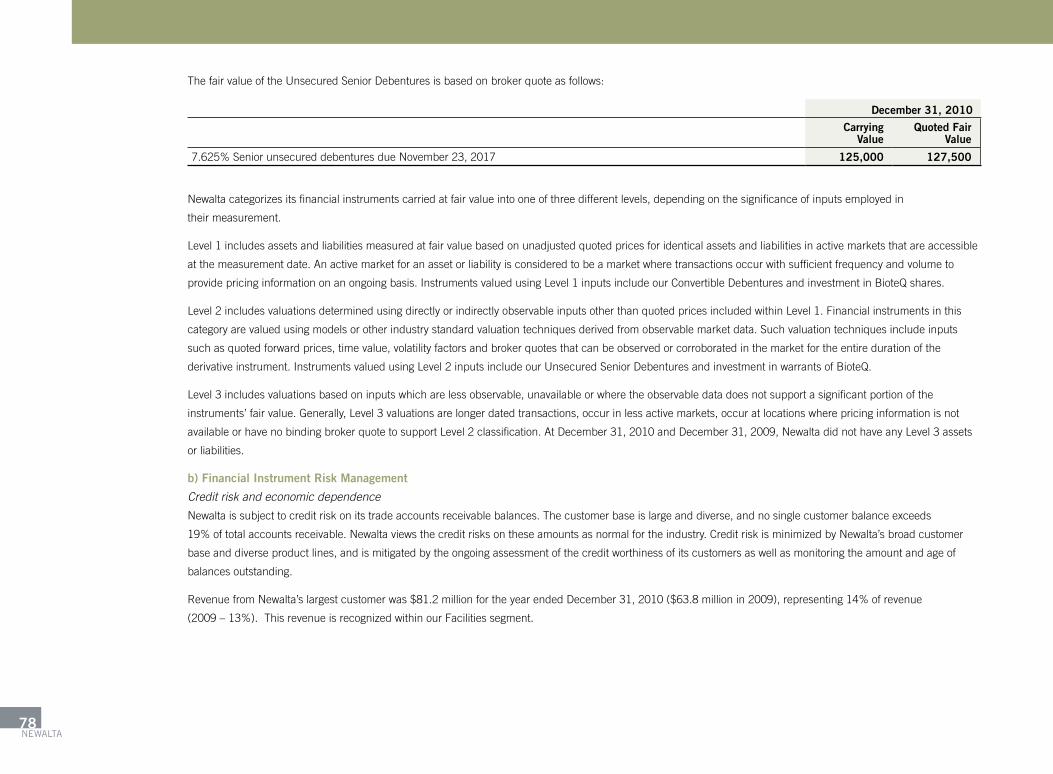
the fair value of the unsecured Senior Debentures is based on broker quote as follows:
December 31, 2010
CarryingValue
Quoted FairValue
7.625%SeniorunsecureddebenturesdueNovember23,2017 125,000 127,500
Newalta categorizes its financial instruments carried at fair value into one of three different levels, depending on the significance of inputs employed in
their measurement.
level 1 includes assets and liabilities measured at fair value based on unadjusted quoted prices for identical assets and liabilities in active markets that are accessible
at the measurement date. an active market for an asset or liability is considered to be a market where transactions occur with sufficient frequency and volume to
provide pricing information on an ongoing basis. Instruments valued using level 1 inputs include our Convertible Debentures and investment in BioteQ shares.
level 2 includes valuations determined using directly or indirectly observable inputs other than quoted prices included within level 1. Financial instruments in this
category are valued using models or other industry standard valuation techniques derived from observable market data. Such valuation techniques include inputs
such as quoted forward prices, time value, volatility factors and broker quotes that can be observed or corroborated in the market for the entire duration of the
derivative instrument. Instruments valued using level 2 inputs include our unsecured Senior Debentures and investment in warrants of BioteQ.
level 3 includes valuations based on inputs which are less observable, unavailable or where the observable data does not support a significant portion of the
instruments’ fair value. Generally, level 3 valuations are longer dated transactions, occur in less active markets, occur at locations where pricing information is not
available or have no binding broker quote to support level 2 classification. at December 31, 2010 and December 31, 2009, Newalta did not have any level 3 assets
or liabilities.
b) Financial Instrument Risk Management
Credit risk and economic dependence
Newalta is subject to credit risk on its trade accounts receivable balances. the customer base is large and diverse, and no single customer balance exceeds
19%oftotalaccountsreceivable.Newaltaviewsthecreditrisksontheseamountsasnormalfortheindustry.CreditriskisminimizedbyNewalta’sbroadcustomer
base and diverse product lines, and is mitigated by the ongoing assessment of the credit worthiness of its customers as well as monitoring the amount and age of
balances outstanding.
RevenuefromNewalta’slargestcustomerwas$81.2millionfortheyearendedDecember31,2010($63.8millionin2009),representing14%ofrevenue
(2009–13%).ThisrevenueisrecognizedwithinourFacilitiessegment.
Newalta78
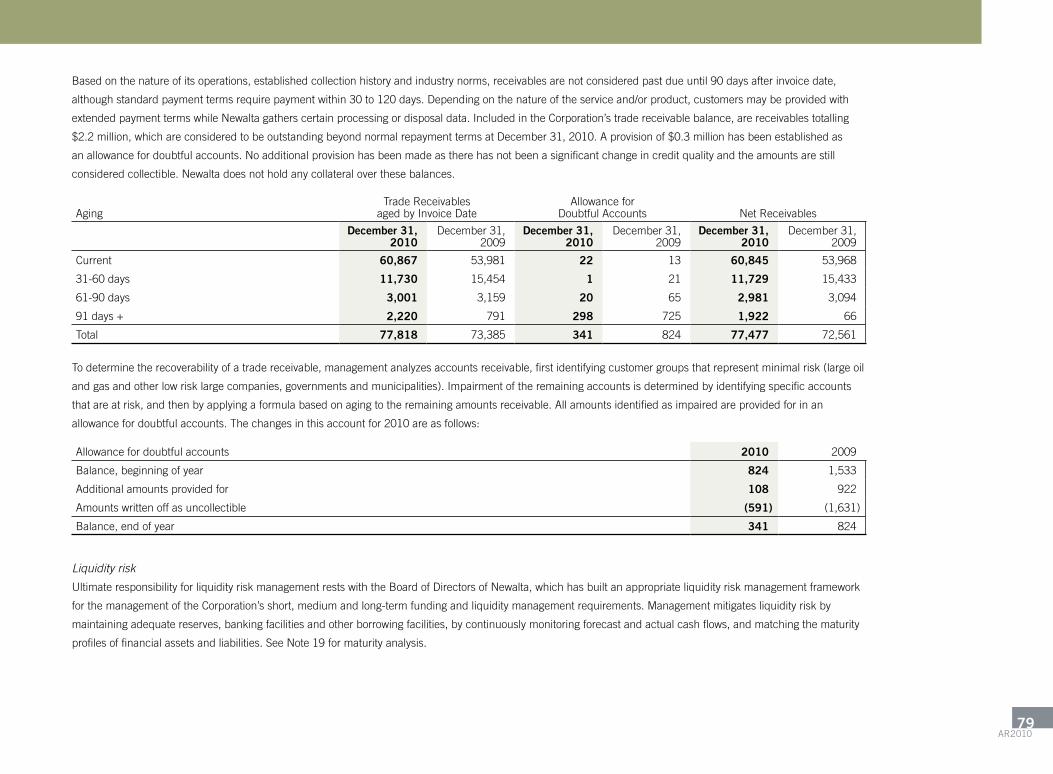
Based on the nature of its operations, established collection history and industry norms, receivables are not considered past due until 90 days after invoice date,
although standard payment terms require payment within 30 to 120 days. Depending on the nature of the service and/or product, customers may be provided with
extended payment terms while Newalta gathers certain processing or disposal data. Included in the Corporation’s trade receivable balance, are receivables totalling
$2.2 million, which are considered to be outstanding beyond normal repayment terms at December 31, 2010. a provision of $0.3 million has been established as
an allowance for doubtful accounts. No additional provision has been made as there has not been a significant change in credit quality and the amounts are still
considered collectible. Newalta does not hold any collateral over these balances.
agingtrade receivables
aged by Invoice Dateallowance for
Doubtful accounts Net receivables
December 31,2010
December 31,2009
December 31,2010
December 31,2009
December 31,2010
December 31,2009
Current 60,867 53,981 22 13 60,845 53,968
31-60 days 11,730 15,454 1 21 11,729 15,433
61-90 days 3,001 3,159 20 65 2,981 3,094
91 days + 2,220 791 298 725 1,922 66
total 77,818 73,385 341 824 77,477 72,561
to determine the recoverability of a trade receivable, management analyzes accounts receivable, first identifying customer groups that represent minimal risk (large oil
and gas and other low risk large companies, governments and municipalities). Impairment of the remaining accounts is determined by identifying specific accounts
that are at risk, and then by applying a formula based on aging to the remaining amounts receivable. all amounts identified as impaired are provided for in an
allowance for doubtful accounts. the changes in this account for 2010 are as follows:
allowance for doubtful accounts 2010 2009
Balance, beginning of year 824 1,533
additional amounts provided for 108 922
amounts written off as uncollectible (591) (1,631)
Balance, end of year 341 824
Liquidity risk
ultimate responsibility for liquidity risk management rests with the Board of Directors of Newalta, which has built an appropriate liquidity risk management framework
for the management of the Corporation’s short, medium and long-term funding and liquidity management requirements. Management mitigates liquidity risk by
maintaining adequate reserves, banking facilities and other borrowing facilities, by continuously monitoring forecast and actual cash flows, and matching the maturity
profiles of financial assets and liabilities. See Note 19 for maturity analysis.
aR201079

Interest rate risk
Newalta is exposed to interest rate risk to the extent that its Credit Facility has a variable interest rate. Management does not enter into any derivative contracts to
manage the exposure to variable interest rates. the Convertible Debentures and Senior unsecured Debentures have fixed interest rates until their maturity dates, at
which point, any remaining amounts owing under these debentures will need to be repaid or refinanced. the table below provides an interest rate sensitivity analysis
for the twelve months ended December 31, 2010:
year ended December 31, 2010
Ifinterestratesincreasedby1%withallothervariablesheldconstant (668)
Market risk
Market risk is the risk that the fair value or future cash flows of Newalta’s financial instruments will fluctuate because of changes in market prices. Newalta is exposed
to foreign exchange market risk. Foreign exchange risk refers to the risk that the value of a financial commitment, recognised asset or liability will fluctuate due to
changes in foreign currency exchange rates. the risk arises primarily from u.S. dollar denominated long-term debt and working capital. as at December 31, 2010,
Newalta had $25.3 million in working capital and $25.4 million in long-term debt denominated in u.S. dollars. Management has not entered into any financial
derivatives to manage the risk for the foreign currency exposure as at December 31, 2010.
the table below provides a foreign currency sensitivity analysis on long-term debt and working capital outstanding as at December 31, 2010:
Net Earnings
If the value of the u.S. dollar increased by $0.01 with all other variables held constant 1
Note 21. Cash Flow Statement Informationthe following tables provide supplemental information.
2010 2009
Changes in current assets (16,941) 33,563
Changes in current liabilities 28,756 (24,644)
Investment 4,274 -
Dividends payable (729) 5,137
Stock-based compensation, foreign exchange and other (4,903) (3,168)
Changes in capital asset accruals (8,074) 12,711
Total increase in non-cash working capital 2,383 23,599
Newalta80

2010 2009
Foreign exchange (429) 2,354
accretion of convertible debentures 1,365 1,289
amortization of deferred financing charges 1,821 1,834
unrealized loss on investment in warrants 435 -
Other (38) (382)
Total other items not requiring cash 3,154 5,095
2010 2009
Cash additions to capital assets during the year (75,603) (26,941)
Changes in capital asset accruals 8,074 (12,711)
Total cash additions to capital assets (67,529) (39,652)
Note 22. Segmented InformationEffective January 1, 2010, Newalta reorganized its reporting structure into two divisions, Onsite and Facilities, which constitute our two reportable segments. the
reportable segments are distinct strategic business units whose operating results are regularly reviewed by the Corporation’s executive officers in order to assess
financial performance and make resource allocation decisions. the reportable segments have separate operating management and operate in distinct competitive and
regulatoryenvironments.TheFacilitiessegmentincludestheprocessingofindustrialandoilfield-generatedwastesincluding:collectiontreatmentanddisposal;clean
oilterminalling;customtreating;thesaleofrecoveredcrudeoilforouraccount;oilrecycling;andleadbatteryrecycling.TheOnsitesegmentinvolvesthemobilization
ofequipmentandstafftoprocesswasteatourcustomersitesincluding:theprocessingofoilfield-generatedwastes;thesaleofrecoveredcrudeoil;industrial
cleaning;siteremediation;dredginganddewatering;anddrillsiteprocessing,includingsolidscontrolanddrillcuttingsmanagement.Newaltahadpreviouslyreported
Western and Eastern reportable segments. as such, 2009 comparative information has been restated to present information under the applicable new segments.
aR201081
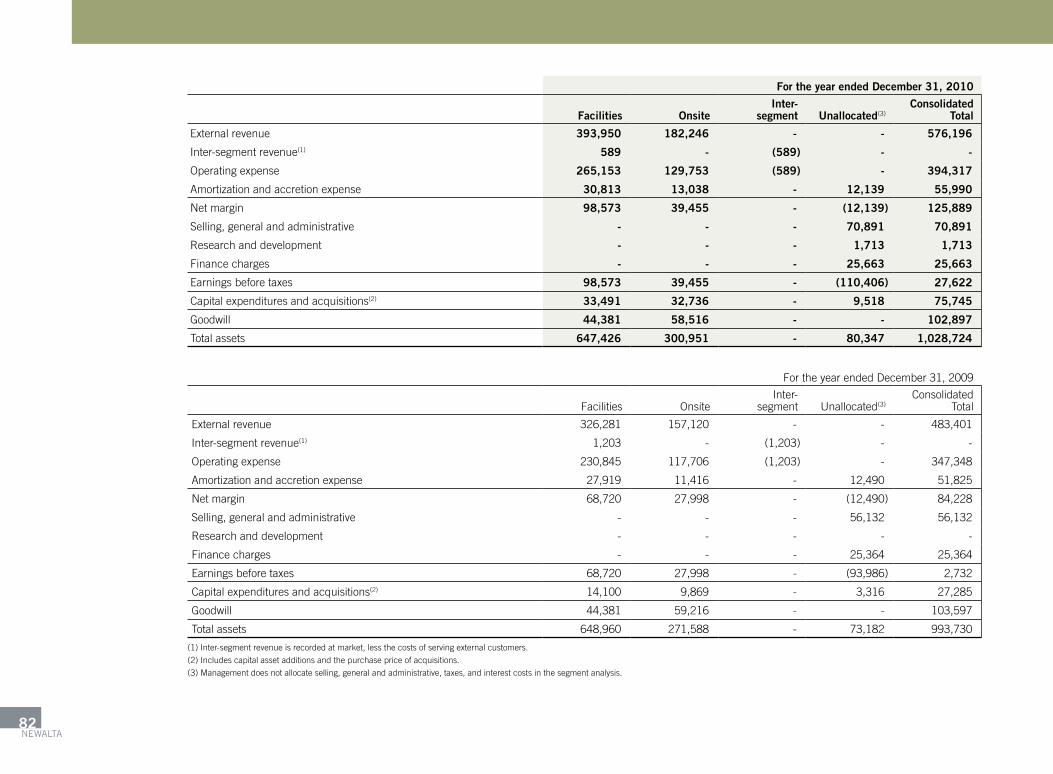
For the year ended December 31, 2010
Facilities Onsite Inter-
segment Unallocated(3)Consolidated
Total
External revenue 393,950 182,246 - - 576,196
Inter-segment revenue(1) 589 - (589) - -
Operating expense 265,153 129,753 (589) - 394,317
amortization and accretion expense 30,813 13,038 - 12,139 55,990
Net margin 98,573 39,455 - (12,139) 125,889
Selling, general and administrative - - - 70,891 70,891
research and development - - - 1,713 1,713
Finance charges - - - 25,663 25,663
Earnings before taxes 98,573 39,455 - (110,406) 27,622
Capital expenditures and acquisitions(2) 33,491 32,736 - 9,518 75,745
Goodwill 44,381 58,516 - - 102,897
total assets 647,426 300,951 - 80,347 1,028,724
For the year ended December 31, 2009
Facilities Onsite Inter-
segment unallocated(3)Consolidated
total
External revenue 326,281 157,120 - - 483,401
Inter-segment revenue(1) 1,203 - (1,203) - -
Operating expense 230,845 117,706 (1,203) - 347,348
amortization and accretion expense 27,919 11,416 - 12,490 51,825
Net margin 68,720 27,998 - (12,490) 84,228
Selling, general and administrative - - - 56,132 56,132
research and development - - - - -
Finance charges - - - 25,364 25,364
Earnings before taxes 68,720 27,998 - (93,986) 2,732
Capital expenditures and acquisitions(2) 14,100 9,869 - 3,316 27,285
Goodwill 44,381 59,216 - - 103,597
total assets 648,960 271,588 - 73,182 993,730
(1) Inter-segment revenue is recorded at market, less the costs of serving external customers.
(2) Includes capital asset additions and the purchase price of acquisitions.
(3) Management does not allocate selling, general and administrative, taxes, and interest costs in the segment analysis.
Newalta82

Corporate Information
OFFICERSAlan P. CadottePresident and Chief Executive Officer
Peter A. DugandzicExecutive Vice President
J. Craig WilkieExecutive Vice President
Michael A. BorysSenior Vice President and Chief Financial Officer
Terry P. DonaleshenSenior Vice President, Organization Development
Doug PecharskySenior Vice President, Onsite Operations
Took Whiteley6
Senior Vice President, BusinessDevelopment and General Counsel
Jim McClimansVice President, Finance
Harry WellsVice President, technical Development
DIRECTORSAlan P. Cadotte Robert M. MacDonald1, 4 R. Vance Milligan, Q.C.1, 3 R.H. (Dick) Pinder1, 3 Gordon E. Pridham2, 4 Susan Riddell Rose2, 4 Tom Ryley3, 4 Barry D. Stewart2, 5
1. audit Committee
2. Compensation Committee
3. Corporate Governance and Nominating Committee
4. Environment, Health and Safety Committee
5. Chairman of the Board
6. Corporate Secretary
INVESTOR RELATIONSAnne M. PlastererExecutive Director, Investor relationstel: 403.806.7019Fax: [email protected]
STOCK EXCHANGEToronto Stock Exchange Symbol: NAL / NAL.DB
AUDITORSDeloitte & Touche LLP Calgary, Alberta
LEGAL COUNSELBennett Jones LLP Calgary, Alberta
BANKERSCanadian Imperial Bank of Commerce Royal Bank of Canada The Bank of Nova Scotia The Toronto Dominion Bank National Bank of Canada
TRANSFER AGENT AND REGISTRARValiant Trust Company Calgary, Alberta
NOTICE OF ANNUAL AND SPECIAL MEETINGWednesday, May 11, 2011 at 2:00 pm (Mt)
Newalta’s corporate office
220 – 12th avenue SW
Calgary, alberta
Designed by Bryan Mills Iradesso, editorial by Fundamental Creative
the savings opposite are achieved when pC recycled fiber is used in place of virgin fiber. Newalta uses 2640 lbs of paper which has a post-consumer recycled percentage of 100%.
additional savings if paper is manufactured with windpower and carbon offsets.
25 trees preserved for the future 73 lbs water-borne waste not created 10,766 gal wastewater flow saved 1,191 lbs solid waste not generated 2,345 lbs net greenhouse gases prevented 17,952,000 Btus energy not consumed
1,191 lbs ghg emissions not generated 1.3 barrels fuel oil unused 1,178 mi, equivalent to not driving 81 trees, equivalent to planting
Newalta is committed to reducing impacts to the environment in every way we can, including the production of this publication. this report was printed on FSC Certified Mohawk options pCw, which is manufactured entirely with wind energy and contains 100% post-consumer recycled fibre.

SPINE
We will expand our customer base and the profitability of our national Facilities’
network by tailoring services to local markets, creating new services, improving
productivity, managing costs and capitalizing on commodity price growth as well as
from recovering drilling activity in the west and manufacturing activity in the east.
We will further leverage our capabilities to grow our Onsite “recovery at source”
segment with an initial emphasis on heavy oil producers - where the need is
growing and our solutions are proven - as well as petrochemical, refining and
mining where Onsite is just emerging.
We will develop, adapt and commercialize technologies to increase the scope of
wastes that we can process and products that we recover.
Our GO BIG StratEGy
211 – 11th avenue S.W. Calgary, aB t2r 0C6
tel: 403.806.7000 Fax: 403.806.7348
newalta.com
GO
ING
BIG
Ne
wa
lta
20
10
aN
Nu
al
Re
po
Rt