newprepacqc reason codes prepacqc...interpretation of ncep prepbufr event quality marks and reason...
TRANSCRIPT
Interpretation of NCEP PREPBUFR Event Quality Marks and Reason Codes Applied to Aircraft Data by the new PREPACQC Quality Control Module
31 December 2010

Page 2 of 13
OVERVIEW Background In spring 2011, NCEP transitioned from older aircraft data quality control (QC) modules called PREPACQC and PREPACARSQC to a module utilizing a different core aircraft data QC routine. This new (new meaning new to NCEP) core routine was originally designed and written by the Naval Research Laboratory. The new QC module, more comprehensive than PREPACQC and PREPACARSQC together, is referred to as the “new PREPACQC”. This document assumes that the reader is at least somewhat familiar with the concept of NCEP PREBUFR QC events, including the quality marks and reason codes present within the event structure. If needed, more information about the NCEP PREPBUFR processing can be found at http://www.emc.ncep.noaa.gov/mmb/data_processing/prepbufr.doc/document.htm and http://www.nco.ncep.noaa.gov/sib/decoders/BUFRLIB/toc/prepbufr. NCEP PREPBUFR Event Quality Markers In both aircraft data QC modules, old and new, the quality markers (QMs) have essentially the same meanings. The QMs applied by the old PREPACQC and PREPACARSQC programs can be referenced via http://www.emc.ncep.noaa.gov/mmb/data_processing/prepbufr.doc/table_7.htm (portion of which are included within this document as Table 1). The new PREPACQC applies the same quality markers as the old PREPACQC and PREPACARSQC; more details about QM use in the new PREPACQC appear in later sections of this document. NCEP PREPBUFR Event Reason Codes As a result of the change in aircraft data QC modules, the method of interpretation of the reason codes in the PREPBUFR events applied to aircraft data changed. (The meanings of the quality marks stay the same.) The older aircraft data QC modules relied upon a static list of reason codes and their definitions. In order to determine why a particular observation was assigned a certain quality mark, one had to simply read the reason code out of the PREPBUFR file and then look up the corresponding meaning in a table. The method of interpretation of the reason codes for the new aircraft data quality control module is different than that of the previous quality control modules because the raw QC information output by the NRL QC routine is somewhat more general than that output by the old PREPACQC or PREPACARSQC. More details about interpreting reason codes output by the new version of PREPACQC are available in subsequent sections of this document.

Page 3 of 13
QUALITY MARKS AND REASON CODES IN OLDER AIRCRAFT DATA QC MODULES Quality Marks In the old PREPACQC and PREPACARSQC, quality marks are applied to the observations via NCEP PREPBUFR events (more information on PREPBUFR events: http://www.emc.ncep.noaa.gov/mmb/data_processing/prepbufr.doc/document.htm). The quality markers are numerical values, with their corresponding definitions listed in Table 1. The online version of Table 1 lists all of the quality marks available in the entire NCEP PREPBUFR system; however, not all of those quality markers are used by PREPACQC or PREPACARSQC. Those that are utilized in these two modules are specified below in Table 1.
Quality Marker
Definition
1 All steps: Good. Applies to pressure, height, wind, temperature, specific humidity, rainfall rate, precipitable water and cloud top pressure.
2 All steps: Neural or not checked (default). Applies to pressure, height, wind, temperature, specific humidity, rainfall rate, precipitable water and cloud top pressure.
3 All steps: Suspect. Applies to pressure, height, wind, temperature, specific humidity, rainfall rate, precipitable water and cloud top pressure.
13 All automated quality control steps: A non-wind profiler observation failed one or more checks. Applies to pressure, height, wind, temperature, specific humidity and precipitable water.
Table 1: NCEP PREPBUFR Quality Marks Applied by the old version of PREPACQC and PREPACARSQC
Reason Codes In the older aircraft data QC modules, the data user only needed to refer to a table in order to decipher what the reason code meant (and hence why an observation was marked as good, bad, etc.). Definitions of reason codes applied by the old version of PREPACQC, which was previously used to screen AIREP, PIREP, AMDAR, and ASDAR aircraft data, can be found at http://www.emc.ncep.noaa.gov/mmb/data_processing/prepbufr.doc/table_13.htm, also included here for reference as Table 2. Definitions of reason codes applied by PREPACARSQC, which was previously used to quality control MDCRS/ACARS aircraft data, can be found in Table 3 (there is currently no online reference for the PREPACARSQC reason codes). An example of interpreting the quality marks and reason codes applied by the old version of PREPACQC follows the tables. Also, additional reference information and documentation about these older aircraft data QC modules (and the NCEP PREPBUFR data processing system in general) can be found at http://www.emc.ncep.noaa.gov/mmb/data_processing/prepbufr.doc/document.htm and http://www.ncep.noaa.gov/officenotes/NOAA-NPM-NCEPON-0005/01408943.pdf.

Page 4 of 13
Reason Code
Meaning
1 CARSWELL/TINKER CONVERTED PIREP REPORT. TEMPERATURE AND WIND DATA CONSIDERED BAD. 2 REPORT BETWEEN ALTITUDE 2000 TO 5000 FEET WITH TEMPERATURE THAT DIFFERS FROM FIRST GUESS
TEMPERATURE BY MORE THAN 25 DEGREES CELSIUS. [PROBABLY ACTUALLY AT ALTITUDE 20,000 TO 50,000 FEET, BUT REPORTED WITH A "0" DIGIT DROPPED(?)]. TEMPERATURE AND WIND DATA CONSIDERED BAD.
3 REPORT WITH NON-MISSING TEMPERATURE GREATER THAN 12 DEGREES CELSIUS. TEMPERATURE DATA CONSIDERED BAD.
4 REPORT WITH CALM WIND FROM A DIRECTION OTHER THAN 360 DEGREES. WIND DATA CONSIDERED BAD. 5 PIREP REPORT WITH VECTOR WIND INCREMENT GREATER THAN 20 KNOTS, OR WITH UNKNOWN VECTOR
WIND INCREMENT. TEMPERATURE AND WIND DATA CONSIDERED BAD. 6 REPORT WITH A CALM WIND IN A STACK OF LESS THAN SEVEN CO-LOCATED REPORTS WITH LESS THAN
FOUR REPORTS HAVING A CALM WIND. WIND DATA CONSIDERED BAD. 7 MID- OR HIGH-LEVEL ASDAR/AMDAR REPORT IN A TRACK WITH AN UNREASONABLE GROUND SPEED AND
A VECTOR WIND INCREMENT GREATER THAN 70 KNOTS. WIND DATA CONSIDERED BAD. 8 THIS ONE OF A PAIR OF AIREP/PIREP REPORTS IN A TRACK IS DETERMINED TO BE A TYPE 2A DUPLICATE.
WIND DATA CONSIDERED BAD. 9 THIS ONE OF A PAIR OF AIREP/PIREP REPORTS IN A TRACK IS DETERMINED TO HAVE A TYPE 3 ERROR.
WIND DATA CONSIDERED BAD. 10 THIS ONE OF SEVERAL (> 2) AIREP/PIREP REPORTS IN A TRACK IS DETERMINED TO HAVE A TYPE 3 ERROR.
WIND DATA CONSIDERED BAD. 11 THIS ONE OF SEVERAL (> 2) AIREP/PIREP REPORTS IN A TRACK IS DETERMINED TO BE A TYPE 2B
DUPLICATE. WIND DATA CONSIDERED BAD. 12 THIS ONE OF SEVERAL (> 2) AIREP/PIREP REPORTS IN A TRACK IS DETERMINED TO BE A TYPE 2A
DUPLICATE. WIND DATA CONSIDERED BAD. 13 THIS LAST OF SEVERAL (> 2) AIREP/PIREP REPORTS IN A TRACK IS DETERMINED TO IN ERROR. WIND DATA
CONSIDERED BAD. 14 THIS ONE OF SEVERAL (> 2) AIREP/PIREP REPORTS IN A TRACK IS DETERMINED TO BE A TYPE 3
DUPLICATE. WIND DATA CONSIDERED BAD. 15 REPORT IS USED TO GENERATE A SUPEROB REPORT. TEMPERATURE AND WIND DATA ARE FLAGGED FOR
NON-USE BY ANALYSIS. 16 ISOLATED AIREP/PIREP REPORT WITH VECTOR WIND INCREMENT GREATER THAN 50 KNOTS.
TEMPERATURE AND WIND DATA CONSIDERED BAD. 17 ISOLATED AIREP/PIREP REPORT WITH VECTOR WIND INCREMENT LESS THAN 21 KNOTS. TEMPERATURE
AND WIND DATA CONSIDERED GOOD. 18 ISOLATED AIREP/PIREP REPORT WITH VECTOR WIND INCREMENT GREATER THAN 20 KNOTS BUT LESS
THAN 51 KNOTS. TEMPERATURE AND WIND DATA CONSIDERED SUSPECT. 19 REPORT (ISOLATED OR STACKED) WITH WIND DATA THAT HAS FAILED ONE OR MORE CHECKS AND IS
CONSIDERED BAD. TEMPERATURE DATA CONSIDERED BAD. 20 REPORT IN A STACK OF CO-LOCATED REPORTS WITH TEMPERATURE AND WIND DATA THAT HAS PASSED
ALL CHECKS. TEMPERATURE AND WIND DATA CONSIDERED GOOD. 21 REPORT IN A STACK OF CO-LOCATED REPORTS WITH WIND DATA THAT HAS FAILED THE WIND SHEAR
CHECK. WIND DATA CONSIDERED BAD. 22 REPORT IN A STACK OF CO-LOCATED REPORTS WITH TEMPERATURE DATA THAT HAS FAILED THE LAPSE
CHECK. TEMPERATURE DATA CONSIDERED BAD. 23 REPORT IN A STACK OF CO-LOCATED REPORTS WITH WIND DATA THAT HAS FAILED ONE OR MORE
CHECKS. THE REPORT IS NOT USED TO GENERATE A SUPEROB. TEMPERATURE AND WIND DATA CONSIDERED BAD.
24 THIS ONE OF A PAIR OF CO-LOCATED REPORTS HAS A VECTOR WIND INCREMENT GREATER THAN 50 KNOTS AND CONTAINS A SUSPECTED TRACK CHECK ERROR. TEMPERATURE AND WIND DATA CONSIDERED BAD.
25 AIREP/PIREP OR SUPEROB REPORT OVER CONUS. TEMPERATURE AND WIND DATA ARE FLAGGED FOR NON-USE BY THE ANALYSIS.
26 SUPEROB REPORT. TEMPERATURE AND WIND DATA CONSIDERED GOOD. 27 IN A TRACK CONTAINING AT LEAST 15 ASDAR/AMDAR REPORTS, THERE ARE AT LEAST 10 REPORTS WITH
A VECTOR WIND INCREMENT GREATER THAN 50 KNOTS. WIND DATA CONSIDERED BAD. 28 ISOLATED ASDAR/AMDAR REPORT WITH TEMPERATURE AND WIND DATA THAT HAVE PASSED ALL
CHECKS. TEMPERATURE AND WIND DATA CONSIDERED GOOD. 29 AIREP/PIREP REPORT IN A STACK OF ONLY TWO CO-LOCATED REPORTS WITH VECTOR WIND INCREMENT
GREATER THAN 50 KNOTS. TEMPERATURE AND WIND DATA CONSIDERED BAD. 30 ISOLATED ASDAR/AMDAR REPORT WITH A MISSING PHASE OF FLIGHT INDICATOR (PROBABLY BANKING).
TEMPERATURE AND WIND DATA CONSIDERED SUSPECT.
Table 2: Old PREPACQC Reason Codes and Definitions/Meanings
Page 5 of 13
Reason Code
Meaning
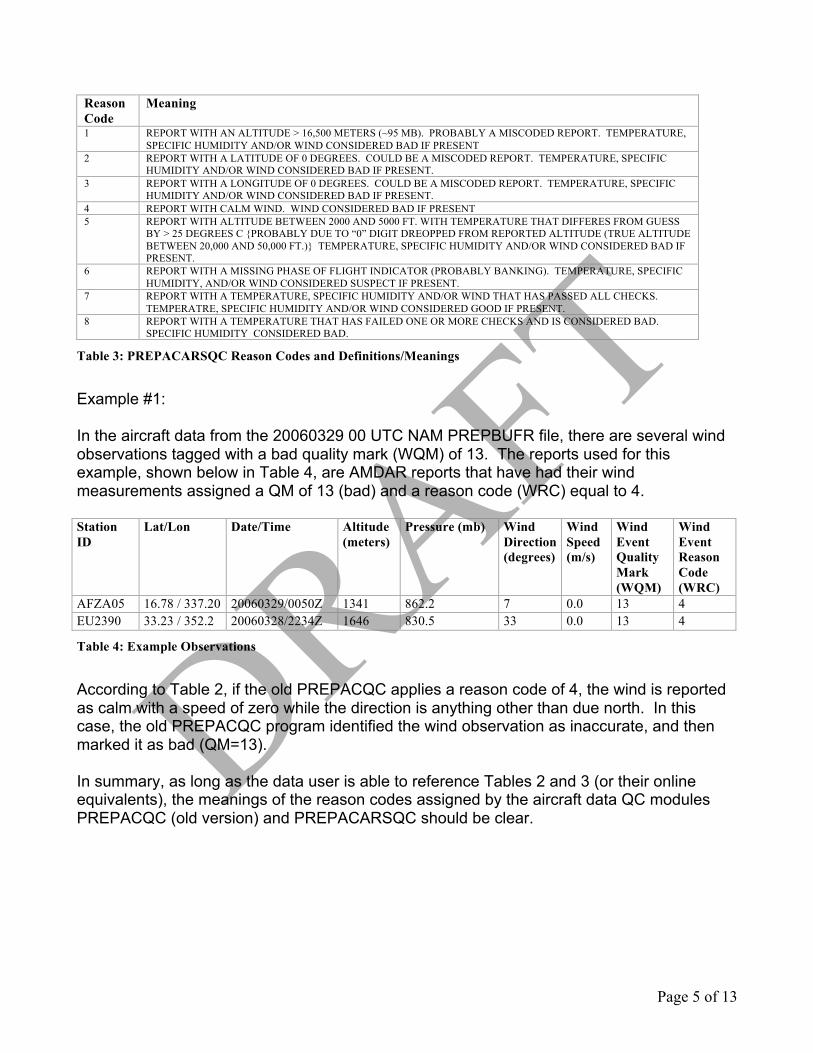
1 REPORT WITH AN ALTITUDE > 16,500 METERS (~95 MB). PROBABLY A MISCODED REPORT. TEMPERATURE, SPECIFIC HUMIDITY AND/OR WIND CONSIDERED BAD IF PRESENT
2 REPORT WITH A LATITUDE OF 0 DEGREES. COULD BE A MISCODED REPORT. TEMPERATURE, SPECIFIC HUMIDITY AND/OR WIND CONSIDERED BAD IF PRESENT.
3 REPORT WITH A LONGITUDE OF 0 DEGREES. COULD BE A MISCODED REPORT. TEMPERATURE, SPECIFIC HUMIDITY AND/OR WIND CONSIDERED BAD IF PRESENT.
4 REPORT WITH CALM WIND. WIND CONSIDERED BAD IF PRESENT 5 REPORT WITH ALTITUDE BETWEEN 2000 AND 5000 FT. WITH TEMPERATURE THAT DIFFERES FROM GUESS
BY > 25 DEGREES C {PROBABLY DUE TO “0” DIGIT DREOPPED FROM REPORTED ALTITUDE (TRUE ALTITUDE BETWEEN 20,000 AND 50,000 FT.)} TEMPERATURE, SPECIFIC HUMIDITY AND/OR WIND CONSIDERED BAD IF PRESENT.
6 REPORT WITH A MISSING PHASE OF FLIGHT INDICATOR (PROBABLY BANKING). TEMPERATURE, SPECIFIC HUMIDITY, AND/OR WIND CONSIDERED SUSPECT IF PRESENT.
7 REPORT WITH A TEMPERATURE, SPECIFIC HUMIDITY AND/OR WIND THAT HAS PASSED ALL CHECKS. TEMPERATRE, SPECIFIC HUMIDITY AND/OR WIND CONSIDERED GOOD IF PRESENT.
8 REPORT WITH A TEMPERATURE THAT HAS FAILED ONE OR MORE CHECKS AND IS CONSIDERED BAD. SPECIFIC HUMIDITY CONSIDERED BAD.
Table 3: PREPACARSQC Reason Codes and Definitions/Meanings
Example #1: In the aircraft data from the 20060329 00 UTC NAM PREPBUFR file, there are several wind observations tagged with a bad quality mark (WQM) of 13. The reports used for this example, shown below in Table 4, are AMDAR reports that have had their wind measurements assigned a QM of 13 (bad) and a reason code (WRC) equal to 4. Station ID
Lat/Lon Date/Time Altitude (meters)
Pressure (mb) Wind Direction (degrees)
Wind Speed (m/s)
Wind Event Quality Mark (WQM)
Wind Event Reason Code (WRC)
AFZA05 16.78 / 337.20 20060329/0050Z 1341 862.2 7 0.0 13 4 EU2390 33.23 / 352.2 20060328/2234Z 1646 830.5 33 0.0 13 4
Table 4: Example Observations
According to Table 2, if the old PREPACQC applies a reason code of 4, the wind is reported as calm with a speed of zero while the direction is anything other than due north. In this case, the old PREPACQC program identified the wind observation as inaccurate, and then marked it as bad (QM=13). In summary, as long as the data user is able to reference Tables 2 and 3 (or their online equivalents), the meanings of the reason codes assigned by the aircraft data QC modules PREPACQC (old version) and PREPACARSQC should be clear.
Page 6 of 13
QUALITY MARKS AND REASON CODES IN THE NEW VERSION OF PREPACQC Quality Marks As mentioned previously, the QC information output by the NRL aircraft data QC routine is more general than that output by the old version of PREPACQC or PREPACARSQC. The NRL code is more comprehensive than the prior modules together, with many more checks being performed on the data. In addition, the raw quality information output by the new QC core routine does not fit directly with the NCEP PREPBUFR event structure. So, a method of translation from the NRL standard to the NCEP PREPBUFR standard is necessary. Documentation of how to interpret the raw quality information output by the NRL QC module involves two charts, c_qc_values_actions and c_qc_values_reasons. These charts can be found online at http://www.emc.ncep.noaa.gov/obs/acqc/. The first chart (c_qc_values_actions) is included as part of this document as Table 6; it is also available separately on the web site. The latter (c_qc_values_reasons) is a more detailed table based on documentation provided by NRL, specifically the acftqc_flags_summary.txt file. Both of these documents (c_qc_values_reasons and acftqc_flags_summary.txt) are lengthy and available separately on the web site. They are not included in this document. In the present section of this document, the focus will be on how to use the raw quality information output by the NRL QC code, as well as how to translate it to equivalent PREPBUFR quality marks using Table 6 (c_qc_values_actions). Further explanation of how to interpret the reason codes applied by the new version of PREPACQC appears later in this document. Raw Output The NRL aircraft data QC code assigns an 11-character string to each report. These strings detail the decisions made by the NRL QC code with respect to each report as a whole and with respect to each measurement (temperature, winds, etc.). Through use of this string, one can determine (a) explicitly which parts of the observation (winds, temperatures, etc.) were marked as bad, good, neutral, or suspect, and (b) with a bit of detective work, why the measurements were marked as such. The acftqc_flags_summary.txt file, provided by NRL, provides the following details about what each character present in the 11 character string represents:

Page 7 of 13
Character position Definition 1 Overall report QC flag 2 Time QC flag 3 Latitude QC flag 4 Longitude QC flag 5 Pressure/altitude QC flag 6 Temperature QC flag 7 Wind direction QC flag 8 Wind speed QC flag 9 Moisture QC flag 10 Blacklist QC flag 11 Flight phase indicator (not necessarily a QC flag itself)
Table 5: Meanings of characters in the QC string output by the NRL QC routine
Each of these eleven positions can hold a variety of character values, ranging from ‘a’ to ‘X’ to the numbers 2 or 3, a space, or a dash. (Note: spaces in this 11-character string are changed to dots because the NCEP BUFRLIB software will trim spaces from the beginning and end of character strings that are written to a BUFR file via the subroutine writlc.) Table 6 (spreadsheet c_qc_values_actions), which appears below, lists in the second column from the left, all characters that are available. However, not every single available character can be used in every character position. For example, for the temperature QC flag (sixth character in the QC string), the characters that can be used are B, b, E, I, K, M, N, R, -, or a dot. The cells indicating characters that can be used are highlighted in green and also marked with a “Y”, meaning, “Yes, this character can be used in this character position.” Cells that are red and that contain no text indicate that the character specified at the left is not used in that position in the NRL QC string. For example, the character ‘P’ is not used to indicate the quality of the temperature ob. Hence, the cell is red and contains no text.

Page 8 of 13
Translation of NRL raw QC information to NCEP Quality Marks In addition to listing which characters may appear in the NRL QC string, Table 6 also lists, depending on which characters are present in the string, whether a report is to be rejected completely, or whether just its temperature or wind measurement is to be rejected, marked suspect, etc. Whether or not a report or portion of it should be rejected, etc., is conveyed by the label within the cell in question. If R[x] appears (where x=R,T, M, W), then the measurement (or entire report if the text is RR), should be rejected and assigned an NCEP quality mark (QM) equal to 13. If S[x] appears, then the measurement (or entire report if the text is SR), should be marked as suspect and assigned an NCEP QM of 3. If the text is NU, then the quality of the measurement is considered neutral and an NCEP QM of 2 will be assigned. If G[x] appears, then the measurement should be marked as good and assigned an NCEP QM of 1. The new aircraft data QC module assigns the same QMs (1=good, 2=neutral, 3=suspect, 13=bad) assigned by the old PREPACQC and PREPACARSQC.
Table 6: c_qc_values_actions

Page 9 of 13
There are a few instances where the new PREPACQC module will not generate a new PREPBUFR event (and therefore QM) for a report. If any QC module upstream of the aircraft data processing step marks a report or measurement with 0, 9, 14, etc., the new PREPACQC honors those QMs and will not override them. More specifically, the new QC module will not generate a new PREPBUFR event and QM if the pre-existing QM applied by an upstream module is:
(a) 0 (keep and always assimilate flag) (b) between 4 and 15 (already marked as bad by an upstream QC module or by the
NCEP Senior Duty Meteorologist (SDM)) (c) 3 (report already marked as suspect) and the new QM is less than or equal to 3
(good or neutral); the pre-existing suspect flag is honored. (d) equal to the new QM assigned by the new PREPACQC; no new event is applied if
there is no change in the QM. Further information about the meanings of the label within the cells is available near the bottom of Table 6. The use of the c_qc_values_actions chart (Table 6) is best illustrated with examples, two of which follow. The examples will also illustrate how to interpret the reason codes present in NCEP PREPBUFR events applied by the new PREPACQC. Reason Codes Because the quality information output by the NRL aircraft data QC code is more general than that output by the old PREPACQC or PREPACARSQC, a higher degree of flexibility in the values of the reason codes themselves is necessary in order to make the reason codes meaningful. Interpretation of the meaning of the PREPBUFR event reason codes is best explained by examples. Example #2 FLIGHT TAIL LAT LON IDT ELEV PRES TEMP MOISTURE WSPD WDIR NRL QC STRING F2OQUSJA 2JBXL5ZA 41.68 272.25 -4500 8054.00 751.10 271.96 –9999. 4.13 353.05! M A! F2OQUSJA 2JBXL5ZA 41.64 272.21 -4440 9938.00 698.50 268.56 –9999. 7.21 357.62! M A! F2OQUSJA 2JBXL5ZA 41.60 272.17 –4440 10738.00 677.10 266.46 –9999. 6.20 180.00! B M A! F2OQUSJA 2JBXL5ZA 41.55 272.15 -4380 11572.00 655.40 267.06 –9999. 6.21 356.31! M A! F2OQUSJA 2JBXL5ZA 41.49 272.13 -4320 12841.00 623.30 264.46 –9999. 9.77 337.11! M A! In the aircraft data from the 20060329 00 UTC NAM PREPBUFR file, there is a sequence of aircraft observations that includes an observation located at latitude 41.60 degrees and longitude 272.17 degrees, and at an altitude of 10738 feet (shown above and highlighted in red italics). Upon closer examination, it is noted that the character in the seventh position of the 11-character QC string is equal to ‘B’. The seventh character of the QC string represents the status of the wind direction measurement (see Table 5). Because the wind direction QC flag is being examined, one should consult the wind direction column of Table 6 in order to determine what action (reject, mark otherwise) should be taken with respect to the wind observation. Specifically, one should locate the wind direction column across the top of the chart, and then find the “character value” row corresponding to the character in question (‘B’). The cell present at the intersection of the row and column indicates that if the wind direction QC flag is equal to ‘B’, then the winds must be rejected (RW=reject winds). Therefore, if the

Page 10 of 13
winds are to be rejected as conveyed by the NRL QC information, then an NCEP quality mark of 13 (bad) will be assigned in the PREPBUFR event applied to this wind measurement. To verify that this ob has been flagged as bad, the reports in this example were located in a PREPBUFR file containing aircraft data that were quality-controlled by the new PREPACQC module instead of the old PREPACQC and PREPACARSQC. Below, the reports, their wind quality marks (WQM), and wind reason codes (WRC) are listed in Table 7. FLIGHT TAIL LAT LON IDT ELEV UOB VOB WQM WPC WRC
F20QUSJA 2JBXL5ZA 41.64 272.21 -4440 9938 0.3 -7.2 1 15 0731
F20QUSJA 2JBXL5ZA 41.60 272.17 -4440 10738 0.0 6.2 13 15 0703
F20QUSJA 2JBXL5ZA 41.55 272.15 -4380 12841 0.4 -6.2 1 15 0731
Table 7: Example 2 Observations and Wind Quality Information assigned by the new PREPACQC
One can see that the second report in the sequence, at 10738 feet, has had its wind measurement marked with a bad quality mark (13). The reason code is 0703. The reason codes output by the new PREPACQC are structured so that they convey what values were present in the original NRL QC string. The first two digits of the reason codes represent the “character position.” In this case, the first two digits are 07, corresponding to the 7th character, or wind direction QC flag, of the NRL QC string. The second two digits, in this case 03, represent the index of the “character value” appearing in the character position in question. To locate the index of the “character value,” the data user should refer to the leftmost column of Table 6 or the c_qc_values_actions table and locate the equivalent row of the second two digits (3 in this case). The character value that appears directly to the right is the character that was present in the wind direction QC flag position, in this case, the letter ‘B’. So, by using the reason codes applied by the new PREPACQC, the data user can reconstruct the NRL QC string should the need arise. Now that it is known that the winds in this report are bad, the question of why must be answered. Answering that question will require the use of the chart named c_qc_values_reasons (available online at http://www.emc.ncep.noaa.gov/obs/acqc). The c_qc_values_reasons.xls file is separate from this document because it is quite lengthy. However, applicable portions of it are included in this document when further explanation and illustration are necessary.

Page 11 of 13
Because the meaning of the wind direction flag is being investigated, the wind direction table of the c_qc_values_reasons chart should be consulted. This table (a portion of which is included here as Table 8) shows that a wind direction measurement can be assigned the character ‘B’ if it is (a) less than zero or greater than 360 or (b) if the direction is due north or due south without any of its neighbors exhibiting a similar value. If the data are examined more closely, it can be seen that the preceding wind direction measurement has a direction of 357.62 degrees, and the subsequent measurement has a direction of 356.31 degrees. Both of these measurements have a northerly component, not a southerly component like in the questionable observation. In this example, (b) is the reason for the assignment of ‘B’ to the wind direction QC value. Example #3 FLIGHT TAIL LAT LON IDT ELEV PRES TEMP WSPD WDIR NRL QC STRING P2TBVXYQ 25M13QZA 31.92 278.09 -2580 38999.00 196.80 209.16 45.83 268.00 ! M L! P2TBVXYQ 25M13QZA 32.49 278.53 -2279 38999.00 196.80 210.16 40.55 267.03 ! M L! P2TBVXYQ 25M13QZA 33.06 278.96 -1979 38999.00 196.80 212.16 41.71 262.01 ! M L! P2TBVXYQ 25M13QZA 31.52 279.42 -1678 38999.00 196.80 212.86 45.26 286.03 !P II M L! P2TBVXYQ 25M13QZA 34.78 280.35 -1076 38999.00 196.80 214.16 39.11 271.03 ! M L! P2TBVXYQ 25M13QZA 35.37 280.86 -775 38999.00 196.80 216.16 40.60 266.05 ! M L! P2TBVXYQ 25M13QZA 36.49 286.67 -174 38999.00 196.80 221.16 30.32 284.91 !P II M L! P2TBVXYQ 25M13QZA 37.51 282.83 428 38999.00 196.80 222.16 39.15 274.98 ! M L! P2TBVXYQ 25M13QZA 38.09 283.34 729 38999.00 196.80 220.16 30.88 274.09 ! M L!
Suppose an aircraft takes the measurements shown above during a level flight leg. In this example, there are two questionable observations (highlighted in red italics). The first occurs at latitude 31.52 degrees, longitude 279.42 degrees, and the second occurs at a latitude of 36.49 degrees and a longitude of 286.67 degrees. Upon examination of the data, one can see that the character in the first position of the QC strings is equal to ‘P’ while the characters in the third and fourth positions are equal to ‘I’. The character in the first position indicates the quality of the report overall as a whole, while the characters in positions three and four indicate quality information about the latitude and longitude, respectively (see also Tables 5 and 6). Consultation of Table 6 indicates that the entire report should be rejected (RR) if a report has the letter ‘P’ in the first character position or the letter ‘I’ in the third or fourth positions. Next, why the report is marked as bad must be determined. According to the “Reject Info” table in the chart called c_qc_values_reasons (a portion of which is shown in Table 9), the first character is equal to ‘P’ for observations from aircraft whose coordinates indicate unrealistic, excessive airspeeds. To have the aircraft to fly from 33.06/278.96 to 31.52/279.42 in the matter of five minutes would result in an airspeed of approximately 565
Table 8: Segment of c_qc_values_reasons/Wind Direction spreadsheet

Page 12 of 13
m/s. Also, for an aircraft to fly from 35.37/280.86 to 36.49/286.67 in 5 minutes, the airspeed would have to be about 868 m/s. For a conventional civilian aircraft, these airspeeds are indeed excessive and indicate that there are errors in the reported position, and therefore, the report should be rejected. In addition, the “Latitude Info” and “Longitude Info” tables (third and fourth spreadsheets respectively in the Excel workbook c_qc_values_reasons.xls) indicate that the character value can be ‘I’ for one of three reasons:
(a) the point is closer to the last rejected point than the last accepted point, (b) the aircraft’s coordinates indicate excessive airspeed, or (c) the aircraft is making more than a 75 degree turn (usually occurs on ascent or descent in the vicinity of a runway upon takeoff or landing). Tables 10 and 11 show the portions of the “Latitude Info” and “Longitude Info” spreadsheets mentioned.
Because of the information gleaned from the “Reject Info,” “Latitude Info,” and “Longitude Info” tables, it can be deduced that the ob in example #3 has been marked bad because the aircraft is determined to be traveling with an excessive airspeed. Upon closer inspection, it
Table 9: Segment of c_qc_values_reasons/Reject Info spreadsheet
Table 10: Segment of c_qc_values_reasons/Latitude spreadsheet
Table 11: Segment of c_qc_values_reasons/Longitude spreadsheet
Page 13 of 13
should be noted that the aircraft is not actually traveling at an excessive speed but rather the latitude and/or longitude is incorrectly reported. The latitudes of the preceding and subsequent observations make sense, but the coordinates of the problematic reports seem to be out of order. Therefore, the problematic reports are marked as rejects. SUMMARY Within this document, the method of interpretation of quality marks and reason codes output by both the old aircraft data QC modules PREPACQC and PREPACARSQC and the new version of the QC module PREPACQC were discussed. Differences between the modules and how they imply quality information were highlighted and detailed. For more information, please visit http://www.emc.ncep.noaa.gov/obs/acqc/ or http://www.emc.ncep.noaa.gov/mmb/data_processing/prepbufr.doc/document.htm.