newton la scala jr fcav / unesp, sp, brazil · newton la scala jr fcav / unesp, sp, brazil workshop...
TRANSCRIPT
Newton La Scala Jr
FCAV / UNESP, SP, Brazil
Workshop – Climate Change x Agriculture, FAPESP
May - 2014
Impact of management practices in the gas emission of sugarcane areas of São Paulo state, in Brazil

Green Harvest
Burned Harvest
A. R. Panosso 2009

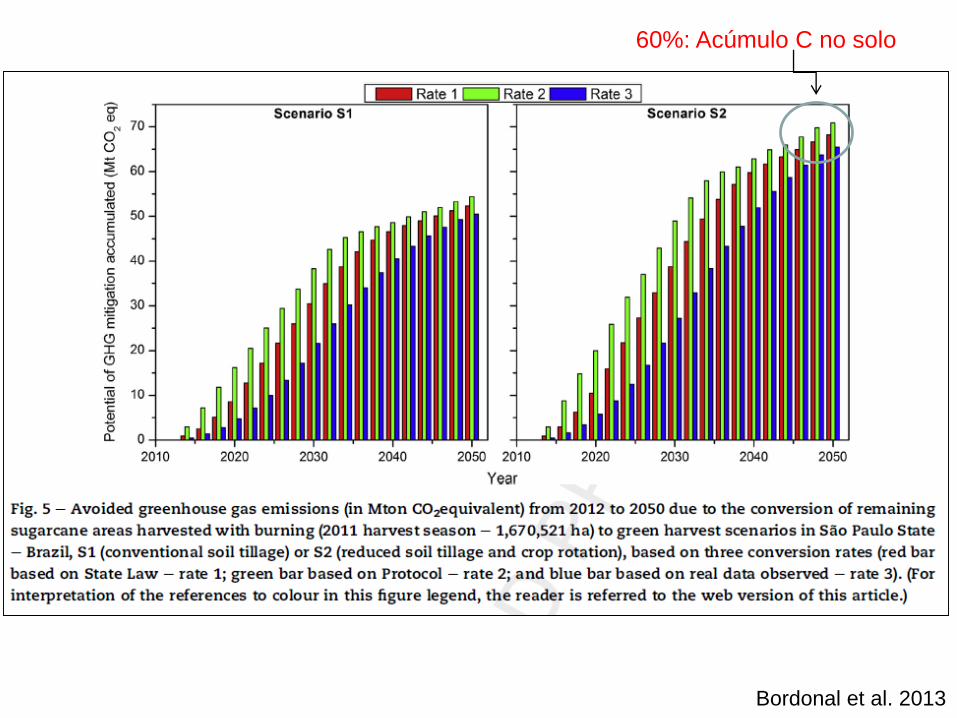
Bordonal et al. 2013

Bordonal et al. 2013

Fig. 3. Emissions of greenhouse gases (in kg CO2eq ha-1 year-1) due to sugarcane agricultural production in São Paulo State,
considering a crop cycle of 6 years for management scenarios S0 (burning harvest that uses conventional soil tillage during
sugarcane field renovation), S1 (green harvest that uses conventional soil tillage during sugarcane field renovation) and S2 (green
harvest that uses reduced soil tillage plus crop rotation, during renovation, with Crotalaria juncea L.).
R. O. Bordonal et al. 2013
Bordonal et al. 2013
60%: Acúmulo C no solo

Green Harvest
Burned Harvest
+Mechanized+ N synth.fert.
Residues burning (CH4 + N2O)
3,104 kg CO2eq year-1
+ C sequest. soil
Figueiredo & La Scala 2011
2,793 kg CO2eq year-1

Table 2. Annual amount of agricultural supplies applied and fossil fuel consumption
(Medium values for a five years crop cycle) for each harvest system in one hectare to
burning harvest and green harvest.
Supplies Burning harvest Green harvest
Units Amount Units Amount
Nitrogen
synthetic
fertilizer
kg ha-1
y-1
88 kg ha-1
y-1
112
Vinasse
application
kg N ha-1
y-1
44.2 kg N ha-1
y-1
44.2
Filtercake
application
kg N ha-1
y-1
21 kg N ha-1
y-1
21
Lime kg ha-1
y-1
400 kg ha-1
y-1
400
Diesel oil L ha-1
y-1
147.68 L ha-1
y-1
223.82
Figueiredo & La Scala 2011

320 kg C hc-1 y-1
760 kg C hc-1 y-1
Figueiredo & La Scala, 2011.
-2500 -2000 -1500 -1000 -500 0 500 1000 1500 2000 2500 3000
1,173
3,104
2,793Sub-Total:
3,1041,620
Total:
C sequestration
Diesel
Liming
Residues Burning
Harvest Residues
Filter Cake
Vinasse
Synthetic Fertilizer
So
urc
e
CO2eq emission (kg ha
-1 y
-1)
Burned harvest Green harvest

1. Bordonal, R. O. ; Figueiredo E. B. ; De Aguiar, D. A. ; Adami, M. ; Rudorff, B. F. T. ; La
Scala, N . Greenhouse gas mitigation potential from green harvested sugarcane
scenarios in São Paulo State, Brazil. Biomass & Bioenergy, v. OnLine, p. 195-207,
2013.
2. Bordonal, R. O. ; Figueiredo E. B. ; La Scala, N . Greenhouse gas balance due to the
conversion of sugarcane areas from burned to green harvest, considering other
conservationist management practices. Global Change Biology. Bioenergy, v. 4, p.
846-858, 2012.
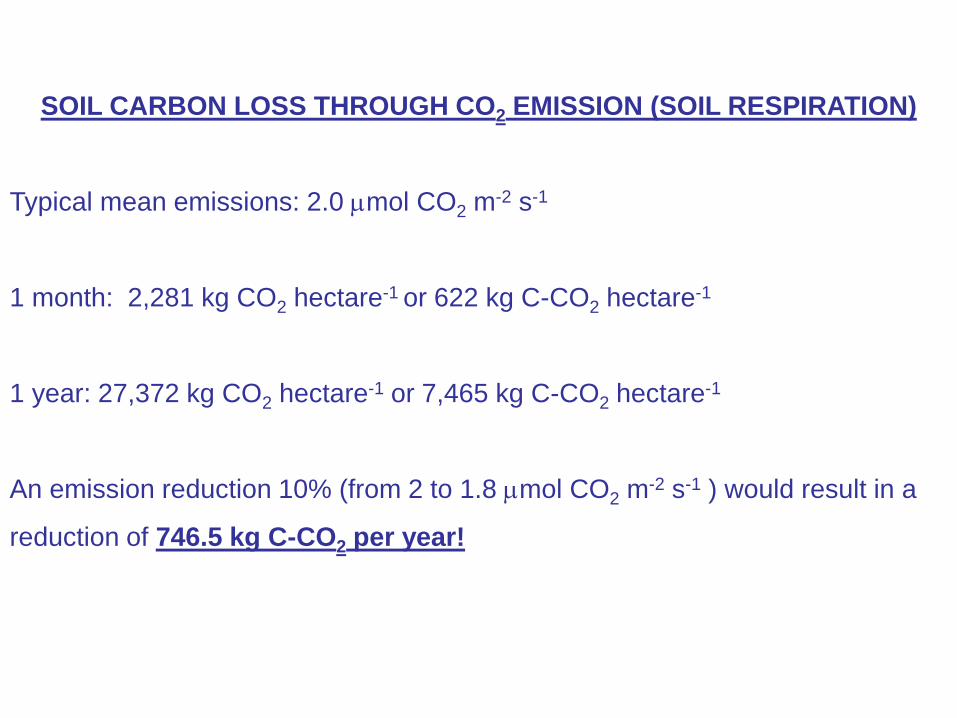
SOIL CARBON LOSS THROUGH CO2 EMISSION (SOIL RESPIRATION)
Typical mean emissions: 2.0 mol CO2 m-2 s-1
1 month: 2,281 kg CO2 hectare-1 or 622 kg C-CO2 hectare-1
1 year: 27,372 kg CO2 hectare-1 or 7,465 kg C-CO2 hectare-1
An emission reduction 10% (from 2 to 1.8 mol CO2 m-2 s-1 ) would result in a
reduction of 746.5 kg C-CO2 per year!

kCdt
dC 2COCF
dt
dC
kCF COC 2
.)(volMoistureporositySoilporosityairFree
Conceptual:
)],(/),(),,(),,(),([ 2 trNCrlayctrOtrmoisturettempkk
StockCarbonC

Figure 2. Linear regression analysis between CO2 emission and soil organic matter
content of the soil (a), air-filled pore space (b) and C/N ratio of the soil.
M. R. Moitinho et al. 2014.


(A.R. Panosso, 2007-2011)
G 192
SB 191
G 201
SB 200
G 246
SB 248
a
b
c
Panosso et al. 2009
21º 24’ S, 48º 09’ OGuariba, SP
Emissions: 2.06 (GH) x 2.87 (BH) µmol m-2 s-1

Figure 15. Plots having different crop residues density on soil surface. October 2009.
D0
D50
D100
(M.M. Corradi, 2010-2011)

(M.M. Corradi, 2010-2011)

Corradi et al. 2013
Difference in total emission (D0-D100) = 386 kg of C-CO2 in 50 days!

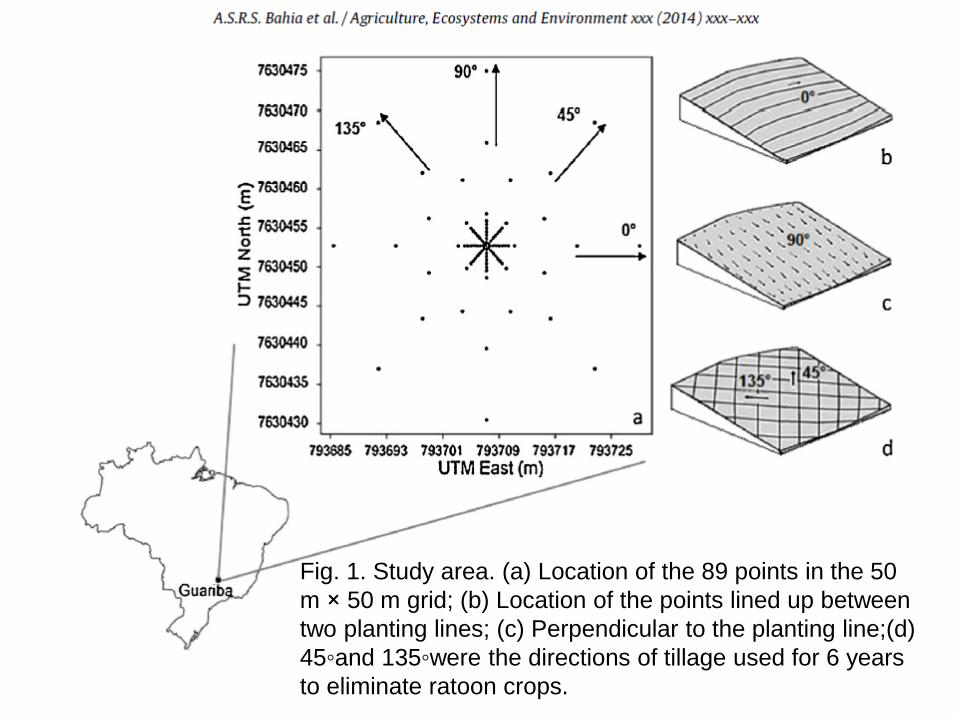
Fig. 1. Study area. (a) Location of the 89 points in the 50
m × 50 m grid; (b) Location of the points lined up between
two planting lines; (c) Perpendicular to the planting line;(d)
45◦and 135◦were the directions of tillage used for 6 years
to eliminate ratoon crops.

Fig. 4. Two-dimensional plot of the first two principal components (biplot).
FCO2= soil CO2emission; FWP = free water porosity; Ts= soil temperature; Ds=
soil density;Ms= soil moisture; Fed= iron oxides extracted by dithionite-citrate-
bicarbonate; Hm = hematite; Gt = goethite.

1. Figueiredo E. B. ; PANOSSO, Alan Rodrigo ; Reicosky, D. C. ; La Scala, N . Short-
term CO2-C emissions from soil prior to sugarcane (Saccharum spp.) replanting in
southern Brazil. Global Change Biology. Bioenergy, v. n/a, p. 1-13, 2014.
2. Bicalho, E. S. ; Panosso, Alan Rodrigo ; Teixeira, D. B. ; Vivas-Miranda J. G. ;
PEREIRA, Gener Tadeu ; LA SCALA, N . Spatial variability structure of soil CO2
emission and soil attributes in a sugarcane area. Agriculture, Ecosystems &
Environment (Print), v. 189, p. 206-215, 2014.
3. Bahia, A. S. R. S. ; Marques Júnior, José ; Panosso, Alan Rodrigo ; Camargo LA ;
Siqueira D.S. ; LA SCALA, N . Iron oxides as proxies for characterizing anisotropy in
soil CO2 emission in sugarcane areas under green harvest. Agriculture, Ecosystems &
Environment (Print), 2014.
4. Bahia, A. S. R. S. ; Marques Júnior, José ; Panosso, Alan Rodrigo ; Camargo LA ;
Siqueira D.S. ; Teixeira, D. B. ; La Scala, N . Field-scale spatial correlation between
iron oxides and CO2 emission in an Oxisol with sugarcane. Scientia Agricola (USP.
Impresso), 2014.

We suggest reduction of tillage intensity and frequency as well as the maintainance of crop residues on soil surface in order to increase
soil C stocks in long term, as a result of reduced emission

acknowledgments:
Fapesp, CNPq, UNESP
Collaborators: J. Marques Jr, A. Lopes, G. T. Pereira, J. G. V.
Miranda.
Grad. + P.Grad students.
Thank You!