NHS in Scotland 2013/14 - Home | Audit Scotland · NHS in Scotland . 2013/14. Prepared by Audit Scotland. ... the capacity of the NHS to provide services and the flow of patients
48
NHS in Scotland 2013/14 Prepared by Audit Scotland October 2014
Auditor General for ScotlandThe Auditor Generalrsquos role is to
bull appoint auditors to Scotlandrsquos central government and NHS bodies
bull examine how public bodies spend public money
bull help them to manage their finances to the highest standards
bull check whether they achieve value for money
The Auditor General is independent and reports to the Scottish Parliament on the performance of
bull directorates of the Scottish Government
bull government agencies eg the Scottish Prison Service Historic Scotland
bull NHS bodies
bull further education colleges
bull Scottish Water
bull NDPBs and others eg Scottish Police Authority Scottish Fire and Rescue Service
You can find out more about the work of the Auditor General on our website wwwaudit-scotlandgovukaboutags
Audit Scotland is a statutory body set up in April 2000 under the Public Finance and Accountability (Scotland) Act 2000 We help the Auditor General for Scotland and the Accounts Commission check that organisations spending public money use it properly efficiently and effectively
NHS in Scotland 201314 | 3
Contents
Key facts 4
Summary 5
Part 1 The NHS in Scotland is facing significant pressures 8
Part 2 Looking ahead 31
Endnotes 45
Appendix 1 Audit methodology 47
Exhibit data
When viewing this report online you can access background data by clicking on the graph icon The data file will open in a new window
4 |
Key facts
09
Expected real terms reduction in the overall health budget from 201314 to 201516
11
Real terms increase in NHS boards revenue budget in 201314
pound2749million
Savings made by NHS boards in 201314
13Percentage of the population expected to be 75 or over in 2037421157
Number of hospital days lost to delayed discharges in 201314
Summary | 5Summary | 5
Summary
Key messages
1 The NHS in Scotland is facing significant pressures at the same time as having to make major changes to services to meet future needs We found evidence that NHS boards are finding it increasingly difficult to cope with these pressures NHS boardsrsquo revenue budgets increased by just over one per cent in real terms in 201314 and smaller real terms increases are planned from 201415 onwards Cost pressures such as staff pay costs the growing costs of drugs and other health technologies and rising pension costs exacerbate this tight financial situation At the same time the demands on the NHS are increasing as a result of demographic change particularly the growing population of elderly and very elderly people the number of people with long-term health conditions and peoplersquos rising expectations of healthcare
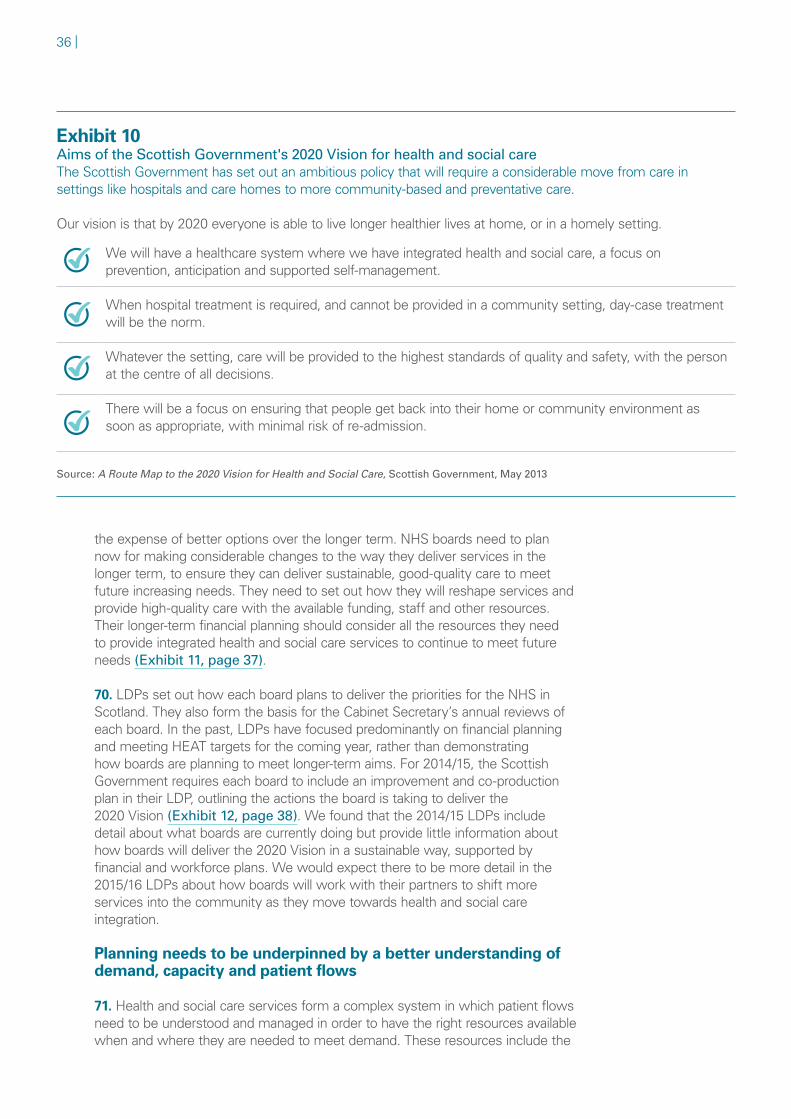
2 The NHS has made good progress in a number of areas including improving outcomes for people with cancer or heart disease and reducing healthcare-associated infections The Scottish Government has set out an ambitious vision for health and social care to enable everyone to live longer healthier lives at home or in a homely setting by 2020 It will be challenging for the NHS to make the scale of changes required over the next few years but critical if it is to meet this vision Progress has been slow and more significant change is needed to move more care into the community The NHS will not be able to continue to provide services in the way it currently does Change on this scale will be challenging at the same time as NHS boards are expected to meet demanding targets for hospital care and when budgets are tightening
3 NHS boards in Scotland delivered a small surplus of pound234 million against an overall budget of pound111 billion All NHS boards met their financial targets but several boards required additional funding from the Scottish Government or relied on non-recurring savings to break even Despite significant efforts the NHS did not meet some key waiting time targets in 201314 The current level of focus on meeting waiting time targets may not be sustainable when combined with additional pressures of increasing demand and tightening budgets There is increasing evidence of lsquopinch pointsrsquo in the complex health and social care system leading to delays in patients getting the care they need in hospital or the community NHS boards need a more detailed understanding of current and future patient demand how they are using their capacity and how patients move through the system in order to assess how they can deliver services differently in the future to better match needs
6 |
Recommendations
The strong focus on meeting annual targets makes it harder to carry out longer-term financial planning This focus makes it difficult for NHS boards to fund services to meet current needs at the same time as making the investment required to reshape care in line with the 2020 Vision NHS boards and their partners need to develop clear plans about how they will deliver sustainable and affordable services to meet future needs by
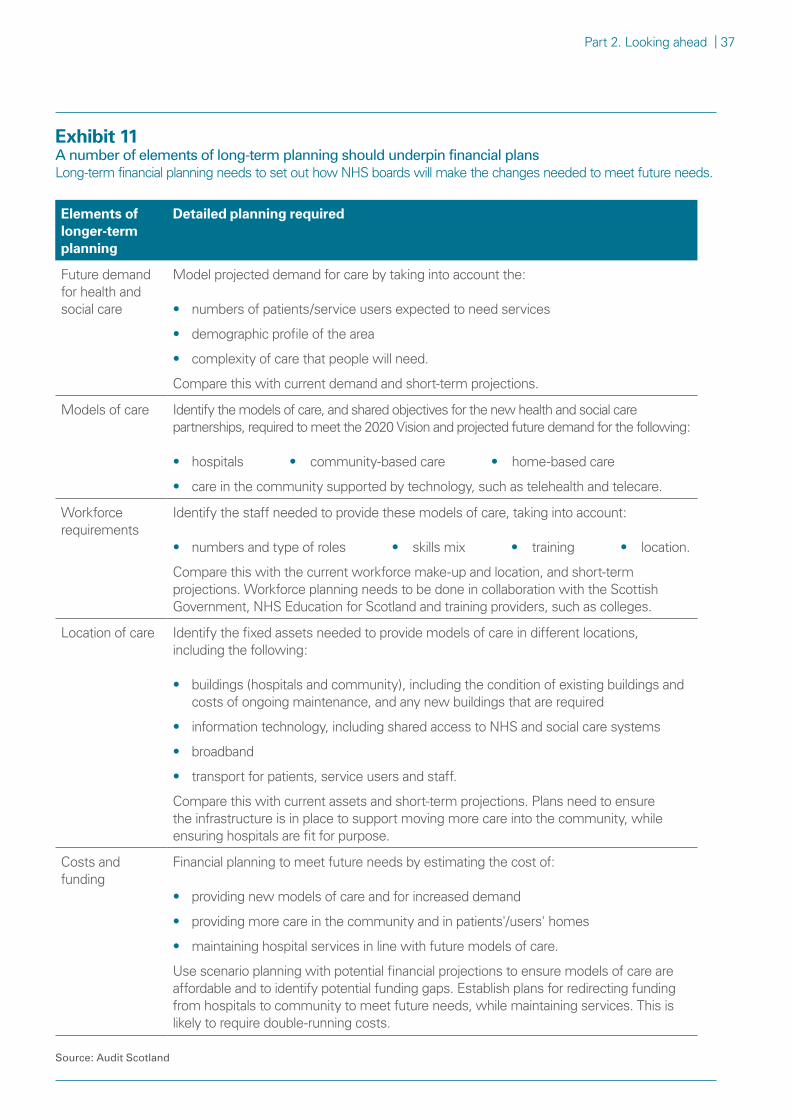
bull using population and long-term condition projections to estimate future demand and identify the way that they will provide care that will meet the future needs of the population and achieve the 2020 Vision
bull developing detailed and integrated long-term plans for how they will move to those models of care These should set out the changes needed to spending workforce buildings information technology and other equipment
bull developing detailed plans to identify the funding they require to move to new models of care and how they will release and move funding to achieve this This includes using budget estimates financial projections scenario planning and economic modelling
bull highlighting any major risks to the Scottish Government to identify what support and action is required at a national level
NHS boards and their partners need to understand blockages in the way that patients move around the health and social care system and which lead to patients not being able to get care where and when they need it They need to use this information to better match patient demand with available staff hospital beds community services and other resources The Scottish Government NHS boards and their partners should
bull improve and maintain data on patterns of demand for and supply of community-based health and social care services
bull ensure they have access to the necessary skills and technology to
ndash record and analyse patterns of demand activity and delays by month week day of the week and time of day
ndash use this data on a real-time basis to make sure that staff and other resources are in place to meet needs
bull use modelling techniques to predict patient needs in the short and longer term They should then use this along with information on available capacity in order to change how they use staffing and other resources to improve the flow of patients around the system and avoid unnecessary delays
Summary | 7
The NHS is facing significant challenges in making the changes required to achieve the 2020 Vision within the tight financial resources available These changes need to happen while continuing to provide services to meet the current needs of patients The Scottish Government should
bull review the current financial and performance targets for the NHS and the planned indicators for integration joint boards to ensure they are consistent with and support the implementation of the 2020 Vision
bull consider introducing milestones to measure the extent to which boards are moving towards more preventative and community-based care
About the audit
1 This report comments on the performance of the NHS in 201314 and on its future plans It is based on our analysis of
bull the audited annual accounts and auditorsrsquo reports on the 201314 audits of the 23 NHS boards
bull NHS boardsrsquo Local Delivery Plans (LDPs) These set out their detailed plans and anticipated budget for the next year and indicative plans for the next three to five years Boards submit their LDPs to the Scottish Government every year for approval
bull monthly Financial Performance Returns (FPRs) that each NHS board submits to the Scottish Government These provide information about NHS boardsrsquo financial performance throughout the financial year
bull NHS activity and performance data published by Information Services Division (ISD) Scotland
bull an analysis of the demand for healthcare services the capacity of the NHS to provide services and the flow of patients through the healthcare system We will publish a briefing paper on this analysis in early 2015
8 |
Part 1The NHS in Scotland is facing significant pressures
all NHS boards met their financial targets in 201314 but some are facing increasing difficulty in achieving them
Key messages
1 All NHS boards broke even against their revenue and capital budgets in 201314 for the sixth year in a row The NHS boards as a whole achieved an overall surplus of pound234 million (021 per cent of their total revenue and capital budgets of pound111 billion) All boards except NHS Western Isles met their savings targets and the NHS as a whole delivered total savings of pound2749 million
2 There are signs that NHS boards are facing increasing difficulty meeting their financial targets and some are doing this in unsustainable ways Four boards required additional funding from the Scottish Government to break even and five continue to rely on high levels of non-recurring savings
3 Despite significant efforts there are increasing signs of pressure on NHS boardsrsquo ability to meet demanding performance targets The strong focus on meeting waiting time targets may not be sustainable when combined with the additional pressures of increasing demand related to demographic changes and the overall NHS budget starting to decrease in real terms The effort that NHS boards are putting into meeting challenging financial and performance targets each year makes it more difficult for them to focus on the long-term planning required to achieve the 2020 Vision
NHS budgets are under pressure
2 The Scottish Government spent pound12 billion on health and wellbeing in 201314 35 per cent of total public spending in Scotland1 It manages the health and wellbeing budget as a whole including NHS boards and sets the national strategy for the NHS in Scotland (Supplement 1 Overview of financial management in the NHS in Scotland) The current national strategy is set out in the 2020 Vision which aims to provide more preventative and ongoing care at home or in homely settings2
3 In 201314 the Scottish Government allocated pound111 billion of the total pound12 billion budget for health and wellbeing to the 14 territorial NHS boards that serve each area of Scotland and deliver frontline healthcare services and to the nine special NHS boards that provide specialist and national services (Supplement 2 Territorial and special boards in Scotland)3
4 Since 200203 the Scottish Governmentrsquos total spending on health (excluding spending on sport and equalities) has increased in real terms (that is taking inflation into account) Health spending per head of population has decreased
Part 1 The NHS in Scotland is facing significant pressures | 9
slightly in real terms since 200910 (Exhibit 1) This is due to smaller increases in the budget compared to previous years and an increasing population The Scottish Governmentrsquos overall health expenditure is planned to decrease by 09 per cent in real terms over the next two years between 201314 and 201516
bull the revenue budget is planned to increase by almost 10 per cent
bull the capital budget is planned to decrease by 536 per cent
Exhibit 1Actual Scottish health budget 200203 to 201314The health budget continues to have small increases in cash terms Health spending per head of population has slightly decreased in real terms since 200910
Hea
lth
spen
ding
per
hea
d of
pop
ulat
ion
(pound)
0
500
1000
1500
2000
2500
Tota
l hea
lth
budg
et (pound
bill
ion)
6
8
10
12
Health spending per head of population (cash terms) Health spending per head of population (real terms)
Health budget (real terms) Health budget (cash terms)
2013
14
2012
13
2011
12
2010
11
2009
10
2008
09
2007
08
2006
07
2005
06
2004
05
2003
04
2002
03
2013
14
2012
13
2011
12
2010
11
2009
10
2008
09
2007
08
2006
07
2005
06
2004
05
2003
04
2002
03
Notes1 The overall health budget is the Scottish Governments total spending on health (excluding spending on sport and equalities) including the budgets allocated to the 14 territorial boards and the nine special boards This includes revenue and capital budgets and annually managed expenditure2 We used 201314 as the reference year for calculating real terms figures3 200203 was the first year of the current three-year budget-setting arrangements and budget figures from before that year are not directly comparable4 Due to an accounting adjustment to the capital budget the cost of capital charges has been removed from budgets prior to 201011
Source Scotlands draft budgets 200708 200809 200910 201011 201112 201213 201314 and 201415 Scottish Government and Mid-Year Population Estimates for Scotland General Register Office for Scotland
Exhibit 1
Audit Scotland
Exhibit 1
Exhibit 1 background data
10 |
5 In 201314 the total amount of revenue funding that the Scottish Government provided to boards increased by almost three per cent in cash terms and by just over one per cent in real terms from 201213
bull All territorial boards received small real terms increases in their revenue budgets There was an overall increase of 16 per cent in 201314
bull Revenue budgets decreased in some special boards mainly in those that do not provide frontline services There was an overall decrease of 05 per cent in 2013144
All NHS boards met their financial targets in 201314 but some are facing increasing difficulty in achieving them
6 NHS boards have two financial targets to break even against both their revenue and capital budgets at the end of the financial year5 This means that NHS boards cannot have a deficit against their budgets at the end of the year The requirement for NHS boards to break even at the end of every year makes it more difficult to carry out longer-term financial planning It makes it difficult for NHS boards to balance the funding of services to meet current needs with the investment required to address longer-term issues
7 Last year we recommended that the Scottish Government should consider moving away from setting annual financial resource limits for NHS boards to help them plan for the longer term6 From 201415 a proportion of funding that the Scottish Government can carry forward each year will be available to the NHS if required (through the budget exchange mechanism) This amount is not fixed and the Scottish Government will decide this on an annual basis7 Although this provides some extra flexibility it does not provide boards with certainty about the amount of additional funding available to allow them to plan ahead The Scottish Government is also able to provide some flexibility each year for NHS boards that want to retain a surplus for investment in the following year NHS boards need to agree this with the Scottish Government in advance As the Scottish Government needs to balance the health budget as a whole each year it can only agree this for a small number of boards or for a small percentage of their budgets
8 All NHS boards broke even in 201314 for the sixth year running There was an overall surplus in the revenue budget of pound233 million for the whole of the NHS in Scotland Supplement 3 Financial performance of NHS boards in 201314 shows the budget and outturn figures for 201314 This represents only 022 per cent of the revenue budget slightly higher than the 016 per cent surplus in 201213 NHS boards normally return any surplus against their budgets at the year-end to the Scottish Government NHS Dumfries and Galloway and NHS Greater Glasgow and Clyde both agreed with the Scottish Government to retain a surplus against their revenue budgets in 201314 of pound3 million and pound10 million respectively This is to support future non-recurring expenditure in relation to new hospitals that are being built in both these boards
Four boards required brokerage in 2013149 The Scottish Government can agree to provide an NHS board with additional funding to help it manage changes to planned expenditure or provide extra money at a time of pressure This is agreed on the basis that the board provides assurance that it can repay the funds in the coming financial years This form of additional funding is known as brokerage The amount of brokerage received by boards in
Part 1 The NHS in Scotland is facing significant pressures | 11
a year is relatively small compared to their overall budget This shows that NHS boards are often working to tight budgets with little flexibility for unexpected costs at the end of the year for example locum costs to cover staff sickness
10 In 201314 four NHS boards received brokerage from the Scottish Government Brokerage can be helpful in providing some additional flexibility in boardsrsquo budgets for unforeseen unexpected financial pressures However poor financial management was a major factor in NHS Highland and NHS Orkney needing brokerage in 201314 Both boards requested brokerage late in the financial year to help them break even due to overspending on their day-to-day running costs
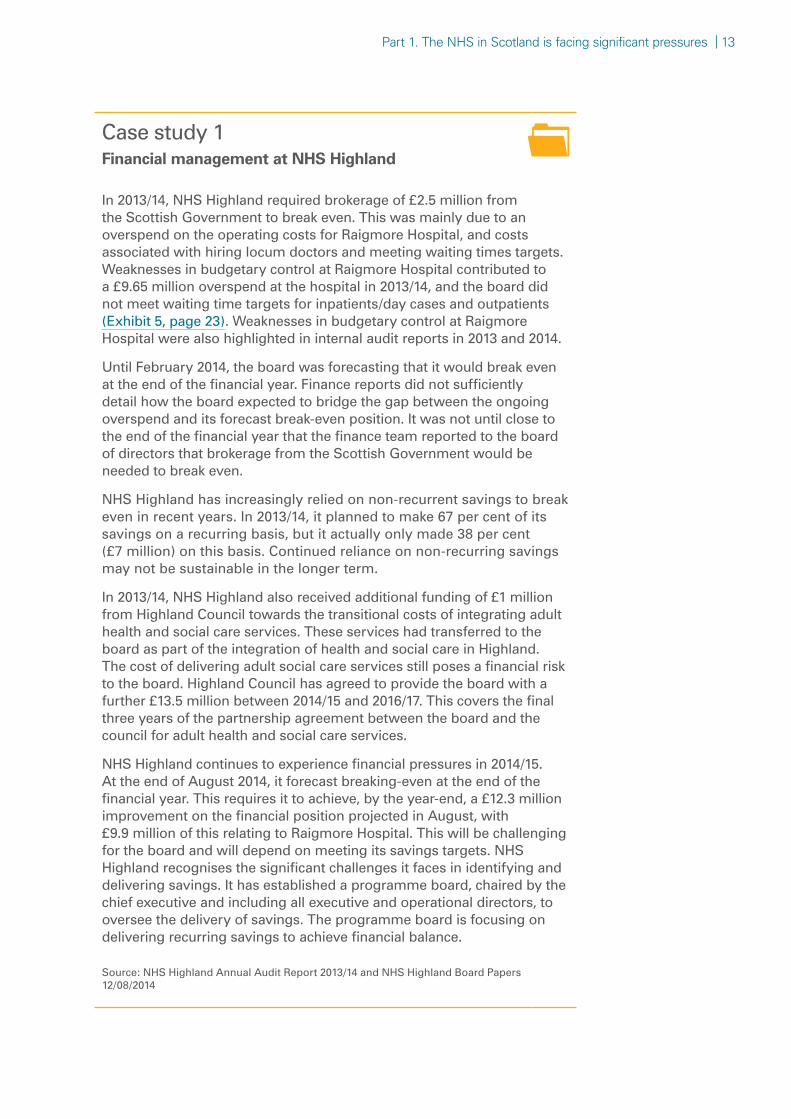
bull NHS Highland received pound25 million (04 per cent of its revenue budget) to cover pressures associated with overspending on the operating costs for Raigmore Hospital and costs associated with hiring locum doctors and meeting waiting times targets (Case study 1 page 13)
bull NHS Orkney received pound1 million (20 per cent of its revenue budget) for additional costs of hiring locum doctors (Case study 2 page 14)
bull NHS 24 received pound39 million (53 per cent of its revenue budget) for the financial implications of delays and ongoing issues in implementing a new IT system This is likely to have financial implications for the board in future years (Case study 3 page 15)
bull NHS Tayside received pound285 million (04 per cent of its revenue budget) for deferring the sale of property with an anticipated profit of pound2 million and associated ongoing maintenance costs This is the second year running the board received brokerage for this reason
Three NHS boards faced particular financial difficulties in 20131411 The external auditors have raised concerns about the financial position and financial management in NHS Highland and NHS Orkney and the financial position in NHS 24 Both NHS Highland and NHS Orkney received brokerage to meet operational cost pressures but did not identify this need until late in the financial year Both boards also made high levels of non-recurring savings to help them break even This is a less sustainable way to meet savings targets than making recurring savings as it means the boards need to find these same savings again in other areas in future years NHS Highland and NHS Orkney both receive funding allocations from the Scottish Government that are less than that recommended by the national funding formula (paragraph 13) While this may contribute to their financial pressures these boards also need to improve their financial management (Case study 1 and Case study 2) NHS 24 has experienced financial difficulties due to problems implementing a new IT system (Case study 3) The Auditor General has prepared separate reports on each of these three boards8
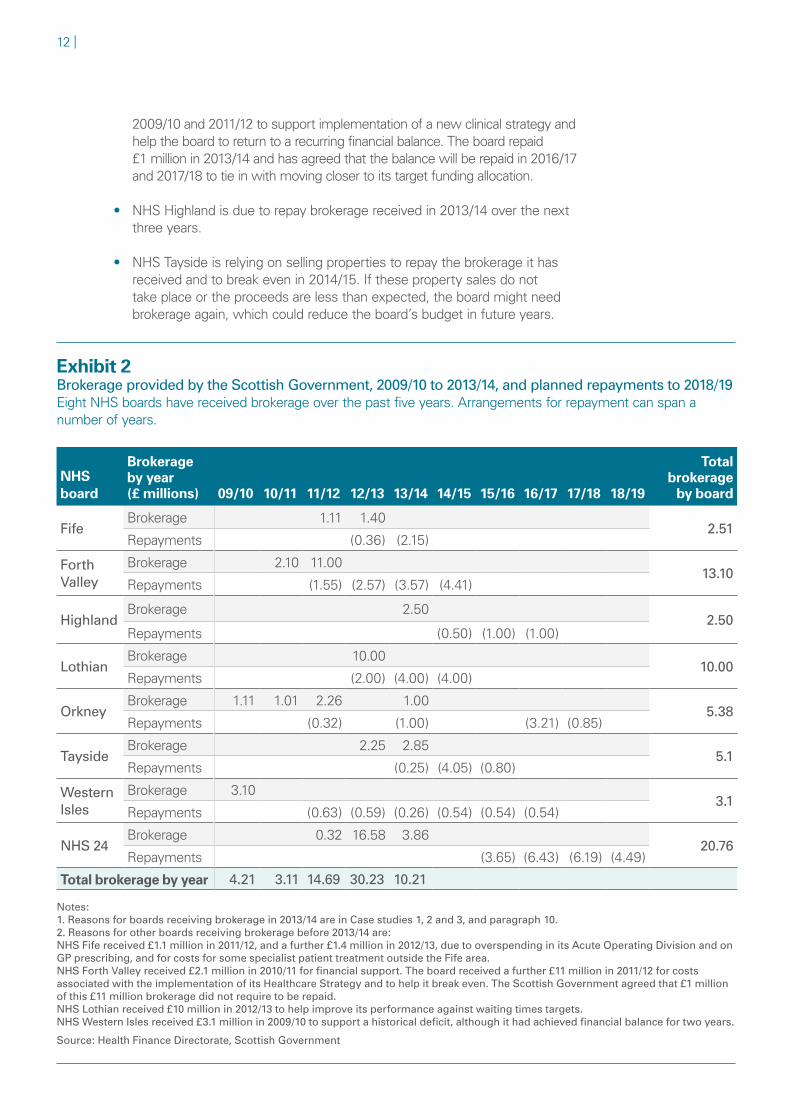
Seven boards have ongoing commitments to repay brokerage12 The Scottish Government has agreed brokerage with eight NHS boards over the past five years with five of these boards receiving brokerage in more than one financial year (Exhibit 2 page 12) Seven NHS boards have ongoing commitments to repay brokerage after 201314 reducing the amount they will have available to spend on services during this period For example
bull NHS Orkney has received brokerage on four occasions and its repayment schedule spans a seven-year period Brokerage was received between
12 |
200910 and 201112 to support implementation of a new clinical strategy and help the board to return to a recurring financial balance The board repaid pound1 million in 201314 and has agreed that the balance will be repaid in 201617 and 201718 to tie in with moving closer to its target funding allocation
bull NHS Highland is due to repay brokerage received in 201314 over the next three years
bull NHS Tayside is relying on selling properties to repay the brokerage it has received and to break even in 201415 If these property sales do not take place or the proceeds are less than expected the board might need brokerage again which could reduce the boardrsquos budget in future years
Exhibit 2Brokerage provided by the Scottish Government 200910 to 201314 and planned repayments to 201819Eight NHS boards have received brokerage over the past five years Arrangements for repayment can span a number of years
NHS board
Brokerage by year (pound millions) 0910 1011 1112 1213 1314 1415 1516 1617 1718 1819
Total brokerage
by board
FifeBrokerage 111 140
251Repayments (036) (215)
Forth Valley
Brokerage 210 11001310
Repayments (155) (257) (357) (441)
HighlandBrokerage 250
250Repayments (050) (100) (100)
LothianBrokerage 1000
1000Repayments (200) (400) (400)
OrkneyBrokerage 111 101 226 100
538Repayments (032) (100) (321) (085)
TaysideBrokerage 225 285
51Repayments (025) (405) (080)
Western Isles
Brokerage 31031
Repayments (063) (059) (026) (054) (054) (054)
NHS 24Brokerage 032 1658 386
2076Repayments (365) (643) (619) (449)
Total brokerage by year 421 311 1469 3023 1021 Notes1 Reasons for boards receiving brokerage in 201314 are in Case studies 1 2 and 3 and paragraph 102 Reasons for other boards receiving brokerage before 201314 areNHS Fife received pound11 million in 201112 and a further pound14 million in 201213 due to overspending in its Acute Operating Division and on GP prescribing and for costs for some specialist patient treatment outside the Fife area NHS Forth Valley received pound21 million in 201011 for financial support The board received a further pound11 million in 201112 for costs associated with the implementation of its Healthcare Strategy and to help it break even The Scottish Government agreed that pound1 million of this pound11 million brokerage did not require to be repaid NHS Lothian received pound10 million in 201213 to help improve its performance against waiting times targetsNHS Western Isles received pound31 million in 200910 to support a historical deficit although it had achieved financial balance for two years
Source Health Finance Directorate Scottish Government
Part 1 The NHS in Scotland is facing significant pressures | 13
Case study 1Financial management at NHS Highland
In 201314 NHS Highland required brokerage of pound25 million from the Scottish Government to break even This was mainly due to an overspend on the operating costs for Raigmore Hospital and costs associated with hiring locum doctors and meeting waiting times targets Weaknesses in budgetary control at Raigmore Hospital contributed to a pound965 million overspend at the hospital in 201314 and the board did not meet waiting time targets for inpatientsday cases and outpatients (Exhibit 5 page 23) Weaknesses in budgetary control at Raigmore Hospital were also highlighted in internal audit reports in 2013 and 2014
Until February 2014 the board was forecasting that it would break even at the end of the financial year Finance reports did not sufficiently detail how the board expected to bridge the gap between the ongoing overspend and its forecast break-even position It was not until close to the end of the financial year that the finance team reported to the board of directors that brokerage from the Scottish Government would be needed to break even
NHS Highland has increasingly relied on non-recurrent savings to break even in recent years In 201314 it planned to make 67 per cent of its savings on a recurring basis but it actually only made 38 per cent (pound7 million) on this basis Continued reliance on non-recurring savings may not be sustainable in the longer term
In 201314 NHS Highland also received additional funding of pound1 million from Highland Council towards the transitional costs of integrating adult health and social care services These services had transferred to the board as part of the integration of health and social care in Highland The cost of delivering adult social care services still poses a financial risk to the board Highland Council has agreed to provide the board with a further pound135 million between 201415 and 201617 This covers the final three years of the partnership agreement between the board and the council for adult health and social care services
NHS Highland continues to experience financial pressures in 201415 At the end of August 2014 it forecast breaking-even at the end of the financial year This requires it to achieve by the year-end a pound123 million improvement on the financial position projected in August with pound99 million of this relating to Raigmore Hospital This will be challenging for the board and will depend on meeting its savings targets NHS Highland recognises the significant challenges it faces in identifying and delivering savings It has established a programme board chaired by the chief executive and including all executive and operational directors to oversee the delivery of savings The programme board is focusing on delivering recurring savings to achieve financial balance
In 201314 NHS Orkney required brokerage of pound1 million from the Scottish Government to break even This was largely due to hiring locum doctors to cover vacant medical posts
Throughout the year NHS Orkney was reporting an overspend against its revenue budget to its Finance and Performance Committee and this increased considerably over the second half of the financial year The board did not have detailed plans for how it was going to bridge the gap between its ongoing overspend position and its forecast break-even position at the year-end or provide reports to its Board of directors about how it would achieve this We were informed that officers discussed actions with Board members
NHS Orkney approached the Scottish Government in February 2014 to request brokerage of pound075 million This was later revised to pound1 million in March 2014 The Scottish Government has agreed that the board does not need to start repaying the total amount of brokerage received of pound406 million (including brokerage received in previous years) until 201617 (Exhibit 2 page 12) This is when the board should receive additional funding to take it closer to its target funding allocation (paragraph 13)
During the audit of the boardrsquos 201314 annual accounts the auditor identified a significant error relating to accounting entries associated with the five-yearly revaluation of its land and buildings during 201314 Due to a lack of capacity within NHS Orkneys finance team staff from NHS Fife assisted the board in resolving this issue The auditor has expressed some concern about the capacity of the finance team given the pressures facing the board
In recent years NHS Orkney has relied on non-recurring savings to break even (Exhibit 3 page 17) In 201314 it achieved pound042 million recurring savings against a target of pound103 million (41 per cent of the target) The boards financial plans for 201415 also rely on non-recurring savings It plans to make over 66 per cent of its planned savings on a non-recurring basis due to the non-recurring nature of the pressures facing the board such as using locum and agency staff until permanent staff are recruited Taking into account the need to continue to deliver savings and to repay brokerage the auditor has highlighted that delivering a break-even position in the coming years will be challenging for the board There are specific pressures that may affect NHS Orkneys ability to achieve the savings required for longer-term sustainability particularly workforce pressures and associated costs of hiring locum doctors Between 201213 and 201314 the boards spending on locum doctors increased by 30 per cent The board recruited a number of staff to key posts in 201314 but it has underlying recruitment problems and has not been able to fill some posts despite several recruitment campaigns Continued reliance on locum doctors will have a significant impact on its plans to achieve savings
The Chief Executive asked the boardrsquos internal auditor to undertake a detailed review of the boardrsquos 201314 financial position This includes an examination of the boardrsquos approach to budget-setting and in-year financial management The review is now complete and the board is developing an action plan
Source NHS Orkney Annual Audit Report 201314
Part 1 The NHS in Scotland is facing significant pressures | 15
Case study 3NHS 24s Future Programme
NHS 24 planned to implement its Future Programme in September 2013 This includes delivering new technology that is central to NHS 24 improving its core telephone and online services for patients NHS 24 also expected the new application to deliver financial savings NHS 24 has delayed implementation as it considers that the new application currently developed does not meet its patient safety requirements
The delay in implementing the new system has led to additional costs being incurred The total cost of the project to date is pound38 million considerably more than the original business case of pound296 million The board has estimated that it will incur further additional costs of pound146 million between 201415 and 201516 to achieve an acceptable solution This includes potential new investment in developing the IT system the costs of continuing to maintain the current system during the delay and failing to achieve savings that were expected as a result of the new system
By the end of 201213 the Scottish Government had provided NHS 24 with brokerage of pound169 million and pound08 million in revenue funding to fund the Future Programme The boards financial plan for 201314 included agreed brokerage of pound17 million to support what was planned to be the final year of implementing the Future Programme Due to the delays and ongoing problems implementing the new IT system the Scottish Government agreed to provide a further pound22 million brokerage taking the total provided in 201314 to pound39 million NHS 24 was due to repay the brokerage over three years from 201415 but the Scottish Government has agreed that this can be postponed to start in 201516 (Exhibit 2 page 12)
NHS 24 has drafted a five-year financial plan for 201415 onwards This projects a break-even revenue position for the first four years of the plan and a small surplus position in year five The plan has factored in the financial implications of resolving the issues with the Future Programme and the board will update this on an ongoing basis as the situation evolves The auditor has highlighted that the achievement of financial targets is likely to remain a high risk for the board given the extent of the issues that need to be resolved and the requirement to repay brokerage in future years
NHS 24 has kept the Scottish Government informed about the problems with the Future Programme The board and the Scottish Government jointly commissioned an independent review and NHS National Services Scotland has also recently provided additional support to NHS 24 through contract management and technical specialists The board is continuing to work with the suppliers of the new IT system on resolving the issues
The board has ensured that the current IT systems can be maintained in a safe and reliable manner so that services for patients are not affected
Source NHS 24 Annual Audit Reports 201213 and 201314
16 |
Four NHS boards are still receiving less than their target funding allocation13 The Scottish Government uses a formula developed by the National Resource Allocation Committee (NRAC) to allocate funding to territorial boards The formula has been in place since 200910 and the Scottish Government is aiming for all NHS boards to be within one per cent of their target allocations by 201617 Territorial boards receive an increase in funding each year however some boardsrsquo allocations are below the amount proposed by the formula Four boards were more than one per cent below their target allocations in 201314 and 201415
bull NHS Orkney -122 per cent (pound48 million) in 201314 -111 per cent (pound45 million) in 201415
bull NHS Grampian -51 per cent (pound399 million) in 201314 -37 per cent (pound302 million) in 201415
bull NHS Highland -22 per cent (pound113 million) in 201314 -23 per cent (pound123 million) in 201415
bull NHS Lanarkshire -15 per cent (pound127 million) in 201314 -17 per cent (pound153 million) in 201415
14 Receiving funding that is below their target NRAC allocation may have contributed to financial difficulties in NHS Highland and NHS Orkney Both boards broke even in 201314 using unsustainable methods specifically brokerage from the Scottish Government and high levels of non-recurring savings However the level of NRAC funding is not the only factor causing financial difficulties at NHS Highland and NHS Orkney We have identified concerns about financial management at these boards NHS Grampian and NHS Lanarkshire also received funding allocations of more than one per cent below their target NRAC allocations NHS Grampian only met two of the eight waiting time targets and the number of its patients with a delayed discharge increased (Exhibit 5 page 23)
Five boards continue to rely on high levels of non-recurring savings
15 Boards are required to make efficiency savings of three per cent against their revenue budgets and had forecast savings of pound2678 million in 201314 The actual savings achieved totalled pound2749 million (pound2447 million by territorial boards and pound302 million by special boards) All boards met their savings targets except NHS Western Isles which was pound30000 (16 per cent) below its target NHS boards retain savings made locally as part of their overall financial planning to help balance their budgets
16 Some boards are still relying on a high percentage of non-recurring savings (Exhibit 3 page 17) These are savings that are only made for one year rather than savings that the board will continue to make every year9 It can be appropriate to have some non-recurring savings but it is important that the majority of savings are recurring to ensure the sustainability of the boards financial position and to reduce the risk of not achieving savings targets in future years We have highlighted this as a risk in our reports over the last two years and the risk still remains The area that contributed most to NHS boardsrsquo savings was productivity NHS boards made total savings of pound1141 million in this area against a forecast pound1027 million However 26 per cent of these savings were non-recurring compared with a forecast of 14 per cent This suggests that these
Part 1 The NHS in Scotland is facing significant pressures | 17
Exhibit 3Recurring and non-recurring savingsA number of NHS boards relied on a high level of non-recurring savings in 201314 and 11 boards made higher levels of non-recurring savings than in 201213
RecurringNon-recurring
201213 201314
NHS Orkney
Territorial boards
Special boards
NHS Highland NHS Borders NHS Tayside
NHS Shetland NHS Lanarkshire NHS Ayrshire and Arran NHS Fife
NHS Western Isles NHS Lothian NHS Dumfries and Galloway NHS Grampian
NHS Forth Valley
The State HospitalNational
Waiting Times CentreHealthcare
Improvement ScotlandNHS Education
for Scotland
NHS 24Scottish
Ambulance ServiceNHS Health
ScotlandNHS National
Services Scotland
NHS Greater Glasgow and Clyde
RecurringNon-recurring
1213 1314 1213 1314 1213 1314 1213 1314
1213 1314 1213 1314 1213 1314 1213 1314
1213 1314 1213 1314 1213 1314 1213 1314
1213 1314 1213 1314
1213 1314 1213 1314 1213 1314 1213 1314
1213 1314 1213 1314 1213 1314 1213 1314
Source NHS boards financial performance returns March 2014 NHS Orkney updated its savings information in July 2014
Exhibit 3
Audit Scotland
Exhibit 3
Exhibit 3 background data
Exhibit 3
kwalker
Sticky Note
Unmarked set by kwalker
Exhibit 3
18 |
savings were the result of short-term initiatives rather than changing the way that services are provided in order to improve productivity This is similar to last year when 28 per cent of productivity savings were non-recurring higher than forecast The difficulty NHS boards have achieving recurring productivity savings is another strain on them and adds to their financial pressures for the coming year
17 Seven territorial and four special boards had higher overall levels of non-recurring savings in 201314 than in the previous year10 Five boards reported a particularly high percentage of non-recurring savings
bull NHS Highland (62 per cent)
bull NHS Orkney (59 per cent)
bull NHS Borders (52 per cent)
bull NHS Tayside (50 per cent)
bull NHS Shetland (48 per cent)
18 These boards will have to find further savings in future years on top of the annual savings target This position is not sustainable especially since boards are required to continue to make three per cent savings from 201415
19 NHS boards set out their financial projections up to five years ahead in their Local Delivery Plans (LDPs) showing expected funding projected expenditure and the savings required each year to close the gap between income and expenditure For 201415 NHS boardsrsquo detailed financial planning is still limited mainly to the first year of the LDP Across the NHS
bull six per cent of the required savings for 201415 are unidentified
bull over two-thirds of the amount of savings are unidentified for the following four years
bull five NHS boards have not identified the breakdown of the amount of their savings after 201415 (Fife Forth Valley Greater Glasgow and Clyde Lothian and Western Isles)
NHS boards are making less progress than expected on reducing backlog maintenance
20 Further cost pressures arise from the backlog of maintenance required to ensure that hospitals and other buildings are fit for purpose In 2012 the Scottish Government forecast that the cost of this backlog would decrease by pound174 million by 2013 from pound948 million to pound774 million11 The actual reduction was pound90 million to pound858 million12 The high-risk backlog reduced to pound96 million pound21 million less of a reduction than anticipated The significant-risk backlog rose from pound265 million to pound275 million13 This reflects additional maintenance identified by boards through survey work during 2013 as well as some lack of progress in carrying out backlog maintenance
21 The level of backlog maintenance decreased in 14 boards and increased in seven14 The total increase in the seven boards was pound199 million of which NHS
Part 1 The NHS in Scotland is facing significant pressures | 19
Fife had by far the largest increase of pound135 million In three of these boards (NHS Borders NHS Highland and the Scottish Ambulance Service) the backlog had also increased in 2012 The increase of pound34 million in NHS Highland is a further financial pressure on the board In four boards over 50 per cent of the cost of backlog maintenance was classed as high-risk and significant risk NHS Lothian (84 per cent) NHS Shetland (82 per cent) NHS Tayside (54 per cent) and NHS Ayrshire and Arran (52 per cent)
22 The Scottish Government now forecasts that the majority of high-risk maintenance backlog will be cleared by 2015 one year later than originally planned The significant-risk backlog is now forecast to decrease to around pound150 million by 2017 compared with the previous forecast that it would be cleared by 2016
The annual financial target for capital spending makes it difficult to plan longer-term projects
23 Capital investment is important in enabling boards to plan and deliver the 2020 Vision by investing in new healthcare facilities maintaining and modernising existing facilities that will be required in future and disposing of those that are no longer needed The NHS capital budget available to boards fell by 21 per cent between 201213 and 201314 from pound6055 million to pound4813 million More than half of this reduction related to accounting adjustments associated with revenue-financed methods such as Non-Profit Distribution (NPD) which do not affect the capital funds available for boards to spend The remaining capital budget available to boards reduced by 12 per cent to pound4664 million
24 All boards broke even against their capital budgets in 201314 but significant movements in their budgets were required during the year to allow them to reach that position (Exhibit 4 page 20) The Scottish Government manages the capital budget carefully during the year moving funds from NHS boards that expect delays in their expenditure to those that are able to make use of the funding This allows the NHS as a whole and individual boards to stay within their capital budgets but it makes it difficult to see how well NHS boards have managed their resources The Scottish Government has increased the proportion of total capital funding that is included in initial allocations each year although it did not agree final budgets with several NHS boards until after the end of the financial year NHS boardsrsquo annual accounts are still not clear about the extent of and reasons for movements in their capital budgets during the year
25 The annual financial targets for capital budgets and uncertainty about future budgets hinders NHS boardsrsquo effective planning of capital projects For example NHS boards returned around pound29 million of capital funding to the Scottish Government during 201314 A number of boards that had returned capital funds in previous years received these funds back in 201314 and subsequently returned them again For example NHS Grampian agreed with the Scottish Government to defer some of its capital budget allocation from 201112 and 201213 into 201314 to help manage the cost of essential backlog maintenance at Aberdeen Royal Infirmary From 201415 the Scottish Government has issued two-year indicative capital allocations to NHS boards to help them manage their capital programmes
26 The NHS needs the right buildings and facilities to achieve the 2020 Vision and provide healthcare that meets future needs Over the next four years the
20 |
Scottish Government plans to invest around pound330 million in new facilities and other capital projects in the community15 This investment is intended to help move towards more community-based and preventative care by April 2017 For example NHS Forth Valley Stirling Council and Forth Valley College plan to develop the Stirling Care Village as part of their wider plans to change and improve care for older people This model intends to combine primary and community healthcare with care for older people providing joined-up services GP surgeries the voluntary sector and other local service providers will also be involved in delivering enhanced services through this model of care16
Exhibit 4There were significant movements in the NHS capital budget in 201314Both the overall capital budget and the budget available for investment decreased from 201213
201213pound million
201314pound million change
Total capital budget 6055 4813 -2052
Split into
Capital provided for investment in board capital programmes 5281 4664 -1168
Capital funded by the Scottish Parliament for accounting treatment for new revenue-financed projects
775 149 -8072
There were also significant movements in the capital budget across all boards These follow a similar pattern to the movements in 201213
Note The capital budget shown here is represented by the final capital resource limits (CRLs) from the NHS boards accounts This differs from the capital budget allocated to the NHS within the Scottish Government Budget due to adjustments for example for assets donated to the boards
Part 1 The NHS in Scotland is facing significant pressures | 21
There have been improvements in the quality of healthcare
27 The Scottish Government has set out the national strategy for the NHS in the 2020 Vision and the Healthcare Quality Strategy These aim to improve the quality and safety of patient care and health outcomes17 The Scottish Patient Safety Programme focuses on improving the safety and reliability of healthcare and reducing harm For example a focus on healthcare-associated infections (HAIs) resulted in a 50 per cent reduction in adult patients in hospital with HAIs between 2005 and 2011 (from 95 per cent to 49 per cent) and rates continue to fall18 Health outcomes for some conditions have also improved Cancer and heart disease are the two main causes of death in Scotland Between 2003 and 2012 the death rate for all forms of heart disease fell by 38 per cent and the number of people having a heart attack fell by a fifth19 The Scottish Government has a policy objective to improve early detection of cancer which improves outcomes for patients Between 2010 and 2013 the number of people diagnosed with early stage breast colorectal or lung cancer increased by 75 per cent Patient satisfaction with hospital inpatient services has also generally increased since 201220
Performance against waiting time targets is showing increasing signs of pressure
28 NHS boards are required to meet a number of performance targets that cover health improvement efficiency access and treatment (HEAT targets) These aim to ensure that NHS boards focus on making improvements in areas the Scottish Government has identified as priorities to help to achieve its overall purpose and objectives21 In recent years the Scottish Government has reduced the number of HEAT targets and has committed to focusing more on outcomes But the level of performance that boards are expected to achieve has become more challenging at the same time as budgets are tightening This is making it increasingly difficult for NHS boards to continue to meet HEAT targets
29 Many of the HEAT targets relate to waiting times Waiting time targets have reduced over the past ten years and the length of time that people wait has decreased considerably Some targets have become more challenging for NHS boards recently
bull Delayed discharges ndash since April 2013 NHS boards have been working to the target that no patient should wait in hospital for more than 28 days from when they are clinically ready for discharge (reduced from 42 days previously) From April 2015 this is due to reduce further to 14 days Boards are finding it difficult to meet the current target with only three boards meeting this at the end of April 2014 (Exhibit 5 page 23)
bull Specialist Child and Adolescent Mental Health Services (CAMHS) ndash the current target is that 90 per cent of patients should wait no longer than 26 weeks from referral to treatment This target is due to reduce to 18 weeks from December 2014 Performance against the current target deteriorated between 201213 and 201314 from 99 to 93 per cent of all patients seen within 26 weeks (Exhibit 5)
bull The treatment time guarantee (TTG) was introduced on 1 October 2012 under the Patient Rights (Scotland) Act 2011 All eligible patients now
22 |
have a legal right to receive planned inpatient or day-case treatment within 12 weeks of the treatment being agreed This is the first time that waiting times have been a legal right and puts more pressure on boards to ensure that all patients are seen within the required time The TTG has not been met nationally since it was introduced and only five territorial boards met it in March 2014
30 Last year we highlighted that the failure to meet some key waiting time targets suggested capacity pressures in boards Overall performance against several of these targets deteriorated between 201213 and 201314 indicating increasing capacity pressures in boards (Exhibit 5) The Scottish Government has recently lowered the threshold for the AampE target as boards were struggling to meet it From April 2013 the AampE waiting time target was temporarily lowered from 98 per cent of patients to be seen within four hours to 95 per cent The 95 per cent target is due to be delivered by the year ending September 2014 and performance data will be published at the end of November 2014
31 Across Scotland at the end of March 201422
bull Only three of the key waiting time targets were met nationally the drug and alcohol treatment target (met by all 14 territorial boards) the cancer (decision to treat to first treatment) target (met by 11 territorial boards) and access to CAMHS (met by nine territorial boards) These three targets were also met at the end of March 2013 The 18-week referral to treatment target which was met in at the end of March 2013 was not met at the end of March 2014
bull No territorial board met the outpatient waiting time target and only three boards met the delayed discharges target (NHS Ayrshire and Arran NHS Orkney and NHS Shetland)
bull Boards are finding it challenging to meet the TTG four-hour AampE target and cancer (urgent referral to first treatment) target
bull Performance against the targets varied by board While NHS Orkney met eight of the nine targets and NHS Shetland met seven NHS Grampian and NHS Lothian met two of the nine targets NHS Greater Glasgow and Clyde and NHS Highland met three and NHS Tayside met four
32 More detailed analysis of performance against these key targets highlights the variability across boards and specialties For example most patients waiting longer than the TTG target of 12 weeks at the end of March 2014 were in NHS Lothian and NHS Grampian More recent information for June 2014 shows that
bull no patients were waiting longer than 12 weeks in any specialty in NHS Forth Valley NHS Greater Glasgow and Clyde NHS Lanarkshire NHS Orkney NHS Shetland and NHS Western Isles
bull the three boards with the highest number of people waiting for more than 12 weeks for treatment were NHS Lothian NHS Highland and NHS Grampian
bull the specialties with the highest number of people waiting more than 12 weeks in NHS Lothian were plastic surgery (125 patients) urology (93) and general surgery (49) in NHS Highland it was trauma and orthopaedics (166) and in NHS Grampian it was plastic surgery (133) and ophthalmology (88)23
Part 1 The NHS in Scotland is facing significant pressures | 23
Exhibit 5Performance against waiting time and delayed discharge targets in territorial NHS boardsPerformance against some waiting time targets deteriorated in some boards (end of March 2013 to end of March 2014)
Child and Adolescent Mental Health Services (CAMHS)1
Drug and alcohol treatment2
Referral to treatment (RTT)1
Out-patients1
Inpatientday-case treatment time guarantee (TTG)1 3 4 AampE1
Cancer ndash urgent referral to first treatment2
Cancer ndash decision to treat to first treatment2
Delayed discharges5
Targetstandard 26 wks 3 wks 18 wks 12 wks 12 wks 4 hrs 62 days 31 days 4 wks
Met Met temporaryinterim target Met for over 99 of patients Within 5 Not met
Notes1 Data is for month ended 31 March 2013 and 2014 CAMHS data for NHS Highland is not available for March 2014
The AampE target was 98 per cent at March 2013 and 95 per cent at March 2014 2 Data for quarter ended 31 March 2013 and 20143 TTG applies to patients added to the waiting list from 1 October 2012 only4 TTG incorporates a legal right to treatment so we have categorised this as met not met or met for over 99 per cent of patients5 Performance against this standard is based on a census at point in time The delayed discharges data are at the end of April 2013 and 20146 National Waiting Times Board is not included in this table Four of these targets apply to this board ndash Referral to treatment (RTT) Outpatients Inpatientday case treatment time guarantee (TTG) and Cancer ndash decision to treat to first treatment The board met all four of these targets
Source Based on data from ISD Scotland and subject to any caveats described by ISD Scotland
24 |
Demand for outpatient appointments is increasing faster than the number of patients seen33 NHS boards need to manage demand for outpatient clinics alongside inpatients and day cases They are finding it difficult to meet the target that new outpatients should be seen within 12 weeks of referral and none of the territorial boards met the target throughout 20131424 Demand for outpatient appointments has increased over the last three years but the number of people seen has not increased to the same extent At the quarter ending March 2014
bull the number of people on waiting lists for a new outpatient appointment was 34 per cent higher than at the quarter ending March 2010 increasing from 187693 to 252009
bull the number of new outpatients seen during the same period increased by only 13 per cent from 324403 to 367259 meaning that the number of people waiting is continuing to increase
bull the number of people who had been waiting longer than 12 weeks increased from 157 at the quarter ending March 2010 to 6754 at the quarter ending March 2014
34 The increasing number of people waiting over 12 weeks indicates pressure on NHS boardsrsquo capacity For example the number of procedures carried out in outpatients has more than doubled since 200809 to 380456 procedures in 201213 There are risks this pressure will increase as demand continues to grow This pressure can only be tackled by some combination of
bull increasing the number of new outpatient appointments available for example by allocating additional staffing and other resources
bull further reducing the number of people attending for follow-up appointments (the ratio of follow-up to new appointments has reduced from 23 in 2004 to 19 in 2013) A new approach is being implemented in hospitals across Scotland to reduce the number of follow-up patients attending orthopaedic clinics (Case study 4 page 25)
bull reducing the number of outpatient referrals by moving to other models of care such as self-management telehealth and telecare
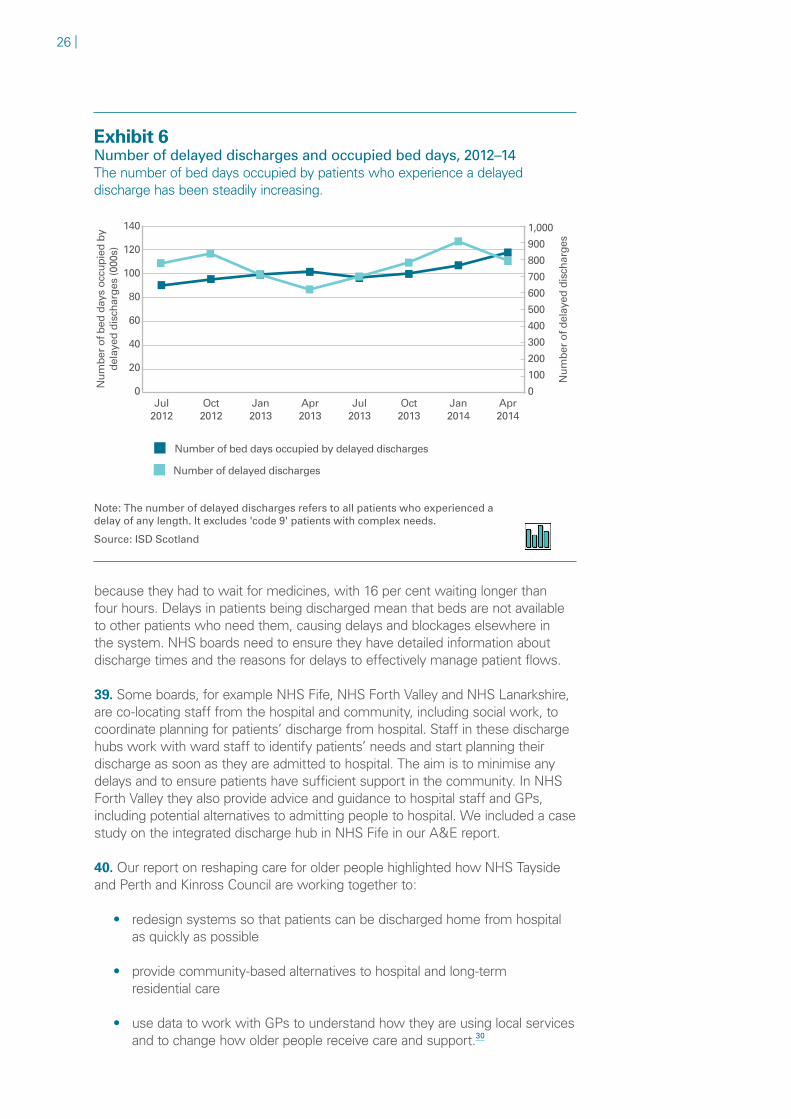
Delays in discharging patients are putting pressure on hospital beds35 Although the overall average (mean) length of stay in hospital has reduced delays in discharging patients who are clinically ready to leave hospital have been increasing over the last five years especially during 201314 They increased from around 101500 bed days over the quarter ending April 2013 to 117800 over the quarter ending April 2014 (Exhibit 6 page 26)25 In 201314 a total of 421157 bed days were occupied by patients who were delayed at an estimated cost to the NHS of pound78 million26
36 Most patients who are affected by delayed discharges are aged 75 and over This reflects their more complex needs and difficulties in organising the community support they need In April 2014
bull there were 738 patients across Scotland whose discharge was delayed compared to 564 in April 2013
Part 1 The NHS in Scotland is facing significant pressures | 25
bull 173 patients were delayed for four weeks or more
bull the most common reason for delays of four weeks or more was waiting for a place in a care home Shorter delays (two weeks or less) were mainly due to waiting for community care assessments27
37 In 2013 and 2014 a number of NHS boards carried out snapshot audits reviewing the healthcare needs of all patients in hospital on one day28 These found that for around 25 per cent of patients there was no clinical reason for them to remain in hospital Reasons for patients remaining in hospital included waiting to be reviewed by a consultant waiting for a place in a care home and waiting for a social work assessment NHS boards are using this information to identify areas for improvement for example focusing on groups of patients at more risk of spending longer in hospital than clinically necessary
38 While the overall results of the latest NHS inpatient experience survey were positive the one aspect that was less positive was leaving hospital29 Fourteen per cent of patients indicated that they had to stay in hospital longer than expected to wait for their care or support services to be organised Two-fifths of patients experienced a delay on the day they were leaving hospital mainly
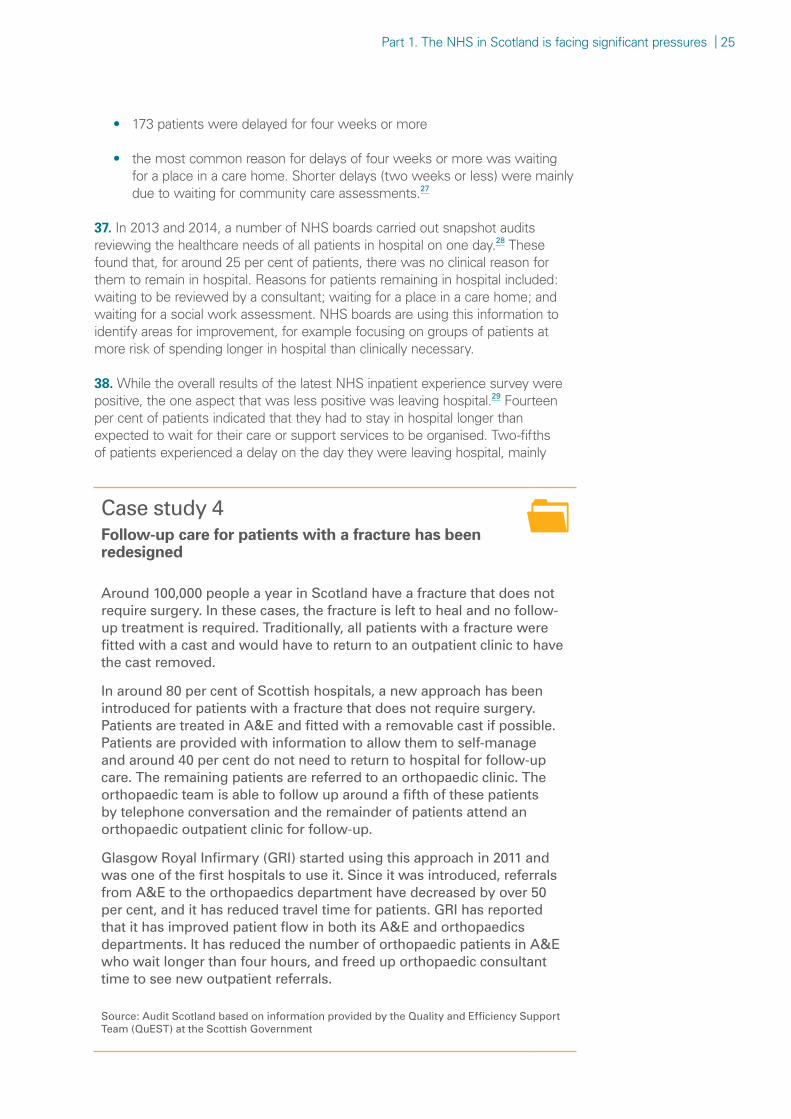
Case study 4Follow-up care for patients with a fracture has been redesigned
Around 100000 people a year in Scotland have a fracture that does not require surgery In these cases the fracture is left to heal and no follow-up treatment is required Traditionally all patients with a fracture were fitted with a cast and would have to return to an outpatient clinic to have the cast removed
In around 80 per cent of Scottish hospitals a new approach has been introduced for patients with a fracture that does not require surgery Patients are treated in AampE and fitted with a removable cast if possible Patients are provided with information to allow them to self-manage and around 40 per cent do not need to return to hospital for follow-up care The remaining patients are referred to an orthopaedic clinic The orthopaedic team is able to follow up around a fifth of these patients by telephone conversation and the remainder of patients attend an orthopaedic outpatient clinic for follow-up
Glasgow Royal Infirmary (GRI) started using this approach in 2011 and was one of the first hospitals to use it Since it was introduced referrals from AampE to the orthopaedics department have decreased by over 50 per cent and it has reduced travel time for patients GRI has reported that it has improved patient flow in both its AampE and orthopaedics departments It has reduced the number of orthopaedic patients in AampE who wait longer than four hours and freed up orthopaedic consultant time to see new outpatient referrals
Source Audit Scotland based on information provided by the Quality and Efficiency Support Team (QuEST) at the Scottish Government
26 |
Exhibit 6Number of delayed discharges and occupied bed days 2012ndash14The number of bed days occupied by patients who experience a delayed discharge has been steadily increasing
Number of bed days occupied by delayed discharges
Number of delayed discharges
Num
ber
of b
ed d
ays
occu
pied
by
dela
yed
disc
harg
es (0
00s)
Jul2012
Oct2012
Jan2013
Apr2013
Jul2013
Oct2013
Jan2014
Apr2014
140
120
100
80
60
40
20
0
Num
ber
of d
elay
ed d
isch
arge
s
1000
900
800
700
600
500
400
300
200
100
0
Note The number of delayed discharges refers to all patients who experienced a delay of any length It excludes code 9 patients with complex needs
Source ISD Scotland
because they had to wait for medicines with 16 per cent waiting longer than four hours Delays in patients being discharged mean that beds are not available to other patients who need them causing delays and blockages elsewhere in the system NHS boards need to ensure they have detailed information about discharge times and the reasons for delays to effectively manage patient flows
39 Some boards for example NHS Fife NHS Forth Valley and NHS Lanarkshire are co-locating staff from the hospital and community including social work to coordinate planning for patientsrsquo discharge from hospital Staff in these discharge hubs work with ward staff to identify patientsrsquo needs and start planning their discharge as soon as they are admitted to hospital The aim is to minimise any delays and to ensure patients have sufficient support in the community In NHS Forth Valley they also provide advice and guidance to hospital staff and GPs including potential alternatives to admitting people to hospital We included a case study on the integrated discharge hub in NHS Fife in our AampE report
40 Our report on reshaping care for older people highlighted how NHS Tayside and Perth and Kinross Council are working together to
bull redesign systems so that patients can be discharged home from hospital as quickly as possible
bull provide community-based alternatives to hospital and long-term residential care
bull use data to work with GPs to understand how they are using local services and to change how older people receive care and support30
Exhibit 6
Audit Scotland
Exhibit 6
Exhibit 6 background data
Part 1 The NHS in Scotland is facing significant pressures | 27
The NHS puts considerable effort into meeting performance targets 41 The Scottish Government and NHS boards put a great deal of effort into attempting to meet annual waiting time targets The Scottish Government also provided additional funding for NHS boards For example in 201314 the Scottish Government provided NHS boards with at least pound17 million additional funding during the year to support waiting time targets This is similar to the additional funding of at least pound20 million that it provided in 20121331 During 201314 NHS boards also received additional funding of pound9 million to improve emergency and urgent care including reducing waiting times in AampE NHS boards have noted additional workforce costs to provide additional capacity to meet waiting times targets particularly the TTG This level of focus on meeting waiting times targets may not be sustainable when combined with the additional pressures of increasing demands related to demographic changes and the overall health budget starting to decrease in real terms
42 National targets are helpful in targeting areas for improvement in performance For example the focus on waiting time targets has led to a considerable reduction in the length of time that people wait for treatment However it is becoming more difficult for NHS boards to meet these targets fully The extent of the effort required to try to meet them makes it more difficult for NHS boards to focus on long-term planning and moving more care into the community There are risks that too narrow a focus on targets can detract attention from achieving the wider aims
43 The Scottish Government is reviewing the HEAT framework and aims to have updated guidance for boards by November 2014 It should review whether the current financial and performance targets for the NHS are achievable at the same time as implementing the 2020 Vision for health and social care within the tight financial resources available It should consider setting targets for NHS boards that will help them work towards the 2020 Vision for example introducing milestones to measure the extent to which boards are moving towards more preventative and community-based care
There is growing evidence of staff pressures
44 The availability of staff is another important factor in NHS boardsrsquo capacity to provide patient care The number of consultants and nursing and midwifery staff in post has increased slightly each year since 2012 Between March 2013 and March 2014 the number of vacancies for nursing and midwifery staff was stable after increasing the previous year but the number of consultant vacancies increased significantly (Exhibit 7 page 28) This may be related to some extent to the increase in the number of consultant posts and the time lag in filling new posts However the number of posts vacant for six months or more almost doubled from 41 whole-time equivalent (WTE) at 31 March 2013 to 792 WTE in March 2014
45 Of the mainland territorial boards consultant vacancy rates were highest in NHS Dumfries and Galloway (154 per cent) NHS Fife (133 per cent) NHS Forth Valley (102 per cent) and NHS Grampian (99 per cent) With the exception of NHS Dumfries and Galloway these boards experienced difficulty achieving a number of performance targets in 201314 (Exhibit 5)
46 Many NHS boards have reported difficulties filling medical vacancies in some specialties and some geographical areas leading to greater use of locum doctors to maintain services NHS boardsrsquo workforce plans comment on a number of factors that are contributing to these difficulties including
28 |
bull changes in junior doctor training since the introduction of Modernising Medical Careers in 2005 These changes have led to a reduction in the number of junior doctors available and NHS boards needing more middle grade doctors and consultants
bull strong competition among NHS boards for medical staff This can make it more difficult for smaller boards and more rural areas to compete with larger boards which can offer more opportunities such as research and development
bull difficulty recruiting and retaining staff in some specialties with unattractive working patterns such as emergency medicine or where there is a national shortage and greater levels of part-time working such as paediatrics
47 These difficulties have an impact on NHS boardsrsquo ability to provide services and on their financial position For example
bull NHS Highland reported that its financial position in 201314 was negatively affected by spending on locums It anticipates that this will continue to be a cost pressure in 201415 (Case study 1)
bull NHS Orkney required brokerage from the Scottish Government to help cover increased spending on locum doctors and agency nursing staff (Case study 2)
bull NHS Dumfries and Gallowayrsquos spending on locums increased from pound63 million in 201213 to pound76 million in 201314 The board reported that this is due to increased demand and difficulty filling posts
bull NHS Grampian has reported that consultant vacancies in oncology are affecting cancer services and patients are having to receive treatment in other boards It has reported significant difficulty recruiting some groups of
Exhibit 7Consultant nursing and midwifery workforce March 2012 to March 2014The number of vacant consultant posts increased significantly between 2013 and 2014
At 31 March 2012 (wte)
At 31 March 2013 (wte)
At 31 March 2014 (wte)
increase 2012 to 2013
increase 2013 to 2014
Consultant staff in post 44277 45316 46936 23 36
Consultant vacancies number and rate
1673 (36) 2025 (43) 3248 (65) 21 604
Nursing and midwifery staff in post
564673 570366 581727 1 2
Nursing and midwifery vacancies number and rate
10279 (18) 16091 (27) 16375 (27) 565 18
Source ISD Scotland
Part 1 The NHS in Scotland is facing significant pressures | 29
staff including AampE staff due to the buoyant labour market competition for jobs in the local area and a national shortage of staff in certain clinical specialties including oncology
bull NHS Fife has highlighted vacancies for radiologists and difficulties securing locums which have had an impact on waiting times for diagnostic tests
bull NHS Ayrshire and Arran has reported that vacancies across medical grades are a challenge to it providing current services and considering its plans for providing services for the future
48 The NHS spent pound128 million on bank and agency nursing and midwifery staff in 201314 an increase of 15 per cent since 201213 This accounts for 13 per cent of total revenue expenditure in 201314 Bank nurses accounted for 93 per cent of the spending However spending on agency staff increased by 46 per cent to pound93 million This follows a rise of 62 per cent the previous year reversing the trend of falls in spending on agency nurses since 20080932 Agency staff are likely to be more expensive than bank nurses and also pose a greater potential risk to patient safety and the quality of care33
Spending on private sector healthcare reduced in 201314
49 NHS boards use private sector healthcare to provide additional capacity to meet patientsrsquo needs or to meet national targets In December 2013 the Scottish Government issued guidance for NHS boards which states that it expects the vast majority of patients to be treated within the NHS with the private sector used only to deal with short-term capacity issues34
50 Total spending on private sector healthcare by the territorial boards fell by 69 per cent in real terms between 201213 and 201314 from pound803 million to pound759 million Spending on private healthcare represented about 09 per cent of total spending on hospital and community health services in 201314 Spending decreased in eight territorial boards and increased very slightly in three35 It increased considerably in
bull NHS Shetland spending increased by 60 per cent from pound116000 to pound186000
bull NHS Highland spending increased by 40 per cent from pound26 million to pound37 million
bull NHS Lothian spending increased by 12 per cent from pound148 million to pound166 million
Most boards do not consider integrated performance reports
51 The board of directors in NHS boards need to oversee all aspects of performance including
bull patient safety and clinical quality
bull performance against HEAT targets
bull finance
bull feedback and complaints from patients and staff
30 |
52 Each aspect of performance is important in ensuring the NHS board is providing high-quality sustainable care Considering any one aspect in isolation may mean that the board does not have a full understanding of overall performance for example the board may be achieving its HEAT targets but facing increasing financial pressure or waiting time targets may be met for inpatient and day-case treatment while waiting times for outpatients are growing
53 An integrated overview of performance with high-level commentary helps the board to quickly get an overview of performance We found that only three boards receive an integrated report bringing together all aspects of performance (Case study 5)36 A further two consider reports that bring together a range of aspects of performance but they consider financial performance separately37 We have previously recommended that NHS boards should avoid considering one aspect of performance in isolation In our report on the management of NHS waiting lists we highlighted the importance of NHS boards considering and scrutinising performance against waiting time targets alongside information on how they are achieving that performance Non-executive directors need access to a range of information in order to allow them to provide effective challenge38
Case study 5NHS Greater Glasgow and Clyde uses integrated performance reporting
In April 2011 NHS Greater Glasgow and Clyde established a Quality and Performance Committee (QPC) as a subcommittee of the board This replaced the Performance Review Group Health and Clinical Governance Committee and Involving People Committee The main aim of the QPC is to bring together all areas of governance quality and performance under one committee to provide an overview
The QPC considers an integrated quality and performance report The report brings together data and commentary on the boards performance in relation to quality patient safety clinical governance financial monitoring performance monitoring workforce planning and involving peoplepatients It highlights any areas where the board is not meeting targets or on track to meet them The committee also considers more detailed monitoring reports on some aspects of performance including a financial monitoring report
Source NHS Greater Glasgow and Clyde Annual Audit Report 201112 and update from auditor
Part 2 Looking ahead | 31
Part 2Looking ahead
the NHS is facing significant pressures at the same time as needing to make major changes to services
Key messages
1 The overall health budget is planned to reduce by 09 per cent in real terms over the next two years Changes in Scotlandrsquos population mean that demand for health and social care will increase significantly over the next 20 years at the same time as budgets are tightening The NHS will not be able to continue to provide services in the way it currently does given the scale of the changes required It needs to do more to plan for how it will make the changes needed to provide sustainable care for the future
2 Increasing demand is already putting pressure on services NHS boards need to better understand their demand capacity and how patients move through the complex health and social care system so that they can match their capacity with current and future needs They also need to better understand the reasons for delays and blockages in the health and social care system The Scottish Government has started working with four NHS boards to help them improve patient flow
The NHS will continue to face increasing pressures
55 Taken together our audit work has found clear evidence that NHS boards are finding it increasingly difficult to meet their financial and performance targets All the available evidence suggests that these pressures will increase in future
56 The Scottish Governmentrsquos overall health budget (revenue and capital) is planned to decrease by 10 per cent between 201314 and 201415 and to increase by 01 per cent between 201415 and 201516 in real terms Within the overall health budget
bull the revenue budget is planned to increase by 03 per cent between 201314 and 201415 and to increase by 06 per cent between 201415 and 201516 in real terms
bull the capital budget is planned to decrease by 389 per cent between 201314 and 201415 and to decrease by 240 per cent between 201415 and 201516 in real terms (Exhibit 8 page 32)
57 Healthcare inflation in the UK is higher than general inflation which has an impact on the health budget in real terms Over the last 20 years general inflation in the UK averaged just over two per cent a year while health service costs rose by 36 per cent a year39
32 |
Exhibit 8In the next two years the health budget will decrease by 09 per cent in real termsThe larger revenue budget will increase by almost one per cent while the smaller capital budget will decrease by 54 per cent
-5357
-2398
-3892
+031 +064 +095Revenue
Capital
CUMULATIVE
TOTAL
-093-104 +010
1314to
1415
1415to
1516
1314to
14151415
to1516
1314to
1516
Source Scottish Government Draft Budgets 201314 201415 and 201516
58 Longer-term forecasts to 201819 by the Office for Budget Responsibility show a real-terms reduction in total UK public sector expenditure of 07 per cent in both 201617 and 201718 before levels are maintained in 20181940 Reductions in spending at a UK level will affect the level of funding available in Scotland The Scottish Government will need to plan for health spending within an overall reducing budget
Part 2 Looking ahead | 33
Other cost pressures are likely to increase in future years59 There is likely to be an increase in contribution rates to the NHS Superannuation Scheme during 201415 The most recent actuarial funding valuation available for the scheme was at 31 March 2004 A funding valuation was carried out at 31 March 2008 but was suspended by HM Treasury prior to completion A new funding valuation was carried out in 201314 for the scheme as at 31 March 2012 and this will be incorporated in the NHS accounts for 201415 Employer contribution rates are expected to increase as a result of this valuation in order to ensure that contributions are large enough to meet the likely future costs of the pension scheme
60 A number of boards highlighted this as a financial risk in their LDPs NHS boards have assumed and are planning for pensions costs of approximately two per cent of their total pay bill but the extent of the increase is not yet known NHS boards will also face further costs due to changes in pension schemes that end the current arrangements under which members and their employers pay lower National Insurance contributions41 As a result of these changes pension scheme members and their employers will no longer pay reduced NI contributions from 6 April 2016
61 NHS boards have identified other future cost pressures including pay costs spending on drugs and the availability of new treatments Staff pay is the largest single item of expenditure for NHS boards and the Scottish Government has estimated that the pay bill will increase by around pound30 million per year from 201415 (not including additional pension costs)42 NHS boards are working with the Scottish Government to identify how they will fund these cost pressures NHS boards are considering how they can work together to provide services more efficiently for example exploring opportunities to provide more services on a regional basis
Changes in the population are increasing demand62 Demographic and other changes are increasing the pressures Scotlandrsquos population is ageing (Exhibit 9 page 34) Between 2012 and 2037
bull the percentage of the population aged 65 or over is projected to increase from 17 per cent (925751 people) to 25 per cent (1473158 people)
bull the percentage of the population aged 75 or over is projected to increase from eight per cent (418486 people) to 13 per cent (778746 people)
bull the number of people aged 100 years or older is projected to increase by 879 per cent from 792 to 775143
63 Older people are more likely to have long-term health problems that require care and in the absence of good community-based care that will increase the pressure on acute services The number of people aged over 65 attending AampE departments increased by 126 per cent over the past five years from 242677 attendances in 200809 to 273192 in 201213 Older people are more likely to be admitted to hospital from AampE in December 2013 60 per cent of AampE attendances for people aged over 65 resulted in admission to hospital compared with 23 per cent of patients aged under 6544
34 |
64 The number of people with long-term conditions such as diabetes is increasing and the number of long-term conditions that an individual may have increases with age Rates of dementia are also increasing and the number of people with dementia is estimated to double within the next 25 years45 The number of inpatient and day-case episodes for people aged 65 and over where the patient had a diagnosis of dementia increased by nearly 50 per cent between 2009 and 2013 from 21524 to 32205 Older people with dementia generally stay longer in hospital often due to the need for specialist care that delays their discharge Around half of long-stay residents in Scottish care homes have a diagnosis of dementia
Exhibit 9Scotlands population is ageingThe percentage of the population aged 75 and over is set to increase considerably over the next 25 years
65-74 yearsUnder 65 years 75-84 years 85 years and older
83
75
2610
912 5
Population
418486 2012
Estimated population
778746 2037
2012
2037
75 yrs +
86
Population
792 2012
Estimated population
7751 2037
100 yrs +
879
Note Due to rounding the total percentages add up to 101 per cent
Source Projected Population of Scotland (2012-based) National Records of Scotland 2013
Exhibit 9
Audit Scotland
Exhibit 9
Exhibit 9 background data
Part 2 Looking ahead | 35
65 Peoplersquos expectations of healthcare are rising in relation to access to services and treatments and the Scottish Government recognises this as another challenge for the NHS46 For example the main issues in orthopaedics affecting demand in addition to an increasing older population are higher patient expectations and improvements in technology and available procedures A wider range of procedures are now available and surgeons can carry out more complex procedures47
The Scottish Government has set out its long-term strategy for the NHS but boards do not yet have detailed plans in place
66 Pressures will continue to increase for the foreseeable future The Scottish Government recognises this and in 2011 it set out its 2020 Vision an overarching strategy for achieving sustainable quality in the delivery of healthcare services across Scotland in the context of the challenges facing the NHS48 The overall aim is that by 2020 everyone is able to live longer healthier lives at home or in a homely setting It is an ambitious policy that aims to prevent or improve poor health caused by lifestyle factors such as smoking alcohol and lack of exercise and move towards the NHS providing more care in community settings (Exhibit 10 page 36) In May 2013 the Scottish Government set out 12 priority areas for action in the form of a Route Map to the 2020 Vision
67 The NHS has already made improvements in health outcomes in the Scottish population The 2020 Vision has the potential to make further improvements in health outcomes and the quality of health and social care But achieving the vision will require major changes in the way that services are delivered and a significant shift of resources into more preventative and community-based services We have highlighted in previous reports that there is a lack of evidence of progress in moving resources and more care into the community49 In 200304 42 per cent of NHS spending for all age groups was on community services by 201112 this had increased to just 44 per cent and in 201213 it reduced to 43 per cent50 Between 200203 and 200910 council spending in real terms on social care services for older people increased by 37 per cent from pound098 billion to pound135 billion By 201213 this had fallen to pound129 billion a four per cent reduction from 20091051 The reasons for this lack of progress are complex but achieving the transformation required is made more difficult by the increasing pressures on acute care and by the continuing focus on short-term planning
68 From April 2016 health and social care services in Scotland will be integrated The Public Bodies (Joint Working) (Scotland) Act 2014 requires NHS boards and councils to establish new health and social care partnerships Under these arrangements NHS boards and councils will be required as a minimum to combine their budgets for adult social care adult primary healthcare and aspects of adult secondary healthcare It provides a good opportunity for NHS boards with their council partners to redirect resources and move towards more community-based and preventative care It will be challenging for NHS boards to make the scale of changes required over the next few years but critical if they are to meet the 2020 Vision Outcomes are being developed for integrated health and social care along with integration indicators for the new integration joint boards to report performance against
69 We have previously recommended that NHS boards need to increase their focus on longer-term financial planning Without this there is a risk that they will continue to take a short-term approach to managing the pressures they face at
36 |
Exhibit 10Aims of the Scottish Governments 2020 Vision for health and social careThe Scottish Government has set out an ambitious policy that will require a considerable move from care in settings like hospitals and care homes to more community-based and preventative care
Our vision is that by 2020 everyone is able to live longer healthier lives at home or in a homely setting
We will have a healthcare system where we have integrated health and social care a focus on prevention anticipation and supported self-management
When hospital treatment is required and cannot be provided in a community setting day-case treatment will be the norm
Whatever the setting care will be provided to the highest standards of quality and safety with the person at the centre of all decisions
There will be a focus on ensuring that people get back into their home or community environment as soon as appropriate with minimal risk of re-admission
Source A Route Map to the 2020 Vision for Health and Social Care Scottish Government May 2013
the expense of better options over the longer term NHS boards need to plan now for making considerable changes to the way they deliver services in the longer term to ensure they can deliver sustainable good-quality care to meet future increasing needs They need to set out how they will reshape services and provide high-quality care with the available funding staff and other resources Their longer-term financial planning should consider all the resources they need to provide integrated health and social care services to continue to meet future needs (Exhibit 11 page 37)
70 LDPs set out how each board plans to deliver the priorities for the NHS in Scotland They also form the basis for the Cabinet Secretaryrsquos annual reviews of each board In the past LDPs have focused predominantly on financial planning and meeting HEAT targets for the coming year rather than demonstrating how boards are planning to meet longer-term aims For 201415 the Scottish Government requires each board to include an improvement and co-production plan in their LDP outlining the actions the board is taking to deliver the 2020 Vision (Exhibit 12 page 38) We found that the 201415 LDPs include detail about what boards are currently doing but provide little information about how boards will deliver the 2020 Vision in a sustainable way supported by financial and workforce plans We would expect there to be more detail in the 201516 LDPs about how boards will work with their partners to shift more services into the community as they move towards health and social care integration
Planning needs to be underpinned by a better understanding of demand capacity and patient flows
71 Health and social care services form a complex system in which patient flows need to be understood and managed in order to have the right resources available when and where they are needed to meet demand These resources include the
Part 2 Looking ahead | 37
Exhibit 11A number of elements of long-term planning should underpin financial plansLong-term financial planning needs to set out how NHS boards will make the changes needed to meet future needs
Elements of longer-term planning
Detailed planning required
Future demand for health and social care
Model projected demand for care by taking into account the
bull numbers of patientsservice users expected to need services
bull demographic profile of the area
bull complexity of care that people will need
Compare this with current demand and short-term projections
Models of care Identify the models of care and shared objectives for the new health and social care partnerships required to meet the 2020 Vision and projected future demand for the following
bull hospitals bull community-based care bull home-based care
bull care in the community supported by technology such as telehealth and telecare
Workforce requirements
Identify the staff needed to provide these models of care taking into account
bull numbers and type of roles bull skills mix bull training bull location
Compare this with the current workforce make-up and location and short-term projections Workforce planning needs to be done in collaboration with the Scottish Government NHS Education for Scotland and training providers such as colleges
Location of care Identify the fixed assets needed to provide models of care in different locations including the following
bull buildings (hospitals and community) including the condition of existing buildings and costs of ongoing maintenance and any new buildings that are required
bull information technology including shared access to NHS and social care systems
bull broadband
bull transport for patients service users and staff
Compare this with current assets and short-term projections Plans need to ensure the infrastructure is in place to support moving more care into the community while ensuring hospitals are fit for purpose
Costs and funding
Financial planning to meet future needs by estimating the cost of
bull providing new models of care and for increased demand
bull providing more care in the community and in patientsusers homes
bull maintaining hospital services in line with future models of care
Use scenario planning with potential financial projections to ensure models of care are affordable and to identify potential funding gaps Establish plans for redirecting funding from hospitals to community to meet future needs while maintaining services This is likely to require double-running costs
Source Audit Scotland
38 |
Exhibit 12LDPs now include improvement and co-production plansNHS boards are required to set out their priority actions for delivering the 2020 Vision
Key elements of the plans are that they should
bull be transformational in nature and underpinned by workforce and finance planning
bull provide assurance that the five priorities for action set out in Everyone Matters 2020 Workforce Vision Implementation Framework (healthy organisational culture sustainable workforce capable workforce integrated workforce effective leadership and management) will be taken forward in a planned way
bull set out the priority actions the NHS board is taking across patient safety programmes of work the plans for spread and sustainability and the impact they are having on patient care
bull include the approach being taken to ensure that feedback on compliments concerns complaints and comments from patients their families and carers is being actively sought and used to improve services
bull set out actions and planned levels of improvement for unscheduled care across the NHS such as increased anticipatory care and support to help people manage their conditions and medicines including how hospitals GPs community teams the Scottish Ambulance Service and NHS 24 will work together
bull set out the actions the NHS board is progressing with its partners to prepare for health and social care integration
Source NHSScotland 2020 Local Delivery Plan Guidance Scottish Government November 2013
number of hospital beds outpatient clinics community services and trained staff The NHS needs a better understanding of its current capacity current and future demand and patient flows in order to inform the major changes to services that will be required to ensure they are sustainable and meet the long-term needs of the population
72 We analysed recent trends in healthcare activity population statistics and rates of conditions such as diabetes and dementia (Appendix 1 summarises our methodology) We looked at data for the previous five years where this is available and comparable in order to understand recent trends and identify where pressures are building This analysis identified some of the main pressures and highlights the complex and interrelated nature of the healthcare system The degree to which pressures impact on NHS boards hospitals and specialties varies but include
bull an ageing population and an increase in the number of older people with complex care needs
Part 2 Looking ahead | 39
bull more people living with long-term conditions and multiple conditions
bull more people seeking emergency and urgent care
bull more people being treated in outpatient and day-case settings
bull making sure hospital beds and staff are available at the time they are needed
bull more people experiencing a delay in their discharge from hospital
73 We have identified a number of lsquopinch pointsrsquo in the system (Exhibit 13 page 40) These particularly relate to
bull Hospital beds being available at the time when patients need them There has been an increase in the number of patients experiencing delays in being admitted from AampE and patients are not always cared for in the appropriate ward for their needs which has an impact on the quality of care they receive (known as boarding) These pinch points are related to how hospitals manage their beds and arrangements for discharging patients
bull More delayed discharges The number of patients delayed in hospital while waiting for services to be available in the community is increasing This has an impact on the quality of care and outcomes for the patients and it also means that beds are not available for other patients adding to the pressures on beds (paragraphs 35 and 36)
bull Increasing demand for outpatient appointments Demographic changes along with improvements in care and more procedures carried out in outpatient clinics rather than on an inpatient basis have increased demand for outpatient appointments Demand is increasing at a faster rate than the number of people seen in clinics meaning that waiting lists are growing and more people are waiting longer (paragraphs 33 and 34)
Inpatient care is changing and becoming more complex74 In recent years there has been a reduction in elective (planned) inpatient care as more planned care shifts to outpatients and day cases The number of patients admitted as emergencies for inpatient care has remained steady and the complexity of these cases has increased NHS boards need to ensure they have the right number of staffed beds available at the right time to deal with this changing demand They also need to plan for changes to services in the longer term including shifting more care into community settings
75 There has been a reduction in the number of hospital beds across Scotland Between 200809 and 201213 the average number of available staffed beds in acute specialties reduced by seven per cent (1144 beds) the number of acute surgical beds fell by 11 per cent (596 beds) and the number of acute medical beds fell by five per cent (313 beds) The main reason for this reduction is the growth in day surgery as more patients are treated as day cases and outpatients for example some eye procedures and diagnostic tests Between 200809 and 201213 the number of procedures carried out on an inpatient basis decreased by 18 per cent (418000 procedures in 201213)
40 |
Exhibit 13The NHS is facing increasing pressures from an ageing population and increasing demandThe health and social care system is complex
Notes 1 Community care data Care home and care at home ndash Censuses (March 2013 and March 2008) NHS 24 ndash NHS 24rsquos performance data
(201314 and 200809) Primary care contacts ndash ISD Scotland (201213 and 200809)2 AampE data Number of attendances and waits ndash ISD Scotland and Audit Scotland AampE data(201213 and 200809)3 Hospital data Inpatient daycase and outpatients ndash ISD Scotland (201213 and 200809) Waiting lists and number waiting over 12 weeks
ndash ISD Scotland (quarter ended March 2014 and March 2010) Occupied bed days for delayed dischargesndash ISD Scotland (201314 and 201213) The data is not available before 201213
4 Patients can also be admitted to hospital as emergencies without going through AampESource Audit Scotland
TELEHEALTH
TELECARE
+346 Wait for
a bed(37946)
bull Ageing populationbull Increase in complex needsbull Increase in multiple complex cases
DAY CASE
455800attendances+6
489898procedures+8
OUTPATIENT
47 millionattendances0
15 millionnew patient attendances
+2
380456procedures+108
+9 Delayed
dischargebed days
Self referral
CARE HOME
-2 36578residents
-10 1282homes
+29 1645 short-stayrespite residents
Preventative care self management treatment and care in the community
CARE AT HOME
Social care
-1160950people receiving home care
NHS 24
-9 14 millioncontacts
ACCIDENT amp EMERGENCY
16 millionattendances+3
HOSPITALCARE
OVERNIGHT INPATIENTS
720262patients admitted-3
417987procedures-18
23728avg staffed beds-11
Demand
Time delays
Change inlast 5 years
XX
KEY
+8
admitted to hospital
from AampE (361121)
PRIMARY CARE TEAMGP amp practice nurse
Community nursing AHPPharmacy Ophthalmology Mental health team
242 million contacts+4
+189 waitedgt4hrs
(104000) Plannedcare
421157 occupied bed days
(changebetweenMar 2010
amp Mar 2014)
(changebetweenMar 2010
amp Mar 2014)
+4200
number waiting
gt12 weeks (157 to 6754)
bull The number of older people attending AampE has risen from 242677 patients aged over 65 in 200809 to 273192 patients aged over 65 in 201213 (126 increase)
bull In December 201360 per cent of AampE attendances for people aged over 65 resulted in admission to hospital compared with 23 per cent of patients aged under 65
bull Between 200809 and 201213 there was an 11 rise in the number of bed days occupied by patients aged 80 and over who had three or more emergency admissions during the year
+376
number waiting
gt12 weeks (162 to 771)
+34
number onwaiting list (252009)
-7
number onwaiting list
(50898)
Older people
(201314)
(change betweenMar 2013 amp Mar 2014)
Part 2 Looking ahead | 41
76 The average (mean) length of stay for inpatients has also been reducing Ensuring that patients stay in hospital for no longer than necessary is important since it helps them stay active remain independent and reduces the chance of acquiring a healthcare-associated infection Between 200809 and 201213 the average length of stay fell from 73 days to 65 days for elective (planned) inpatients and from 38 to 31 days for emergency inpatients
77 There is evidence that the complexity of care for patients admitted as emergencies is increasing There has been a slight growth in the number of days that hospital beds are occupied by emergency admissions for people admitted three or more times during one year (one per cent between 200809 and 201213) This is more noticeable among older people (aged 80 and over) who are likely to have more long-term conditions and complex needs Between 200809 and 201213 there was an 11 per cent rise in the number of bed days occupied by patients in this age group who had three or more admissions during the year The increase in the older population suggests that this trend will continue unless there are significant shifts to more anticipatory and preventative care in the community
NHS boards need to improve bed planning and management78 There are a number of indicators of problems with bed planning and management The number of people delayed in AampE while waiting for a hospital bed has increased fourfold since 200809 This is the most common reason for patients waiting more than four hours in AampE The reasons for this are complex and linked to beds not being available at the time when they are needed The day and time that patients are discharged from wards affect the flow of patients throughout the hospital Attendances at AampE departments are highest on Mondays and Tuesdays Delays in AampE due to people waiting for a bed in hospital are more likely on these days since fewer inpatients are discharged at weekends Discharges from hospital generally take place in the afternoon Across Scotland lsquowait for a bedrsquo delays for AampE patients are highest at 6pm The Scottish Government has announced plans to provide more services at weekends and in the evenings to improve the flow of patients and reduce delays Any knock-on effects in primary and social care should be considered as part of these plans In our recent report on AampE performance we highlighted the work that NHS Tayside is doing to improve the quality of care for AampE patients by looking at patient flow (Case study 6 page 42)
79 Boarding is another indicator that a hospital is not organising its capacity to match demand This can happen when there are not enough beds available in a particular specialty when patients need them for example when new patients are admitted as emergencies Instead patients are admitted or transferred to a ward of a different specialty Research has shown that this practice may mean that less specialist care is provided since staff without the appropriate skills are looking after patients Boarding can also significantly increase patientsrsquo length of stay and contribute to other complications resulting from delayed assessment and treatment including developing blood clots and healthcare-associated infections52
80 Boarding used to be more common in winter when demand traditionally increases due to seasonal infections Research by the Royal College of Physicians of Edinburgh (RCPE) suggests that it is becoming an all-year problem In an RCPE survey conducted in May 2012 80 per cent of respondents reported that boarding now happens all year round in Scottish hospitals and 71 per cent said that boarding levels in Scotland are high and increasing The RCPE and the
42 |
Case study 6Improving patient flow in AampE in Ninewells Hospital
Our AampE report identified a number of factors that have helped Ninewells Hospital in NHS Tayside improve the way that patients move through the healthcare system and meet the four-hour waiting time target for AampE These include
bull having senior clinical decision-makers available at all times which means that patients get the right type of care quickly
bull starting the process of planning for patients to be admitted from AampE early to avoid delays in patients waiting for a bed
bull a policy that allows GPs to refer emergency patients directly to wards rather than through AampE first
bull a policy of signposting patients attending AampE to other services such as their GP where appropriate
Source Accident and Emergency performance update Audit Scotland May 2014 (Case study 1 pages 35-36)
Scottish Government are examining the extent of boarding in Scottish hospitals the effect it has on patients and ways to reduce it Results from this work should be available in late 2014 or early 2015
81 The number of emergency admissions over a period of time is reasonably predictable based on previous activity levels On a daily and weekly basis elective admissions can be much more variable than emergency admissions Exhibit 14 (page 43) provides an example of the pattern of elective and emergency admissions to General Surgery on a daily basis in one of Scotlandrsquos district general hospitals and on a weekly basis in another hospital
82 NHS boards need to understand the differing patterns of emergency and elective admissions and actively plan and manage these two flows in a coordinated way Although the number of emergency admissions is reasonably predictable the time of day at which patients arrive at hospital is less so Managing these two flows together means more than ensuring average capacity meets average demand NHS boards also need to ensure that staffing levels are flexible enough to cope with varying demand and that sufficient capacity is available at the right time This means having staff who are trained and equipped to treat increasing numbers of older people with multiple conditions and complex needs
83 A lot of variation in elective admissions can be due to NHS boards not having sufficient capacity to treat both elective and emergency admissions at the time that patients present This includes the availability of beds in appropriate wards sufficient staff with the necessary skills equipment and access to operating theatres This can mean having to cancel planned admissions and rearrange for patients to attend at a later date However data on the overall proportion of inpatient cases that are cancelled has not been available nationally since October 2012 This is due to changes to NHS boardsrsquo electronic systems for managing waiting lists following the introduction of the TTG In September 2012
Part 2 Looking ahead | 43
Exhibit 14Variability in elective and emergency admissions to hospital 201314Elective admission patterns can be more variable than emergency admissions both from day to day (Hospital A) and from week to week (Hospital B)
69 per cent of inpatient and day-case appointments were cancelled across Scotland We have previously highlighted that NHS boards need to ensure they are monitoring this locally to understand any problems with capacity and inform how they manage demand53
84 The Health Foundation worked with NHS trusts in England to look at the relationship between capacity and demand This was based on the premise that the mismatch between the timing of capacity such as when staff are available and when patients present to a service contributes more to delays and inefficiencies than overall levels of demand or resources Key findings from this work were that using systems improvement methods such as detailed data
44 |
analysis and bringing together stakeholders and patients across the hospital system to develop an informed understanding of how care pathways really work can improve patient flow patient safety and make significant cost-savings54
85 The Scottish Government is working with boards over the next year to help them manage beds better in the short term including developing a bed-planning toolkit This will also help them to plan for the number and type of beds required in the longer term reflecting the new models of care that will be needed The toolkit will be piloted in 2015 and include scenario planning based on assumptions of demand admission rates and length of stay taking into account demographic patterns and more care being provided in the community Extensive work has also started in 2014 looking at patient flow in boards and the Scottish Government is leading an Outpatients Primary and Community Care Programme that aims to help NHS boards move more care from hospitals into the community and peoplersquos homes
The Scottish Government is working with NHS boards to improve patient flow
86 As well as having sufficient capacity to deal with demand NHS boards need to make sure that the flow of patients through the hospital and back into the community is as efficient as possible The Scottish Governmentrsquos Quality and Efficiency Support Team (QuEST) is working with four NHS boards to pilot an approach to improve patient flow (NHS Forth Valley NHS Borders NHS Greater Glasgow and Clyde and NHS Tayside) drawing on evidence from the Institute of Healthcare Optimisation in America This is a significant piece of work looking at individual hospitals within each board area as a whole system to understand how patients flow through the system and the factors that can influence this NHS Forth Valley started testing this approach in 2014 and the lessons learned will be shared with other boards as it is rolled out over the next three years The Scottish Government will evaluate the pilot as it progresses and also plans to commission an external evaluation
87 To help improve patient flow and avoid delays in patients getting the appropriate care or being discharged from hospital the Scottish Government also plans to provide more services at weekends and out of hours This includes hospital physiotherapy and pharmacy services An expert group met for the first time in April 2014 The Scottish Government has said there will be no additional funding for this initiative which will require staff to be available at additional times instead NHS boards will be expected to make better use of existing resources
88 Telehealth and telecare offer the potential to care for more people at home or closer to home supported by technology This includes things like equipment for people to monitor their own health at home with their results reviewed by a clinician remotely and alarms and sensors to help people to stay at home more independently These innovations support the 2020 Vision of providing care closer to home potentially improving outcomes for users and avoiding people needing more intensive care in the community or in hospital55 In 2012 the Scottish Government set out its aim that telehealth and telecare will be provided for an additional 300000 people by March 2015 as a milestone towards achieving the 2020 Vision56 It is focusing on rolling out a number of telehealth and telecare projects at a larger scale than the previous smaller pilots Both the Scottish Government and the European Union have provided funding for telehealth and telecare projects
Endnotes | 45
Endnotes
1 The total budget for the Scottish Governmentrsquos Health and Wellbeing Portfolio includes the budgets for health sport and equalities
2 2020 Vision ndash Strategic Narrative Scottish Government September 2011
3 In this report we refer to NHS National Services Scotland the Mental Welfare Commission and Healthcare Improvement Scotland as special health boards
4 Three special boards revenue budgets increased in 201314 National Waiting Times Centre (114 per cent) Scottish Ambulance Service (01 per cent) and NHS 24 (05 per cent)
5 The revenue budget is known as the Revenue Resource Limit (RRL) and the capital budget is known as the Capital Resource Limit (CRL)
6 NHS financial performance 201213 (PDF) Audit Scotland October 2013
7 Response from the Scottish Government to the Public Audit Committee dated 1 August 2014
8 These reports were prepared under Section 22 of the Public Finance and Accountability (Scotland) Act 2000 and are published on Audit Scotlandrsquos website
9 Recurring savings are savings that once achieved recur year-on-year from that date for example savings on staff costs as a result of streamlining services Non-recurring savings only happen once for example not filling a vacancy on a temporary basis
10 NHS Ayrshire and Arran Borders Dumfries and Galloway Highland Lanarkshire Orkney Shetland National Waiting Times Board NHS 24 NHS Education for Scotland and State Hospital
11 Annual State of NHSScotland Assets and Facilities Report for 2012 Scottish Government December 2012
12 Annual State of NHSScotland Assets and Facilities Report for 2013 Scottish Government December 2013
13 The Scottish Government has defined high-risk backlog maintenance as work that must be addressed as an urgent priority Significant risk is the next highest priority category of backlog maintenance and requires expenditure in the short term ndash Correspondence from the Scottish Government to the Public Audit Committee dated 16 January 2013
14 Backlog maintenance reduced in (level of backlog at 2013 in brackets) NHS Ayrshire and Arran (pound77m) Dumfries and Galloway (pound51m) Forth Valley (pound13m) Grampian (pound159m) Greater Glasgow and Clyde (pound167m) Lanarkshire (pound57m) Lothian (pound96m) Orkney (pound95m) Shetland (pound38m) Tayside (pound50m) National Waiting Times Centre (pound26m) NHS National Services Scotland (pound26m) NHS 24 (pound0m) and State Hospital (pound03m) It increased in NHS Borders (pound65m) Fife (pound70m) Highland (pound83m) Western Isles (pound32m) NHS Education for Scotland (pound03m) NHS Health Scotland (pound01m) and the Scottish Ambulance Service (pound33m) NHS Highland has reported that one reason for its backlog maintenance increasing is that a number of properties transferred from the council to the board in 2012 as part of health and social care integration
15 Annual State of NHSScotland Assets and Facilities Report for 2013 Scottish Government December 2013
16 Outline Business Case for a Care Village in Stirling (A Health amp Social Care Partnership Venture) NHS Forth Valley Stirling Council and Forth Valley College 2 December 2013
17 The Healthcare Quality Strategy for NHSScotland Scottish Government May 2010
18 Scottish National Point Prevalence Survey of Healthcare Associated Infection and Antimicrobial Prescribing 2011 Health Protection Scotland April 2012 Rates of individual HAIs (MRSA and Clostridium difficile) have continued to decrease (Scotland Performs Scottish Government website)
19 Heart disease statistics update ISD Scotland January 2014
20 Scottish Inpatient Patient Experience Survey 2014 Scottish Government August 2014
22 Depending on the target this may be performance for the month ending March 2014 or for the quarter ending March 2014 The notes in Exhibit 5 give details for each target
46 |
23 ISD Waiting Times Warehouse data August 2014
24 The National Waiting Times Board a special NHS board met the target for three months in 201314
25 These figures are for standard delayed discharges They exclude delayed discharges recorded under lsquocode 9rsquo for patients with complex needs This includes patients delayed due to waiting for a place in a high-level needs specialist facility where no facilities exist or where an adult may lack capacity under adults with incapacity legislation
26 ISD calculates the cost of days lost to delayed discharges using a cost per day that excludes costs not incurred by delayed patients such as costs related to admissions and allows for the reduced medical and other clinical care that is required for delayed patients This average cost is around pound185 per day
27 These figures are for standard delayed discharges
28 These are called Day of Care Surveys
29 Scottish Inpatient Patient Experience Survey 2014 Volume 1 National Results Scottish Government August 2014
30 Reshaping care for older people (PDF) Audit Scotland February 2014 (Case study 2 page 30)
31 Scottish Government allocation letters to NHS boards 201314
32 NHS financial performance 201213 (PDF) Audit Scotland October 2013
33 Using locum doctors in hospitals (PDF) Audit Scotland June 2010
34 Additional 2020 Local Delivery Plan Guidance Scottish Government December 2013
35 Spending increased slightly in NHS Ayrshire and Arran (15 per cent) NHS Tayside (07 per cent) and NHS Western Isles (13 per cent)
36 NHS Forth Valley NHS Greater Glasgow and Clyde and NHS Tayside
37 NHS Western Isles and NHS 24
38 Management of patients on NHS waiting lists (PDF) Audit Scotland February 2013
39 Why is health care inflation greater than general inflation Charlesworth A Journal of Health Services Research and Policy June 2014
40 Economic and Fiscal Outlook ndash March 2014 Office for Budget Responsibility March 2014
41 Under the current state pension arrangements members of the NHS Superannuation Scheme pay a reduced rate of National Insurance (NI) Their employers the NHS boards also contribute reduced NI payments on their behalf This is because it is assumed that the scheme members have opted not to contribute to or claim the additional state pension (an additional element paid on top of the basic state pension) Reforms mean the additional state pension will no longer exist and everyone will receive a flat rate basic state pension
42 Scottish Government budget 201415 ndash Performance evaluation material for Parliamentary Committees Scottish Government September 2013
43 Projected Population of Scotland (2012-based) National Records of Scotland 2013
44 Accident and Emergency performance update (PDF) Audit Scotland May 2014
45 Scotlandrsquos National Dementia Strategy Scottish Government 2010
46 The Healthcare Quality Strategy for NHSScotland Scottish Government May 2010
47 Review of orthopaedic services (PDF) Audit Scotland March 2010
48 2020 Vision ndash Strategic Narrative Scottish Government September 2011
49 Reshaping care for older people (PDF) Audit Scotland February 2014 Review of Community Health Partnerships (PDF) Audit Scotland June 2011 Overview of the NHS in Scotlandrsquos performance 200809 (PDF) Audit Scotland December 2009 Financial overview of the NHS in Scotland 200708 (PDF) Audit Scotland December 2008
50 Audit Scotland analysis of NHS Costs Book data Spending on community family health services and resource transfer as stated in the costs book has been counted as being spent in the community
51 Figures in real terms 201213 prices Audit Scotland analysis of Local Financial Return statistics 200203 ndash 201213
52 Royal College of Physicians of Edinburgh press release June 2012
53 Management of patients on NHS waiting lists audit update (PDF) Audit Scotland December 2013
54 Improving patient flow How two trusts focused on flow to improve the quality of care and use available capacity effectively The Health Foundation April 2013
55 A review of telehealth in Scotland (PDF) Audit Scotland October 2011
56 A National Telehealth and Telecare Delivery Plan for Scotland to 2015 Scottish Government 2012
Appendix 1 Audit methodology | 47
Appendix 1Audit methodology
Methodology for analysing demand capacity and patient flow
To get a better understanding of some of the pressures on NHS services we carried out data analysis looking at
bull the demand for healthcare services
bull the capacity of the NHS to provide services
bull the flow of patients through the healthcare system
This is the first stage of this work and we have presented some high-level findings throughout the report We will be carrying out further analysis looking in more detail at hospital and specialty level data and daily activity We will publish a briefing paper on this analysis in early 2015
For this report we looked at the NHS as a whole system We tried to identify some of the main pressures facing NHS boards and how a pressure in one part of the system can affect another part of the system We have summarised these pressures in Exhibit 13 (page 40) Throughout the report we explain some of these in more detail and how this affects patients and services
In addition to drawing on information from our previous reports we analysed a range of published data and also requested some bespoke analysis from ISD Scotland This includes the following data
bull ISD Scotland
ndash acute hospital inpatient day-case and outpatient activity (admissions discharges average length of stay multiple emergency admissions average number of staffed beds bed occupancy rates)
ndash number of procedures carried out in hospitals
ndash waiting times for inpatient and day-case treatment and outpatient clinics
ndash hospital workforce numbers and vacancies
ndash number of general practice contacts with GPs and practice nurses
ndash Quality and Outcomes Framework (QOF) prevalence rates for a number of health conditions
ndash number of delayed discharges and occupied bed days
ndash care home census
bull Scottish Government community healthcare assessments data
bull National Records of Scotland population statistics
bull Alzheimer Scotland information
NHS in Scotland 201314This report is available in PDF and RTF formats along with a podcast summary at wwwaudit-scotlandgovuk
If you require this publication in an alternative format andor language please contact us to discuss your needs 0131 625 1500 or infoaudit-scotlandgovuk
For the latest news reports and updates follow us on Twitter or subscribe to our email delivery service
AuditScotland
Subscribe to updates
ISBN 978 1 909705 49 4 AGS20146
Audit Scotland 110 George Street Edinburgh EH2 4LHT 0131 625 1500 E infoaudit-scotlandgovuk wwwaudit-scotlandgovuk
This publication is printed on 100 recycled uncoated paper
Key facts
Summary
Key messages
Recommendations
About the audit
Part 1 The NHS in Scotland is facing significant pressures
Key messages
NHS budgets are under pressure
Exhibit 1
All NHS boards met their financial targets in 201314 but some are facing increasing difficulty in achieving them
Exhibit 2
Case study 1
Case study 2
Case study 3
Five boards continue to rely on high levels of non-recurring savings
Exhibit 3
NHS boards are making less progress than expected on reducing backlog maintenance
The annual financial target for capital spending makes it difficult to plan longer-term projects
Exhibit 4
There have been improvements in the quality of healthcare
Performance against waiting time targets is showing increasing signs of pressure
Exhibit 5
Case study 4
Exhibit 6
There is growing evidence of staff pressures
Exhibit 7
Spending on private sector healthcare reduced in 201314
Most boards do not consider integrated performance reports
Case study 5
Part 2 Looking ahead
Key messages
The NHS will continue to face increasing pressures
Exhibit 8
Exhibit 9
The Scottish Government has set out its long-term strategy for the NHS but boards do not yet have detailed plans in place
Exhibit 10
Planning needs to be underpinned by a better understanding of demand capacity and patient flows
Exhibit 11
Exhibit 12
Exhibit 13
Case study 6
Exhibit 14
The Scottish Government is working with NHS boards to improve patient flow
Endnotes
Appendix 1 Audit methodology
NHS in Scotland 201314
Exhibit 9
Scotlands population is ageing
2012
2037
Population
Percentage of population
Estimated population
Percentage of estimated population
Under 65 years
4387849
83
4307213
75
65-74 years
507265
10
694412
12
75-84 years
309244
6
504249
9
85 years and older
109242
2
274497
5
Note Due to rounding the total percentages add up to 101 per cent
Source Projected Population of Scotland (2012-based) National Records of Scotland 2013
NHS in Scotland 201314
Exhibit 6
Number of delayed discharges and occupied bed days 2012-2014
Number of bed days occupied by delayed discharges
Number of delayed discharges
July 2012
90425
778
October 2012
95527
835
January 2013
99198
711
April 2013
101534
621
July 2013
96448
698
October 2013
99815
781
January 2014
107076
908
April 2104
117818
791
Note The number of delayed discharges refers to all patients who experienced a delay of any length It excludes code 9 patients with complex needs
Source ISD Scotland
NHS in Scotland 201314
Exhibit 3
Recurring and non-recurring savings
Territorial boards
Percentage recurring savings
Percentage non-recurring savings
201213
NHS Highland
45
55
201314
38
62
201213
NHS Orkney
69
31
201314
41
59
201213
NHS Borders
65
35
201314
48
52
201213
NHS Tayside
44
56
201314
50
50
201213
NHS Shetland
80
20
201314
52
48
201213
NHS Lanarkshire
91
9
201314
61
39
201213
NHS Ayrshire and Arran
95
5
201314
67
33
201213
NHS Fife
53
47
201314
69
31
201213
NHS Western Isles
71
29
201314
73
27
201213
NHS Lothian
70
30
201314
85
15
201213
NHS Dumfries and Galloway
96
4
201314
94
6
201213
NHS Grampian
87
13
201314
97
3
201213
NHS Forth Valley
78
22
201314
100
0
201213
NHS Greater Glasgow and Clyde
100
0
201314
100
0
Special boards
Percentage recurring savings
Percentage non-recurring savings
201213
The State Hospital
73
27
201314
59
41
201213
National Waiting Times Centre
87
13
201314
69
31
201213
Healthcare Improvement Scotland
83
17
201314
83
17
201213
NHS Education for Scotland
86
14
201314
84
16
201213
NHS 24
100
0
201314
93
7
201213
Scottish Ambulance Service
96
4
201314
98
2
201213
NHS Health Scotland
100
0
201314
100
0
201213
NHS National Services Scotland
100
0
201314
100
0
Source NHS boards financial performance returns March 2014 NHS Orkney updated its savings information in July 2014
NHS in Scotland 201314
Exhibit 1
Actual Scottish health budget 200203 to 201314
Total health budget (poundbillion)
200203
200304
200405
200506
200607
200708
200809
200910
201011
201112
201213
201314
Health budget (real terms)
871
903
1002
1054
1082
1144
1163
1179
1177
1167
1181
1182
Health budget (cash terms)
679
717
818
876
924
1002
1048
1091
1118
1134
1160
1182
Health spending per head of population (pound)
200203
200304
200405
200506
200607
200708
200809
200910
201011
201112
201213
201314
Health spending per head of population (cash terms)
1339
1414
1608
1714
1801
1938
2014
2085
2125
2138
2182
2219
Health spending per head of population (real terms)
1720
1782
1972
2063
2107
2213
2236
2253
2237
2202
2222
2219
Notes
1 The overall health budget is the Scottish Governments total spending on health (excluding spending on sport and equalities) including the budgets allocated to the 14 territorial boards and the nine special boards This includes revenue and capital budgets and annually managed expenditure
2 We used 201314 as the reference year for calculating real terms figures
3 200203 was the first year of the current three-year budget-setting arrangements and budget figures from before that year are not directly comparable
4 Due to an accounting adjustment to the capital budget the cost of capital charges has been removed from budgets prior to 201011
Source Scotlands draft budgets 200708 200809 200910 201011 201112 201213 201314 and 201415 Scottish Government and Mid-Year Population Estimates for Scotland General Register Office for Scotland
Auditor General for ScotlandThe Auditor Generalrsquos role is to
bull appoint auditors to Scotlandrsquos central government and NHS bodies
bull examine how public bodies spend public money
bull help them to manage their finances to the highest standards
bull check whether they achieve value for money
The Auditor General is independent and reports to the Scottish Parliament on the performance of
bull directorates of the Scottish Government
bull government agencies eg the Scottish Prison Service Historic Scotland
bull NHS bodies
bull further education colleges
bull Scottish Water
bull NDPBs and others eg Scottish Police Authority Scottish Fire and Rescue Service
You can find out more about the work of the Auditor General on our website wwwaudit-scotlandgovukaboutags
Audit Scotland is a statutory body set up in April 2000 under the Public Finance and Accountability (Scotland) Act 2000 We help the Auditor General for Scotland and the Accounts Commission check that organisations spending public money use it properly efficiently and effectively
NHS in Scotland 201314 | 3
Contents
Key facts 4
Summary 5
Part 1 The NHS in Scotland is facing significant pressures 8
Part 2 Looking ahead 31
Endnotes 45
Appendix 1 Audit methodology 47
Exhibit data
When viewing this report online you can access background data by clicking on the graph icon The data file will open in a new window
4 |
Key facts
09
Expected real terms reduction in the overall health budget from 201314 to 201516
11
Real terms increase in NHS boards revenue budget in 201314
pound2749million
Savings made by NHS boards in 201314
13Percentage of the population expected to be 75 or over in 2037421157
Number of hospital days lost to delayed discharges in 201314
Summary | 5Summary | 5
Summary
Key messages
1 The NHS in Scotland is facing significant pressures at the same time as having to make major changes to services to meet future needs We found evidence that NHS boards are finding it increasingly difficult to cope with these pressures NHS boardsrsquo revenue budgets increased by just over one per cent in real terms in 201314 and smaller real terms increases are planned from 201415 onwards Cost pressures such as staff pay costs the growing costs of drugs and other health technologies and rising pension costs exacerbate this tight financial situation At the same time the demands on the NHS are increasing as a result of demographic change particularly the growing population of elderly and very elderly people the number of people with long-term health conditions and peoplersquos rising expectations of healthcare
2 The NHS has made good progress in a number of areas including improving outcomes for people with cancer or heart disease and reducing healthcare-associated infections The Scottish Government has set out an ambitious vision for health and social care to enable everyone to live longer healthier lives at home or in a homely setting by 2020 It will be challenging for the NHS to make the scale of changes required over the next few years but critical if it is to meet this vision Progress has been slow and more significant change is needed to move more care into the community The NHS will not be able to continue to provide services in the way it currently does Change on this scale will be challenging at the same time as NHS boards are expected to meet demanding targets for hospital care and when budgets are tightening
3 NHS boards in Scotland delivered a small surplus of pound234 million against an overall budget of pound111 billion All NHS boards met their financial targets but several boards required additional funding from the Scottish Government or relied on non-recurring savings to break even Despite significant efforts the NHS did not meet some key waiting time targets in 201314 The current level of focus on meeting waiting time targets may not be sustainable when combined with additional pressures of increasing demand and tightening budgets There is increasing evidence of lsquopinch pointsrsquo in the complex health and social care system leading to delays in patients getting the care they need in hospital or the community NHS boards need a more detailed understanding of current and future patient demand how they are using their capacity and how patients move through the system in order to assess how they can deliver services differently in the future to better match needs
6 |
Recommendations
The strong focus on meeting annual targets makes it harder to carry out longer-term financial planning This focus makes it difficult for NHS boards to fund services to meet current needs at the same time as making the investment required to reshape care in line with the 2020 Vision NHS boards and their partners need to develop clear plans about how they will deliver sustainable and affordable services to meet future needs by
bull using population and long-term condition projections to estimate future demand and identify the way that they will provide care that will meet the future needs of the population and achieve the 2020 Vision
bull developing detailed and integrated long-term plans for how they will move to those models of care These should set out the changes needed to spending workforce buildings information technology and other equipment
bull developing detailed plans to identify the funding they require to move to new models of care and how they will release and move funding to achieve this This includes using budget estimates financial projections scenario planning and economic modelling
bull highlighting any major risks to the Scottish Government to identify what support and action is required at a national level
NHS boards and their partners need to understand blockages in the way that patients move around the health and social care system and which lead to patients not being able to get care where and when they need it They need to use this information to better match patient demand with available staff hospital beds community services and other resources The Scottish Government NHS boards and their partners should
bull improve and maintain data on patterns of demand for and supply of community-based health and social care services
bull ensure they have access to the necessary skills and technology to
ndash record and analyse patterns of demand activity and delays by month week day of the week and time of day
ndash use this data on a real-time basis to make sure that staff and other resources are in place to meet needs
bull use modelling techniques to predict patient needs in the short and longer term They should then use this along with information on available capacity in order to change how they use staffing and other resources to improve the flow of patients around the system and avoid unnecessary delays
Summary | 7
The NHS is facing significant challenges in making the changes required to achieve the 2020 Vision within the tight financial resources available These changes need to happen while continuing to provide services to meet the current needs of patients The Scottish Government should
bull review the current financial and performance targets for the NHS and the planned indicators for integration joint boards to ensure they are consistent with and support the implementation of the 2020 Vision
bull consider introducing milestones to measure the extent to which boards are moving towards more preventative and community-based care
About the audit
1 This report comments on the performance of the NHS in 201314 and on its future plans It is based on our analysis of
bull the audited annual accounts and auditorsrsquo reports on the 201314 audits of the 23 NHS boards
bull NHS boardsrsquo Local Delivery Plans (LDPs) These set out their detailed plans and anticipated budget for the next year and indicative plans for the next three to five years Boards submit their LDPs to the Scottish Government every year for approval
bull monthly Financial Performance Returns (FPRs) that each NHS board submits to the Scottish Government These provide information about NHS boardsrsquo financial performance throughout the financial year
bull NHS activity and performance data published by Information Services Division (ISD) Scotland
bull an analysis of the demand for healthcare services the capacity of the NHS to provide services and the flow of patients through the healthcare system We will publish a briefing paper on this analysis in early 2015
8 |
Part 1The NHS in Scotland is facing significant pressures
all NHS boards met their financial targets in 201314 but some are facing increasing difficulty in achieving them
Key messages
1 All NHS boards broke even against their revenue and capital budgets in 201314 for the sixth year in a row The NHS boards as a whole achieved an overall surplus of pound234 million (021 per cent of their total revenue and capital budgets of pound111 billion) All boards except NHS Western Isles met their savings targets and the NHS as a whole delivered total savings of pound2749 million
2 There are signs that NHS boards are facing increasing difficulty meeting their financial targets and some are doing this in unsustainable ways Four boards required additional funding from the Scottish Government to break even and five continue to rely on high levels of non-recurring savings
3 Despite significant efforts there are increasing signs of pressure on NHS boardsrsquo ability to meet demanding performance targets The strong focus on meeting waiting time targets may not be sustainable when combined with the additional pressures of increasing demand related to demographic changes and the overall NHS budget starting to decrease in real terms The effort that NHS boards are putting into meeting challenging financial and performance targets each year makes it more difficult for them to focus on the long-term planning required to achieve the 2020 Vision
NHS budgets are under pressure
2 The Scottish Government spent pound12 billion on health and wellbeing in 201314 35 per cent of total public spending in Scotland1 It manages the health and wellbeing budget as a whole including NHS boards and sets the national strategy for the NHS in Scotland (Supplement 1 Overview of financial management in the NHS in Scotland) The current national strategy is set out in the 2020 Vision which aims to provide more preventative and ongoing care at home or in homely settings2
3 In 201314 the Scottish Government allocated pound111 billion of the total pound12 billion budget for health and wellbeing to the 14 territorial NHS boards that serve each area of Scotland and deliver frontline healthcare services and to the nine special NHS boards that provide specialist and national services (Supplement 2 Territorial and special boards in Scotland)3
4 Since 200203 the Scottish Governmentrsquos total spending on health (excluding spending on sport and equalities) has increased in real terms (that is taking inflation into account) Health spending per head of population has decreased
Part 1 The NHS in Scotland is facing significant pressures | 9
slightly in real terms since 200910 (Exhibit 1) This is due to smaller increases in the budget compared to previous years and an increasing population The Scottish Governmentrsquos overall health expenditure is planned to decrease by 09 per cent in real terms over the next two years between 201314 and 201516
bull the revenue budget is planned to increase by almost 10 per cent
bull the capital budget is planned to decrease by 536 per cent
Exhibit 1Actual Scottish health budget 200203 to 201314The health budget continues to have small increases in cash terms Health spending per head of population has slightly decreased in real terms since 200910
Hea
lth
spen
ding
per
hea
d of
pop
ulat
ion
(pound)
0
500
1000
1500
2000
2500
Tota
l hea
lth
budg
et (pound
bill
ion)
6
8
10
12
Health spending per head of population (cash terms) Health spending per head of population (real terms)
Health budget (real terms) Health budget (cash terms)
2013
14
2012
13
2011
12
2010
11
2009
10
2008
09
2007
08
2006
07
2005
06
2004
05
2003
04
2002
03
2013
14
2012
13
2011
12
2010
11
2009
10
2008
09
2007
08
2006
07
2005
06
2004
05
2003
04
2002
03
Notes1 The overall health budget is the Scottish Governments total spending on health (excluding spending on sport and equalities) including the budgets allocated to the 14 territorial boards and the nine special boards This includes revenue and capital budgets and annually managed expenditure2 We used 201314 as the reference year for calculating real terms figures3 200203 was the first year of the current three-year budget-setting arrangements and budget figures from before that year are not directly comparable4 Due to an accounting adjustment to the capital budget the cost of capital charges has been removed from budgets prior to 201011
Source Scotlands draft budgets 200708 200809 200910 201011 201112 201213 201314 and 201415 Scottish Government and Mid-Year Population Estimates for Scotland General Register Office for Scotland
Exhibit 1
Audit Scotland
Exhibit 1
Exhibit 1 background data
10 |
5 In 201314 the total amount of revenue funding that the Scottish Government provided to boards increased by almost three per cent in cash terms and by just over one per cent in real terms from 201213
bull All territorial boards received small real terms increases in their revenue budgets There was an overall increase of 16 per cent in 201314
bull Revenue budgets decreased in some special boards mainly in those that do not provide frontline services There was an overall decrease of 05 per cent in 2013144
All NHS boards met their financial targets in 201314 but some are facing increasing difficulty in achieving them
6 NHS boards have two financial targets to break even against both their revenue and capital budgets at the end of the financial year5 This means that NHS boards cannot have a deficit against their budgets at the end of the year The requirement for NHS boards to break even at the end of every year makes it more difficult to carry out longer-term financial planning It makes it difficult for NHS boards to balance the funding of services to meet current needs with the investment required to address longer-term issues
7 Last year we recommended that the Scottish Government should consider moving away from setting annual financial resource limits for NHS boards to help them plan for the longer term6 From 201415 a proportion of funding that the Scottish Government can carry forward each year will be available to the NHS if required (through the budget exchange mechanism) This amount is not fixed and the Scottish Government will decide this on an annual basis7 Although this provides some extra flexibility it does not provide boards with certainty about the amount of additional funding available to allow them to plan ahead The Scottish Government is also able to provide some flexibility each year for NHS boards that want to retain a surplus for investment in the following year NHS boards need to agree this with the Scottish Government in advance As the Scottish Government needs to balance the health budget as a whole each year it can only agree this for a small number of boards or for a small percentage of their budgets
8 All NHS boards broke even in 201314 for the sixth year running There was an overall surplus in the revenue budget of pound233 million for the whole of the NHS in Scotland Supplement 3 Financial performance of NHS boards in 201314 shows the budget and outturn figures for 201314 This represents only 022 per cent of the revenue budget slightly higher than the 016 per cent surplus in 201213 NHS boards normally return any surplus against their budgets at the year-end to the Scottish Government NHS Dumfries and Galloway and NHS Greater Glasgow and Clyde both agreed with the Scottish Government to retain a surplus against their revenue budgets in 201314 of pound3 million and pound10 million respectively This is to support future non-recurring expenditure in relation to new hospitals that are being built in both these boards
Four boards required brokerage in 2013149 The Scottish Government can agree to provide an NHS board with additional funding to help it manage changes to planned expenditure or provide extra money at a time of pressure This is agreed on the basis that the board provides assurance that it can repay the funds in the coming financial years This form of additional funding is known as brokerage The amount of brokerage received by boards in
Part 1 The NHS in Scotland is facing significant pressures | 11
a year is relatively small compared to their overall budget This shows that NHS boards are often working to tight budgets with little flexibility for unexpected costs at the end of the year for example locum costs to cover staff sickness
10 In 201314 four NHS boards received brokerage from the Scottish Government Brokerage can be helpful in providing some additional flexibility in boardsrsquo budgets for unforeseen unexpected financial pressures However poor financial management was a major factor in NHS Highland and NHS Orkney needing brokerage in 201314 Both boards requested brokerage late in the financial year to help them break even due to overspending on their day-to-day running costs
bull NHS Highland received pound25 million (04 per cent of its revenue budget) to cover pressures associated with overspending on the operating costs for Raigmore Hospital and costs associated with hiring locum doctors and meeting waiting times targets (Case study 1 page 13)
bull NHS Orkney received pound1 million (20 per cent of its revenue budget) for additional costs of hiring locum doctors (Case study 2 page 14)
bull NHS 24 received pound39 million (53 per cent of its revenue budget) for the financial implications of delays and ongoing issues in implementing a new IT system This is likely to have financial implications for the board in future years (Case study 3 page 15)
bull NHS Tayside received pound285 million (04 per cent of its revenue budget) for deferring the sale of property with an anticipated profit of pound2 million and associated ongoing maintenance costs This is the second year running the board received brokerage for this reason
Three NHS boards faced particular financial difficulties in 20131411 The external auditors have raised concerns about the financial position and financial management in NHS Highland and NHS Orkney and the financial position in NHS 24 Both NHS Highland and NHS Orkney received brokerage to meet operational cost pressures but did not identify this need until late in the financial year Both boards also made high levels of non-recurring savings to help them break even This is a less sustainable way to meet savings targets than making recurring savings as it means the boards need to find these same savings again in other areas in future years NHS Highland and NHS Orkney both receive funding allocations from the Scottish Government that are less than that recommended by the national funding formula (paragraph 13) While this may contribute to their financial pressures these boards also need to improve their financial management (Case study 1 and Case study 2) NHS 24 has experienced financial difficulties due to problems implementing a new IT system (Case study 3) The Auditor General has prepared separate reports on each of these three boards8
Seven boards have ongoing commitments to repay brokerage12 The Scottish Government has agreed brokerage with eight NHS boards over the past five years with five of these boards receiving brokerage in more than one financial year (Exhibit 2 page 12) Seven NHS boards have ongoing commitments to repay brokerage after 201314 reducing the amount they will have available to spend on services during this period For example
bull NHS Orkney has received brokerage on four occasions and its repayment schedule spans a seven-year period Brokerage was received between
12 |
200910 and 201112 to support implementation of a new clinical strategy and help the board to return to a recurring financial balance The board repaid pound1 million in 201314 and has agreed that the balance will be repaid in 201617 and 201718 to tie in with moving closer to its target funding allocation
bull NHS Highland is due to repay brokerage received in 201314 over the next three years
bull NHS Tayside is relying on selling properties to repay the brokerage it has received and to break even in 201415 If these property sales do not take place or the proceeds are less than expected the board might need brokerage again which could reduce the boardrsquos budget in future years
Exhibit 2Brokerage provided by the Scottish Government 200910 to 201314 and planned repayments to 201819Eight NHS boards have received brokerage over the past five years Arrangements for repayment can span a number of years
NHS board
Brokerage by year (pound millions) 0910 1011 1112 1213 1314 1415 1516 1617 1718 1819
Total brokerage
by board
FifeBrokerage 111 140
251Repayments (036) (215)
Forth Valley
Brokerage 210 11001310
Repayments (155) (257) (357) (441)
HighlandBrokerage 250
250Repayments (050) (100) (100)
LothianBrokerage 1000
1000Repayments (200) (400) (400)
OrkneyBrokerage 111 101 226 100
538Repayments (032) (100) (321) (085)
TaysideBrokerage 225 285
51Repayments (025) (405) (080)
Western Isles
Brokerage 31031
Repayments (063) (059) (026) (054) (054) (054)
NHS 24Brokerage 032 1658 386
2076Repayments (365) (643) (619) (449)
Total brokerage by year 421 311 1469 3023 1021 Notes1 Reasons for boards receiving brokerage in 201314 are in Case studies 1 2 and 3 and paragraph 102 Reasons for other boards receiving brokerage before 201314 areNHS Fife received pound11 million in 201112 and a further pound14 million in 201213 due to overspending in its Acute Operating Division and on GP prescribing and for costs for some specialist patient treatment outside the Fife area NHS Forth Valley received pound21 million in 201011 for financial support The board received a further pound11 million in 201112 for costs associated with the implementation of its Healthcare Strategy and to help it break even The Scottish Government agreed that pound1 million of this pound11 million brokerage did not require to be repaid NHS Lothian received pound10 million in 201213 to help improve its performance against waiting times targetsNHS Western Isles received pound31 million in 200910 to support a historical deficit although it had achieved financial balance for two years
Source Health Finance Directorate Scottish Government
Part 1 The NHS in Scotland is facing significant pressures | 13
Case study 1Financial management at NHS Highland
In 201314 NHS Highland required brokerage of pound25 million from the Scottish Government to break even This was mainly due to an overspend on the operating costs for Raigmore Hospital and costs associated with hiring locum doctors and meeting waiting times targets Weaknesses in budgetary control at Raigmore Hospital contributed to a pound965 million overspend at the hospital in 201314 and the board did not meet waiting time targets for inpatientsday cases and outpatients (Exhibit 5 page 23) Weaknesses in budgetary control at Raigmore Hospital were also highlighted in internal audit reports in 2013 and 2014
Until February 2014 the board was forecasting that it would break even at the end of the financial year Finance reports did not sufficiently detail how the board expected to bridge the gap between the ongoing overspend and its forecast break-even position It was not until close to the end of the financial year that the finance team reported to the board of directors that brokerage from the Scottish Government would be needed to break even
NHS Highland has increasingly relied on non-recurrent savings to break even in recent years In 201314 it planned to make 67 per cent of its savings on a recurring basis but it actually only made 38 per cent (pound7 million) on this basis Continued reliance on non-recurring savings may not be sustainable in the longer term
In 201314 NHS Highland also received additional funding of pound1 million from Highland Council towards the transitional costs of integrating adult health and social care services These services had transferred to the board as part of the integration of health and social care in Highland The cost of delivering adult social care services still poses a financial risk to the board Highland Council has agreed to provide the board with a further pound135 million between 201415 and 201617 This covers the final three years of the partnership agreement between the board and the council for adult health and social care services
NHS Highland continues to experience financial pressures in 201415 At the end of August 2014 it forecast breaking-even at the end of the financial year This requires it to achieve by the year-end a pound123 million improvement on the financial position projected in August with pound99 million of this relating to Raigmore Hospital This will be challenging for the board and will depend on meeting its savings targets NHS Highland recognises the significant challenges it faces in identifying and delivering savings It has established a programme board chaired by the chief executive and including all executive and operational directors to oversee the delivery of savings The programme board is focusing on delivering recurring savings to achieve financial balance
In 201314 NHS Orkney required brokerage of pound1 million from the Scottish Government to break even This was largely due to hiring locum doctors to cover vacant medical posts
Throughout the year NHS Orkney was reporting an overspend against its revenue budget to its Finance and Performance Committee and this increased considerably over the second half of the financial year The board did not have detailed plans for how it was going to bridge the gap between its ongoing overspend position and its forecast break-even position at the year-end or provide reports to its Board of directors about how it would achieve this We were informed that officers discussed actions with Board members
NHS Orkney approached the Scottish Government in February 2014 to request brokerage of pound075 million This was later revised to pound1 million in March 2014 The Scottish Government has agreed that the board does not need to start repaying the total amount of brokerage received of pound406 million (including brokerage received in previous years) until 201617 (Exhibit 2 page 12) This is when the board should receive additional funding to take it closer to its target funding allocation (paragraph 13)
During the audit of the boardrsquos 201314 annual accounts the auditor identified a significant error relating to accounting entries associated with the five-yearly revaluation of its land and buildings during 201314 Due to a lack of capacity within NHS Orkneys finance team staff from NHS Fife assisted the board in resolving this issue The auditor has expressed some concern about the capacity of the finance team given the pressures facing the board
In recent years NHS Orkney has relied on non-recurring savings to break even (Exhibit 3 page 17) In 201314 it achieved pound042 million recurring savings against a target of pound103 million (41 per cent of the target) The boards financial plans for 201415 also rely on non-recurring savings It plans to make over 66 per cent of its planned savings on a non-recurring basis due to the non-recurring nature of the pressures facing the board such as using locum and agency staff until permanent staff are recruited Taking into account the need to continue to deliver savings and to repay brokerage the auditor has highlighted that delivering a break-even position in the coming years will be challenging for the board There are specific pressures that may affect NHS Orkneys ability to achieve the savings required for longer-term sustainability particularly workforce pressures and associated costs of hiring locum doctors Between 201213 and 201314 the boards spending on locum doctors increased by 30 per cent The board recruited a number of staff to key posts in 201314 but it has underlying recruitment problems and has not been able to fill some posts despite several recruitment campaigns Continued reliance on locum doctors will have a significant impact on its plans to achieve savings
The Chief Executive asked the boardrsquos internal auditor to undertake a detailed review of the boardrsquos 201314 financial position This includes an examination of the boardrsquos approach to budget-setting and in-year financial management The review is now complete and the board is developing an action plan
Source NHS Orkney Annual Audit Report 201314
Part 1 The NHS in Scotland is facing significant pressures | 15
Case study 3NHS 24s Future Programme
NHS 24 planned to implement its Future Programme in September 2013 This includes delivering new technology that is central to NHS 24 improving its core telephone and online services for patients NHS 24 also expected the new application to deliver financial savings NHS 24 has delayed implementation as it considers that the new application currently developed does not meet its patient safety requirements
The delay in implementing the new system has led to additional costs being incurred The total cost of the project to date is pound38 million considerably more than the original business case of pound296 million The board has estimated that it will incur further additional costs of pound146 million between 201415 and 201516 to achieve an acceptable solution This includes potential new investment in developing the IT system the costs of continuing to maintain the current system during the delay and failing to achieve savings that were expected as a result of the new system
By the end of 201213 the Scottish Government had provided NHS 24 with brokerage of pound169 million and pound08 million in revenue funding to fund the Future Programme The boards financial plan for 201314 included agreed brokerage of pound17 million to support what was planned to be the final year of implementing the Future Programme Due to the delays and ongoing problems implementing the new IT system the Scottish Government agreed to provide a further pound22 million brokerage taking the total provided in 201314 to pound39 million NHS 24 was due to repay the brokerage over three years from 201415 but the Scottish Government has agreed that this can be postponed to start in 201516 (Exhibit 2 page 12)
NHS 24 has drafted a five-year financial plan for 201415 onwards This projects a break-even revenue position for the first four years of the plan and a small surplus position in year five The plan has factored in the financial implications of resolving the issues with the Future Programme and the board will update this on an ongoing basis as the situation evolves The auditor has highlighted that the achievement of financial targets is likely to remain a high risk for the board given the extent of the issues that need to be resolved and the requirement to repay brokerage in future years
NHS 24 has kept the Scottish Government informed about the problems with the Future Programme The board and the Scottish Government jointly commissioned an independent review and NHS National Services Scotland has also recently provided additional support to NHS 24 through contract management and technical specialists The board is continuing to work with the suppliers of the new IT system on resolving the issues
The board has ensured that the current IT systems can be maintained in a safe and reliable manner so that services for patients are not affected
Source NHS 24 Annual Audit Reports 201213 and 201314
16 |
Four NHS boards are still receiving less than their target funding allocation13 The Scottish Government uses a formula developed by the National Resource Allocation Committee (NRAC) to allocate funding to territorial boards The formula has been in place since 200910 and the Scottish Government is aiming for all NHS boards to be within one per cent of their target allocations by 201617 Territorial boards receive an increase in funding each year however some boardsrsquo allocations are below the amount proposed by the formula Four boards were more than one per cent below their target allocations in 201314 and 201415
bull NHS Orkney -122 per cent (pound48 million) in 201314 -111 per cent (pound45 million) in 201415
bull NHS Grampian -51 per cent (pound399 million) in 201314 -37 per cent (pound302 million) in 201415
bull NHS Highland -22 per cent (pound113 million) in 201314 -23 per cent (pound123 million) in 201415
bull NHS Lanarkshire -15 per cent (pound127 million) in 201314 -17 per cent (pound153 million) in 201415
14 Receiving funding that is below their target NRAC allocation may have contributed to financial difficulties in NHS Highland and NHS Orkney Both boards broke even in 201314 using unsustainable methods specifically brokerage from the Scottish Government and high levels of non-recurring savings However the level of NRAC funding is not the only factor causing financial difficulties at NHS Highland and NHS Orkney We have identified concerns about financial management at these boards NHS Grampian and NHS Lanarkshire also received funding allocations of more than one per cent below their target NRAC allocations NHS Grampian only met two of the eight waiting time targets and the number of its patients with a delayed discharge increased (Exhibit 5 page 23)
Five boards continue to rely on high levels of non-recurring savings
15 Boards are required to make efficiency savings of three per cent against their revenue budgets and had forecast savings of pound2678 million in 201314 The actual savings achieved totalled pound2749 million (pound2447 million by territorial boards and pound302 million by special boards) All boards met their savings targets except NHS Western Isles which was pound30000 (16 per cent) below its target NHS boards retain savings made locally as part of their overall financial planning to help balance their budgets
16 Some boards are still relying on a high percentage of non-recurring savings (Exhibit 3 page 17) These are savings that are only made for one year rather than savings that the board will continue to make every year9 It can be appropriate to have some non-recurring savings but it is important that the majority of savings are recurring to ensure the sustainability of the boards financial position and to reduce the risk of not achieving savings targets in future years We have highlighted this as a risk in our reports over the last two years and the risk still remains The area that contributed most to NHS boardsrsquo savings was productivity NHS boards made total savings of pound1141 million in this area against a forecast pound1027 million However 26 per cent of these savings were non-recurring compared with a forecast of 14 per cent This suggests that these
Part 1 The NHS in Scotland is facing significant pressures | 17
Exhibit 3Recurring and non-recurring savingsA number of NHS boards relied on a high level of non-recurring savings in 201314 and 11 boards made higher levels of non-recurring savings than in 201213
RecurringNon-recurring
201213 201314
NHS Orkney
Territorial boards
Special boards
NHS Highland NHS Borders NHS Tayside
NHS Shetland NHS Lanarkshire NHS Ayrshire and Arran NHS Fife
NHS Western Isles NHS Lothian NHS Dumfries and Galloway NHS Grampian
NHS Forth Valley
The State HospitalNational
Waiting Times CentreHealthcare
Improvement ScotlandNHS Education
for Scotland
NHS 24Scottish
Ambulance ServiceNHS Health
ScotlandNHS National
Services Scotland
NHS Greater Glasgow and Clyde
RecurringNon-recurring
1213 1314 1213 1314 1213 1314 1213 1314
1213 1314 1213 1314 1213 1314 1213 1314
1213 1314 1213 1314 1213 1314 1213 1314
1213 1314 1213 1314
1213 1314 1213 1314 1213 1314 1213 1314
1213 1314 1213 1314 1213 1314 1213 1314
Source NHS boards financial performance returns March 2014 NHS Orkney updated its savings information in July 2014
Exhibit 3
Audit Scotland
Exhibit 3
Exhibit 3 background data
Exhibit 3
kwalker
Sticky Note
Unmarked set by kwalker
Exhibit 3
18 |
savings were the result of short-term initiatives rather than changing the way that services are provided in order to improve productivity This is similar to last year when 28 per cent of productivity savings were non-recurring higher than forecast The difficulty NHS boards have achieving recurring productivity savings is another strain on them and adds to their financial pressures for the coming year
17 Seven territorial and four special boards had higher overall levels of non-recurring savings in 201314 than in the previous year10 Five boards reported a particularly high percentage of non-recurring savings
bull NHS Highland (62 per cent)
bull NHS Orkney (59 per cent)
bull NHS Borders (52 per cent)
bull NHS Tayside (50 per cent)
bull NHS Shetland (48 per cent)
18 These boards will have to find further savings in future years on top of the annual savings target This position is not sustainable especially since boards are required to continue to make three per cent savings from 201415
19 NHS boards set out their financial projections up to five years ahead in their Local Delivery Plans (LDPs) showing expected funding projected expenditure and the savings required each year to close the gap between income and expenditure For 201415 NHS boardsrsquo detailed financial planning is still limited mainly to the first year of the LDP Across the NHS
bull six per cent of the required savings for 201415 are unidentified
bull over two-thirds of the amount of savings are unidentified for the following four years
bull five NHS boards have not identified the breakdown of the amount of their savings after 201415 (Fife Forth Valley Greater Glasgow and Clyde Lothian and Western Isles)
NHS boards are making less progress than expected on reducing backlog maintenance
20 Further cost pressures arise from the backlog of maintenance required to ensure that hospitals and other buildings are fit for purpose In 2012 the Scottish Government forecast that the cost of this backlog would decrease by pound174 million by 2013 from pound948 million to pound774 million11 The actual reduction was pound90 million to pound858 million12 The high-risk backlog reduced to pound96 million pound21 million less of a reduction than anticipated The significant-risk backlog rose from pound265 million to pound275 million13 This reflects additional maintenance identified by boards through survey work during 2013 as well as some lack of progress in carrying out backlog maintenance
21 The level of backlog maintenance decreased in 14 boards and increased in seven14 The total increase in the seven boards was pound199 million of which NHS
Part 1 The NHS in Scotland is facing significant pressures | 19
Fife had by far the largest increase of pound135 million In three of these boards (NHS Borders NHS Highland and the Scottish Ambulance Service) the backlog had also increased in 2012 The increase of pound34 million in NHS Highland is a further financial pressure on the board In four boards over 50 per cent of the cost of backlog maintenance was classed as high-risk and significant risk NHS Lothian (84 per cent) NHS Shetland (82 per cent) NHS Tayside (54 per cent) and NHS Ayrshire and Arran (52 per cent)
22 The Scottish Government now forecasts that the majority of high-risk maintenance backlog will be cleared by 2015 one year later than originally planned The significant-risk backlog is now forecast to decrease to around pound150 million by 2017 compared with the previous forecast that it would be cleared by 2016
The annual financial target for capital spending makes it difficult to plan longer-term projects
23 Capital investment is important in enabling boards to plan and deliver the 2020 Vision by investing in new healthcare facilities maintaining and modernising existing facilities that will be required in future and disposing of those that are no longer needed The NHS capital budget available to boards fell by 21 per cent between 201213 and 201314 from pound6055 million to pound4813 million More than half of this reduction related to accounting adjustments associated with revenue-financed methods such as Non-Profit Distribution (NPD) which do not affect the capital funds available for boards to spend The remaining capital budget available to boards reduced by 12 per cent to pound4664 million
24 All boards broke even against their capital budgets in 201314 but significant movements in their budgets were required during the year to allow them to reach that position (Exhibit 4 page 20) The Scottish Government manages the capital budget carefully during the year moving funds from NHS boards that expect delays in their expenditure to those that are able to make use of the funding This allows the NHS as a whole and individual boards to stay within their capital budgets but it makes it difficult to see how well NHS boards have managed their resources The Scottish Government has increased the proportion of total capital funding that is included in initial allocations each year although it did not agree final budgets with several NHS boards until after the end of the financial year NHS boardsrsquo annual accounts are still not clear about the extent of and reasons for movements in their capital budgets during the year
25 The annual financial targets for capital budgets and uncertainty about future budgets hinders NHS boardsrsquo effective planning of capital projects For example NHS boards returned around pound29 million of capital funding to the Scottish Government during 201314 A number of boards that had returned capital funds in previous years received these funds back in 201314 and subsequently returned them again For example NHS Grampian agreed with the Scottish Government to defer some of its capital budget allocation from 201112 and 201213 into 201314 to help manage the cost of essential backlog maintenance at Aberdeen Royal Infirmary From 201415 the Scottish Government has issued two-year indicative capital allocations to NHS boards to help them manage their capital programmes
26 The NHS needs the right buildings and facilities to achieve the 2020 Vision and provide healthcare that meets future needs Over the next four years the
20 |
Scottish Government plans to invest around pound330 million in new facilities and other capital projects in the community15 This investment is intended to help move towards more community-based and preventative care by April 2017 For example NHS Forth Valley Stirling Council and Forth Valley College plan to develop the Stirling Care Village as part of their wider plans to change and improve care for older people This model intends to combine primary and community healthcare with care for older people providing joined-up services GP surgeries the voluntary sector and other local service providers will also be involved in delivering enhanced services through this model of care16
Exhibit 4There were significant movements in the NHS capital budget in 201314Both the overall capital budget and the budget available for investment decreased from 201213
201213pound million
201314pound million change
Total capital budget 6055 4813 -2052
Split into
Capital provided for investment in board capital programmes 5281 4664 -1168
Capital funded by the Scottish Parliament for accounting treatment for new revenue-financed projects
775 149 -8072
There were also significant movements in the capital budget across all boards These follow a similar pattern to the movements in 201213
Note The capital budget shown here is represented by the final capital resource limits (CRLs) from the NHS boards accounts This differs from the capital budget allocated to the NHS within the Scottish Government Budget due to adjustments for example for assets donated to the boards
Part 1 The NHS in Scotland is facing significant pressures | 21
There have been improvements in the quality of healthcare
27 The Scottish Government has set out the national strategy for the NHS in the 2020 Vision and the Healthcare Quality Strategy These aim to improve the quality and safety of patient care and health outcomes17 The Scottish Patient Safety Programme focuses on improving the safety and reliability of healthcare and reducing harm For example a focus on healthcare-associated infections (HAIs) resulted in a 50 per cent reduction in adult patients in hospital with HAIs between 2005 and 2011 (from 95 per cent to 49 per cent) and rates continue to fall18 Health outcomes for some conditions have also improved Cancer and heart disease are the two main causes of death in Scotland Between 2003 and 2012 the death rate for all forms of heart disease fell by 38 per cent and the number of people having a heart attack fell by a fifth19 The Scottish Government has a policy objective to improve early detection of cancer which improves outcomes for patients Between 2010 and 2013 the number of people diagnosed with early stage breast colorectal or lung cancer increased by 75 per cent Patient satisfaction with hospital inpatient services has also generally increased since 201220
Performance against waiting time targets is showing increasing signs of pressure
28 NHS boards are required to meet a number of performance targets that cover health improvement efficiency access and treatment (HEAT targets) These aim to ensure that NHS boards focus on making improvements in areas the Scottish Government has identified as priorities to help to achieve its overall purpose and objectives21 In recent years the Scottish Government has reduced the number of HEAT targets and has committed to focusing more on outcomes But the level of performance that boards are expected to achieve has become more challenging at the same time as budgets are tightening This is making it increasingly difficult for NHS boards to continue to meet HEAT targets
29 Many of the HEAT targets relate to waiting times Waiting time targets have reduced over the past ten years and the length of time that people wait has decreased considerably Some targets have become more challenging for NHS boards recently
bull Delayed discharges ndash since April 2013 NHS boards have been working to the target that no patient should wait in hospital for more than 28 days from when they are clinically ready for discharge (reduced from 42 days previously) From April 2015 this is due to reduce further to 14 days Boards are finding it difficult to meet the current target with only three boards meeting this at the end of April 2014 (Exhibit 5 page 23)
bull Specialist Child and Adolescent Mental Health Services (CAMHS) ndash the current target is that 90 per cent of patients should wait no longer than 26 weeks from referral to treatment This target is due to reduce to 18 weeks from December 2014 Performance against the current target deteriorated between 201213 and 201314 from 99 to 93 per cent of all patients seen within 26 weeks (Exhibit 5)
bull The treatment time guarantee (TTG) was introduced on 1 October 2012 under the Patient Rights (Scotland) Act 2011 All eligible patients now
22 |
have a legal right to receive planned inpatient or day-case treatment within 12 weeks of the treatment being agreed This is the first time that waiting times have been a legal right and puts more pressure on boards to ensure that all patients are seen within the required time The TTG has not been met nationally since it was introduced and only five territorial boards met it in March 2014
30 Last year we highlighted that the failure to meet some key waiting time targets suggested capacity pressures in boards Overall performance against several of these targets deteriorated between 201213 and 201314 indicating increasing capacity pressures in boards (Exhibit 5) The Scottish Government has recently lowered the threshold for the AampE target as boards were struggling to meet it From April 2013 the AampE waiting time target was temporarily lowered from 98 per cent of patients to be seen within four hours to 95 per cent The 95 per cent target is due to be delivered by the year ending September 2014 and performance data will be published at the end of November 2014
31 Across Scotland at the end of March 201422
bull Only three of the key waiting time targets were met nationally the drug and alcohol treatment target (met by all 14 territorial boards) the cancer (decision to treat to first treatment) target (met by 11 territorial boards) and access to CAMHS (met by nine territorial boards) These three targets were also met at the end of March 2013 The 18-week referral to treatment target which was met in at the end of March 2013 was not met at the end of March 2014
bull No territorial board met the outpatient waiting time target and only three boards met the delayed discharges target (NHS Ayrshire and Arran NHS Orkney and NHS Shetland)
bull Boards are finding it challenging to meet the TTG four-hour AampE target and cancer (urgent referral to first treatment) target
bull Performance against the targets varied by board While NHS Orkney met eight of the nine targets and NHS Shetland met seven NHS Grampian and NHS Lothian met two of the nine targets NHS Greater Glasgow and Clyde and NHS Highland met three and NHS Tayside met four
32 More detailed analysis of performance against these key targets highlights the variability across boards and specialties For example most patients waiting longer than the TTG target of 12 weeks at the end of March 2014 were in NHS Lothian and NHS Grampian More recent information for June 2014 shows that
bull no patients were waiting longer than 12 weeks in any specialty in NHS Forth Valley NHS Greater Glasgow and Clyde NHS Lanarkshire NHS Orkney NHS Shetland and NHS Western Isles
bull the three boards with the highest number of people waiting for more than 12 weeks for treatment were NHS Lothian NHS Highland and NHS Grampian
bull the specialties with the highest number of people waiting more than 12 weeks in NHS Lothian were plastic surgery (125 patients) urology (93) and general surgery (49) in NHS Highland it was trauma and orthopaedics (166) and in NHS Grampian it was plastic surgery (133) and ophthalmology (88)23
Part 1 The NHS in Scotland is facing significant pressures | 23
Exhibit 5Performance against waiting time and delayed discharge targets in territorial NHS boardsPerformance against some waiting time targets deteriorated in some boards (end of March 2013 to end of March 2014)
Child and Adolescent Mental Health Services (CAMHS)1
Drug and alcohol treatment2
Referral to treatment (RTT)1
Out-patients1
Inpatientday-case treatment time guarantee (TTG)1 3 4 AampE1
Cancer ndash urgent referral to first treatment2
Cancer ndash decision to treat to first treatment2
Delayed discharges5
Targetstandard 26 wks 3 wks 18 wks 12 wks 12 wks 4 hrs 62 days 31 days 4 wks
Met Met temporaryinterim target Met for over 99 of patients Within 5 Not met
Notes1 Data is for month ended 31 March 2013 and 2014 CAMHS data for NHS Highland is not available for March 2014
The AampE target was 98 per cent at March 2013 and 95 per cent at March 2014 2 Data for quarter ended 31 March 2013 and 20143 TTG applies to patients added to the waiting list from 1 October 2012 only4 TTG incorporates a legal right to treatment so we have categorised this as met not met or met for over 99 per cent of patients5 Performance against this standard is based on a census at point in time The delayed discharges data are at the end of April 2013 and 20146 National Waiting Times Board is not included in this table Four of these targets apply to this board ndash Referral to treatment (RTT) Outpatients Inpatientday case treatment time guarantee (TTG) and Cancer ndash decision to treat to first treatment The board met all four of these targets
Source Based on data from ISD Scotland and subject to any caveats described by ISD Scotland
24 |
Demand for outpatient appointments is increasing faster than the number of patients seen33 NHS boards need to manage demand for outpatient clinics alongside inpatients and day cases They are finding it difficult to meet the target that new outpatients should be seen within 12 weeks of referral and none of the territorial boards met the target throughout 20131424 Demand for outpatient appointments has increased over the last three years but the number of people seen has not increased to the same extent At the quarter ending March 2014
bull the number of people on waiting lists for a new outpatient appointment was 34 per cent higher than at the quarter ending March 2010 increasing from 187693 to 252009
bull the number of new outpatients seen during the same period increased by only 13 per cent from 324403 to 367259 meaning that the number of people waiting is continuing to increase
bull the number of people who had been waiting longer than 12 weeks increased from 157 at the quarter ending March 2010 to 6754 at the quarter ending March 2014
34 The increasing number of people waiting over 12 weeks indicates pressure on NHS boardsrsquo capacity For example the number of procedures carried out in outpatients has more than doubled since 200809 to 380456 procedures in 201213 There are risks this pressure will increase as demand continues to grow This pressure can only be tackled by some combination of
bull increasing the number of new outpatient appointments available for example by allocating additional staffing and other resources
bull further reducing the number of people attending for follow-up appointments (the ratio of follow-up to new appointments has reduced from 23 in 2004 to 19 in 2013) A new approach is being implemented in hospitals across Scotland to reduce the number of follow-up patients attending orthopaedic clinics (Case study 4 page 25)
bull reducing the number of outpatient referrals by moving to other models of care such as self-management telehealth and telecare
Delays in discharging patients are putting pressure on hospital beds35 Although the overall average (mean) length of stay in hospital has reduced delays in discharging patients who are clinically ready to leave hospital have been increasing over the last five years especially during 201314 They increased from around 101500 bed days over the quarter ending April 2013 to 117800 over the quarter ending April 2014 (Exhibit 6 page 26)25 In 201314 a total of 421157 bed days were occupied by patients who were delayed at an estimated cost to the NHS of pound78 million26
36 Most patients who are affected by delayed discharges are aged 75 and over This reflects their more complex needs and difficulties in organising the community support they need In April 2014
bull there were 738 patients across Scotland whose discharge was delayed compared to 564 in April 2013
Part 1 The NHS in Scotland is facing significant pressures | 25
bull 173 patients were delayed for four weeks or more
bull the most common reason for delays of four weeks or more was waiting for a place in a care home Shorter delays (two weeks or less) were mainly due to waiting for community care assessments27
37 In 2013 and 2014 a number of NHS boards carried out snapshot audits reviewing the healthcare needs of all patients in hospital on one day28 These found that for around 25 per cent of patients there was no clinical reason for them to remain in hospital Reasons for patients remaining in hospital included waiting to be reviewed by a consultant waiting for a place in a care home and waiting for a social work assessment NHS boards are using this information to identify areas for improvement for example focusing on groups of patients at more risk of spending longer in hospital than clinically necessary
38 While the overall results of the latest NHS inpatient experience survey were positive the one aspect that was less positive was leaving hospital29 Fourteen per cent of patients indicated that they had to stay in hospital longer than expected to wait for their care or support services to be organised Two-fifths of patients experienced a delay on the day they were leaving hospital mainly
Case study 4Follow-up care for patients with a fracture has been redesigned
Around 100000 people a year in Scotland have a fracture that does not require surgery In these cases the fracture is left to heal and no follow-up treatment is required Traditionally all patients with a fracture were fitted with a cast and would have to return to an outpatient clinic to have the cast removed
In around 80 per cent of Scottish hospitals a new approach has been introduced for patients with a fracture that does not require surgery Patients are treated in AampE and fitted with a removable cast if possible Patients are provided with information to allow them to self-manage and around 40 per cent do not need to return to hospital for follow-up care The remaining patients are referred to an orthopaedic clinic The orthopaedic team is able to follow up around a fifth of these patients by telephone conversation and the remainder of patients attend an orthopaedic outpatient clinic for follow-up
Glasgow Royal Infirmary (GRI) started using this approach in 2011 and was one of the first hospitals to use it Since it was introduced referrals from AampE to the orthopaedics department have decreased by over 50 per cent and it has reduced travel time for patients GRI has reported that it has improved patient flow in both its AampE and orthopaedics departments It has reduced the number of orthopaedic patients in AampE who wait longer than four hours and freed up orthopaedic consultant time to see new outpatient referrals
Source Audit Scotland based on information provided by the Quality and Efficiency Support Team (QuEST) at the Scottish Government
26 |
Exhibit 6Number of delayed discharges and occupied bed days 2012ndash14The number of bed days occupied by patients who experience a delayed discharge has been steadily increasing
Number of bed days occupied by delayed discharges
Number of delayed discharges
Num
ber
of b
ed d
ays
occu
pied
by
dela
yed
disc
harg
es (0
00s)
Jul2012
Oct2012
Jan2013
Apr2013
Jul2013
Oct2013
Jan2014
Apr2014
140
120
100
80
60
40
20
0
Num
ber
of d
elay
ed d
isch
arge
s
1000
900
800
700
600
500
400
300
200
100
0
Note The number of delayed discharges refers to all patients who experienced a delay of any length It excludes code 9 patients with complex needs
Source ISD Scotland
because they had to wait for medicines with 16 per cent waiting longer than four hours Delays in patients being discharged mean that beds are not available to other patients who need them causing delays and blockages elsewhere in the system NHS boards need to ensure they have detailed information about discharge times and the reasons for delays to effectively manage patient flows
39 Some boards for example NHS Fife NHS Forth Valley and NHS Lanarkshire are co-locating staff from the hospital and community including social work to coordinate planning for patientsrsquo discharge from hospital Staff in these discharge hubs work with ward staff to identify patientsrsquo needs and start planning their discharge as soon as they are admitted to hospital The aim is to minimise any delays and to ensure patients have sufficient support in the community In NHS Forth Valley they also provide advice and guidance to hospital staff and GPs including potential alternatives to admitting people to hospital We included a case study on the integrated discharge hub in NHS Fife in our AampE report
40 Our report on reshaping care for older people highlighted how NHS Tayside and Perth and Kinross Council are working together to
bull redesign systems so that patients can be discharged home from hospital as quickly as possible
bull provide community-based alternatives to hospital and long-term residential care
bull use data to work with GPs to understand how they are using local services and to change how older people receive care and support30
Exhibit 6
Audit Scotland
Exhibit 6
Exhibit 6 background data
Part 1 The NHS in Scotland is facing significant pressures | 27
The NHS puts considerable effort into meeting performance targets 41 The Scottish Government and NHS boards put a great deal of effort into attempting to meet annual waiting time targets The Scottish Government also provided additional funding for NHS boards For example in 201314 the Scottish Government provided NHS boards with at least pound17 million additional funding during the year to support waiting time targets This is similar to the additional funding of at least pound20 million that it provided in 20121331 During 201314 NHS boards also received additional funding of pound9 million to improve emergency and urgent care including reducing waiting times in AampE NHS boards have noted additional workforce costs to provide additional capacity to meet waiting times targets particularly the TTG This level of focus on meeting waiting times targets may not be sustainable when combined with the additional pressures of increasing demands related to demographic changes and the overall health budget starting to decrease in real terms
42 National targets are helpful in targeting areas for improvement in performance For example the focus on waiting time targets has led to a considerable reduction in the length of time that people wait for treatment However it is becoming more difficult for NHS boards to meet these targets fully The extent of the effort required to try to meet them makes it more difficult for NHS boards to focus on long-term planning and moving more care into the community There are risks that too narrow a focus on targets can detract attention from achieving the wider aims
43 The Scottish Government is reviewing the HEAT framework and aims to have updated guidance for boards by November 2014 It should review whether the current financial and performance targets for the NHS are achievable at the same time as implementing the 2020 Vision for health and social care within the tight financial resources available It should consider setting targets for NHS boards that will help them work towards the 2020 Vision for example introducing milestones to measure the extent to which boards are moving towards more preventative and community-based care
There is growing evidence of staff pressures
44 The availability of staff is another important factor in NHS boardsrsquo capacity to provide patient care The number of consultants and nursing and midwifery staff in post has increased slightly each year since 2012 Between March 2013 and March 2014 the number of vacancies for nursing and midwifery staff was stable after increasing the previous year but the number of consultant vacancies increased significantly (Exhibit 7 page 28) This may be related to some extent to the increase in the number of consultant posts and the time lag in filling new posts However the number of posts vacant for six months or more almost doubled from 41 whole-time equivalent (WTE) at 31 March 2013 to 792 WTE in March 2014
45 Of the mainland territorial boards consultant vacancy rates were highest in NHS Dumfries and Galloway (154 per cent) NHS Fife (133 per cent) NHS Forth Valley (102 per cent) and NHS Grampian (99 per cent) With the exception of NHS Dumfries and Galloway these boards experienced difficulty achieving a number of performance targets in 201314 (Exhibit 5)
46 Many NHS boards have reported difficulties filling medical vacancies in some specialties and some geographical areas leading to greater use of locum doctors to maintain services NHS boardsrsquo workforce plans comment on a number of factors that are contributing to these difficulties including
28 |
bull changes in junior doctor training since the introduction of Modernising Medical Careers in 2005 These changes have led to a reduction in the number of junior doctors available and NHS boards needing more middle grade doctors and consultants
bull strong competition among NHS boards for medical staff This can make it more difficult for smaller boards and more rural areas to compete with larger boards which can offer more opportunities such as research and development
bull difficulty recruiting and retaining staff in some specialties with unattractive working patterns such as emergency medicine or where there is a national shortage and greater levels of part-time working such as paediatrics
47 These difficulties have an impact on NHS boardsrsquo ability to provide services and on their financial position For example
bull NHS Highland reported that its financial position in 201314 was negatively affected by spending on locums It anticipates that this will continue to be a cost pressure in 201415 (Case study 1)
bull NHS Orkney required brokerage from the Scottish Government to help cover increased spending on locum doctors and agency nursing staff (Case study 2)
bull NHS Dumfries and Gallowayrsquos spending on locums increased from pound63 million in 201213 to pound76 million in 201314 The board reported that this is due to increased demand and difficulty filling posts
bull NHS Grampian has reported that consultant vacancies in oncology are affecting cancer services and patients are having to receive treatment in other boards It has reported significant difficulty recruiting some groups of
Exhibit 7Consultant nursing and midwifery workforce March 2012 to March 2014The number of vacant consultant posts increased significantly between 2013 and 2014
At 31 March 2012 (wte)
At 31 March 2013 (wte)
At 31 March 2014 (wte)
increase 2012 to 2013
increase 2013 to 2014
Consultant staff in post 44277 45316 46936 23 36
Consultant vacancies number and rate
1673 (36) 2025 (43) 3248 (65) 21 604
Nursing and midwifery staff in post
564673 570366 581727 1 2
Nursing and midwifery vacancies number and rate
10279 (18) 16091 (27) 16375 (27) 565 18
Source ISD Scotland
Part 1 The NHS in Scotland is facing significant pressures | 29
staff including AampE staff due to the buoyant labour market competition for jobs in the local area and a national shortage of staff in certain clinical specialties including oncology
bull NHS Fife has highlighted vacancies for radiologists and difficulties securing locums which have had an impact on waiting times for diagnostic tests
bull NHS Ayrshire and Arran has reported that vacancies across medical grades are a challenge to it providing current services and considering its plans for providing services for the future
48 The NHS spent pound128 million on bank and agency nursing and midwifery staff in 201314 an increase of 15 per cent since 201213 This accounts for 13 per cent of total revenue expenditure in 201314 Bank nurses accounted for 93 per cent of the spending However spending on agency staff increased by 46 per cent to pound93 million This follows a rise of 62 per cent the previous year reversing the trend of falls in spending on agency nurses since 20080932 Agency staff are likely to be more expensive than bank nurses and also pose a greater potential risk to patient safety and the quality of care33
Spending on private sector healthcare reduced in 201314
49 NHS boards use private sector healthcare to provide additional capacity to meet patientsrsquo needs or to meet national targets In December 2013 the Scottish Government issued guidance for NHS boards which states that it expects the vast majority of patients to be treated within the NHS with the private sector used only to deal with short-term capacity issues34
50 Total spending on private sector healthcare by the territorial boards fell by 69 per cent in real terms between 201213 and 201314 from pound803 million to pound759 million Spending on private healthcare represented about 09 per cent of total spending on hospital and community health services in 201314 Spending decreased in eight territorial boards and increased very slightly in three35 It increased considerably in
bull NHS Shetland spending increased by 60 per cent from pound116000 to pound186000
bull NHS Highland spending increased by 40 per cent from pound26 million to pound37 million
bull NHS Lothian spending increased by 12 per cent from pound148 million to pound166 million
Most boards do not consider integrated performance reports
51 The board of directors in NHS boards need to oversee all aspects of performance including
bull patient safety and clinical quality
bull performance against HEAT targets
bull finance
bull feedback and complaints from patients and staff
30 |
52 Each aspect of performance is important in ensuring the NHS board is providing high-quality sustainable care Considering any one aspect in isolation may mean that the board does not have a full understanding of overall performance for example the board may be achieving its HEAT targets but facing increasing financial pressure or waiting time targets may be met for inpatient and day-case treatment while waiting times for outpatients are growing
53 An integrated overview of performance with high-level commentary helps the board to quickly get an overview of performance We found that only three boards receive an integrated report bringing together all aspects of performance (Case study 5)36 A further two consider reports that bring together a range of aspects of performance but they consider financial performance separately37 We have previously recommended that NHS boards should avoid considering one aspect of performance in isolation In our report on the management of NHS waiting lists we highlighted the importance of NHS boards considering and scrutinising performance against waiting time targets alongside information on how they are achieving that performance Non-executive directors need access to a range of information in order to allow them to provide effective challenge38
Case study 5NHS Greater Glasgow and Clyde uses integrated performance reporting
In April 2011 NHS Greater Glasgow and Clyde established a Quality and Performance Committee (QPC) as a subcommittee of the board This replaced the Performance Review Group Health and Clinical Governance Committee and Involving People Committee The main aim of the QPC is to bring together all areas of governance quality and performance under one committee to provide an overview
The QPC considers an integrated quality and performance report The report brings together data and commentary on the boards performance in relation to quality patient safety clinical governance financial monitoring performance monitoring workforce planning and involving peoplepatients It highlights any areas where the board is not meeting targets or on track to meet them The committee also considers more detailed monitoring reports on some aspects of performance including a financial monitoring report
Source NHS Greater Glasgow and Clyde Annual Audit Report 201112 and update from auditor
Part 2 Looking ahead | 31
Part 2Looking ahead
the NHS is facing significant pressures at the same time as needing to make major changes to services
Key messages
1 The overall health budget is planned to reduce by 09 per cent in real terms over the next two years Changes in Scotlandrsquos population mean that demand for health and social care will increase significantly over the next 20 years at the same time as budgets are tightening The NHS will not be able to continue to provide services in the way it currently does given the scale of the changes required It needs to do more to plan for how it will make the changes needed to provide sustainable care for the future
2 Increasing demand is already putting pressure on services NHS boards need to better understand their demand capacity and how patients move through the complex health and social care system so that they can match their capacity with current and future needs They also need to better understand the reasons for delays and blockages in the health and social care system The Scottish Government has started working with four NHS boards to help them improve patient flow
The NHS will continue to face increasing pressures
55 Taken together our audit work has found clear evidence that NHS boards are finding it increasingly difficult to meet their financial and performance targets All the available evidence suggests that these pressures will increase in future
56 The Scottish Governmentrsquos overall health budget (revenue and capital) is planned to decrease by 10 per cent between 201314 and 201415 and to increase by 01 per cent between 201415 and 201516 in real terms Within the overall health budget
bull the revenue budget is planned to increase by 03 per cent between 201314 and 201415 and to increase by 06 per cent between 201415 and 201516 in real terms
bull the capital budget is planned to decrease by 389 per cent between 201314 and 201415 and to decrease by 240 per cent between 201415 and 201516 in real terms (Exhibit 8 page 32)
57 Healthcare inflation in the UK is higher than general inflation which has an impact on the health budget in real terms Over the last 20 years general inflation in the UK averaged just over two per cent a year while health service costs rose by 36 per cent a year39
32 |
Exhibit 8In the next two years the health budget will decrease by 09 per cent in real termsThe larger revenue budget will increase by almost one per cent while the smaller capital budget will decrease by 54 per cent
-5357
-2398
-3892
+031 +064 +095Revenue
Capital
CUMULATIVE
TOTAL
-093-104 +010
1314to
1415
1415to
1516
1314to
14151415
to1516
1314to
1516
Source Scottish Government Draft Budgets 201314 201415 and 201516
58 Longer-term forecasts to 201819 by the Office for Budget Responsibility show a real-terms reduction in total UK public sector expenditure of 07 per cent in both 201617 and 201718 before levels are maintained in 20181940 Reductions in spending at a UK level will affect the level of funding available in Scotland The Scottish Government will need to plan for health spending within an overall reducing budget
Part 2 Looking ahead | 33
Other cost pressures are likely to increase in future years59 There is likely to be an increase in contribution rates to the NHS Superannuation Scheme during 201415 The most recent actuarial funding valuation available for the scheme was at 31 March 2004 A funding valuation was carried out at 31 March 2008 but was suspended by HM Treasury prior to completion A new funding valuation was carried out in 201314 for the scheme as at 31 March 2012 and this will be incorporated in the NHS accounts for 201415 Employer contribution rates are expected to increase as a result of this valuation in order to ensure that contributions are large enough to meet the likely future costs of the pension scheme
60 A number of boards highlighted this as a financial risk in their LDPs NHS boards have assumed and are planning for pensions costs of approximately two per cent of their total pay bill but the extent of the increase is not yet known NHS boards will also face further costs due to changes in pension schemes that end the current arrangements under which members and their employers pay lower National Insurance contributions41 As a result of these changes pension scheme members and their employers will no longer pay reduced NI contributions from 6 April 2016
61 NHS boards have identified other future cost pressures including pay costs spending on drugs and the availability of new treatments Staff pay is the largest single item of expenditure for NHS boards and the Scottish Government has estimated that the pay bill will increase by around pound30 million per year from 201415 (not including additional pension costs)42 NHS boards are working with the Scottish Government to identify how they will fund these cost pressures NHS boards are considering how they can work together to provide services more efficiently for example exploring opportunities to provide more services on a regional basis
Changes in the population are increasing demand62 Demographic and other changes are increasing the pressures Scotlandrsquos population is ageing (Exhibit 9 page 34) Between 2012 and 2037
bull the percentage of the population aged 65 or over is projected to increase from 17 per cent (925751 people) to 25 per cent (1473158 people)
bull the percentage of the population aged 75 or over is projected to increase from eight per cent (418486 people) to 13 per cent (778746 people)
bull the number of people aged 100 years or older is projected to increase by 879 per cent from 792 to 775143
63 Older people are more likely to have long-term health problems that require care and in the absence of good community-based care that will increase the pressure on acute services The number of people aged over 65 attending AampE departments increased by 126 per cent over the past five years from 242677 attendances in 200809 to 273192 in 201213 Older people are more likely to be admitted to hospital from AampE in December 2013 60 per cent of AampE attendances for people aged over 65 resulted in admission to hospital compared with 23 per cent of patients aged under 6544
34 |
64 The number of people with long-term conditions such as diabetes is increasing and the number of long-term conditions that an individual may have increases with age Rates of dementia are also increasing and the number of people with dementia is estimated to double within the next 25 years45 The number of inpatient and day-case episodes for people aged 65 and over where the patient had a diagnosis of dementia increased by nearly 50 per cent between 2009 and 2013 from 21524 to 32205 Older people with dementia generally stay longer in hospital often due to the need for specialist care that delays their discharge Around half of long-stay residents in Scottish care homes have a diagnosis of dementia
Exhibit 9Scotlands population is ageingThe percentage of the population aged 75 and over is set to increase considerably over the next 25 years
65-74 yearsUnder 65 years 75-84 years 85 years and older
83
75
2610
912 5
Population
418486 2012
Estimated population
778746 2037
2012
2037
75 yrs +
86
Population
792 2012
Estimated population
7751 2037
100 yrs +
879
Note Due to rounding the total percentages add up to 101 per cent
Source Projected Population of Scotland (2012-based) National Records of Scotland 2013
Exhibit 9
Audit Scotland
Exhibit 9
Exhibit 9 background data
Part 2 Looking ahead | 35
65 Peoplersquos expectations of healthcare are rising in relation to access to services and treatments and the Scottish Government recognises this as another challenge for the NHS46 For example the main issues in orthopaedics affecting demand in addition to an increasing older population are higher patient expectations and improvements in technology and available procedures A wider range of procedures are now available and surgeons can carry out more complex procedures47
The Scottish Government has set out its long-term strategy for the NHS but boards do not yet have detailed plans in place
66 Pressures will continue to increase for the foreseeable future The Scottish Government recognises this and in 2011 it set out its 2020 Vision an overarching strategy for achieving sustainable quality in the delivery of healthcare services across Scotland in the context of the challenges facing the NHS48 The overall aim is that by 2020 everyone is able to live longer healthier lives at home or in a homely setting It is an ambitious policy that aims to prevent or improve poor health caused by lifestyle factors such as smoking alcohol and lack of exercise and move towards the NHS providing more care in community settings (Exhibit 10 page 36) In May 2013 the Scottish Government set out 12 priority areas for action in the form of a Route Map to the 2020 Vision
67 The NHS has already made improvements in health outcomes in the Scottish population The 2020 Vision has the potential to make further improvements in health outcomes and the quality of health and social care But achieving the vision will require major changes in the way that services are delivered and a significant shift of resources into more preventative and community-based services We have highlighted in previous reports that there is a lack of evidence of progress in moving resources and more care into the community49 In 200304 42 per cent of NHS spending for all age groups was on community services by 201112 this had increased to just 44 per cent and in 201213 it reduced to 43 per cent50 Between 200203 and 200910 council spending in real terms on social care services for older people increased by 37 per cent from pound098 billion to pound135 billion By 201213 this had fallen to pound129 billion a four per cent reduction from 20091051 The reasons for this lack of progress are complex but achieving the transformation required is made more difficult by the increasing pressures on acute care and by the continuing focus on short-term planning
68 From April 2016 health and social care services in Scotland will be integrated The Public Bodies (Joint Working) (Scotland) Act 2014 requires NHS boards and councils to establish new health and social care partnerships Under these arrangements NHS boards and councils will be required as a minimum to combine their budgets for adult social care adult primary healthcare and aspects of adult secondary healthcare It provides a good opportunity for NHS boards with their council partners to redirect resources and move towards more community-based and preventative care It will be challenging for NHS boards to make the scale of changes required over the next few years but critical if they are to meet the 2020 Vision Outcomes are being developed for integrated health and social care along with integration indicators for the new integration joint boards to report performance against
69 We have previously recommended that NHS boards need to increase their focus on longer-term financial planning Without this there is a risk that they will continue to take a short-term approach to managing the pressures they face at
36 |
Exhibit 10Aims of the Scottish Governments 2020 Vision for health and social careThe Scottish Government has set out an ambitious policy that will require a considerable move from care in settings like hospitals and care homes to more community-based and preventative care
Our vision is that by 2020 everyone is able to live longer healthier lives at home or in a homely setting
We will have a healthcare system where we have integrated health and social care a focus on prevention anticipation and supported self-management
When hospital treatment is required and cannot be provided in a community setting day-case treatment will be the norm
Whatever the setting care will be provided to the highest standards of quality and safety with the person at the centre of all decisions
There will be a focus on ensuring that people get back into their home or community environment as soon as appropriate with minimal risk of re-admission
Source A Route Map to the 2020 Vision for Health and Social Care Scottish Government May 2013
the expense of better options over the longer term NHS boards need to plan now for making considerable changes to the way they deliver services in the longer term to ensure they can deliver sustainable good-quality care to meet future increasing needs They need to set out how they will reshape services and provide high-quality care with the available funding staff and other resources Their longer-term financial planning should consider all the resources they need to provide integrated health and social care services to continue to meet future needs (Exhibit 11 page 37)
70 LDPs set out how each board plans to deliver the priorities for the NHS in Scotland They also form the basis for the Cabinet Secretaryrsquos annual reviews of each board In the past LDPs have focused predominantly on financial planning and meeting HEAT targets for the coming year rather than demonstrating how boards are planning to meet longer-term aims For 201415 the Scottish Government requires each board to include an improvement and co-production plan in their LDP outlining the actions the board is taking to deliver the 2020 Vision (Exhibit 12 page 38) We found that the 201415 LDPs include detail about what boards are currently doing but provide little information about how boards will deliver the 2020 Vision in a sustainable way supported by financial and workforce plans We would expect there to be more detail in the 201516 LDPs about how boards will work with their partners to shift more services into the community as they move towards health and social care integration
Planning needs to be underpinned by a better understanding of demand capacity and patient flows
71 Health and social care services form a complex system in which patient flows need to be understood and managed in order to have the right resources available when and where they are needed to meet demand These resources include the
Part 2 Looking ahead | 37
Exhibit 11A number of elements of long-term planning should underpin financial plansLong-term financial planning needs to set out how NHS boards will make the changes needed to meet future needs
Elements of longer-term planning
Detailed planning required
Future demand for health and social care
Model projected demand for care by taking into account the
bull numbers of patientsservice users expected to need services
bull demographic profile of the area
bull complexity of care that people will need
Compare this with current demand and short-term projections
Models of care Identify the models of care and shared objectives for the new health and social care partnerships required to meet the 2020 Vision and projected future demand for the following
bull hospitals bull community-based care bull home-based care
bull care in the community supported by technology such as telehealth and telecare
Workforce requirements
Identify the staff needed to provide these models of care taking into account
bull numbers and type of roles bull skills mix bull training bull location
Compare this with the current workforce make-up and location and short-term projections Workforce planning needs to be done in collaboration with the Scottish Government NHS Education for Scotland and training providers such as colleges
Location of care Identify the fixed assets needed to provide models of care in different locations including the following
bull buildings (hospitals and community) including the condition of existing buildings and costs of ongoing maintenance and any new buildings that are required
bull information technology including shared access to NHS and social care systems
bull broadband
bull transport for patients service users and staff
Compare this with current assets and short-term projections Plans need to ensure the infrastructure is in place to support moving more care into the community while ensuring hospitals are fit for purpose
Costs and funding
Financial planning to meet future needs by estimating the cost of
bull providing new models of care and for increased demand
bull providing more care in the community and in patientsusers homes
bull maintaining hospital services in line with future models of care
Use scenario planning with potential financial projections to ensure models of care are affordable and to identify potential funding gaps Establish plans for redirecting funding from hospitals to community to meet future needs while maintaining services This is likely to require double-running costs
Source Audit Scotland
38 |
Exhibit 12LDPs now include improvement and co-production plansNHS boards are required to set out their priority actions for delivering the 2020 Vision
Key elements of the plans are that they should
bull be transformational in nature and underpinned by workforce and finance planning
bull provide assurance that the five priorities for action set out in Everyone Matters 2020 Workforce Vision Implementation Framework (healthy organisational culture sustainable workforce capable workforce integrated workforce effective leadership and management) will be taken forward in a planned way
bull set out the priority actions the NHS board is taking across patient safety programmes of work the plans for spread and sustainability and the impact they are having on patient care
bull include the approach being taken to ensure that feedback on compliments concerns complaints and comments from patients their families and carers is being actively sought and used to improve services
bull set out actions and planned levels of improvement for unscheduled care across the NHS such as increased anticipatory care and support to help people manage their conditions and medicines including how hospitals GPs community teams the Scottish Ambulance Service and NHS 24 will work together
bull set out the actions the NHS board is progressing with its partners to prepare for health and social care integration
Source NHSScotland 2020 Local Delivery Plan Guidance Scottish Government November 2013
number of hospital beds outpatient clinics community services and trained staff The NHS needs a better understanding of its current capacity current and future demand and patient flows in order to inform the major changes to services that will be required to ensure they are sustainable and meet the long-term needs of the population
72 We analysed recent trends in healthcare activity population statistics and rates of conditions such as diabetes and dementia (Appendix 1 summarises our methodology) We looked at data for the previous five years where this is available and comparable in order to understand recent trends and identify where pressures are building This analysis identified some of the main pressures and highlights the complex and interrelated nature of the healthcare system The degree to which pressures impact on NHS boards hospitals and specialties varies but include
bull an ageing population and an increase in the number of older people with complex care needs
Part 2 Looking ahead | 39
bull more people living with long-term conditions and multiple conditions
bull more people seeking emergency and urgent care
bull more people being treated in outpatient and day-case settings
bull making sure hospital beds and staff are available at the time they are needed
bull more people experiencing a delay in their discharge from hospital
73 We have identified a number of lsquopinch pointsrsquo in the system (Exhibit 13 page 40) These particularly relate to
bull Hospital beds being available at the time when patients need them There has been an increase in the number of patients experiencing delays in being admitted from AampE and patients are not always cared for in the appropriate ward for their needs which has an impact on the quality of care they receive (known as boarding) These pinch points are related to how hospitals manage their beds and arrangements for discharging patients
bull More delayed discharges The number of patients delayed in hospital while waiting for services to be available in the community is increasing This has an impact on the quality of care and outcomes for the patients and it also means that beds are not available for other patients adding to the pressures on beds (paragraphs 35 and 36)
bull Increasing demand for outpatient appointments Demographic changes along with improvements in care and more procedures carried out in outpatient clinics rather than on an inpatient basis have increased demand for outpatient appointments Demand is increasing at a faster rate than the number of people seen in clinics meaning that waiting lists are growing and more people are waiting longer (paragraphs 33 and 34)
Inpatient care is changing and becoming more complex74 In recent years there has been a reduction in elective (planned) inpatient care as more planned care shifts to outpatients and day cases The number of patients admitted as emergencies for inpatient care has remained steady and the complexity of these cases has increased NHS boards need to ensure they have the right number of staffed beds available at the right time to deal with this changing demand They also need to plan for changes to services in the longer term including shifting more care into community settings
75 There has been a reduction in the number of hospital beds across Scotland Between 200809 and 201213 the average number of available staffed beds in acute specialties reduced by seven per cent (1144 beds) the number of acute surgical beds fell by 11 per cent (596 beds) and the number of acute medical beds fell by five per cent (313 beds) The main reason for this reduction is the growth in day surgery as more patients are treated as day cases and outpatients for example some eye procedures and diagnostic tests Between 200809 and 201213 the number of procedures carried out on an inpatient basis decreased by 18 per cent (418000 procedures in 201213)
40 |
Exhibit 13The NHS is facing increasing pressures from an ageing population and increasing demandThe health and social care system is complex
Notes 1 Community care data Care home and care at home ndash Censuses (March 2013 and March 2008) NHS 24 ndash NHS 24rsquos performance data
(201314 and 200809) Primary care contacts ndash ISD Scotland (201213 and 200809)2 AampE data Number of attendances and waits ndash ISD Scotland and Audit Scotland AampE data(201213 and 200809)3 Hospital data Inpatient daycase and outpatients ndash ISD Scotland (201213 and 200809) Waiting lists and number waiting over 12 weeks
ndash ISD Scotland (quarter ended March 2014 and March 2010) Occupied bed days for delayed dischargesndash ISD Scotland (201314 and 201213) The data is not available before 201213
4 Patients can also be admitted to hospital as emergencies without going through AampESource Audit Scotland
TELEHEALTH
TELECARE
+346 Wait for
a bed(37946)
bull Ageing populationbull Increase in complex needsbull Increase in multiple complex cases
DAY CASE
455800attendances+6
489898procedures+8
OUTPATIENT
47 millionattendances0
15 millionnew patient attendances
+2
380456procedures+108
+9 Delayed
dischargebed days
Self referral
CARE HOME
-2 36578residents
-10 1282homes
+29 1645 short-stayrespite residents
Preventative care self management treatment and care in the community
CARE AT HOME
Social care
-1160950people receiving home care
NHS 24
-9 14 millioncontacts
ACCIDENT amp EMERGENCY
16 millionattendances+3
HOSPITALCARE
OVERNIGHT INPATIENTS
720262patients admitted-3
417987procedures-18
23728avg staffed beds-11
Demand
Time delays
Change inlast 5 years
XX
KEY
+8
admitted to hospital
from AampE (361121)
PRIMARY CARE TEAMGP amp practice nurse
Community nursing AHPPharmacy Ophthalmology Mental health team
242 million contacts+4
+189 waitedgt4hrs
(104000) Plannedcare
421157 occupied bed days
(changebetweenMar 2010
amp Mar 2014)
(changebetweenMar 2010
amp Mar 2014)
+4200
number waiting
gt12 weeks (157 to 6754)
bull The number of older people attending AampE has risen from 242677 patients aged over 65 in 200809 to 273192 patients aged over 65 in 201213 (126 increase)
bull In December 201360 per cent of AampE attendances for people aged over 65 resulted in admission to hospital compared with 23 per cent of patients aged under 65
bull Between 200809 and 201213 there was an 11 rise in the number of bed days occupied by patients aged 80 and over who had three or more emergency admissions during the year
+376
number waiting
gt12 weeks (162 to 771)
+34
number onwaiting list (252009)
-7
number onwaiting list
(50898)
Older people
(201314)
(change betweenMar 2013 amp Mar 2014)
Part 2 Looking ahead | 41
76 The average (mean) length of stay for inpatients has also been reducing Ensuring that patients stay in hospital for no longer than necessary is important since it helps them stay active remain independent and reduces the chance of acquiring a healthcare-associated infection Between 200809 and 201213 the average length of stay fell from 73 days to 65 days for elective (planned) inpatients and from 38 to 31 days for emergency inpatients
77 There is evidence that the complexity of care for patients admitted as emergencies is increasing There has been a slight growth in the number of days that hospital beds are occupied by emergency admissions for people admitted three or more times during one year (one per cent between 200809 and 201213) This is more noticeable among older people (aged 80 and over) who are likely to have more long-term conditions and complex needs Between 200809 and 201213 there was an 11 per cent rise in the number of bed days occupied by patients in this age group who had three or more admissions during the year The increase in the older population suggests that this trend will continue unless there are significant shifts to more anticipatory and preventative care in the community
NHS boards need to improve bed planning and management78 There are a number of indicators of problems with bed planning and management The number of people delayed in AampE while waiting for a hospital bed has increased fourfold since 200809 This is the most common reason for patients waiting more than four hours in AampE The reasons for this are complex and linked to beds not being available at the time when they are needed The day and time that patients are discharged from wards affect the flow of patients throughout the hospital Attendances at AampE departments are highest on Mondays and Tuesdays Delays in AampE due to people waiting for a bed in hospital are more likely on these days since fewer inpatients are discharged at weekends Discharges from hospital generally take place in the afternoon Across Scotland lsquowait for a bedrsquo delays for AampE patients are highest at 6pm The Scottish Government has announced plans to provide more services at weekends and in the evenings to improve the flow of patients and reduce delays Any knock-on effects in primary and social care should be considered as part of these plans In our recent report on AampE performance we highlighted the work that NHS Tayside is doing to improve the quality of care for AampE patients by looking at patient flow (Case study 6 page 42)
79 Boarding is another indicator that a hospital is not organising its capacity to match demand This can happen when there are not enough beds available in a particular specialty when patients need them for example when new patients are admitted as emergencies Instead patients are admitted or transferred to a ward of a different specialty Research has shown that this practice may mean that less specialist care is provided since staff without the appropriate skills are looking after patients Boarding can also significantly increase patientsrsquo length of stay and contribute to other complications resulting from delayed assessment and treatment including developing blood clots and healthcare-associated infections52
80 Boarding used to be more common in winter when demand traditionally increases due to seasonal infections Research by the Royal College of Physicians of Edinburgh (RCPE) suggests that it is becoming an all-year problem In an RCPE survey conducted in May 2012 80 per cent of respondents reported that boarding now happens all year round in Scottish hospitals and 71 per cent said that boarding levels in Scotland are high and increasing The RCPE and the
42 |
Case study 6Improving patient flow in AampE in Ninewells Hospital
Our AampE report identified a number of factors that have helped Ninewells Hospital in NHS Tayside improve the way that patients move through the healthcare system and meet the four-hour waiting time target for AampE These include
bull having senior clinical decision-makers available at all times which means that patients get the right type of care quickly
bull starting the process of planning for patients to be admitted from AampE early to avoid delays in patients waiting for a bed
bull a policy that allows GPs to refer emergency patients directly to wards rather than through AampE first
bull a policy of signposting patients attending AampE to other services such as their GP where appropriate
Source Accident and Emergency performance update Audit Scotland May 2014 (Case study 1 pages 35-36)
Scottish Government are examining the extent of boarding in Scottish hospitals the effect it has on patients and ways to reduce it Results from this work should be available in late 2014 or early 2015
81 The number of emergency admissions over a period of time is reasonably predictable based on previous activity levels On a daily and weekly basis elective admissions can be much more variable than emergency admissions Exhibit 14 (page 43) provides an example of the pattern of elective and emergency admissions to General Surgery on a daily basis in one of Scotlandrsquos district general hospitals and on a weekly basis in another hospital
82 NHS boards need to understand the differing patterns of emergency and elective admissions and actively plan and manage these two flows in a coordinated way Although the number of emergency admissions is reasonably predictable the time of day at which patients arrive at hospital is less so Managing these two flows together means more than ensuring average capacity meets average demand NHS boards also need to ensure that staffing levels are flexible enough to cope with varying demand and that sufficient capacity is available at the right time This means having staff who are trained and equipped to treat increasing numbers of older people with multiple conditions and complex needs
83 A lot of variation in elective admissions can be due to NHS boards not having sufficient capacity to treat both elective and emergency admissions at the time that patients present This includes the availability of beds in appropriate wards sufficient staff with the necessary skills equipment and access to operating theatres This can mean having to cancel planned admissions and rearrange for patients to attend at a later date However data on the overall proportion of inpatient cases that are cancelled has not been available nationally since October 2012 This is due to changes to NHS boardsrsquo electronic systems for managing waiting lists following the introduction of the TTG In September 2012
Part 2 Looking ahead | 43
Exhibit 14Variability in elective and emergency admissions to hospital 201314Elective admission patterns can be more variable than emergency admissions both from day to day (Hospital A) and from week to week (Hospital B)
69 per cent of inpatient and day-case appointments were cancelled across Scotland We have previously highlighted that NHS boards need to ensure they are monitoring this locally to understand any problems with capacity and inform how they manage demand53
84 The Health Foundation worked with NHS trusts in England to look at the relationship between capacity and demand This was based on the premise that the mismatch between the timing of capacity such as when staff are available and when patients present to a service contributes more to delays and inefficiencies than overall levels of demand or resources Key findings from this work were that using systems improvement methods such as detailed data
44 |
analysis and bringing together stakeholders and patients across the hospital system to develop an informed understanding of how care pathways really work can improve patient flow patient safety and make significant cost-savings54
85 The Scottish Government is working with boards over the next year to help them manage beds better in the short term including developing a bed-planning toolkit This will also help them to plan for the number and type of beds required in the longer term reflecting the new models of care that will be needed The toolkit will be piloted in 2015 and include scenario planning based on assumptions of demand admission rates and length of stay taking into account demographic patterns and more care being provided in the community Extensive work has also started in 2014 looking at patient flow in boards and the Scottish Government is leading an Outpatients Primary and Community Care Programme that aims to help NHS boards move more care from hospitals into the community and peoplersquos homes
The Scottish Government is working with NHS boards to improve patient flow
86 As well as having sufficient capacity to deal with demand NHS boards need to make sure that the flow of patients through the hospital and back into the community is as efficient as possible The Scottish Governmentrsquos Quality and Efficiency Support Team (QuEST) is working with four NHS boards to pilot an approach to improve patient flow (NHS Forth Valley NHS Borders NHS Greater Glasgow and Clyde and NHS Tayside) drawing on evidence from the Institute of Healthcare Optimisation in America This is a significant piece of work looking at individual hospitals within each board area as a whole system to understand how patients flow through the system and the factors that can influence this NHS Forth Valley started testing this approach in 2014 and the lessons learned will be shared with other boards as it is rolled out over the next three years The Scottish Government will evaluate the pilot as it progresses and also plans to commission an external evaluation
87 To help improve patient flow and avoid delays in patients getting the appropriate care or being discharged from hospital the Scottish Government also plans to provide more services at weekends and out of hours This includes hospital physiotherapy and pharmacy services An expert group met for the first time in April 2014 The Scottish Government has said there will be no additional funding for this initiative which will require staff to be available at additional times instead NHS boards will be expected to make better use of existing resources
88 Telehealth and telecare offer the potential to care for more people at home or closer to home supported by technology This includes things like equipment for people to monitor their own health at home with their results reviewed by a clinician remotely and alarms and sensors to help people to stay at home more independently These innovations support the 2020 Vision of providing care closer to home potentially improving outcomes for users and avoiding people needing more intensive care in the community or in hospital55 In 2012 the Scottish Government set out its aim that telehealth and telecare will be provided for an additional 300000 people by March 2015 as a milestone towards achieving the 2020 Vision56 It is focusing on rolling out a number of telehealth and telecare projects at a larger scale than the previous smaller pilots Both the Scottish Government and the European Union have provided funding for telehealth and telecare projects
Endnotes | 45
Endnotes
1 The total budget for the Scottish Governmentrsquos Health and Wellbeing Portfolio includes the budgets for health sport and equalities
2 2020 Vision ndash Strategic Narrative Scottish Government September 2011
3 In this report we refer to NHS National Services Scotland the Mental Welfare Commission and Healthcare Improvement Scotland as special health boards
4 Three special boards revenue budgets increased in 201314 National Waiting Times Centre (114 per cent) Scottish Ambulance Service (01 per cent) and NHS 24 (05 per cent)
5 The revenue budget is known as the Revenue Resource Limit (RRL) and the capital budget is known as the Capital Resource Limit (CRL)
6 NHS financial performance 201213 (PDF) Audit Scotland October 2013
7 Response from the Scottish Government to the Public Audit Committee dated 1 August 2014
8 These reports were prepared under Section 22 of the Public Finance and Accountability (Scotland) Act 2000 and are published on Audit Scotlandrsquos website
9 Recurring savings are savings that once achieved recur year-on-year from that date for example savings on staff costs as a result of streamlining services Non-recurring savings only happen once for example not filling a vacancy on a temporary basis
10 NHS Ayrshire and Arran Borders Dumfries and Galloway Highland Lanarkshire Orkney Shetland National Waiting Times Board NHS 24 NHS Education for Scotland and State Hospital
11 Annual State of NHSScotland Assets and Facilities Report for 2012 Scottish Government December 2012
12 Annual State of NHSScotland Assets and Facilities Report for 2013 Scottish Government December 2013
13 The Scottish Government has defined high-risk backlog maintenance as work that must be addressed as an urgent priority Significant risk is the next highest priority category of backlog maintenance and requires expenditure in the short term ndash Correspondence from the Scottish Government to the Public Audit Committee dated 16 January 2013
14 Backlog maintenance reduced in (level of backlog at 2013 in brackets) NHS Ayrshire and Arran (pound77m) Dumfries and Galloway (pound51m) Forth Valley (pound13m) Grampian (pound159m) Greater Glasgow and Clyde (pound167m) Lanarkshire (pound57m) Lothian (pound96m) Orkney (pound95m) Shetland (pound38m) Tayside (pound50m) National Waiting Times Centre (pound26m) NHS National Services Scotland (pound26m) NHS 24 (pound0m) and State Hospital (pound03m) It increased in NHS Borders (pound65m) Fife (pound70m) Highland (pound83m) Western Isles (pound32m) NHS Education for Scotland (pound03m) NHS Health Scotland (pound01m) and the Scottish Ambulance Service (pound33m) NHS Highland has reported that one reason for its backlog maintenance increasing is that a number of properties transferred from the council to the board in 2012 as part of health and social care integration
15 Annual State of NHSScotland Assets and Facilities Report for 2013 Scottish Government December 2013
16 Outline Business Case for a Care Village in Stirling (A Health amp Social Care Partnership Venture) NHS Forth Valley Stirling Council and Forth Valley College 2 December 2013
17 The Healthcare Quality Strategy for NHSScotland Scottish Government May 2010
18 Scottish National Point Prevalence Survey of Healthcare Associated Infection and Antimicrobial Prescribing 2011 Health Protection Scotland April 2012 Rates of individual HAIs (MRSA and Clostridium difficile) have continued to decrease (Scotland Performs Scottish Government website)
19 Heart disease statistics update ISD Scotland January 2014
20 Scottish Inpatient Patient Experience Survey 2014 Scottish Government August 2014
22 Depending on the target this may be performance for the month ending March 2014 or for the quarter ending March 2014 The notes in Exhibit 5 give details for each target
46 |
23 ISD Waiting Times Warehouse data August 2014
24 The National Waiting Times Board a special NHS board met the target for three months in 201314
25 These figures are for standard delayed discharges They exclude delayed discharges recorded under lsquocode 9rsquo for patients with complex needs This includes patients delayed due to waiting for a place in a high-level needs specialist facility where no facilities exist or where an adult may lack capacity under adults with incapacity legislation
26 ISD calculates the cost of days lost to delayed discharges using a cost per day that excludes costs not incurred by delayed patients such as costs related to admissions and allows for the reduced medical and other clinical care that is required for delayed patients This average cost is around pound185 per day
27 These figures are for standard delayed discharges
28 These are called Day of Care Surveys
29 Scottish Inpatient Patient Experience Survey 2014 Volume 1 National Results Scottish Government August 2014
30 Reshaping care for older people (PDF) Audit Scotland February 2014 (Case study 2 page 30)
31 Scottish Government allocation letters to NHS boards 201314
32 NHS financial performance 201213 (PDF) Audit Scotland October 2013
33 Using locum doctors in hospitals (PDF) Audit Scotland June 2010
34 Additional 2020 Local Delivery Plan Guidance Scottish Government December 2013
35 Spending increased slightly in NHS Ayrshire and Arran (15 per cent) NHS Tayside (07 per cent) and NHS Western Isles (13 per cent)
36 NHS Forth Valley NHS Greater Glasgow and Clyde and NHS Tayside
37 NHS Western Isles and NHS 24
38 Management of patients on NHS waiting lists (PDF) Audit Scotland February 2013
39 Why is health care inflation greater than general inflation Charlesworth A Journal of Health Services Research and Policy June 2014
40 Economic and Fiscal Outlook ndash March 2014 Office for Budget Responsibility March 2014
41 Under the current state pension arrangements members of the NHS Superannuation Scheme pay a reduced rate of National Insurance (NI) Their employers the NHS boards also contribute reduced NI payments on their behalf This is because it is assumed that the scheme members have opted not to contribute to or claim the additional state pension (an additional element paid on top of the basic state pension) Reforms mean the additional state pension will no longer exist and everyone will receive a flat rate basic state pension
42 Scottish Government budget 201415 ndash Performance evaluation material for Parliamentary Committees Scottish Government September 2013
43 Projected Population of Scotland (2012-based) National Records of Scotland 2013
44 Accident and Emergency performance update (PDF) Audit Scotland May 2014
45 Scotlandrsquos National Dementia Strategy Scottish Government 2010
46 The Healthcare Quality Strategy for NHSScotland Scottish Government May 2010
47 Review of orthopaedic services (PDF) Audit Scotland March 2010
48 2020 Vision ndash Strategic Narrative Scottish Government September 2011
49 Reshaping care for older people (PDF) Audit Scotland February 2014 Review of Community Health Partnerships (PDF) Audit Scotland June 2011 Overview of the NHS in Scotlandrsquos performance 200809 (PDF) Audit Scotland December 2009 Financial overview of the NHS in Scotland 200708 (PDF) Audit Scotland December 2008
50 Audit Scotland analysis of NHS Costs Book data Spending on community family health services and resource transfer as stated in the costs book has been counted as being spent in the community
51 Figures in real terms 201213 prices Audit Scotland analysis of Local Financial Return statistics 200203 ndash 201213
52 Royal College of Physicians of Edinburgh press release June 2012
53 Management of patients on NHS waiting lists audit update (PDF) Audit Scotland December 2013
54 Improving patient flow How two trusts focused on flow to improve the quality of care and use available capacity effectively The Health Foundation April 2013
55 A review of telehealth in Scotland (PDF) Audit Scotland October 2011
56 A National Telehealth and Telecare Delivery Plan for Scotland to 2015 Scottish Government 2012
Appendix 1 Audit methodology | 47
Appendix 1Audit methodology
Methodology for analysing demand capacity and patient flow
To get a better understanding of some of the pressures on NHS services we carried out data analysis looking at
bull the demand for healthcare services
bull the capacity of the NHS to provide services
bull the flow of patients through the healthcare system
This is the first stage of this work and we have presented some high-level findings throughout the report We will be carrying out further analysis looking in more detail at hospital and specialty level data and daily activity We will publish a briefing paper on this analysis in early 2015
For this report we looked at the NHS as a whole system We tried to identify some of the main pressures facing NHS boards and how a pressure in one part of the system can affect another part of the system We have summarised these pressures in Exhibit 13 (page 40) Throughout the report we explain some of these in more detail and how this affects patients and services
In addition to drawing on information from our previous reports we analysed a range of published data and also requested some bespoke analysis from ISD Scotland This includes the following data
bull ISD Scotland
ndash acute hospital inpatient day-case and outpatient activity (admissions discharges average length of stay multiple emergency admissions average number of staffed beds bed occupancy rates)
ndash number of procedures carried out in hospitals
ndash waiting times for inpatient and day-case treatment and outpatient clinics
ndash hospital workforce numbers and vacancies
ndash number of general practice contacts with GPs and practice nurses
ndash Quality and Outcomes Framework (QOF) prevalence rates for a number of health conditions
ndash number of delayed discharges and occupied bed days
ndash care home census
bull Scottish Government community healthcare assessments data
bull National Records of Scotland population statistics
bull Alzheimer Scotland information
NHS in Scotland 201314This report is available in PDF and RTF formats along with a podcast summary at wwwaudit-scotlandgovuk
If you require this publication in an alternative format andor language please contact us to discuss your needs 0131 625 1500 or infoaudit-scotlandgovuk
For the latest news reports and updates follow us on Twitter or subscribe to our email delivery service
AuditScotland
Subscribe to updates
ISBN 978 1 909705 49 4 AGS20146
Audit Scotland 110 George Street Edinburgh EH2 4LHT 0131 625 1500 E infoaudit-scotlandgovuk wwwaudit-scotlandgovuk
This publication is printed on 100 recycled uncoated paper
Key facts
Summary
Key messages
Recommendations
About the audit
Part 1 The NHS in Scotland is facing significant pressures
Key messages
NHS budgets are under pressure
Exhibit 1
All NHS boards met their financial targets in 201314 but some are facing increasing difficulty in achieving them
Exhibit 2
Case study 1
Case study 2
Case study 3
Five boards continue to rely on high levels of non-recurring savings
Exhibit 3
NHS boards are making less progress than expected on reducing backlog maintenance
The annual financial target for capital spending makes it difficult to plan longer-term projects
Exhibit 4
There have been improvements in the quality of healthcare
Performance against waiting time targets is showing increasing signs of pressure
Exhibit 5
Case study 4
Exhibit 6
There is growing evidence of staff pressures
Exhibit 7
Spending on private sector healthcare reduced in 201314
Most boards do not consider integrated performance reports
Case study 5
Part 2 Looking ahead
Key messages
The NHS will continue to face increasing pressures
Exhibit 8
Exhibit 9
The Scottish Government has set out its long-term strategy for the NHS but boards do not yet have detailed plans in place
Exhibit 10
Planning needs to be underpinned by a better understanding of demand capacity and patient flows
Exhibit 11
Exhibit 12
Exhibit 13
Case study 6
Exhibit 14
The Scottish Government is working with NHS boards to improve patient flow
Endnotes
Appendix 1 Audit methodology
NHS in Scotland 201314
Exhibit 9
Scotlands population is ageing
2012
2037
Population
Percentage of population
Estimated population
Percentage of estimated population
Under 65 years
4387849
83
4307213
75
65-74 years
507265
10
694412
12
75-84 years
309244
6
504249
9
85 years and older
109242
2
274497
5
Note Due to rounding the total percentages add up to 101 per cent
Source Projected Population of Scotland (2012-based) National Records of Scotland 2013
NHS in Scotland 201314
Exhibit 6
Number of delayed discharges and occupied bed days 2012-2014
Number of bed days occupied by delayed discharges
Number of delayed discharges
July 2012
90425
778
October 2012
95527
835
January 2013
99198
711
April 2013
101534
621
July 2013
96448
698
October 2013
99815
781
January 2014
107076
908
April 2104
117818
791
Note The number of delayed discharges refers to all patients who experienced a delay of any length It excludes code 9 patients with complex needs
Source ISD Scotland
NHS in Scotland 201314
Exhibit 3
Recurring and non-recurring savings
Territorial boards
Percentage recurring savings
Percentage non-recurring savings
201213
NHS Highland
45
55
201314
38
62
201213
NHS Orkney
69
31
201314
41
59
201213
NHS Borders
65
35
201314
48
52
201213
NHS Tayside
44
56
201314
50
50
201213
NHS Shetland
80
20
201314
52
48
201213
NHS Lanarkshire
91
9
201314
61
39
201213
NHS Ayrshire and Arran
95
5
201314
67
33
201213
NHS Fife
53
47
201314
69
31
201213
NHS Western Isles
71
29
201314
73
27
201213
NHS Lothian
70
30
201314
85
15
201213
NHS Dumfries and Galloway
96
4
201314
94
6
201213
NHS Grampian
87
13
201314
97
3
201213
NHS Forth Valley
78
22
201314
100
0
201213
NHS Greater Glasgow and Clyde
100
0
201314
100
0
Special boards
Percentage recurring savings
Percentage non-recurring savings
201213
The State Hospital
73
27
201314
59
41
201213
National Waiting Times Centre
87
13
201314
69
31
201213
Healthcare Improvement Scotland
83
17
201314
83
17
201213
NHS Education for Scotland
86
14
201314
84
16
201213
NHS 24
100
0
201314
93
7
201213
Scottish Ambulance Service
96
4
201314
98
2
201213
NHS Health Scotland
100
0
201314
100
0
201213
NHS National Services Scotland
100
0
201314
100
0
Source NHS boards financial performance returns March 2014 NHS Orkney updated its savings information in July 2014
NHS in Scotland 201314
Exhibit 3
Recurring and non-recurring savings
Territorial boards
Percentage recurring savings
Percentage non-recurring savings
201213
NHS Highland
45
55
201314
38
62
201213
NHS Orkney
69
31
201314
41
59
201213
NHS Borders
65
35
201314
48
52
201213
NHS Tayside
44
56
201314
50
50
201213
NHS Shetland
80
20
201314
52
48
201213
NHS Lanarkshire
91
9
201314
61
39
201213
NHS Ayrshire and Arran
95
5
201314
67
33
201213
NHS Fife
53
47
201314
69
31
201213
NHS Western Isles
71
29
201314
73
27
201213
NHS Lothian
70
30
201314
85
15
201213
NHS Dumfries and Galloway
96
4
201314
94
6
201213
NHS Grampian
87
13
201314
97
3
201213
NHS Forth Valley
78
22
201314
100
0
201213
NHS Greater Glasgow and Clyde
100
0
201314
100
0
Special boards
Percentage recurring savings
Percentage non-recurring savings
201213
The State Hospital
73
27
201314
59
41
201213
National Waiting Times Centre
87
13
201314
69
31
201213
Healthcare Improvement Scotland
83
17
201314
83
17
201213
NHS Education for Scotland
86
14
201314
84
16
201213
NHS 24
100
0
201314
93
7
201213
Scottish Ambulance Service
96
4
201314
98
2
201213
NHS Health Scotland
100
0
201314
100
0
201213
NHS National Services Scotland
100
0
201314
100
0
Source NHS boards financial performance returns March 2014 NHS Orkney updated its savings information in July 2014
NHS in Scotland 201314
Exhibit 3
Recurring and non-recurring savings
Territorial boards
Percentage recurring savings
Percentage non-recurring savings
201213
NHS Highland
45
55
201314
38
62
201213
NHS Orkney
69
31
201314
41
59
201213
NHS Borders
65
35
201314
48
52
201213
NHS Tayside
44
56
201314
50
50
201213
NHS Shetland
80
20
201314
52
48
201213
NHS Lanarkshire
91
9
201314
61
39
201213
NHS Ayrshire and Arran
95
5
201314
67
33
201213
NHS Fife
53
47
201314
69
31
201213
NHS Western Isles
71
29
201314
73
27
201213
NHS Lothian
70
30
201314
85
15
201213
NHS Dumfries and Galloway
96
4
201314
94
6
201213
NHS Grampian
87
13
201314
97
3
201213
NHS Forth Valley
78
22
201314
100
0
201213
NHS Greater Glasgow and Clyde
100
0
201314
100
0
Special boards
Percentage recurring savings
Percentage non-recurring savings
201213
The State Hospital
73
27
201314
59
41
201213
National Waiting Times Centre
87
13
201314
69
31
201213
Healthcare Improvement Scotland
83
17
201314
83
17
201213
NHS Education for Scotland
86
14
201314
84
16
201213
NHS 24
100
0
201314
93
7
201213
Scottish Ambulance Service
96
4
201314
98
2
201213
NHS Health Scotland
100
0
201314
100
0
201213
NHS National Services Scotland
100
0
201314
100
0
Source NHS boards financial performance returns March 2014 NHS Orkney updated its savings information in July 2014
NHS in Scotland 201314
Exhibit 1
Actual Scottish health budget 200203 to 201314
Total health budget (poundbillion)
200203
200304
200405
200506
200607
200708
200809
200910
201011
201112
201213
201314
Health budget (real terms)
871
903
1002
1054
1082
1144
1163
1179
1177
1167
1181
1182
Health budget (cash terms)
679
717
818
876
924
1002
1048
1091
1118
1134
1160
1182
Health spending per head of population (pound)
200203
200304
200405
200506
200607
200708
200809
200910
201011
201112
201213
201314
Health spending per head of population (cash terms)
1339
1414
1608
1714
1801
1938
2014
2085
2125
2138
2182
2219
Health spending per head of population (real terms)
1720
1782
1972
2063
2107
2213
2236
2253
2237
2202
2222
2219
Notes
1 The overall health budget is the Scottish Governments total spending on health (excluding spending on sport and equalities) including the budgets allocated to the 14 territorial boards and the nine special boards This includes revenue and capital budgets and annually managed expenditure
2 We used 201314 as the reference year for calculating real terms figures
3 200203 was the first year of the current three-year budget-setting arrangements and budget figures from before that year are not directly comparable
4 Due to an accounting adjustment to the capital budget the cost of capital charges has been removed from budgets prior to 201011
Source Scotlands draft budgets 200708 200809 200910 201011 201112 201213 201314 and 201415 Scottish Government and Mid-Year Population Estimates for Scotland General Register Office for Scotland
10 |
5 In 201314 the total amount of revenue funding that the Scottish Government provided to boards increased by almost three per cent in cash terms and by just over one per cent in real terms from 201213
bull All territorial boards received small real terms increases in their revenue budgets There was an overall increase of 16 per cent in 201314
bull Revenue budgets decreased in some special boards mainly in those that do not provide frontline services There was an overall decrease of 05 per cent in 2013144
All NHS boards met their financial targets in 201314 but some are facing increasing difficulty in achieving them
6 NHS boards have two financial targets to break even against both their revenue and capital budgets at the end of the financial year5 This means that NHS boards cannot have a deficit against their budgets at the end of the year The requirement for NHS boards to break even at the end of every year makes it more difficult to carry out longer-term financial planning It makes it difficult for NHS boards to balance the funding of services to meet current needs with the investment required to address longer-term issues
7 Last year we recommended that the Scottish Government should consider moving away from setting annual financial resource limits for NHS boards to help them plan for the longer term6 From 201415 a proportion of funding that the Scottish Government can carry forward each year will be available to the NHS if required (through the budget exchange mechanism) This amount is not fixed and the Scottish Government will decide this on an annual basis7 Although this provides some extra flexibility it does not provide boards with certainty about the amount of additional funding available to allow them to plan ahead The Scottish Government is also able to provide some flexibility each year for NHS boards that want to retain a surplus for investment in the following year NHS boards need to agree this with the Scottish Government in advance As the Scottish Government needs to balance the health budget as a whole each year it can only agree this for a small number of boards or for a small percentage of their budgets
8 All NHS boards broke even in 201314 for the sixth year running There was an overall surplus in the revenue budget of pound233 million for the whole of the NHS in Scotland Supplement 3 Financial performance of NHS boards in 201314 shows the budget and outturn figures for 201314 This represents only 022 per cent of the revenue budget slightly higher than the 016 per cent surplus in 201213 NHS boards normally return any surplus against their budgets at the year-end to the Scottish Government NHS Dumfries and Galloway and NHS Greater Glasgow and Clyde both agreed with the Scottish Government to retain a surplus against their revenue budgets in 201314 of pound3 million and pound10 million respectively This is to support future non-recurring expenditure in relation to new hospitals that are being built in both these boards
Four boards required brokerage in 2013149 The Scottish Government can agree to provide an NHS board with additional funding to help it manage changes to planned expenditure or provide extra money at a time of pressure This is agreed on the basis that the board provides assurance that it can repay the funds in the coming financial years This form of additional funding is known as brokerage The amount of brokerage received by boards in
Part 1 The NHS in Scotland is facing significant pressures | 11
a year is relatively small compared to their overall budget This shows that NHS boards are often working to tight budgets with little flexibility for unexpected costs at the end of the year for example locum costs to cover staff sickness
10 In 201314 four NHS boards received brokerage from the Scottish Government Brokerage can be helpful in providing some additional flexibility in boardsrsquo budgets for unforeseen unexpected financial pressures However poor financial management was a major factor in NHS Highland and NHS Orkney needing brokerage in 201314 Both boards requested brokerage late in the financial year to help them break even due to overspending on their day-to-day running costs
bull NHS Highland received pound25 million (04 per cent of its revenue budget) to cover pressures associated with overspending on the operating costs for Raigmore Hospital and costs associated with hiring locum doctors and meeting waiting times targets (Case study 1 page 13)
bull NHS Orkney received pound1 million (20 per cent of its revenue budget) for additional costs of hiring locum doctors (Case study 2 page 14)
bull NHS 24 received pound39 million (53 per cent of its revenue budget) for the financial implications of delays and ongoing issues in implementing a new IT system This is likely to have financial implications for the board in future years (Case study 3 page 15)
bull NHS Tayside received pound285 million (04 per cent of its revenue budget) for deferring the sale of property with an anticipated profit of pound2 million and associated ongoing maintenance costs This is the second year running the board received brokerage for this reason
Three NHS boards faced particular financial difficulties in 20131411 The external auditors have raised concerns about the financial position and financial management in NHS Highland and NHS Orkney and the financial position in NHS 24 Both NHS Highland and NHS Orkney received brokerage to meet operational cost pressures but did not identify this need until late in the financial year Both boards also made high levels of non-recurring savings to help them break even This is a less sustainable way to meet savings targets than making recurring savings as it means the boards need to find these same savings again in other areas in future years NHS Highland and NHS Orkney both receive funding allocations from the Scottish Government that are less than that recommended by the national funding formula (paragraph 13) While this may contribute to their financial pressures these boards also need to improve their financial management (Case study 1 and Case study 2) NHS 24 has experienced financial difficulties due to problems implementing a new IT system (Case study 3) The Auditor General has prepared separate reports on each of these three boards8
Seven boards have ongoing commitments to repay brokerage12 The Scottish Government has agreed brokerage with eight NHS boards over the past five years with five of these boards receiving brokerage in more than one financial year (Exhibit 2 page 12) Seven NHS boards have ongoing commitments to repay brokerage after 201314 reducing the amount they will have available to spend on services during this period For example
bull NHS Orkney has received brokerage on four occasions and its repayment schedule spans a seven-year period Brokerage was received between
12 |
200910 and 201112 to support implementation of a new clinical strategy and help the board to return to a recurring financial balance The board repaid pound1 million in 201314 and has agreed that the balance will be repaid in 201617 and 201718 to tie in with moving closer to its target funding allocation
bull NHS Highland is due to repay brokerage received in 201314 over the next three years
bull NHS Tayside is relying on selling properties to repay the brokerage it has received and to break even in 201415 If these property sales do not take place or the proceeds are less than expected the board might need brokerage again which could reduce the boardrsquos budget in future years
Exhibit 2Brokerage provided by the Scottish Government 200910 to 201314 and planned repayments to 201819Eight NHS boards have received brokerage over the past five years Arrangements for repayment can span a number of years
NHS board
Brokerage by year (pound millions) 0910 1011 1112 1213 1314 1415 1516 1617 1718 1819
Total brokerage
by board
FifeBrokerage 111 140
251Repayments (036) (215)
Forth Valley
Brokerage 210 11001310
Repayments (155) (257) (357) (441)
HighlandBrokerage 250
250Repayments (050) (100) (100)
LothianBrokerage 1000
1000Repayments (200) (400) (400)
OrkneyBrokerage 111 101 226 100
538Repayments (032) (100) (321) (085)
TaysideBrokerage 225 285
51Repayments (025) (405) (080)
Western Isles
Brokerage 31031
Repayments (063) (059) (026) (054) (054) (054)
NHS 24Brokerage 032 1658 386
2076Repayments (365) (643) (619) (449)
Total brokerage by year 421 311 1469 3023 1021 Notes1 Reasons for boards receiving brokerage in 201314 are in Case studies 1 2 and 3 and paragraph 102 Reasons for other boards receiving brokerage before 201314 areNHS Fife received pound11 million in 201112 and a further pound14 million in 201213 due to overspending in its Acute Operating Division and on GP prescribing and for costs for some specialist patient treatment outside the Fife area NHS Forth Valley received pound21 million in 201011 for financial support The board received a further pound11 million in 201112 for costs associated with the implementation of its Healthcare Strategy and to help it break even The Scottish Government agreed that pound1 million of this pound11 million brokerage did not require to be repaid NHS Lothian received pound10 million in 201213 to help improve its performance against waiting times targetsNHS Western Isles received pound31 million in 200910 to support a historical deficit although it had achieved financial balance for two years
Source Health Finance Directorate Scottish Government
Part 1 The NHS in Scotland is facing significant pressures | 13
Case study 1Financial management at NHS Highland
In 201314 NHS Highland required brokerage of pound25 million from the Scottish Government to break even This was mainly due to an overspend on the operating costs for Raigmore Hospital and costs associated with hiring locum doctors and meeting waiting times targets Weaknesses in budgetary control at Raigmore Hospital contributed to a pound965 million overspend at the hospital in 201314 and the board did not meet waiting time targets for inpatientsday cases and outpatients (Exhibit 5 page 23) Weaknesses in budgetary control at Raigmore Hospital were also highlighted in internal audit reports in 2013 and 2014
Until February 2014 the board was forecasting that it would break even at the end of the financial year Finance reports did not sufficiently detail how the board expected to bridge the gap between the ongoing overspend and its forecast break-even position It was not until close to the end of the financial year that the finance team reported to the board of directors that brokerage from the Scottish Government would be needed to break even
NHS Highland has increasingly relied on non-recurrent savings to break even in recent years In 201314 it planned to make 67 per cent of its savings on a recurring basis but it actually only made 38 per cent (pound7 million) on this basis Continued reliance on non-recurring savings may not be sustainable in the longer term
In 201314 NHS Highland also received additional funding of pound1 million from Highland Council towards the transitional costs of integrating adult health and social care services These services had transferred to the board as part of the integration of health and social care in Highland The cost of delivering adult social care services still poses a financial risk to the board Highland Council has agreed to provide the board with a further pound135 million between 201415 and 201617 This covers the final three years of the partnership agreement between the board and the council for adult health and social care services
NHS Highland continues to experience financial pressures in 201415 At the end of August 2014 it forecast breaking-even at the end of the financial year This requires it to achieve by the year-end a pound123 million improvement on the financial position projected in August with pound99 million of this relating to Raigmore Hospital This will be challenging for the board and will depend on meeting its savings targets NHS Highland recognises the significant challenges it faces in identifying and delivering savings It has established a programme board chaired by the chief executive and including all executive and operational directors to oversee the delivery of savings The programme board is focusing on delivering recurring savings to achieve financial balance
In 201314 NHS Orkney required brokerage of pound1 million from the Scottish Government to break even This was largely due to hiring locum doctors to cover vacant medical posts
Throughout the year NHS Orkney was reporting an overspend against its revenue budget to its Finance and Performance Committee and this increased considerably over the second half of the financial year The board did not have detailed plans for how it was going to bridge the gap between its ongoing overspend position and its forecast break-even position at the year-end or provide reports to its Board of directors about how it would achieve this We were informed that officers discussed actions with Board members
NHS Orkney approached the Scottish Government in February 2014 to request brokerage of pound075 million This was later revised to pound1 million in March 2014 The Scottish Government has agreed that the board does not need to start repaying the total amount of brokerage received of pound406 million (including brokerage received in previous years) until 201617 (Exhibit 2 page 12) This is when the board should receive additional funding to take it closer to its target funding allocation (paragraph 13)
During the audit of the boardrsquos 201314 annual accounts the auditor identified a significant error relating to accounting entries associated with the five-yearly revaluation of its land and buildings during 201314 Due to a lack of capacity within NHS Orkneys finance team staff from NHS Fife assisted the board in resolving this issue The auditor has expressed some concern about the capacity of the finance team given the pressures facing the board
In recent years NHS Orkney has relied on non-recurring savings to break even (Exhibit 3 page 17) In 201314 it achieved pound042 million recurring savings against a target of pound103 million (41 per cent of the target) The boards financial plans for 201415 also rely on non-recurring savings It plans to make over 66 per cent of its planned savings on a non-recurring basis due to the non-recurring nature of the pressures facing the board such as using locum and agency staff until permanent staff are recruited Taking into account the need to continue to deliver savings and to repay brokerage the auditor has highlighted that delivering a break-even position in the coming years will be challenging for the board There are specific pressures that may affect NHS Orkneys ability to achieve the savings required for longer-term sustainability particularly workforce pressures and associated costs of hiring locum doctors Between 201213 and 201314 the boards spending on locum doctors increased by 30 per cent The board recruited a number of staff to key posts in 201314 but it has underlying recruitment problems and has not been able to fill some posts despite several recruitment campaigns Continued reliance on locum doctors will have a significant impact on its plans to achieve savings
The Chief Executive asked the boardrsquos internal auditor to undertake a detailed review of the boardrsquos 201314 financial position This includes an examination of the boardrsquos approach to budget-setting and in-year financial management The review is now complete and the board is developing an action plan
Source NHS Orkney Annual Audit Report 201314
Part 1 The NHS in Scotland is facing significant pressures | 15
Case study 3NHS 24s Future Programme
NHS 24 planned to implement its Future Programme in September 2013 This includes delivering new technology that is central to NHS 24 improving its core telephone and online services for patients NHS 24 also expected the new application to deliver financial savings NHS 24 has delayed implementation as it considers that the new application currently developed does not meet its patient safety requirements
The delay in implementing the new system has led to additional costs being incurred The total cost of the project to date is pound38 million considerably more than the original business case of pound296 million The board has estimated that it will incur further additional costs of pound146 million between 201415 and 201516 to achieve an acceptable solution This includes potential new investment in developing the IT system the costs of continuing to maintain the current system during the delay and failing to achieve savings that were expected as a result of the new system
By the end of 201213 the Scottish Government had provided NHS 24 with brokerage of pound169 million and pound08 million in revenue funding to fund the Future Programme The boards financial plan for 201314 included agreed brokerage of pound17 million to support what was planned to be the final year of implementing the Future Programme Due to the delays and ongoing problems implementing the new IT system the Scottish Government agreed to provide a further pound22 million brokerage taking the total provided in 201314 to pound39 million NHS 24 was due to repay the brokerage over three years from 201415 but the Scottish Government has agreed that this can be postponed to start in 201516 (Exhibit 2 page 12)
NHS 24 has drafted a five-year financial plan for 201415 onwards This projects a break-even revenue position for the first four years of the plan and a small surplus position in year five The plan has factored in the financial implications of resolving the issues with the Future Programme and the board will update this on an ongoing basis as the situation evolves The auditor has highlighted that the achievement of financial targets is likely to remain a high risk for the board given the extent of the issues that need to be resolved and the requirement to repay brokerage in future years
NHS 24 has kept the Scottish Government informed about the problems with the Future Programme The board and the Scottish Government jointly commissioned an independent review and NHS National Services Scotland has also recently provided additional support to NHS 24 through contract management and technical specialists The board is continuing to work with the suppliers of the new IT system on resolving the issues
The board has ensured that the current IT systems can be maintained in a safe and reliable manner so that services for patients are not affected
Source NHS 24 Annual Audit Reports 201213 and 201314
16 |
Four NHS boards are still receiving less than their target funding allocation13 The Scottish Government uses a formula developed by the National Resource Allocation Committee (NRAC) to allocate funding to territorial boards The formula has been in place since 200910 and the Scottish Government is aiming for all NHS boards to be within one per cent of their target allocations by 201617 Territorial boards receive an increase in funding each year however some boardsrsquo allocations are below the amount proposed by the formula Four boards were more than one per cent below their target allocations in 201314 and 201415
bull NHS Orkney -122 per cent (pound48 million) in 201314 -111 per cent (pound45 million) in 201415
bull NHS Grampian -51 per cent (pound399 million) in 201314 -37 per cent (pound302 million) in 201415
bull NHS Highland -22 per cent (pound113 million) in 201314 -23 per cent (pound123 million) in 201415
bull NHS Lanarkshire -15 per cent (pound127 million) in 201314 -17 per cent (pound153 million) in 201415
14 Receiving funding that is below their target NRAC allocation may have contributed to financial difficulties in NHS Highland and NHS Orkney Both boards broke even in 201314 using unsustainable methods specifically brokerage from the Scottish Government and high levels of non-recurring savings However the level of NRAC funding is not the only factor causing financial difficulties at NHS Highland and NHS Orkney We have identified concerns about financial management at these boards NHS Grampian and NHS Lanarkshire also received funding allocations of more than one per cent below their target NRAC allocations NHS Grampian only met two of the eight waiting time targets and the number of its patients with a delayed discharge increased (Exhibit 5 page 23)
Five boards continue to rely on high levels of non-recurring savings
15 Boards are required to make efficiency savings of three per cent against their revenue budgets and had forecast savings of pound2678 million in 201314 The actual savings achieved totalled pound2749 million (pound2447 million by territorial boards and pound302 million by special boards) All boards met their savings targets except NHS Western Isles which was pound30000 (16 per cent) below its target NHS boards retain savings made locally as part of their overall financial planning to help balance their budgets
16 Some boards are still relying on a high percentage of non-recurring savings (Exhibit 3 page 17) These are savings that are only made for one year rather than savings that the board will continue to make every year9 It can be appropriate to have some non-recurring savings but it is important that the majority of savings are recurring to ensure the sustainability of the boards financial position and to reduce the risk of not achieving savings targets in future years We have highlighted this as a risk in our reports over the last two years and the risk still remains The area that contributed most to NHS boardsrsquo savings was productivity NHS boards made total savings of pound1141 million in this area against a forecast pound1027 million However 26 per cent of these savings were non-recurring compared with a forecast of 14 per cent This suggests that these
Part 1 The NHS in Scotland is facing significant pressures | 17
Exhibit 3Recurring and non-recurring savingsA number of NHS boards relied on a high level of non-recurring savings in 201314 and 11 boards made higher levels of non-recurring savings than in 201213
RecurringNon-recurring
201213 201314
NHS Orkney
Territorial boards
Special boards
NHS Highland NHS Borders NHS Tayside
NHS Shetland NHS Lanarkshire NHS Ayrshire and Arran NHS Fife
NHS Western Isles NHS Lothian NHS Dumfries and Galloway NHS Grampian
NHS Forth Valley
The State HospitalNational
Waiting Times CentreHealthcare
Improvement ScotlandNHS Education
for Scotland
NHS 24Scottish
Ambulance ServiceNHS Health
ScotlandNHS National
Services Scotland
NHS Greater Glasgow and Clyde
RecurringNon-recurring
1213 1314 1213 1314 1213 1314 1213 1314
1213 1314 1213 1314 1213 1314 1213 1314
1213 1314 1213 1314 1213 1314 1213 1314
1213 1314 1213 1314
1213 1314 1213 1314 1213 1314 1213 1314
1213 1314 1213 1314 1213 1314 1213 1314
Source NHS boards financial performance returns March 2014 NHS Orkney updated its savings information in July 2014
Exhibit 3
Audit Scotland
Exhibit 3
Exhibit 3 background data
Exhibit 3
kwalker
Sticky Note
Unmarked set by kwalker
Exhibit 3
18 |
savings were the result of short-term initiatives rather than changing the way that services are provided in order to improve productivity This is similar to last year when 28 per cent of productivity savings were non-recurring higher than forecast The difficulty NHS boards have achieving recurring productivity savings is another strain on them and adds to their financial pressures for the coming year
17 Seven territorial and four special boards had higher overall levels of non-recurring savings in 201314 than in the previous year10 Five boards reported a particularly high percentage of non-recurring savings
bull NHS Highland (62 per cent)
bull NHS Orkney (59 per cent)
bull NHS Borders (52 per cent)
bull NHS Tayside (50 per cent)
bull NHS Shetland (48 per cent)
18 These boards will have to find further savings in future years on top of the annual savings target This position is not sustainable especially since boards are required to continue to make three per cent savings from 201415
19 NHS boards set out their financial projections up to five years ahead in their Local Delivery Plans (LDPs) showing expected funding projected expenditure and the savings required each year to close the gap between income and expenditure For 201415 NHS boardsrsquo detailed financial planning is still limited mainly to the first year of the LDP Across the NHS
bull six per cent of the required savings for 201415 are unidentified
bull over two-thirds of the amount of savings are unidentified for the following four years
bull five NHS boards have not identified the breakdown of the amount of their savings after 201415 (Fife Forth Valley Greater Glasgow and Clyde Lothian and Western Isles)
NHS boards are making less progress than expected on reducing backlog maintenance
20 Further cost pressures arise from the backlog of maintenance required to ensure that hospitals and other buildings are fit for purpose In 2012 the Scottish Government forecast that the cost of this backlog would decrease by pound174 million by 2013 from pound948 million to pound774 million11 The actual reduction was pound90 million to pound858 million12 The high-risk backlog reduced to pound96 million pound21 million less of a reduction than anticipated The significant-risk backlog rose from pound265 million to pound275 million13 This reflects additional maintenance identified by boards through survey work during 2013 as well as some lack of progress in carrying out backlog maintenance
21 The level of backlog maintenance decreased in 14 boards and increased in seven14 The total increase in the seven boards was pound199 million of which NHS
Part 1 The NHS in Scotland is facing significant pressures | 19
Fife had by far the largest increase of pound135 million In three of these boards (NHS Borders NHS Highland and the Scottish Ambulance Service) the backlog had also increased in 2012 The increase of pound34 million in NHS Highland is a further financial pressure on the board In four boards over 50 per cent of the cost of backlog maintenance was classed as high-risk and significant risk NHS Lothian (84 per cent) NHS Shetland (82 per cent) NHS Tayside (54 per cent) and NHS Ayrshire and Arran (52 per cent)
22 The Scottish Government now forecasts that the majority of high-risk maintenance backlog will be cleared by 2015 one year later than originally planned The significant-risk backlog is now forecast to decrease to around pound150 million by 2017 compared with the previous forecast that it would be cleared by 2016
The annual financial target for capital spending makes it difficult to plan longer-term projects
23 Capital investment is important in enabling boards to plan and deliver the 2020 Vision by investing in new healthcare facilities maintaining and modernising existing facilities that will be required in future and disposing of those that are no longer needed The NHS capital budget available to boards fell by 21 per cent between 201213 and 201314 from pound6055 million to pound4813 million More than half of this reduction related to accounting adjustments associated with revenue-financed methods such as Non-Profit Distribution (NPD) which do not affect the capital funds available for boards to spend The remaining capital budget available to boards reduced by 12 per cent to pound4664 million
24 All boards broke even against their capital budgets in 201314 but significant movements in their budgets were required during the year to allow them to reach that position (Exhibit 4 page 20) The Scottish Government manages the capital budget carefully during the year moving funds from NHS boards that expect delays in their expenditure to those that are able to make use of the funding This allows the NHS as a whole and individual boards to stay within their capital budgets but it makes it difficult to see how well NHS boards have managed their resources The Scottish Government has increased the proportion of total capital funding that is included in initial allocations each year although it did not agree final budgets with several NHS boards until after the end of the financial year NHS boardsrsquo annual accounts are still not clear about the extent of and reasons for movements in their capital budgets during the year
25 The annual financial targets for capital budgets and uncertainty about future budgets hinders NHS boardsrsquo effective planning of capital projects For example NHS boards returned around pound29 million of capital funding to the Scottish Government during 201314 A number of boards that had returned capital funds in previous years received these funds back in 201314 and subsequently returned them again For example NHS Grampian agreed with the Scottish Government to defer some of its capital budget allocation from 201112 and 201213 into 201314 to help manage the cost of essential backlog maintenance at Aberdeen Royal Infirmary From 201415 the Scottish Government has issued two-year indicative capital allocations to NHS boards to help them manage their capital programmes
26 The NHS needs the right buildings and facilities to achieve the 2020 Vision and provide healthcare that meets future needs Over the next four years the
20 |
Scottish Government plans to invest around pound330 million in new facilities and other capital projects in the community15 This investment is intended to help move towards more community-based and preventative care by April 2017 For example NHS Forth Valley Stirling Council and Forth Valley College plan to develop the Stirling Care Village as part of their wider plans to change and improve care for older people This model intends to combine primary and community healthcare with care for older people providing joined-up services GP surgeries the voluntary sector and other local service providers will also be involved in delivering enhanced services through this model of care16
Exhibit 4There were significant movements in the NHS capital budget in 201314Both the overall capital budget and the budget available for investment decreased from 201213
201213pound million
201314pound million change
Total capital budget 6055 4813 -2052
Split into
Capital provided for investment in board capital programmes 5281 4664 -1168
Capital funded by the Scottish Parliament for accounting treatment for new revenue-financed projects
775 149 -8072
There were also significant movements in the capital budget across all boards These follow a similar pattern to the movements in 201213
Note The capital budget shown here is represented by the final capital resource limits (CRLs) from the NHS boards accounts This differs from the capital budget allocated to the NHS within the Scottish Government Budget due to adjustments for example for assets donated to the boards
Part 1 The NHS in Scotland is facing significant pressures | 21
There have been improvements in the quality of healthcare
27 The Scottish Government has set out the national strategy for the NHS in the 2020 Vision and the Healthcare Quality Strategy These aim to improve the quality and safety of patient care and health outcomes17 The Scottish Patient Safety Programme focuses on improving the safety and reliability of healthcare and reducing harm For example a focus on healthcare-associated infections (HAIs) resulted in a 50 per cent reduction in adult patients in hospital with HAIs between 2005 and 2011 (from 95 per cent to 49 per cent) and rates continue to fall18 Health outcomes for some conditions have also improved Cancer and heart disease are the two main causes of death in Scotland Between 2003 and 2012 the death rate for all forms of heart disease fell by 38 per cent and the number of people having a heart attack fell by a fifth19 The Scottish Government has a policy objective to improve early detection of cancer which improves outcomes for patients Between 2010 and 2013 the number of people diagnosed with early stage breast colorectal or lung cancer increased by 75 per cent Patient satisfaction with hospital inpatient services has also generally increased since 201220
Performance against waiting time targets is showing increasing signs of pressure
28 NHS boards are required to meet a number of performance targets that cover health improvement efficiency access and treatment (HEAT targets) These aim to ensure that NHS boards focus on making improvements in areas the Scottish Government has identified as priorities to help to achieve its overall purpose and objectives21 In recent years the Scottish Government has reduced the number of HEAT targets and has committed to focusing more on outcomes But the level of performance that boards are expected to achieve has become more challenging at the same time as budgets are tightening This is making it increasingly difficult for NHS boards to continue to meet HEAT targets
29 Many of the HEAT targets relate to waiting times Waiting time targets have reduced over the past ten years and the length of time that people wait has decreased considerably Some targets have become more challenging for NHS boards recently
bull Delayed discharges ndash since April 2013 NHS boards have been working to the target that no patient should wait in hospital for more than 28 days from when they are clinically ready for discharge (reduced from 42 days previously) From April 2015 this is due to reduce further to 14 days Boards are finding it difficult to meet the current target with only three boards meeting this at the end of April 2014 (Exhibit 5 page 23)
bull Specialist Child and Adolescent Mental Health Services (CAMHS) ndash the current target is that 90 per cent of patients should wait no longer than 26 weeks from referral to treatment This target is due to reduce to 18 weeks from December 2014 Performance against the current target deteriorated between 201213 and 201314 from 99 to 93 per cent of all patients seen within 26 weeks (Exhibit 5)
bull The treatment time guarantee (TTG) was introduced on 1 October 2012 under the Patient Rights (Scotland) Act 2011 All eligible patients now
22 |
have a legal right to receive planned inpatient or day-case treatment within 12 weeks of the treatment being agreed This is the first time that waiting times have been a legal right and puts more pressure on boards to ensure that all patients are seen within the required time The TTG has not been met nationally since it was introduced and only five territorial boards met it in March 2014
30 Last year we highlighted that the failure to meet some key waiting time targets suggested capacity pressures in boards Overall performance against several of these targets deteriorated between 201213 and 201314 indicating increasing capacity pressures in boards (Exhibit 5) The Scottish Government has recently lowered the threshold for the AampE target as boards were struggling to meet it From April 2013 the AampE waiting time target was temporarily lowered from 98 per cent of patients to be seen within four hours to 95 per cent The 95 per cent target is due to be delivered by the year ending September 2014 and performance data will be published at the end of November 2014
31 Across Scotland at the end of March 201422
bull Only three of the key waiting time targets were met nationally the drug and alcohol treatment target (met by all 14 territorial boards) the cancer (decision to treat to first treatment) target (met by 11 territorial boards) and access to CAMHS (met by nine territorial boards) These three targets were also met at the end of March 2013 The 18-week referral to treatment target which was met in at the end of March 2013 was not met at the end of March 2014
bull No territorial board met the outpatient waiting time target and only three boards met the delayed discharges target (NHS Ayrshire and Arran NHS Orkney and NHS Shetland)
bull Boards are finding it challenging to meet the TTG four-hour AampE target and cancer (urgent referral to first treatment) target
bull Performance against the targets varied by board While NHS Orkney met eight of the nine targets and NHS Shetland met seven NHS Grampian and NHS Lothian met two of the nine targets NHS Greater Glasgow and Clyde and NHS Highland met three and NHS Tayside met four
32 More detailed analysis of performance against these key targets highlights the variability across boards and specialties For example most patients waiting longer than the TTG target of 12 weeks at the end of March 2014 were in NHS Lothian and NHS Grampian More recent information for June 2014 shows that
bull no patients were waiting longer than 12 weeks in any specialty in NHS Forth Valley NHS Greater Glasgow and Clyde NHS Lanarkshire NHS Orkney NHS Shetland and NHS Western Isles
bull the three boards with the highest number of people waiting for more than 12 weeks for treatment were NHS Lothian NHS Highland and NHS Grampian
bull the specialties with the highest number of people waiting more than 12 weeks in NHS Lothian were plastic surgery (125 patients) urology (93) and general surgery (49) in NHS Highland it was trauma and orthopaedics (166) and in NHS Grampian it was plastic surgery (133) and ophthalmology (88)23
Part 1 The NHS in Scotland is facing significant pressures | 23
Exhibit 5Performance against waiting time and delayed discharge targets in territorial NHS boardsPerformance against some waiting time targets deteriorated in some boards (end of March 2013 to end of March 2014)
Child and Adolescent Mental Health Services (CAMHS)1
Drug and alcohol treatment2
Referral to treatment (RTT)1
Out-patients1
Inpatientday-case treatment time guarantee (TTG)1 3 4 AampE1
Cancer ndash urgent referral to first treatment2
Cancer ndash decision to treat to first treatment2
Delayed discharges5
Targetstandard 26 wks 3 wks 18 wks 12 wks 12 wks 4 hrs 62 days 31 days 4 wks
Met Met temporaryinterim target Met for over 99 of patients Within 5 Not met
Notes1 Data is for month ended 31 March 2013 and 2014 CAMHS data for NHS Highland is not available for March 2014
The AampE target was 98 per cent at March 2013 and 95 per cent at March 2014 2 Data for quarter ended 31 March 2013 and 20143 TTG applies to patients added to the waiting list from 1 October 2012 only4 TTG incorporates a legal right to treatment so we have categorised this as met not met or met for over 99 per cent of patients5 Performance against this standard is based on a census at point in time The delayed discharges data are at the end of April 2013 and 20146 National Waiting Times Board is not included in this table Four of these targets apply to this board ndash Referral to treatment (RTT) Outpatients Inpatientday case treatment time guarantee (TTG) and Cancer ndash decision to treat to first treatment The board met all four of these targets
Source Based on data from ISD Scotland and subject to any caveats described by ISD Scotland
24 |
Demand for outpatient appointments is increasing faster than the number of patients seen33 NHS boards need to manage demand for outpatient clinics alongside inpatients and day cases They are finding it difficult to meet the target that new outpatients should be seen within 12 weeks of referral and none of the territorial boards met the target throughout 20131424 Demand for outpatient appointments has increased over the last three years but the number of people seen has not increased to the same extent At the quarter ending March 2014
bull the number of people on waiting lists for a new outpatient appointment was 34 per cent higher than at the quarter ending March 2010 increasing from 187693 to 252009
bull the number of new outpatients seen during the same period increased by only 13 per cent from 324403 to 367259 meaning that the number of people waiting is continuing to increase
bull the number of people who had been waiting longer than 12 weeks increased from 157 at the quarter ending March 2010 to 6754 at the quarter ending March 2014
34 The increasing number of people waiting over 12 weeks indicates pressure on NHS boardsrsquo capacity For example the number of procedures carried out in outpatients has more than doubled since 200809 to 380456 procedures in 201213 There are risks this pressure will increase as demand continues to grow This pressure can only be tackled by some combination of
bull increasing the number of new outpatient appointments available for example by allocating additional staffing and other resources
bull further reducing the number of people attending for follow-up appointments (the ratio of follow-up to new appointments has reduced from 23 in 2004 to 19 in 2013) A new approach is being implemented in hospitals across Scotland to reduce the number of follow-up patients attending orthopaedic clinics (Case study 4 page 25)
bull reducing the number of outpatient referrals by moving to other models of care such as self-management telehealth and telecare
Delays in discharging patients are putting pressure on hospital beds35 Although the overall average (mean) length of stay in hospital has reduced delays in discharging patients who are clinically ready to leave hospital have been increasing over the last five years especially during 201314 They increased from around 101500 bed days over the quarter ending April 2013 to 117800 over the quarter ending April 2014 (Exhibit 6 page 26)25 In 201314 a total of 421157 bed days were occupied by patients who were delayed at an estimated cost to the NHS of pound78 million26
36 Most patients who are affected by delayed discharges are aged 75 and over This reflects their more complex needs and difficulties in organising the community support they need In April 2014
bull there were 738 patients across Scotland whose discharge was delayed compared to 564 in April 2013
Part 1 The NHS in Scotland is facing significant pressures | 25
bull 173 patients were delayed for four weeks or more
bull the most common reason for delays of four weeks or more was waiting for a place in a care home Shorter delays (two weeks or less) were mainly due to waiting for community care assessments27
37 In 2013 and 2014 a number of NHS boards carried out snapshot audits reviewing the healthcare needs of all patients in hospital on one day28 These found that for around 25 per cent of patients there was no clinical reason for them to remain in hospital Reasons for patients remaining in hospital included waiting to be reviewed by a consultant waiting for a place in a care home and waiting for a social work assessment NHS boards are using this information to identify areas for improvement for example focusing on groups of patients at more risk of spending longer in hospital than clinically necessary
38 While the overall results of the latest NHS inpatient experience survey were positive the one aspect that was less positive was leaving hospital29 Fourteen per cent of patients indicated that they had to stay in hospital longer than expected to wait for their care or support services to be organised Two-fifths of patients experienced a delay on the day they were leaving hospital mainly
Case study 4Follow-up care for patients with a fracture has been redesigned
Around 100000 people a year in Scotland have a fracture that does not require surgery In these cases the fracture is left to heal and no follow-up treatment is required Traditionally all patients with a fracture were fitted with a cast and would have to return to an outpatient clinic to have the cast removed
In around 80 per cent of Scottish hospitals a new approach has been introduced for patients with a fracture that does not require surgery Patients are treated in AampE and fitted with a removable cast if possible Patients are provided with information to allow them to self-manage and around 40 per cent do not need to return to hospital for follow-up care The remaining patients are referred to an orthopaedic clinic The orthopaedic team is able to follow up around a fifth of these patients by telephone conversation and the remainder of patients attend an orthopaedic outpatient clinic for follow-up
Glasgow Royal Infirmary (GRI) started using this approach in 2011 and was one of the first hospitals to use it Since it was introduced referrals from AampE to the orthopaedics department have decreased by over 50 per cent and it has reduced travel time for patients GRI has reported that it has improved patient flow in both its AampE and orthopaedics departments It has reduced the number of orthopaedic patients in AampE who wait longer than four hours and freed up orthopaedic consultant time to see new outpatient referrals
Source Audit Scotland based on information provided by the Quality and Efficiency Support Team (QuEST) at the Scottish Government
26 |
Exhibit 6Number of delayed discharges and occupied bed days 2012ndash14The number of bed days occupied by patients who experience a delayed discharge has been steadily increasing
Number of bed days occupied by delayed discharges
Number of delayed discharges
Num
ber
of b
ed d
ays
occu
pied
by
dela
yed
disc
harg
es (0
00s)
Jul2012
Oct2012
Jan2013
Apr2013
Jul2013
Oct2013
Jan2014
Apr2014
140
120
100
80
60
40
20
0
Num
ber
of d
elay
ed d
isch
arge
s
1000
900
800
700
600
500
400
300
200
100
0
Note The number of delayed discharges refers to all patients who experienced a delay of any length It excludes code 9 patients with complex needs
Source ISD Scotland
because they had to wait for medicines with 16 per cent waiting longer than four hours Delays in patients being discharged mean that beds are not available to other patients who need them causing delays and blockages elsewhere in the system NHS boards need to ensure they have detailed information about discharge times and the reasons for delays to effectively manage patient flows
39 Some boards for example NHS Fife NHS Forth Valley and NHS Lanarkshire are co-locating staff from the hospital and community including social work to coordinate planning for patientsrsquo discharge from hospital Staff in these discharge hubs work with ward staff to identify patientsrsquo needs and start planning their discharge as soon as they are admitted to hospital The aim is to minimise any delays and to ensure patients have sufficient support in the community In NHS Forth Valley they also provide advice and guidance to hospital staff and GPs including potential alternatives to admitting people to hospital We included a case study on the integrated discharge hub in NHS Fife in our AampE report
40 Our report on reshaping care for older people highlighted how NHS Tayside and Perth and Kinross Council are working together to
bull redesign systems so that patients can be discharged home from hospital as quickly as possible
bull provide community-based alternatives to hospital and long-term residential care
bull use data to work with GPs to understand how they are using local services and to change how older people receive care and support30
Exhibit 6
Audit Scotland
Exhibit 6
Exhibit 6 background data
Part 1 The NHS in Scotland is facing significant pressures | 27
The NHS puts considerable effort into meeting performance targets 41 The Scottish Government and NHS boards put a great deal of effort into attempting to meet annual waiting time targets The Scottish Government also provided additional funding for NHS boards For example in 201314 the Scottish Government provided NHS boards with at least pound17 million additional funding during the year to support waiting time targets This is similar to the additional funding of at least pound20 million that it provided in 20121331 During 201314 NHS boards also received additional funding of pound9 million to improve emergency and urgent care including reducing waiting times in AampE NHS boards have noted additional workforce costs to provide additional capacity to meet waiting times targets particularly the TTG This level of focus on meeting waiting times targets may not be sustainable when combined with the additional pressures of increasing demands related to demographic changes and the overall health budget starting to decrease in real terms
42 National targets are helpful in targeting areas for improvement in performance For example the focus on waiting time targets has led to a considerable reduction in the length of time that people wait for treatment However it is becoming more difficult for NHS boards to meet these targets fully The extent of the effort required to try to meet them makes it more difficult for NHS boards to focus on long-term planning and moving more care into the community There are risks that too narrow a focus on targets can detract attention from achieving the wider aims
43 The Scottish Government is reviewing the HEAT framework and aims to have updated guidance for boards by November 2014 It should review whether the current financial and performance targets for the NHS are achievable at the same time as implementing the 2020 Vision for health and social care within the tight financial resources available It should consider setting targets for NHS boards that will help them work towards the 2020 Vision for example introducing milestones to measure the extent to which boards are moving towards more preventative and community-based care
There is growing evidence of staff pressures
44 The availability of staff is another important factor in NHS boardsrsquo capacity to provide patient care The number of consultants and nursing and midwifery staff in post has increased slightly each year since 2012 Between March 2013 and March 2014 the number of vacancies for nursing and midwifery staff was stable after increasing the previous year but the number of consultant vacancies increased significantly (Exhibit 7 page 28) This may be related to some extent to the increase in the number of consultant posts and the time lag in filling new posts However the number of posts vacant for six months or more almost doubled from 41 whole-time equivalent (WTE) at 31 March 2013 to 792 WTE in March 2014
45 Of the mainland territorial boards consultant vacancy rates were highest in NHS Dumfries and Galloway (154 per cent) NHS Fife (133 per cent) NHS Forth Valley (102 per cent) and NHS Grampian (99 per cent) With the exception of NHS Dumfries and Galloway these boards experienced difficulty achieving a number of performance targets in 201314 (Exhibit 5)
46 Many NHS boards have reported difficulties filling medical vacancies in some specialties and some geographical areas leading to greater use of locum doctors to maintain services NHS boardsrsquo workforce plans comment on a number of factors that are contributing to these difficulties including
28 |
bull changes in junior doctor training since the introduction of Modernising Medical Careers in 2005 These changes have led to a reduction in the number of junior doctors available and NHS boards needing more middle grade doctors and consultants
bull strong competition among NHS boards for medical staff This can make it more difficult for smaller boards and more rural areas to compete with larger boards which can offer more opportunities such as research and development
bull difficulty recruiting and retaining staff in some specialties with unattractive working patterns such as emergency medicine or where there is a national shortage and greater levels of part-time working such as paediatrics
47 These difficulties have an impact on NHS boardsrsquo ability to provide services and on their financial position For example
bull NHS Highland reported that its financial position in 201314 was negatively affected by spending on locums It anticipates that this will continue to be a cost pressure in 201415 (Case study 1)
bull NHS Orkney required brokerage from the Scottish Government to help cover increased spending on locum doctors and agency nursing staff (Case study 2)
bull NHS Dumfries and Gallowayrsquos spending on locums increased from pound63 million in 201213 to pound76 million in 201314 The board reported that this is due to increased demand and difficulty filling posts
bull NHS Grampian has reported that consultant vacancies in oncology are affecting cancer services and patients are having to receive treatment in other boards It has reported significant difficulty recruiting some groups of
Exhibit 7Consultant nursing and midwifery workforce March 2012 to March 2014The number of vacant consultant posts increased significantly between 2013 and 2014
At 31 March 2012 (wte)
At 31 March 2013 (wte)
At 31 March 2014 (wte)
increase 2012 to 2013
increase 2013 to 2014
Consultant staff in post 44277 45316 46936 23 36
Consultant vacancies number and rate
1673 (36) 2025 (43) 3248 (65) 21 604
Nursing and midwifery staff in post
564673 570366 581727 1 2
Nursing and midwifery vacancies number and rate
10279 (18) 16091 (27) 16375 (27) 565 18
Source ISD Scotland
Part 1 The NHS in Scotland is facing significant pressures | 29
staff including AampE staff due to the buoyant labour market competition for jobs in the local area and a national shortage of staff in certain clinical specialties including oncology
bull NHS Fife has highlighted vacancies for radiologists and difficulties securing locums which have had an impact on waiting times for diagnostic tests
bull NHS Ayrshire and Arran has reported that vacancies across medical grades are a challenge to it providing current services and considering its plans for providing services for the future
48 The NHS spent pound128 million on bank and agency nursing and midwifery staff in 201314 an increase of 15 per cent since 201213 This accounts for 13 per cent of total revenue expenditure in 201314 Bank nurses accounted for 93 per cent of the spending However spending on agency staff increased by 46 per cent to pound93 million This follows a rise of 62 per cent the previous year reversing the trend of falls in spending on agency nurses since 20080932 Agency staff are likely to be more expensive than bank nurses and also pose a greater potential risk to patient safety and the quality of care33
Spending on private sector healthcare reduced in 201314
49 NHS boards use private sector healthcare to provide additional capacity to meet patientsrsquo needs or to meet national targets In December 2013 the Scottish Government issued guidance for NHS boards which states that it expects the vast majority of patients to be treated within the NHS with the private sector used only to deal with short-term capacity issues34
50 Total spending on private sector healthcare by the territorial boards fell by 69 per cent in real terms between 201213 and 201314 from pound803 million to pound759 million Spending on private healthcare represented about 09 per cent of total spending on hospital and community health services in 201314 Spending decreased in eight territorial boards and increased very slightly in three35 It increased considerably in
bull NHS Shetland spending increased by 60 per cent from pound116000 to pound186000
bull NHS Highland spending increased by 40 per cent from pound26 million to pound37 million
bull NHS Lothian spending increased by 12 per cent from pound148 million to pound166 million
Most boards do not consider integrated performance reports
51 The board of directors in NHS boards need to oversee all aspects of performance including
bull patient safety and clinical quality
bull performance against HEAT targets
bull finance
bull feedback and complaints from patients and staff
30 |
52 Each aspect of performance is important in ensuring the NHS board is providing high-quality sustainable care Considering any one aspect in isolation may mean that the board does not have a full understanding of overall performance for example the board may be achieving its HEAT targets but facing increasing financial pressure or waiting time targets may be met for inpatient and day-case treatment while waiting times for outpatients are growing
53 An integrated overview of performance with high-level commentary helps the board to quickly get an overview of performance We found that only three boards receive an integrated report bringing together all aspects of performance (Case study 5)36 A further two consider reports that bring together a range of aspects of performance but they consider financial performance separately37 We have previously recommended that NHS boards should avoid considering one aspect of performance in isolation In our report on the management of NHS waiting lists we highlighted the importance of NHS boards considering and scrutinising performance against waiting time targets alongside information on how they are achieving that performance Non-executive directors need access to a range of information in order to allow them to provide effective challenge38
Case study 5NHS Greater Glasgow and Clyde uses integrated performance reporting
In April 2011 NHS Greater Glasgow and Clyde established a Quality and Performance Committee (QPC) as a subcommittee of the board This replaced the Performance Review Group Health and Clinical Governance Committee and Involving People Committee The main aim of the QPC is to bring together all areas of governance quality and performance under one committee to provide an overview
The QPC considers an integrated quality and performance report The report brings together data and commentary on the boards performance in relation to quality patient safety clinical governance financial monitoring performance monitoring workforce planning and involving peoplepatients It highlights any areas where the board is not meeting targets or on track to meet them The committee also considers more detailed monitoring reports on some aspects of performance including a financial monitoring report
Source NHS Greater Glasgow and Clyde Annual Audit Report 201112 and update from auditor
Part 2 Looking ahead | 31
Part 2Looking ahead
the NHS is facing significant pressures at the same time as needing to make major changes to services
Key messages
1 The overall health budget is planned to reduce by 09 per cent in real terms over the next two years Changes in Scotlandrsquos population mean that demand for health and social care will increase significantly over the next 20 years at the same time as budgets are tightening The NHS will not be able to continue to provide services in the way it currently does given the scale of the changes required It needs to do more to plan for how it will make the changes needed to provide sustainable care for the future
2 Increasing demand is already putting pressure on services NHS boards need to better understand their demand capacity and how patients move through the complex health and social care system so that they can match their capacity with current and future needs They also need to better understand the reasons for delays and blockages in the health and social care system The Scottish Government has started working with four NHS boards to help them improve patient flow
The NHS will continue to face increasing pressures
55 Taken together our audit work has found clear evidence that NHS boards are finding it increasingly difficult to meet their financial and performance targets All the available evidence suggests that these pressures will increase in future
56 The Scottish Governmentrsquos overall health budget (revenue and capital) is planned to decrease by 10 per cent between 201314 and 201415 and to increase by 01 per cent between 201415 and 201516 in real terms Within the overall health budget
bull the revenue budget is planned to increase by 03 per cent between 201314 and 201415 and to increase by 06 per cent between 201415 and 201516 in real terms
bull the capital budget is planned to decrease by 389 per cent between 201314 and 201415 and to decrease by 240 per cent between 201415 and 201516 in real terms (Exhibit 8 page 32)
57 Healthcare inflation in the UK is higher than general inflation which has an impact on the health budget in real terms Over the last 20 years general inflation in the UK averaged just over two per cent a year while health service costs rose by 36 per cent a year39
32 |
Exhibit 8In the next two years the health budget will decrease by 09 per cent in real termsThe larger revenue budget will increase by almost one per cent while the smaller capital budget will decrease by 54 per cent
-5357
-2398
-3892
+031 +064 +095Revenue
Capital
CUMULATIVE
TOTAL
-093-104 +010
1314to
1415
1415to
1516
1314to
14151415
to1516
1314to
1516
Source Scottish Government Draft Budgets 201314 201415 and 201516
58 Longer-term forecasts to 201819 by the Office for Budget Responsibility show a real-terms reduction in total UK public sector expenditure of 07 per cent in both 201617 and 201718 before levels are maintained in 20181940 Reductions in spending at a UK level will affect the level of funding available in Scotland The Scottish Government will need to plan for health spending within an overall reducing budget
Part 2 Looking ahead | 33
Other cost pressures are likely to increase in future years59 There is likely to be an increase in contribution rates to the NHS Superannuation Scheme during 201415 The most recent actuarial funding valuation available for the scheme was at 31 March 2004 A funding valuation was carried out at 31 March 2008 but was suspended by HM Treasury prior to completion A new funding valuation was carried out in 201314 for the scheme as at 31 March 2012 and this will be incorporated in the NHS accounts for 201415 Employer contribution rates are expected to increase as a result of this valuation in order to ensure that contributions are large enough to meet the likely future costs of the pension scheme
60 A number of boards highlighted this as a financial risk in their LDPs NHS boards have assumed and are planning for pensions costs of approximately two per cent of their total pay bill but the extent of the increase is not yet known NHS boards will also face further costs due to changes in pension schemes that end the current arrangements under which members and their employers pay lower National Insurance contributions41 As a result of these changes pension scheme members and their employers will no longer pay reduced NI contributions from 6 April 2016
61 NHS boards have identified other future cost pressures including pay costs spending on drugs and the availability of new treatments Staff pay is the largest single item of expenditure for NHS boards and the Scottish Government has estimated that the pay bill will increase by around pound30 million per year from 201415 (not including additional pension costs)42 NHS boards are working with the Scottish Government to identify how they will fund these cost pressures NHS boards are considering how they can work together to provide services more efficiently for example exploring opportunities to provide more services on a regional basis
Changes in the population are increasing demand62 Demographic and other changes are increasing the pressures Scotlandrsquos population is ageing (Exhibit 9 page 34) Between 2012 and 2037
bull the percentage of the population aged 65 or over is projected to increase from 17 per cent (925751 people) to 25 per cent (1473158 people)
bull the percentage of the population aged 75 or over is projected to increase from eight per cent (418486 people) to 13 per cent (778746 people)
bull the number of people aged 100 years or older is projected to increase by 879 per cent from 792 to 775143
63 Older people are more likely to have long-term health problems that require care and in the absence of good community-based care that will increase the pressure on acute services The number of people aged over 65 attending AampE departments increased by 126 per cent over the past five years from 242677 attendances in 200809 to 273192 in 201213 Older people are more likely to be admitted to hospital from AampE in December 2013 60 per cent of AampE attendances for people aged over 65 resulted in admission to hospital compared with 23 per cent of patients aged under 6544
34 |
64 The number of people with long-term conditions such as diabetes is increasing and the number of long-term conditions that an individual may have increases with age Rates of dementia are also increasing and the number of people with dementia is estimated to double within the next 25 years45 The number of inpatient and day-case episodes for people aged 65 and over where the patient had a diagnosis of dementia increased by nearly 50 per cent between 2009 and 2013 from 21524 to 32205 Older people with dementia generally stay longer in hospital often due to the need for specialist care that delays their discharge Around half of long-stay residents in Scottish care homes have a diagnosis of dementia
Exhibit 9Scotlands population is ageingThe percentage of the population aged 75 and over is set to increase considerably over the next 25 years
65-74 yearsUnder 65 years 75-84 years 85 years and older
83
75
2610
912 5
Population
418486 2012
Estimated population
778746 2037
2012
2037
75 yrs +
86
Population
792 2012
Estimated population
7751 2037
100 yrs +
879
Note Due to rounding the total percentages add up to 101 per cent
Source Projected Population of Scotland (2012-based) National Records of Scotland 2013
Exhibit 9
Audit Scotland
Exhibit 9
Exhibit 9 background data
Part 2 Looking ahead | 35
65 Peoplersquos expectations of healthcare are rising in relation to access to services and treatments and the Scottish Government recognises this as another challenge for the NHS46 For example the main issues in orthopaedics affecting demand in addition to an increasing older population are higher patient expectations and improvements in technology and available procedures A wider range of procedures are now available and surgeons can carry out more complex procedures47
The Scottish Government has set out its long-term strategy for the NHS but boards do not yet have detailed plans in place
66 Pressures will continue to increase for the foreseeable future The Scottish Government recognises this and in 2011 it set out its 2020 Vision an overarching strategy for achieving sustainable quality in the delivery of healthcare services across Scotland in the context of the challenges facing the NHS48 The overall aim is that by 2020 everyone is able to live longer healthier lives at home or in a homely setting It is an ambitious policy that aims to prevent or improve poor health caused by lifestyle factors such as smoking alcohol and lack of exercise and move towards the NHS providing more care in community settings (Exhibit 10 page 36) In May 2013 the Scottish Government set out 12 priority areas for action in the form of a Route Map to the 2020 Vision
67 The NHS has already made improvements in health outcomes in the Scottish population The 2020 Vision has the potential to make further improvements in health outcomes and the quality of health and social care But achieving the vision will require major changes in the way that services are delivered and a significant shift of resources into more preventative and community-based services We have highlighted in previous reports that there is a lack of evidence of progress in moving resources and more care into the community49 In 200304 42 per cent of NHS spending for all age groups was on community services by 201112 this had increased to just 44 per cent and in 201213 it reduced to 43 per cent50 Between 200203 and 200910 council spending in real terms on social care services for older people increased by 37 per cent from pound098 billion to pound135 billion By 201213 this had fallen to pound129 billion a four per cent reduction from 20091051 The reasons for this lack of progress are complex but achieving the transformation required is made more difficult by the increasing pressures on acute care and by the continuing focus on short-term planning
68 From April 2016 health and social care services in Scotland will be integrated The Public Bodies (Joint Working) (Scotland) Act 2014 requires NHS boards and councils to establish new health and social care partnerships Under these arrangements NHS boards and councils will be required as a minimum to combine their budgets for adult social care adult primary healthcare and aspects of adult secondary healthcare It provides a good opportunity for NHS boards with their council partners to redirect resources and move towards more community-based and preventative care It will be challenging for NHS boards to make the scale of changes required over the next few years but critical if they are to meet the 2020 Vision Outcomes are being developed for integrated health and social care along with integration indicators for the new integration joint boards to report performance against
69 We have previously recommended that NHS boards need to increase their focus on longer-term financial planning Without this there is a risk that they will continue to take a short-term approach to managing the pressures they face at
36 |
Exhibit 10Aims of the Scottish Governments 2020 Vision for health and social careThe Scottish Government has set out an ambitious policy that will require a considerable move from care in settings like hospitals and care homes to more community-based and preventative care
Our vision is that by 2020 everyone is able to live longer healthier lives at home or in a homely setting
We will have a healthcare system where we have integrated health and social care a focus on prevention anticipation and supported self-management
When hospital treatment is required and cannot be provided in a community setting day-case treatment will be the norm
Whatever the setting care will be provided to the highest standards of quality and safety with the person at the centre of all decisions
There will be a focus on ensuring that people get back into their home or community environment as soon as appropriate with minimal risk of re-admission
Source A Route Map to the 2020 Vision for Health and Social Care Scottish Government May 2013
the expense of better options over the longer term NHS boards need to plan now for making considerable changes to the way they deliver services in the longer term to ensure they can deliver sustainable good-quality care to meet future increasing needs They need to set out how they will reshape services and provide high-quality care with the available funding staff and other resources Their longer-term financial planning should consider all the resources they need to provide integrated health and social care services to continue to meet future needs (Exhibit 11 page 37)
70 LDPs set out how each board plans to deliver the priorities for the NHS in Scotland They also form the basis for the Cabinet Secretaryrsquos annual reviews of each board In the past LDPs have focused predominantly on financial planning and meeting HEAT targets for the coming year rather than demonstrating how boards are planning to meet longer-term aims For 201415 the Scottish Government requires each board to include an improvement and co-production plan in their LDP outlining the actions the board is taking to deliver the 2020 Vision (Exhibit 12 page 38) We found that the 201415 LDPs include detail about what boards are currently doing but provide little information about how boards will deliver the 2020 Vision in a sustainable way supported by financial and workforce plans We would expect there to be more detail in the 201516 LDPs about how boards will work with their partners to shift more services into the community as they move towards health and social care integration
Planning needs to be underpinned by a better understanding of demand capacity and patient flows
71 Health and social care services form a complex system in which patient flows need to be understood and managed in order to have the right resources available when and where they are needed to meet demand These resources include the
Part 2 Looking ahead | 37
Exhibit 11A number of elements of long-term planning should underpin financial plansLong-term financial planning needs to set out how NHS boards will make the changes needed to meet future needs
Elements of longer-term planning
Detailed planning required
Future demand for health and social care
Model projected demand for care by taking into account the
bull numbers of patientsservice users expected to need services
bull demographic profile of the area
bull complexity of care that people will need
Compare this with current demand and short-term projections
Models of care Identify the models of care and shared objectives for the new health and social care partnerships required to meet the 2020 Vision and projected future demand for the following
bull hospitals bull community-based care bull home-based care
bull care in the community supported by technology such as telehealth and telecare
Workforce requirements
Identify the staff needed to provide these models of care taking into account
bull numbers and type of roles bull skills mix bull training bull location
Compare this with the current workforce make-up and location and short-term projections Workforce planning needs to be done in collaboration with the Scottish Government NHS Education for Scotland and training providers such as colleges
Location of care Identify the fixed assets needed to provide models of care in different locations including the following
bull buildings (hospitals and community) including the condition of existing buildings and costs of ongoing maintenance and any new buildings that are required
bull information technology including shared access to NHS and social care systems
bull broadband
bull transport for patients service users and staff
Compare this with current assets and short-term projections Plans need to ensure the infrastructure is in place to support moving more care into the community while ensuring hospitals are fit for purpose
Costs and funding
Financial planning to meet future needs by estimating the cost of
bull providing new models of care and for increased demand
bull providing more care in the community and in patientsusers homes
bull maintaining hospital services in line with future models of care
Use scenario planning with potential financial projections to ensure models of care are affordable and to identify potential funding gaps Establish plans for redirecting funding from hospitals to community to meet future needs while maintaining services This is likely to require double-running costs
Source Audit Scotland
38 |
Exhibit 12LDPs now include improvement and co-production plansNHS boards are required to set out their priority actions for delivering the 2020 Vision
Key elements of the plans are that they should
bull be transformational in nature and underpinned by workforce and finance planning
bull provide assurance that the five priorities for action set out in Everyone Matters 2020 Workforce Vision Implementation Framework (healthy organisational culture sustainable workforce capable workforce integrated workforce effective leadership and management) will be taken forward in a planned way
bull set out the priority actions the NHS board is taking across patient safety programmes of work the plans for spread and sustainability and the impact they are having on patient care
bull include the approach being taken to ensure that feedback on compliments concerns complaints and comments from patients their families and carers is being actively sought and used to improve services
bull set out actions and planned levels of improvement for unscheduled care across the NHS such as increased anticipatory care and support to help people manage their conditions and medicines including how hospitals GPs community teams the Scottish Ambulance Service and NHS 24 will work together
bull set out the actions the NHS board is progressing with its partners to prepare for health and social care integration
Source NHSScotland 2020 Local Delivery Plan Guidance Scottish Government November 2013
number of hospital beds outpatient clinics community services and trained staff The NHS needs a better understanding of its current capacity current and future demand and patient flows in order to inform the major changes to services that will be required to ensure they are sustainable and meet the long-term needs of the population
72 We analysed recent trends in healthcare activity population statistics and rates of conditions such as diabetes and dementia (Appendix 1 summarises our methodology) We looked at data for the previous five years where this is available and comparable in order to understand recent trends and identify where pressures are building This analysis identified some of the main pressures and highlights the complex and interrelated nature of the healthcare system The degree to which pressures impact on NHS boards hospitals and specialties varies but include
bull an ageing population and an increase in the number of older people with complex care needs
Part 2 Looking ahead | 39
bull more people living with long-term conditions and multiple conditions
bull more people seeking emergency and urgent care
bull more people being treated in outpatient and day-case settings
bull making sure hospital beds and staff are available at the time they are needed
bull more people experiencing a delay in their discharge from hospital
73 We have identified a number of lsquopinch pointsrsquo in the system (Exhibit 13 page 40) These particularly relate to
bull Hospital beds being available at the time when patients need them There has been an increase in the number of patients experiencing delays in being admitted from AampE and patients are not always cared for in the appropriate ward for their needs which has an impact on the quality of care they receive (known as boarding) These pinch points are related to how hospitals manage their beds and arrangements for discharging patients
bull More delayed discharges The number of patients delayed in hospital while waiting for services to be available in the community is increasing This has an impact on the quality of care and outcomes for the patients and it also means that beds are not available for other patients adding to the pressures on beds (paragraphs 35 and 36)
bull Increasing demand for outpatient appointments Demographic changes along with improvements in care and more procedures carried out in outpatient clinics rather than on an inpatient basis have increased demand for outpatient appointments Demand is increasing at a faster rate than the number of people seen in clinics meaning that waiting lists are growing and more people are waiting longer (paragraphs 33 and 34)
Inpatient care is changing and becoming more complex74 In recent years there has been a reduction in elective (planned) inpatient care as more planned care shifts to outpatients and day cases The number of patients admitted as emergencies for inpatient care has remained steady and the complexity of these cases has increased NHS boards need to ensure they have the right number of staffed beds available at the right time to deal with this changing demand They also need to plan for changes to services in the longer term including shifting more care into community settings
75 There has been a reduction in the number of hospital beds across Scotland Between 200809 and 201213 the average number of available staffed beds in acute specialties reduced by seven per cent (1144 beds) the number of acute surgical beds fell by 11 per cent (596 beds) and the number of acute medical beds fell by five per cent (313 beds) The main reason for this reduction is the growth in day surgery as more patients are treated as day cases and outpatients for example some eye procedures and diagnostic tests Between 200809 and 201213 the number of procedures carried out on an inpatient basis decreased by 18 per cent (418000 procedures in 201213)
40 |
Exhibit 13The NHS is facing increasing pressures from an ageing population and increasing demandThe health and social care system is complex
Notes 1 Community care data Care home and care at home ndash Censuses (March 2013 and March 2008) NHS 24 ndash NHS 24rsquos performance data
(201314 and 200809) Primary care contacts ndash ISD Scotland (201213 and 200809)2 AampE data Number of attendances and waits ndash ISD Scotland and Audit Scotland AampE data(201213 and 200809)3 Hospital data Inpatient daycase and outpatients ndash ISD Scotland (201213 and 200809) Waiting lists and number waiting over 12 weeks
ndash ISD Scotland (quarter ended March 2014 and March 2010) Occupied bed days for delayed dischargesndash ISD Scotland (201314 and 201213) The data is not available before 201213
4 Patients can also be admitted to hospital as emergencies without going through AampESource Audit Scotland
TELEHEALTH
TELECARE
+346 Wait for
a bed(37946)
bull Ageing populationbull Increase in complex needsbull Increase in multiple complex cases
DAY CASE
455800attendances+6
489898procedures+8
OUTPATIENT
47 millionattendances0
15 millionnew patient attendances
+2
380456procedures+108
+9 Delayed
dischargebed days
Self referral
CARE HOME
-2 36578residents
-10 1282homes
+29 1645 short-stayrespite residents
Preventative care self management treatment and care in the community
CARE AT HOME
Social care
-1160950people receiving home care
NHS 24
-9 14 millioncontacts
ACCIDENT amp EMERGENCY
16 millionattendances+3
HOSPITALCARE
OVERNIGHT INPATIENTS
720262patients admitted-3
417987procedures-18
23728avg staffed beds-11
Demand
Time delays
Change inlast 5 years
XX
KEY
+8
admitted to hospital
from AampE (361121)
PRIMARY CARE TEAMGP amp practice nurse
Community nursing AHPPharmacy Ophthalmology Mental health team
242 million contacts+4
+189 waitedgt4hrs
(104000) Plannedcare
421157 occupied bed days
(changebetweenMar 2010
amp Mar 2014)
(changebetweenMar 2010
amp Mar 2014)
+4200
number waiting
gt12 weeks (157 to 6754)
bull The number of older people attending AampE has risen from 242677 patients aged over 65 in 200809 to 273192 patients aged over 65 in 201213 (126 increase)
bull In December 201360 per cent of AampE attendances for people aged over 65 resulted in admission to hospital compared with 23 per cent of patients aged under 65
bull Between 200809 and 201213 there was an 11 rise in the number of bed days occupied by patients aged 80 and over who had three or more emergency admissions during the year
+376
number waiting
gt12 weeks (162 to 771)
+34
number onwaiting list (252009)
-7
number onwaiting list
(50898)
Older people
(201314)
(change betweenMar 2013 amp Mar 2014)
Part 2 Looking ahead | 41
76 The average (mean) length of stay for inpatients has also been reducing Ensuring that patients stay in hospital for no longer than necessary is important since it helps them stay active remain independent and reduces the chance of acquiring a healthcare-associated infection Between 200809 and 201213 the average length of stay fell from 73 days to 65 days for elective (planned) inpatients and from 38 to 31 days for emergency inpatients
77 There is evidence that the complexity of care for patients admitted as emergencies is increasing There has been a slight growth in the number of days that hospital beds are occupied by emergency admissions for people admitted three or more times during one year (one per cent between 200809 and 201213) This is more noticeable among older people (aged 80 and over) who are likely to have more long-term conditions and complex needs Between 200809 and 201213 there was an 11 per cent rise in the number of bed days occupied by patients in this age group who had three or more admissions during the year The increase in the older population suggests that this trend will continue unless there are significant shifts to more anticipatory and preventative care in the community
NHS boards need to improve bed planning and management78 There are a number of indicators of problems with bed planning and management The number of people delayed in AampE while waiting for a hospital bed has increased fourfold since 200809 This is the most common reason for patients waiting more than four hours in AampE The reasons for this are complex and linked to beds not being available at the time when they are needed The day and time that patients are discharged from wards affect the flow of patients throughout the hospital Attendances at AampE departments are highest on Mondays and Tuesdays Delays in AampE due to people waiting for a bed in hospital are more likely on these days since fewer inpatients are discharged at weekends Discharges from hospital generally take place in the afternoon Across Scotland lsquowait for a bedrsquo delays for AampE patients are highest at 6pm The Scottish Government has announced plans to provide more services at weekends and in the evenings to improve the flow of patients and reduce delays Any knock-on effects in primary and social care should be considered as part of these plans In our recent report on AampE performance we highlighted the work that NHS Tayside is doing to improve the quality of care for AampE patients by looking at patient flow (Case study 6 page 42)
79 Boarding is another indicator that a hospital is not organising its capacity to match demand This can happen when there are not enough beds available in a particular specialty when patients need them for example when new patients are admitted as emergencies Instead patients are admitted or transferred to a ward of a different specialty Research has shown that this practice may mean that less specialist care is provided since staff without the appropriate skills are looking after patients Boarding can also significantly increase patientsrsquo length of stay and contribute to other complications resulting from delayed assessment and treatment including developing blood clots and healthcare-associated infections52
80 Boarding used to be more common in winter when demand traditionally increases due to seasonal infections Research by the Royal College of Physicians of Edinburgh (RCPE) suggests that it is becoming an all-year problem In an RCPE survey conducted in May 2012 80 per cent of respondents reported that boarding now happens all year round in Scottish hospitals and 71 per cent said that boarding levels in Scotland are high and increasing The RCPE and the
42 |
Case study 6Improving patient flow in AampE in Ninewells Hospital
Our AampE report identified a number of factors that have helped Ninewells Hospital in NHS Tayside improve the way that patients move through the healthcare system and meet the four-hour waiting time target for AampE These include
bull having senior clinical decision-makers available at all times which means that patients get the right type of care quickly
bull starting the process of planning for patients to be admitted from AampE early to avoid delays in patients waiting for a bed
bull a policy that allows GPs to refer emergency patients directly to wards rather than through AampE first
bull a policy of signposting patients attending AampE to other services such as their GP where appropriate
Source Accident and Emergency performance update Audit Scotland May 2014 (Case study 1 pages 35-36)
Scottish Government are examining the extent of boarding in Scottish hospitals the effect it has on patients and ways to reduce it Results from this work should be available in late 2014 or early 2015
81 The number of emergency admissions over a period of time is reasonably predictable based on previous activity levels On a daily and weekly basis elective admissions can be much more variable than emergency admissions Exhibit 14 (page 43) provides an example of the pattern of elective and emergency admissions to General Surgery on a daily basis in one of Scotlandrsquos district general hospitals and on a weekly basis in another hospital
82 NHS boards need to understand the differing patterns of emergency and elective admissions and actively plan and manage these two flows in a coordinated way Although the number of emergency admissions is reasonably predictable the time of day at which patients arrive at hospital is less so Managing these two flows together means more than ensuring average capacity meets average demand NHS boards also need to ensure that staffing levels are flexible enough to cope with varying demand and that sufficient capacity is available at the right time This means having staff who are trained and equipped to treat increasing numbers of older people with multiple conditions and complex needs
83 A lot of variation in elective admissions can be due to NHS boards not having sufficient capacity to treat both elective and emergency admissions at the time that patients present This includes the availability of beds in appropriate wards sufficient staff with the necessary skills equipment and access to operating theatres This can mean having to cancel planned admissions and rearrange for patients to attend at a later date However data on the overall proportion of inpatient cases that are cancelled has not been available nationally since October 2012 This is due to changes to NHS boardsrsquo electronic systems for managing waiting lists following the introduction of the TTG In September 2012
Part 2 Looking ahead | 43
Exhibit 14Variability in elective and emergency admissions to hospital 201314Elective admission patterns can be more variable than emergency admissions both from day to day (Hospital A) and from week to week (Hospital B)
69 per cent of inpatient and day-case appointments were cancelled across Scotland We have previously highlighted that NHS boards need to ensure they are monitoring this locally to understand any problems with capacity and inform how they manage demand53
84 The Health Foundation worked with NHS trusts in England to look at the relationship between capacity and demand This was based on the premise that the mismatch between the timing of capacity such as when staff are available and when patients present to a service contributes more to delays and inefficiencies than overall levels of demand or resources Key findings from this work were that using systems improvement methods such as detailed data
44 |
analysis and bringing together stakeholders and patients across the hospital system to develop an informed understanding of how care pathways really work can improve patient flow patient safety and make significant cost-savings54
85 The Scottish Government is working with boards over the next year to help them manage beds better in the short term including developing a bed-planning toolkit This will also help them to plan for the number and type of beds required in the longer term reflecting the new models of care that will be needed The toolkit will be piloted in 2015 and include scenario planning based on assumptions of demand admission rates and length of stay taking into account demographic patterns and more care being provided in the community Extensive work has also started in 2014 looking at patient flow in boards and the Scottish Government is leading an Outpatients Primary and Community Care Programme that aims to help NHS boards move more care from hospitals into the community and peoplersquos homes
The Scottish Government is working with NHS boards to improve patient flow
86 As well as having sufficient capacity to deal with demand NHS boards need to make sure that the flow of patients through the hospital and back into the community is as efficient as possible The Scottish Governmentrsquos Quality and Efficiency Support Team (QuEST) is working with four NHS boards to pilot an approach to improve patient flow (NHS Forth Valley NHS Borders NHS Greater Glasgow and Clyde and NHS Tayside) drawing on evidence from the Institute of Healthcare Optimisation in America This is a significant piece of work looking at individual hospitals within each board area as a whole system to understand how patients flow through the system and the factors that can influence this NHS Forth Valley started testing this approach in 2014 and the lessons learned will be shared with other boards as it is rolled out over the next three years The Scottish Government will evaluate the pilot as it progresses and also plans to commission an external evaluation
87 To help improve patient flow and avoid delays in patients getting the appropriate care or being discharged from hospital the Scottish Government also plans to provide more services at weekends and out of hours This includes hospital physiotherapy and pharmacy services An expert group met for the first time in April 2014 The Scottish Government has said there will be no additional funding for this initiative which will require staff to be available at additional times instead NHS boards will be expected to make better use of existing resources
88 Telehealth and telecare offer the potential to care for more people at home or closer to home supported by technology This includes things like equipment for people to monitor their own health at home with their results reviewed by a clinician remotely and alarms and sensors to help people to stay at home more independently These innovations support the 2020 Vision of providing care closer to home potentially improving outcomes for users and avoiding people needing more intensive care in the community or in hospital55 In 2012 the Scottish Government set out its aim that telehealth and telecare will be provided for an additional 300000 people by March 2015 as a milestone towards achieving the 2020 Vision56 It is focusing on rolling out a number of telehealth and telecare projects at a larger scale than the previous smaller pilots Both the Scottish Government and the European Union have provided funding for telehealth and telecare projects
Endnotes | 45
Endnotes
1 The total budget for the Scottish Governmentrsquos Health and Wellbeing Portfolio includes the budgets for health sport and equalities
2 2020 Vision ndash Strategic Narrative Scottish Government September 2011
3 In this report we refer to NHS National Services Scotland the Mental Welfare Commission and Healthcare Improvement Scotland as special health boards
4 Three special boards revenue budgets increased in 201314 National Waiting Times Centre (114 per cent) Scottish Ambulance Service (01 per cent) and NHS 24 (05 per cent)
5 The revenue budget is known as the Revenue Resource Limit (RRL) and the capital budget is known as the Capital Resource Limit (CRL)
6 NHS financial performance 201213 (PDF) Audit Scotland October 2013
7 Response from the Scottish Government to the Public Audit Committee dated 1 August 2014
8 These reports were prepared under Section 22 of the Public Finance and Accountability (Scotland) Act 2000 and are published on Audit Scotlandrsquos website
9 Recurring savings are savings that once achieved recur year-on-year from that date for example savings on staff costs as a result of streamlining services Non-recurring savings only happen once for example not filling a vacancy on a temporary basis
10 NHS Ayrshire and Arran Borders Dumfries and Galloway Highland Lanarkshire Orkney Shetland National Waiting Times Board NHS 24 NHS Education for Scotland and State Hospital
11 Annual State of NHSScotland Assets and Facilities Report for 2012 Scottish Government December 2012
12 Annual State of NHSScotland Assets and Facilities Report for 2013 Scottish Government December 2013
13 The Scottish Government has defined high-risk backlog maintenance as work that must be addressed as an urgent priority Significant risk is the next highest priority category of backlog maintenance and requires expenditure in the short term ndash Correspondence from the Scottish Government to the Public Audit Committee dated 16 January 2013
14 Backlog maintenance reduced in (level of backlog at 2013 in brackets) NHS Ayrshire and Arran (pound77m) Dumfries and Galloway (pound51m) Forth Valley (pound13m) Grampian (pound159m) Greater Glasgow and Clyde (pound167m) Lanarkshire (pound57m) Lothian (pound96m) Orkney (pound95m) Shetland (pound38m) Tayside (pound50m) National Waiting Times Centre (pound26m) NHS National Services Scotland (pound26m) NHS 24 (pound0m) and State Hospital (pound03m) It increased in NHS Borders (pound65m) Fife (pound70m) Highland (pound83m) Western Isles (pound32m) NHS Education for Scotland (pound03m) NHS Health Scotland (pound01m) and the Scottish Ambulance Service (pound33m) NHS Highland has reported that one reason for its backlog maintenance increasing is that a number of properties transferred from the council to the board in 2012 as part of health and social care integration
15 Annual State of NHSScotland Assets and Facilities Report for 2013 Scottish Government December 2013
16 Outline Business Case for a Care Village in Stirling (A Health amp Social Care Partnership Venture) NHS Forth Valley Stirling Council and Forth Valley College 2 December 2013
17 The Healthcare Quality Strategy for NHSScotland Scottish Government May 2010
18 Scottish National Point Prevalence Survey of Healthcare Associated Infection and Antimicrobial Prescribing 2011 Health Protection Scotland April 2012 Rates of individual HAIs (MRSA and Clostridium difficile) have continued to decrease (Scotland Performs Scottish Government website)
19 Heart disease statistics update ISD Scotland January 2014
20 Scottish Inpatient Patient Experience Survey 2014 Scottish Government August 2014
22 Depending on the target this may be performance for the month ending March 2014 or for the quarter ending March 2014 The notes in Exhibit 5 give details for each target
46 |
23 ISD Waiting Times Warehouse data August 2014
24 The National Waiting Times Board a special NHS board met the target for three months in 201314
25 These figures are for standard delayed discharges They exclude delayed discharges recorded under lsquocode 9rsquo for patients with complex needs This includes patients delayed due to waiting for a place in a high-level needs specialist facility where no facilities exist or where an adult may lack capacity under adults with incapacity legislation
26 ISD calculates the cost of days lost to delayed discharges using a cost per day that excludes costs not incurred by delayed patients such as costs related to admissions and allows for the reduced medical and other clinical care that is required for delayed patients This average cost is around pound185 per day
27 These figures are for standard delayed discharges
28 These are called Day of Care Surveys
29 Scottish Inpatient Patient Experience Survey 2014 Volume 1 National Results Scottish Government August 2014
30 Reshaping care for older people (PDF) Audit Scotland February 2014 (Case study 2 page 30)
31 Scottish Government allocation letters to NHS boards 201314
32 NHS financial performance 201213 (PDF) Audit Scotland October 2013
33 Using locum doctors in hospitals (PDF) Audit Scotland June 2010
34 Additional 2020 Local Delivery Plan Guidance Scottish Government December 2013
35 Spending increased slightly in NHS Ayrshire and Arran (15 per cent) NHS Tayside (07 per cent) and NHS Western Isles (13 per cent)
36 NHS Forth Valley NHS Greater Glasgow and Clyde and NHS Tayside
37 NHS Western Isles and NHS 24
38 Management of patients on NHS waiting lists (PDF) Audit Scotland February 2013
39 Why is health care inflation greater than general inflation Charlesworth A Journal of Health Services Research and Policy June 2014
40 Economic and Fiscal Outlook ndash March 2014 Office for Budget Responsibility March 2014
41 Under the current state pension arrangements members of the NHS Superannuation Scheme pay a reduced rate of National Insurance (NI) Their employers the NHS boards also contribute reduced NI payments on their behalf This is because it is assumed that the scheme members have opted not to contribute to or claim the additional state pension (an additional element paid on top of the basic state pension) Reforms mean the additional state pension will no longer exist and everyone will receive a flat rate basic state pension
42 Scottish Government budget 201415 ndash Performance evaluation material for Parliamentary Committees Scottish Government September 2013
43 Projected Population of Scotland (2012-based) National Records of Scotland 2013
44 Accident and Emergency performance update (PDF) Audit Scotland May 2014
45 Scotlandrsquos National Dementia Strategy Scottish Government 2010
46 The Healthcare Quality Strategy for NHSScotland Scottish Government May 2010
47 Review of orthopaedic services (PDF) Audit Scotland March 2010
48 2020 Vision ndash Strategic Narrative Scottish Government September 2011
49 Reshaping care for older people (PDF) Audit Scotland February 2014 Review of Community Health Partnerships (PDF) Audit Scotland June 2011 Overview of the NHS in Scotlandrsquos performance 200809 (PDF) Audit Scotland December 2009 Financial overview of the NHS in Scotland 200708 (PDF) Audit Scotland December 2008
50 Audit Scotland analysis of NHS Costs Book data Spending on community family health services and resource transfer as stated in the costs book has been counted as being spent in the community
51 Figures in real terms 201213 prices Audit Scotland analysis of Local Financial Return statistics 200203 ndash 201213
52 Royal College of Physicians of Edinburgh press release June 2012
53 Management of patients on NHS waiting lists audit update (PDF) Audit Scotland December 2013
54 Improving patient flow How two trusts focused on flow to improve the quality of care and use available capacity effectively The Health Foundation April 2013
55 A review of telehealth in Scotland (PDF) Audit Scotland October 2011
56 A National Telehealth and Telecare Delivery Plan for Scotland to 2015 Scottish Government 2012
Appendix 1 Audit methodology | 47
Appendix 1Audit methodology
Methodology for analysing demand capacity and patient flow
To get a better understanding of some of the pressures on NHS services we carried out data analysis looking at
bull the demand for healthcare services
bull the capacity of the NHS to provide services
bull the flow of patients through the healthcare system
This is the first stage of this work and we have presented some high-level findings throughout the report We will be carrying out further analysis looking in more detail at hospital and specialty level data and daily activity We will publish a briefing paper on this analysis in early 2015
For this report we looked at the NHS as a whole system We tried to identify some of the main pressures facing NHS boards and how a pressure in one part of the system can affect another part of the system We have summarised these pressures in Exhibit 13 (page 40) Throughout the report we explain some of these in more detail and how this affects patients and services
In addition to drawing on information from our previous reports we analysed a range of published data and also requested some bespoke analysis from ISD Scotland This includes the following data
bull ISD Scotland
ndash acute hospital inpatient day-case and outpatient activity (admissions discharges average length of stay multiple emergency admissions average number of staffed beds bed occupancy rates)
ndash number of procedures carried out in hospitals
ndash waiting times for inpatient and day-case treatment and outpatient clinics
ndash hospital workforce numbers and vacancies
ndash number of general practice contacts with GPs and practice nurses
ndash Quality and Outcomes Framework (QOF) prevalence rates for a number of health conditions
ndash number of delayed discharges and occupied bed days
ndash care home census
bull Scottish Government community healthcare assessments data
bull National Records of Scotland population statistics
bull Alzheimer Scotland information
NHS in Scotland 201314This report is available in PDF and RTF formats along with a podcast summary at wwwaudit-scotlandgovuk
If you require this publication in an alternative format andor language please contact us to discuss your needs 0131 625 1500 or infoaudit-scotlandgovuk
For the latest news reports and updates follow us on Twitter or subscribe to our email delivery service
AuditScotland
Subscribe to updates
ISBN 978 1 909705 49 4 AGS20146
Audit Scotland 110 George Street Edinburgh EH2 4LHT 0131 625 1500 E infoaudit-scotlandgovuk wwwaudit-scotlandgovuk
This publication is printed on 100 recycled uncoated paper
Key facts
Summary
Key messages
Recommendations
About the audit
Part 1 The NHS in Scotland is facing significant pressures
Key messages
NHS budgets are under pressure
Exhibit 1
All NHS boards met their financial targets in 201314 but some are facing increasing difficulty in achieving them
Exhibit 2
Case study 1
Case study 2
Case study 3
Five boards continue to rely on high levels of non-recurring savings
Exhibit 3
NHS boards are making less progress than expected on reducing backlog maintenance
The annual financial target for capital spending makes it difficult to plan longer-term projects
Exhibit 4
There have been improvements in the quality of healthcare
Performance against waiting time targets is showing increasing signs of pressure
Exhibit 5
Case study 4
Exhibit 6
There is growing evidence of staff pressures
Exhibit 7
Spending on private sector healthcare reduced in 201314
Most boards do not consider integrated performance reports
Case study 5
Part 2 Looking ahead
Key messages
The NHS will continue to face increasing pressures
Exhibit 8
Exhibit 9
The Scottish Government has set out its long-term strategy for the NHS but boards do not yet have detailed plans in place
Exhibit 10
Planning needs to be underpinned by a better understanding of demand capacity and patient flows
Exhibit 11
Exhibit 12
Exhibit 13
Case study 6
Exhibit 14
The Scottish Government is working with NHS boards to improve patient flow
Endnotes
Appendix 1 Audit methodology
NHS in Scotland 201314
Exhibit 9
Scotlands population is ageing
2012
2037
Population
Percentage of population
Estimated population
Percentage of estimated population
Under 65 years
4387849
83
4307213
75
65-74 years
507265
10
694412
12
75-84 years
309244
6
504249
9
85 years and older
109242
2
274497
5
Note Due to rounding the total percentages add up to 101 per cent
Source Projected Population of Scotland (2012-based) National Records of Scotland 2013
NHS in Scotland 201314
Exhibit 6
Number of delayed discharges and occupied bed days 2012-2014
Number of bed days occupied by delayed discharges
Number of delayed discharges
July 2012
90425
778
October 2012
95527
835
January 2013
99198
711
April 2013
101534
621
July 2013
96448
698
October 2013
99815
781
January 2014
107076
908
April 2104
117818
791
Note The number of delayed discharges refers to all patients who experienced a delay of any length It excludes code 9 patients with complex needs
Source ISD Scotland
NHS in Scotland 201314
Exhibit 3
Recurring and non-recurring savings
Territorial boards
Percentage recurring savings
Percentage non-recurring savings
201213
NHS Highland
45
55
201314
38
62
201213
NHS Orkney
69
31
201314
41
59
201213
NHS Borders
65
35
201314
48
52
201213
NHS Tayside
44
56
201314
50
50
201213
NHS Shetland
80
20
201314
52
48
201213
NHS Lanarkshire
91
9
201314
61
39
201213
NHS Ayrshire and Arran
95
5
201314
67
33
201213
NHS Fife
53
47
201314
69
31
201213
NHS Western Isles
71
29
201314
73
27
201213
NHS Lothian
70
30
201314
85
15
201213
NHS Dumfries and Galloway
96
4
201314
94
6
201213
NHS Grampian
87
13
201314
97
3
201213
NHS Forth Valley
78
22
201314
100
0
201213
NHS Greater Glasgow and Clyde
100
0
201314
100
0
Special boards
Percentage recurring savings
Percentage non-recurring savings
201213
The State Hospital
73
27
201314
59
41
201213
National Waiting Times Centre
87
13
201314
69
31
201213
Healthcare Improvement Scotland
83
17
201314
83
17
201213
NHS Education for Scotland
86
14
201314
84
16
201213
NHS 24
100
0
201314
93
7
201213
Scottish Ambulance Service
96
4
201314
98
2
201213
NHS Health Scotland
100
0
201314
100
0
201213
NHS National Services Scotland
100
0
201314
100
0
Source NHS boards financial performance returns March 2014 NHS Orkney updated its savings information in July 2014
NHS in Scotland 201314
Exhibit 3
Recurring and non-recurring savings
Territorial boards
Percentage recurring savings
Percentage non-recurring savings
201213
NHS Highland
45
55
201314
38
62
201213
NHS Orkney
69
31
201314
41
59
201213
NHS Borders
65
35
201314
48
52
201213
NHS Tayside
44
56
201314
50
50
201213
NHS Shetland
80
20
201314
52
48
201213
NHS Lanarkshire
91
9
201314
61
39
201213
NHS Ayrshire and Arran
95
5
201314
67
33
201213
NHS Fife
53
47
201314
69
31
201213
NHS Western Isles
71
29
201314
73
27
201213
NHS Lothian
70
30
201314
85
15
201213
NHS Dumfries and Galloway
96
4
201314
94
6
201213
NHS Grampian
87
13
201314
97
3
201213
NHS Forth Valley
78
22
201314
100
0
201213
NHS Greater Glasgow and Clyde
100
0
201314
100
0
Special boards
Percentage recurring savings
Percentage non-recurring savings
201213
The State Hospital
73
27
201314
59
41
201213
National Waiting Times Centre
87
13
201314
69
31
201213
Healthcare Improvement Scotland
83
17
201314
83
17
201213
NHS Education for Scotland
86
14
201314
84
16
201213
NHS 24
100
0
201314
93
7
201213
Scottish Ambulance Service
96
4
201314
98
2
201213
NHS Health Scotland
100
0
201314
100
0
201213
NHS National Services Scotland
100
0
201314
100
0
Source NHS boards financial performance returns March 2014 NHS Orkney updated its savings information in July 2014
NHS in Scotland 201314
Exhibit 3
Recurring and non-recurring savings
Territorial boards
Percentage recurring savings
Percentage non-recurring savings
201213
NHS Highland
45
55
201314
38
62
201213
NHS Orkney
69
31
201314
41
59
201213
NHS Borders
65
35
201314
48
52
201213
NHS Tayside
44
56
201314
50
50
201213
NHS Shetland
80
20
201314
52
48
201213
NHS Lanarkshire
91
9
201314
61
39
201213
NHS Ayrshire and Arran
95
5
201314
67
33
201213
NHS Fife
53
47
201314
69
31
201213
NHS Western Isles
71
29
201314
73
27
201213
NHS Lothian
70
30
201314
85
15
201213
NHS Dumfries and Galloway
96
4
201314
94
6
201213
NHS Grampian
87
13
201314
97
3
201213
NHS Forth Valley
78
22
201314
100
0
201213
NHS Greater Glasgow and Clyde
100
0
201314
100
0
Special boards
Percentage recurring savings
Percentage non-recurring savings
201213
The State Hospital
73
27
201314
59
41
201213
National Waiting Times Centre
87
13
201314
69
31
201213
Healthcare Improvement Scotland
83
17
201314
83
17
201213
NHS Education for Scotland
86
14
201314
84
16
201213
NHS 24
100
0
201314
93
7
201213
Scottish Ambulance Service
96
4
201314
98
2
201213
NHS Health Scotland
100
0
201314
100
0
201213
NHS National Services Scotland
100
0
201314
100
0
Source NHS boards financial performance returns March 2014 NHS Orkney updated its savings information in July 2014
14 |
Case study 2Financial management at NHS Orkney
In 201314 NHS Orkney required brokerage of pound1 million from the Scottish Government to break even This was largely due to hiring locum doctors to cover vacant medical posts
Throughout the year NHS Orkney was reporting an overspend against its revenue budget to its Finance and Performance Committee and this increased considerably over the second half of the financial year The board did not have detailed plans for how it was going to bridge the gap between its ongoing overspend position and its forecast break-even position at the year-end or provide reports to its Board of directors about how it would achieve this We were informed that officers discussed actions with Board members
NHS Orkney approached the Scottish Government in February 2014 to request brokerage of pound075 million This was later revised to pound1 million in March 2014 The Scottish Government has agreed that the board does not need to start repaying the total amount of brokerage received of pound406 million (including brokerage received in previous years) until 201617 (Exhibit 2 page 12) This is when the board should receive additional funding to take it closer to its target funding allocation (paragraph 13)
During the audit of the boardrsquos 201314 annual accounts the auditor identified a significant error relating to accounting entries associated with the five-yearly revaluation of its land and buildings during 201314 Due to a lack of capacity within NHS Orkneys finance team staff from NHS Fife assisted the board in resolving this issue The auditor has expressed some concern about the capacity of the finance team given the pressures facing the board
In recent years NHS Orkney has relied on non-recurring savings to break even (Exhibit 3 page 17) In 201314 it achieved pound042 million recurring savings against a target of pound103 million (41 per cent of the target) The boards financial plans for 201415 also rely on non-recurring savings It plans to make over 66 per cent of its planned savings on a non-recurring basis due to the non-recurring nature of the pressures facing the board such as using locum and agency staff until permanent staff are recruited Taking into account the need to continue to deliver savings and to repay brokerage the auditor has highlighted that delivering a break-even position in the coming years will be challenging for the board There are specific pressures that may affect NHS Orkneys ability to achieve the savings required for longer-term sustainability particularly workforce pressures and associated costs of hiring locum doctors Between 201213 and 201314 the boards spending on locum doctors increased by 30 per cent The board recruited a number of staff to key posts in 201314 but it has underlying recruitment problems and has not been able to fill some posts despite several recruitment campaigns Continued reliance on locum doctors will have a significant impact on its plans to achieve savings
The Chief Executive asked the boardrsquos internal auditor to undertake a detailed review of the boardrsquos 201314 financial position This includes an examination of the boardrsquos approach to budget-setting and in-year financial management The review is now complete and the board is developing an action plan
Source NHS Orkney Annual Audit Report 201314
Part 1 The NHS in Scotland is facing significant pressures | 15
Case study 3NHS 24s Future Programme
NHS 24 planned to implement its Future Programme in September 2013 This includes delivering new technology that is central to NHS 24 improving its core telephone and online services for patients NHS 24 also expected the new application to deliver financial savings NHS 24 has delayed implementation as it considers that the new application currently developed does not meet its patient safety requirements
The delay in implementing the new system has led to additional costs being incurred The total cost of the project to date is pound38 million considerably more than the original business case of pound296 million The board has estimated that it will incur further additional costs of pound146 million between 201415 and 201516 to achieve an acceptable solution This includes potential new investment in developing the IT system the costs of continuing to maintain the current system during the delay and failing to achieve savings that were expected as a result of the new system
By the end of 201213 the Scottish Government had provided NHS 24 with brokerage of pound169 million and pound08 million in revenue funding to fund the Future Programme The boards financial plan for 201314 included agreed brokerage of pound17 million to support what was planned to be the final year of implementing the Future Programme Due to the delays and ongoing problems implementing the new IT system the Scottish Government agreed to provide a further pound22 million brokerage taking the total provided in 201314 to pound39 million NHS 24 was due to repay the brokerage over three years from 201415 but the Scottish Government has agreed that this can be postponed to start in 201516 (Exhibit 2 page 12)
NHS 24 has drafted a five-year financial plan for 201415 onwards This projects a break-even revenue position for the first four years of the plan and a small surplus position in year five The plan has factored in the financial implications of resolving the issues with the Future Programme and the board will update this on an ongoing basis as the situation evolves The auditor has highlighted that the achievement of financial targets is likely to remain a high risk for the board given the extent of the issues that need to be resolved and the requirement to repay brokerage in future years
NHS 24 has kept the Scottish Government informed about the problems with the Future Programme The board and the Scottish Government jointly commissioned an independent review and NHS National Services Scotland has also recently provided additional support to NHS 24 through contract management and technical specialists The board is continuing to work with the suppliers of the new IT system on resolving the issues
The board has ensured that the current IT systems can be maintained in a safe and reliable manner so that services for patients are not affected
Source NHS 24 Annual Audit Reports 201213 and 201314
16 |
Four NHS boards are still receiving less than their target funding allocation13 The Scottish Government uses a formula developed by the National Resource Allocation Committee (NRAC) to allocate funding to territorial boards The formula has been in place since 200910 and the Scottish Government is aiming for all NHS boards to be within one per cent of their target allocations by 201617 Territorial boards receive an increase in funding each year however some boardsrsquo allocations are below the amount proposed by the formula Four boards were more than one per cent below their target allocations in 201314 and 201415
bull NHS Orkney -122 per cent (pound48 million) in 201314 -111 per cent (pound45 million) in 201415
bull NHS Grampian -51 per cent (pound399 million) in 201314 -37 per cent (pound302 million) in 201415
bull NHS Highland -22 per cent (pound113 million) in 201314 -23 per cent (pound123 million) in 201415
bull NHS Lanarkshire -15 per cent (pound127 million) in 201314 -17 per cent (pound153 million) in 201415
14 Receiving funding that is below their target NRAC allocation may have contributed to financial difficulties in NHS Highland and NHS Orkney Both boards broke even in 201314 using unsustainable methods specifically brokerage from the Scottish Government and high levels of non-recurring savings However the level of NRAC funding is not the only factor causing financial difficulties at NHS Highland and NHS Orkney We have identified concerns about financial management at these boards NHS Grampian and NHS Lanarkshire also received funding allocations of more than one per cent below their target NRAC allocations NHS Grampian only met two of the eight waiting time targets and the number of its patients with a delayed discharge increased (Exhibit 5 page 23)
Five boards continue to rely on high levels of non-recurring savings
15 Boards are required to make efficiency savings of three per cent against their revenue budgets and had forecast savings of pound2678 million in 201314 The actual savings achieved totalled pound2749 million (pound2447 million by territorial boards and pound302 million by special boards) All boards met their savings targets except NHS Western Isles which was pound30000 (16 per cent) below its target NHS boards retain savings made locally as part of their overall financial planning to help balance their budgets
16 Some boards are still relying on a high percentage of non-recurring savings (Exhibit 3 page 17) These are savings that are only made for one year rather than savings that the board will continue to make every year9 It can be appropriate to have some non-recurring savings but it is important that the majority of savings are recurring to ensure the sustainability of the boards financial position and to reduce the risk of not achieving savings targets in future years We have highlighted this as a risk in our reports over the last two years and the risk still remains The area that contributed most to NHS boardsrsquo savings was productivity NHS boards made total savings of pound1141 million in this area against a forecast pound1027 million However 26 per cent of these savings were non-recurring compared with a forecast of 14 per cent This suggests that these
Part 1 The NHS in Scotland is facing significant pressures | 17
Exhibit 3Recurring and non-recurring savingsA number of NHS boards relied on a high level of non-recurring savings in 201314 and 11 boards made higher levels of non-recurring savings than in 201213
RecurringNon-recurring
201213 201314
NHS Orkney
Territorial boards
Special boards
NHS Highland NHS Borders NHS Tayside
NHS Shetland NHS Lanarkshire NHS Ayrshire and Arran NHS Fife
NHS Western Isles NHS Lothian NHS Dumfries and Galloway NHS Grampian
NHS Forth Valley
The State HospitalNational
Waiting Times CentreHealthcare
Improvement ScotlandNHS Education
for Scotland
NHS 24Scottish
Ambulance ServiceNHS Health
ScotlandNHS National
Services Scotland
NHS Greater Glasgow and Clyde
RecurringNon-recurring
1213 1314 1213 1314 1213 1314 1213 1314
1213 1314 1213 1314 1213 1314 1213 1314
1213 1314 1213 1314 1213 1314 1213 1314
1213 1314 1213 1314
1213 1314 1213 1314 1213 1314 1213 1314
1213 1314 1213 1314 1213 1314 1213 1314
Source NHS boards financial performance returns March 2014 NHS Orkney updated its savings information in July 2014
Exhibit 3
Audit Scotland
Exhibit 3
Exhibit 3 background data
Exhibit 3
kwalker
Sticky Note
Unmarked set by kwalker
Exhibit 3
18 |
savings were the result of short-term initiatives rather than changing the way that services are provided in order to improve productivity This is similar to last year when 28 per cent of productivity savings were non-recurring higher than forecast The difficulty NHS boards have achieving recurring productivity savings is another strain on them and adds to their financial pressures for the coming year
17 Seven territorial and four special boards had higher overall levels of non-recurring savings in 201314 than in the previous year10 Five boards reported a particularly high percentage of non-recurring savings
bull NHS Highland (62 per cent)
bull NHS Orkney (59 per cent)
bull NHS Borders (52 per cent)
bull NHS Tayside (50 per cent)
bull NHS Shetland (48 per cent)
18 These boards will have to find further savings in future years on top of the annual savings target This position is not sustainable especially since boards are required to continue to make three per cent savings from 201415
19 NHS boards set out their financial projections up to five years ahead in their Local Delivery Plans (LDPs) showing expected funding projected expenditure and the savings required each year to close the gap between income and expenditure For 201415 NHS boardsrsquo detailed financial planning is still limited mainly to the first year of the LDP Across the NHS
bull six per cent of the required savings for 201415 are unidentified
bull over two-thirds of the amount of savings are unidentified for the following four years
bull five NHS boards have not identified the breakdown of the amount of their savings after 201415 (Fife Forth Valley Greater Glasgow and Clyde Lothian and Western Isles)
NHS boards are making less progress than expected on reducing backlog maintenance
20 Further cost pressures arise from the backlog of maintenance required to ensure that hospitals and other buildings are fit for purpose In 2012 the Scottish Government forecast that the cost of this backlog would decrease by pound174 million by 2013 from pound948 million to pound774 million11 The actual reduction was pound90 million to pound858 million12 The high-risk backlog reduced to pound96 million pound21 million less of a reduction than anticipated The significant-risk backlog rose from pound265 million to pound275 million13 This reflects additional maintenance identified by boards through survey work during 2013 as well as some lack of progress in carrying out backlog maintenance
21 The level of backlog maintenance decreased in 14 boards and increased in seven14 The total increase in the seven boards was pound199 million of which NHS
Part 1 The NHS in Scotland is facing significant pressures | 19
Fife had by far the largest increase of pound135 million In three of these boards (NHS Borders NHS Highland and the Scottish Ambulance Service) the backlog had also increased in 2012 The increase of pound34 million in NHS Highland is a further financial pressure on the board In four boards over 50 per cent of the cost of backlog maintenance was classed as high-risk and significant risk NHS Lothian (84 per cent) NHS Shetland (82 per cent) NHS Tayside (54 per cent) and NHS Ayrshire and Arran (52 per cent)
22 The Scottish Government now forecasts that the majority of high-risk maintenance backlog will be cleared by 2015 one year later than originally planned The significant-risk backlog is now forecast to decrease to around pound150 million by 2017 compared with the previous forecast that it would be cleared by 2016
The annual financial target for capital spending makes it difficult to plan longer-term projects
23 Capital investment is important in enabling boards to plan and deliver the 2020 Vision by investing in new healthcare facilities maintaining and modernising existing facilities that will be required in future and disposing of those that are no longer needed The NHS capital budget available to boards fell by 21 per cent between 201213 and 201314 from pound6055 million to pound4813 million More than half of this reduction related to accounting adjustments associated with revenue-financed methods such as Non-Profit Distribution (NPD) which do not affect the capital funds available for boards to spend The remaining capital budget available to boards reduced by 12 per cent to pound4664 million
24 All boards broke even against their capital budgets in 201314 but significant movements in their budgets were required during the year to allow them to reach that position (Exhibit 4 page 20) The Scottish Government manages the capital budget carefully during the year moving funds from NHS boards that expect delays in their expenditure to those that are able to make use of the funding This allows the NHS as a whole and individual boards to stay within their capital budgets but it makes it difficult to see how well NHS boards have managed their resources The Scottish Government has increased the proportion of total capital funding that is included in initial allocations each year although it did not agree final budgets with several NHS boards until after the end of the financial year NHS boardsrsquo annual accounts are still not clear about the extent of and reasons for movements in their capital budgets during the year
25 The annual financial targets for capital budgets and uncertainty about future budgets hinders NHS boardsrsquo effective planning of capital projects For example NHS boards returned around pound29 million of capital funding to the Scottish Government during 201314 A number of boards that had returned capital funds in previous years received these funds back in 201314 and subsequently returned them again For example NHS Grampian agreed with the Scottish Government to defer some of its capital budget allocation from 201112 and 201213 into 201314 to help manage the cost of essential backlog maintenance at Aberdeen Royal Infirmary From 201415 the Scottish Government has issued two-year indicative capital allocations to NHS boards to help them manage their capital programmes
26 The NHS needs the right buildings and facilities to achieve the 2020 Vision and provide healthcare that meets future needs Over the next four years the
20 |
Scottish Government plans to invest around pound330 million in new facilities and other capital projects in the community15 This investment is intended to help move towards more community-based and preventative care by April 2017 For example NHS Forth Valley Stirling Council and Forth Valley College plan to develop the Stirling Care Village as part of their wider plans to change and improve care for older people This model intends to combine primary and community healthcare with care for older people providing joined-up services GP surgeries the voluntary sector and other local service providers will also be involved in delivering enhanced services through this model of care16
Exhibit 4There were significant movements in the NHS capital budget in 201314Both the overall capital budget and the budget available for investment decreased from 201213
201213pound million
201314pound million change
Total capital budget 6055 4813 -2052
Split into
Capital provided for investment in board capital programmes 5281 4664 -1168
Capital funded by the Scottish Parliament for accounting treatment for new revenue-financed projects
775 149 -8072
There were also significant movements in the capital budget across all boards These follow a similar pattern to the movements in 201213
Note The capital budget shown here is represented by the final capital resource limits (CRLs) from the NHS boards accounts This differs from the capital budget allocated to the NHS within the Scottish Government Budget due to adjustments for example for assets donated to the boards
Part 1 The NHS in Scotland is facing significant pressures | 21
There have been improvements in the quality of healthcare
27 The Scottish Government has set out the national strategy for the NHS in the 2020 Vision and the Healthcare Quality Strategy These aim to improve the quality and safety of patient care and health outcomes17 The Scottish Patient Safety Programme focuses on improving the safety and reliability of healthcare and reducing harm For example a focus on healthcare-associated infections (HAIs) resulted in a 50 per cent reduction in adult patients in hospital with HAIs between 2005 and 2011 (from 95 per cent to 49 per cent) and rates continue to fall18 Health outcomes for some conditions have also improved Cancer and heart disease are the two main causes of death in Scotland Between 2003 and 2012 the death rate for all forms of heart disease fell by 38 per cent and the number of people having a heart attack fell by a fifth19 The Scottish Government has a policy objective to improve early detection of cancer which improves outcomes for patients Between 2010 and 2013 the number of people diagnosed with early stage breast colorectal or lung cancer increased by 75 per cent Patient satisfaction with hospital inpatient services has also generally increased since 201220
Performance against waiting time targets is showing increasing signs of pressure
28 NHS boards are required to meet a number of performance targets that cover health improvement efficiency access and treatment (HEAT targets) These aim to ensure that NHS boards focus on making improvements in areas the Scottish Government has identified as priorities to help to achieve its overall purpose and objectives21 In recent years the Scottish Government has reduced the number of HEAT targets and has committed to focusing more on outcomes But the level of performance that boards are expected to achieve has become more challenging at the same time as budgets are tightening This is making it increasingly difficult for NHS boards to continue to meet HEAT targets
29 Many of the HEAT targets relate to waiting times Waiting time targets have reduced over the past ten years and the length of time that people wait has decreased considerably Some targets have become more challenging for NHS boards recently
bull Delayed discharges ndash since April 2013 NHS boards have been working to the target that no patient should wait in hospital for more than 28 days from when they are clinically ready for discharge (reduced from 42 days previously) From April 2015 this is due to reduce further to 14 days Boards are finding it difficult to meet the current target with only three boards meeting this at the end of April 2014 (Exhibit 5 page 23)
bull Specialist Child and Adolescent Mental Health Services (CAMHS) ndash the current target is that 90 per cent of patients should wait no longer than 26 weeks from referral to treatment This target is due to reduce to 18 weeks from December 2014 Performance against the current target deteriorated between 201213 and 201314 from 99 to 93 per cent of all patients seen within 26 weeks (Exhibit 5)
bull The treatment time guarantee (TTG) was introduced on 1 October 2012 under the Patient Rights (Scotland) Act 2011 All eligible patients now
22 |
have a legal right to receive planned inpatient or day-case treatment within 12 weeks of the treatment being agreed This is the first time that waiting times have been a legal right and puts more pressure on boards to ensure that all patients are seen within the required time The TTG has not been met nationally since it was introduced and only five territorial boards met it in March 2014
30 Last year we highlighted that the failure to meet some key waiting time targets suggested capacity pressures in boards Overall performance against several of these targets deteriorated between 201213 and 201314 indicating increasing capacity pressures in boards (Exhibit 5) The Scottish Government has recently lowered the threshold for the AampE target as boards were struggling to meet it From April 2013 the AampE waiting time target was temporarily lowered from 98 per cent of patients to be seen within four hours to 95 per cent The 95 per cent target is due to be delivered by the year ending September 2014 and performance data will be published at the end of November 2014
31 Across Scotland at the end of March 201422
bull Only three of the key waiting time targets were met nationally the drug and alcohol treatment target (met by all 14 territorial boards) the cancer (decision to treat to first treatment) target (met by 11 territorial boards) and access to CAMHS (met by nine territorial boards) These three targets were also met at the end of March 2013 The 18-week referral to treatment target which was met in at the end of March 2013 was not met at the end of March 2014
bull No territorial board met the outpatient waiting time target and only three boards met the delayed discharges target (NHS Ayrshire and Arran NHS Orkney and NHS Shetland)
bull Boards are finding it challenging to meet the TTG four-hour AampE target and cancer (urgent referral to first treatment) target
bull Performance against the targets varied by board While NHS Orkney met eight of the nine targets and NHS Shetland met seven NHS Grampian and NHS Lothian met two of the nine targets NHS Greater Glasgow and Clyde and NHS Highland met three and NHS Tayside met four
32 More detailed analysis of performance against these key targets highlights the variability across boards and specialties For example most patients waiting longer than the TTG target of 12 weeks at the end of March 2014 were in NHS Lothian and NHS Grampian More recent information for June 2014 shows that
bull no patients were waiting longer than 12 weeks in any specialty in NHS Forth Valley NHS Greater Glasgow and Clyde NHS Lanarkshire NHS Orkney NHS Shetland and NHS Western Isles
bull the three boards with the highest number of people waiting for more than 12 weeks for treatment were NHS Lothian NHS Highland and NHS Grampian
bull the specialties with the highest number of people waiting more than 12 weeks in NHS Lothian were plastic surgery (125 patients) urology (93) and general surgery (49) in NHS Highland it was trauma and orthopaedics (166) and in NHS Grampian it was plastic surgery (133) and ophthalmology (88)23
Part 1 The NHS in Scotland is facing significant pressures | 23
Exhibit 5Performance against waiting time and delayed discharge targets in territorial NHS boardsPerformance against some waiting time targets deteriorated in some boards (end of March 2013 to end of March 2014)
Child and Adolescent Mental Health Services (CAMHS)1
Drug and alcohol treatment2
Referral to treatment (RTT)1
Out-patients1
Inpatientday-case treatment time guarantee (TTG)1 3 4 AampE1
Cancer ndash urgent referral to first treatment2
Cancer ndash decision to treat to first treatment2
Delayed discharges5
Targetstandard 26 wks 3 wks 18 wks 12 wks 12 wks 4 hrs 62 days 31 days 4 wks
Met Met temporaryinterim target Met for over 99 of patients Within 5 Not met
Notes1 Data is for month ended 31 March 2013 and 2014 CAMHS data for NHS Highland is not available for March 2014
The AampE target was 98 per cent at March 2013 and 95 per cent at March 2014 2 Data for quarter ended 31 March 2013 and 20143 TTG applies to patients added to the waiting list from 1 October 2012 only4 TTG incorporates a legal right to treatment so we have categorised this as met not met or met for over 99 per cent of patients5 Performance against this standard is based on a census at point in time The delayed discharges data are at the end of April 2013 and 20146 National Waiting Times Board is not included in this table Four of these targets apply to this board ndash Referral to treatment (RTT) Outpatients Inpatientday case treatment time guarantee (TTG) and Cancer ndash decision to treat to first treatment The board met all four of these targets
Source Based on data from ISD Scotland and subject to any caveats described by ISD Scotland
24 |
Demand for outpatient appointments is increasing faster than the number of patients seen33 NHS boards need to manage demand for outpatient clinics alongside inpatients and day cases They are finding it difficult to meet the target that new outpatients should be seen within 12 weeks of referral and none of the territorial boards met the target throughout 20131424 Demand for outpatient appointments has increased over the last three years but the number of people seen has not increased to the same extent At the quarter ending March 2014
bull the number of people on waiting lists for a new outpatient appointment was 34 per cent higher than at the quarter ending March 2010 increasing from 187693 to 252009
bull the number of new outpatients seen during the same period increased by only 13 per cent from 324403 to 367259 meaning that the number of people waiting is continuing to increase
bull the number of people who had been waiting longer than 12 weeks increased from 157 at the quarter ending March 2010 to 6754 at the quarter ending March 2014
34 The increasing number of people waiting over 12 weeks indicates pressure on NHS boardsrsquo capacity For example the number of procedures carried out in outpatients has more than doubled since 200809 to 380456 procedures in 201213 There are risks this pressure will increase as demand continues to grow This pressure can only be tackled by some combination of
bull increasing the number of new outpatient appointments available for example by allocating additional staffing and other resources
bull further reducing the number of people attending for follow-up appointments (the ratio of follow-up to new appointments has reduced from 23 in 2004 to 19 in 2013) A new approach is being implemented in hospitals across Scotland to reduce the number of follow-up patients attending orthopaedic clinics (Case study 4 page 25)
bull reducing the number of outpatient referrals by moving to other models of care such as self-management telehealth and telecare
Delays in discharging patients are putting pressure on hospital beds35 Although the overall average (mean) length of stay in hospital has reduced delays in discharging patients who are clinically ready to leave hospital have been increasing over the last five years especially during 201314 They increased from around 101500 bed days over the quarter ending April 2013 to 117800 over the quarter ending April 2014 (Exhibit 6 page 26)25 In 201314 a total of 421157 bed days were occupied by patients who were delayed at an estimated cost to the NHS of pound78 million26
36 Most patients who are affected by delayed discharges are aged 75 and over This reflects their more complex needs and difficulties in organising the community support they need In April 2014
bull there were 738 patients across Scotland whose discharge was delayed compared to 564 in April 2013
Part 1 The NHS in Scotland is facing significant pressures | 25
bull 173 patients were delayed for four weeks or more
bull the most common reason for delays of four weeks or more was waiting for a place in a care home Shorter delays (two weeks or less) were mainly due to waiting for community care assessments27
37 In 2013 and 2014 a number of NHS boards carried out snapshot audits reviewing the healthcare needs of all patients in hospital on one day28 These found that for around 25 per cent of patients there was no clinical reason for them to remain in hospital Reasons for patients remaining in hospital included waiting to be reviewed by a consultant waiting for a place in a care home and waiting for a social work assessment NHS boards are using this information to identify areas for improvement for example focusing on groups of patients at more risk of spending longer in hospital than clinically necessary
38 While the overall results of the latest NHS inpatient experience survey were positive the one aspect that was less positive was leaving hospital29 Fourteen per cent of patients indicated that they had to stay in hospital longer than expected to wait for their care or support services to be organised Two-fifths of patients experienced a delay on the day they were leaving hospital mainly
Case study 4Follow-up care for patients with a fracture has been redesigned
Around 100000 people a year in Scotland have a fracture that does not require surgery In these cases the fracture is left to heal and no follow-up treatment is required Traditionally all patients with a fracture were fitted with a cast and would have to return to an outpatient clinic to have the cast removed
In around 80 per cent of Scottish hospitals a new approach has been introduced for patients with a fracture that does not require surgery Patients are treated in AampE and fitted with a removable cast if possible Patients are provided with information to allow them to self-manage and around 40 per cent do not need to return to hospital for follow-up care The remaining patients are referred to an orthopaedic clinic The orthopaedic team is able to follow up around a fifth of these patients by telephone conversation and the remainder of patients attend an orthopaedic outpatient clinic for follow-up
Glasgow Royal Infirmary (GRI) started using this approach in 2011 and was one of the first hospitals to use it Since it was introduced referrals from AampE to the orthopaedics department have decreased by over 50 per cent and it has reduced travel time for patients GRI has reported that it has improved patient flow in both its AampE and orthopaedics departments It has reduced the number of orthopaedic patients in AampE who wait longer than four hours and freed up orthopaedic consultant time to see new outpatient referrals
Source Audit Scotland based on information provided by the Quality and Efficiency Support Team (QuEST) at the Scottish Government
26 |
Exhibit 6Number of delayed discharges and occupied bed days 2012ndash14The number of bed days occupied by patients who experience a delayed discharge has been steadily increasing
Number of bed days occupied by delayed discharges
Number of delayed discharges
Num
ber
of b
ed d
ays
occu
pied
by
dela
yed
disc
harg
es (0
00s)
Jul2012
Oct2012
Jan2013
Apr2013
Jul2013
Oct2013
Jan2014
Apr2014
140
120
100
80
60
40
20
0
Num
ber
of d
elay
ed d
isch
arge
s
1000
900
800
700
600
500
400
300
200
100
0
Note The number of delayed discharges refers to all patients who experienced a delay of any length It excludes code 9 patients with complex needs
Source ISD Scotland
because they had to wait for medicines with 16 per cent waiting longer than four hours Delays in patients being discharged mean that beds are not available to other patients who need them causing delays and blockages elsewhere in the system NHS boards need to ensure they have detailed information about discharge times and the reasons for delays to effectively manage patient flows
39 Some boards for example NHS Fife NHS Forth Valley and NHS Lanarkshire are co-locating staff from the hospital and community including social work to coordinate planning for patientsrsquo discharge from hospital Staff in these discharge hubs work with ward staff to identify patientsrsquo needs and start planning their discharge as soon as they are admitted to hospital The aim is to minimise any delays and to ensure patients have sufficient support in the community In NHS Forth Valley they also provide advice and guidance to hospital staff and GPs including potential alternatives to admitting people to hospital We included a case study on the integrated discharge hub in NHS Fife in our AampE report
40 Our report on reshaping care for older people highlighted how NHS Tayside and Perth and Kinross Council are working together to
bull redesign systems so that patients can be discharged home from hospital as quickly as possible
bull provide community-based alternatives to hospital and long-term residential care
bull use data to work with GPs to understand how they are using local services and to change how older people receive care and support30
Exhibit 6
Audit Scotland
Exhibit 6
Exhibit 6 background data
Part 1 The NHS in Scotland is facing significant pressures | 27
The NHS puts considerable effort into meeting performance targets 41 The Scottish Government and NHS boards put a great deal of effort into attempting to meet annual waiting time targets The Scottish Government also provided additional funding for NHS boards For example in 201314 the Scottish Government provided NHS boards with at least pound17 million additional funding during the year to support waiting time targets This is similar to the additional funding of at least pound20 million that it provided in 20121331 During 201314 NHS boards also received additional funding of pound9 million to improve emergency and urgent care including reducing waiting times in AampE NHS boards have noted additional workforce costs to provide additional capacity to meet waiting times targets particularly the TTG This level of focus on meeting waiting times targets may not be sustainable when combined with the additional pressures of increasing demands related to demographic changes and the overall health budget starting to decrease in real terms
42 National targets are helpful in targeting areas for improvement in performance For example the focus on waiting time targets has led to a considerable reduction in the length of time that people wait for treatment However it is becoming more difficult for NHS boards to meet these targets fully The extent of the effort required to try to meet them makes it more difficult for NHS boards to focus on long-term planning and moving more care into the community There are risks that too narrow a focus on targets can detract attention from achieving the wider aims
43 The Scottish Government is reviewing the HEAT framework and aims to have updated guidance for boards by November 2014 It should review whether the current financial and performance targets for the NHS are achievable at the same time as implementing the 2020 Vision for health and social care within the tight financial resources available It should consider setting targets for NHS boards that will help them work towards the 2020 Vision for example introducing milestones to measure the extent to which boards are moving towards more preventative and community-based care
There is growing evidence of staff pressures
44 The availability of staff is another important factor in NHS boardsrsquo capacity to provide patient care The number of consultants and nursing and midwifery staff in post has increased slightly each year since 2012 Between March 2013 and March 2014 the number of vacancies for nursing and midwifery staff was stable after increasing the previous year but the number of consultant vacancies increased significantly (Exhibit 7 page 28) This may be related to some extent to the increase in the number of consultant posts and the time lag in filling new posts However the number of posts vacant for six months or more almost doubled from 41 whole-time equivalent (WTE) at 31 March 2013 to 792 WTE in March 2014
45 Of the mainland territorial boards consultant vacancy rates were highest in NHS Dumfries and Galloway (154 per cent) NHS Fife (133 per cent) NHS Forth Valley (102 per cent) and NHS Grampian (99 per cent) With the exception of NHS Dumfries and Galloway these boards experienced difficulty achieving a number of performance targets in 201314 (Exhibit 5)
46 Many NHS boards have reported difficulties filling medical vacancies in some specialties and some geographical areas leading to greater use of locum doctors to maintain services NHS boardsrsquo workforce plans comment on a number of factors that are contributing to these difficulties including
28 |
bull changes in junior doctor training since the introduction of Modernising Medical Careers in 2005 These changes have led to a reduction in the number of junior doctors available and NHS boards needing more middle grade doctors and consultants
bull strong competition among NHS boards for medical staff This can make it more difficult for smaller boards and more rural areas to compete with larger boards which can offer more opportunities such as research and development
bull difficulty recruiting and retaining staff in some specialties with unattractive working patterns such as emergency medicine or where there is a national shortage and greater levels of part-time working such as paediatrics
47 These difficulties have an impact on NHS boardsrsquo ability to provide services and on their financial position For example
bull NHS Highland reported that its financial position in 201314 was negatively affected by spending on locums It anticipates that this will continue to be a cost pressure in 201415 (Case study 1)
bull NHS Orkney required brokerage from the Scottish Government to help cover increased spending on locum doctors and agency nursing staff (Case study 2)
bull NHS Dumfries and Gallowayrsquos spending on locums increased from pound63 million in 201213 to pound76 million in 201314 The board reported that this is due to increased demand and difficulty filling posts
bull NHS Grampian has reported that consultant vacancies in oncology are affecting cancer services and patients are having to receive treatment in other boards It has reported significant difficulty recruiting some groups of
Exhibit 7Consultant nursing and midwifery workforce March 2012 to March 2014The number of vacant consultant posts increased significantly between 2013 and 2014
At 31 March 2012 (wte)
At 31 March 2013 (wte)
At 31 March 2014 (wte)
increase 2012 to 2013
increase 2013 to 2014
Consultant staff in post 44277 45316 46936 23 36
Consultant vacancies number and rate
1673 (36) 2025 (43) 3248 (65) 21 604
Nursing and midwifery staff in post
564673 570366 581727 1 2
Nursing and midwifery vacancies number and rate
10279 (18) 16091 (27) 16375 (27) 565 18
Source ISD Scotland
Part 1 The NHS in Scotland is facing significant pressures | 29
staff including AampE staff due to the buoyant labour market competition for jobs in the local area and a national shortage of staff in certain clinical specialties including oncology
bull NHS Fife has highlighted vacancies for radiologists and difficulties securing locums which have had an impact on waiting times for diagnostic tests
bull NHS Ayrshire and Arran has reported that vacancies across medical grades are a challenge to it providing current services and considering its plans for providing services for the future
48 The NHS spent pound128 million on bank and agency nursing and midwifery staff in 201314 an increase of 15 per cent since 201213 This accounts for 13 per cent of total revenue expenditure in 201314 Bank nurses accounted for 93 per cent of the spending However spending on agency staff increased by 46 per cent to pound93 million This follows a rise of 62 per cent the previous year reversing the trend of falls in spending on agency nurses since 20080932 Agency staff are likely to be more expensive than bank nurses and also pose a greater potential risk to patient safety and the quality of care33
Spending on private sector healthcare reduced in 201314
49 NHS boards use private sector healthcare to provide additional capacity to meet patientsrsquo needs or to meet national targets In December 2013 the Scottish Government issued guidance for NHS boards which states that it expects the vast majority of patients to be treated within the NHS with the private sector used only to deal with short-term capacity issues34
50 Total spending on private sector healthcare by the territorial boards fell by 69 per cent in real terms between 201213 and 201314 from pound803 million to pound759 million Spending on private healthcare represented about 09 per cent of total spending on hospital and community health services in 201314 Spending decreased in eight territorial boards and increased very slightly in three35 It increased considerably in
bull NHS Shetland spending increased by 60 per cent from pound116000 to pound186000
bull NHS Highland spending increased by 40 per cent from pound26 million to pound37 million
bull NHS Lothian spending increased by 12 per cent from pound148 million to pound166 million
Most boards do not consider integrated performance reports
51 The board of directors in NHS boards need to oversee all aspects of performance including
bull patient safety and clinical quality
bull performance against HEAT targets
bull finance
bull feedback and complaints from patients and staff
30 |
52 Each aspect of performance is important in ensuring the NHS board is providing high-quality sustainable care Considering any one aspect in isolation may mean that the board does not have a full understanding of overall performance for example the board may be achieving its HEAT targets but facing increasing financial pressure or waiting time targets may be met for inpatient and day-case treatment while waiting times for outpatients are growing
53 An integrated overview of performance with high-level commentary helps the board to quickly get an overview of performance We found that only three boards receive an integrated report bringing together all aspects of performance (Case study 5)36 A further two consider reports that bring together a range of aspects of performance but they consider financial performance separately37 We have previously recommended that NHS boards should avoid considering one aspect of performance in isolation In our report on the management of NHS waiting lists we highlighted the importance of NHS boards considering and scrutinising performance against waiting time targets alongside information on how they are achieving that performance Non-executive directors need access to a range of information in order to allow them to provide effective challenge38
Case study 5NHS Greater Glasgow and Clyde uses integrated performance reporting
In April 2011 NHS Greater Glasgow and Clyde established a Quality and Performance Committee (QPC) as a subcommittee of the board This replaced the Performance Review Group Health and Clinical Governance Committee and Involving People Committee The main aim of the QPC is to bring together all areas of governance quality and performance under one committee to provide an overview
The QPC considers an integrated quality and performance report The report brings together data and commentary on the boards performance in relation to quality patient safety clinical governance financial monitoring performance monitoring workforce planning and involving peoplepatients It highlights any areas where the board is not meeting targets or on track to meet them The committee also considers more detailed monitoring reports on some aspects of performance including a financial monitoring report
Source NHS Greater Glasgow and Clyde Annual Audit Report 201112 and update from auditor
Part 2 Looking ahead | 31
Part 2Looking ahead
the NHS is facing significant pressures at the same time as needing to make major changes to services
Key messages
1 The overall health budget is planned to reduce by 09 per cent in real terms over the next two years Changes in Scotlandrsquos population mean that demand for health and social care will increase significantly over the next 20 years at the same time as budgets are tightening The NHS will not be able to continue to provide services in the way it currently does given the scale of the changes required It needs to do more to plan for how it will make the changes needed to provide sustainable care for the future
2 Increasing demand is already putting pressure on services NHS boards need to better understand their demand capacity and how patients move through the complex health and social care system so that they can match their capacity with current and future needs They also need to better understand the reasons for delays and blockages in the health and social care system The Scottish Government has started working with four NHS boards to help them improve patient flow
The NHS will continue to face increasing pressures
55 Taken together our audit work has found clear evidence that NHS boards are finding it increasingly difficult to meet their financial and performance targets All the available evidence suggests that these pressures will increase in future
56 The Scottish Governmentrsquos overall health budget (revenue and capital) is planned to decrease by 10 per cent between 201314 and 201415 and to increase by 01 per cent between 201415 and 201516 in real terms Within the overall health budget
bull the revenue budget is planned to increase by 03 per cent between 201314 and 201415 and to increase by 06 per cent between 201415 and 201516 in real terms
bull the capital budget is planned to decrease by 389 per cent between 201314 and 201415 and to decrease by 240 per cent between 201415 and 201516 in real terms (Exhibit 8 page 32)
57 Healthcare inflation in the UK is higher than general inflation which has an impact on the health budget in real terms Over the last 20 years general inflation in the UK averaged just over two per cent a year while health service costs rose by 36 per cent a year39
32 |
Exhibit 8In the next two years the health budget will decrease by 09 per cent in real termsThe larger revenue budget will increase by almost one per cent while the smaller capital budget will decrease by 54 per cent
-5357
-2398
-3892
+031 +064 +095Revenue
Capital
CUMULATIVE
TOTAL
-093-104 +010
1314to
1415
1415to
1516
1314to
14151415
to1516
1314to
1516
Source Scottish Government Draft Budgets 201314 201415 and 201516
58 Longer-term forecasts to 201819 by the Office for Budget Responsibility show a real-terms reduction in total UK public sector expenditure of 07 per cent in both 201617 and 201718 before levels are maintained in 20181940 Reductions in spending at a UK level will affect the level of funding available in Scotland The Scottish Government will need to plan for health spending within an overall reducing budget
Part 2 Looking ahead | 33
Other cost pressures are likely to increase in future years59 There is likely to be an increase in contribution rates to the NHS Superannuation Scheme during 201415 The most recent actuarial funding valuation available for the scheme was at 31 March 2004 A funding valuation was carried out at 31 March 2008 but was suspended by HM Treasury prior to completion A new funding valuation was carried out in 201314 for the scheme as at 31 March 2012 and this will be incorporated in the NHS accounts for 201415 Employer contribution rates are expected to increase as a result of this valuation in order to ensure that contributions are large enough to meet the likely future costs of the pension scheme
60 A number of boards highlighted this as a financial risk in their LDPs NHS boards have assumed and are planning for pensions costs of approximately two per cent of their total pay bill but the extent of the increase is not yet known NHS boards will also face further costs due to changes in pension schemes that end the current arrangements under which members and their employers pay lower National Insurance contributions41 As a result of these changes pension scheme members and their employers will no longer pay reduced NI contributions from 6 April 2016
61 NHS boards have identified other future cost pressures including pay costs spending on drugs and the availability of new treatments Staff pay is the largest single item of expenditure for NHS boards and the Scottish Government has estimated that the pay bill will increase by around pound30 million per year from 201415 (not including additional pension costs)42 NHS boards are working with the Scottish Government to identify how they will fund these cost pressures NHS boards are considering how they can work together to provide services more efficiently for example exploring opportunities to provide more services on a regional basis
Changes in the population are increasing demand62 Demographic and other changes are increasing the pressures Scotlandrsquos population is ageing (Exhibit 9 page 34) Between 2012 and 2037
bull the percentage of the population aged 65 or over is projected to increase from 17 per cent (925751 people) to 25 per cent (1473158 people)
bull the percentage of the population aged 75 or over is projected to increase from eight per cent (418486 people) to 13 per cent (778746 people)
bull the number of people aged 100 years or older is projected to increase by 879 per cent from 792 to 775143
63 Older people are more likely to have long-term health problems that require care and in the absence of good community-based care that will increase the pressure on acute services The number of people aged over 65 attending AampE departments increased by 126 per cent over the past five years from 242677 attendances in 200809 to 273192 in 201213 Older people are more likely to be admitted to hospital from AampE in December 2013 60 per cent of AampE attendances for people aged over 65 resulted in admission to hospital compared with 23 per cent of patients aged under 6544
34 |
64 The number of people with long-term conditions such as diabetes is increasing and the number of long-term conditions that an individual may have increases with age Rates of dementia are also increasing and the number of people with dementia is estimated to double within the next 25 years45 The number of inpatient and day-case episodes for people aged 65 and over where the patient had a diagnosis of dementia increased by nearly 50 per cent between 2009 and 2013 from 21524 to 32205 Older people with dementia generally stay longer in hospital often due to the need for specialist care that delays their discharge Around half of long-stay residents in Scottish care homes have a diagnosis of dementia
Exhibit 9Scotlands population is ageingThe percentage of the population aged 75 and over is set to increase considerably over the next 25 years
65-74 yearsUnder 65 years 75-84 years 85 years and older
83
75
2610
912 5
Population
418486 2012
Estimated population
778746 2037
2012
2037
75 yrs +
86
Population
792 2012
Estimated population
7751 2037
100 yrs +
879
Note Due to rounding the total percentages add up to 101 per cent
Source Projected Population of Scotland (2012-based) National Records of Scotland 2013
Exhibit 9
Audit Scotland
Exhibit 9
Exhibit 9 background data
Part 2 Looking ahead | 35
65 Peoplersquos expectations of healthcare are rising in relation to access to services and treatments and the Scottish Government recognises this as another challenge for the NHS46 For example the main issues in orthopaedics affecting demand in addition to an increasing older population are higher patient expectations and improvements in technology and available procedures A wider range of procedures are now available and surgeons can carry out more complex procedures47
The Scottish Government has set out its long-term strategy for the NHS but boards do not yet have detailed plans in place
66 Pressures will continue to increase for the foreseeable future The Scottish Government recognises this and in 2011 it set out its 2020 Vision an overarching strategy for achieving sustainable quality in the delivery of healthcare services across Scotland in the context of the challenges facing the NHS48 The overall aim is that by 2020 everyone is able to live longer healthier lives at home or in a homely setting It is an ambitious policy that aims to prevent or improve poor health caused by lifestyle factors such as smoking alcohol and lack of exercise and move towards the NHS providing more care in community settings (Exhibit 10 page 36) In May 2013 the Scottish Government set out 12 priority areas for action in the form of a Route Map to the 2020 Vision
67 The NHS has already made improvements in health outcomes in the Scottish population The 2020 Vision has the potential to make further improvements in health outcomes and the quality of health and social care But achieving the vision will require major changes in the way that services are delivered and a significant shift of resources into more preventative and community-based services We have highlighted in previous reports that there is a lack of evidence of progress in moving resources and more care into the community49 In 200304 42 per cent of NHS spending for all age groups was on community services by 201112 this had increased to just 44 per cent and in 201213 it reduced to 43 per cent50 Between 200203 and 200910 council spending in real terms on social care services for older people increased by 37 per cent from pound098 billion to pound135 billion By 201213 this had fallen to pound129 billion a four per cent reduction from 20091051 The reasons for this lack of progress are complex but achieving the transformation required is made more difficult by the increasing pressures on acute care and by the continuing focus on short-term planning
68 From April 2016 health and social care services in Scotland will be integrated The Public Bodies (Joint Working) (Scotland) Act 2014 requires NHS boards and councils to establish new health and social care partnerships Under these arrangements NHS boards and councils will be required as a minimum to combine their budgets for adult social care adult primary healthcare and aspects of adult secondary healthcare It provides a good opportunity for NHS boards with their council partners to redirect resources and move towards more community-based and preventative care It will be challenging for NHS boards to make the scale of changes required over the next few years but critical if they are to meet the 2020 Vision Outcomes are being developed for integrated health and social care along with integration indicators for the new integration joint boards to report performance against
69 We have previously recommended that NHS boards need to increase their focus on longer-term financial planning Without this there is a risk that they will continue to take a short-term approach to managing the pressures they face at
36 |
Exhibit 10Aims of the Scottish Governments 2020 Vision for health and social careThe Scottish Government has set out an ambitious policy that will require a considerable move from care in settings like hospitals and care homes to more community-based and preventative care
Our vision is that by 2020 everyone is able to live longer healthier lives at home or in a homely setting
We will have a healthcare system where we have integrated health and social care a focus on prevention anticipation and supported self-management
When hospital treatment is required and cannot be provided in a community setting day-case treatment will be the norm
Whatever the setting care will be provided to the highest standards of quality and safety with the person at the centre of all decisions
There will be a focus on ensuring that people get back into their home or community environment as soon as appropriate with minimal risk of re-admission
Source A Route Map to the 2020 Vision for Health and Social Care Scottish Government May 2013
the expense of better options over the longer term NHS boards need to plan now for making considerable changes to the way they deliver services in the longer term to ensure they can deliver sustainable good-quality care to meet future increasing needs They need to set out how they will reshape services and provide high-quality care with the available funding staff and other resources Their longer-term financial planning should consider all the resources they need to provide integrated health and social care services to continue to meet future needs (Exhibit 11 page 37)
70 LDPs set out how each board plans to deliver the priorities for the NHS in Scotland They also form the basis for the Cabinet Secretaryrsquos annual reviews of each board In the past LDPs have focused predominantly on financial planning and meeting HEAT targets for the coming year rather than demonstrating how boards are planning to meet longer-term aims For 201415 the Scottish Government requires each board to include an improvement and co-production plan in their LDP outlining the actions the board is taking to deliver the 2020 Vision (Exhibit 12 page 38) We found that the 201415 LDPs include detail about what boards are currently doing but provide little information about how boards will deliver the 2020 Vision in a sustainable way supported by financial and workforce plans We would expect there to be more detail in the 201516 LDPs about how boards will work with their partners to shift more services into the community as they move towards health and social care integration
Planning needs to be underpinned by a better understanding of demand capacity and patient flows
71 Health and social care services form a complex system in which patient flows need to be understood and managed in order to have the right resources available when and where they are needed to meet demand These resources include the
Part 2 Looking ahead | 37
Exhibit 11A number of elements of long-term planning should underpin financial plansLong-term financial planning needs to set out how NHS boards will make the changes needed to meet future needs
Elements of longer-term planning
Detailed planning required
Future demand for health and social care
Model projected demand for care by taking into account the
bull numbers of patientsservice users expected to need services
bull demographic profile of the area
bull complexity of care that people will need
Compare this with current demand and short-term projections
Models of care Identify the models of care and shared objectives for the new health and social care partnerships required to meet the 2020 Vision and projected future demand for the following
bull hospitals bull community-based care bull home-based care
bull care in the community supported by technology such as telehealth and telecare
Workforce requirements
Identify the staff needed to provide these models of care taking into account
bull numbers and type of roles bull skills mix bull training bull location
Compare this with the current workforce make-up and location and short-term projections Workforce planning needs to be done in collaboration with the Scottish Government NHS Education for Scotland and training providers such as colleges
Location of care Identify the fixed assets needed to provide models of care in different locations including the following
bull buildings (hospitals and community) including the condition of existing buildings and costs of ongoing maintenance and any new buildings that are required
bull information technology including shared access to NHS and social care systems
bull broadband
bull transport for patients service users and staff
Compare this with current assets and short-term projections Plans need to ensure the infrastructure is in place to support moving more care into the community while ensuring hospitals are fit for purpose
Costs and funding
Financial planning to meet future needs by estimating the cost of
bull providing new models of care and for increased demand
bull providing more care in the community and in patientsusers homes
bull maintaining hospital services in line with future models of care
Use scenario planning with potential financial projections to ensure models of care are affordable and to identify potential funding gaps Establish plans for redirecting funding from hospitals to community to meet future needs while maintaining services This is likely to require double-running costs
Source Audit Scotland
38 |
Exhibit 12LDPs now include improvement and co-production plansNHS boards are required to set out their priority actions for delivering the 2020 Vision
Key elements of the plans are that they should
bull be transformational in nature and underpinned by workforce and finance planning
bull provide assurance that the five priorities for action set out in Everyone Matters 2020 Workforce Vision Implementation Framework (healthy organisational culture sustainable workforce capable workforce integrated workforce effective leadership and management) will be taken forward in a planned way
bull set out the priority actions the NHS board is taking across patient safety programmes of work the plans for spread and sustainability and the impact they are having on patient care
bull include the approach being taken to ensure that feedback on compliments concerns complaints and comments from patients their families and carers is being actively sought and used to improve services
bull set out actions and planned levels of improvement for unscheduled care across the NHS such as increased anticipatory care and support to help people manage their conditions and medicines including how hospitals GPs community teams the Scottish Ambulance Service and NHS 24 will work together
bull set out the actions the NHS board is progressing with its partners to prepare for health and social care integration
Source NHSScotland 2020 Local Delivery Plan Guidance Scottish Government November 2013
number of hospital beds outpatient clinics community services and trained staff The NHS needs a better understanding of its current capacity current and future demand and patient flows in order to inform the major changes to services that will be required to ensure they are sustainable and meet the long-term needs of the population
72 We analysed recent trends in healthcare activity population statistics and rates of conditions such as diabetes and dementia (Appendix 1 summarises our methodology) We looked at data for the previous five years where this is available and comparable in order to understand recent trends and identify where pressures are building This analysis identified some of the main pressures and highlights the complex and interrelated nature of the healthcare system The degree to which pressures impact on NHS boards hospitals and specialties varies but include
bull an ageing population and an increase in the number of older people with complex care needs
Part 2 Looking ahead | 39
bull more people living with long-term conditions and multiple conditions
bull more people seeking emergency and urgent care
bull more people being treated in outpatient and day-case settings
bull making sure hospital beds and staff are available at the time they are needed
bull more people experiencing a delay in their discharge from hospital
73 We have identified a number of lsquopinch pointsrsquo in the system (Exhibit 13 page 40) These particularly relate to
bull Hospital beds being available at the time when patients need them There has been an increase in the number of patients experiencing delays in being admitted from AampE and patients are not always cared for in the appropriate ward for their needs which has an impact on the quality of care they receive (known as boarding) These pinch points are related to how hospitals manage their beds and arrangements for discharging patients
bull More delayed discharges The number of patients delayed in hospital while waiting for services to be available in the community is increasing This has an impact on the quality of care and outcomes for the patients and it also means that beds are not available for other patients adding to the pressures on beds (paragraphs 35 and 36)
bull Increasing demand for outpatient appointments Demographic changes along with improvements in care and more procedures carried out in outpatient clinics rather than on an inpatient basis have increased demand for outpatient appointments Demand is increasing at a faster rate than the number of people seen in clinics meaning that waiting lists are growing and more people are waiting longer (paragraphs 33 and 34)
Inpatient care is changing and becoming more complex74 In recent years there has been a reduction in elective (planned) inpatient care as more planned care shifts to outpatients and day cases The number of patients admitted as emergencies for inpatient care has remained steady and the complexity of these cases has increased NHS boards need to ensure they have the right number of staffed beds available at the right time to deal with this changing demand They also need to plan for changes to services in the longer term including shifting more care into community settings
75 There has been a reduction in the number of hospital beds across Scotland Between 200809 and 201213 the average number of available staffed beds in acute specialties reduced by seven per cent (1144 beds) the number of acute surgical beds fell by 11 per cent (596 beds) and the number of acute medical beds fell by five per cent (313 beds) The main reason for this reduction is the growth in day surgery as more patients are treated as day cases and outpatients for example some eye procedures and diagnostic tests Between 200809 and 201213 the number of procedures carried out on an inpatient basis decreased by 18 per cent (418000 procedures in 201213)
40 |
Exhibit 13The NHS is facing increasing pressures from an ageing population and increasing demandThe health and social care system is complex
Notes 1 Community care data Care home and care at home ndash Censuses (March 2013 and March 2008) NHS 24 ndash NHS 24rsquos performance data
(201314 and 200809) Primary care contacts ndash ISD Scotland (201213 and 200809)2 AampE data Number of attendances and waits ndash ISD Scotland and Audit Scotland AampE data(201213 and 200809)3 Hospital data Inpatient daycase and outpatients ndash ISD Scotland (201213 and 200809) Waiting lists and number waiting over 12 weeks
ndash ISD Scotland (quarter ended March 2014 and March 2010) Occupied bed days for delayed dischargesndash ISD Scotland (201314 and 201213) The data is not available before 201213
4 Patients can also be admitted to hospital as emergencies without going through AampESource Audit Scotland
TELEHEALTH
TELECARE
+346 Wait for
a bed(37946)
bull Ageing populationbull Increase in complex needsbull Increase in multiple complex cases
DAY CASE
455800attendances+6
489898procedures+8
OUTPATIENT
47 millionattendances0
15 millionnew patient attendances
+2
380456procedures+108
+9 Delayed
dischargebed days
Self referral
CARE HOME
-2 36578residents
-10 1282homes
+29 1645 short-stayrespite residents
Preventative care self management treatment and care in the community
CARE AT HOME
Social care
-1160950people receiving home care
NHS 24
-9 14 millioncontacts
ACCIDENT amp EMERGENCY
16 millionattendances+3
HOSPITALCARE
OVERNIGHT INPATIENTS
720262patients admitted-3
417987procedures-18
23728avg staffed beds-11
Demand
Time delays
Change inlast 5 years
XX
KEY
+8
admitted to hospital
from AampE (361121)
PRIMARY CARE TEAMGP amp practice nurse
Community nursing AHPPharmacy Ophthalmology Mental health team
242 million contacts+4
+189 waitedgt4hrs
(104000) Plannedcare
421157 occupied bed days
(changebetweenMar 2010
amp Mar 2014)
(changebetweenMar 2010
amp Mar 2014)
+4200
number waiting
gt12 weeks (157 to 6754)
bull The number of older people attending AampE has risen from 242677 patients aged over 65 in 200809 to 273192 patients aged over 65 in 201213 (126 increase)
bull In December 201360 per cent of AampE attendances for people aged over 65 resulted in admission to hospital compared with 23 per cent of patients aged under 65
bull Between 200809 and 201213 there was an 11 rise in the number of bed days occupied by patients aged 80 and over who had three or more emergency admissions during the year
+376
number waiting
gt12 weeks (162 to 771)
+34
number onwaiting list (252009)
-7
number onwaiting list
(50898)
Older people
(201314)
(change betweenMar 2013 amp Mar 2014)
Part 2 Looking ahead | 41
76 The average (mean) length of stay for inpatients has also been reducing Ensuring that patients stay in hospital for no longer than necessary is important since it helps them stay active remain independent and reduces the chance of acquiring a healthcare-associated infection Between 200809 and 201213 the average length of stay fell from 73 days to 65 days for elective (planned) inpatients and from 38 to 31 days for emergency inpatients
77 There is evidence that the complexity of care for patients admitted as emergencies is increasing There has been a slight growth in the number of days that hospital beds are occupied by emergency admissions for people admitted three or more times during one year (one per cent between 200809 and 201213) This is more noticeable among older people (aged 80 and over) who are likely to have more long-term conditions and complex needs Between 200809 and 201213 there was an 11 per cent rise in the number of bed days occupied by patients in this age group who had three or more admissions during the year The increase in the older population suggests that this trend will continue unless there are significant shifts to more anticipatory and preventative care in the community
NHS boards need to improve bed planning and management78 There are a number of indicators of problems with bed planning and management The number of people delayed in AampE while waiting for a hospital bed has increased fourfold since 200809 This is the most common reason for patients waiting more than four hours in AampE The reasons for this are complex and linked to beds not being available at the time when they are needed The day and time that patients are discharged from wards affect the flow of patients throughout the hospital Attendances at AampE departments are highest on Mondays and Tuesdays Delays in AampE due to people waiting for a bed in hospital are more likely on these days since fewer inpatients are discharged at weekends Discharges from hospital generally take place in the afternoon Across Scotland lsquowait for a bedrsquo delays for AampE patients are highest at 6pm The Scottish Government has announced plans to provide more services at weekends and in the evenings to improve the flow of patients and reduce delays Any knock-on effects in primary and social care should be considered as part of these plans In our recent report on AampE performance we highlighted the work that NHS Tayside is doing to improve the quality of care for AampE patients by looking at patient flow (Case study 6 page 42)
79 Boarding is another indicator that a hospital is not organising its capacity to match demand This can happen when there are not enough beds available in a particular specialty when patients need them for example when new patients are admitted as emergencies Instead patients are admitted or transferred to a ward of a different specialty Research has shown that this practice may mean that less specialist care is provided since staff without the appropriate skills are looking after patients Boarding can also significantly increase patientsrsquo length of stay and contribute to other complications resulting from delayed assessment and treatment including developing blood clots and healthcare-associated infections52
80 Boarding used to be more common in winter when demand traditionally increases due to seasonal infections Research by the Royal College of Physicians of Edinburgh (RCPE) suggests that it is becoming an all-year problem In an RCPE survey conducted in May 2012 80 per cent of respondents reported that boarding now happens all year round in Scottish hospitals and 71 per cent said that boarding levels in Scotland are high and increasing The RCPE and the
42 |
Case study 6Improving patient flow in AampE in Ninewells Hospital
Our AampE report identified a number of factors that have helped Ninewells Hospital in NHS Tayside improve the way that patients move through the healthcare system and meet the four-hour waiting time target for AampE These include
bull having senior clinical decision-makers available at all times which means that patients get the right type of care quickly
bull starting the process of planning for patients to be admitted from AampE early to avoid delays in patients waiting for a bed
bull a policy that allows GPs to refer emergency patients directly to wards rather than through AampE first
bull a policy of signposting patients attending AampE to other services such as their GP where appropriate
Source Accident and Emergency performance update Audit Scotland May 2014 (Case study 1 pages 35-36)
Scottish Government are examining the extent of boarding in Scottish hospitals the effect it has on patients and ways to reduce it Results from this work should be available in late 2014 or early 2015
81 The number of emergency admissions over a period of time is reasonably predictable based on previous activity levels On a daily and weekly basis elective admissions can be much more variable than emergency admissions Exhibit 14 (page 43) provides an example of the pattern of elective and emergency admissions to General Surgery on a daily basis in one of Scotlandrsquos district general hospitals and on a weekly basis in another hospital
82 NHS boards need to understand the differing patterns of emergency and elective admissions and actively plan and manage these two flows in a coordinated way Although the number of emergency admissions is reasonably predictable the time of day at which patients arrive at hospital is less so Managing these two flows together means more than ensuring average capacity meets average demand NHS boards also need to ensure that staffing levels are flexible enough to cope with varying demand and that sufficient capacity is available at the right time This means having staff who are trained and equipped to treat increasing numbers of older people with multiple conditions and complex needs
83 A lot of variation in elective admissions can be due to NHS boards not having sufficient capacity to treat both elective and emergency admissions at the time that patients present This includes the availability of beds in appropriate wards sufficient staff with the necessary skills equipment and access to operating theatres This can mean having to cancel planned admissions and rearrange for patients to attend at a later date However data on the overall proportion of inpatient cases that are cancelled has not been available nationally since October 2012 This is due to changes to NHS boardsrsquo electronic systems for managing waiting lists following the introduction of the TTG In September 2012
Part 2 Looking ahead | 43
Exhibit 14Variability in elective and emergency admissions to hospital 201314Elective admission patterns can be more variable than emergency admissions both from day to day (Hospital A) and from week to week (Hospital B)
69 per cent of inpatient and day-case appointments were cancelled across Scotland We have previously highlighted that NHS boards need to ensure they are monitoring this locally to understand any problems with capacity and inform how they manage demand53
84 The Health Foundation worked with NHS trusts in England to look at the relationship between capacity and demand This was based on the premise that the mismatch between the timing of capacity such as when staff are available and when patients present to a service contributes more to delays and inefficiencies than overall levels of demand or resources Key findings from this work were that using systems improvement methods such as detailed data
44 |
analysis and bringing together stakeholders and patients across the hospital system to develop an informed understanding of how care pathways really work can improve patient flow patient safety and make significant cost-savings54
85 The Scottish Government is working with boards over the next year to help them manage beds better in the short term including developing a bed-planning toolkit This will also help them to plan for the number and type of beds required in the longer term reflecting the new models of care that will be needed The toolkit will be piloted in 2015 and include scenario planning based on assumptions of demand admission rates and length of stay taking into account demographic patterns and more care being provided in the community Extensive work has also started in 2014 looking at patient flow in boards and the Scottish Government is leading an Outpatients Primary and Community Care Programme that aims to help NHS boards move more care from hospitals into the community and peoplersquos homes
The Scottish Government is working with NHS boards to improve patient flow
86 As well as having sufficient capacity to deal with demand NHS boards need to make sure that the flow of patients through the hospital and back into the community is as efficient as possible The Scottish Governmentrsquos Quality and Efficiency Support Team (QuEST) is working with four NHS boards to pilot an approach to improve patient flow (NHS Forth Valley NHS Borders NHS Greater Glasgow and Clyde and NHS Tayside) drawing on evidence from the Institute of Healthcare Optimisation in America This is a significant piece of work looking at individual hospitals within each board area as a whole system to understand how patients flow through the system and the factors that can influence this NHS Forth Valley started testing this approach in 2014 and the lessons learned will be shared with other boards as it is rolled out over the next three years The Scottish Government will evaluate the pilot as it progresses and also plans to commission an external evaluation
87 To help improve patient flow and avoid delays in patients getting the appropriate care or being discharged from hospital the Scottish Government also plans to provide more services at weekends and out of hours This includes hospital physiotherapy and pharmacy services An expert group met for the first time in April 2014 The Scottish Government has said there will be no additional funding for this initiative which will require staff to be available at additional times instead NHS boards will be expected to make better use of existing resources
88 Telehealth and telecare offer the potential to care for more people at home or closer to home supported by technology This includes things like equipment for people to monitor their own health at home with their results reviewed by a clinician remotely and alarms and sensors to help people to stay at home more independently These innovations support the 2020 Vision of providing care closer to home potentially improving outcomes for users and avoiding people needing more intensive care in the community or in hospital55 In 2012 the Scottish Government set out its aim that telehealth and telecare will be provided for an additional 300000 people by March 2015 as a milestone towards achieving the 2020 Vision56 It is focusing on rolling out a number of telehealth and telecare projects at a larger scale than the previous smaller pilots Both the Scottish Government and the European Union have provided funding for telehealth and telecare projects
Endnotes | 45
Endnotes
1 The total budget for the Scottish Governmentrsquos Health and Wellbeing Portfolio includes the budgets for health sport and equalities
2 2020 Vision ndash Strategic Narrative Scottish Government September 2011
3 In this report we refer to NHS National Services Scotland the Mental Welfare Commission and Healthcare Improvement Scotland as special health boards
4 Three special boards revenue budgets increased in 201314 National Waiting Times Centre (114 per cent) Scottish Ambulance Service (01 per cent) and NHS 24 (05 per cent)
5 The revenue budget is known as the Revenue Resource Limit (RRL) and the capital budget is known as the Capital Resource Limit (CRL)
6 NHS financial performance 201213 (PDF) Audit Scotland October 2013
7 Response from the Scottish Government to the Public Audit Committee dated 1 August 2014
8 These reports were prepared under Section 22 of the Public Finance and Accountability (Scotland) Act 2000 and are published on Audit Scotlandrsquos website
9 Recurring savings are savings that once achieved recur year-on-year from that date for example savings on staff costs as a result of streamlining services Non-recurring savings only happen once for example not filling a vacancy on a temporary basis
10 NHS Ayrshire and Arran Borders Dumfries and Galloway Highland Lanarkshire Orkney Shetland National Waiting Times Board NHS 24 NHS Education for Scotland and State Hospital
11 Annual State of NHSScotland Assets and Facilities Report for 2012 Scottish Government December 2012
12 Annual State of NHSScotland Assets and Facilities Report for 2013 Scottish Government December 2013
13 The Scottish Government has defined high-risk backlog maintenance as work that must be addressed as an urgent priority Significant risk is the next highest priority category of backlog maintenance and requires expenditure in the short term ndash Correspondence from the Scottish Government to the Public Audit Committee dated 16 January 2013
14 Backlog maintenance reduced in (level of backlog at 2013 in brackets) NHS Ayrshire and Arran (pound77m) Dumfries and Galloway (pound51m) Forth Valley (pound13m) Grampian (pound159m) Greater Glasgow and Clyde (pound167m) Lanarkshire (pound57m) Lothian (pound96m) Orkney (pound95m) Shetland (pound38m) Tayside (pound50m) National Waiting Times Centre (pound26m) NHS National Services Scotland (pound26m) NHS 24 (pound0m) and State Hospital (pound03m) It increased in NHS Borders (pound65m) Fife (pound70m) Highland (pound83m) Western Isles (pound32m) NHS Education for Scotland (pound03m) NHS Health Scotland (pound01m) and the Scottish Ambulance Service (pound33m) NHS Highland has reported that one reason for its backlog maintenance increasing is that a number of properties transferred from the council to the board in 2012 as part of health and social care integration
15 Annual State of NHSScotland Assets and Facilities Report for 2013 Scottish Government December 2013
16 Outline Business Case for a Care Village in Stirling (A Health amp Social Care Partnership Venture) NHS Forth Valley Stirling Council and Forth Valley College 2 December 2013
17 The Healthcare Quality Strategy for NHSScotland Scottish Government May 2010
18 Scottish National Point Prevalence Survey of Healthcare Associated Infection and Antimicrobial Prescribing 2011 Health Protection Scotland April 2012 Rates of individual HAIs (MRSA and Clostridium difficile) have continued to decrease (Scotland Performs Scottish Government website)
19 Heart disease statistics update ISD Scotland January 2014
20 Scottish Inpatient Patient Experience Survey 2014 Scottish Government August 2014
22 Depending on the target this may be performance for the month ending March 2014 or for the quarter ending March 2014 The notes in Exhibit 5 give details for each target
46 |
23 ISD Waiting Times Warehouse data August 2014
24 The National Waiting Times Board a special NHS board met the target for three months in 201314
25 These figures are for standard delayed discharges They exclude delayed discharges recorded under lsquocode 9rsquo for patients with complex needs This includes patients delayed due to waiting for a place in a high-level needs specialist facility where no facilities exist or where an adult may lack capacity under adults with incapacity legislation
26 ISD calculates the cost of days lost to delayed discharges using a cost per day that excludes costs not incurred by delayed patients such as costs related to admissions and allows for the reduced medical and other clinical care that is required for delayed patients This average cost is around pound185 per day
27 These figures are for standard delayed discharges
28 These are called Day of Care Surveys
29 Scottish Inpatient Patient Experience Survey 2014 Volume 1 National Results Scottish Government August 2014
30 Reshaping care for older people (PDF) Audit Scotland February 2014 (Case study 2 page 30)
31 Scottish Government allocation letters to NHS boards 201314
32 NHS financial performance 201213 (PDF) Audit Scotland October 2013
33 Using locum doctors in hospitals (PDF) Audit Scotland June 2010
34 Additional 2020 Local Delivery Plan Guidance Scottish Government December 2013
35 Spending increased slightly in NHS Ayrshire and Arran (15 per cent) NHS Tayside (07 per cent) and NHS Western Isles (13 per cent)
36 NHS Forth Valley NHS Greater Glasgow and Clyde and NHS Tayside
37 NHS Western Isles and NHS 24
38 Management of patients on NHS waiting lists (PDF) Audit Scotland February 2013
39 Why is health care inflation greater than general inflation Charlesworth A Journal of Health Services Research and Policy June 2014
40 Economic and Fiscal Outlook ndash March 2014 Office for Budget Responsibility March 2014
41 Under the current state pension arrangements members of the NHS Superannuation Scheme pay a reduced rate of National Insurance (NI) Their employers the NHS boards also contribute reduced NI payments on their behalf This is because it is assumed that the scheme members have opted not to contribute to or claim the additional state pension (an additional element paid on top of the basic state pension) Reforms mean the additional state pension will no longer exist and everyone will receive a flat rate basic state pension
42 Scottish Government budget 201415 ndash Performance evaluation material for Parliamentary Committees Scottish Government September 2013
43 Projected Population of Scotland (2012-based) National Records of Scotland 2013
44 Accident and Emergency performance update (PDF) Audit Scotland May 2014
45 Scotlandrsquos National Dementia Strategy Scottish Government 2010
46 The Healthcare Quality Strategy for NHSScotland Scottish Government May 2010
47 Review of orthopaedic services (PDF) Audit Scotland March 2010
48 2020 Vision ndash Strategic Narrative Scottish Government September 2011
49 Reshaping care for older people (PDF) Audit Scotland February 2014 Review of Community Health Partnerships (PDF) Audit Scotland June 2011 Overview of the NHS in Scotlandrsquos performance 200809 (PDF) Audit Scotland December 2009 Financial overview of the NHS in Scotland 200708 (PDF) Audit Scotland December 2008
50 Audit Scotland analysis of NHS Costs Book data Spending on community family health services and resource transfer as stated in the costs book has been counted as being spent in the community
51 Figures in real terms 201213 prices Audit Scotland analysis of Local Financial Return statistics 200203 ndash 201213
52 Royal College of Physicians of Edinburgh press release June 2012
53 Management of patients on NHS waiting lists audit update (PDF) Audit Scotland December 2013
54 Improving patient flow How two trusts focused on flow to improve the quality of care and use available capacity effectively The Health Foundation April 2013
55 A review of telehealth in Scotland (PDF) Audit Scotland October 2011
56 A National Telehealth and Telecare Delivery Plan for Scotland to 2015 Scottish Government 2012
Appendix 1 Audit methodology | 47
Appendix 1Audit methodology
Methodology for analysing demand capacity and patient flow
To get a better understanding of some of the pressures on NHS services we carried out data analysis looking at
bull the demand for healthcare services
bull the capacity of the NHS to provide services
bull the flow of patients through the healthcare system
This is the first stage of this work and we have presented some high-level findings throughout the report We will be carrying out further analysis looking in more detail at hospital and specialty level data and daily activity We will publish a briefing paper on this analysis in early 2015
For this report we looked at the NHS as a whole system We tried to identify some of the main pressures facing NHS boards and how a pressure in one part of the system can affect another part of the system We have summarised these pressures in Exhibit 13 (page 40) Throughout the report we explain some of these in more detail and how this affects patients and services
In addition to drawing on information from our previous reports we analysed a range of published data and also requested some bespoke analysis from ISD Scotland This includes the following data
bull ISD Scotland
ndash acute hospital inpatient day-case and outpatient activity (admissions discharges average length of stay multiple emergency admissions average number of staffed beds bed occupancy rates)
ndash number of procedures carried out in hospitals
ndash waiting times for inpatient and day-case treatment and outpatient clinics
ndash hospital workforce numbers and vacancies
ndash number of general practice contacts with GPs and practice nurses
ndash Quality and Outcomes Framework (QOF) prevalence rates for a number of health conditions
ndash number of delayed discharges and occupied bed days
ndash care home census
bull Scottish Government community healthcare assessments data
bull National Records of Scotland population statistics
bull Alzheimer Scotland information
NHS in Scotland 201314This report is available in PDF and RTF formats along with a podcast summary at wwwaudit-scotlandgovuk
If you require this publication in an alternative format andor language please contact us to discuss your needs 0131 625 1500 or infoaudit-scotlandgovuk
For the latest news reports and updates follow us on Twitter or subscribe to our email delivery service
AuditScotland
Subscribe to updates
ISBN 978 1 909705 49 4 AGS20146
Audit Scotland 110 George Street Edinburgh EH2 4LHT 0131 625 1500 E infoaudit-scotlandgovuk wwwaudit-scotlandgovuk
This publication is printed on 100 recycled uncoated paper
Key facts
Summary
Key messages
Recommendations
About the audit
Part 1 The NHS in Scotland is facing significant pressures
Key messages
NHS budgets are under pressure
Exhibit 1
All NHS boards met their financial targets in 201314 but some are facing increasing difficulty in achieving them
Exhibit 2
Case study 1
Case study 2
Case study 3
Five boards continue to rely on high levels of non-recurring savings
Exhibit 3
NHS boards are making less progress than expected on reducing backlog maintenance
The annual financial target for capital spending makes it difficult to plan longer-term projects
Exhibit 4
There have been improvements in the quality of healthcare
Performance against waiting time targets is showing increasing signs of pressure
Exhibit 5
Case study 4
Exhibit 6
There is growing evidence of staff pressures
Exhibit 7
Spending on private sector healthcare reduced in 201314
Most boards do not consider integrated performance reports
Case study 5
Part 2 Looking ahead
Key messages
The NHS will continue to face increasing pressures
Exhibit 8
Exhibit 9
The Scottish Government has set out its long-term strategy for the NHS but boards do not yet have detailed plans in place
Exhibit 10
Planning needs to be underpinned by a better understanding of demand capacity and patient flows
Exhibit 11
Exhibit 12
Exhibit 13
Case study 6
Exhibit 14
The Scottish Government is working with NHS boards to improve patient flow
Endnotes
Appendix 1 Audit methodology
NHS in Scotland 201314
Exhibit 9
Scotlands population is ageing
2012
2037
Population
Percentage of population
Estimated population
Percentage of estimated population
Under 65 years
4387849
83
4307213
75
65-74 years
507265
10
694412
12
75-84 years
309244
6
504249
9
85 years and older
109242
2
274497
5
Note Due to rounding the total percentages add up to 101 per cent
Source Projected Population of Scotland (2012-based) National Records of Scotland 2013
NHS in Scotland 201314
Exhibit 6
Number of delayed discharges and occupied bed days 2012-2014
Number of bed days occupied by delayed discharges
Number of delayed discharges
July 2012
90425
778
October 2012
95527
835
January 2013
99198
711
April 2013
101534
621
July 2013
96448
698
October 2013
99815
781
January 2014
107076
908
April 2104
117818
791
Note The number of delayed discharges refers to all patients who experienced a delay of any length It excludes code 9 patients with complex needs
Source ISD Scotland
NHS in Scotland 201314
Exhibit 3
Recurring and non-recurring savings
Territorial boards
Percentage recurring savings
Percentage non-recurring savings
201213
NHS Highland
45
55
201314
38
62
201213
NHS Orkney
69
31
201314
41
59
201213
NHS Borders
65
35
201314
48
52
201213
NHS Tayside
44
56
201314
50
50
201213
NHS Shetland
80
20
201314
52
48
201213
NHS Lanarkshire
91
9
201314
61
39
201213
NHS Ayrshire and Arran
95
5
201314
67
33
201213
NHS Fife
53
47
201314
69
31
201213
NHS Western Isles
71
29
201314
73
27
201213
NHS Lothian
70
30
201314
85
15
201213
NHS Dumfries and Galloway
96
4
201314
94
6
201213
NHS Grampian
87
13
201314
97
3
201213
NHS Forth Valley
78
22
201314
100
0
201213
NHS Greater Glasgow and Clyde
100
0
201314
100
0
Special boards
Percentage recurring savings
Percentage non-recurring savings
201213
The State Hospital
73
27
201314
59
41
201213
National Waiting Times Centre
87
13
201314
69
31
201213
Healthcare Improvement Scotland
83
17
201314
83
17
201213
NHS Education for Scotland
86
14
201314
84
16
201213
NHS 24
100
0
201314
93
7
201213
Scottish Ambulance Service
96
4
201314
98
2
201213
NHS Health Scotland
100
0
201314
100
0
201213
NHS National Services Scotland
100
0
201314
100
0
Source NHS boards financial performance returns March 2014 NHS Orkney updated its savings information in July 2014
NHS in Scotland 201314
Exhibit 3
Recurring and non-recurring savings
Territorial boards
Percentage recurring savings
Percentage non-recurring savings
201213
NHS Highland
45
55
201314
38
62
201213
NHS Orkney
69
31
201314
41
59
201213
NHS Borders
65
35
201314
48
52
201213
NHS Tayside
44
56
201314
50
50
201213
NHS Shetland
80
20
201314
52
48
201213
NHS Lanarkshire
91
9
201314
61
39
201213
NHS Ayrshire and Arran
95
5
201314
67
33
201213
NHS Fife
53
47
201314
69
31
201213
NHS Western Isles
71
29
201314
73
27
201213
NHS Lothian
70
30
201314
85
15
201213
NHS Dumfries and Galloway
96
4
201314
94
6
201213
NHS Grampian
87
13
201314
97
3
201213
NHS Forth Valley
78
22
201314
100
0
201213
NHS Greater Glasgow and Clyde
100
0
201314
100
0
Special boards
Percentage recurring savings
Percentage non-recurring savings
201213
The State Hospital
73
27
201314
59
41
201213
National Waiting Times Centre
87
13
201314
69
31
201213
Healthcare Improvement Scotland
83
17
201314
83
17
201213
NHS Education for Scotland
86
14
201314
84
16
201213
NHS 24
100
0
201314
93
7
201213
Scottish Ambulance Service
96
4
201314
98
2
201213
NHS Health Scotland
100
0
201314
100
0
201213
NHS National Services Scotland
100
0
201314
100
0
Source NHS boards financial performance returns March 2014 NHS Orkney updated its savings information in July 2014
NHS in Scotland 201314
Exhibit 3
Recurring and non-recurring savings
Territorial boards
Percentage recurring savings
Percentage non-recurring savings
201213
NHS Highland
45
55
201314
38
62
201213
NHS Orkney
69
31
201314
41
59
201213
NHS Borders
65
35
201314
48
52
201213
NHS Tayside
44
56
201314
50
50
201213
NHS Shetland
80
20
201314
52
48
201213
NHS Lanarkshire
91
9
201314
61
39
201213
NHS Ayrshire and Arran
95
5
201314
67
33
201213
NHS Fife
53
47
201314
69
31
201213
NHS Western Isles
71
29
201314
73
27
201213
NHS Lothian
70
30
201314
85
15
201213
NHS Dumfries and Galloway
96
4
201314
94
6
201213
NHS Grampian
87
13
201314
97
3
201213
NHS Forth Valley
78
22
201314
100
0
201213
NHS Greater Glasgow and Clyde
100
0
201314
100
0
Special boards
Percentage recurring savings
Percentage non-recurring savings
201213
The State Hospital
73
27
201314
59
41
201213
National Waiting Times Centre
87
13
201314
69
31
201213
Healthcare Improvement Scotland
83
17
201314
83
17
201213
NHS Education for Scotland
86
14
201314
84
16
201213
NHS 24
100
0
201314
93
7
201213
Scottish Ambulance Service
96
4
201314
98
2
201213
NHS Health Scotland
100
0
201314
100
0
201213
NHS National Services Scotland
100
0
201314
100
0
Source NHS boards financial performance returns March 2014 NHS Orkney updated its savings information in July 2014
18 |
savings were the result of short-term initiatives rather than changing the way that services are provided in order to improve productivity This is similar to last year when 28 per cent of productivity savings were non-recurring higher than forecast The difficulty NHS boards have achieving recurring productivity savings is another strain on them and adds to their financial pressures for the coming year
17 Seven territorial and four special boards had higher overall levels of non-recurring savings in 201314 than in the previous year10 Five boards reported a particularly high percentage of non-recurring savings
bull NHS Highland (62 per cent)
bull NHS Orkney (59 per cent)
bull NHS Borders (52 per cent)
bull NHS Tayside (50 per cent)
bull NHS Shetland (48 per cent)
18 These boards will have to find further savings in future years on top of the annual savings target This position is not sustainable especially since boards are required to continue to make three per cent savings from 201415
19 NHS boards set out their financial projections up to five years ahead in their Local Delivery Plans (LDPs) showing expected funding projected expenditure and the savings required each year to close the gap between income and expenditure For 201415 NHS boardsrsquo detailed financial planning is still limited mainly to the first year of the LDP Across the NHS
bull six per cent of the required savings for 201415 are unidentified
bull over two-thirds of the amount of savings are unidentified for the following four years
bull five NHS boards have not identified the breakdown of the amount of their savings after 201415 (Fife Forth Valley Greater Glasgow and Clyde Lothian and Western Isles)
NHS boards are making less progress than expected on reducing backlog maintenance
20 Further cost pressures arise from the backlog of maintenance required to ensure that hospitals and other buildings are fit for purpose In 2012 the Scottish Government forecast that the cost of this backlog would decrease by pound174 million by 2013 from pound948 million to pound774 million11 The actual reduction was pound90 million to pound858 million12 The high-risk backlog reduced to pound96 million pound21 million less of a reduction than anticipated The significant-risk backlog rose from pound265 million to pound275 million13 This reflects additional maintenance identified by boards through survey work during 2013 as well as some lack of progress in carrying out backlog maintenance
21 The level of backlog maintenance decreased in 14 boards and increased in seven14 The total increase in the seven boards was pound199 million of which NHS
Part 1 The NHS in Scotland is facing significant pressures | 19
Fife had by far the largest increase of pound135 million In three of these boards (NHS Borders NHS Highland and the Scottish Ambulance Service) the backlog had also increased in 2012 The increase of pound34 million in NHS Highland is a further financial pressure on the board In four boards over 50 per cent of the cost of backlog maintenance was classed as high-risk and significant risk NHS Lothian (84 per cent) NHS Shetland (82 per cent) NHS Tayside (54 per cent) and NHS Ayrshire and Arran (52 per cent)
22 The Scottish Government now forecasts that the majority of high-risk maintenance backlog will be cleared by 2015 one year later than originally planned The significant-risk backlog is now forecast to decrease to around pound150 million by 2017 compared with the previous forecast that it would be cleared by 2016
The annual financial target for capital spending makes it difficult to plan longer-term projects
23 Capital investment is important in enabling boards to plan and deliver the 2020 Vision by investing in new healthcare facilities maintaining and modernising existing facilities that will be required in future and disposing of those that are no longer needed The NHS capital budget available to boards fell by 21 per cent between 201213 and 201314 from pound6055 million to pound4813 million More than half of this reduction related to accounting adjustments associated with revenue-financed methods such as Non-Profit Distribution (NPD) which do not affect the capital funds available for boards to spend The remaining capital budget available to boards reduced by 12 per cent to pound4664 million
24 All boards broke even against their capital budgets in 201314 but significant movements in their budgets were required during the year to allow them to reach that position (Exhibit 4 page 20) The Scottish Government manages the capital budget carefully during the year moving funds from NHS boards that expect delays in their expenditure to those that are able to make use of the funding This allows the NHS as a whole and individual boards to stay within their capital budgets but it makes it difficult to see how well NHS boards have managed their resources The Scottish Government has increased the proportion of total capital funding that is included in initial allocations each year although it did not agree final budgets with several NHS boards until after the end of the financial year NHS boardsrsquo annual accounts are still not clear about the extent of and reasons for movements in their capital budgets during the year
25 The annual financial targets for capital budgets and uncertainty about future budgets hinders NHS boardsrsquo effective planning of capital projects For example NHS boards returned around pound29 million of capital funding to the Scottish Government during 201314 A number of boards that had returned capital funds in previous years received these funds back in 201314 and subsequently returned them again For example NHS Grampian agreed with the Scottish Government to defer some of its capital budget allocation from 201112 and 201213 into 201314 to help manage the cost of essential backlog maintenance at Aberdeen Royal Infirmary From 201415 the Scottish Government has issued two-year indicative capital allocations to NHS boards to help them manage their capital programmes
26 The NHS needs the right buildings and facilities to achieve the 2020 Vision and provide healthcare that meets future needs Over the next four years the
20 |
Scottish Government plans to invest around pound330 million in new facilities and other capital projects in the community15 This investment is intended to help move towards more community-based and preventative care by April 2017 For example NHS Forth Valley Stirling Council and Forth Valley College plan to develop the Stirling Care Village as part of their wider plans to change and improve care for older people This model intends to combine primary and community healthcare with care for older people providing joined-up services GP surgeries the voluntary sector and other local service providers will also be involved in delivering enhanced services through this model of care16
Exhibit 4There were significant movements in the NHS capital budget in 201314Both the overall capital budget and the budget available for investment decreased from 201213
201213pound million
201314pound million change
Total capital budget 6055 4813 -2052
Split into
Capital provided for investment in board capital programmes 5281 4664 -1168
Capital funded by the Scottish Parliament for accounting treatment for new revenue-financed projects
775 149 -8072
There were also significant movements in the capital budget across all boards These follow a similar pattern to the movements in 201213
Note The capital budget shown here is represented by the final capital resource limits (CRLs) from the NHS boards accounts This differs from the capital budget allocated to the NHS within the Scottish Government Budget due to adjustments for example for assets donated to the boards
Part 1 The NHS in Scotland is facing significant pressures | 21
There have been improvements in the quality of healthcare
27 The Scottish Government has set out the national strategy for the NHS in the 2020 Vision and the Healthcare Quality Strategy These aim to improve the quality and safety of patient care and health outcomes17 The Scottish Patient Safety Programme focuses on improving the safety and reliability of healthcare and reducing harm For example a focus on healthcare-associated infections (HAIs) resulted in a 50 per cent reduction in adult patients in hospital with HAIs between 2005 and 2011 (from 95 per cent to 49 per cent) and rates continue to fall18 Health outcomes for some conditions have also improved Cancer and heart disease are the two main causes of death in Scotland Between 2003 and 2012 the death rate for all forms of heart disease fell by 38 per cent and the number of people having a heart attack fell by a fifth19 The Scottish Government has a policy objective to improve early detection of cancer which improves outcomes for patients Between 2010 and 2013 the number of people diagnosed with early stage breast colorectal or lung cancer increased by 75 per cent Patient satisfaction with hospital inpatient services has also generally increased since 201220
Performance against waiting time targets is showing increasing signs of pressure
28 NHS boards are required to meet a number of performance targets that cover health improvement efficiency access and treatment (HEAT targets) These aim to ensure that NHS boards focus on making improvements in areas the Scottish Government has identified as priorities to help to achieve its overall purpose and objectives21 In recent years the Scottish Government has reduced the number of HEAT targets and has committed to focusing more on outcomes But the level of performance that boards are expected to achieve has become more challenging at the same time as budgets are tightening This is making it increasingly difficult for NHS boards to continue to meet HEAT targets
29 Many of the HEAT targets relate to waiting times Waiting time targets have reduced over the past ten years and the length of time that people wait has decreased considerably Some targets have become more challenging for NHS boards recently
bull Delayed discharges ndash since April 2013 NHS boards have been working to the target that no patient should wait in hospital for more than 28 days from when they are clinically ready for discharge (reduced from 42 days previously) From April 2015 this is due to reduce further to 14 days Boards are finding it difficult to meet the current target with only three boards meeting this at the end of April 2014 (Exhibit 5 page 23)
bull Specialist Child and Adolescent Mental Health Services (CAMHS) ndash the current target is that 90 per cent of patients should wait no longer than 26 weeks from referral to treatment This target is due to reduce to 18 weeks from December 2014 Performance against the current target deteriorated between 201213 and 201314 from 99 to 93 per cent of all patients seen within 26 weeks (Exhibit 5)
bull The treatment time guarantee (TTG) was introduced on 1 October 2012 under the Patient Rights (Scotland) Act 2011 All eligible patients now
22 |
have a legal right to receive planned inpatient or day-case treatment within 12 weeks of the treatment being agreed This is the first time that waiting times have been a legal right and puts more pressure on boards to ensure that all patients are seen within the required time The TTG has not been met nationally since it was introduced and only five territorial boards met it in March 2014
30 Last year we highlighted that the failure to meet some key waiting time targets suggested capacity pressures in boards Overall performance against several of these targets deteriorated between 201213 and 201314 indicating increasing capacity pressures in boards (Exhibit 5) The Scottish Government has recently lowered the threshold for the AampE target as boards were struggling to meet it From April 2013 the AampE waiting time target was temporarily lowered from 98 per cent of patients to be seen within four hours to 95 per cent The 95 per cent target is due to be delivered by the year ending September 2014 and performance data will be published at the end of November 2014
31 Across Scotland at the end of March 201422
bull Only three of the key waiting time targets were met nationally the drug and alcohol treatment target (met by all 14 territorial boards) the cancer (decision to treat to first treatment) target (met by 11 territorial boards) and access to CAMHS (met by nine territorial boards) These three targets were also met at the end of March 2013 The 18-week referral to treatment target which was met in at the end of March 2013 was not met at the end of March 2014
bull No territorial board met the outpatient waiting time target and only three boards met the delayed discharges target (NHS Ayrshire and Arran NHS Orkney and NHS Shetland)
bull Boards are finding it challenging to meet the TTG four-hour AampE target and cancer (urgent referral to first treatment) target
bull Performance against the targets varied by board While NHS Orkney met eight of the nine targets and NHS Shetland met seven NHS Grampian and NHS Lothian met two of the nine targets NHS Greater Glasgow and Clyde and NHS Highland met three and NHS Tayside met four
32 More detailed analysis of performance against these key targets highlights the variability across boards and specialties For example most patients waiting longer than the TTG target of 12 weeks at the end of March 2014 were in NHS Lothian and NHS Grampian More recent information for June 2014 shows that
bull no patients were waiting longer than 12 weeks in any specialty in NHS Forth Valley NHS Greater Glasgow and Clyde NHS Lanarkshire NHS Orkney NHS Shetland and NHS Western Isles
bull the three boards with the highest number of people waiting for more than 12 weeks for treatment were NHS Lothian NHS Highland and NHS Grampian
bull the specialties with the highest number of people waiting more than 12 weeks in NHS Lothian were plastic surgery (125 patients) urology (93) and general surgery (49) in NHS Highland it was trauma and orthopaedics (166) and in NHS Grampian it was plastic surgery (133) and ophthalmology (88)23
Part 1 The NHS in Scotland is facing significant pressures | 23
Exhibit 5Performance against waiting time and delayed discharge targets in territorial NHS boardsPerformance against some waiting time targets deteriorated in some boards (end of March 2013 to end of March 2014)
Child and Adolescent Mental Health Services (CAMHS)1
Drug and alcohol treatment2
Referral to treatment (RTT)1
Out-patients1
Inpatientday-case treatment time guarantee (TTG)1 3 4 AampE1
Cancer ndash urgent referral to first treatment2
Cancer ndash decision to treat to first treatment2
Delayed discharges5
Targetstandard 26 wks 3 wks 18 wks 12 wks 12 wks 4 hrs 62 days 31 days 4 wks
Met Met temporaryinterim target Met for over 99 of patients Within 5 Not met
Notes1 Data is for month ended 31 March 2013 and 2014 CAMHS data for NHS Highland is not available for March 2014
The AampE target was 98 per cent at March 2013 and 95 per cent at March 2014 2 Data for quarter ended 31 March 2013 and 20143 TTG applies to patients added to the waiting list from 1 October 2012 only4 TTG incorporates a legal right to treatment so we have categorised this as met not met or met for over 99 per cent of patients5 Performance against this standard is based on a census at point in time The delayed discharges data are at the end of April 2013 and 20146 National Waiting Times Board is not included in this table Four of these targets apply to this board ndash Referral to treatment (RTT) Outpatients Inpatientday case treatment time guarantee (TTG) and Cancer ndash decision to treat to first treatment The board met all four of these targets
Source Based on data from ISD Scotland and subject to any caveats described by ISD Scotland
24 |
Demand for outpatient appointments is increasing faster than the number of patients seen33 NHS boards need to manage demand for outpatient clinics alongside inpatients and day cases They are finding it difficult to meet the target that new outpatients should be seen within 12 weeks of referral and none of the territorial boards met the target throughout 20131424 Demand for outpatient appointments has increased over the last three years but the number of people seen has not increased to the same extent At the quarter ending March 2014
bull the number of people on waiting lists for a new outpatient appointment was 34 per cent higher than at the quarter ending March 2010 increasing from 187693 to 252009
bull the number of new outpatients seen during the same period increased by only 13 per cent from 324403 to 367259 meaning that the number of people waiting is continuing to increase
bull the number of people who had been waiting longer than 12 weeks increased from 157 at the quarter ending March 2010 to 6754 at the quarter ending March 2014
34 The increasing number of people waiting over 12 weeks indicates pressure on NHS boardsrsquo capacity For example the number of procedures carried out in outpatients has more than doubled since 200809 to 380456 procedures in 201213 There are risks this pressure will increase as demand continues to grow This pressure can only be tackled by some combination of
bull increasing the number of new outpatient appointments available for example by allocating additional staffing and other resources
bull further reducing the number of people attending for follow-up appointments (the ratio of follow-up to new appointments has reduced from 23 in 2004 to 19 in 2013) A new approach is being implemented in hospitals across Scotland to reduce the number of follow-up patients attending orthopaedic clinics (Case study 4 page 25)
bull reducing the number of outpatient referrals by moving to other models of care such as self-management telehealth and telecare
Delays in discharging patients are putting pressure on hospital beds35 Although the overall average (mean) length of stay in hospital has reduced delays in discharging patients who are clinically ready to leave hospital have been increasing over the last five years especially during 201314 They increased from around 101500 bed days over the quarter ending April 2013 to 117800 over the quarter ending April 2014 (Exhibit 6 page 26)25 In 201314 a total of 421157 bed days were occupied by patients who were delayed at an estimated cost to the NHS of pound78 million26
36 Most patients who are affected by delayed discharges are aged 75 and over This reflects their more complex needs and difficulties in organising the community support they need In April 2014
bull there were 738 patients across Scotland whose discharge was delayed compared to 564 in April 2013
Part 1 The NHS in Scotland is facing significant pressures | 25
bull 173 patients were delayed for four weeks or more
bull the most common reason for delays of four weeks or more was waiting for a place in a care home Shorter delays (two weeks or less) were mainly due to waiting for community care assessments27
37 In 2013 and 2014 a number of NHS boards carried out snapshot audits reviewing the healthcare needs of all patients in hospital on one day28 These found that for around 25 per cent of patients there was no clinical reason for them to remain in hospital Reasons for patients remaining in hospital included waiting to be reviewed by a consultant waiting for a place in a care home and waiting for a social work assessment NHS boards are using this information to identify areas for improvement for example focusing on groups of patients at more risk of spending longer in hospital than clinically necessary
38 While the overall results of the latest NHS inpatient experience survey were positive the one aspect that was less positive was leaving hospital29 Fourteen per cent of patients indicated that they had to stay in hospital longer than expected to wait for their care or support services to be organised Two-fifths of patients experienced a delay on the day they were leaving hospital mainly
Case study 4Follow-up care for patients with a fracture has been redesigned
Around 100000 people a year in Scotland have a fracture that does not require surgery In these cases the fracture is left to heal and no follow-up treatment is required Traditionally all patients with a fracture were fitted with a cast and would have to return to an outpatient clinic to have the cast removed
In around 80 per cent of Scottish hospitals a new approach has been introduced for patients with a fracture that does not require surgery Patients are treated in AampE and fitted with a removable cast if possible Patients are provided with information to allow them to self-manage and around 40 per cent do not need to return to hospital for follow-up care The remaining patients are referred to an orthopaedic clinic The orthopaedic team is able to follow up around a fifth of these patients by telephone conversation and the remainder of patients attend an orthopaedic outpatient clinic for follow-up
Glasgow Royal Infirmary (GRI) started using this approach in 2011 and was one of the first hospitals to use it Since it was introduced referrals from AampE to the orthopaedics department have decreased by over 50 per cent and it has reduced travel time for patients GRI has reported that it has improved patient flow in both its AampE and orthopaedics departments It has reduced the number of orthopaedic patients in AampE who wait longer than four hours and freed up orthopaedic consultant time to see new outpatient referrals
Source Audit Scotland based on information provided by the Quality and Efficiency Support Team (QuEST) at the Scottish Government
26 |
Exhibit 6Number of delayed discharges and occupied bed days 2012ndash14The number of bed days occupied by patients who experience a delayed discharge has been steadily increasing
Number of bed days occupied by delayed discharges
Number of delayed discharges
Num
ber
of b
ed d
ays
occu
pied
by
dela
yed
disc
harg
es (0
00s)
Jul2012
Oct2012
Jan2013
Apr2013
Jul2013
Oct2013
Jan2014
Apr2014
140
120
100
80
60
40
20
0
Num
ber
of d
elay
ed d
isch
arge
s
1000
900
800
700
600
500
400
300
200
100
0
Note The number of delayed discharges refers to all patients who experienced a delay of any length It excludes code 9 patients with complex needs
Source ISD Scotland
because they had to wait for medicines with 16 per cent waiting longer than four hours Delays in patients being discharged mean that beds are not available to other patients who need them causing delays and blockages elsewhere in the system NHS boards need to ensure they have detailed information about discharge times and the reasons for delays to effectively manage patient flows
39 Some boards for example NHS Fife NHS Forth Valley and NHS Lanarkshire are co-locating staff from the hospital and community including social work to coordinate planning for patientsrsquo discharge from hospital Staff in these discharge hubs work with ward staff to identify patientsrsquo needs and start planning their discharge as soon as they are admitted to hospital The aim is to minimise any delays and to ensure patients have sufficient support in the community In NHS Forth Valley they also provide advice and guidance to hospital staff and GPs including potential alternatives to admitting people to hospital We included a case study on the integrated discharge hub in NHS Fife in our AampE report
40 Our report on reshaping care for older people highlighted how NHS Tayside and Perth and Kinross Council are working together to
bull redesign systems so that patients can be discharged home from hospital as quickly as possible
bull provide community-based alternatives to hospital and long-term residential care
bull use data to work with GPs to understand how they are using local services and to change how older people receive care and support30
Exhibit 6
Audit Scotland
Exhibit 6
Exhibit 6 background data
Part 1 The NHS in Scotland is facing significant pressures | 27
The NHS puts considerable effort into meeting performance targets 41 The Scottish Government and NHS boards put a great deal of effort into attempting to meet annual waiting time targets The Scottish Government also provided additional funding for NHS boards For example in 201314 the Scottish Government provided NHS boards with at least pound17 million additional funding during the year to support waiting time targets This is similar to the additional funding of at least pound20 million that it provided in 20121331 During 201314 NHS boards also received additional funding of pound9 million to improve emergency and urgent care including reducing waiting times in AampE NHS boards have noted additional workforce costs to provide additional capacity to meet waiting times targets particularly the TTG This level of focus on meeting waiting times targets may not be sustainable when combined with the additional pressures of increasing demands related to demographic changes and the overall health budget starting to decrease in real terms
42 National targets are helpful in targeting areas for improvement in performance For example the focus on waiting time targets has led to a considerable reduction in the length of time that people wait for treatment However it is becoming more difficult for NHS boards to meet these targets fully The extent of the effort required to try to meet them makes it more difficult for NHS boards to focus on long-term planning and moving more care into the community There are risks that too narrow a focus on targets can detract attention from achieving the wider aims
43 The Scottish Government is reviewing the HEAT framework and aims to have updated guidance for boards by November 2014 It should review whether the current financial and performance targets for the NHS are achievable at the same time as implementing the 2020 Vision for health and social care within the tight financial resources available It should consider setting targets for NHS boards that will help them work towards the 2020 Vision for example introducing milestones to measure the extent to which boards are moving towards more preventative and community-based care
There is growing evidence of staff pressures
44 The availability of staff is another important factor in NHS boardsrsquo capacity to provide patient care The number of consultants and nursing and midwifery staff in post has increased slightly each year since 2012 Between March 2013 and March 2014 the number of vacancies for nursing and midwifery staff was stable after increasing the previous year but the number of consultant vacancies increased significantly (Exhibit 7 page 28) This may be related to some extent to the increase in the number of consultant posts and the time lag in filling new posts However the number of posts vacant for six months or more almost doubled from 41 whole-time equivalent (WTE) at 31 March 2013 to 792 WTE in March 2014
45 Of the mainland territorial boards consultant vacancy rates were highest in NHS Dumfries and Galloway (154 per cent) NHS Fife (133 per cent) NHS Forth Valley (102 per cent) and NHS Grampian (99 per cent) With the exception of NHS Dumfries and Galloway these boards experienced difficulty achieving a number of performance targets in 201314 (Exhibit 5)
46 Many NHS boards have reported difficulties filling medical vacancies in some specialties and some geographical areas leading to greater use of locum doctors to maintain services NHS boardsrsquo workforce plans comment on a number of factors that are contributing to these difficulties including
28 |
bull changes in junior doctor training since the introduction of Modernising Medical Careers in 2005 These changes have led to a reduction in the number of junior doctors available and NHS boards needing more middle grade doctors and consultants
bull strong competition among NHS boards for medical staff This can make it more difficult for smaller boards and more rural areas to compete with larger boards which can offer more opportunities such as research and development
bull difficulty recruiting and retaining staff in some specialties with unattractive working patterns such as emergency medicine or where there is a national shortage and greater levels of part-time working such as paediatrics
47 These difficulties have an impact on NHS boardsrsquo ability to provide services and on their financial position For example
bull NHS Highland reported that its financial position in 201314 was negatively affected by spending on locums It anticipates that this will continue to be a cost pressure in 201415 (Case study 1)
bull NHS Orkney required brokerage from the Scottish Government to help cover increased spending on locum doctors and agency nursing staff (Case study 2)
bull NHS Dumfries and Gallowayrsquos spending on locums increased from pound63 million in 201213 to pound76 million in 201314 The board reported that this is due to increased demand and difficulty filling posts
bull NHS Grampian has reported that consultant vacancies in oncology are affecting cancer services and patients are having to receive treatment in other boards It has reported significant difficulty recruiting some groups of
Exhibit 7Consultant nursing and midwifery workforce March 2012 to March 2014The number of vacant consultant posts increased significantly between 2013 and 2014
At 31 March 2012 (wte)
At 31 March 2013 (wte)
At 31 March 2014 (wte)
increase 2012 to 2013
increase 2013 to 2014
Consultant staff in post 44277 45316 46936 23 36
Consultant vacancies number and rate
1673 (36) 2025 (43) 3248 (65) 21 604
Nursing and midwifery staff in post
564673 570366 581727 1 2
Nursing and midwifery vacancies number and rate
10279 (18) 16091 (27) 16375 (27) 565 18
Source ISD Scotland
Part 1 The NHS in Scotland is facing significant pressures | 29
staff including AampE staff due to the buoyant labour market competition for jobs in the local area and a national shortage of staff in certain clinical specialties including oncology
bull NHS Fife has highlighted vacancies for radiologists and difficulties securing locums which have had an impact on waiting times for diagnostic tests
bull NHS Ayrshire and Arran has reported that vacancies across medical grades are a challenge to it providing current services and considering its plans for providing services for the future
48 The NHS spent pound128 million on bank and agency nursing and midwifery staff in 201314 an increase of 15 per cent since 201213 This accounts for 13 per cent of total revenue expenditure in 201314 Bank nurses accounted for 93 per cent of the spending However spending on agency staff increased by 46 per cent to pound93 million This follows a rise of 62 per cent the previous year reversing the trend of falls in spending on agency nurses since 20080932 Agency staff are likely to be more expensive than bank nurses and also pose a greater potential risk to patient safety and the quality of care33
Spending on private sector healthcare reduced in 201314
49 NHS boards use private sector healthcare to provide additional capacity to meet patientsrsquo needs or to meet national targets In December 2013 the Scottish Government issued guidance for NHS boards which states that it expects the vast majority of patients to be treated within the NHS with the private sector used only to deal with short-term capacity issues34
50 Total spending on private sector healthcare by the territorial boards fell by 69 per cent in real terms between 201213 and 201314 from pound803 million to pound759 million Spending on private healthcare represented about 09 per cent of total spending on hospital and community health services in 201314 Spending decreased in eight territorial boards and increased very slightly in three35 It increased considerably in
bull NHS Shetland spending increased by 60 per cent from pound116000 to pound186000
bull NHS Highland spending increased by 40 per cent from pound26 million to pound37 million
bull NHS Lothian spending increased by 12 per cent from pound148 million to pound166 million
Most boards do not consider integrated performance reports
51 The board of directors in NHS boards need to oversee all aspects of performance including
bull patient safety and clinical quality
bull performance against HEAT targets
bull finance
bull feedback and complaints from patients and staff
30 |
52 Each aspect of performance is important in ensuring the NHS board is providing high-quality sustainable care Considering any one aspect in isolation may mean that the board does not have a full understanding of overall performance for example the board may be achieving its HEAT targets but facing increasing financial pressure or waiting time targets may be met for inpatient and day-case treatment while waiting times for outpatients are growing
53 An integrated overview of performance with high-level commentary helps the board to quickly get an overview of performance We found that only three boards receive an integrated report bringing together all aspects of performance (Case study 5)36 A further two consider reports that bring together a range of aspects of performance but they consider financial performance separately37 We have previously recommended that NHS boards should avoid considering one aspect of performance in isolation In our report on the management of NHS waiting lists we highlighted the importance of NHS boards considering and scrutinising performance against waiting time targets alongside information on how they are achieving that performance Non-executive directors need access to a range of information in order to allow them to provide effective challenge38
Case study 5NHS Greater Glasgow and Clyde uses integrated performance reporting
In April 2011 NHS Greater Glasgow and Clyde established a Quality and Performance Committee (QPC) as a subcommittee of the board This replaced the Performance Review Group Health and Clinical Governance Committee and Involving People Committee The main aim of the QPC is to bring together all areas of governance quality and performance under one committee to provide an overview
The QPC considers an integrated quality and performance report The report brings together data and commentary on the boards performance in relation to quality patient safety clinical governance financial monitoring performance monitoring workforce planning and involving peoplepatients It highlights any areas where the board is not meeting targets or on track to meet them The committee also considers more detailed monitoring reports on some aspects of performance including a financial monitoring report
Source NHS Greater Glasgow and Clyde Annual Audit Report 201112 and update from auditor
Part 2 Looking ahead | 31
Part 2Looking ahead
the NHS is facing significant pressures at the same time as needing to make major changes to services
Key messages
1 The overall health budget is planned to reduce by 09 per cent in real terms over the next two years Changes in Scotlandrsquos population mean that demand for health and social care will increase significantly over the next 20 years at the same time as budgets are tightening The NHS will not be able to continue to provide services in the way it currently does given the scale of the changes required It needs to do more to plan for how it will make the changes needed to provide sustainable care for the future
2 Increasing demand is already putting pressure on services NHS boards need to better understand their demand capacity and how patients move through the complex health and social care system so that they can match their capacity with current and future needs They also need to better understand the reasons for delays and blockages in the health and social care system The Scottish Government has started working with four NHS boards to help them improve patient flow
The NHS will continue to face increasing pressures
55 Taken together our audit work has found clear evidence that NHS boards are finding it increasingly difficult to meet their financial and performance targets All the available evidence suggests that these pressures will increase in future
56 The Scottish Governmentrsquos overall health budget (revenue and capital) is planned to decrease by 10 per cent between 201314 and 201415 and to increase by 01 per cent between 201415 and 201516 in real terms Within the overall health budget
bull the revenue budget is planned to increase by 03 per cent between 201314 and 201415 and to increase by 06 per cent between 201415 and 201516 in real terms
bull the capital budget is planned to decrease by 389 per cent between 201314 and 201415 and to decrease by 240 per cent between 201415 and 201516 in real terms (Exhibit 8 page 32)
57 Healthcare inflation in the UK is higher than general inflation which has an impact on the health budget in real terms Over the last 20 years general inflation in the UK averaged just over two per cent a year while health service costs rose by 36 per cent a year39
32 |
Exhibit 8In the next two years the health budget will decrease by 09 per cent in real termsThe larger revenue budget will increase by almost one per cent while the smaller capital budget will decrease by 54 per cent
-5357
-2398
-3892
+031 +064 +095Revenue
Capital
CUMULATIVE
TOTAL
-093-104 +010
1314to
1415
1415to
1516
1314to
14151415
to1516
1314to
1516
Source Scottish Government Draft Budgets 201314 201415 and 201516
58 Longer-term forecasts to 201819 by the Office for Budget Responsibility show a real-terms reduction in total UK public sector expenditure of 07 per cent in both 201617 and 201718 before levels are maintained in 20181940 Reductions in spending at a UK level will affect the level of funding available in Scotland The Scottish Government will need to plan for health spending within an overall reducing budget
Part 2 Looking ahead | 33
Other cost pressures are likely to increase in future years59 There is likely to be an increase in contribution rates to the NHS Superannuation Scheme during 201415 The most recent actuarial funding valuation available for the scheme was at 31 March 2004 A funding valuation was carried out at 31 March 2008 but was suspended by HM Treasury prior to completion A new funding valuation was carried out in 201314 for the scheme as at 31 March 2012 and this will be incorporated in the NHS accounts for 201415 Employer contribution rates are expected to increase as a result of this valuation in order to ensure that contributions are large enough to meet the likely future costs of the pension scheme
60 A number of boards highlighted this as a financial risk in their LDPs NHS boards have assumed and are planning for pensions costs of approximately two per cent of their total pay bill but the extent of the increase is not yet known NHS boards will also face further costs due to changes in pension schemes that end the current arrangements under which members and their employers pay lower National Insurance contributions41 As a result of these changes pension scheme members and their employers will no longer pay reduced NI contributions from 6 April 2016
61 NHS boards have identified other future cost pressures including pay costs spending on drugs and the availability of new treatments Staff pay is the largest single item of expenditure for NHS boards and the Scottish Government has estimated that the pay bill will increase by around pound30 million per year from 201415 (not including additional pension costs)42 NHS boards are working with the Scottish Government to identify how they will fund these cost pressures NHS boards are considering how they can work together to provide services more efficiently for example exploring opportunities to provide more services on a regional basis
Changes in the population are increasing demand62 Demographic and other changes are increasing the pressures Scotlandrsquos population is ageing (Exhibit 9 page 34) Between 2012 and 2037
bull the percentage of the population aged 65 or over is projected to increase from 17 per cent (925751 people) to 25 per cent (1473158 people)
bull the percentage of the population aged 75 or over is projected to increase from eight per cent (418486 people) to 13 per cent (778746 people)
bull the number of people aged 100 years or older is projected to increase by 879 per cent from 792 to 775143
63 Older people are more likely to have long-term health problems that require care and in the absence of good community-based care that will increase the pressure on acute services The number of people aged over 65 attending AampE departments increased by 126 per cent over the past five years from 242677 attendances in 200809 to 273192 in 201213 Older people are more likely to be admitted to hospital from AampE in December 2013 60 per cent of AampE attendances for people aged over 65 resulted in admission to hospital compared with 23 per cent of patients aged under 6544
34 |
64 The number of people with long-term conditions such as diabetes is increasing and the number of long-term conditions that an individual may have increases with age Rates of dementia are also increasing and the number of people with dementia is estimated to double within the next 25 years45 The number of inpatient and day-case episodes for people aged 65 and over where the patient had a diagnosis of dementia increased by nearly 50 per cent between 2009 and 2013 from 21524 to 32205 Older people with dementia generally stay longer in hospital often due to the need for specialist care that delays their discharge Around half of long-stay residents in Scottish care homes have a diagnosis of dementia
Exhibit 9Scotlands population is ageingThe percentage of the population aged 75 and over is set to increase considerably over the next 25 years
65-74 yearsUnder 65 years 75-84 years 85 years and older
83
75
2610
912 5
Population
418486 2012
Estimated population
778746 2037
2012
2037
75 yrs +
86
Population
792 2012
Estimated population
7751 2037
100 yrs +
879
Note Due to rounding the total percentages add up to 101 per cent
Source Projected Population of Scotland (2012-based) National Records of Scotland 2013
Exhibit 9
Audit Scotland
Exhibit 9
Exhibit 9 background data
Part 2 Looking ahead | 35
65 Peoplersquos expectations of healthcare are rising in relation to access to services and treatments and the Scottish Government recognises this as another challenge for the NHS46 For example the main issues in orthopaedics affecting demand in addition to an increasing older population are higher patient expectations and improvements in technology and available procedures A wider range of procedures are now available and surgeons can carry out more complex procedures47
The Scottish Government has set out its long-term strategy for the NHS but boards do not yet have detailed plans in place
66 Pressures will continue to increase for the foreseeable future The Scottish Government recognises this and in 2011 it set out its 2020 Vision an overarching strategy for achieving sustainable quality in the delivery of healthcare services across Scotland in the context of the challenges facing the NHS48 The overall aim is that by 2020 everyone is able to live longer healthier lives at home or in a homely setting It is an ambitious policy that aims to prevent or improve poor health caused by lifestyle factors such as smoking alcohol and lack of exercise and move towards the NHS providing more care in community settings (Exhibit 10 page 36) In May 2013 the Scottish Government set out 12 priority areas for action in the form of a Route Map to the 2020 Vision
67 The NHS has already made improvements in health outcomes in the Scottish population The 2020 Vision has the potential to make further improvements in health outcomes and the quality of health and social care But achieving the vision will require major changes in the way that services are delivered and a significant shift of resources into more preventative and community-based services We have highlighted in previous reports that there is a lack of evidence of progress in moving resources and more care into the community49 In 200304 42 per cent of NHS spending for all age groups was on community services by 201112 this had increased to just 44 per cent and in 201213 it reduced to 43 per cent50 Between 200203 and 200910 council spending in real terms on social care services for older people increased by 37 per cent from pound098 billion to pound135 billion By 201213 this had fallen to pound129 billion a four per cent reduction from 20091051 The reasons for this lack of progress are complex but achieving the transformation required is made more difficult by the increasing pressures on acute care and by the continuing focus on short-term planning
68 From April 2016 health and social care services in Scotland will be integrated The Public Bodies (Joint Working) (Scotland) Act 2014 requires NHS boards and councils to establish new health and social care partnerships Under these arrangements NHS boards and councils will be required as a minimum to combine their budgets for adult social care adult primary healthcare and aspects of adult secondary healthcare It provides a good opportunity for NHS boards with their council partners to redirect resources and move towards more community-based and preventative care It will be challenging for NHS boards to make the scale of changes required over the next few years but critical if they are to meet the 2020 Vision Outcomes are being developed for integrated health and social care along with integration indicators for the new integration joint boards to report performance against
69 We have previously recommended that NHS boards need to increase their focus on longer-term financial planning Without this there is a risk that they will continue to take a short-term approach to managing the pressures they face at
36 |
Exhibit 10Aims of the Scottish Governments 2020 Vision for health and social careThe Scottish Government has set out an ambitious policy that will require a considerable move from care in settings like hospitals and care homes to more community-based and preventative care
Our vision is that by 2020 everyone is able to live longer healthier lives at home or in a homely setting
We will have a healthcare system where we have integrated health and social care a focus on prevention anticipation and supported self-management
When hospital treatment is required and cannot be provided in a community setting day-case treatment will be the norm
Whatever the setting care will be provided to the highest standards of quality and safety with the person at the centre of all decisions
There will be a focus on ensuring that people get back into their home or community environment as soon as appropriate with minimal risk of re-admission
Source A Route Map to the 2020 Vision for Health and Social Care Scottish Government May 2013
the expense of better options over the longer term NHS boards need to plan now for making considerable changes to the way they deliver services in the longer term to ensure they can deliver sustainable good-quality care to meet future increasing needs They need to set out how they will reshape services and provide high-quality care with the available funding staff and other resources Their longer-term financial planning should consider all the resources they need to provide integrated health and social care services to continue to meet future needs (Exhibit 11 page 37)
70 LDPs set out how each board plans to deliver the priorities for the NHS in Scotland They also form the basis for the Cabinet Secretaryrsquos annual reviews of each board In the past LDPs have focused predominantly on financial planning and meeting HEAT targets for the coming year rather than demonstrating how boards are planning to meet longer-term aims For 201415 the Scottish Government requires each board to include an improvement and co-production plan in their LDP outlining the actions the board is taking to deliver the 2020 Vision (Exhibit 12 page 38) We found that the 201415 LDPs include detail about what boards are currently doing but provide little information about how boards will deliver the 2020 Vision in a sustainable way supported by financial and workforce plans We would expect there to be more detail in the 201516 LDPs about how boards will work with their partners to shift more services into the community as they move towards health and social care integration
Planning needs to be underpinned by a better understanding of demand capacity and patient flows
71 Health and social care services form a complex system in which patient flows need to be understood and managed in order to have the right resources available when and where they are needed to meet demand These resources include the
Part 2 Looking ahead | 37
Exhibit 11A number of elements of long-term planning should underpin financial plansLong-term financial planning needs to set out how NHS boards will make the changes needed to meet future needs
Elements of longer-term planning
Detailed planning required
Future demand for health and social care
Model projected demand for care by taking into account the
bull numbers of patientsservice users expected to need services
bull demographic profile of the area
bull complexity of care that people will need
Compare this with current demand and short-term projections
Models of care Identify the models of care and shared objectives for the new health and social care partnerships required to meet the 2020 Vision and projected future demand for the following
bull hospitals bull community-based care bull home-based care
bull care in the community supported by technology such as telehealth and telecare
Workforce requirements
Identify the staff needed to provide these models of care taking into account
bull numbers and type of roles bull skills mix bull training bull location
Compare this with the current workforce make-up and location and short-term projections Workforce planning needs to be done in collaboration with the Scottish Government NHS Education for Scotland and training providers such as colleges
Location of care Identify the fixed assets needed to provide models of care in different locations including the following
bull buildings (hospitals and community) including the condition of existing buildings and costs of ongoing maintenance and any new buildings that are required
bull information technology including shared access to NHS and social care systems
bull broadband
bull transport for patients service users and staff
Compare this with current assets and short-term projections Plans need to ensure the infrastructure is in place to support moving more care into the community while ensuring hospitals are fit for purpose
Costs and funding
Financial planning to meet future needs by estimating the cost of
bull providing new models of care and for increased demand
bull providing more care in the community and in patientsusers homes
bull maintaining hospital services in line with future models of care
Use scenario planning with potential financial projections to ensure models of care are affordable and to identify potential funding gaps Establish plans for redirecting funding from hospitals to community to meet future needs while maintaining services This is likely to require double-running costs
Source Audit Scotland
38 |
Exhibit 12LDPs now include improvement and co-production plansNHS boards are required to set out their priority actions for delivering the 2020 Vision
Key elements of the plans are that they should
bull be transformational in nature and underpinned by workforce and finance planning
bull provide assurance that the five priorities for action set out in Everyone Matters 2020 Workforce Vision Implementation Framework (healthy organisational culture sustainable workforce capable workforce integrated workforce effective leadership and management) will be taken forward in a planned way
bull set out the priority actions the NHS board is taking across patient safety programmes of work the plans for spread and sustainability and the impact they are having on patient care
bull include the approach being taken to ensure that feedback on compliments concerns complaints and comments from patients their families and carers is being actively sought and used to improve services
bull set out actions and planned levels of improvement for unscheduled care across the NHS such as increased anticipatory care and support to help people manage their conditions and medicines including how hospitals GPs community teams the Scottish Ambulance Service and NHS 24 will work together
bull set out the actions the NHS board is progressing with its partners to prepare for health and social care integration
Source NHSScotland 2020 Local Delivery Plan Guidance Scottish Government November 2013
number of hospital beds outpatient clinics community services and trained staff The NHS needs a better understanding of its current capacity current and future demand and patient flows in order to inform the major changes to services that will be required to ensure they are sustainable and meet the long-term needs of the population
72 We analysed recent trends in healthcare activity population statistics and rates of conditions such as diabetes and dementia (Appendix 1 summarises our methodology) We looked at data for the previous five years where this is available and comparable in order to understand recent trends and identify where pressures are building This analysis identified some of the main pressures and highlights the complex and interrelated nature of the healthcare system The degree to which pressures impact on NHS boards hospitals and specialties varies but include
bull an ageing population and an increase in the number of older people with complex care needs
Part 2 Looking ahead | 39
bull more people living with long-term conditions and multiple conditions
bull more people seeking emergency and urgent care
bull more people being treated in outpatient and day-case settings
bull making sure hospital beds and staff are available at the time they are needed
bull more people experiencing a delay in their discharge from hospital
73 We have identified a number of lsquopinch pointsrsquo in the system (Exhibit 13 page 40) These particularly relate to
bull Hospital beds being available at the time when patients need them There has been an increase in the number of patients experiencing delays in being admitted from AampE and patients are not always cared for in the appropriate ward for their needs which has an impact on the quality of care they receive (known as boarding) These pinch points are related to how hospitals manage their beds and arrangements for discharging patients
bull More delayed discharges The number of patients delayed in hospital while waiting for services to be available in the community is increasing This has an impact on the quality of care and outcomes for the patients and it also means that beds are not available for other patients adding to the pressures on beds (paragraphs 35 and 36)
bull Increasing demand for outpatient appointments Demographic changes along with improvements in care and more procedures carried out in outpatient clinics rather than on an inpatient basis have increased demand for outpatient appointments Demand is increasing at a faster rate than the number of people seen in clinics meaning that waiting lists are growing and more people are waiting longer (paragraphs 33 and 34)
Inpatient care is changing and becoming more complex74 In recent years there has been a reduction in elective (planned) inpatient care as more planned care shifts to outpatients and day cases The number of patients admitted as emergencies for inpatient care has remained steady and the complexity of these cases has increased NHS boards need to ensure they have the right number of staffed beds available at the right time to deal with this changing demand They also need to plan for changes to services in the longer term including shifting more care into community settings
75 There has been a reduction in the number of hospital beds across Scotland Between 200809 and 201213 the average number of available staffed beds in acute specialties reduced by seven per cent (1144 beds) the number of acute surgical beds fell by 11 per cent (596 beds) and the number of acute medical beds fell by five per cent (313 beds) The main reason for this reduction is the growth in day surgery as more patients are treated as day cases and outpatients for example some eye procedures and diagnostic tests Between 200809 and 201213 the number of procedures carried out on an inpatient basis decreased by 18 per cent (418000 procedures in 201213)
40 |
Exhibit 13The NHS is facing increasing pressures from an ageing population and increasing demandThe health and social care system is complex
Notes 1 Community care data Care home and care at home ndash Censuses (March 2013 and March 2008) NHS 24 ndash NHS 24rsquos performance data
(201314 and 200809) Primary care contacts ndash ISD Scotland (201213 and 200809)2 AampE data Number of attendances and waits ndash ISD Scotland and Audit Scotland AampE data(201213 and 200809)3 Hospital data Inpatient daycase and outpatients ndash ISD Scotland (201213 and 200809) Waiting lists and number waiting over 12 weeks
ndash ISD Scotland (quarter ended March 2014 and March 2010) Occupied bed days for delayed dischargesndash ISD Scotland (201314 and 201213) The data is not available before 201213
4 Patients can also be admitted to hospital as emergencies without going through AampESource Audit Scotland
TELEHEALTH
TELECARE
+346 Wait for
a bed(37946)
bull Ageing populationbull Increase in complex needsbull Increase in multiple complex cases
DAY CASE
455800attendances+6
489898procedures+8
OUTPATIENT
47 millionattendances0
15 millionnew patient attendances
+2
380456procedures+108
+9 Delayed
dischargebed days
Self referral
CARE HOME
-2 36578residents
-10 1282homes
+29 1645 short-stayrespite residents
Preventative care self management treatment and care in the community
CARE AT HOME
Social care
-1160950people receiving home care
NHS 24
-9 14 millioncontacts
ACCIDENT amp EMERGENCY
16 millionattendances+3
HOSPITALCARE
OVERNIGHT INPATIENTS
720262patients admitted-3
417987procedures-18
23728avg staffed beds-11
Demand
Time delays
Change inlast 5 years
XX
KEY
+8
admitted to hospital
from AampE (361121)
PRIMARY CARE TEAMGP amp practice nurse
Community nursing AHPPharmacy Ophthalmology Mental health team
242 million contacts+4
+189 waitedgt4hrs
(104000) Plannedcare
421157 occupied bed days
(changebetweenMar 2010
amp Mar 2014)
(changebetweenMar 2010
amp Mar 2014)
+4200
number waiting
gt12 weeks (157 to 6754)
bull The number of older people attending AampE has risen from 242677 patients aged over 65 in 200809 to 273192 patients aged over 65 in 201213 (126 increase)
bull In December 201360 per cent of AampE attendances for people aged over 65 resulted in admission to hospital compared with 23 per cent of patients aged under 65
bull Between 200809 and 201213 there was an 11 rise in the number of bed days occupied by patients aged 80 and over who had three or more emergency admissions during the year
+376
number waiting
gt12 weeks (162 to 771)
+34
number onwaiting list (252009)
-7
number onwaiting list
(50898)
Older people
(201314)
(change betweenMar 2013 amp Mar 2014)
Part 2 Looking ahead | 41
76 The average (mean) length of stay for inpatients has also been reducing Ensuring that patients stay in hospital for no longer than necessary is important since it helps them stay active remain independent and reduces the chance of acquiring a healthcare-associated infection Between 200809 and 201213 the average length of stay fell from 73 days to 65 days for elective (planned) inpatients and from 38 to 31 days for emergency inpatients
77 There is evidence that the complexity of care for patients admitted as emergencies is increasing There has been a slight growth in the number of days that hospital beds are occupied by emergency admissions for people admitted three or more times during one year (one per cent between 200809 and 201213) This is more noticeable among older people (aged 80 and over) who are likely to have more long-term conditions and complex needs Between 200809 and 201213 there was an 11 per cent rise in the number of bed days occupied by patients in this age group who had three or more admissions during the year The increase in the older population suggests that this trend will continue unless there are significant shifts to more anticipatory and preventative care in the community
NHS boards need to improve bed planning and management78 There are a number of indicators of problems with bed planning and management The number of people delayed in AampE while waiting for a hospital bed has increased fourfold since 200809 This is the most common reason for patients waiting more than four hours in AampE The reasons for this are complex and linked to beds not being available at the time when they are needed The day and time that patients are discharged from wards affect the flow of patients throughout the hospital Attendances at AampE departments are highest on Mondays and Tuesdays Delays in AampE due to people waiting for a bed in hospital are more likely on these days since fewer inpatients are discharged at weekends Discharges from hospital generally take place in the afternoon Across Scotland lsquowait for a bedrsquo delays for AampE patients are highest at 6pm The Scottish Government has announced plans to provide more services at weekends and in the evenings to improve the flow of patients and reduce delays Any knock-on effects in primary and social care should be considered as part of these plans In our recent report on AampE performance we highlighted the work that NHS Tayside is doing to improve the quality of care for AampE patients by looking at patient flow (Case study 6 page 42)
79 Boarding is another indicator that a hospital is not organising its capacity to match demand This can happen when there are not enough beds available in a particular specialty when patients need them for example when new patients are admitted as emergencies Instead patients are admitted or transferred to a ward of a different specialty Research has shown that this practice may mean that less specialist care is provided since staff without the appropriate skills are looking after patients Boarding can also significantly increase patientsrsquo length of stay and contribute to other complications resulting from delayed assessment and treatment including developing blood clots and healthcare-associated infections52
80 Boarding used to be more common in winter when demand traditionally increases due to seasonal infections Research by the Royal College of Physicians of Edinburgh (RCPE) suggests that it is becoming an all-year problem In an RCPE survey conducted in May 2012 80 per cent of respondents reported that boarding now happens all year round in Scottish hospitals and 71 per cent said that boarding levels in Scotland are high and increasing The RCPE and the
42 |
Case study 6Improving patient flow in AampE in Ninewells Hospital
Our AampE report identified a number of factors that have helped Ninewells Hospital in NHS Tayside improve the way that patients move through the healthcare system and meet the four-hour waiting time target for AampE These include
bull having senior clinical decision-makers available at all times which means that patients get the right type of care quickly
bull starting the process of planning for patients to be admitted from AampE early to avoid delays in patients waiting for a bed
bull a policy that allows GPs to refer emergency patients directly to wards rather than through AampE first
bull a policy of signposting patients attending AampE to other services such as their GP where appropriate
Source Accident and Emergency performance update Audit Scotland May 2014 (Case study 1 pages 35-36)
Scottish Government are examining the extent of boarding in Scottish hospitals the effect it has on patients and ways to reduce it Results from this work should be available in late 2014 or early 2015
81 The number of emergency admissions over a period of time is reasonably predictable based on previous activity levels On a daily and weekly basis elective admissions can be much more variable than emergency admissions Exhibit 14 (page 43) provides an example of the pattern of elective and emergency admissions to General Surgery on a daily basis in one of Scotlandrsquos district general hospitals and on a weekly basis in another hospital
82 NHS boards need to understand the differing patterns of emergency and elective admissions and actively plan and manage these two flows in a coordinated way Although the number of emergency admissions is reasonably predictable the time of day at which patients arrive at hospital is less so Managing these two flows together means more than ensuring average capacity meets average demand NHS boards also need to ensure that staffing levels are flexible enough to cope with varying demand and that sufficient capacity is available at the right time This means having staff who are trained and equipped to treat increasing numbers of older people with multiple conditions and complex needs
83 A lot of variation in elective admissions can be due to NHS boards not having sufficient capacity to treat both elective and emergency admissions at the time that patients present This includes the availability of beds in appropriate wards sufficient staff with the necessary skills equipment and access to operating theatres This can mean having to cancel planned admissions and rearrange for patients to attend at a later date However data on the overall proportion of inpatient cases that are cancelled has not been available nationally since October 2012 This is due to changes to NHS boardsrsquo electronic systems for managing waiting lists following the introduction of the TTG In September 2012
Part 2 Looking ahead | 43
Exhibit 14Variability in elective and emergency admissions to hospital 201314Elective admission patterns can be more variable than emergency admissions both from day to day (Hospital A) and from week to week (Hospital B)
69 per cent of inpatient and day-case appointments were cancelled across Scotland We have previously highlighted that NHS boards need to ensure they are monitoring this locally to understand any problems with capacity and inform how they manage demand53
84 The Health Foundation worked with NHS trusts in England to look at the relationship between capacity and demand This was based on the premise that the mismatch between the timing of capacity such as when staff are available and when patients present to a service contributes more to delays and inefficiencies than overall levels of demand or resources Key findings from this work were that using systems improvement methods such as detailed data
44 |
analysis and bringing together stakeholders and patients across the hospital system to develop an informed understanding of how care pathways really work can improve patient flow patient safety and make significant cost-savings54
85 The Scottish Government is working with boards over the next year to help them manage beds better in the short term including developing a bed-planning toolkit This will also help them to plan for the number and type of beds required in the longer term reflecting the new models of care that will be needed The toolkit will be piloted in 2015 and include scenario planning based on assumptions of demand admission rates and length of stay taking into account demographic patterns and more care being provided in the community Extensive work has also started in 2014 looking at patient flow in boards and the Scottish Government is leading an Outpatients Primary and Community Care Programme that aims to help NHS boards move more care from hospitals into the community and peoplersquos homes
The Scottish Government is working with NHS boards to improve patient flow
86 As well as having sufficient capacity to deal with demand NHS boards need to make sure that the flow of patients through the hospital and back into the community is as efficient as possible The Scottish Governmentrsquos Quality and Efficiency Support Team (QuEST) is working with four NHS boards to pilot an approach to improve patient flow (NHS Forth Valley NHS Borders NHS Greater Glasgow and Clyde and NHS Tayside) drawing on evidence from the Institute of Healthcare Optimisation in America This is a significant piece of work looking at individual hospitals within each board area as a whole system to understand how patients flow through the system and the factors that can influence this NHS Forth Valley started testing this approach in 2014 and the lessons learned will be shared with other boards as it is rolled out over the next three years The Scottish Government will evaluate the pilot as it progresses and also plans to commission an external evaluation
87 To help improve patient flow and avoid delays in patients getting the appropriate care or being discharged from hospital the Scottish Government also plans to provide more services at weekends and out of hours This includes hospital physiotherapy and pharmacy services An expert group met for the first time in April 2014 The Scottish Government has said there will be no additional funding for this initiative which will require staff to be available at additional times instead NHS boards will be expected to make better use of existing resources
88 Telehealth and telecare offer the potential to care for more people at home or closer to home supported by technology This includes things like equipment for people to monitor their own health at home with their results reviewed by a clinician remotely and alarms and sensors to help people to stay at home more independently These innovations support the 2020 Vision of providing care closer to home potentially improving outcomes for users and avoiding people needing more intensive care in the community or in hospital55 In 2012 the Scottish Government set out its aim that telehealth and telecare will be provided for an additional 300000 people by March 2015 as a milestone towards achieving the 2020 Vision56 It is focusing on rolling out a number of telehealth and telecare projects at a larger scale than the previous smaller pilots Both the Scottish Government and the European Union have provided funding for telehealth and telecare projects
Endnotes | 45
Endnotes
1 The total budget for the Scottish Governmentrsquos Health and Wellbeing Portfolio includes the budgets for health sport and equalities
2 2020 Vision ndash Strategic Narrative Scottish Government September 2011
3 In this report we refer to NHS National Services Scotland the Mental Welfare Commission and Healthcare Improvement Scotland as special health boards
4 Three special boards revenue budgets increased in 201314 National Waiting Times Centre (114 per cent) Scottish Ambulance Service (01 per cent) and NHS 24 (05 per cent)
5 The revenue budget is known as the Revenue Resource Limit (RRL) and the capital budget is known as the Capital Resource Limit (CRL)
6 NHS financial performance 201213 (PDF) Audit Scotland October 2013
7 Response from the Scottish Government to the Public Audit Committee dated 1 August 2014
8 These reports were prepared under Section 22 of the Public Finance and Accountability (Scotland) Act 2000 and are published on Audit Scotlandrsquos website
9 Recurring savings are savings that once achieved recur year-on-year from that date for example savings on staff costs as a result of streamlining services Non-recurring savings only happen once for example not filling a vacancy on a temporary basis
10 NHS Ayrshire and Arran Borders Dumfries and Galloway Highland Lanarkshire Orkney Shetland National Waiting Times Board NHS 24 NHS Education for Scotland and State Hospital
11 Annual State of NHSScotland Assets and Facilities Report for 2012 Scottish Government December 2012
12 Annual State of NHSScotland Assets and Facilities Report for 2013 Scottish Government December 2013
13 The Scottish Government has defined high-risk backlog maintenance as work that must be addressed as an urgent priority Significant risk is the next highest priority category of backlog maintenance and requires expenditure in the short term ndash Correspondence from the Scottish Government to the Public Audit Committee dated 16 January 2013
14 Backlog maintenance reduced in (level of backlog at 2013 in brackets) NHS Ayrshire and Arran (pound77m) Dumfries and Galloway (pound51m) Forth Valley (pound13m) Grampian (pound159m) Greater Glasgow and Clyde (pound167m) Lanarkshire (pound57m) Lothian (pound96m) Orkney (pound95m) Shetland (pound38m) Tayside (pound50m) National Waiting Times Centre (pound26m) NHS National Services Scotland (pound26m) NHS 24 (pound0m) and State Hospital (pound03m) It increased in NHS Borders (pound65m) Fife (pound70m) Highland (pound83m) Western Isles (pound32m) NHS Education for Scotland (pound03m) NHS Health Scotland (pound01m) and the Scottish Ambulance Service (pound33m) NHS Highland has reported that one reason for its backlog maintenance increasing is that a number of properties transferred from the council to the board in 2012 as part of health and social care integration
15 Annual State of NHSScotland Assets and Facilities Report for 2013 Scottish Government December 2013
16 Outline Business Case for a Care Village in Stirling (A Health amp Social Care Partnership Venture) NHS Forth Valley Stirling Council and Forth Valley College 2 December 2013
17 The Healthcare Quality Strategy for NHSScotland Scottish Government May 2010
18 Scottish National Point Prevalence Survey of Healthcare Associated Infection and Antimicrobial Prescribing 2011 Health Protection Scotland April 2012 Rates of individual HAIs (MRSA and Clostridium difficile) have continued to decrease (Scotland Performs Scottish Government website)
19 Heart disease statistics update ISD Scotland January 2014
20 Scottish Inpatient Patient Experience Survey 2014 Scottish Government August 2014
22 Depending on the target this may be performance for the month ending March 2014 or for the quarter ending March 2014 The notes in Exhibit 5 give details for each target
46 |
23 ISD Waiting Times Warehouse data August 2014
24 The National Waiting Times Board a special NHS board met the target for three months in 201314
25 These figures are for standard delayed discharges They exclude delayed discharges recorded under lsquocode 9rsquo for patients with complex needs This includes patients delayed due to waiting for a place in a high-level needs specialist facility where no facilities exist or where an adult may lack capacity under adults with incapacity legislation
26 ISD calculates the cost of days lost to delayed discharges using a cost per day that excludes costs not incurred by delayed patients such as costs related to admissions and allows for the reduced medical and other clinical care that is required for delayed patients This average cost is around pound185 per day
27 These figures are for standard delayed discharges
28 These are called Day of Care Surveys
29 Scottish Inpatient Patient Experience Survey 2014 Volume 1 National Results Scottish Government August 2014
30 Reshaping care for older people (PDF) Audit Scotland February 2014 (Case study 2 page 30)
31 Scottish Government allocation letters to NHS boards 201314
32 NHS financial performance 201213 (PDF) Audit Scotland October 2013
33 Using locum doctors in hospitals (PDF) Audit Scotland June 2010
34 Additional 2020 Local Delivery Plan Guidance Scottish Government December 2013
35 Spending increased slightly in NHS Ayrshire and Arran (15 per cent) NHS Tayside (07 per cent) and NHS Western Isles (13 per cent)
36 NHS Forth Valley NHS Greater Glasgow and Clyde and NHS Tayside
37 NHS Western Isles and NHS 24
38 Management of patients on NHS waiting lists (PDF) Audit Scotland February 2013
39 Why is health care inflation greater than general inflation Charlesworth A Journal of Health Services Research and Policy June 2014
40 Economic and Fiscal Outlook ndash March 2014 Office for Budget Responsibility March 2014
41 Under the current state pension arrangements members of the NHS Superannuation Scheme pay a reduced rate of National Insurance (NI) Their employers the NHS boards also contribute reduced NI payments on their behalf This is because it is assumed that the scheme members have opted not to contribute to or claim the additional state pension (an additional element paid on top of the basic state pension) Reforms mean the additional state pension will no longer exist and everyone will receive a flat rate basic state pension
42 Scottish Government budget 201415 ndash Performance evaluation material for Parliamentary Committees Scottish Government September 2013
43 Projected Population of Scotland (2012-based) National Records of Scotland 2013
44 Accident and Emergency performance update (PDF) Audit Scotland May 2014
45 Scotlandrsquos National Dementia Strategy Scottish Government 2010
46 The Healthcare Quality Strategy for NHSScotland Scottish Government May 2010
47 Review of orthopaedic services (PDF) Audit Scotland March 2010
48 2020 Vision ndash Strategic Narrative Scottish Government September 2011
49 Reshaping care for older people (PDF) Audit Scotland February 2014 Review of Community Health Partnerships (PDF) Audit Scotland June 2011 Overview of the NHS in Scotlandrsquos performance 200809 (PDF) Audit Scotland December 2009 Financial overview of the NHS in Scotland 200708 (PDF) Audit Scotland December 2008
50 Audit Scotland analysis of NHS Costs Book data Spending on community family health services and resource transfer as stated in the costs book has been counted as being spent in the community
51 Figures in real terms 201213 prices Audit Scotland analysis of Local Financial Return statistics 200203 ndash 201213
52 Royal College of Physicians of Edinburgh press release June 2012
53 Management of patients on NHS waiting lists audit update (PDF) Audit Scotland December 2013
54 Improving patient flow How two trusts focused on flow to improve the quality of care and use available capacity effectively The Health Foundation April 2013
55 A review of telehealth in Scotland (PDF) Audit Scotland October 2011
56 A National Telehealth and Telecare Delivery Plan for Scotland to 2015 Scottish Government 2012
Appendix 1 Audit methodology | 47
Appendix 1Audit methodology
Methodology for analysing demand capacity and patient flow
To get a better understanding of some of the pressures on NHS services we carried out data analysis looking at
bull the demand for healthcare services
bull the capacity of the NHS to provide services
bull the flow of patients through the healthcare system
This is the first stage of this work and we have presented some high-level findings throughout the report We will be carrying out further analysis looking in more detail at hospital and specialty level data and daily activity We will publish a briefing paper on this analysis in early 2015
For this report we looked at the NHS as a whole system We tried to identify some of the main pressures facing NHS boards and how a pressure in one part of the system can affect another part of the system We have summarised these pressures in Exhibit 13 (page 40) Throughout the report we explain some of these in more detail and how this affects patients and services
In addition to drawing on information from our previous reports we analysed a range of published data and also requested some bespoke analysis from ISD Scotland This includes the following data
bull ISD Scotland
ndash acute hospital inpatient day-case and outpatient activity (admissions discharges average length of stay multiple emergency admissions average number of staffed beds bed occupancy rates)
ndash number of procedures carried out in hospitals
ndash waiting times for inpatient and day-case treatment and outpatient clinics
ndash hospital workforce numbers and vacancies
ndash number of general practice contacts with GPs and practice nurses
ndash Quality and Outcomes Framework (QOF) prevalence rates for a number of health conditions
ndash number of delayed discharges and occupied bed days
ndash care home census
bull Scottish Government community healthcare assessments data
bull National Records of Scotland population statistics
bull Alzheimer Scotland information
NHS in Scotland 201314This report is available in PDF and RTF formats along with a podcast summary at wwwaudit-scotlandgovuk
If you require this publication in an alternative format andor language please contact us to discuss your needs 0131 625 1500 or infoaudit-scotlandgovuk
For the latest news reports and updates follow us on Twitter or subscribe to our email delivery service
AuditScotland
Subscribe to updates
ISBN 978 1 909705 49 4 AGS20146
Audit Scotland 110 George Street Edinburgh EH2 4LHT 0131 625 1500 E infoaudit-scotlandgovuk wwwaudit-scotlandgovuk
This publication is printed on 100 recycled uncoated paper
Key facts
Summary
Key messages
Recommendations
About the audit
Part 1 The NHS in Scotland is facing significant pressures
Key messages
NHS budgets are under pressure
Exhibit 1
All NHS boards met their financial targets in 201314 but some are facing increasing difficulty in achieving them
Exhibit 2
Case study 1
Case study 2
Case study 3
Five boards continue to rely on high levels of non-recurring savings
Exhibit 3
NHS boards are making less progress than expected on reducing backlog maintenance
The annual financial target for capital spending makes it difficult to plan longer-term projects
Exhibit 4
There have been improvements in the quality of healthcare
Performance against waiting time targets is showing increasing signs of pressure
Exhibit 5
Case study 4
Exhibit 6
There is growing evidence of staff pressures
Exhibit 7
Spending on private sector healthcare reduced in 201314
Most boards do not consider integrated performance reports
Case study 5
Part 2 Looking ahead
Key messages
The NHS will continue to face increasing pressures
Exhibit 8
Exhibit 9
The Scottish Government has set out its long-term strategy for the NHS but boards do not yet have detailed plans in place
Exhibit 10
Planning needs to be underpinned by a better understanding of demand capacity and patient flows
Exhibit 11
Exhibit 12
Exhibit 13
Case study 6
Exhibit 14
The Scottish Government is working with NHS boards to improve patient flow
Endnotes
Appendix 1 Audit methodology
NHS in Scotland 201314
Exhibit 9
Scotlands population is ageing
2012
2037
Population
Percentage of population
Estimated population
Percentage of estimated population
Under 65 years
4387849
83
4307213
75
65-74 years
507265
10
694412
12
75-84 years
309244
6
504249
9
85 years and older
109242
2
274497
5
Note Due to rounding the total percentages add up to 101 per cent
Source Projected Population of Scotland (2012-based) National Records of Scotland 2013
NHS in Scotland 201314
Exhibit 6
Number of delayed discharges and occupied bed days 2012-2014
Number of bed days occupied by delayed discharges
Number of delayed discharges
July 2012
90425
778
October 2012
95527
835
January 2013
99198
711
April 2013
101534
621
July 2013
96448
698
October 2013
99815
781
January 2014
107076
908
April 2104
117818
791
Note The number of delayed discharges refers to all patients who experienced a delay of any length It excludes code 9 patients with complex needs
Source ISD Scotland
Part 1 The NHS in Scotland is facing significant pressures | 27
The NHS puts considerable effort into meeting performance targets 41 The Scottish Government and NHS boards put a great deal of effort into attempting to meet annual waiting time targets The Scottish Government also provided additional funding for NHS boards For example in 201314 the Scottish Government provided NHS boards with at least pound17 million additional funding during the year to support waiting time targets This is similar to the additional funding of at least pound20 million that it provided in 20121331 During 201314 NHS boards also received additional funding of pound9 million to improve emergency and urgent care including reducing waiting times in AampE NHS boards have noted additional workforce costs to provide additional capacity to meet waiting times targets particularly the TTG This level of focus on meeting waiting times targets may not be sustainable when combined with the additional pressures of increasing demands related to demographic changes and the overall health budget starting to decrease in real terms
42 National targets are helpful in targeting areas for improvement in performance For example the focus on waiting time targets has led to a considerable reduction in the length of time that people wait for treatment However it is becoming more difficult for NHS boards to meet these targets fully The extent of the effort required to try to meet them makes it more difficult for NHS boards to focus on long-term planning and moving more care into the community There are risks that too narrow a focus on targets can detract attention from achieving the wider aims
43 The Scottish Government is reviewing the HEAT framework and aims to have updated guidance for boards by November 2014 It should review whether the current financial and performance targets for the NHS are achievable at the same time as implementing the 2020 Vision for health and social care within the tight financial resources available It should consider setting targets for NHS boards that will help them work towards the 2020 Vision for example introducing milestones to measure the extent to which boards are moving towards more preventative and community-based care
There is growing evidence of staff pressures
44 The availability of staff is another important factor in NHS boardsrsquo capacity to provide patient care The number of consultants and nursing and midwifery staff in post has increased slightly each year since 2012 Between March 2013 and March 2014 the number of vacancies for nursing and midwifery staff was stable after increasing the previous year but the number of consultant vacancies increased significantly (Exhibit 7 page 28) This may be related to some extent to the increase in the number of consultant posts and the time lag in filling new posts However the number of posts vacant for six months or more almost doubled from 41 whole-time equivalent (WTE) at 31 March 2013 to 792 WTE in March 2014
45 Of the mainland territorial boards consultant vacancy rates were highest in NHS Dumfries and Galloway (154 per cent) NHS Fife (133 per cent) NHS Forth Valley (102 per cent) and NHS Grampian (99 per cent) With the exception of NHS Dumfries and Galloway these boards experienced difficulty achieving a number of performance targets in 201314 (Exhibit 5)
46 Many NHS boards have reported difficulties filling medical vacancies in some specialties and some geographical areas leading to greater use of locum doctors to maintain services NHS boardsrsquo workforce plans comment on a number of factors that are contributing to these difficulties including
28 |
bull changes in junior doctor training since the introduction of Modernising Medical Careers in 2005 These changes have led to a reduction in the number of junior doctors available and NHS boards needing more middle grade doctors and consultants
bull strong competition among NHS boards for medical staff This can make it more difficult for smaller boards and more rural areas to compete with larger boards which can offer more opportunities such as research and development
bull difficulty recruiting and retaining staff in some specialties with unattractive working patterns such as emergency medicine or where there is a national shortage and greater levels of part-time working such as paediatrics
47 These difficulties have an impact on NHS boardsrsquo ability to provide services and on their financial position For example
bull NHS Highland reported that its financial position in 201314 was negatively affected by spending on locums It anticipates that this will continue to be a cost pressure in 201415 (Case study 1)
bull NHS Orkney required brokerage from the Scottish Government to help cover increased spending on locum doctors and agency nursing staff (Case study 2)
bull NHS Dumfries and Gallowayrsquos spending on locums increased from pound63 million in 201213 to pound76 million in 201314 The board reported that this is due to increased demand and difficulty filling posts
bull NHS Grampian has reported that consultant vacancies in oncology are affecting cancer services and patients are having to receive treatment in other boards It has reported significant difficulty recruiting some groups of
Exhibit 7Consultant nursing and midwifery workforce March 2012 to March 2014The number of vacant consultant posts increased significantly between 2013 and 2014
At 31 March 2012 (wte)
At 31 March 2013 (wte)
At 31 March 2014 (wte)
increase 2012 to 2013
increase 2013 to 2014
Consultant staff in post 44277 45316 46936 23 36
Consultant vacancies number and rate
1673 (36) 2025 (43) 3248 (65) 21 604
Nursing and midwifery staff in post
564673 570366 581727 1 2
Nursing and midwifery vacancies number and rate
10279 (18) 16091 (27) 16375 (27) 565 18
Source ISD Scotland
Part 1 The NHS in Scotland is facing significant pressures | 29
staff including AampE staff due to the buoyant labour market competition for jobs in the local area and a national shortage of staff in certain clinical specialties including oncology
bull NHS Fife has highlighted vacancies for radiologists and difficulties securing locums which have had an impact on waiting times for diagnostic tests
bull NHS Ayrshire and Arran has reported that vacancies across medical grades are a challenge to it providing current services and considering its plans for providing services for the future
48 The NHS spent pound128 million on bank and agency nursing and midwifery staff in 201314 an increase of 15 per cent since 201213 This accounts for 13 per cent of total revenue expenditure in 201314 Bank nurses accounted for 93 per cent of the spending However spending on agency staff increased by 46 per cent to pound93 million This follows a rise of 62 per cent the previous year reversing the trend of falls in spending on agency nurses since 20080932 Agency staff are likely to be more expensive than bank nurses and also pose a greater potential risk to patient safety and the quality of care33
Spending on private sector healthcare reduced in 201314
49 NHS boards use private sector healthcare to provide additional capacity to meet patientsrsquo needs or to meet national targets In December 2013 the Scottish Government issued guidance for NHS boards which states that it expects the vast majority of patients to be treated within the NHS with the private sector used only to deal with short-term capacity issues34
50 Total spending on private sector healthcare by the territorial boards fell by 69 per cent in real terms between 201213 and 201314 from pound803 million to pound759 million Spending on private healthcare represented about 09 per cent of total spending on hospital and community health services in 201314 Spending decreased in eight territorial boards and increased very slightly in three35 It increased considerably in
bull NHS Shetland spending increased by 60 per cent from pound116000 to pound186000
bull NHS Highland spending increased by 40 per cent from pound26 million to pound37 million
bull NHS Lothian spending increased by 12 per cent from pound148 million to pound166 million
Most boards do not consider integrated performance reports
51 The board of directors in NHS boards need to oversee all aspects of performance including
bull patient safety and clinical quality
bull performance against HEAT targets
bull finance
bull feedback and complaints from patients and staff
30 |
52 Each aspect of performance is important in ensuring the NHS board is providing high-quality sustainable care Considering any one aspect in isolation may mean that the board does not have a full understanding of overall performance for example the board may be achieving its HEAT targets but facing increasing financial pressure or waiting time targets may be met for inpatient and day-case treatment while waiting times for outpatients are growing
53 An integrated overview of performance with high-level commentary helps the board to quickly get an overview of performance We found that only three boards receive an integrated report bringing together all aspects of performance (Case study 5)36 A further two consider reports that bring together a range of aspects of performance but they consider financial performance separately37 We have previously recommended that NHS boards should avoid considering one aspect of performance in isolation In our report on the management of NHS waiting lists we highlighted the importance of NHS boards considering and scrutinising performance against waiting time targets alongside information on how they are achieving that performance Non-executive directors need access to a range of information in order to allow them to provide effective challenge38
Case study 5NHS Greater Glasgow and Clyde uses integrated performance reporting
In April 2011 NHS Greater Glasgow and Clyde established a Quality and Performance Committee (QPC) as a subcommittee of the board This replaced the Performance Review Group Health and Clinical Governance Committee and Involving People Committee The main aim of the QPC is to bring together all areas of governance quality and performance under one committee to provide an overview
The QPC considers an integrated quality and performance report The report brings together data and commentary on the boards performance in relation to quality patient safety clinical governance financial monitoring performance monitoring workforce planning and involving peoplepatients It highlights any areas where the board is not meeting targets or on track to meet them The committee also considers more detailed monitoring reports on some aspects of performance including a financial monitoring report
Source NHS Greater Glasgow and Clyde Annual Audit Report 201112 and update from auditor
Part 2 Looking ahead | 31
Part 2Looking ahead
the NHS is facing significant pressures at the same time as needing to make major changes to services
Key messages
1 The overall health budget is planned to reduce by 09 per cent in real terms over the next two years Changes in Scotlandrsquos population mean that demand for health and social care will increase significantly over the next 20 years at the same time as budgets are tightening The NHS will not be able to continue to provide services in the way it currently does given the scale of the changes required It needs to do more to plan for how it will make the changes needed to provide sustainable care for the future
2 Increasing demand is already putting pressure on services NHS boards need to better understand their demand capacity and how patients move through the complex health and social care system so that they can match their capacity with current and future needs They also need to better understand the reasons for delays and blockages in the health and social care system The Scottish Government has started working with four NHS boards to help them improve patient flow
The NHS will continue to face increasing pressures
55 Taken together our audit work has found clear evidence that NHS boards are finding it increasingly difficult to meet their financial and performance targets All the available evidence suggests that these pressures will increase in future
56 The Scottish Governmentrsquos overall health budget (revenue and capital) is planned to decrease by 10 per cent between 201314 and 201415 and to increase by 01 per cent between 201415 and 201516 in real terms Within the overall health budget
bull the revenue budget is planned to increase by 03 per cent between 201314 and 201415 and to increase by 06 per cent between 201415 and 201516 in real terms
bull the capital budget is planned to decrease by 389 per cent between 201314 and 201415 and to decrease by 240 per cent between 201415 and 201516 in real terms (Exhibit 8 page 32)
57 Healthcare inflation in the UK is higher than general inflation which has an impact on the health budget in real terms Over the last 20 years general inflation in the UK averaged just over two per cent a year while health service costs rose by 36 per cent a year39
32 |
Exhibit 8In the next two years the health budget will decrease by 09 per cent in real termsThe larger revenue budget will increase by almost one per cent while the smaller capital budget will decrease by 54 per cent
-5357
-2398
-3892
+031 +064 +095Revenue
Capital
CUMULATIVE
TOTAL
-093-104 +010
1314to
1415
1415to
1516
1314to
14151415
to1516
1314to
1516
Source Scottish Government Draft Budgets 201314 201415 and 201516
58 Longer-term forecasts to 201819 by the Office for Budget Responsibility show a real-terms reduction in total UK public sector expenditure of 07 per cent in both 201617 and 201718 before levels are maintained in 20181940 Reductions in spending at a UK level will affect the level of funding available in Scotland The Scottish Government will need to plan for health spending within an overall reducing budget
Part 2 Looking ahead | 33
Other cost pressures are likely to increase in future years59 There is likely to be an increase in contribution rates to the NHS Superannuation Scheme during 201415 The most recent actuarial funding valuation available for the scheme was at 31 March 2004 A funding valuation was carried out at 31 March 2008 but was suspended by HM Treasury prior to completion A new funding valuation was carried out in 201314 for the scheme as at 31 March 2012 and this will be incorporated in the NHS accounts for 201415 Employer contribution rates are expected to increase as a result of this valuation in order to ensure that contributions are large enough to meet the likely future costs of the pension scheme
60 A number of boards highlighted this as a financial risk in their LDPs NHS boards have assumed and are planning for pensions costs of approximately two per cent of their total pay bill but the extent of the increase is not yet known NHS boards will also face further costs due to changes in pension schemes that end the current arrangements under which members and their employers pay lower National Insurance contributions41 As a result of these changes pension scheme members and their employers will no longer pay reduced NI contributions from 6 April 2016
61 NHS boards have identified other future cost pressures including pay costs spending on drugs and the availability of new treatments Staff pay is the largest single item of expenditure for NHS boards and the Scottish Government has estimated that the pay bill will increase by around pound30 million per year from 201415 (not including additional pension costs)42 NHS boards are working with the Scottish Government to identify how they will fund these cost pressures NHS boards are considering how they can work together to provide services more efficiently for example exploring opportunities to provide more services on a regional basis
Changes in the population are increasing demand62 Demographic and other changes are increasing the pressures Scotlandrsquos population is ageing (Exhibit 9 page 34) Between 2012 and 2037
bull the percentage of the population aged 65 or over is projected to increase from 17 per cent (925751 people) to 25 per cent (1473158 people)
bull the percentage of the population aged 75 or over is projected to increase from eight per cent (418486 people) to 13 per cent (778746 people)
bull the number of people aged 100 years or older is projected to increase by 879 per cent from 792 to 775143
63 Older people are more likely to have long-term health problems that require care and in the absence of good community-based care that will increase the pressure on acute services The number of people aged over 65 attending AampE departments increased by 126 per cent over the past five years from 242677 attendances in 200809 to 273192 in 201213 Older people are more likely to be admitted to hospital from AampE in December 2013 60 per cent of AampE attendances for people aged over 65 resulted in admission to hospital compared with 23 per cent of patients aged under 6544
34 |
64 The number of people with long-term conditions such as diabetes is increasing and the number of long-term conditions that an individual may have increases with age Rates of dementia are also increasing and the number of people with dementia is estimated to double within the next 25 years45 The number of inpatient and day-case episodes for people aged 65 and over where the patient had a diagnosis of dementia increased by nearly 50 per cent between 2009 and 2013 from 21524 to 32205 Older people with dementia generally stay longer in hospital often due to the need for specialist care that delays their discharge Around half of long-stay residents in Scottish care homes have a diagnosis of dementia
Exhibit 9Scotlands population is ageingThe percentage of the population aged 75 and over is set to increase considerably over the next 25 years
65-74 yearsUnder 65 years 75-84 years 85 years and older
83
75
2610
912 5
Population
418486 2012
Estimated population
778746 2037
2012
2037
75 yrs +
86
Population
792 2012
Estimated population
7751 2037
100 yrs +
879
Note Due to rounding the total percentages add up to 101 per cent
Source Projected Population of Scotland (2012-based) National Records of Scotland 2013
Exhibit 9
Audit Scotland
Exhibit 9
Exhibit 9 background data
Part 2 Looking ahead | 35
65 Peoplersquos expectations of healthcare are rising in relation to access to services and treatments and the Scottish Government recognises this as another challenge for the NHS46 For example the main issues in orthopaedics affecting demand in addition to an increasing older population are higher patient expectations and improvements in technology and available procedures A wider range of procedures are now available and surgeons can carry out more complex procedures47
The Scottish Government has set out its long-term strategy for the NHS but boards do not yet have detailed plans in place
66 Pressures will continue to increase for the foreseeable future The Scottish Government recognises this and in 2011 it set out its 2020 Vision an overarching strategy for achieving sustainable quality in the delivery of healthcare services across Scotland in the context of the challenges facing the NHS48 The overall aim is that by 2020 everyone is able to live longer healthier lives at home or in a homely setting It is an ambitious policy that aims to prevent or improve poor health caused by lifestyle factors such as smoking alcohol and lack of exercise and move towards the NHS providing more care in community settings (Exhibit 10 page 36) In May 2013 the Scottish Government set out 12 priority areas for action in the form of a Route Map to the 2020 Vision
67 The NHS has already made improvements in health outcomes in the Scottish population The 2020 Vision has the potential to make further improvements in health outcomes and the quality of health and social care But achieving the vision will require major changes in the way that services are delivered and a significant shift of resources into more preventative and community-based services We have highlighted in previous reports that there is a lack of evidence of progress in moving resources and more care into the community49 In 200304 42 per cent of NHS spending for all age groups was on community services by 201112 this had increased to just 44 per cent and in 201213 it reduced to 43 per cent50 Between 200203 and 200910 council spending in real terms on social care services for older people increased by 37 per cent from pound098 billion to pound135 billion By 201213 this had fallen to pound129 billion a four per cent reduction from 20091051 The reasons for this lack of progress are complex but achieving the transformation required is made more difficult by the increasing pressures on acute care and by the continuing focus on short-term planning
68 From April 2016 health and social care services in Scotland will be integrated The Public Bodies (Joint Working) (Scotland) Act 2014 requires NHS boards and councils to establish new health and social care partnerships Under these arrangements NHS boards and councils will be required as a minimum to combine their budgets for adult social care adult primary healthcare and aspects of adult secondary healthcare It provides a good opportunity for NHS boards with their council partners to redirect resources and move towards more community-based and preventative care It will be challenging for NHS boards to make the scale of changes required over the next few years but critical if they are to meet the 2020 Vision Outcomes are being developed for integrated health and social care along with integration indicators for the new integration joint boards to report performance against
69 We have previously recommended that NHS boards need to increase their focus on longer-term financial planning Without this there is a risk that they will continue to take a short-term approach to managing the pressures they face at
36 |
Exhibit 10Aims of the Scottish Governments 2020 Vision for health and social careThe Scottish Government has set out an ambitious policy that will require a considerable move from care in settings like hospitals and care homes to more community-based and preventative care
Our vision is that by 2020 everyone is able to live longer healthier lives at home or in a homely setting
We will have a healthcare system where we have integrated health and social care a focus on prevention anticipation and supported self-management
When hospital treatment is required and cannot be provided in a community setting day-case treatment will be the norm
Whatever the setting care will be provided to the highest standards of quality and safety with the person at the centre of all decisions
There will be a focus on ensuring that people get back into their home or community environment as soon as appropriate with minimal risk of re-admission
Source A Route Map to the 2020 Vision for Health and Social Care Scottish Government May 2013
the expense of better options over the longer term NHS boards need to plan now for making considerable changes to the way they deliver services in the longer term to ensure they can deliver sustainable good-quality care to meet future increasing needs They need to set out how they will reshape services and provide high-quality care with the available funding staff and other resources Their longer-term financial planning should consider all the resources they need to provide integrated health and social care services to continue to meet future needs (Exhibit 11 page 37)
70 LDPs set out how each board plans to deliver the priorities for the NHS in Scotland They also form the basis for the Cabinet Secretaryrsquos annual reviews of each board In the past LDPs have focused predominantly on financial planning and meeting HEAT targets for the coming year rather than demonstrating how boards are planning to meet longer-term aims For 201415 the Scottish Government requires each board to include an improvement and co-production plan in their LDP outlining the actions the board is taking to deliver the 2020 Vision (Exhibit 12 page 38) We found that the 201415 LDPs include detail about what boards are currently doing but provide little information about how boards will deliver the 2020 Vision in a sustainable way supported by financial and workforce plans We would expect there to be more detail in the 201516 LDPs about how boards will work with their partners to shift more services into the community as they move towards health and social care integration
Planning needs to be underpinned by a better understanding of demand capacity and patient flows
71 Health and social care services form a complex system in which patient flows need to be understood and managed in order to have the right resources available when and where they are needed to meet demand These resources include the
Part 2 Looking ahead | 37
Exhibit 11A number of elements of long-term planning should underpin financial plansLong-term financial planning needs to set out how NHS boards will make the changes needed to meet future needs
Elements of longer-term planning
Detailed planning required
Future demand for health and social care
Model projected demand for care by taking into account the
bull numbers of patientsservice users expected to need services
bull demographic profile of the area
bull complexity of care that people will need
Compare this with current demand and short-term projections
Models of care Identify the models of care and shared objectives for the new health and social care partnerships required to meet the 2020 Vision and projected future demand for the following
bull hospitals bull community-based care bull home-based care
bull care in the community supported by technology such as telehealth and telecare
Workforce requirements
Identify the staff needed to provide these models of care taking into account
bull numbers and type of roles bull skills mix bull training bull location
Compare this with the current workforce make-up and location and short-term projections Workforce planning needs to be done in collaboration with the Scottish Government NHS Education for Scotland and training providers such as colleges
Location of care Identify the fixed assets needed to provide models of care in different locations including the following
bull buildings (hospitals and community) including the condition of existing buildings and costs of ongoing maintenance and any new buildings that are required
bull information technology including shared access to NHS and social care systems
bull broadband
bull transport for patients service users and staff
Compare this with current assets and short-term projections Plans need to ensure the infrastructure is in place to support moving more care into the community while ensuring hospitals are fit for purpose
Costs and funding
Financial planning to meet future needs by estimating the cost of
bull providing new models of care and for increased demand
bull providing more care in the community and in patientsusers homes
bull maintaining hospital services in line with future models of care
Use scenario planning with potential financial projections to ensure models of care are affordable and to identify potential funding gaps Establish plans for redirecting funding from hospitals to community to meet future needs while maintaining services This is likely to require double-running costs
Source Audit Scotland
38 |
Exhibit 12LDPs now include improvement and co-production plansNHS boards are required to set out their priority actions for delivering the 2020 Vision
Key elements of the plans are that they should
bull be transformational in nature and underpinned by workforce and finance planning
bull provide assurance that the five priorities for action set out in Everyone Matters 2020 Workforce Vision Implementation Framework (healthy organisational culture sustainable workforce capable workforce integrated workforce effective leadership and management) will be taken forward in a planned way
bull set out the priority actions the NHS board is taking across patient safety programmes of work the plans for spread and sustainability and the impact they are having on patient care
bull include the approach being taken to ensure that feedback on compliments concerns complaints and comments from patients their families and carers is being actively sought and used to improve services
bull set out actions and planned levels of improvement for unscheduled care across the NHS such as increased anticipatory care and support to help people manage their conditions and medicines including how hospitals GPs community teams the Scottish Ambulance Service and NHS 24 will work together
bull set out the actions the NHS board is progressing with its partners to prepare for health and social care integration
Source NHSScotland 2020 Local Delivery Plan Guidance Scottish Government November 2013
number of hospital beds outpatient clinics community services and trained staff The NHS needs a better understanding of its current capacity current and future demand and patient flows in order to inform the major changes to services that will be required to ensure they are sustainable and meet the long-term needs of the population
72 We analysed recent trends in healthcare activity population statistics and rates of conditions such as diabetes and dementia (Appendix 1 summarises our methodology) We looked at data for the previous five years where this is available and comparable in order to understand recent trends and identify where pressures are building This analysis identified some of the main pressures and highlights the complex and interrelated nature of the healthcare system The degree to which pressures impact on NHS boards hospitals and specialties varies but include
bull an ageing population and an increase in the number of older people with complex care needs
Part 2 Looking ahead | 39
bull more people living with long-term conditions and multiple conditions
bull more people seeking emergency and urgent care
bull more people being treated in outpatient and day-case settings
bull making sure hospital beds and staff are available at the time they are needed
bull more people experiencing a delay in their discharge from hospital
73 We have identified a number of lsquopinch pointsrsquo in the system (Exhibit 13 page 40) These particularly relate to
bull Hospital beds being available at the time when patients need them There has been an increase in the number of patients experiencing delays in being admitted from AampE and patients are not always cared for in the appropriate ward for their needs which has an impact on the quality of care they receive (known as boarding) These pinch points are related to how hospitals manage their beds and arrangements for discharging patients
bull More delayed discharges The number of patients delayed in hospital while waiting for services to be available in the community is increasing This has an impact on the quality of care and outcomes for the patients and it also means that beds are not available for other patients adding to the pressures on beds (paragraphs 35 and 36)
bull Increasing demand for outpatient appointments Demographic changes along with improvements in care and more procedures carried out in outpatient clinics rather than on an inpatient basis have increased demand for outpatient appointments Demand is increasing at a faster rate than the number of people seen in clinics meaning that waiting lists are growing and more people are waiting longer (paragraphs 33 and 34)
Inpatient care is changing and becoming more complex74 In recent years there has been a reduction in elective (planned) inpatient care as more planned care shifts to outpatients and day cases The number of patients admitted as emergencies for inpatient care has remained steady and the complexity of these cases has increased NHS boards need to ensure they have the right number of staffed beds available at the right time to deal with this changing demand They also need to plan for changes to services in the longer term including shifting more care into community settings
75 There has been a reduction in the number of hospital beds across Scotland Between 200809 and 201213 the average number of available staffed beds in acute specialties reduced by seven per cent (1144 beds) the number of acute surgical beds fell by 11 per cent (596 beds) and the number of acute medical beds fell by five per cent (313 beds) The main reason for this reduction is the growth in day surgery as more patients are treated as day cases and outpatients for example some eye procedures and diagnostic tests Between 200809 and 201213 the number of procedures carried out on an inpatient basis decreased by 18 per cent (418000 procedures in 201213)
40 |
Exhibit 13The NHS is facing increasing pressures from an ageing population and increasing demandThe health and social care system is complex
Notes 1 Community care data Care home and care at home ndash Censuses (March 2013 and March 2008) NHS 24 ndash NHS 24rsquos performance data
(201314 and 200809) Primary care contacts ndash ISD Scotland (201213 and 200809)2 AampE data Number of attendances and waits ndash ISD Scotland and Audit Scotland AampE data(201213 and 200809)3 Hospital data Inpatient daycase and outpatients ndash ISD Scotland (201213 and 200809) Waiting lists and number waiting over 12 weeks
ndash ISD Scotland (quarter ended March 2014 and March 2010) Occupied bed days for delayed dischargesndash ISD Scotland (201314 and 201213) The data is not available before 201213
4 Patients can also be admitted to hospital as emergencies without going through AampESource Audit Scotland
TELEHEALTH
TELECARE
+346 Wait for
a bed(37946)
bull Ageing populationbull Increase in complex needsbull Increase in multiple complex cases
DAY CASE
455800attendances+6
489898procedures+8
OUTPATIENT
47 millionattendances0
15 millionnew patient attendances
+2
380456procedures+108
+9 Delayed
dischargebed days
Self referral
CARE HOME
-2 36578residents
-10 1282homes
+29 1645 short-stayrespite residents
Preventative care self management treatment and care in the community
CARE AT HOME
Social care
-1160950people receiving home care
NHS 24
-9 14 millioncontacts
ACCIDENT amp EMERGENCY
16 millionattendances+3
HOSPITALCARE
OVERNIGHT INPATIENTS
720262patients admitted-3
417987procedures-18
23728avg staffed beds-11
Demand
Time delays
Change inlast 5 years
XX
KEY
+8
admitted to hospital
from AampE (361121)
PRIMARY CARE TEAMGP amp practice nurse
Community nursing AHPPharmacy Ophthalmology Mental health team
242 million contacts+4
+189 waitedgt4hrs
(104000) Plannedcare
421157 occupied bed days
(changebetweenMar 2010
amp Mar 2014)
(changebetweenMar 2010
amp Mar 2014)
+4200
number waiting
gt12 weeks (157 to 6754)
bull The number of older people attending AampE has risen from 242677 patients aged over 65 in 200809 to 273192 patients aged over 65 in 201213 (126 increase)
bull In December 201360 per cent of AampE attendances for people aged over 65 resulted in admission to hospital compared with 23 per cent of patients aged under 65
bull Between 200809 and 201213 there was an 11 rise in the number of bed days occupied by patients aged 80 and over who had three or more emergency admissions during the year
+376
number waiting
gt12 weeks (162 to 771)
+34
number onwaiting list (252009)
-7
number onwaiting list
(50898)
Older people
(201314)
(change betweenMar 2013 amp Mar 2014)
Part 2 Looking ahead | 41
76 The average (mean) length of stay for inpatients has also been reducing Ensuring that patients stay in hospital for no longer than necessary is important since it helps them stay active remain independent and reduces the chance of acquiring a healthcare-associated infection Between 200809 and 201213 the average length of stay fell from 73 days to 65 days for elective (planned) inpatients and from 38 to 31 days for emergency inpatients
77 There is evidence that the complexity of care for patients admitted as emergencies is increasing There has been a slight growth in the number of days that hospital beds are occupied by emergency admissions for people admitted three or more times during one year (one per cent between 200809 and 201213) This is more noticeable among older people (aged 80 and over) who are likely to have more long-term conditions and complex needs Between 200809 and 201213 there was an 11 per cent rise in the number of bed days occupied by patients in this age group who had three or more admissions during the year The increase in the older population suggests that this trend will continue unless there are significant shifts to more anticipatory and preventative care in the community
NHS boards need to improve bed planning and management78 There are a number of indicators of problems with bed planning and management The number of people delayed in AampE while waiting for a hospital bed has increased fourfold since 200809 This is the most common reason for patients waiting more than four hours in AampE The reasons for this are complex and linked to beds not being available at the time when they are needed The day and time that patients are discharged from wards affect the flow of patients throughout the hospital Attendances at AampE departments are highest on Mondays and Tuesdays Delays in AampE due to people waiting for a bed in hospital are more likely on these days since fewer inpatients are discharged at weekends Discharges from hospital generally take place in the afternoon Across Scotland lsquowait for a bedrsquo delays for AampE patients are highest at 6pm The Scottish Government has announced plans to provide more services at weekends and in the evenings to improve the flow of patients and reduce delays Any knock-on effects in primary and social care should be considered as part of these plans In our recent report on AampE performance we highlighted the work that NHS Tayside is doing to improve the quality of care for AampE patients by looking at patient flow (Case study 6 page 42)
79 Boarding is another indicator that a hospital is not organising its capacity to match demand This can happen when there are not enough beds available in a particular specialty when patients need them for example when new patients are admitted as emergencies Instead patients are admitted or transferred to a ward of a different specialty Research has shown that this practice may mean that less specialist care is provided since staff without the appropriate skills are looking after patients Boarding can also significantly increase patientsrsquo length of stay and contribute to other complications resulting from delayed assessment and treatment including developing blood clots and healthcare-associated infections52
80 Boarding used to be more common in winter when demand traditionally increases due to seasonal infections Research by the Royal College of Physicians of Edinburgh (RCPE) suggests that it is becoming an all-year problem In an RCPE survey conducted in May 2012 80 per cent of respondents reported that boarding now happens all year round in Scottish hospitals and 71 per cent said that boarding levels in Scotland are high and increasing The RCPE and the
42 |
Case study 6Improving patient flow in AampE in Ninewells Hospital
Our AampE report identified a number of factors that have helped Ninewells Hospital in NHS Tayside improve the way that patients move through the healthcare system and meet the four-hour waiting time target for AampE These include
bull having senior clinical decision-makers available at all times which means that patients get the right type of care quickly
bull starting the process of planning for patients to be admitted from AampE early to avoid delays in patients waiting for a bed
bull a policy that allows GPs to refer emergency patients directly to wards rather than through AampE first
bull a policy of signposting patients attending AampE to other services such as their GP where appropriate
Source Accident and Emergency performance update Audit Scotland May 2014 (Case study 1 pages 35-36)
Scottish Government are examining the extent of boarding in Scottish hospitals the effect it has on patients and ways to reduce it Results from this work should be available in late 2014 or early 2015
81 The number of emergency admissions over a period of time is reasonably predictable based on previous activity levels On a daily and weekly basis elective admissions can be much more variable than emergency admissions Exhibit 14 (page 43) provides an example of the pattern of elective and emergency admissions to General Surgery on a daily basis in one of Scotlandrsquos district general hospitals and on a weekly basis in another hospital
82 NHS boards need to understand the differing patterns of emergency and elective admissions and actively plan and manage these two flows in a coordinated way Although the number of emergency admissions is reasonably predictable the time of day at which patients arrive at hospital is less so Managing these two flows together means more than ensuring average capacity meets average demand NHS boards also need to ensure that staffing levels are flexible enough to cope with varying demand and that sufficient capacity is available at the right time This means having staff who are trained and equipped to treat increasing numbers of older people with multiple conditions and complex needs
83 A lot of variation in elective admissions can be due to NHS boards not having sufficient capacity to treat both elective and emergency admissions at the time that patients present This includes the availability of beds in appropriate wards sufficient staff with the necessary skills equipment and access to operating theatres This can mean having to cancel planned admissions and rearrange for patients to attend at a later date However data on the overall proportion of inpatient cases that are cancelled has not been available nationally since October 2012 This is due to changes to NHS boardsrsquo electronic systems for managing waiting lists following the introduction of the TTG In September 2012
Part 2 Looking ahead | 43
Exhibit 14Variability in elective and emergency admissions to hospital 201314Elective admission patterns can be more variable than emergency admissions both from day to day (Hospital A) and from week to week (Hospital B)
69 per cent of inpatient and day-case appointments were cancelled across Scotland We have previously highlighted that NHS boards need to ensure they are monitoring this locally to understand any problems with capacity and inform how they manage demand53
84 The Health Foundation worked with NHS trusts in England to look at the relationship between capacity and demand This was based on the premise that the mismatch between the timing of capacity such as when staff are available and when patients present to a service contributes more to delays and inefficiencies than overall levels of demand or resources Key findings from this work were that using systems improvement methods such as detailed data
44 |
analysis and bringing together stakeholders and patients across the hospital system to develop an informed understanding of how care pathways really work can improve patient flow patient safety and make significant cost-savings54
85 The Scottish Government is working with boards over the next year to help them manage beds better in the short term including developing a bed-planning toolkit This will also help them to plan for the number and type of beds required in the longer term reflecting the new models of care that will be needed The toolkit will be piloted in 2015 and include scenario planning based on assumptions of demand admission rates and length of stay taking into account demographic patterns and more care being provided in the community Extensive work has also started in 2014 looking at patient flow in boards and the Scottish Government is leading an Outpatients Primary and Community Care Programme that aims to help NHS boards move more care from hospitals into the community and peoplersquos homes
The Scottish Government is working with NHS boards to improve patient flow
86 As well as having sufficient capacity to deal with demand NHS boards need to make sure that the flow of patients through the hospital and back into the community is as efficient as possible The Scottish Governmentrsquos Quality and Efficiency Support Team (QuEST) is working with four NHS boards to pilot an approach to improve patient flow (NHS Forth Valley NHS Borders NHS Greater Glasgow and Clyde and NHS Tayside) drawing on evidence from the Institute of Healthcare Optimisation in America This is a significant piece of work looking at individual hospitals within each board area as a whole system to understand how patients flow through the system and the factors that can influence this NHS Forth Valley started testing this approach in 2014 and the lessons learned will be shared with other boards as it is rolled out over the next three years The Scottish Government will evaluate the pilot as it progresses and also plans to commission an external evaluation
87 To help improve patient flow and avoid delays in patients getting the appropriate care or being discharged from hospital the Scottish Government also plans to provide more services at weekends and out of hours This includes hospital physiotherapy and pharmacy services An expert group met for the first time in April 2014 The Scottish Government has said there will be no additional funding for this initiative which will require staff to be available at additional times instead NHS boards will be expected to make better use of existing resources
88 Telehealth and telecare offer the potential to care for more people at home or closer to home supported by technology This includes things like equipment for people to monitor their own health at home with their results reviewed by a clinician remotely and alarms and sensors to help people to stay at home more independently These innovations support the 2020 Vision of providing care closer to home potentially improving outcomes for users and avoiding people needing more intensive care in the community or in hospital55 In 2012 the Scottish Government set out its aim that telehealth and telecare will be provided for an additional 300000 people by March 2015 as a milestone towards achieving the 2020 Vision56 It is focusing on rolling out a number of telehealth and telecare projects at a larger scale than the previous smaller pilots Both the Scottish Government and the European Union have provided funding for telehealth and telecare projects
Endnotes | 45
Endnotes
1 The total budget for the Scottish Governmentrsquos Health and Wellbeing Portfolio includes the budgets for health sport and equalities
2 2020 Vision ndash Strategic Narrative Scottish Government September 2011
3 In this report we refer to NHS National Services Scotland the Mental Welfare Commission and Healthcare Improvement Scotland as special health boards
4 Three special boards revenue budgets increased in 201314 National Waiting Times Centre (114 per cent) Scottish Ambulance Service (01 per cent) and NHS 24 (05 per cent)
5 The revenue budget is known as the Revenue Resource Limit (RRL) and the capital budget is known as the Capital Resource Limit (CRL)
6 NHS financial performance 201213 (PDF) Audit Scotland October 2013
7 Response from the Scottish Government to the Public Audit Committee dated 1 August 2014
8 These reports were prepared under Section 22 of the Public Finance and Accountability (Scotland) Act 2000 and are published on Audit Scotlandrsquos website
9 Recurring savings are savings that once achieved recur year-on-year from that date for example savings on staff costs as a result of streamlining services Non-recurring savings only happen once for example not filling a vacancy on a temporary basis
10 NHS Ayrshire and Arran Borders Dumfries and Galloway Highland Lanarkshire Orkney Shetland National Waiting Times Board NHS 24 NHS Education for Scotland and State Hospital
11 Annual State of NHSScotland Assets and Facilities Report for 2012 Scottish Government December 2012
12 Annual State of NHSScotland Assets and Facilities Report for 2013 Scottish Government December 2013
13 The Scottish Government has defined high-risk backlog maintenance as work that must be addressed as an urgent priority Significant risk is the next highest priority category of backlog maintenance and requires expenditure in the short term ndash Correspondence from the Scottish Government to the Public Audit Committee dated 16 January 2013
14 Backlog maintenance reduced in (level of backlog at 2013 in brackets) NHS Ayrshire and Arran (pound77m) Dumfries and Galloway (pound51m) Forth Valley (pound13m) Grampian (pound159m) Greater Glasgow and Clyde (pound167m) Lanarkshire (pound57m) Lothian (pound96m) Orkney (pound95m) Shetland (pound38m) Tayside (pound50m) National Waiting Times Centre (pound26m) NHS National Services Scotland (pound26m) NHS 24 (pound0m) and State Hospital (pound03m) It increased in NHS Borders (pound65m) Fife (pound70m) Highland (pound83m) Western Isles (pound32m) NHS Education for Scotland (pound03m) NHS Health Scotland (pound01m) and the Scottish Ambulance Service (pound33m) NHS Highland has reported that one reason for its backlog maintenance increasing is that a number of properties transferred from the council to the board in 2012 as part of health and social care integration
15 Annual State of NHSScotland Assets and Facilities Report for 2013 Scottish Government December 2013
16 Outline Business Case for a Care Village in Stirling (A Health amp Social Care Partnership Venture) NHS Forth Valley Stirling Council and Forth Valley College 2 December 2013
17 The Healthcare Quality Strategy for NHSScotland Scottish Government May 2010
18 Scottish National Point Prevalence Survey of Healthcare Associated Infection and Antimicrobial Prescribing 2011 Health Protection Scotland April 2012 Rates of individual HAIs (MRSA and Clostridium difficile) have continued to decrease (Scotland Performs Scottish Government website)
19 Heart disease statistics update ISD Scotland January 2014
20 Scottish Inpatient Patient Experience Survey 2014 Scottish Government August 2014
22 Depending on the target this may be performance for the month ending March 2014 or for the quarter ending March 2014 The notes in Exhibit 5 give details for each target
46 |
23 ISD Waiting Times Warehouse data August 2014
24 The National Waiting Times Board a special NHS board met the target for three months in 201314
25 These figures are for standard delayed discharges They exclude delayed discharges recorded under lsquocode 9rsquo for patients with complex needs This includes patients delayed due to waiting for a place in a high-level needs specialist facility where no facilities exist or where an adult may lack capacity under adults with incapacity legislation
26 ISD calculates the cost of days lost to delayed discharges using a cost per day that excludes costs not incurred by delayed patients such as costs related to admissions and allows for the reduced medical and other clinical care that is required for delayed patients This average cost is around pound185 per day
27 These figures are for standard delayed discharges
28 These are called Day of Care Surveys
29 Scottish Inpatient Patient Experience Survey 2014 Volume 1 National Results Scottish Government August 2014
30 Reshaping care for older people (PDF) Audit Scotland February 2014 (Case study 2 page 30)
31 Scottish Government allocation letters to NHS boards 201314
32 NHS financial performance 201213 (PDF) Audit Scotland October 2013
33 Using locum doctors in hospitals (PDF) Audit Scotland June 2010
34 Additional 2020 Local Delivery Plan Guidance Scottish Government December 2013
35 Spending increased slightly in NHS Ayrshire and Arran (15 per cent) NHS Tayside (07 per cent) and NHS Western Isles (13 per cent)
36 NHS Forth Valley NHS Greater Glasgow and Clyde and NHS Tayside
37 NHS Western Isles and NHS 24
38 Management of patients on NHS waiting lists (PDF) Audit Scotland February 2013
39 Why is health care inflation greater than general inflation Charlesworth A Journal of Health Services Research and Policy June 2014
40 Economic and Fiscal Outlook ndash March 2014 Office for Budget Responsibility March 2014
41 Under the current state pension arrangements members of the NHS Superannuation Scheme pay a reduced rate of National Insurance (NI) Their employers the NHS boards also contribute reduced NI payments on their behalf This is because it is assumed that the scheme members have opted not to contribute to or claim the additional state pension (an additional element paid on top of the basic state pension) Reforms mean the additional state pension will no longer exist and everyone will receive a flat rate basic state pension
42 Scottish Government budget 201415 ndash Performance evaluation material for Parliamentary Committees Scottish Government September 2013
43 Projected Population of Scotland (2012-based) National Records of Scotland 2013
44 Accident and Emergency performance update (PDF) Audit Scotland May 2014
45 Scotlandrsquos National Dementia Strategy Scottish Government 2010
46 The Healthcare Quality Strategy for NHSScotland Scottish Government May 2010
47 Review of orthopaedic services (PDF) Audit Scotland March 2010
48 2020 Vision ndash Strategic Narrative Scottish Government September 2011
49 Reshaping care for older people (PDF) Audit Scotland February 2014 Review of Community Health Partnerships (PDF) Audit Scotland June 2011 Overview of the NHS in Scotlandrsquos performance 200809 (PDF) Audit Scotland December 2009 Financial overview of the NHS in Scotland 200708 (PDF) Audit Scotland December 2008
50 Audit Scotland analysis of NHS Costs Book data Spending on community family health services and resource transfer as stated in the costs book has been counted as being spent in the community
51 Figures in real terms 201213 prices Audit Scotland analysis of Local Financial Return statistics 200203 ndash 201213
52 Royal College of Physicians of Edinburgh press release June 2012
53 Management of patients on NHS waiting lists audit update (PDF) Audit Scotland December 2013
54 Improving patient flow How two trusts focused on flow to improve the quality of care and use available capacity effectively The Health Foundation April 2013
55 A review of telehealth in Scotland (PDF) Audit Scotland October 2011
56 A National Telehealth and Telecare Delivery Plan for Scotland to 2015 Scottish Government 2012
Appendix 1 Audit methodology | 47
Appendix 1Audit methodology
Methodology for analysing demand capacity and patient flow
To get a better understanding of some of the pressures on NHS services we carried out data analysis looking at
bull the demand for healthcare services
bull the capacity of the NHS to provide services
bull the flow of patients through the healthcare system
This is the first stage of this work and we have presented some high-level findings throughout the report We will be carrying out further analysis looking in more detail at hospital and specialty level data and daily activity We will publish a briefing paper on this analysis in early 2015
For this report we looked at the NHS as a whole system We tried to identify some of the main pressures facing NHS boards and how a pressure in one part of the system can affect another part of the system We have summarised these pressures in Exhibit 13 (page 40) Throughout the report we explain some of these in more detail and how this affects patients and services
In addition to drawing on information from our previous reports we analysed a range of published data and also requested some bespoke analysis from ISD Scotland This includes the following data
bull ISD Scotland
ndash acute hospital inpatient day-case and outpatient activity (admissions discharges average length of stay multiple emergency admissions average number of staffed beds bed occupancy rates)
ndash number of procedures carried out in hospitals
ndash waiting times for inpatient and day-case treatment and outpatient clinics
ndash hospital workforce numbers and vacancies
ndash number of general practice contacts with GPs and practice nurses
ndash Quality and Outcomes Framework (QOF) prevalence rates for a number of health conditions
ndash number of delayed discharges and occupied bed days
ndash care home census
bull Scottish Government community healthcare assessments data
bull National Records of Scotland population statistics
bull Alzheimer Scotland information
NHS in Scotland 201314This report is available in PDF and RTF formats along with a podcast summary at wwwaudit-scotlandgovuk
If you require this publication in an alternative format andor language please contact us to discuss your needs 0131 625 1500 or infoaudit-scotlandgovuk
For the latest news reports and updates follow us on Twitter or subscribe to our email delivery service
AuditScotland
Subscribe to updates
ISBN 978 1 909705 49 4 AGS20146
Audit Scotland 110 George Street Edinburgh EH2 4LHT 0131 625 1500 E infoaudit-scotlandgovuk wwwaudit-scotlandgovuk
This publication is printed on 100 recycled uncoated paper
Key facts
Summary
Key messages
Recommendations
About the audit
Part 1 The NHS in Scotland is facing significant pressures
Key messages
NHS budgets are under pressure
Exhibit 1
All NHS boards met their financial targets in 201314 but some are facing increasing difficulty in achieving them
Exhibit 2
Case study 1
Case study 2
Case study 3
Five boards continue to rely on high levels of non-recurring savings
Exhibit 3
NHS boards are making less progress than expected on reducing backlog maintenance
The annual financial target for capital spending makes it difficult to plan longer-term projects
Exhibit 4
There have been improvements in the quality of healthcare
Performance against waiting time targets is showing increasing signs of pressure
Exhibit 5
Case study 4
Exhibit 6
There is growing evidence of staff pressures
Exhibit 7
Spending on private sector healthcare reduced in 201314
Most boards do not consider integrated performance reports
Case study 5
Part 2 Looking ahead
Key messages
The NHS will continue to face increasing pressures
Exhibit 8
Exhibit 9
The Scottish Government has set out its long-term strategy for the NHS but boards do not yet have detailed plans in place
Exhibit 10
Planning needs to be underpinned by a better understanding of demand capacity and patient flows
Exhibit 11
Exhibit 12
Exhibit 13
Case study 6
Exhibit 14
The Scottish Government is working with NHS boards to improve patient flow
Endnotes
Appendix 1 Audit methodology
NHS in Scotland 201314
Exhibit 9
Scotlands population is ageing
2012
2037
Population
Percentage of population
Estimated population
Percentage of estimated population
Under 65 years
4387849
83
4307213
75
65-74 years
507265
10
694412
12
75-84 years
309244
6
504249
9
85 years and older
109242
2
274497
5
Note Due to rounding the total percentages add up to 101 per cent
Source Projected Population of Scotland (2012-based) National Records of Scotland 2013
Part 2 Looking ahead | 35
65 Peoplersquos expectations of healthcare are rising in relation to access to services and treatments and the Scottish Government recognises this as another challenge for the NHS46 For example the main issues in orthopaedics affecting demand in addition to an increasing older population are higher patient expectations and improvements in technology and available procedures A wider range of procedures are now available and surgeons can carry out more complex procedures47
The Scottish Government has set out its long-term strategy for the NHS but boards do not yet have detailed plans in place
66 Pressures will continue to increase for the foreseeable future The Scottish Government recognises this and in 2011 it set out its 2020 Vision an overarching strategy for achieving sustainable quality in the delivery of healthcare services across Scotland in the context of the challenges facing the NHS48 The overall aim is that by 2020 everyone is able to live longer healthier lives at home or in a homely setting It is an ambitious policy that aims to prevent or improve poor health caused by lifestyle factors such as smoking alcohol and lack of exercise and move towards the NHS providing more care in community settings (Exhibit 10 page 36) In May 2013 the Scottish Government set out 12 priority areas for action in the form of a Route Map to the 2020 Vision
67 The NHS has already made improvements in health outcomes in the Scottish population The 2020 Vision has the potential to make further improvements in health outcomes and the quality of health and social care But achieving the vision will require major changes in the way that services are delivered and a significant shift of resources into more preventative and community-based services We have highlighted in previous reports that there is a lack of evidence of progress in moving resources and more care into the community49 In 200304 42 per cent of NHS spending for all age groups was on community services by 201112 this had increased to just 44 per cent and in 201213 it reduced to 43 per cent50 Between 200203 and 200910 council spending in real terms on social care services for older people increased by 37 per cent from pound098 billion to pound135 billion By 201213 this had fallen to pound129 billion a four per cent reduction from 20091051 The reasons for this lack of progress are complex but achieving the transformation required is made more difficult by the increasing pressures on acute care and by the continuing focus on short-term planning
68 From April 2016 health and social care services in Scotland will be integrated The Public Bodies (Joint Working) (Scotland) Act 2014 requires NHS boards and councils to establish new health and social care partnerships Under these arrangements NHS boards and councils will be required as a minimum to combine their budgets for adult social care adult primary healthcare and aspects of adult secondary healthcare It provides a good opportunity for NHS boards with their council partners to redirect resources and move towards more community-based and preventative care It will be challenging for NHS boards to make the scale of changes required over the next few years but critical if they are to meet the 2020 Vision Outcomes are being developed for integrated health and social care along with integration indicators for the new integration joint boards to report performance against
69 We have previously recommended that NHS boards need to increase their focus on longer-term financial planning Without this there is a risk that they will continue to take a short-term approach to managing the pressures they face at
36 |
Exhibit 10Aims of the Scottish Governments 2020 Vision for health and social careThe Scottish Government has set out an ambitious policy that will require a considerable move from care in settings like hospitals and care homes to more community-based and preventative care
Our vision is that by 2020 everyone is able to live longer healthier lives at home or in a homely setting
We will have a healthcare system where we have integrated health and social care a focus on prevention anticipation and supported self-management
When hospital treatment is required and cannot be provided in a community setting day-case treatment will be the norm
Whatever the setting care will be provided to the highest standards of quality and safety with the person at the centre of all decisions
There will be a focus on ensuring that people get back into their home or community environment as soon as appropriate with minimal risk of re-admission
Source A Route Map to the 2020 Vision for Health and Social Care Scottish Government May 2013
the expense of better options over the longer term NHS boards need to plan now for making considerable changes to the way they deliver services in the longer term to ensure they can deliver sustainable good-quality care to meet future increasing needs They need to set out how they will reshape services and provide high-quality care with the available funding staff and other resources Their longer-term financial planning should consider all the resources they need to provide integrated health and social care services to continue to meet future needs (Exhibit 11 page 37)
70 LDPs set out how each board plans to deliver the priorities for the NHS in Scotland They also form the basis for the Cabinet Secretaryrsquos annual reviews of each board In the past LDPs have focused predominantly on financial planning and meeting HEAT targets for the coming year rather than demonstrating how boards are planning to meet longer-term aims For 201415 the Scottish Government requires each board to include an improvement and co-production plan in their LDP outlining the actions the board is taking to deliver the 2020 Vision (Exhibit 12 page 38) We found that the 201415 LDPs include detail about what boards are currently doing but provide little information about how boards will deliver the 2020 Vision in a sustainable way supported by financial and workforce plans We would expect there to be more detail in the 201516 LDPs about how boards will work with their partners to shift more services into the community as they move towards health and social care integration
Planning needs to be underpinned by a better understanding of demand capacity and patient flows
71 Health and social care services form a complex system in which patient flows need to be understood and managed in order to have the right resources available when and where they are needed to meet demand These resources include the
Part 2 Looking ahead | 37
Exhibit 11A number of elements of long-term planning should underpin financial plansLong-term financial planning needs to set out how NHS boards will make the changes needed to meet future needs
Elements of longer-term planning
Detailed planning required
Future demand for health and social care
Model projected demand for care by taking into account the
bull numbers of patientsservice users expected to need services
bull demographic profile of the area
bull complexity of care that people will need
Compare this with current demand and short-term projections
Models of care Identify the models of care and shared objectives for the new health and social care partnerships required to meet the 2020 Vision and projected future demand for the following
bull hospitals bull community-based care bull home-based care
bull care in the community supported by technology such as telehealth and telecare
Workforce requirements
Identify the staff needed to provide these models of care taking into account
bull numbers and type of roles bull skills mix bull training bull location
Compare this with the current workforce make-up and location and short-term projections Workforce planning needs to be done in collaboration with the Scottish Government NHS Education for Scotland and training providers such as colleges
Location of care Identify the fixed assets needed to provide models of care in different locations including the following
bull buildings (hospitals and community) including the condition of existing buildings and costs of ongoing maintenance and any new buildings that are required
bull information technology including shared access to NHS and social care systems
bull broadband
bull transport for patients service users and staff
Compare this with current assets and short-term projections Plans need to ensure the infrastructure is in place to support moving more care into the community while ensuring hospitals are fit for purpose
Costs and funding
Financial planning to meet future needs by estimating the cost of
bull providing new models of care and for increased demand
bull providing more care in the community and in patientsusers homes
bull maintaining hospital services in line with future models of care
Use scenario planning with potential financial projections to ensure models of care are affordable and to identify potential funding gaps Establish plans for redirecting funding from hospitals to community to meet future needs while maintaining services This is likely to require double-running costs
Source Audit Scotland
38 |
Exhibit 12LDPs now include improvement and co-production plansNHS boards are required to set out their priority actions for delivering the 2020 Vision
Key elements of the plans are that they should
bull be transformational in nature and underpinned by workforce and finance planning
bull provide assurance that the five priorities for action set out in Everyone Matters 2020 Workforce Vision Implementation Framework (healthy organisational culture sustainable workforce capable workforce integrated workforce effective leadership and management) will be taken forward in a planned way
bull set out the priority actions the NHS board is taking across patient safety programmes of work the plans for spread and sustainability and the impact they are having on patient care
bull include the approach being taken to ensure that feedback on compliments concerns complaints and comments from patients their families and carers is being actively sought and used to improve services
bull set out actions and planned levels of improvement for unscheduled care across the NHS such as increased anticipatory care and support to help people manage their conditions and medicines including how hospitals GPs community teams the Scottish Ambulance Service and NHS 24 will work together
bull set out the actions the NHS board is progressing with its partners to prepare for health and social care integration
Source NHSScotland 2020 Local Delivery Plan Guidance Scottish Government November 2013
number of hospital beds outpatient clinics community services and trained staff The NHS needs a better understanding of its current capacity current and future demand and patient flows in order to inform the major changes to services that will be required to ensure they are sustainable and meet the long-term needs of the population
72 We analysed recent trends in healthcare activity population statistics and rates of conditions such as diabetes and dementia (Appendix 1 summarises our methodology) We looked at data for the previous five years where this is available and comparable in order to understand recent trends and identify where pressures are building This analysis identified some of the main pressures and highlights the complex and interrelated nature of the healthcare system The degree to which pressures impact on NHS boards hospitals and specialties varies but include
bull an ageing population and an increase in the number of older people with complex care needs
Part 2 Looking ahead | 39
bull more people living with long-term conditions and multiple conditions
bull more people seeking emergency and urgent care
bull more people being treated in outpatient and day-case settings
bull making sure hospital beds and staff are available at the time they are needed
bull more people experiencing a delay in their discharge from hospital
73 We have identified a number of lsquopinch pointsrsquo in the system (Exhibit 13 page 40) These particularly relate to
bull Hospital beds being available at the time when patients need them There has been an increase in the number of patients experiencing delays in being admitted from AampE and patients are not always cared for in the appropriate ward for their needs which has an impact on the quality of care they receive (known as boarding) These pinch points are related to how hospitals manage their beds and arrangements for discharging patients
bull More delayed discharges The number of patients delayed in hospital while waiting for services to be available in the community is increasing This has an impact on the quality of care and outcomes for the patients and it also means that beds are not available for other patients adding to the pressures on beds (paragraphs 35 and 36)
bull Increasing demand for outpatient appointments Demographic changes along with improvements in care and more procedures carried out in outpatient clinics rather than on an inpatient basis have increased demand for outpatient appointments Demand is increasing at a faster rate than the number of people seen in clinics meaning that waiting lists are growing and more people are waiting longer (paragraphs 33 and 34)
Inpatient care is changing and becoming more complex74 In recent years there has been a reduction in elective (planned) inpatient care as more planned care shifts to outpatients and day cases The number of patients admitted as emergencies for inpatient care has remained steady and the complexity of these cases has increased NHS boards need to ensure they have the right number of staffed beds available at the right time to deal with this changing demand They also need to plan for changes to services in the longer term including shifting more care into community settings
75 There has been a reduction in the number of hospital beds across Scotland Between 200809 and 201213 the average number of available staffed beds in acute specialties reduced by seven per cent (1144 beds) the number of acute surgical beds fell by 11 per cent (596 beds) and the number of acute medical beds fell by five per cent (313 beds) The main reason for this reduction is the growth in day surgery as more patients are treated as day cases and outpatients for example some eye procedures and diagnostic tests Between 200809 and 201213 the number of procedures carried out on an inpatient basis decreased by 18 per cent (418000 procedures in 201213)
40 |
Exhibit 13The NHS is facing increasing pressures from an ageing population and increasing demandThe health and social care system is complex
Notes 1 Community care data Care home and care at home ndash Censuses (March 2013 and March 2008) NHS 24 ndash NHS 24rsquos performance data
(201314 and 200809) Primary care contacts ndash ISD Scotland (201213 and 200809)2 AampE data Number of attendances and waits ndash ISD Scotland and Audit Scotland AampE data(201213 and 200809)3 Hospital data Inpatient daycase and outpatients ndash ISD Scotland (201213 and 200809) Waiting lists and number waiting over 12 weeks
ndash ISD Scotland (quarter ended March 2014 and March 2010) Occupied bed days for delayed dischargesndash ISD Scotland (201314 and 201213) The data is not available before 201213
4 Patients can also be admitted to hospital as emergencies without going through AampESource Audit Scotland
TELEHEALTH
TELECARE
+346 Wait for
a bed(37946)
bull Ageing populationbull Increase in complex needsbull Increase in multiple complex cases
DAY CASE
455800attendances+6
489898procedures+8
OUTPATIENT
47 millionattendances0
15 millionnew patient attendances
+2
380456procedures+108
+9 Delayed
dischargebed days
Self referral
CARE HOME
-2 36578residents
-10 1282homes
+29 1645 short-stayrespite residents
Preventative care self management treatment and care in the community
CARE AT HOME
Social care
-1160950people receiving home care
NHS 24
-9 14 millioncontacts
ACCIDENT amp EMERGENCY
16 millionattendances+3
HOSPITALCARE
OVERNIGHT INPATIENTS
720262patients admitted-3
417987procedures-18
23728avg staffed beds-11
Demand
Time delays
Change inlast 5 years
XX
KEY
+8
admitted to hospital
from AampE (361121)
PRIMARY CARE TEAMGP amp practice nurse
Community nursing AHPPharmacy Ophthalmology Mental health team
242 million contacts+4
+189 waitedgt4hrs
(104000) Plannedcare
421157 occupied bed days
(changebetweenMar 2010
amp Mar 2014)
(changebetweenMar 2010
amp Mar 2014)
+4200
number waiting
gt12 weeks (157 to 6754)
bull The number of older people attending AampE has risen from 242677 patients aged over 65 in 200809 to 273192 patients aged over 65 in 201213 (126 increase)
bull In December 201360 per cent of AampE attendances for people aged over 65 resulted in admission to hospital compared with 23 per cent of patients aged under 65
bull Between 200809 and 201213 there was an 11 rise in the number of bed days occupied by patients aged 80 and over who had three or more emergency admissions during the year
+376
number waiting
gt12 weeks (162 to 771)
+34
number onwaiting list (252009)
-7
number onwaiting list
(50898)
Older people
(201314)
(change betweenMar 2013 amp Mar 2014)
Part 2 Looking ahead | 41
76 The average (mean) length of stay for inpatients has also been reducing Ensuring that patients stay in hospital for no longer than necessary is important since it helps them stay active remain independent and reduces the chance of acquiring a healthcare-associated infection Between 200809 and 201213 the average length of stay fell from 73 days to 65 days for elective (planned) inpatients and from 38 to 31 days for emergency inpatients
77 There is evidence that the complexity of care for patients admitted as emergencies is increasing There has been a slight growth in the number of days that hospital beds are occupied by emergency admissions for people admitted three or more times during one year (one per cent between 200809 and 201213) This is more noticeable among older people (aged 80 and over) who are likely to have more long-term conditions and complex needs Between 200809 and 201213 there was an 11 per cent rise in the number of bed days occupied by patients in this age group who had three or more admissions during the year The increase in the older population suggests that this trend will continue unless there are significant shifts to more anticipatory and preventative care in the community
NHS boards need to improve bed planning and management78 There are a number of indicators of problems with bed planning and management The number of people delayed in AampE while waiting for a hospital bed has increased fourfold since 200809 This is the most common reason for patients waiting more than four hours in AampE The reasons for this are complex and linked to beds not being available at the time when they are needed The day and time that patients are discharged from wards affect the flow of patients throughout the hospital Attendances at AampE departments are highest on Mondays and Tuesdays Delays in AampE due to people waiting for a bed in hospital are more likely on these days since fewer inpatients are discharged at weekends Discharges from hospital generally take place in the afternoon Across Scotland lsquowait for a bedrsquo delays for AampE patients are highest at 6pm The Scottish Government has announced plans to provide more services at weekends and in the evenings to improve the flow of patients and reduce delays Any knock-on effects in primary and social care should be considered as part of these plans In our recent report on AampE performance we highlighted the work that NHS Tayside is doing to improve the quality of care for AampE patients by looking at patient flow (Case study 6 page 42)
79 Boarding is another indicator that a hospital is not organising its capacity to match demand This can happen when there are not enough beds available in a particular specialty when patients need them for example when new patients are admitted as emergencies Instead patients are admitted or transferred to a ward of a different specialty Research has shown that this practice may mean that less specialist care is provided since staff without the appropriate skills are looking after patients Boarding can also significantly increase patientsrsquo length of stay and contribute to other complications resulting from delayed assessment and treatment including developing blood clots and healthcare-associated infections52
80 Boarding used to be more common in winter when demand traditionally increases due to seasonal infections Research by the Royal College of Physicians of Edinburgh (RCPE) suggests that it is becoming an all-year problem In an RCPE survey conducted in May 2012 80 per cent of respondents reported that boarding now happens all year round in Scottish hospitals and 71 per cent said that boarding levels in Scotland are high and increasing The RCPE and the
42 |
Case study 6Improving patient flow in AampE in Ninewells Hospital
Our AampE report identified a number of factors that have helped Ninewells Hospital in NHS Tayside improve the way that patients move through the healthcare system and meet the four-hour waiting time target for AampE These include
bull having senior clinical decision-makers available at all times which means that patients get the right type of care quickly
bull starting the process of planning for patients to be admitted from AampE early to avoid delays in patients waiting for a bed
bull a policy that allows GPs to refer emergency patients directly to wards rather than through AampE first
bull a policy of signposting patients attending AampE to other services such as their GP where appropriate
Source Accident and Emergency performance update Audit Scotland May 2014 (Case study 1 pages 35-36)
Scottish Government are examining the extent of boarding in Scottish hospitals the effect it has on patients and ways to reduce it Results from this work should be available in late 2014 or early 2015
81 The number of emergency admissions over a period of time is reasonably predictable based on previous activity levels On a daily and weekly basis elective admissions can be much more variable than emergency admissions Exhibit 14 (page 43) provides an example of the pattern of elective and emergency admissions to General Surgery on a daily basis in one of Scotlandrsquos district general hospitals and on a weekly basis in another hospital
82 NHS boards need to understand the differing patterns of emergency and elective admissions and actively plan and manage these two flows in a coordinated way Although the number of emergency admissions is reasonably predictable the time of day at which patients arrive at hospital is less so Managing these two flows together means more than ensuring average capacity meets average demand NHS boards also need to ensure that staffing levels are flexible enough to cope with varying demand and that sufficient capacity is available at the right time This means having staff who are trained and equipped to treat increasing numbers of older people with multiple conditions and complex needs
83 A lot of variation in elective admissions can be due to NHS boards not having sufficient capacity to treat both elective and emergency admissions at the time that patients present This includes the availability of beds in appropriate wards sufficient staff with the necessary skills equipment and access to operating theatres This can mean having to cancel planned admissions and rearrange for patients to attend at a later date However data on the overall proportion of inpatient cases that are cancelled has not been available nationally since October 2012 This is due to changes to NHS boardsrsquo electronic systems for managing waiting lists following the introduction of the TTG In September 2012
Part 2 Looking ahead | 43
Exhibit 14Variability in elective and emergency admissions to hospital 201314Elective admission patterns can be more variable than emergency admissions both from day to day (Hospital A) and from week to week (Hospital B)
69 per cent of inpatient and day-case appointments were cancelled across Scotland We have previously highlighted that NHS boards need to ensure they are monitoring this locally to understand any problems with capacity and inform how they manage demand53
84 The Health Foundation worked with NHS trusts in England to look at the relationship between capacity and demand This was based on the premise that the mismatch between the timing of capacity such as when staff are available and when patients present to a service contributes more to delays and inefficiencies than overall levels of demand or resources Key findings from this work were that using systems improvement methods such as detailed data
44 |
analysis and bringing together stakeholders and patients across the hospital system to develop an informed understanding of how care pathways really work can improve patient flow patient safety and make significant cost-savings54
85 The Scottish Government is working with boards over the next year to help them manage beds better in the short term including developing a bed-planning toolkit This will also help them to plan for the number and type of beds required in the longer term reflecting the new models of care that will be needed The toolkit will be piloted in 2015 and include scenario planning based on assumptions of demand admission rates and length of stay taking into account demographic patterns and more care being provided in the community Extensive work has also started in 2014 looking at patient flow in boards and the Scottish Government is leading an Outpatients Primary and Community Care Programme that aims to help NHS boards move more care from hospitals into the community and peoplersquos homes
The Scottish Government is working with NHS boards to improve patient flow
86 As well as having sufficient capacity to deal with demand NHS boards need to make sure that the flow of patients through the hospital and back into the community is as efficient as possible The Scottish Governmentrsquos Quality and Efficiency Support Team (QuEST) is working with four NHS boards to pilot an approach to improve patient flow (NHS Forth Valley NHS Borders NHS Greater Glasgow and Clyde and NHS Tayside) drawing on evidence from the Institute of Healthcare Optimisation in America This is a significant piece of work looking at individual hospitals within each board area as a whole system to understand how patients flow through the system and the factors that can influence this NHS Forth Valley started testing this approach in 2014 and the lessons learned will be shared with other boards as it is rolled out over the next three years The Scottish Government will evaluate the pilot as it progresses and also plans to commission an external evaluation
87 To help improve patient flow and avoid delays in patients getting the appropriate care or being discharged from hospital the Scottish Government also plans to provide more services at weekends and out of hours This includes hospital physiotherapy and pharmacy services An expert group met for the first time in April 2014 The Scottish Government has said there will be no additional funding for this initiative which will require staff to be available at additional times instead NHS boards will be expected to make better use of existing resources
88 Telehealth and telecare offer the potential to care for more people at home or closer to home supported by technology This includes things like equipment for people to monitor their own health at home with their results reviewed by a clinician remotely and alarms and sensors to help people to stay at home more independently These innovations support the 2020 Vision of providing care closer to home potentially improving outcomes for users and avoiding people needing more intensive care in the community or in hospital55 In 2012 the Scottish Government set out its aim that telehealth and telecare will be provided for an additional 300000 people by March 2015 as a milestone towards achieving the 2020 Vision56 It is focusing on rolling out a number of telehealth and telecare projects at a larger scale than the previous smaller pilots Both the Scottish Government and the European Union have provided funding for telehealth and telecare projects
Endnotes | 45
Endnotes
1 The total budget for the Scottish Governmentrsquos Health and Wellbeing Portfolio includes the budgets for health sport and equalities
2 2020 Vision ndash Strategic Narrative Scottish Government September 2011
3 In this report we refer to NHS National Services Scotland the Mental Welfare Commission and Healthcare Improvement Scotland as special health boards
4 Three special boards revenue budgets increased in 201314 National Waiting Times Centre (114 per cent) Scottish Ambulance Service (01 per cent) and NHS 24 (05 per cent)
5 The revenue budget is known as the Revenue Resource Limit (RRL) and the capital budget is known as the Capital Resource Limit (CRL)
6 NHS financial performance 201213 (PDF) Audit Scotland October 2013
7 Response from the Scottish Government to the Public Audit Committee dated 1 August 2014
8 These reports were prepared under Section 22 of the Public Finance and Accountability (Scotland) Act 2000 and are published on Audit Scotlandrsquos website
9 Recurring savings are savings that once achieved recur year-on-year from that date for example savings on staff costs as a result of streamlining services Non-recurring savings only happen once for example not filling a vacancy on a temporary basis
10 NHS Ayrshire and Arran Borders Dumfries and Galloway Highland Lanarkshire Orkney Shetland National Waiting Times Board NHS 24 NHS Education for Scotland and State Hospital
11 Annual State of NHSScotland Assets and Facilities Report for 2012 Scottish Government December 2012
12 Annual State of NHSScotland Assets and Facilities Report for 2013 Scottish Government December 2013
13 The Scottish Government has defined high-risk backlog maintenance as work that must be addressed as an urgent priority Significant risk is the next highest priority category of backlog maintenance and requires expenditure in the short term ndash Correspondence from the Scottish Government to the Public Audit Committee dated 16 January 2013
14 Backlog maintenance reduced in (level of backlog at 2013 in brackets) NHS Ayrshire and Arran (pound77m) Dumfries and Galloway (pound51m) Forth Valley (pound13m) Grampian (pound159m) Greater Glasgow and Clyde (pound167m) Lanarkshire (pound57m) Lothian (pound96m) Orkney (pound95m) Shetland (pound38m) Tayside (pound50m) National Waiting Times Centre (pound26m) NHS National Services Scotland (pound26m) NHS 24 (pound0m) and State Hospital (pound03m) It increased in NHS Borders (pound65m) Fife (pound70m) Highland (pound83m) Western Isles (pound32m) NHS Education for Scotland (pound03m) NHS Health Scotland (pound01m) and the Scottish Ambulance Service (pound33m) NHS Highland has reported that one reason for its backlog maintenance increasing is that a number of properties transferred from the council to the board in 2012 as part of health and social care integration
15 Annual State of NHSScotland Assets and Facilities Report for 2013 Scottish Government December 2013
16 Outline Business Case for a Care Village in Stirling (A Health amp Social Care Partnership Venture) NHS Forth Valley Stirling Council and Forth Valley College 2 December 2013
17 The Healthcare Quality Strategy for NHSScotland Scottish Government May 2010
18 Scottish National Point Prevalence Survey of Healthcare Associated Infection and Antimicrobial Prescribing 2011 Health Protection Scotland April 2012 Rates of individual HAIs (MRSA and Clostridium difficile) have continued to decrease (Scotland Performs Scottish Government website)
19 Heart disease statistics update ISD Scotland January 2014
20 Scottish Inpatient Patient Experience Survey 2014 Scottish Government August 2014
22 Depending on the target this may be performance for the month ending March 2014 or for the quarter ending March 2014 The notes in Exhibit 5 give details for each target
46 |
23 ISD Waiting Times Warehouse data August 2014
24 The National Waiting Times Board a special NHS board met the target for three months in 201314
25 These figures are for standard delayed discharges They exclude delayed discharges recorded under lsquocode 9rsquo for patients with complex needs This includes patients delayed due to waiting for a place in a high-level needs specialist facility where no facilities exist or where an adult may lack capacity under adults with incapacity legislation
26 ISD calculates the cost of days lost to delayed discharges using a cost per day that excludes costs not incurred by delayed patients such as costs related to admissions and allows for the reduced medical and other clinical care that is required for delayed patients This average cost is around pound185 per day
27 These figures are for standard delayed discharges
28 These are called Day of Care Surveys
29 Scottish Inpatient Patient Experience Survey 2014 Volume 1 National Results Scottish Government August 2014
30 Reshaping care for older people (PDF) Audit Scotland February 2014 (Case study 2 page 30)
31 Scottish Government allocation letters to NHS boards 201314
32 NHS financial performance 201213 (PDF) Audit Scotland October 2013
33 Using locum doctors in hospitals (PDF) Audit Scotland June 2010
34 Additional 2020 Local Delivery Plan Guidance Scottish Government December 2013
35 Spending increased slightly in NHS Ayrshire and Arran (15 per cent) NHS Tayside (07 per cent) and NHS Western Isles (13 per cent)
36 NHS Forth Valley NHS Greater Glasgow and Clyde and NHS Tayside
37 NHS Western Isles and NHS 24
38 Management of patients on NHS waiting lists (PDF) Audit Scotland February 2013
39 Why is health care inflation greater than general inflation Charlesworth A Journal of Health Services Research and Policy June 2014
40 Economic and Fiscal Outlook ndash March 2014 Office for Budget Responsibility March 2014
41 Under the current state pension arrangements members of the NHS Superannuation Scheme pay a reduced rate of National Insurance (NI) Their employers the NHS boards also contribute reduced NI payments on their behalf This is because it is assumed that the scheme members have opted not to contribute to or claim the additional state pension (an additional element paid on top of the basic state pension) Reforms mean the additional state pension will no longer exist and everyone will receive a flat rate basic state pension
42 Scottish Government budget 201415 ndash Performance evaluation material for Parliamentary Committees Scottish Government September 2013
43 Projected Population of Scotland (2012-based) National Records of Scotland 2013
44 Accident and Emergency performance update (PDF) Audit Scotland May 2014
45 Scotlandrsquos National Dementia Strategy Scottish Government 2010
46 The Healthcare Quality Strategy for NHSScotland Scottish Government May 2010
47 Review of orthopaedic services (PDF) Audit Scotland March 2010
48 2020 Vision ndash Strategic Narrative Scottish Government September 2011
49 Reshaping care for older people (PDF) Audit Scotland February 2014 Review of Community Health Partnerships (PDF) Audit Scotland June 2011 Overview of the NHS in Scotlandrsquos performance 200809 (PDF) Audit Scotland December 2009 Financial overview of the NHS in Scotland 200708 (PDF) Audit Scotland December 2008
50 Audit Scotland analysis of NHS Costs Book data Spending on community family health services and resource transfer as stated in the costs book has been counted as being spent in the community
51 Figures in real terms 201213 prices Audit Scotland analysis of Local Financial Return statistics 200203 ndash 201213
52 Royal College of Physicians of Edinburgh press release June 2012
53 Management of patients on NHS waiting lists audit update (PDF) Audit Scotland December 2013
54 Improving patient flow How two trusts focused on flow to improve the quality of care and use available capacity effectively The Health Foundation April 2013
55 A review of telehealth in Scotland (PDF) Audit Scotland October 2011
56 A National Telehealth and Telecare Delivery Plan for Scotland to 2015 Scottish Government 2012
Appendix 1 Audit methodology | 47
Appendix 1Audit methodology
Methodology for analysing demand capacity and patient flow
To get a better understanding of some of the pressures on NHS services we carried out data analysis looking at
bull the demand for healthcare services
bull the capacity of the NHS to provide services
bull the flow of patients through the healthcare system
This is the first stage of this work and we have presented some high-level findings throughout the report We will be carrying out further analysis looking in more detail at hospital and specialty level data and daily activity We will publish a briefing paper on this analysis in early 2015
For this report we looked at the NHS as a whole system We tried to identify some of the main pressures facing NHS boards and how a pressure in one part of the system can affect another part of the system We have summarised these pressures in Exhibit 13 (page 40) Throughout the report we explain some of these in more detail and how this affects patients and services
In addition to drawing on information from our previous reports we analysed a range of published data and also requested some bespoke analysis from ISD Scotland This includes the following data
bull ISD Scotland
ndash acute hospital inpatient day-case and outpatient activity (admissions discharges average length of stay multiple emergency admissions average number of staffed beds bed occupancy rates)
ndash number of procedures carried out in hospitals
ndash waiting times for inpatient and day-case treatment and outpatient clinics
ndash hospital workforce numbers and vacancies
ndash number of general practice contacts with GPs and practice nurses
ndash Quality and Outcomes Framework (QOF) prevalence rates for a number of health conditions
ndash number of delayed discharges and occupied bed days
ndash care home census
bull Scottish Government community healthcare assessments data
bull National Records of Scotland population statistics
bull Alzheimer Scotland information
NHS in Scotland 201314This report is available in PDF and RTF formats along with a podcast summary at wwwaudit-scotlandgovuk
If you require this publication in an alternative format andor language please contact us to discuss your needs 0131 625 1500 or infoaudit-scotlandgovuk
For the latest news reports and updates follow us on Twitter or subscribe to our email delivery service
AuditScotland
Subscribe to updates
ISBN 978 1 909705 49 4 AGS20146
Audit Scotland 110 George Street Edinburgh EH2 4LHT 0131 625 1500 E infoaudit-scotlandgovuk wwwaudit-scotlandgovuk
This publication is printed on 100 recycled uncoated paper
Key facts
Summary
Key messages
Recommendations
About the audit
Part 1 The NHS in Scotland is facing significant pressures
Key messages
NHS budgets are under pressure
Exhibit 1
All NHS boards met their financial targets in 201314 but some are facing increasing difficulty in achieving them
Exhibit 2
Case study 1
Case study 2
Case study 3
Five boards continue to rely on high levels of non-recurring savings
Exhibit 3
NHS boards are making less progress than expected on reducing backlog maintenance
The annual financial target for capital spending makes it difficult to plan longer-term projects
Exhibit 4
There have been improvements in the quality of healthcare
Performance against waiting time targets is showing increasing signs of pressure
Exhibit 5
Case study 4
Exhibit 6
There is growing evidence of staff pressures
Exhibit 7
Spending on private sector healthcare reduced in 201314
Most boards do not consider integrated performance reports
Case study 5
Part 2 Looking ahead
Key messages
The NHS will continue to face increasing pressures
Exhibit 8
Exhibit 9
The Scottish Government has set out its long-term strategy for the NHS but boards do not yet have detailed plans in place
Exhibit 10
Planning needs to be underpinned by a better understanding of demand capacity and patient flows
Exhibit 11
Exhibit 12
Exhibit 13
Case study 6
Exhibit 14
The Scottish Government is working with NHS boards to improve patient flow
Endnotes
Appendix 1 Audit methodology
NHS in Scotland 201314This report is available in PDF and RTF formats along with a podcast summary at wwwaudit-scotlandgovuk
If you require this publication in an alternative format andor language please contact us to discuss your needs 0131 625 1500 or infoaudit-scotlandgovuk
For the latest news reports and updates follow us on Twitter or subscribe to our email delivery service
AuditScotland
Subscribe to updates
ISBN 978 1 909705 49 4 AGS20146
Audit Scotland 110 George Street Edinburgh EH2 4LHT 0131 625 1500 E infoaudit-scotlandgovuk wwwaudit-scotlandgovuk
This publication is printed on 100 recycled uncoated paper
Key facts
Summary
Key messages
Recommendations
About the audit
Part 1 The NHS in Scotland is facing significant pressures
Key messages
NHS budgets are under pressure
Exhibit 1
All NHS boards met their financial targets in 201314 but some are facing increasing difficulty in achieving them
Exhibit 2
Case study 1
Case study 2
Case study 3
Five boards continue to rely on high levels of non-recurring savings
Exhibit 3
NHS boards are making less progress than expected on reducing backlog maintenance
The annual financial target for capital spending makes it difficult to plan longer-term projects
Exhibit 4
There have been improvements in the quality of healthcare
Performance against waiting time targets is showing increasing signs of pressure
Exhibit 5
Case study 4
Exhibit 6
There is growing evidence of staff pressures
Exhibit 7
Spending on private sector healthcare reduced in 201314
Most boards do not consider integrated performance reports
Case study 5
Part 2 Looking ahead
Key messages
The NHS will continue to face increasing pressures
Exhibit 8
Exhibit 9
The Scottish Government has set out its long-term strategy for the NHS but boards do not yet have detailed plans in place
Exhibit 10
Planning needs to be underpinned by a better understanding of demand capacity and patient flows
Exhibit 11
Exhibit 12
Exhibit 13
Case study 6
Exhibit 14
The Scottish Government is working with NHS boards to improve patient flow