ni 43-101 technical report and mineral resource estimate ... · mines, as well as ore deposits and...
TRANSCRIPT

InnovExplo Inc. Consultants–Mines–Exploration
Val-d’Or Office 560, 3e Avenue
Val-d’Or (Québec) J9P 1S4
Longueuil Office
859 boul. Jean-Paul-Vincent, suite 201 Longueuil (Québec) J4G 1R3
Telephone: 819.874-0447 Facsimile: 819.874-0379 Toll-free: 866.749-8140
Email: [email protected] Web site: www.innovexplo.com
NI 43-101 Technical Report and Mineral Resource Estimate for the
O’Brien Project, Abitibi, Québec
Prepared for
Radisson Mining Resources Inc.
700 Dallaire Ave, 2nd Floor Rouyn-Noranda (Québec) J9X 4V9
Project Location
Latitude 48° 14' 07" N, Longitude 78° 22' 54" W
Cadillac Township
Province of Quebec, Canada
Prepared by:
Christine Beausoleil, P.Geo.
Effective Date: March 20, 2018 Signature Date: May 3rd, 2018

www.innovexplo.com
NI 43 101 Technical Report and Mineral Resource Estimate for the O’Brien Project, Abitibi, Québec – May 2018
SIGNATURE PAGE – INNOVEXPLO
NI 43-101 Technical Report and Mineral Resource Estimate for the O’Brien Project, Abitibi, Québec
Project Location
Latitude 48° 14' 07" N, Longitude 78° 22' 54" W
Cadillac Township Province of Quebec, Canada
Prepared for Radisson Mining Resources Inc.
700 Dallaire Ave, 2nd Floor Rouyn-Noranda (Québec) J9X 4V9
(Original signed and sealed)
Signed at Val-d’Or on May 3rd, 2018 Christine Beausoleil, P.Geo. InnovExplo Inc. Val-d’Or (Québec)
www.innovexplo.com
NI 43 101 Technical Report and Mineral Resource Estimate for the O’Brien Project, Abitibi, Québec – May 2018
CERTIFICATE OF AUTHOR – CHRISTINE BEAUSOLEIL I, Christine Beausoleil, P.Geo. (OGQ No. 656, EGBC No. 36156), do hereby certify that:
1. I am a professional geoscientist, employed as Project Manager – Technical Services of InnovExplo Inc., located at 560, 3e Avenue, Val-d’Or, Québec, Canada, J9P 1S4.
2. This certificate applies to the technical report entitled “NI 43 101 Technical Report and Mineral Resource Estimate for the O’Brien Project, Abitibi, Québec” with an effective date of March 20, 2018.
3. I am a member in good standing of the Ordre des Géologues du Québec (OGQ licence No. 656) and of the Engineers & Geoscientists of British Columbia (licence No. 36156). I graduated with a Bachelor of Geology degree from Université du Québec à Montréal (Montréal, Québec) in 1997.
4. I have practiced my profession continuously as a geologist for a total of twenty-one (21) years during which time I have been involved in mineral exploration, mine geology, ore control and resource modelling projects for gold, copper, zinc and silver properties in Canada.
5. I have read the definition of “qualified person” set out in National Instrument 43-101/Regulation 43-101 (“NI 43-101”) and certify that by reason of my education, affiliation with a professional association (as defined in NI 43-101) and past relevant work experience, I fulfill the requirements to be a “qualified person” for the purposes of NI 43-101.
6. I have visited the O’Brien Project on November 23, 2017. 7. I am the author of items 1 to 27 of the report titled “NI 43 101 Technical Report and Mineral
Resource Estimate for the O’Brien Project, Abitibi, Québec”, with an effective date of March 20, 2018 and a signature date of May 3rd, 2018, prepared for Radisson Mining Resources Inc.
8. I have not had prior involvement with the property that is the subject of this technical report. 9. I am independent of the issuer in accordance with the application of Section 1.5 of
NI 43-101. 10. I have read NI 43-101 and Form 43-101F1, and the items of the Technical Report for which
I am responsible have been prepared in accordance with that instrument and form. 11. I am not aware of any material fact or material change with respect to the subject matter
of the Technical Report that is not reflected in the Technical Report, the omission to disclose which makes the Technical Report misleading
Dated at Val d’Or, Québec this 3rd day of May 2018.
(Original signed and sealed) Christine Beausoleil, P.Geo. InnovExplo Inc. [email protected]

www.innovexplo.com
NI 43 101 Technical Report and Mineral Resource Estimate for the O’Brien Project, Abitibi, Québec – May 2018 4
TABLE OF CONTENTS 1. SUMMARY .......................................................................................................................................... 10
Introduction .................................................................................................................................. 10 Contributors and Qualified Person .............................................................................................. 10 Property Description and Location .............................................................................................. 10 Accessibility, Climate, Local resources, Infrastructure and Physiography ................................. 10 Geological Setting and Mineralization ......................................................................................... 11 Drilling, Sampling Method, Approach and Analysis .................................................................... 12 Data Verification .......................................................................................................................... 12 Mineral Resource Estimates ....................................................................................................... 13 Interpretation and Conclusions ................................................................................................... 14 Recommendations ...................................................................................................................... 15
2. INTRODUCTION ................................................................................................................................. 17 Overview ..................................................................................................................................... 17 Report Responsibility and Qualified Persons .............................................................................. 17 Effective Date .............................................................................................................................. 17 Sources of Information ................................................................................................................ 17 Currency, Units of Measure, and Abbreviations ......................................................................... 18 Important Notice .......................................................................................................................... 20
3. RELIANCE ON OTHER EXPERTS .................................................................................................... 21 4. PROPERTY DESCRIPTION AND LOCATION .................................................................................. 22
Location ....................................................................................................................................... 22 Mining Rights in the Province of Québec .................................................................................... 22 The Claim .................................................................................................................................... 25 The Mining Lease ........................................................................................................................ 25 The Mining Concession ............................................................................................................... 26 Other Information ........................................................................................................................ 26 Property Description and Mineral Royalties ................................................................................ 26 Claim Status ................................................................................................................................ 27 Urban Perimeter .......................................................................................................................... 28 Territory Akin to an Area for Vacationing .................................................................................... 28 Permits ........................................................................................................................................ 29 Environment ................................................................................................................................ 29 Comments on Item 4 ................................................................................................................... 30
5. ACCESSIBILITY, CLIMATE, LOCAL RESOURCES, INFRASTRUCTURE AND PHYSIOGRAPHY 31
Accessibility ................................................................................................................................. 31

www.innovexplo.com
NI 43 101 Technical Report and Mineral Resource Estimate for the O’Brien Project, Abitibi, Québec – May 2018 5
Climate ........................................................................................................................................ 33 Local Resources and Infrastructure ............................................................................................ 33 Physiography............................................................................................................................... 33
6. HISTORY ............................................................................................................................................ 35 Former O’Brien Mine Property .................................................................................................... 35
6.1.1 O’BRIEN GOLD MINES LTD ......................................................................................................................... 35 6.1.2 DARIUS GOLD MINES INC. .......................................................................................................................... 39 6.1.3 SULPETRO MINERALS / NOVAMIN RESOURCES / BREAKWATER RESOURCES ................................................... 41 6.1.4 HISTORICAL WORK COMPLETED BY THE ISSUER............................................................................................. 43 Former Kewagama Property ....................................................................................................... 48
6.2.1 KEWAGAMA GOLD MINES LTD .................................................................................................................... 48 6.2.2 SULPETRO MINERALS / NOVAMIN RESOURCES / BREAKWATER RESOURCES ................................................... 50 6.2.3 HISTORICAL WORK COMPLETED BY THE ISSUER............................................................................................. 50 Recent Studies Completed by the Issuer on the Combined O’Brien and Kewagama Properties
53 7. GEOLOGICAL SETTING AND MINERALIZATION........................................................................... 57
Abitibi Terrane (Abitibi Subprovince) .......................................................................................... 57 Cadillac Area ............................................................................................................................... 59 Property Geology ........................................................................................................................ 62
7.3.1 CADILLAC GROUP ..................................................................................................................................... 62 7.3.2 PICHÉ GROUP........................................................................................................................................... 62
7.3.2.1 Quartz-feldspar porphyry ..............................................................................62 7.3.2.2 Conglomerate ...............................................................................................63 7.3.2.3 Volcanic rocks...............................................................................................63 7.3.2.4 Graphitic schist and argillite ..........................................................................63
7.3.3 PONTIAC GROUP ....................................................................................................................................... 63 Mineralization .............................................................................................................................. 64
7.4.1 O’BRIEN MINE ........................................................................................................................................... 64 7.4.1.1 No. 1 Vein .....................................................................................................64 7.4.1.2 No. 4 Vein .....................................................................................................64 7.4.1.3 No. 9 Vein .....................................................................................................64
7.4.2 ZONE 36 EAST AREA ................................................................................................................................. 65 7.4.3 KEWAGAMA AREA ...................................................................................................................................... 65 Hydrothermal Alteration .............................................................................................................. 66
8. MINERAL DEPOSIT TYPES .............................................................................................................. 67 9. EXPLORATION .................................................................................................................................. 70
Geophysics .................................................................................................................................. 70
www.innovexplo.com
NI 43 101 Technical Report and Mineral Resource Estimate for the O’Brien Project, Abitibi, Québec – May 2018 6
Prospecting and Mapping ........................................................................................................... 70 Historical Compilation ................................................................................................................. 71
10. DRILLING ....................................................................................................................................... 72 Drilling Methodology .................................................................................................................... 72 Core Logging Procedures ........................................................................................................... 72 2015–2017 Drilling Program ....................................................................................................... 73
11. SAMPLE PREPARATION, ANALYSES AND SECURITY ............................................................ 75 Core handling, Sampling and Security ........................................................................................ 75 Laboratories Accreditation and Certification ............................................................................... 75 Laboratory Preparation and Assays ............................................................................................ 76
11.3.1 TECHNI-LAB ......................................................................................................................................... 76 11.3.2 SWASTIKA ............................................................................................................................................ 76
Quality Assurance and Quality Control (QA/QC) ........................................................................ 76 11.4.1 BLANK SAMPLES ................................................................................................................................... 76 11.4.2 STANDARDS ......................................................................................................................................... 78
Conclusions on the QA/QC for the 2017 drilling campaign ........................................................ 79 12. DATA VERIFICATION .................................................................................................................... 80
Historical Work ............................................................................................................................ 80 Radisson Database ..................................................................................................................... 80
12.2.1 DRILL HOLE LOCATION ........................................................................................................................... 80 12.2.2 DOWN-HOLE SURVEY ............................................................................................................................ 80 12.2.3 ASSAYS ............................................................................................................................................... 81
Mined-out Voids .......................................................................................................................... 81 Radisson Logging, Sampling and Assaying Procedures ............................................................ 81 Conclusion ................................................................................................................................... 83
13. MINERAL PROCESSING AND METALLURGICAL TESTING ..................................................... 84 14. MINERAL RESOURCE ESTIMATE ............................................................................................... 85
Drill Hole Database ..................................................................................................................... 85 Geological Model ........................................................................................................................ 86 Interpretation of Mineralized Zones ............................................................................................ 87 High Grade Capping ................................................................................................................... 88 Underground Voids ..................................................................................................................... 91 Compositing ................................................................................................................................ 93 Density ........................................................................................................................................ 94 Block Model ................................................................................................................................. 94 Variography and Search Ellipsoids ............................................................................................. 96 Grade Interpolation.................................................................................................................. 96

www.innovexplo.com
NI 43 101 Technical Report and Mineral Resource Estimate for the O’Brien Project, Abitibi, Québec – May 2018 7
Cut-off Parameters .................................................................................................................. 97 Mineral Resource Classification .............................................................................................. 98
14.12.1 MINERAL RESOURCE CLASSIFICATION DEFINITION ..................................................................................... 98 14.12.2 MINERAL RESOURCE CLASSIFICATION FOR THE O’BRIEN PROJECT ............................................................. 98
Mineral Resource Estimate ................................................................................................... 101 15. MINERAL RESERVE ESTIMATE ................................................................................................ 103 16. MINING METHODS ...................................................................................................................... 103 17. RECOVERY METHOD ................................................................................................................. 103 18. PROJECT INFRASTRUCTURE ................................................................................................... 103 19. MARKET STUDIES AND CONTRACTS ...................................................................................... 103 20. ENVIRONMENTAL STUDIES, PERMITTING AND SOCIAL OR COMMUNITY IMPACT .......... 103 21. CAPITAL AND OPERATING COSTS .......................................................................................... 103 22. ECONOMIC ANALYSIS ............................................................................................................... 103 23. ADJACENT PROPERTIES .......................................................................................................... 104
Agnico Eagle Properties ............................................................................................................ 104 New Alger Property ................................................................................................................... 106 Pandora Wood Property ............................................................................................................ 106 Comments on Item 23 ............................................................................................................... 107
24. OTHER RELEVANT DATA AND INFORMATION ....................................................................... 108 25. INTERPRETATIONS AND CONCLUSIONS ................................................................................ 109 26. RECOMMENDATIONS ................................................................................................................. 116 27. REFERENCES .............................................................................................................................. 118 LIST OF FIGURES
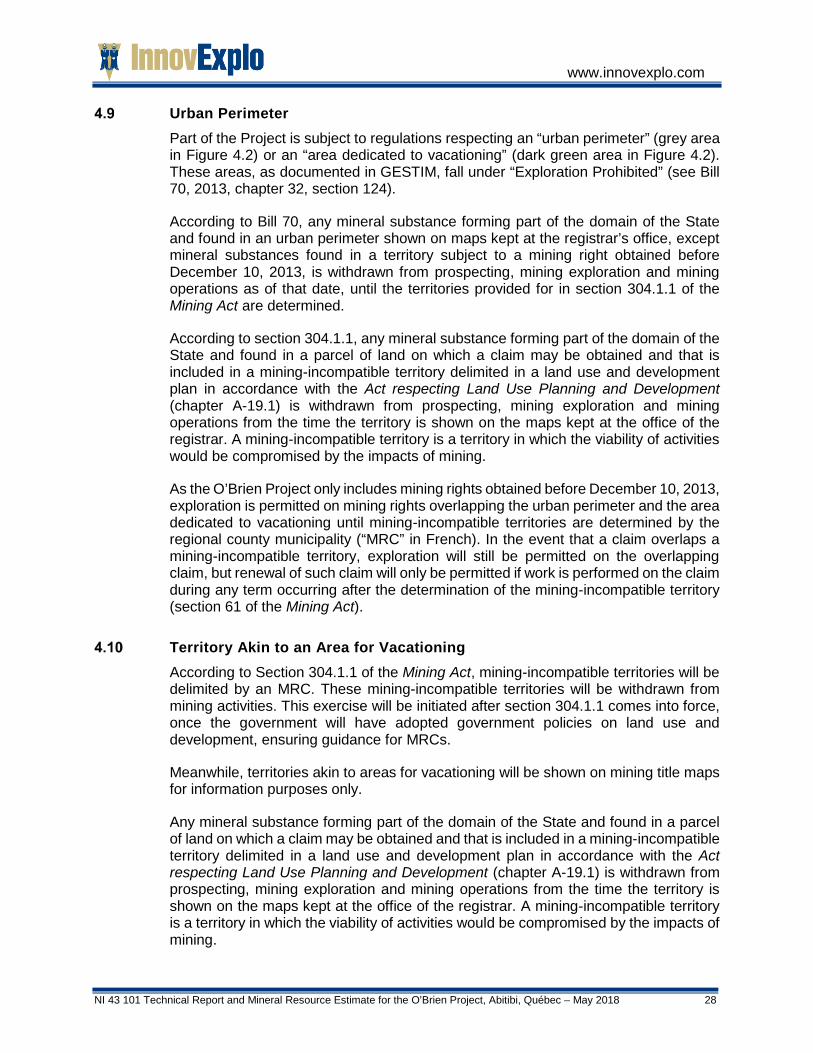
Figure 4.1 – Location of the O’Brien Project in the Province of Québec .................................................... 23 Figure 4.2 – Location map of the O’Brien Project mining titles ................................................................... 24 Figure 4.3 – Schematic longitudinal section of the O’Brien Mine ............................................................... 30 Figure 5.1 – Topography and accessibility of the O’Brien Project (Kewagama and O’Brien claim blocks) 32 Figure 7.1 –Stratigraphic map of the Abitibi Greenstone Belt. The geology of the southern Abitibi
Greenstone Belt is based on Ayer et al. (2005) and the Québec portion on Goutier and Melançon (2007) Figure modified from Thurston et al. (2008) .............................................. 58
Figure 7.2 – Geological synthesis of the Cadillac mining camp showing the location of active and closed mines, as well as ore deposits and showings. Modified from Lafrance et al. (2003a, 2003b) ................................................................................................................................................ 61
Figure 8.1 – Inferred crustal levels of gold deposition showing the different types of lode gold deposits and the inferred deposit clan (from Dubé et al., 2001; Poulsen et al., 2000) ................................ 67
Figure 8.2 – Schematic diagram illustrating the setting of greenstone-hosted quartz-carbonate vein deposits (from Poulsen et al., 2000) ..................................................................................................... 68
Figure 9.1 – Abitibi Geophysics OreVision® Survey with interpretation ...................................................... 70
www.innovexplo.com
NI 43 101 Technical Report and Mineral Resource Estimate for the O’Brien Project, Abitibi, Québec – May 2018 8
Figure 10.1 – 2015-2017 Drilling program collar locations ......................................................................... 74 Figure 11.1 – Distribution graph showing results from assayed blanks (marble) from the 2015 to September
2017 drilling programs (Techni-Lab)....................................................................................... 77 Figure 11.2 – Distribution graph showing results from assayed blanks (marble) from the 2015 to September
2017 drilling program (Swastika) ............................................................................................ 78 Figure 12.1 – Logging facility visited in November 2017 ............................................................................ 82 Figure 12.2 – Outdoor core storage site visited in November 2017 ........................................................... 82 Figure 14.1 – Surface plan view of the validated diamond drill holes used for the 2018 MRE .................. 86 Figure 14.2 – 3D view of the 34 mineralized solids, looking northeast ....................................................... 88 Figure 14.3 – Different graphs supporting a capping grade of 30 g/t Au for the mineralized zones .......... 89 Figure 14.4 – Different graphs supporting a capping grade of 5 g/t Au for the dilution envelopes ............. 90 Figure 14.5 – 3D view of the underground workings in the 36 East and Kewagama areas in relation to
resource blocks (red), looking northeast. Note that the compilation of the underground workings to the west (former O’Brien mine) is incomplete. .................................................... 92
Figure 14.6 – 3D view of Zone 1_S, looking north-northeast, showing all drill holes and the ellipsoid of Pass 1 (50m x 30m x 15m), Pass 2 (100m x 60m x 30m) .............................................................. 97
Figure 14.7 – Longitudinal view looking north showing the interpolated blocks of 1S zone and the classification ........................................................................................................................... 99
Figure 14.8 – 3D view looking northeast showing all indicated blocks above the cut-off grade of 3.50 g/t Au. .............................................................................................................................................. 100
Figure 14.9 – 3D view looking northeast showing all indicated blocks above the cut-off grade of 3.50 g/t Au as well as drill hole traces and historical underground voids ............................................... 100
Figure 23.1 – Adjacent properties of the O’Brien Project, showing past and current producers .............. 105 Figure 25.1 – 3D view of the O’Brien Project showing Indicated and Inferred blocks, along with historical
voids in the area where resources were compiled. .............................................................. 114 Figure 25.2 – Longitudinal view of the O’Brien Project showing indicated and inferred blocks, along with
historical voids including the area of the historical O’Brien mine ......................................... 115 LIST OF TABLES
Table 1.1 – 2018 O’Brien Project Mineral Resource Estimate at the official 3.50 g/t Au cut-off, sensitivity at other cut-off scenarios ............................................................................................................ 14
Table 2.1 – List of abbreviations ................................................................................................................. 18 Table 2.2– Conversion factors for measurements ...................................................................................... 20 Table 4.1 – Mining title list ........................................................................................................................... 27 Table 6.1 – Total mine workings at the O’Brien mine from 1926 to 1957 ................................................... 38 Table 6.2 - Total gold production from the O’Brien mine from 1926 to 1957 .............................................. 39 Table 6.3 – Total gold production from the O’Brien mine from 1974 to 1981 ............................................. 41 Table 6.4 – Holes drilled by Radisson between 1995 and 2013................................................................. 48 Table 6.5 – Holes drilled by Radisson from 2003 to 2011 .......................................................................... 52 Table 6.6 – Best results obtained from Radisson drilling programs (2003-2011)....................................... 52

www.innovexplo.com
NI 43 101 Technical Report and Mineral Resource Estimate for the O’Brien Project, Abitibi, Québec – May 2018 9
Table 6.7 – 2015 O’Brien Project Mineral Resource Estimate at a 3.50 g/t Au cut-off (O’Brien and Kewagama claim blocks) and sensitivity at other cut-off scenarios ....................................... 54
Table 6.8 – 2016 PEA Trade-Off study ....................................................................................................... 54 Table 6.9 – Mine plan tonnage distribution ................................................................................................. 55 Table 6.10 – Cash flow analysis summary ................................................................................................. 56 Table 9.1 – Samples from the 2017 prospecting campaign ....................................................................... 71 Table 10.1 – Drill hole summary, by year ................................................................................................... 73 Table 11.1 – Summary of batches with failed standards during the 2015 to September 2017 Radisson
drilling programs ..................................................................................................................... 79 Table 14.1 – Summary statistics for the raw assays by dataset ................................................................. 88 Table 14.2 – Summary statistics for the composites .................................................................................. 93 Table 14.3 – Mineral density factors and relative abundance in O’Brien Project mineralization ................ 94 Table 14.4 – Block model properties .......................................................................................................... 94 Table 14.5 – Block model ............................................................................................................................ 95 Table 14.6 – Resource model estimation parameters ................................................................................ 96 Table 14.7 – Input parameters used for the underground cut-off grade estimation ................................... 97 Table 14.8 – 2018 O’Brien Project Mineral Resource Estimate at a 3.50 g/t Au cut-off, sensitivity at other
cut-off scenarios ................................................................................................................... 101 Table 14.9 - 2018 in situ Mineral Resource Estimate for the O’Brien Project at the official 3.5 g/t Au cut-off
grade, by mineralized zone .................................................................................................. 102 Table 25.1 – Risks of the O’Brien Project ................................................................................................. 111 Table 25.2 – Opportunities of the O’Brien Project .................................................................................... 112 Table 26.1 – Estimated costs for the recommended work program ......................................................... 117

www.innovexplo.com
NI 43 101 Technical Report and Mineral Resource Estimate for the O’Brien Project, Abitibi, Québec – May 2018 10
1. SUMMARY
Introduction InnovExplo Inc. (“InnovExplo”) was contracted by Mario Bouchard, President and CEO of Radisson Mining Resources (“Radisson” or the “issuer”), to prepare an updated mineral resource estimate for the O’Brien Project (the “Project”) and a supporting Technical Report in accordance with Canadian Securities Administrators’ National Instrument 43 101 Respecting Standards of Disclosure for Mineral Projects (“NI 43 101” or “43 101”) and its related Form 43 101F1.
InnovExplo is an independent mining and exploration consulting firm based in Val-d’Or (Québec).
This Technical Report supports the disclosure of the updated mineral resource estimate covering the Project, near the town of Cadillac in the Province of Québec. There is insufficient compilation work in the area of the former O’Brien mine to warrant its inclusion in this update.
Contributors and Qualified Person Christine Beausoleil, P.Geo., Project Manager–Technical Services for InnovExplo, is the qualified person (“QP”), as defined in NI 43-101, responsible for preparing all the sections of this technical report (the “Technical Report”).
Property Description and Location The Project is located in the province of Québec, Canada, just north of the municipality of Cadillac, within the new limits of the city of Rouyn-Noranda. Cadillac lies approximately 45 km east of downtown Rouyn-Noranda and 45 km west of downtown Val-d’Or.
The current O’Brien Project consists of 21 contiguous claims covering an aggregate area of 637.43 ha. It represents the amalgamation of the former O’Brien and Kewagama properties.
The former O’Brien property included a mining lease that expired in 2008 and was subsequently converted back into claims.
The former Kewagama claim group owned by Radisson (100%), with a 2% NSR royalty payable to KWG Resources Inc. in the event of commercial production.
A $1,000,000 payment must be made to Breakwater Resources Ltd (now Nyrstar) upon reaching commercial production on either the O’Brien or Kewagama claim groups, against which shall be deducted any costs required to restore the O’Brien tailing ponds.
Accessibility, Climate, Local resources, Infrastructure and Physiography The O’Brien Project is located in the northwest part of the Abitibi administrative region, in the western part of Cadillac Township. Highway 117 runs just south of the Project’s
www.innovexplo.com
NI 43 101 Technical Report and Mineral Resource Estimate for the O’Brien Project, Abitibi, Québec – May 2018 11
boundary. Well-maintained secondary gravel roads provide easy access to the old O’Brien and Kewagama mine sites.
A large power line straddles the south part of the Project and a railway connected to the national network passes through Cadillac, just 2 km to the south.
Radisson has an exploration office and a large, well-equipped core logging and storage facility at the O’Brien mine site. Surface facilities also include large areas for stockpiling ore and waste materials. A tailings facility of 4 hectares and a polishing basin are located directly north of the old mill. A security guard patrols the mine site several times a day and Radisson has implemented additional measures to maintain security.
The region is under the influence of a continental climate marked by cold, dry winters and mild, humid summers. The topography of the project area is relatively flat to gently rolling, with local relief up to 20 m. Low-lying grounds are characterized by swamps and ponds, and overall drainage is very poor throughout the area. The Blake River flows northeast, running from the southwest corner through the Project to reach Lac Preissac, 3.2 km northeast of the property. The Project lies within the boreal forest domain.
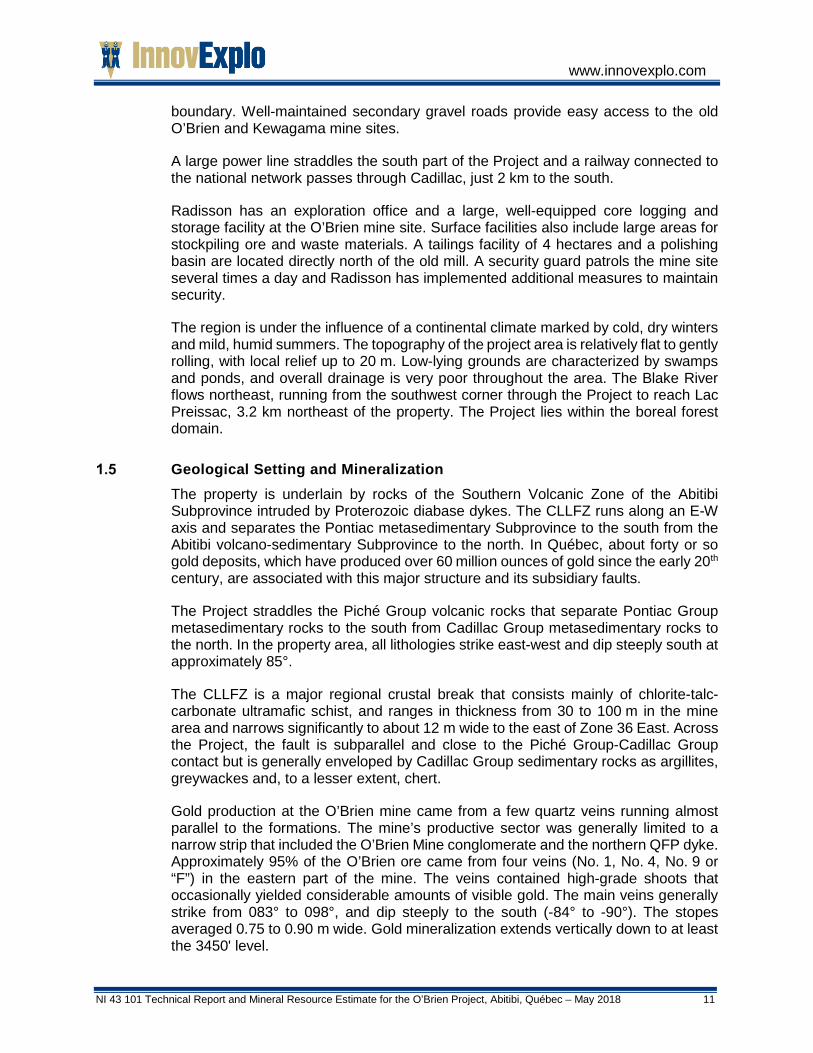
Geological Setting and Mineralization The property is underlain by rocks of the Southern Volcanic Zone of the Abitibi Subprovince intruded by Proterozoic diabase dykes. The CLLFZ runs along an E-W axis and separates the Pontiac metasedimentary Subprovince to the south from the Abitibi volcano-sedimentary Subprovince to the north. In Québec, about forty or so gold deposits, which have produced over 60 million ounces of gold since the early 20th century, are associated with this major structure and its subsidiary faults.
The Project straddles the Piché Group volcanic rocks that separate Pontiac Group metasedimentary rocks to the south from Cadillac Group metasedimentary rocks to the north. In the property area, all lithologies strike east-west and dip steeply south at approximately 85°.
The CLLFZ is a major regional crustal break that consists mainly of chlorite-talc-carbonate ultramafic schist, and ranges in thickness from 30 to 100 m in the mine area and narrows significantly to about 12 m wide to the east of Zone 36 East. Across the Project, the fault is subparallel and close to the Piché Group-Cadillac Group contact but is generally enveloped by Cadillac Group sedimentary rocks as argillites, greywackes and, to a lesser extent, chert.
Gold production at the O’Brien mine came from a few quartz veins running almost parallel to the formations. The mine’s productive sector was generally limited to a narrow strip that included the O’Brien Mine conglomerate and the northern QFP dyke. Approximately 95% of the O’Brien ore came from four veins (No. 1, No. 4, No. 9 or “F”) in the eastern part of the mine. The veins contained high-grade shoots that occasionally yielded considerable amounts of visible gold. The main veins generally strike from 083° to 098°, and dip steeply to the south (-84° to -90°). The stopes averaged 0.75 to 0.90 m wide. Gold mineralization extends vertically down to at least the 3450' level.
www.innovexplo.com
NI 43 101 Technical Report and Mineral Resource Estimate for the O’Brien Project, Abitibi, Québec – May 2018 12
Drilling, Sampling Method, Approach and Analysis Diamond drilling core is the principal source of information for geological data. From December 2015, Radisson resumed fields work and drilled 76 surface diamond drill holes for 30,150 m.
From 2015 to 2017, all drilling on the O’Brien Project was performed by Rouillier Drilling Inc. from Amos, Quebec. All holes were drilled from surface, with NQ core caliber (47.6 mm core diameter). RQD (Rock Quality Designation) measurements was completed on most drilled core. The overall average RQD is 85%.
Core boxes are received on a daily basis at the core shack on the Project. Drill core is logged and sampled by experienced and qualified geologists or by a geologist-in-training under the supervision of a qualified geologist. Samples usually range from 0.5 m to 1.0 m in length and, whenever possible, sample contacts respect lithological contacts, the appearance of mineralization, and changes in alteration type, vein type or vein density. Core samples are sawed in half (NQ core diameter).
For the 2016-2017 drilling program, samples were prepared at the sample preparation facilities of Swastika Laboratories Ltd (“Swastika”) in Swastika, Ontario, and Activation Laboratories Ltd (“ActLabs”) in Val-d’Or, Québec. Actlabs sent the prepared samples to their assay facility in Ste-Germaine-Boulé (herein referred to by “Techni-Lab”) whereas Swastika does sample preparation and assaying at the same facility. Both are commercial laboratories independent of Radisson with no interests in the Project. Both laboratories received ISO/IEC 17025 accreditation through the Standards Council of Canada (“SCC”).
Sample preparation procedures for routine fire assaying are to initially crush to >80% passing 1,700 microns (Swatiska) or 8 mesh (Techni-lab). A 250 g subsample is split by rotary split (Swatiska) or a riffle unit (Techni-lab) and pulverized to >90% passing 107 microns (Swatiska) or 200 mesh (Techni-lab). This subsample is sent for assay where a 30 g subsample is taken and fire-assayed with an atomic absorption (AA) spectrometry finish. When assay results are higher than 5 g/t Au a second subsample of 30 g sample pulp are reassayed by fire assay using a gravimetric finish. When visible gold is observed, the sample is identified and sent to metallic sieve.
The issuer’s QA/QC program for drill core includes the insertion of blanks and standards in the flow stream of core samples. For each group of 20 samples, the issuer inserted one blank and one standard.
InnovExplo is in the opinion that the sample preparation, analysis and security procedures and QA/QC protocols used by Radisson for the O’Brien Project are appropriate for an advanced exploration program. Duplicates should also be implemented to complete the QA/QC coverage.
Data Verification InnovExplo’s data verification included visits to the project’s office, as well as to the logging and core storage facilities, completed by Christine Beausoleil on November 23, 2017. It also included a review of selected core intervals, drill hole collar locations, assays, the QA/QC program, downhole surveys, information on mined-out areas, and the descriptions of lithologies, alterations and structures.

www.innovexplo.com
NI 43 101 Technical Report and Mineral Resource Estimate for the O’Brien Project, Abitibi, Québec – May 2018 13
For assays and survey data a comparison of the database with original certificates were performed. Any discrepancies found were corrected and incorporated into the database. InnovExplo is of the opinion that the data verification process demonstrates the validity of the data and protocols for the Kewagama and 36 East areas of the Project.
InnovExplo considers the Radisson database to be valid and of sufficient quality to be used for the mineral resource estimate herein.
Mineral Resource Estimates The mineral resource estimate for the O’Brien Project (the “2018 MRE) herein was prepared by Christine Beausoleil, P.Geo., using all available information. The main objective of the mandate assigned by the issuer was to use the 2015-2017 drilling programs to update the 2015 Mineral Resource Estimate prepared by InnovExplo, which was published in a report titled “Technical Report for the O’Brien Project, Abitibi, Québec” (Richard et al., 2015).
The 2018 resource area measures 2.15 km on strike, 0.4 km wide and 1.2 km deep. The resource estimate is based on a compilation of historical and recent diamond drill holes and a litho-structural model constructed by InnovExplo.
The GEMS diamond drill hole database contains 366 surface holes and 281 underground holes inside the resource estimate area. All 647 holes had been compiled and validated at the time of the estimate.
The 2018 model is the result of a review of historical data combined with new holes from the 2015-2017 drilling programs. The 3D mineralized zones were created using the vein modelling module in Leapfrog from an interval selection based on the intercepts field. The selection was locally changed to ensure spatial coherence and continuity in 3D. InnovExplo created a total of 34 mineralized solids (17 mineralized zones) that honour the drill hole database.
InnovExplo is of the opinion that the current mineral resource estimate can be categorized as Indicated and Inferred mineral resources based on data density, search ellipse criteria, drill hole density, and interpolation parameters. InnovExplo considers the 2018 MRE to be reliable and based on quality data, reasonable hypotheses and parameters that follow CIM Definition Standards.
Table 1.1Table 14.8 displays the results of the 2018 in situ Mineral Resource Estimate for the O’Brien Project (17 mineralized zones and 2 dilution envelopes) at the official 3.50 g/t Au cut-off grade, as well as the sensitivity at other cut-off grades. The reader should be cautioned that the figures presented in Table 1.1Table 14.8 should not be misinterpreted as a mineral resource statement apart from the official scenario at 3.50 g/t Au. The reported quantities and grade estimates at different cut-off grades are only presented to demonstrate the sensitivity of the resource model to the selection of a reporting cut-off grade.
www.innovexplo.com
NI 43 101 Technical Report and Mineral Resource Estimate for the O’Brien Project, Abitibi, Québec – May 2018 14
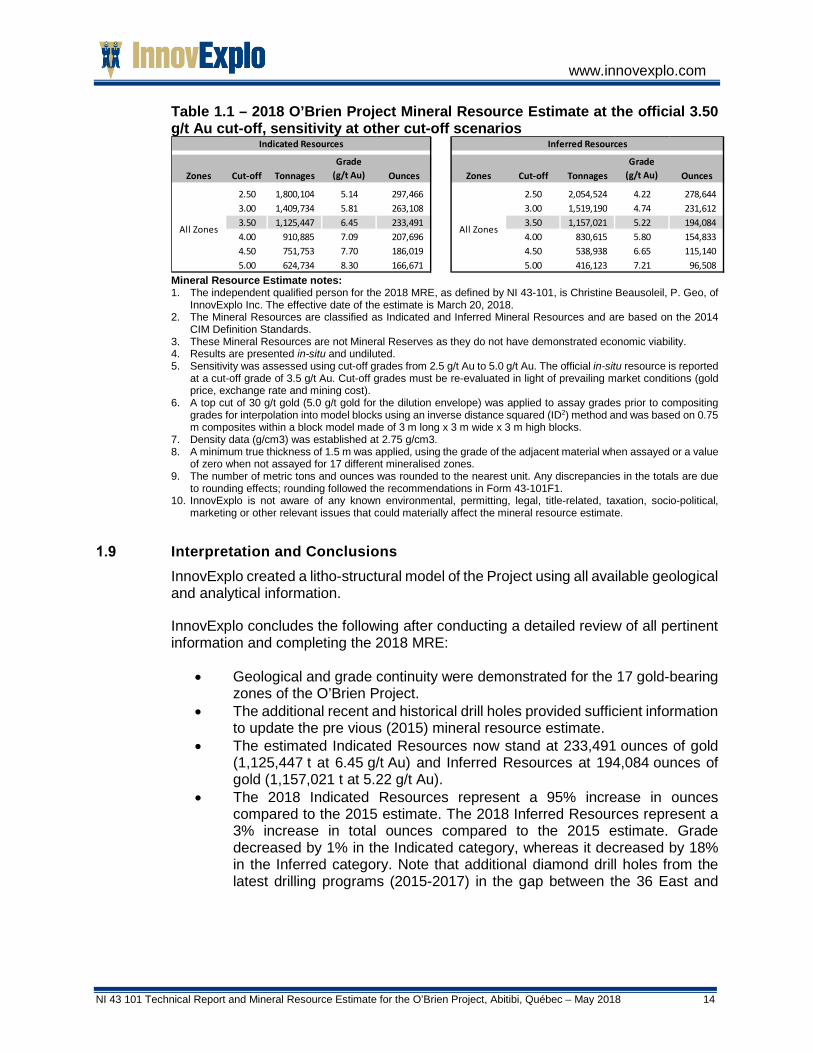
Table 1.1 – 2018 O’Brien Project Mineral Resource Estimate at the official 3.50 g/t Au cut-off, sensitivity at other cut-off scenarios
Mineral Resource Estimate notes: 1. The independent qualified person for the 2018 MRE, as defined by NI 43-101, is Christine Beausoleil, P. Geo, of
InnovExplo Inc. The effective date of the estimate is March 20, 2018. 2. The Mineral Resources are classified as Indicated and Inferred Mineral Resources and are based on the 2014
CIM Definition Standards. 3. These Mineral Resources are not Mineral Reserves as they do not have demonstrated economic viability. 4. Results are presented in-situ and undiluted. 5. Sensitivity was assessed using cut-off grades from 2.5 g/t Au to 5.0 g/t Au. The official in-situ resource is reported
at a cut-off grade of 3.5 g/t Au. Cut-off grades must be re-evaluated in light of prevailing market conditions (gold price, exchange rate and mining cost).
6. A top cut of 30 g/t gold (5.0 g/t gold for the dilution envelope) was applied to assay grades prior to compositing grades for interpolation into model blocks using an inverse distance squared (ID2) method and was based on 0.75 m composites within a block model made of 3 m long x 3 m wide x 3 m high blocks.
7. Density data (g/cm3) was established at 2.75 g/cm3. 8. A minimum true thickness of 1.5 m was applied, using the grade of the adjacent material when assayed or a value
of zero when not assayed for 17 different mineralised zones. 9. The number of metric tons and ounces was rounded to the nearest unit. Any discrepancies in the totals are due
to rounding effects; rounding followed the recommendations in Form 43-101F1. 10. InnovExplo is not aware of any known environmental, permitting, legal, title-related, taxation, socio-political,
marketing or other relevant issues that could materially affect the mineral resource estimate.
Interpretation and Conclusions InnovExplo created a litho-structural model of the Project using all available geological and analytical information.
InnovExplo concludes the following after conducting a detailed review of all pertinent information and completing the 2018 MRE:
• Geological and grade continuity were demonstrated for the 17 gold-bearing zones of the O’Brien Project.
• The additional recent and historical drill holes provided sufficient information to update the pre vious (2015) mineral resource estimate.
• The estimated Indicated Resources now stand at 233,491 ounces of gold (1,125,447 t at 6.45 g/t Au) and Inferred Resources at 194,084 ounces of gold (1,157,021 t at 5.22 g/t Au).
• The 2018 Indicated Resources represent a 95% increase in ounces compared to the 2015 estimate. The 2018 Inferred Resources represent a 3% increase in total ounces compared to the 2015 estimate. Grade decreased by 1% in the Indicated category, whereas it decreased by 18% in the Inferred category. Note that additional diamond drill holes from the latest drilling programs (2015-2017) in the gap between the 36 East and
Zones Cut-off TonnagesGrade
(g/t Au) Ounces Zones Cut-off TonnagesGrade
(g/t Au) Ounces
2.50 1,800,104 5.14 297,466 2.50 2,054,524 4.22 278,6443.00 1,409,734 5.81 263,108 3.00 1,519,190 4.74 231,6123.50 1,125,447 6.45 233,491 3.50 1,157,021 5.22 194,0844.00 910,885 7.09 207,696 4.00 830,615 5.80 154,8334.50 751,753 7.70 186,019 4.50 538,938 6.65 115,1405.00 624,734 8.30 166,671 5.00 416,123 7.21 96,508
Indicated Resources
All Zones
Inferred Resources
All Zones

www.innovexplo.com
NI 43 101 Technical Report and Mineral Resource Estimate for the O’Brien Project, Abitibi, Québec – May 2018 15
Kewagama areas is mainly responsible for the resources increasing from the previous (2015) resource estimate.
• It is likely that additional diamond drilling on multiple zones would increase the indicated Resources and upgrade some of the Inferred Resources to Indicated Resources.
• There is also the potential for upgrading some of the Indicated Resources to Measured Resources through detailed geological mapping, infill drilling and systematic channel sampling from the underground workings.
InnovExplo also believes there are several opportunities to add additional resources to the O’Brien Project:
• Target 1: o Zone F between old O’Brien and Zone 36E.
• Target 2: o Near surface thickening of Zone 36E.
• Target 3: o Depth extension of all zones (36 East, Kewagama and O’Brien).
• Target 4: o Extension of subparallel mineralized zones north and south of the
currently identified zones.
• Target 5: o Remaining mineralization in the old O’Brien mine area.
Recommendations Based on the results of the 2018 Mineral Resource Estimate, InnovExplo recommends that the O’Brien Project be advanced to the next phase, which would be a PEA.
The company should complete the 3D compilation of the remaining historical openings, which would have a positive impact on locating all remaining historical underground drill holes and channel samples. The remaining historical data (drill holes, channel samples, etc.) should also be compiled. InnovExplo recommends prioritizing the eastern area of the former O’Brien Mine and use to upgrade the current model and resource estimate.
Conversion drilling should be devoted to upgrading part of the Inferred resources to the Indicated category, while exploration drilling should target the currently identified areas of interests described in this report, but also target the discovery of additional zones over the entire project.
www.innovexplo.com
NI 43 101 Technical Report and Mineral Resource Estimate for the O’Brien Project, Abitibi, Québec – May 2018 16
The stakeholder mapping and communication plan should be pursued. A baseline environmental study should be completed and should include addressing the arsenic trioxide underground storage area located at level 1500’ in the old O’Brien mine, west of the No. 3 Shaft in the 15-G-West and 15-F-West drifts, 1,100 meters west of western boundary of current resources. Based on the results of this study, appropriate actions (to be determined) should be carried out.
InnovExplo also recommends an underground bulk sample to test and validate the different mining and metallurgical assumptions and validate the geological and resources model.
In summary, InnovExplo recommends a two-phase work program as follows:
• Phase 1: o 3D compilation of historical voids of the eastern part of the former
O’Brien Mine; o Continue surface conversion drilling; o Social Licence Management; o Environmental and hydrogeological characterization testing; o Waste rock and old waste pad characterization; o Initiate the documentation and different studies in preparation for
legislative permitting process; o Update the Mineral Resource Estimation.
• Phase 2: o PEA on Phase 1 Mineral Resource Estimation; o Continue surface conversion drilling; o Compile all remaining historical openings and historical data from
Kewagama and O’Brien areas.
InnovExplo has prepared a cost estimate for the recommended two-phase work program to serve as a guideline for the project. The budget for the proposed program is presented in Table 26.1. Expenditures for Phase 1 are estimated at C$1,828,500 (incl. 15% for contingencies). Expenditures for Phase 2 are estimated at C$1,684,750 (incl. 15% for contingencies). The grand total is C$3,513,250 (incl. 15% for contingencies). Phase 2 is contingent upon the success of Phase 1.
InnovExplo is of the opinion that the recommended two-phase work program and proposed expenditures are appropriate and well thought out, and that the character of the Project is of sufficient merit to justify the recommended program. InnovExplo believes that the proposed budget reasonably reflects the type and amount of the contemplated activities.
www.innovexplo.com
NI 43 101 Technical Report and Mineral Resource Estimate for the O’Brien Project, Abitibi, Québec – May 2018 17
2. INTRODUCTION
Overview InnovExplo Inc. (“InnovExplo”) was contracted by Mario Bouchard, President and CEO of Radisson Mining Resources (“Radisson” or the “issuer”), to prepare an updated mineral resource estimate for the O’Brien Project (the “Project”) and a supporting Technical Report in accordance with Canadian Securities Administrators’ National Instrument 43-101 Respecting Standards of Disclosure for Mineral Projects (“NI 43-101” or “43-101”) and its related Form 43 101F1.
InnovExplo is an independent mining and exploration consulting firm based in Val-d’Or (Québec).
Radisson is a Canadian mineral exploration company trading publicly on the TSX Venture Exchange under the symbol RDS.
The Project is located north of the town of Cadillac in the province of Québec. It consists of two claim groups (O’Brien and Kewagama) that host what were historically referred to as the O’Brien mine, the Kewagama mine and the 36 East Zone. For the purpose of this Technical Report, the term “O’Brien Project” covers the entire property and the O’Brien mine, Kewagama mine and 36 East Zone will be referred to as “areas”, not mines or zones.
The updated mineral resource estimate herein (“2018 MRE”) has an effective date of March 20, 2018 and includes new holes since the last mineral resource of 2015 (Richard et al., 2015). The estimate follows CIM Definition Standards.
Report Responsibility and Qualified Persons This Technical Report and the 2018 MRE were prepared by Christine Beausoleil, Project Manager–Technical Services for InnovExplo. Ms. Beausoleil is a professional geologist in good standing with the OGQ (licence No. 656) and EGBC (licence No. 36156) and the independent qualified person (“QP”) as defined by NI 43-101 for all sections of the Technical Report.
Christine Beausoleil visited the Project site on November 23, 2017, at which time she examined mineralized exploration diamond drill core, reviewed the core logging and sampling procedures, and performed onsite data verification.
Effective Date The effective date of this Technical Report is March 20, 2018.
Sources of Information The documentation listed in items 3 and 27 were used to support the Technical Report. Excerpts or summaries from documents authored by other consultants are indicated in the text.
www.innovexplo.com
NI 43 101 Technical Report and Mineral Resource Estimate for the O’Brien Project, Abitibi, Québec – May 2018 18
InnovExplo’s review of the Project was based on published material in addition to the data, professional opinions and unpublished material submitted by Radisson. InnovExplo has reviewed the data provided by the issuer and/or by its agents.
InnovExplo has also consulted other information sources, principally the Government of Québec’s online claim management and assessment work databases (GESTIM and SIGEOM, respectively), as well as technical reports, AIFs, MD&A reports, and press releases published by Radisson on SEDAR (www.sedar.com).
InnovExplo conducted a review and appraisal of the information used to prepare this Technical Report, including the conclusions and recommendations, and believes that such information is valid and appropriate considering the status of the project and the purpose for which the report is prepared. The author has fully researched and documented the conclusions and recommendations made in the Technical Report.
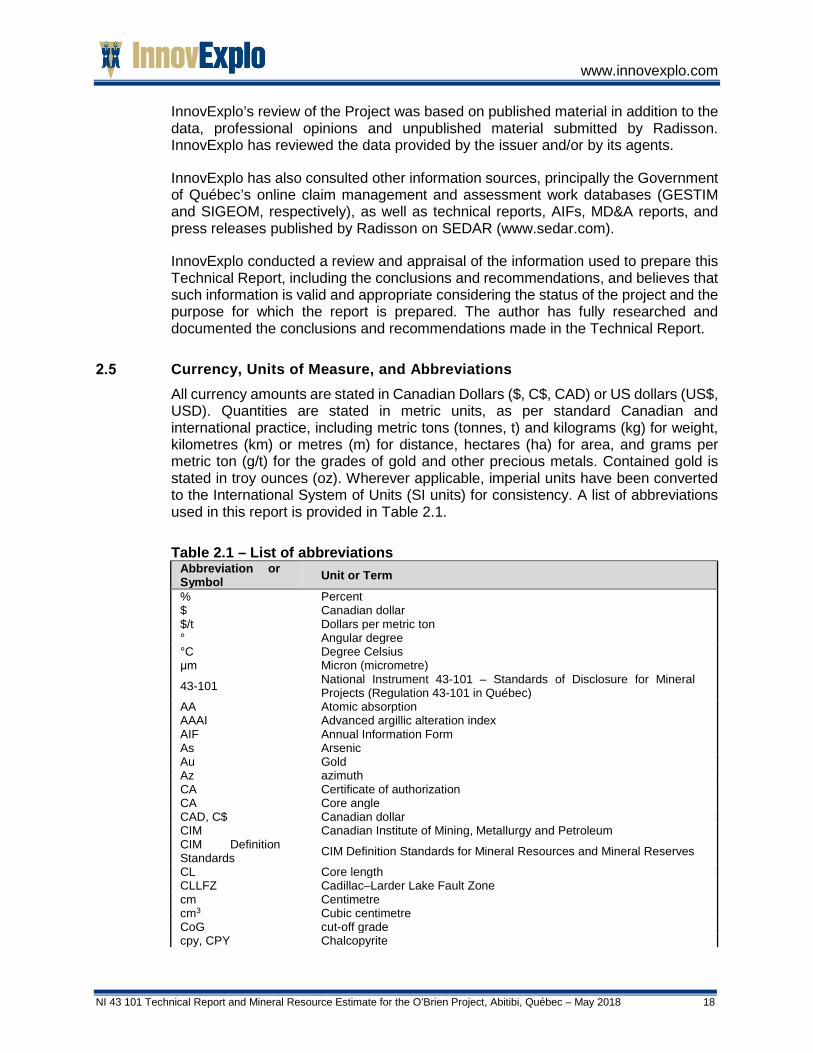
Currency, Units of Measure, and Abbreviations All currency amounts are stated in Canadian Dollars ($, C$, CAD) or US dollars (US$, USD). Quantities are stated in metric units, as per standard Canadian and international practice, including metric tons (tonnes, t) and kilograms (kg) for weight, kilometres (km) or metres (m) for distance, hectares (ha) for area, and grams per metric ton (g/t) for the grades of gold and other precious metals. Contained gold is stated in troy ounces (oz). Wherever applicable, imperial units have been converted to the International System of Units (SI units) for consistency. A list of abbreviations used in this report is provided in Table 2.1.
Table 2.1 – List of abbreviations Abbreviation or Symbol Unit or Term % Percent $ Canadian dollar $/t Dollars per metric ton ° Angular degree °C Degree Celsius μm Micron (micrometre)
43-101 National Instrument 43-101 – Standards of Disclosure for Mineral Projects (Regulation 43-101 in Québec)
AA Atomic absorption AAAI Advanced argillic alteration index AIF Annual Information Form As Arsenic Au Gold Az azimuth CA Certificate of authorization CA Core angle CAD, C$ Canadian dollar CIM Canadian Institute of Mining, Metallurgy and Petroleum CIM Definition Standards CIM Definition Standards for Mineral Resources and Mineral Reserves
CL Core length CLLFZ Cadillac–Larder Lake Fault Zone cm Centimetre cm3 Cubic centimetre CoG cut-off grade cpy, CPY Chalcopyrite

www.innovexplo.com
NI 43 101 Technical Report and Mineral Resource Estimate for the O’Brien Project, Abitibi, Québec – May 2018 19
Abbreviation or Symbol Unit or Term CRM Certified reference material DDH Diamond drill hole EM Electromagnetics ft, ' Foot (12 inches) ft3/ton cubic feet per short ton g Gram G Billion Ga Billion years g/cm3 Gram per cubic centimetre g/t Gram per metric ton (tonne)
GESTIM Gestion des titres miniers (the MERN’s online claim management system)
ha Hectare ICP-AES Inductively coupled plasma atomic emission spectroscopy ICP-OES Inductively coupled plasma optical emission spectroscopy ICP-MS Inductively coupled plasma mass spectroscopy ID2 Inverse distance squared ID3 Inverse distance cubed ID6 Inverse distance power six in, " Inch IP Induced polarization ISO International Organization for Standardization JV Joint venture kg Kilogram km Kilometre lb Pound M Million m Metre m2 Square metre m3 Cubic metre Ma Million years Mag, MAG Magnetometer, magnetometric masl Metres above mean sea level MD&A Management’s Discussion and Analysis
MDDELCC
Ministère du Développement durable, de l’Environnement et de la Lutte contre les changements climatiques du Québec (Québec’s Ministry of Sustainable Energy, Environment and the Fight Against Climate Change)
MERN Ministère de l’Énergie et des Ressources Naturelles du Québec (Québec’s Ministry of Energy and Natural Resources)
MERQ Former name of MERN mesh US mesh
MFFP Ministère des Forêts, de la Faune et des Parcs (Québec’s Ministry of Forests, Wildlife and Parks)
mL Millilitre mm Millimetre Moz Million (troy) ounces MRC Municipalité régional de comté (Regional county municipality in English) MRE Mineral resource estimate Mt Million metric tons (tonnes) NAG Non-acid generating
NI 43-101 National Instrument 43-101 – Standards of Disclosure for Mineral Projects (Regulation 43-101 in Québec)
NN Nearest neighbour NSR Net smelter return NTS National Topographic System OGQ Ordre des géologues du Québec (Québec order of geologists) OIQ Ordre des ingénieurs du Québec (Québec order of engineer) OK Ordinary kriging oz Troy ounce
www.innovexplo.com
NI 43 101 Technical Report and Mineral Resource Estimate for the O’Brien Project, Abitibi, Québec – May 2018 20
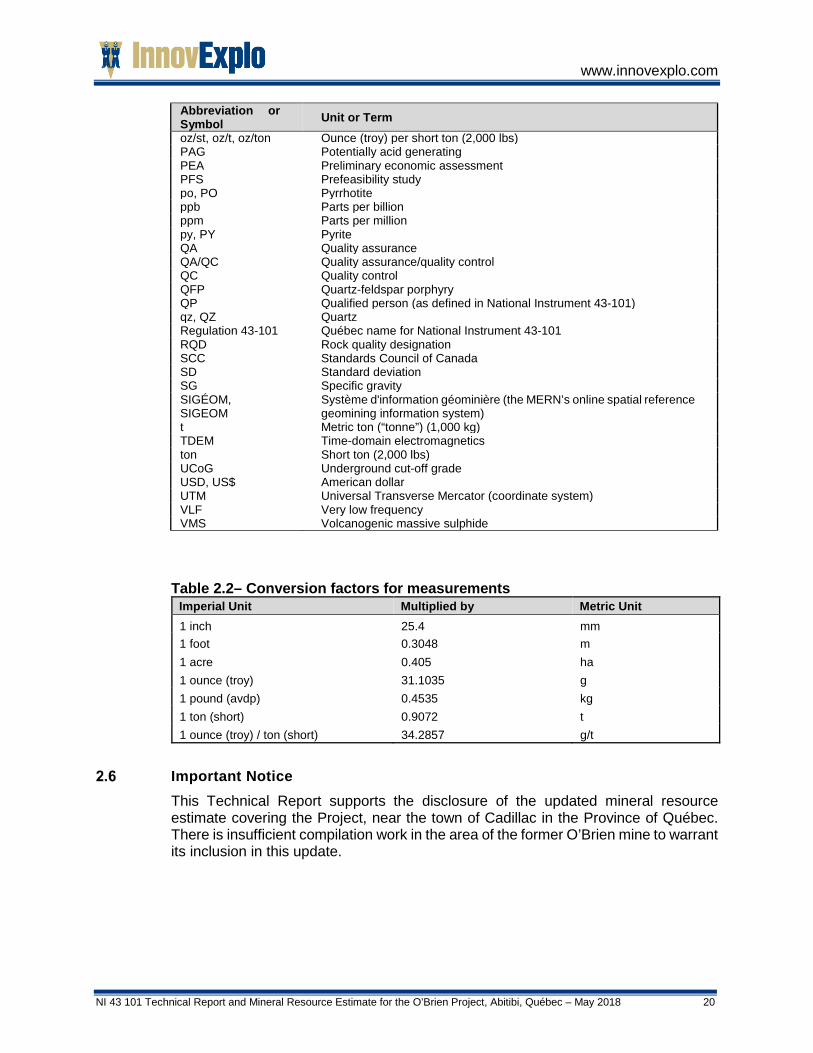
Abbreviation or Symbol Unit or Term oz/st, oz/t, oz/ton Ounce (troy) per short ton (2,000 lbs) PAG Potentially acid generating PEA Preliminary economic assessment PFS Prefeasibility study po, PO Pyrrhotite ppb Parts per billion ppm Parts per million py, PY Pyrite QA Quality assurance QA/QC Quality assurance/quality control QC Quality control QFP Quartz-feldspar porphyry QP Qualified person (as defined in National Instrument 43-101) qz, QZ Quartz Regulation 43-101 Québec name for National Instrument 43-101 RQD Rock quality designation SCC Standards Council of Canada SD Standard deviation SG Specific gravity SIGÉOM, SIGEOM
Système d'information géominière (the MERN’s online spatial reference geomining information system)
t Metric ton (“tonne”) (1,000 kg) TDEM Time-domain electromagnetics ton Short ton (2,000 lbs) UCoG Underground cut-off grade USD, US$ American dollar UTM Universal Transverse Mercator (coordinate system) VLF Very low frequency VMS Volcanogenic massive sulphide
Table 2.2– Conversion factors for measurements Imperial Unit Multiplied by Metric Unit 1 inch 25.4 mm 1 foot 0.3048 m 1 acre 0.405 ha 1 ounce (troy) 31.1035 g 1 pound (avdp) 0.4535 kg 1 ton (short) 0.9072 t 1 ounce (troy) / ton (short) 34.2857 g/t
Important Notice This Technical Report supports the disclosure of the updated mineral resource estimate covering the Project, near the town of Cadillac in the Province of Québec. There is insufficient compilation work in the area of the former O’Brien mine to warrant its inclusion in this update.

www.innovexplo.com
NI 43 101 Technical Report and Mineral Resource Estimate for the O’Brien Project, Abitibi, Québec – May 2018 21
3. RELIANCE ON OTHER EXPERTS This Technical Report has been prepared by InnovExplo at the request of the issuer. Christine Beausoleil (P.Geo.) of InnovExplo is the qualified and independent person (“QP”) who was assigned the mandate of reviewing technical documentation relevant to the report, preparing a mineral resource estimate update on the O’Brien Project, and recommending a work program if warranted.
Some of the geological and/or technical reports for projects in the vicinity of the Project were prepared before the implementation of NI 43-101 in 2001. The authors of such reports appear to have been qualified and the information prepared according to standards that were acceptable to the exploration community at the time. In some cases, however, the data are incomplete and do not fully meet the current requirements of NI 43-101. InnovExplo has no reason to believe that any of the information used to prepare this Technical Report is invalid or contains misrepresentations.
The QP relied on the following people or sources of information during the preparation of this Technical Report:
• The issuer supplied information about mining titles, option agreements, royalty agreements, environmental liabilities, permits and details of negotiations with First Nations. InnovExplo consulted the mining titles and their status, as well as any agreements and technical data supplied by the issuer (or its agents) and any available public sources of relevant technical information. InnovExplo is not qualified to express any legal opinion with respect to property titles, current ownership or possible litigation.
• Patrick Frenette, P.Eng., of InnovExplo, provided parameters to establish the official cut-off grade for the mineral resource estimate.
• Venetia Bodycomb, M.Sc., of Vee Geoservices provided critical and linguistic editing of a draft version of the Technical Report.
• Isabelle Richard, P.Eng., of InnovExplo was in charge of compiling the Technical Report.

www.innovexplo.com
NI 43 101 Technical Report and Mineral Resource Estimate for the O’Brien Project, Abitibi, Québec – May 2018 22
4. PROPERTY DESCRIPTION AND LOCATION
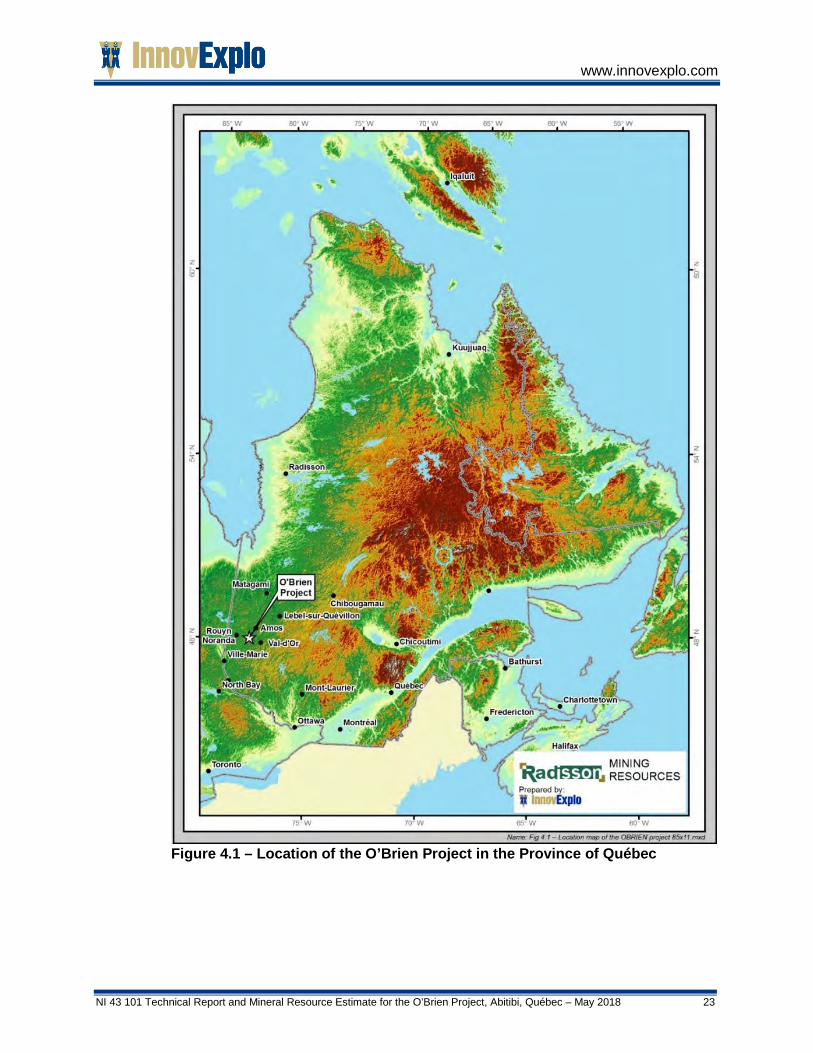
Location The O’Brien Project is located in the province of Québec, Canada, just north of the municipality of Cadillac, within the new limits of the city of Rouyn-Noranda (Figure 4.1). Cadillac lies approximately 45 km east of downtown Rouyn-Noranda and 45 km west of downtown Val-d’Or. A small portion of the urban perimeter of the town of Cadillac overlaps the southern limit of the Project (Figure 4.1). The Project is located on NTS map sheet 32 D/01 in the township of Cadillac. The approximate centre of the Project is at Latitude 48º14'07" N and Longitude 78º22'54" W, and the approximate UTM coordinates are 694330E and 5345765N (NAD 83, Zone 17).
Mining Rights in the Province of Québec The following discussion on the mining rights in the province of Québec was largely taken from Guzon (2012) and Gagné and Masson (2013), and from the Mining Act and the Act to Amend the Mining Act (“Bill 70”), the latter of which was assented on December 10, 2013 (National Assembly, 2013).
In the Province of Québec, mining is principally regulated by the provincial government. The Ministère de l’Énergie des Ressources Naturelles (“MERN”) is the provincial agency entrusted with the management of mineral substances in Québec. The ownership and granting of mining titles for mineral substances are primarily governed by the Mining Act and related regulations. In Québec, land surface rights are distinct property from mining rights. Rights in or over mineral substances in Québec form part of the domain of the State (the public domain), subject to limited exceptions for privately owned mineral substances. Mining titles for mineral substances within the public domain are granted and managed by the MERN. The granting of mining rights in privately owned mineral substances is a matter of private negotiations, although certain aspects of the exploration for and mining of such mineral substances are governed by the Mining Act. This section provides a brief overview of the most common mining rights for mineral substances within the domain of the State.
www.innovexplo.com
NI 43 101 Technical Report and Mineral Resource Estimate for the O’Brien Project, Abitibi, Québec – May 2018 23
Figure 4.1 – Location of the O’Brien Project in the Province of Québec
www.innovexplo.com
NI 43 101 Technical Report and Mineral Resource Estimate for the O’Brien Project, Abitibi, Québec – May 2018 24
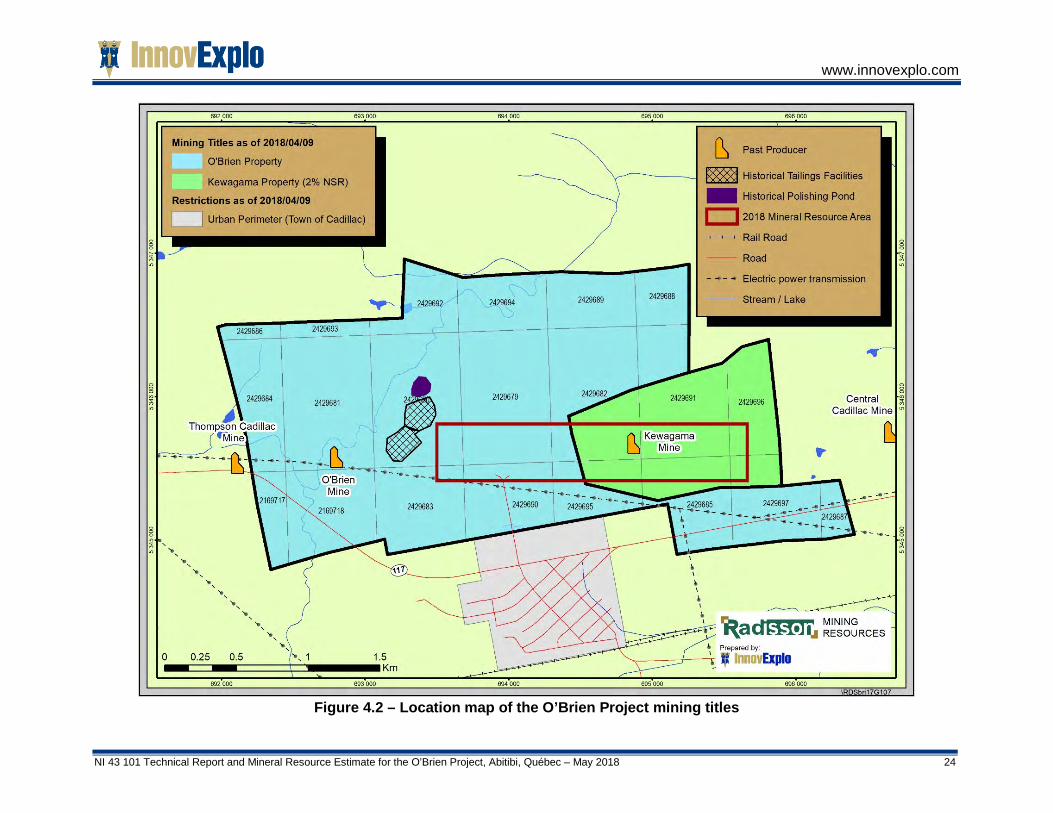
Figure 4.2 – Location map of the O’Brien Project mining titles
www.innovexplo.com
NI 43 101 Technical Report and Mineral Resource Estimate for the O’Brien Project, Abitibi, Québec – May 2018 25
The Claim A claim is the only exploration title for mineral substances (other than surface mineral substances or petroleum, natural gas and brine) currently issued in Québec. A claim gives its holder the exclusive right to explore for such mineral substances on the land subject to the claim but does not entitle its holder to extract mineral substances except for sampling in limited quantities. In order to mine mineral substances, the holder of a claim must obtain a mining lease. Electronic map designation is the most common method of acquiring new claims from the MERN whereby an applicant makes an online selection of available pre-mapped claims. In a few territories defined by the government, claims can still be obtained by staking.
A claim has a term of two years, which is renewable for additional periods of two years, subject to performance of minimum exploration work on the claim and compliance with other requirements set forth by the Mining Act. In certain circumstances, if the work carried out in respect of a claim is insufficient or if no work has been carried out at all, it is possible for the claimholder to comply with the minimum work obligations by using work credits for exploration work conducted on adjacent parcels or by making a payment in lieu of the required work.
Additionally, it requires a claim holder to submit to the Minister, on each claim registration anniversary date, a report of the work performed on the claim in the previous year. Moreover, the amount to be paid in order to obtain renewal of a claim at the end of its term when the minimum prescribed work has not been carried out now corresponds to twice the amount of the work required. Any excess amount spent on work during the term of a claim can only be applied to the six subsequent renewal periods (12 years in total). Holders of a mining lease or a mining concession are no longer able to apply work that is carried out in respect of a mining lease or a mining concession to renewal of claims.
The Mining Lease Mining leases and mining concessions are extraction (production) mining titles which give their holder the exclusive right to mine mineral substances (other than surface mineral substances or petroleum, natural gas and brine). A mining lease is granted to the holder of one or several claims upon proof of the existence of indicators of the presence of a workable deposit on the area covered by such claims and compliance with other requirements prescribed by the Mining Act. A mining lease has an initial term of 20 years but may be renewed for three additional periods of 10 years each. Under certain conditions, a mining lease may be renewed beyond the three statutory renewal periods.
The Mining Act (as amended by Bill 70) states that an application for a mining lease must be accompanied by a project feasibility study as well as a scoping and market study as regards to processing in Québec. Holders of mining leases must then produce such a scoping and market study every 20 years. Bill 70 adds, as an additional condition for granting a mining lease, the issuance of a certificate of authorization under the Environment Quality Act. The Minister may nevertheless grant a mining lease if the time required to obtain the certificate of authorization is unreasonable. A rehabilitation and restoration plan must be approved by the Minister before any mining lease can be granted. In the case of an open-pit mine, the plan must

www.innovexplo.com
NI 43 101 Technical Report and Mineral Resource Estimate for the O’Brien Project, Abitibi, Québec – May 2018 26
contain a backfill feasibility study. This last requirement does not apply to mines in operation as of December 10, 2013. Bill 70 sets forth that the financial guarantee to be provided by a holder of a mining lease be for an amount that corresponds to the anticipated total cost of completing the work required under the rehabilitation and restoration plan.
The Mining Concession Mining concessions are extraction (production) mining titles that give their holder the exclusive right to mine mineral substances other than surface mineral substances, petroleum, natural gas and brine. Mining concessions were issued prior to January 1, 1966. After that date, grants of mining concessions were replaced by grants of mining leases. Although similar in certain respects to mining leases, mining concessions granted broader surface and mining rights and are not limited in time.
A grantee of a mining concession must commence mining operations within five years from December 10, 2013. As is the case for a holder of a mining lease, a grantee may be required by the government, on reasonable grounds, to maximize the economic spinoffs within Québec of mining the mineral resources authorized under the concession. It must also, within three years of commencing mining operations and every 20 years thereafter, send the Minister a scoping and market study as regards to processing in Québec.
Other Information Claims, mining leases, mining concessions and exclusive leases for surface mineral substances, and licences and leases for petroleum, natural gas and underground reservoirs obtained from the MERN may be sold, transferred, hypothecated or otherwise encumbered without the MERN’s consent. However, a release from the MERN is required for a vendor or a transferee to be released from its obligations and liabilities owing to the MERN related to the mine rehabilitation and restoration plan associated with the alienated lease or mining concession. Such release can be obtained when a third-party purchaser assumes those obligations as part of a property transfer. For perfection purposes, the transfers of mining titles and grants of hypothecs and other encumbrances in mining rights must be recorded in the register of real and immovable mining rights maintained by the MERN and other applicable registers.
Under Bill 70, a lessee or grantee of a mining lease or a mining concession, on each anniversary date of such lease or concession, must send the Minister a report showing the quantity and value of ore extracted during the previous year, the duties paid under the Mining Tax Act and the overall contributions paid during the same period, as well as any other information as determined by regulation.
Property Description and Mineral Royalties The current O’Brien Project consists of 21 contiguous claims covering an aggregate area of 637.43 ha (Figure 4.2). It represents the amalgamation of the former O’Brien and Kewagama properties. A detailed list of mining titles is provided in Table 4.1.
www.innovexplo.com
NI 43 101 Technical Report and Mineral Resource Estimate for the O’Brien Project, Abitibi, Québec – May 2018 27
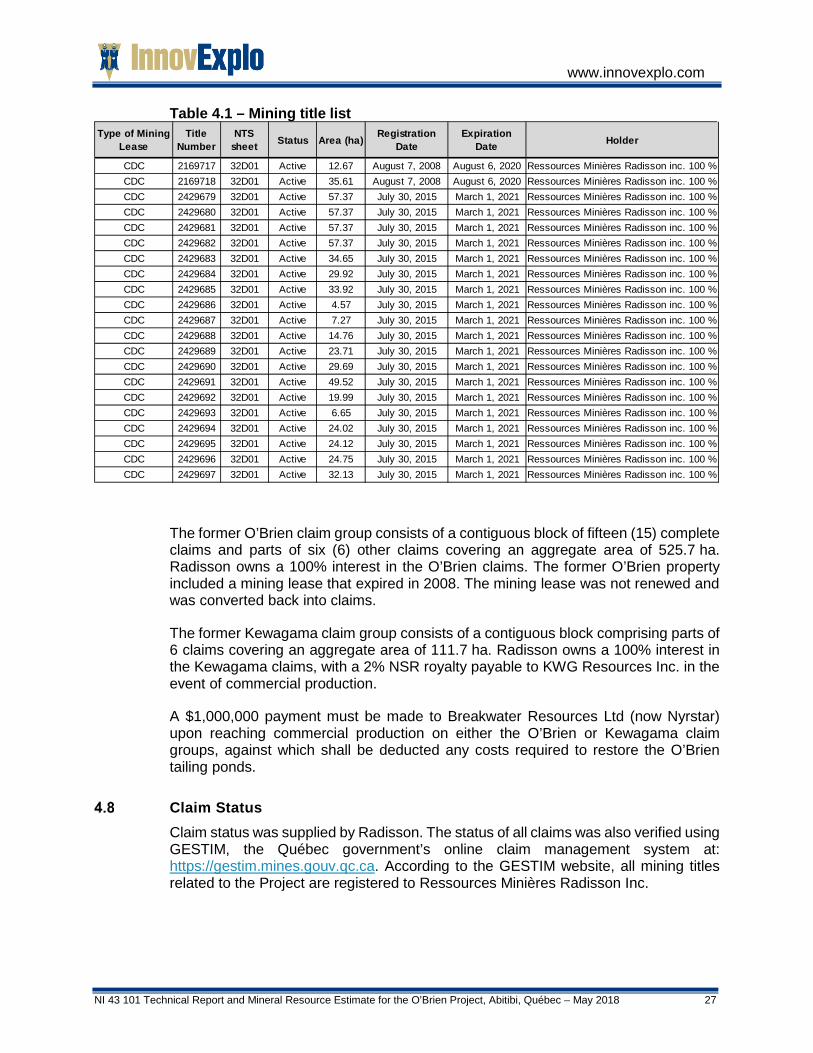
Table 4.1 – Mining title list
The former O’Brien claim group consists of a contiguous block of fifteen (15) complete claims and parts of six (6) other claims covering an aggregate area of 525.7 ha. Radisson owns a 100% interest in the O’Brien claims. The former O’Brien property included a mining lease that expired in 2008. The mining lease was not renewed and was converted back into claims.
The former Kewagama claim group consists of a contiguous block comprising parts of 6 claims covering an aggregate area of 111.7 ha. Radisson owns a 100% interest in the Kewagama claims, with a 2% NSR royalty payable to KWG Resources Inc. in the event of commercial production.
A $1,000,000 payment must be made to Breakwater Resources Ltd (now Nyrstar) upon reaching commercial production on either the O’Brien or Kewagama claim groups, against which shall be deducted any costs required to restore the O’Brien tailing ponds.
Claim Status Claim status was supplied by Radisson. The status of all claims was also verified using GESTIM, the Québec government’s online claim management system at: https://gestim.mines.gouv.qc.ca. According to the GESTIM website, all mining titles related to the Project are registered to Ressources Minières Radisson Inc.
Type of Mining Lease
Title Number
NTS sheet Status Area (ha) Registration
DateExpiration
Date Holder
CDC 2169717 32D01 Active 12.67 August 7, 2008 August 6, 2020 Ressources Minières Radisson inc. 100 %CDC 2169718 32D01 Active 35.61 August 7, 2008 August 6, 2020 Ressources Minières Radisson inc. 100 %CDC 2429679 32D01 Active 57.37 July 30, 2015 March 1, 2021 Ressources Minières Radisson inc. 100 %CDC 2429680 32D01 Active 57.37 July 30, 2015 March 1, 2021 Ressources Minières Radisson inc. 100 %CDC 2429681 32D01 Active 57.37 July 30, 2015 March 1, 2021 Ressources Minières Radisson inc. 100 %CDC 2429682 32D01 Active 57.37 July 30, 2015 March 1, 2021 Ressources Minières Radisson inc. 100 %CDC 2429683 32D01 Active 34.65 July 30, 2015 March 1, 2021 Ressources Minières Radisson inc. 100 %CDC 2429684 32D01 Active 29.92 July 30, 2015 March 1, 2021 Ressources Minières Radisson inc. 100 %CDC 2429685 32D01 Active 33.92 July 30, 2015 March 1, 2021 Ressources Minières Radisson inc. 100 %CDC 2429686 32D01 Active 4.57 July 30, 2015 March 1, 2021 Ressources Minières Radisson inc. 100 %CDC 2429687 32D01 Active 7.27 July 30, 2015 March 1, 2021 Ressources Minières Radisson inc. 100 %CDC 2429688 32D01 Active 14.76 July 30, 2015 March 1, 2021 Ressources Minières Radisson inc. 100 %CDC 2429689 32D01 Active 23.71 July 30, 2015 March 1, 2021 Ressources Minières Radisson inc. 100 %CDC 2429690 32D01 Active 29.69 July 30, 2015 March 1, 2021 Ressources Minières Radisson inc. 100 %CDC 2429691 32D01 Active 49.52 July 30, 2015 March 1, 2021 Ressources Minières Radisson inc. 100 %CDC 2429692 32D01 Active 19.99 July 30, 2015 March 1, 2021 Ressources Minières Radisson inc. 100 %CDC 2429693 32D01 Active 6.65 July 30, 2015 March 1, 2021 Ressources Minières Radisson inc. 100 %CDC 2429694 32D01 Active 24.02 July 30, 2015 March 1, 2021 Ressources Minières Radisson inc. 100 %CDC 2429695 32D01 Active 24.12 July 30, 2015 March 1, 2021 Ressources Minières Radisson inc. 100 %CDC 2429696 32D01 Active 24.75 July 30, 2015 March 1, 2021 Ressources Minières Radisson inc. 100 %CDC 2429697 32D01 Active 32.13 July 30, 2015 March 1, 2021 Ressources Minières Radisson inc. 100 %
www.innovexplo.com
NI 43 101 Technical Report and Mineral Resource Estimate for the O’Brien Project, Abitibi, Québec – May 2018 28
Urban Perimeter Part of the Project is subject to regulations respecting an “urban perimeter” (grey area in Figure 4.2) or an “area dedicated to vacationing” (dark green area in Figure 4.2). These areas, as documented in GESTIM, fall under “Exploration Prohibited” (see Bill 70, 2013, chapter 32, section 124).
According to Bill 70, any mineral substance forming part of the domain of the State and found in an urban perimeter shown on maps kept at the registrar’s office, except mineral substances found in a territory subject to a mining right obtained before December 10, 2013, is withdrawn from prospecting, mining exploration and mining operations as of that date, until the territories provided for in section 304.1.1 of the Mining Act are determined.
According to section 304.1.1, any mineral substance forming part of the domain of the State and found in a parcel of land on which a claim may be obtained and that is included in a mining-incompatible territory delimited in a land use and development plan in accordance with the Act respecting Land Use Planning and Development (chapter A-19.1) is withdrawn from prospecting, mining exploration and mining operations from the time the territory is shown on the maps kept at the office of the registrar. A mining-incompatible territory is a territory in which the viability of activities would be compromised by the impacts of mining.
As the O’Brien Project only includes mining rights obtained before December 10, 2013, exploration is permitted on mining rights overlapping the urban perimeter and the area dedicated to vacationing until mining-incompatible territories are determined by the regional county municipality (“MRC” in French). In the event that a claim overlaps a mining-incompatible territory, exploration will still be permitted on the overlapping claim, but renewal of such claim will only be permitted if work is performed on the claim during any term occurring after the determination of the mining-incompatible territory (section 61 of the Mining Act).
Territory Akin to an Area for Vacationing According to Section 304.1.1 of the Mining Act, mining-incompatible territories will be delimited by an MRC. These mining-incompatible territories will be withdrawn from mining activities. This exercise will be initiated after section 304.1.1 comes into force, once the government will have adopted government policies on land use and development, ensuring guidance for MRCs.
Meanwhile, territories akin to areas for vacationing will be shown on mining title maps for information purposes only.
Any mineral substance forming part of the domain of the State and found in a parcel of land on which a claim may be obtained and that is included in a mining-incompatible territory delimited in a land use and development plan in accordance with the Act respecting Land Use Planning and Development (chapter A-19.1) is withdrawn from prospecting, mining exploration and mining operations from the time the territory is shown on the maps kept at the office of the registrar. A mining-incompatible territory is a territory in which the viability of activities would be compromised by the impacts of mining.

www.innovexplo.com
NI 43 101 Technical Report and Mineral Resource Estimate for the O’Brien Project, Abitibi, Québec – May 2018 29
Permits Permits are required for any exploration program that involves tree-cutting to provide road access for a drill rig, or to carry out drilling and stripping work. Permitting timelines are short, typically on the order of 3 to 4 weeks. The permits are delivered by the MERN.
Environment Presently, the MERN has exempted Radisson of all liabilities associated with the onsite historical tailings. However, in the event that Radisson decides to use the same area for future tailings, Radisson would acquire all liabilities for past and present tailings. In this case, the significant amount of arsenic trioxide stored underground at the O’Brien mine would become relevant.
In 1956, a stockpile containing an estimated 1,150 metric tons of crude arsenic (arsenic trioxide) was stored in 8,938 barrels west of the No. 3 Shaft on level 1500 in the 15-G-West and 15-F-West drifts (Figure 4.3). The entrances to the drifts were sealed with concrete plugs about 1.2 m wide. The mine was flooded thereafter.
In 1972, the mine was reactivated and pumped out, but no information about the barrels is available for that period.
In 1981, Darius Gold Mines, then owner of the O’Brien mine, was believed to have a buyer for the crude arsenic. The concrete walls from the 1500' level were demolished. Later that year, the potential buyer withdrew.
In the 1980s, the provincial Ministry of the Environment (now the “MDDELCC”) visited the area where the barrels were stored after the concrete walls were demolished. Charlton (1985) mentions that the barrels were rusted and in very bad shape. He also added that the sides of the barrels looked so fragile that the bottoms were likely to fail under the weight of their contents if the barrels were to be moved. Deposits of arsenic trioxide was also observed in the drifts.
Following the mine’s acquisition from Sulpetro Minerals Ltd, the new owner tried unsuccessfully to find other buyers for the crude arsenic stored on level 1500.
In 1985, the mine closed. In April, the Ministry of the Environment authorized the installation of new waterproof and reinforced concrete plugs (2.3 m wide) at the entrance of each drift containing the barrels. In August, the Ministry authorized the flooding of the mine. The storage site has not been visited since.
In 1989, GERLED, a government entity with the mandate to catalogue and monitor all known dangerous waste material sites in the province, categorized this storage site as a class 1 dangerous waste material site.
Radisson started to address the situation through a basic hydrogeological study (Fournier and Leblanc, 2017). The study includes monitoring of well nests; wells monitoring, water level surveys; hydraulic tests; two (2) sampling campaigns and one (1) well sampling campaign on the former O’Brien Mine property and nearby residents. The groundwater samples show a low concentration of minerals, neutral pH, and are
www.innovexplo.com
NI 43 101 Technical Report and Mineral Resource Estimate for the O’Brien Project, Abitibi, Québec – May 2018 30
mainly characterized by an exceeds for esthetic criteria as Iron, Manganese, sulfides and hardness and exceeds drinking parameter limits for Arsenic, Mercury and Nickel. Which could potentially correspond to the regional background levels (Poissant, 1997). Radisson put in place an environmental monitoring program based on the report recommendations.
Figure 4.3 – Schematic longitudinal section of the O’Brien Mine
Comments on Item 4 InnovExplo is not aware of any other significant factors and risks that may affect access, ownership, or the right or ability to perform the proposed work program on the Project.
www.innovexplo.com
NI 43 101 Technical Report and Mineral Resource Estimate for the O’Brien Project, Abitibi, Québec – May 2018 31
5. ACCESSIBILITY, CLIMATE, LOCAL RESOURCES, INFRASTRUCTURE AND PHYSIOGRAPHY
Accessibility The O’Brien Project is located in the northwest part of the Abitibi administrative region, in the western part of Cadillac Township (Figure 5.1). Highway 117 runs just south of the Project’s boundary. Well-maintained secondary gravel roads provide easy access to the old O’Brien and Kewagama mine sites.
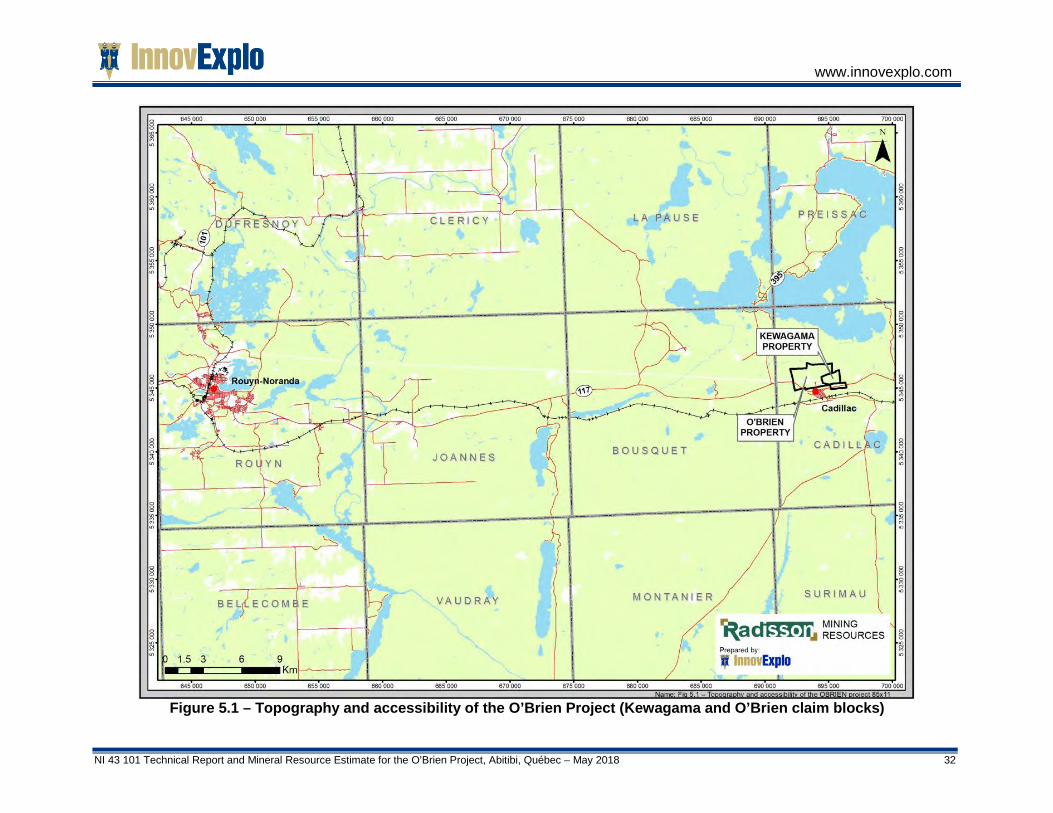
www.innovexplo.com
NI 43 101 Technical Report and Mineral Resource Estimate for the O’Brien Project, Abitibi, Québec – May 2018 32
Figure 5.1 – Topography and accessibility of the O’Brien Project (Kewagama and O’Brien claim blocks)

www.innovexplo.com
NI 43 101 Technical Report and Mineral Resource Estimate for the O’Brien Project, Abitibi, Québec – May 2018 33
Climate The region is under the influence of a continental climate marked by cold, dry winters and mild, humid summers. According to Environment Canada (climat.meteo.gc.ca/climate_normals), statistics for the 1981–2010 period at the nearest permanent weather monitoring station of Mont Brun (approx. 28 km northwest of the Project) show a daily average temperature for July of 16.7°C and a daily average temperature for January of -17.9°C. The record low was -49.5°C and the record high was 35.5°C. There are, on average, 74 days without frost. Historical records of annual precipitation indicate a mean rainfall of 985 mm. Snow accumulates from October to May, with a peak from November to March. Climatic conditions do not seriously hinder exploration or mining activities, with only some seasonal adjustments for certain types of work (e.g., conducting mapping in summer and drilling boggy areas in winter).
Local Resources and Infrastructure About 45 km to the west, Rouyn-Noranda is a town with a population of approximately 39,000 inhabitants and is considered as the regional centre for the western Abitibi region, while Val-d’Or, 45 km to the east, is a renowned gold mining town of 33,250 inhabitants. The area is traditionally a mining area with several operating mines and active exploration companies. Full infrastructure and an experienced mining workforce are also available in a number of nearby well-established mining towns, such as Val-d’Or, Malartic and Rouyn-Noranda. Both Rouyn-Noranda and Val-d’Or have commercial airports with regularly scheduled direct flights to Montreal.
The historical mines on the Project saw production from 1925 to 1956. Mining activities on the O’Brien and Kewagama properties resumed from the early 1970s to 1981. Most of the mine surface infrastructure was dismantled in 2012. The mill building, and garage still remain.
A large power line straddles the south part of the Project and a railway connected to the national network passes through Cadillac, just 2 km to the south.
Radisson has an exploration office and a large, well-equipped core logging and storage facility at the O’Brien mine site. Surface facilities also include large areas for stockpiling ore and waste materials. A tailings facility of 4 hectares and a polishing basin are located directly north of the old mill. A security guard patrols the mine site several times a day and Radisson has implemented additional measures to maintain security.
The closest mill, Agnico-Eagle’s LaRonde Mill, is located about 7 km west by road. Other active mills in the area include Doyon-Westwood (Cadillac), Canadian Malartic (Malartic) and Camflo (Dubuisson).
Physiography The topography of the project area is relatively flat to gently rolling, with local relief up to 20 m. The approximate elevation of the Project varies from 305 to 350 masl. There are no distinct prominent topographic features that stand out. Low-lying grounds are characterized by swamps and ponds, and overall drainage is very poor throughout the area. The Blake River flows northeast, running from the southwest corner through the
www.innovexplo.com
NI 43 101 Technical Report and Mineral Resource Estimate for the O’Brien Project, Abitibi, Québec – May 2018 34
Project to reach Lac Preissac, 3.2 km northeast of the property. The Project lies within the boreal forest domain. Predominant tree species include black spruce, balsam fir and tamarack. Local stands of white birch, jack pine and poplar are established on better-drained areas.

www.innovexplo.com
NI 43 101 Technical Report and Mineral Resource Estimate for the O’Brien Project, Abitibi, Québec – May 2018 35
6. HISTORY
Former O’Brien Mine Property
6.1.1 O’Brien Gold Mines Ltd The following summary of the work conducted by O’Brien Gold Mines Ltd and its predecessors on the former O’Brien property is mostly modified and summarized from Bell and MacLean (1929), Cooke et al. (1931), Bell (1937), Gunning (1937), Brown (1948), Dresser and Denis (1949), Paquet (1989) and Bisson (1994).
1924: Claims were staked in the summer of 1924 by two prospectors, Austin Dumont and W. Herweston from M.J. O'Brien Company Ltd. That same year, the No. 1 Vein, the most productive in terms of tonnage, was discovered by Austin Dumont while prospecting.
1925: A two-compartment exploration shaft (No. 1 Shaft) was sunk on the No. 1 vein to a depth of 110 ft and drifting and crosscutting commenced. The shaft followed the dip of the No. 1 vein (87°N). The rocks near the shaft are Timiskaming sediments, porphyry dykes or sills, and greenstone bands, all striking about east. It was determined that the No. 1 vein occurred in a band of conglomerate 50 to 80 ft wide (15 to 24 m). The conglomerate consisted of pebbles of greenstone, with a few granitic rocks, up to 5 in (13 cm) long, embedded in a medium-grained arkose groundmass. The quartz of the vein was described as dark and glossy, though some sections of white quartz were observed within the dark quartz. Coarse, free gold was found scattered through the quartz at intervals over its entire length. Arsenopyrite was the most common mineral within the quartz, though some pyrrhotite was seen and a little chalcopyrite was also reported.
1926-1929: During the following winter and in the early summer of 1926, a diamond drilling campaign was carried out, comprising twelve (12) holes for a total of 6,000 ft (GM 07451-A).
Five principal veins (No. 1 to No. 5) were disclosed by surface and underground work, and by diamond drilling. All underground work was confined to the 100-ft horizon of the mine. A crosscut was driven 340 ft to the north of the shaft to intersect the No. 4 and No. 5 veins, where drifts had been cut to the east. The No. 1 vein was opened up by a drift for approximately 900 ft, and 60 ft north of this drift, a second drift was driven on the No. 4 vein for a distance of 800 ft. At 310 ft north of the shaft in the main cross-cut, a drift was cut on the No. 5 vein, for a distance of 280 ft. At 320 ft east of the shaft, from the cross-cut driven 40 ft north of the drift on the No. 4 vein, a drift was opened up for 45 ft on what is now known as the No. 3 vein. These main drifts and cross-cuts, together with other lateral work of a minor nature, comprised a total of approximately 3,000 ft of underground workings at the time.
The high-grade shoots in the No. 4 vein were opened up at intervals of approximately 185, 370 and 800 ft, respectively, to the east of the shaft. The first of these, which was 50 ft long where it was intersected by the drift, was stoped through to the surface as a raise. The No. 4 vein occurs within the porphyry. It was uncovered intermittently over a length of about 1,200 ft and followed the strike of the porphyry body. The width of the vein varied between 6 and 24 in (15 to 61 cm). In one section about 60 ft long, it
www.innovexplo.com
NI 43 101 Technical Report and Mineral Resource Estimate for the O’Brien Project, Abitibi, Québec – May 2018 36
carried a large amount of coarse free gold in small fissures within the quartz. The adjoining country rock was sheared and carried some free gold near the vein.
Stoping was only commenced in 1929 on the most easterly shoot, which contained very spectacular occurrences of visible gold. By the end of 1929, no stopes had yet been opened up in the No. 1 vein.
Several shipments of hand-sorted, high-grade ore were sent to Cobalt where the gold was extracted in the O'Brien Mill. Many specimens were retained for museum and exhibition purposes. The gold produced from the small shipments of high-grade ore milled during 1928 amounted to several hundred ounces.
1930: Diamond drilling followed, and in 1930, the No. 2 Shaft (which became the main shaft) was sunk 300 ft east of the No. 1 Shaft. Levels were established at 100, 200 and 300 ft.
1932-1933: An amalgamation mill, with a capacity of 90 tons per day, was built in 1932 and began operating. As of February 1933, the mill was in continuous operation, processing about 75 tons per day.
1934: The No. 2 Shaft was extended from 300 to 500 ft deep, and the 400' and 500' levels developed. As of July 1934, the mine had produced 38,730 metric tons of ore, averaging 15.43 g/t Au.
1935: An addition for roasting and cyaniding the gold-bearing arsenical concentrates was completed and operating in 1935. As of October 5, 1935, a total of 16,219 ft of drifting, crosscutting and raising had been done. By November 1935, the No. 2 Shaft had been deepened to 1,035 ft, and stations were established at approximately 625, 750, 875 and 1,000 ft.
Production from September 9, 1934, to October 5, 1935, was given as 26,662 metric tons, with a total gold content of 7,865.481 ounces, or 9.19 g/t Au. Of this, 66.12% was recovered as bullion, and 26.12% was saved in concentrates for re-processing by the new addition to the mill. It was estimated that extraction should be 92%, giving an overall extraction of 90.06%.
At the end of the year, the reserves were estimated to be 20,585 metric tons at an average grade of 8.13 g/t Au.
1936: Late in April 1936, spectacular high-grade ore was encountered in the new lower levels on the No. 4 vein. On May 11, the 6th, 7th, 8th and 9th levels of the No. 4 vein were developed east from the shaft. On each level, free gold was encountered in the vein about 180 ft east of the shaft. This was reportedly about 200 ft west (on average) from the location where the richer shoots were encountered between the surface and the 5th level.
At the end of the year, reserves were estimated to be 108,058 metric tons at an average grade of 25.20 g/t Au. They were mainly related to the new discovery of the No. 4 Vein, a particularly rich vein.
www.innovexplo.com
NI 43 101 Technical Report and Mineral Resource Estimate for the O’Brien Project, Abitibi, Québec – May 2018 37
1937: The milling capacity was increased to 150 tons per day. During the year, the No. 3 Shaft was started on the western section of the property where excellent diamond drilling results had been obtained by the surface drilling campaign of 1935. Stations were established at 125-ft intervals, and a zone of multiple high-grade ore carriers was identified on the upper levels.
1939: The No. 3 Shaft reached a maximum depth of 1,500 ft. Remarkably greater quantities of gold were recovered from 1937 to 1939. They came partly from processing arsenopyrite concentrates that had been stockpiled in the past, but mostly from mining an extremely rich mineralized chimney in the No. 4 Vein.
1940: The first shipment of crude arsenic was made in 1940 to Deloro Smelting & Refining Company in Deloro, Ontario, with production sales continuing until 1950. Crude arsenic, grading 83.0% arsenic trioxide and 8.5 to 12.0 g/t Au, was refined and the sludges returned to the O’Brien mine for gold recovery.
1941: Since 1930, the hoisting from the No. 2 Shaft had been in cars. In 1941, the No. 2 Shaft was converted to skips with an ore transfer system at the 2000' level. That same year, production stoping was by rill shrinkage with changeover to inclined cut and fill in the deeper levels. Stoping width varied from 4 to 20 ft, with the average on the narrow end of that range. The sinking of the No. 4 Shaft began in October 1941.
1942: Production peaked in 1942 at 63,086 metric tons milled averaging 12.79 g/t Au, and reserves were at their highest at 218,648 metric tons averaging 12.14 g/t Au.
1943: In 1943, 43,269 metric tons averaging 11.66 g/t Au were mined from the No. 3 Shaft, representing about 5.6% of the total mine production. A total of 3,400 ft of drifts was driven from the No. 3 Shaft. Apart from a small amount work in 1950, no work was done from the No. 3 Shaft after 1943. Management reports repeatedly cite the labour shortage as the reason.
1949: In January, the sinking of No. 4 Shaft resumed and was completed in July 1949. This internal shaft (winze) was sunk from 2,000 to 3,500 ft between 1941 and 1949. Reserves slowly declined between 1942 and1949 and fell off rapidly thereafter.
1952: By 1952, rising costs eroded profits to a break-even point and ore reserves declined to a 2-year supply. Leads to new high-grade ore were considered to be exhausted on the development levels, and the most favourable prospecting ground was considered to be at the depth. The last commercial crude arsenic shipment was made between 1951 and 1952 to Belgium.
1954: A drilling program was carried out to explore the area between depths of 3,400 and 4,000 ft. Seven (7) holes totalling 4,000 ft were drilled below the 3400' level, and results reported in 1954 indicated continuity of the No. 1 vein, although gold values could not support shaft sinking or a continuing operation.
1956-1957: On July 1956, the operation of the O’Brien mine was closed down. The surface plant, the mill and all equipment where gold might have accumulated were cleaned until 1957. The mine closed because of rising operating costs, lower grades from stopes, and the fixed price of gold at US$35.00.
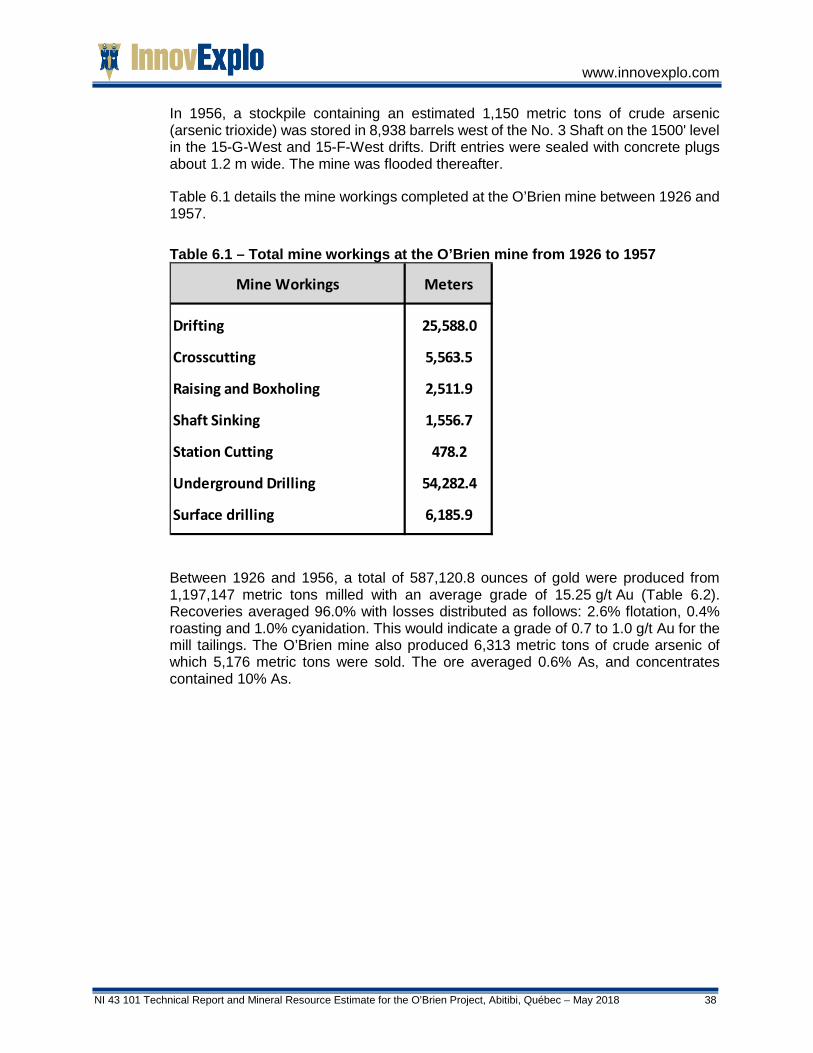
www.innovexplo.com
NI 43 101 Technical Report and Mineral Resource Estimate for the O’Brien Project, Abitibi, Québec – May 2018 38
In 1956, a stockpile containing an estimated 1,150 metric tons of crude arsenic (arsenic trioxide) was stored in 8,938 barrels west of the No. 3 Shaft on the 1500' level in the 15-G-West and 15-F-West drifts. Drift entries were sealed with concrete plugs about 1.2 m wide. The mine was flooded thereafter.
Table 6.1 details the mine workings completed at the O’Brien mine between 1926 and 1957.
Table 6.1 – Total mine workings at the O’Brien mine from 1926 to 1957
Between 1926 and 1956, a total of 587,120.8 ounces of gold were produced from 1,197,147 metric tons milled with an average grade of 15.25 g/t Au (Table 6.2). Recoveries averaged 96.0% with losses distributed as follows: 2.6% flotation, 0.4% roasting and 1.0% cyanidation. This would indicate a grade of 0.7 to 1.0 g/t Au for the mill tailings. The O’Brien mine also produced 6,313 metric tons of crude arsenic of which 5,176 metric tons were sold. The ore averaged 0.6% As, and concentrates contained 10% As.
Mine Workings Meters
Drifting 25,588.0
Crosscutting 5,563.5
Raising and Boxholing 2,511.9
Shaft Sinking 1,556.7
Station Cutting 478.2
Underground Drilling 54,282.4
Surface drilling 6,185.9

www.innovexplo.com
NI 43 101 Technical Report and Mineral Resource Estimate for the O’Brien Project, Abitibi, Québec – May 2018 39
Table 6.2 - Total gold production from the O’Brien mine from 1926 to 1957
6.1.2 Darius Gold Mines Inc. The following summary of the work conducted by Darius Gold Mines Inc. (“Darius”) on the former O’Brien property is mostly modified and summarized from Schaaf (1972; 1976a to 1976f), Scobie (1972), Brethour (1974; 1975a; 1975b; 1976), van de Wall (1980), Lafleur (1980), Rive (1981; 1982), Paquet (1989), Bisson (1994) and Charlton (1994).
1969: Abandoned since its closure in 1956, the O’Brien mine was acquired by A. N. Ferris and the property renamed the Ferris property. The property was re-evaluated, and surface work (mostly scouring) was carried out. That same year, A. N. Ferris created Darius Gold Mines Inc.1972: Darius began an exploration and reassessment

www.innovexplo.com
NI 43 101 Technical Report and Mineral Resource Estimate for the O’Brien Project, Abitibi, Québec – May 2018 40
program at the former O’Brien mine. A brief study on the tailings from the former O’Brien mine was carried out to ascertain the form of the contained gold and the amount that might be recoverable by further treatment. Four samples of mill tailings, weighing approximately 100 pounds, were received at Lakefield Laboratories. The head assays from the sample graded 0.86 g/t Au and 0.047% As and contained 0.22% sulphur. One flotation test was attempted, but the results were discouraging. The sulphide concentrate was very low grade with low recovery. The cyanidation test was carried out on the tailings sample. The recovery was improved by grinding the sample, yielding recoveries of 78.2% and 81.5% after 24 and 96 hours, respectively.
1973: Darius pumped out the O’Brien mine to the 9th level (1400') and began a sampling program. The headframe and hoist were installed on the No. 2 Shaft. Chip samples were taken at 20-ft intervals on the 250', 375', 500', 625' and 750' levels.
1974: Darius carried out an underground bulk sampling program composed of many samples. The samples were blasted 6 ft high across the width of the vein, and for as long as it was exposed in the drifts. The samples were chosen according to vein width and varied in length from 20 to 45 ft (6 to 14 m). Once blasted, the samples were mucked and shipped separately by truck to the Malartic Goldfields Mill, a distance of 42 km, where they were sampled and run through the mill circuits.
Early in March, a dump ramp was built on the west side of the headframe, and one mucking machine and four 1-ton cars were purchased. Track was installed from the cage, and cars were dumped one at a time directly into the truck. With this method, a complete sample could be mucked and shipped in one day, averaging two truckloads. Between February and April 1974, a total of 171 metric tons was extracted from the 375' level in the F and G veins.
1975: At the end of February 1975, a total of 2,500 metric tons averaging 3.14 g/t Au were extracted during the bulk sampling program at the O’Brien mine. A total of 2,406 linear feet of drift backs were sampled on the 375', 500', 625', 750' and 875' levels. A total of 523 ft of drifting and 422 ft of raising (three raises) were completed. Seventeen (17) underground holes (74-1 to 74-11, D-16, D-18, D-19, D-21, D-24 and D-25) were drilled for a total of 2,985 ft.
1976: Thirty-two (32) underground holes (D-20, D-22, D-23, D-26 to D-29, D-31 to D-51 and D-53 to D-56) were drilled for a total of 4,275 ft. Following the underground drilling campaign, Robert E. Schaaf carried out a mineral inventory compilation on veins No. 1 S, No. 1 N, F9 and H-4-14.
1977: In October 1977, Goldfield Mining Consolidated acquired a 51% interest in the property for US$4,635,000, with a commitment to spend enough money to make the mine operational and explore adjacent properties. The acquisition led to additional restoration work and bulk sampling. Darius built a mill with a capacity of 200 short tons per day, which could be increased to 500 short tons per day. The mill was completed on June 1, 1978, for about C$3 million.
1978: A total of 11,018 metric tons grading 1.07 g/t Au were milled in the new mill. The ore essentially came from drifting.
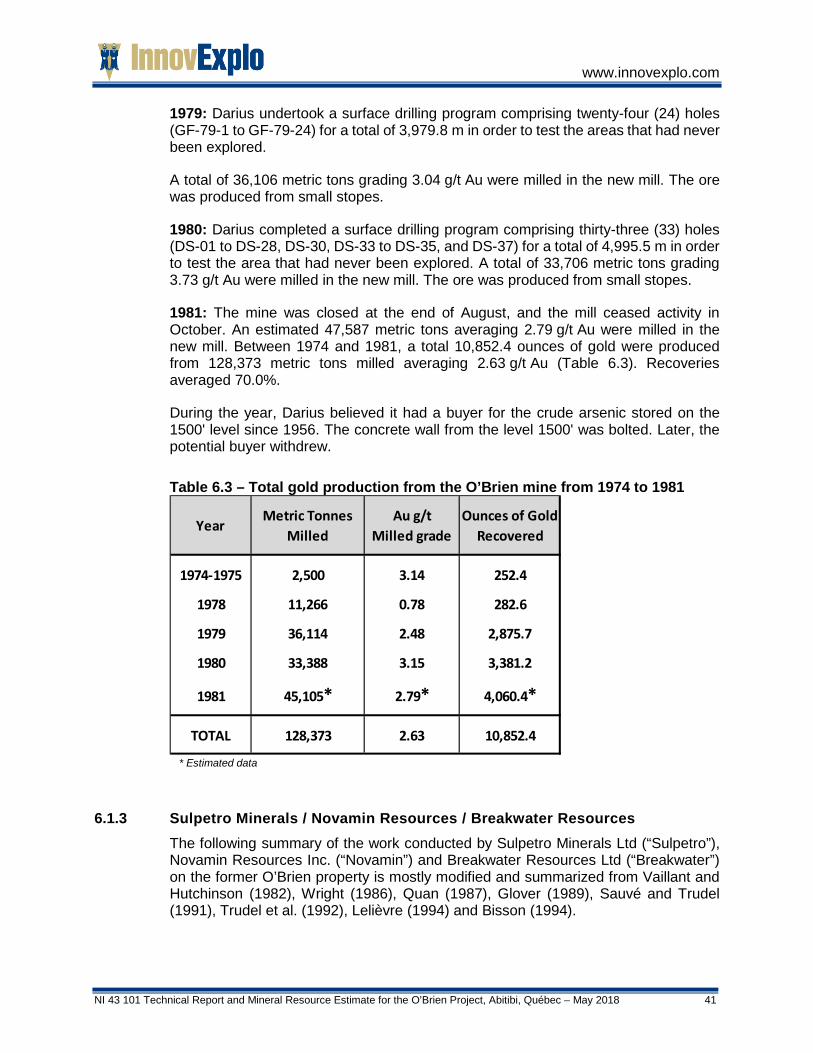
www.innovexplo.com
NI 43 101 Technical Report and Mineral Resource Estimate for the O’Brien Project, Abitibi, Québec – May 2018 41
1979: Darius undertook a surface drilling program comprising twenty-four (24) holes (GF-79-1 to GF-79-24) for a total of 3,979.8 m in order to test the areas that had never been explored.
A total of 36,106 metric tons grading 3.04 g/t Au were milled in the new mill. The ore was produced from small stopes.
1980: Darius completed a surface drilling program comprising thirty-three (33) holes (DS-01 to DS-28, DS-30, DS-33 to DS-35, and DS-37) for a total of 4,995.5 m in order to test the area that had never been explored. A total of 33,706 metric tons grading 3.73 g/t Au were milled in the new mill. The ore was produced from small stopes.
1981: The mine was closed at the end of August, and the mill ceased activity in October. An estimated 47,587 metric tons averaging 2.79 g/t Au were milled in the new mill. Between 1974 and 1981, a total 10,852.4 ounces of gold were produced from 128,373 metric tons milled averaging 2.63 g/t Au (Table 6.3). Recoveries averaged 70.0%.
During the year, Darius believed it had a buyer for the crude arsenic stored on the 1500' level since 1956. The concrete wall from the level 1500' was bolted. Later, the potential buyer withdrew.
Table 6.3 – Total gold production from the O’Brien mine from 1974 to 1981
* Estimated data
6.1.3 Sulpetro Minerals / Novamin Resources / Breakwater Resources The following summary of the work conducted by Sulpetro Minerals Ltd (“Sulpetro”), Novamin Resources Inc. (“Novamin”) and Breakwater Resources Ltd (“Breakwater”) on the former O’Brien property is mostly modified and summarized from Vaillant and Hutchinson (1982), Wright (1986), Quan (1987), Glover (1989), Sauvé and Trudel (1991), Trudel et al. (1992), Lelièvre (1994) and Bisson (1994).
YearMetric Tonnes
MilledAu g/t
Milled gradeOunces of Gold
Recovered
1974-1975 2,500 3.14 252.4
1978 11,266 0.78 282.6
1979 36,114 2.48 2,875.7
1980 33,388 3.15 3,381.2
1981 45,105* 2.79* 4,060.4*
TOTAL 128,373 2.63 10,852.4

www.innovexplo.com
NI 43 101 Technical Report and Mineral Resource Estimate for the O’Brien Project, Abitibi, Québec – May 2018 42
1981: In December, Sulpetro bought the property for C$2,800,000 for the purpose of treating ore from its adjoining Kewagama mine to the east. The property was renamed O’Brien Division.
Sulpetro tried unsuccessfully to find other buyers for the crude arsenic stored on the 1500' level.
1985: Sulpetro completed magnetometric (49.5 line-km) and VLF electromagnetic (49.5 line-km) surveys over the property, including a limited amount of IP (4.9 line-km) surveys.
The mine was closed down that same year, although the facilities were kept. All electrical equipment was removed from the No. 2 Shaft.
In April, the provincial Ministry of Environment authorized the installation of new waterproof and reinforced concrete plugs (2.3 m wide) at the entrance of each drift containing crude arsenic. In August, the Ministry authorized the flooding of the mine.
1986-1987: In January 1986, Sulpetro was reorganized into Novamin.
In 1986 and 1987, surface drilling was done in the area of the No. 3 Shaft, extending the No. 2 and No. 4 vein structures towards the New Alger property boundary. Eight (8) drill holes totalling 1,999.8 m were drilled (2130-1 to 2130-8). Later, Novamin added eight (8) new holes totalling 2,185 m (2130-9 to 2130-16). These holes led to the discovery of a new gold prospect in the area of line 36+00E (Zone 36 East). It consisted of a series of gold-bearing quartz echelon veins that were similar in nature and character to the mined structures of the O’Brien mine.
Control of Novamin was acquired by Breakwater later in 1987.
1988: At the beginning of the year, Novamin drilled eight (8) additional holes (2130-17 to 2130-24) on Zone 36 East for a total of 2,198.5 m.
1989: Breakwater completed the acquisition of Novamin and continued drilling the property. Twenty-four (24) holes (2130-25 to 2130-46, incl. 2130-40E and 2130-40W) were drilled on Zone 36 East for a total of 7832.1 m.
Surface drilling on the eastern part of the O’Brien mine property had begun to outline a significant gold occurrence. Breakwater outlined an inferred mineral inventory on Zone 36 East of 249,746 metric tons averaging 8.23 g/t Au using a cut-off grade of 3.4 g/t Au and totalling 66,071 ounces. This inventory was developed using a 7.6-m (25-ft) lateral and 45.7-m (150-ft) vertical maximum zone of influence from each pierce point. The cut-off was 3.4 g/t Au over 1.2 m, with combined individually cut grades diluted to 1.2 m (4 ft) if necessary, and zero values assigned to wing samples. Individually cut assays were established at 34.3 g/t Au. Neither the gold price nor the exchange rate were mentioned in Breakwater’s report.
These “resources” are historical in nature and should not be relied upon. It is unlikely they conform to current NI 43-101 requirements or follow CIM Definition Standards, and they have not been verified to determine their relevance or reliability. They are included in this section for illustrative purposes only and should not be disclosed out of context.

www.innovexplo.com
NI 43 101 Technical Report and Mineral Resource Estimate for the O’Brien Project, Abitibi, Québec – May 2018 43
6.1.4 Historical work completed by the issuer The following summary of the work conducted by Radisson on the O’Brien property is mostly modified and summarized from Bisson (1994; 1995; 1996; 2004), Kroon (1996; 1997), Karpoff and Evans (1998), Barrie (2006), Evans (2007), Vincent (2009), David and Gauthier (2012), de l’Étoile and Salmon (2013), and Radisson’s annual reports (1997 to 2013).
1994: On October 24, a deal was signed whereby Radisson could earn a 50% interest in Breakwater’s O'Brien property. Under the deal, Radisson could earn a 50% interest by spending C$3,000,000 on exploration and issuing Breakwater 500,000 class A Radisson shares by Feb. 28, 1999. In addition, the deal gave Breakwater the option to purchase 200,000 Radisson shares at $0.40 each. Breakwater retained ownership of the surface infrastructure, including the mill, but Radisson had the option to purchase a 50% interest in these facilities once it had spent its C$3,000.000.
1995: Radisson compiled data and proceeded with a new geological interpretation on Zone 36 East. Between December 1994 and February 1995, twelve (12) holes (OB-95-47 to OB-95-56, including OB-95-55A and OB-95-56A) totalling 3,998.4 m were drilled on Zone 36 East in order to increase the mineral inventory of the zone.
The Indicated mineral inventory of Zone 36 East was estimated at 489,277 metric tons at 7.20 g/t Au using a cut-off grade of 3.4 g/t Au, for a total of 113,260 ounces. This inventory was developed using a 7.6-m (25-ft) and 45.7-m (150-ft) vertical maximum zone of influence from each pierce point. Individually cut assays were established at 34.3 g/t Au. Specific gravity was fixed at 2.67. A 3.4 g/t Au / 1.2 m (true thickness) cut-off was used. Neither the gold price nor the exchange rate was mentioned in the Radisson report.
These “resources” are historical in nature and should not be relied upon. It is unlikely they conform to current NI 43-101 requirements or follow CIM Definition Standards, and they have not been verified to determine their relevance or reliability. They are included in this section for illustrative purposes only and should not be disclosed out of context.
1996: Between December 1995 and February 1996, Radisson added thirty-one (31) holes (OB96-57 to OB96-75, incl. OB96-57A, OB96-62A and 10 wedged holes) for a total of 11,962.8 m. The purpose of this campaign was to increase the confidence level of the mineral inventory from the surface to 1,200 ft elevation, and to demonstrate the presence of an extension of the veins at a vertical depth below 2000 ft.
The total gold resources were 1,270,000 metric tons at an average grade of 6.9 g/t Au (cut) and 8.6 g/t Au (uncut). Of this total, 735,600 metric tons were in Zone 36 East, averaging 7.2 g/t Au (cut) or 10.6 g/t Au (uncut). Kilborn SNC-Lavalin wrote up an independent study supporting the evaluations of Radisson’s geologists. This inventory was developed using a 7.6-m (25-ft) and 45.7-m (150-ft) vertical maximum zone of influence from each pierce point. Assays were cut at 34.3 g/t Au. Specific gravity was fixed at 2.67. A 3.4 g/t Au / 1.2 m (true thickness) cut-off was used. Neither the gold price nor the exchange rate was mentioned in the Kilborn SNC-Lavalin report.
These “resources” are historical in nature and should not be relied upon. It is unlikely they conform to current NI 43-101 requirements or follow CIM Definition Standards, and they have not been verified to determine their relevance or reliability. They are included in this section for illustrative purposes only and should not be disclosed out of context.
www.innovexplo.com
NI 43 101 Technical Report and Mineral Resource Estimate for the O’Brien Project, Abitibi, Québec – May 2018 44
During the fall of 1996, eleven (11) outcrops were stripped at a distance of 400 ft east of the No. 2 Shaft in order to evaluate the gold potential of two gold-bearing structures (2V and Contact Veins) located in sedimentary rocks of the Pontiac Subprovince, near the Piché Group contact. Some anomalous gold values were obtained from quartz veins in sedimentary rocks.
1997: Two drilling programs were conducted in 1997. The first, early in the year, amounted to 1,283 m in seven (7) holes (OB97-76 to OB97-82) and focused on the quartz veins associated with the contact zone between the Pontiac Group and the Piché Group (former mine unit). Drilling was done in the central part, but despite some economic grades, it did not confirm the area’s mining potential.
On September 30, 1997, a new drilling program began in Zone 36 East. A total of 4,555 m was drilled in twenty-three (23) holes (OB97-83 to OB97-103, incl. OB97-87B and OB97-96B) between sections 32E and 44E, from surface to a vertical depth of 230 m.
1998: Following a letter of agreement signed on December 9, 1998 between Radisson, 3064077 Canada Inc. and Breakwater, Radisson purchased 100% of the rights to the O’Brien property as well as all the infrastructure, in addition to acquiring the adjacent Kewagama property.
In June 1998, an independent study signed by Roscoe Postle Associates Inc. (“RPA”) updated the gold resources in Zone 36 East in the O’Brien mine. As at April 30, 1998, Using a cut-off grade of 5.1 g/t Au, RPA estimated that indicated resources down to a depth of 610 m below surface amounted to 348,365 metric tons at 9.9 g/t Au cut to 68.5 g/t Au (14.5 g/t uncut), for a total of 111,000 contained ounces (162,000 oz uncut), and inferred resources to the same depth amounted to 15,422 metric tons at 18.6 g/t Au cut to 68.5 g/t Au (19.8 g/t uncut), for a total of 9,000 contained ounces of gold (10,000 oz uncut). The specific gravity was set at 2.67 g/cm3. The price of gold was US$300/oz with a CAD:USD exchange rate of 1.444.
These “resources” are historical in nature and should not be relied upon. It is unlikely they conform to current NI 43-101 requirements or follow CIM Definition Standards, and they have not been verified to determine their relevance or reliability. They are included in this section for illustrative purposes only and should not be disclosed out of context.
RPA’s mandate also included a PFS to evaluate the viability of commercial production for the project. The study concluded that the project would not be profitable at the US$300/oz gold price and exchange rate of 1.444. The resources would have to increase, and a better grade than the cut grade of 6.9 g/t Au would have to be confirmed, as well as a metallurgical recovery of at least 90%.
Two metallurgical tests were completed in two Canadian laboratories in 1998 on sulphide concentrates originating from Zone 36 East and Zone F. Two different processes were used: bioleaching at the BC Research Laboratory in Vancouver, British Columbia, and microwaves at the EMR Technology Laboratory in Fredericton, New Brunswick. The objective was to reach 90% recovery for sulphide-related gold at a competitive processing cost. With direct cyanidation, the recovery barely reached 80%.
www.innovexplo.com
NI 43 101 Technical Report and Mineral Resource Estimate for the O’Brien Project, Abitibi, Québec – May 2018 45
In May 1998, two (2) drill holes (OB98-106 and OB-98-107) were completed for 546.8 m on targets identified outside the known zones north of the Cadillac–Larder Lake Fault Zone (“CLLFZ”). A network of horizontal gold-bearing quartz veins with free gold was discovered. The best grade was 6.9 g/t Au over 2.33 m. In November, another drilling program (1,402.7 m) was completed to locate other gold-bearing veins north of the CLLFZ. The five (5) drill holes (OB98-108 to OB98-112) intersected interesting settings.
2001: On August 24, 2001, Radisson signed an initial agreement with Rocmec Mining Inc. (“Rocmec”) concerning preliminary tests and the use of a new extraction technology applied to the gold-bearing quartz veins on the O’Brien property. The two partners decided to drill a series of pilot holes in an easily accessible exposed surface vein near the Radisson facilities. Rocmec drilled an initial series of thermal holes supervised by Radisson personnel. This work allowed 1.54 metric tons of gold-bearing quartz vein material to be extracted. The extracted sample was processed on a Deister table in the Radisson concentrator, on site in Cadillac. The gold in the batch totalled 35.245 grams, or a grade of 22.83 g/t Au. Recovery reached 77%. This work confirmed a high rate of recovery by gravimetry and an excellent grade for the smokey quartz veins in the former O’Brien mine.
2003: In the summer of 2003, a surface exploration program was carried out for the purposes of verifying the surface extraction potential of gold-bearing quartz veins in the O’Brien mine area, approximately 900 ft east of the headframe, and the potential of the Zone 36 East veins. The O’Brien property was stripped to reveal new smokey quartz veins. The samples taken in the stripped zones did not yield economic grades.
In the Zone 36 East area, three (3) holes (OB03-02 to OB03-04) were completed for a total of 210.3 m of drilling. Two composite core samples drilled on the same zone, one from a vein and the other from its wall, were analyzed at Laboratoire LTM in Val-d’Or. The test was intended to determine the content of the vein and the wall, as well as to verify the gold recovery ratio by gravimetric method. A content of 4.80 g/t Au was obtained for the vein with a 63% recovery by gravity. The wall yielded 2.40 g/t Au gold and an equivalent recovery. On their own, these results could not justify a major surface bulk sample test, and it was decided to discontinue efforts to verify this scenario.
In July 2003, Radisson decided to abandon its surface exploration efforts on the O’Brien property after carrying out a cursory stripping and short drilling program to verify the possibility of extracting the gold veins reaching the surface. Based on the results, the company concluded it was not worth continuing surface work at this time.
2004: An initial diamond drilling campaign to verify depth potential was completed in 2004 for the purposes of analyzing “Contact Zone”-type gold mineralization on the O’Brien and Kewagama properties. This program studied the favourable horizon to a depth never before explored. The objective was to significantly increase the potential and value of the Radisson lands by discovering more extensive gold structures at depth, along the CLLFZ, compared with the known vein system near the surface. One hole (OB04-01A) was drilled on the O’Brien property under Zone 36 East, reaching a total length of 1,535 m. It confirmed the continuity of Zone 36 East to double its previously known depth.
www.innovexplo.com
NI 43 101 Technical Report and Mineral Resource Estimate for the O’Brien Project, Abitibi, Québec – May 2018 46
The hole cut Zone 36 East and intersected mineralized alteration zones at depth, also in the Piché Group volcanics. This setting is very similar to that of the Lapa mine Contact Zone, also located within the Piché Group.
2006: A high-resolution aeromagnetic, horizontal gradiometer and XDS-VLF-EM survey was carried out on the O’Brien and Kewagama properties in June 2006. The survey, which was the first phase of the 2006 exploration program, was conducted by Terraquest Ltd with a flight line spacing of 50 m. Data from this survey was used to define drill targets north of the CLLFZ.
Radisson also carried out a lithogeochemical sampling program focusing on the talc-chlorite schists in drill core stored at the O’Brien mine site. The program’s objective was to verify the presence of mineralization similar to the D Zone on the Wood/Pandora project.
A diamond drilling program was then carried out on the property. Three (3) holes (OB06-17 to OB06-19) totalling 1,198 m were drilled on the No. 2 Vein, Zone 36 East and the North Zone.
2007: RPA estimated the mineral resources of Zone 36 East using the historical surface and underground drilling data available in April 2007. The resources provided below were estimated using a conventional 2D longitudinal block resource estimation methodology, a horizontal thickness for indicated resources ranging from 1.2 to 2.7 m with an average of 1.4 m, a gold price of US$575/oz, a USD:CAD exchange rate of 0.87, a gold recovery of 90%, a specific gravity of 2.67, and a selected capping level of 68.5 g/t Au.
At a 5.8 g/t Au cut-off grade, RPA estimated that the indicated resources of Zone 36 East amount to 251,295 metric tons at an average cut grade of 12.3 g/t Au for a total of 97,000 contained ounces. RPA estimated that the inferred resources totalled 165,110 metric tons at an average cut grade of 9.9 g/t Au for a total of 54,000 contained ounces. The Zone 36 East mineralization was very sensitive to cutting high gold assays, and the cut indicated average grade was approximately 36% lower than the uncut Indicated average grade. Cutting high gold assays reduced the contained gold in the global resource by approximately 30% from the uncut figure.
These “resources” are historical in nature and should not be relied upon. It is unlikely they conform to current NI 43-101 requirements or follow CIM Definition Standards, and they have not been verified to determine their relevance or reliability. They are included in this section for illustrative purposes only and should not be disclosed out of context.
The 2007 exploration program included 60.8 km of line cutting, 46.1 km of IP, and 2,053.2 m of diamond drilling in fifteen (15) holes (OB07-120 to OB07-134). The drilling program continued until March 2008. The purpose was to test the resource blocks identified in the 2007 43-101 report on the Zone 36 East resources (Evans, 2007).
In late 2007, negotiations were initiated with Aurizon Mines Ltd (“Aurizon”) who was interested in becoming Radisson’s partner on the O’Brien-Kewagama project.
2008: From January to March 2008, the drilling program totalled 3,738.7 m in twenty-one (21) holes (OB-08 to OB08-150).
www.innovexplo.com
NI 43 101 Technical Report and Mineral Resource Estimate for the O’Brien Project, Abitibi, Québec – May 2018 47
On April 14, 2008, Radisson agreed to grant Aurizon an option to acquire an undivided 50% interest in the O’Brien-Kewagama project. The transaction was subject to a number of conditions, including completion of satisfactory due diligence. By September 2008, Aurizon had been conducting a due diligence investigation on the project for almost six months. Subsequently, Aurizon requested that it be entitled to earn a 75% interest in return for conducting the study, a proposal declined by Radisson.
In fall 2008, an exploration drilling program was carried out on the O’Brien property totalling 1,920.6 m in seven (7) holes (OB08-152, OB08-153, OB-85-153A, OB-08153B, OB08-161, OB08-162, and OB08-162A). Three (3) holes, OB08-153B, OB08-161 and OB08-162 (hole OB08-152 was stopped in the CLLFZ), tested the eastern extension of Zone 36 East.
2011: Six (6) holes (RM-11-03, RM-11-04, RM-11-14 and RM-11-16 to RM-11-18) were drilled on the O’Brien property for a total of 1,989.0 m. The program was designed to carry out resource definition drilling on Zone 36 East to categorize the inferred resource and potentially increase total resources.
2012: An exploration drilling program was carried out on the O’Brien property totalling 2,112.5 m in three (3) holes (OB-12-20 to OB-12-22). The holes also returned gold intersections in the Pontiac Group sandstone to the south of the formations containing O’Brien-type mineralization. Visible gold was observed in two of the holes.
2013: RPA estimated the mineral resources of Zone 36 East using the historical surface and underground drilling data available up to December 2012 (de l’Étoile and Salmon, 2013). The resources provided below were estimated using a block model in GEMCOM software, a minimum horizontal width of approximately of 1.8 m, a gold price of US$1,600/oz, a USD:CAD exchange rate of 1.0, a gold recovery of 90%, a specific gravity of 2.67, and a selected capping level of 51.9 g/t Au.
At the 3.4 g/t Au gold cut-off grade, RPA estimated that the indicated resources of Zone 36 East stood at 508,032 metric tons at an average cut grade of 6.5 g/t Au for a total of 106,000 contained ounces. RPA estimates that the Inferred resources amount to 287,582 metric tons at an average cut grade of 7.29 g/t Au for a total of 67,000 contained ounces.
These “resources” are historical in nature and should not be relied upon. It is unlikely they conform to current NI 43-101 requirements or follow CIM Definition Standards, and they have not been verified to determine their relevance or reliability. They are included in this section for illustrative purposes only and should not be disclosed out of context.
According to RPA, there some of the inferred resource of Zone 36 East could potentially be converted to indicated through additional drilling. RPA also considered the eastern extension of Zone 36 East, up to the Kewagama property, to be open, and that follow-up exploration on the 2011 and 2012 results was warranted.
Table 6.4 shows the statistics from the Radisson drilling programs on the O’Brien property between 1995 and 2012.

www.innovexplo.com
NI 43 101 Technical Report and Mineral Resource Estimate for the O’Brien Project, Abitibi, Québec – May 2018 48
Table 6.4 – Holes drilled by Radisson between 1995 and 2013
Former Kewagama Property
6.2.1 Kewagama Gold Mines Ltd The following summary of the work conducted primarily by Kewagama Gold Mines Ltd (“Kewagama Gold”) on the former Kewagama property is mostly modified and summarized from Bell (1937), Gunning (1937), Dresser and Denis (1949), Pouliot (1964), Dugas et al. (1967), Brereton (1973), Thompson (1974), Schaaf (1979), Laronde (1980), Vaillant and Hutchinson (1982).
1928: Activity on the property commenced in 1928 with trenching and diamond drilling by Cartier Malartic Gold Mines.
1931: In 1931, eight (8) of the present claims were acquired by Canadian Gold Operators Ltd (“Canadian Gold”).
1932-1933: A considerable amount of development was carried out by Canadian Gold, including diamond drilling (10 holes aggregating about 5,000 ft), the sinking of a two-compartment shaft to a depth of 125 ft, and approximately 1,500 ft of lateral work (drifts and crosscuts) at the 125' level. The shaft is 4,800 ft east of the O'Brien No. 2 Shaft. The work indicated that geological and structural conditions of the Kewagama property are essentially similar to those of the adjoining O’Brien property. Exploration revealed the presence of several gold-bearing quartz veins. Four veins (Nos. 1, 6, 7 and 8) were developed and investigated. Although the limited amount of drifting that was done on these veins did not establish any ore shoots, it did disclose encouraging gold values. The property was closed down in April 1933.
1934-1935: The underground workings were flooded.
1936: Control of Canadian Gold was acquired by Ventures Ltd, and the property plus an additional claim adjoining the northeast corner was turned over to Kewagama Gold, a newly formed Ontario-based company.
Year Number of
HolesTotal Length
(meter)1995 10 3,726.21996 31 14,530.11997 37 6,586.11998 7 1,949.52003 3 210.32004 2 1,656.02006 3 1.198.02007 15 2,053.22008 28 5,659.32011 6 1,989.02012 3 2,113.5
TOTAL 145 41,610.7
www.innovexplo.com
NI 43 101 Technical Report and Mineral Resource Estimate for the O’Brien Project, Abitibi, Québec – May 2018 49
1937-1939: The shaft was deepened to 524 ft, with three compartments, and new levels were established at 250, 375 and 500 ft. At a point 400 ft east of the shaft, a winze was from the 500' level to the 700' level, and new sublevels were established at 550, 600, and 700 ft. Lateral developments were carried out on four levels from the shaft, and three sublevels from the winze. A total of 12,600 ft of drilling was drilled.
Although interesting gold assays were obtained from the material encountered, especially on the lower levels, commercial grade ore was not present in sufficient quantity to assure a profitable venture and all operations were suspended in early 1939 due to the restrictions on gold mining with the outbreak of World War II.
1940: A total of 2,470 metric tons of stockpiled development ore, having an average grade of 9.9 g/t Au, was processed at the neighbouring Thompson-Cadillac Mill, from which 790.7 ounces of gold were recovered.
1947: A magnetometer survey was completed over the Piché Group (Cadillac Shear Zone) and the Cadillac Formation north of the shear, to determine whether the gold mineralization of the neighbouring Wood-Central and Pandora properties to the east continued onto the Kewagama property.
1964: Falconbridge Nickel Mines, the successor to Ventures Ltd, initiated a surface drilling program in 1964, partially for assessment work. Four (4) holes totalling 981.7 ft were drilled (S-46 to S-49) approximately 50 ft apart to trace the upward extension of the Winze Zone that had been partially developed from the 500' level from 1937 to 1939.
1973-1974: Surface exploration was renewed by Kewagama Gold under the direction of Derry, Michener & Booth, Geological Consultants. A program of overburden (basal till) sampling for gold was conducted along the 2,800-ft strike length of the favourable Cadillac Belt of rocks extending east of the 1964 Falconbridge drill holes and north of the Cadillac Shear, to explore the iron formation environment that had been productive on the neighbouring Wood-Central and Pandora properties to the east. Diamond drilling followed, consisting of thirteen (13) holes (S74-1 to S74-13) for a total of 3,149 ft. Results were considered encouraging and worthy of underground investigation.
1976: Management control of the company was acquired by A. N. Ferris of Cadillac, Québec.
1977: The mine site was cleared of bush and leveled.
1978: A temporary mining plant/service building, a hoist room, a headframe, a mine dry and a machine shop were constructed.
1979-1980: The hoist was operative in early 1979, and the mine was dewatered and secured in May. Inspection of underground workings took place, followed immediately by sampling and planning. The company removed the pentice to form a third compartment, rehabilitated the shaft, sank approximately 200 ft of shaft, cut a station on the 700' level and drove 800 ft of drift.

www.innovexplo.com
NI 43 101 Technical Report and Mineral Resource Estimate for the O’Brien Project, Abitibi, Québec – May 2018 50
On November 12, 1980, an agreement was signed with St-Joseph Explorations Ltd (later Sulpetro Minerals Ltd). In light of strong gold prices and the excellent outlook, St-Joseph Explorations decided to continue exploring the Kewagama property.
6.2.2 Sulpetro Minerals / Novamin Resources / Breakwater Resources The following summary of the work carried out by Sulpetro Minerals Ltd (“Sulpetro”; formerly St-Joseph Explorations Ltd), Novamin Resources Inc. (“Novamin”) and Breakwater Resources Ltd (“Breakwater”) on the Kewagama Property is mostly modified and summarized from Vaillant and Hutchinson (1982) and Pelchat (1996).
1981: Sulpetro deepened the shaft to 1,150 ft. Ore and waste passes were driven from the 7th level to the 4th level. Thirty-one (31) surface drill holes (2120-S-1 to 2120-S-31) were drilled for a total of 4,789.8 m. Geophysical surveys (Mag, VLF, IP) were carried out on the Kewagama property. Five (5) of the holes were drilled to test a coincident Mag and IP anomaly between lines 3+20E and 4+00E. The result was the discovery of the West IP Zone.
1982: Development continued on the 6th and 7th levels, and the Winze Zone was mined out, producing 11,340 metric tons averaging 3.03 g/t Au. Production also continued from the Q, R and S veins until operations were suspended in November 1982.
1988: Four (4) surface diamond drill holes (2120-S-32 to 2120-S-35) totalling 1,005.8 m were drilled by Novamin to test the Piché Group "Mine Horizon" lithologies between the O'Brien and Kewagama property boundaries at the westernmost end of the 500' Ievel in the Kewagama underground workings. These holes intersected favourable lithologies that could host ore-grade gold mineralization laterally and at depth.
1994: On July 25, the wooden Kewagama shaft was struck by lightning and burned down.
1995: Breakwater re-activated the exploration activities on the Kewagama property, and established new surveyed grid lines spaced 100 m apart, with a cumulative length of 16 km.
As a first step, a compilation of historical work was completed to better understand the geological setting and assess the economic potential of the Kewagama property. Consequently, geological mapping was conducted over the recently cut grid lines, which covered the entire property. The purpose of this work was to study the lithological and structural controls on gold distribution and to build a geological compilation map of the Kewagama property.
6.2.3 Historical work completed by the issuer The following summary of the work conducted by Radisson on the Kewagama property is mostly modified and summarized from Kelly (2003), Bisson (2004), Barrie (2006), Vincent (2009), David and Gauthier (2012), and Radisson’s annual reports (1999 to 2013).

www.innovexplo.com
NI 43 101 Technical Report and Mineral Resource Estimate for the O’Brien Project, Abitibi, Québec – May 2018 51
1999: Radisson became 100% owner of the Kewagama property in 1999. A compilation of existing data began that same year with the objective of assessing the potential of existing gold showings.
2003: Radisson drilled one hole (KW03-01) for 176 m in March 2003. Drilling took place in the western sector of the property to verify the existence of near-surface quartz veins.
2004: An initial deep-drilling campaign was carried out in 2004 to study “Contact Zone”-type gold mineralization on the O’Brien and Kewagama properties. Seven (7) holes (KW04-02 to KW04-05, KW04-06C, KW04-02W and KW04-04W) were drilled on the Kewagama property, ranging in length from 690 to 1,580 m, for a total of 4,839.1 m. This program studied the favourable horizon to a depth never before explored. The objective was to significantly increase the potential and value of the Company’s holdings by discovering more extensive gold structures at depth, along the CLLFZ, compared with the known vein system near the surface.
2005: Radisson drilled five (5) holes (KW05-07 to KW05-11) for a total of 3,030.0 m. The purpose was to investigate the area between Zone 36 East and the Kewagama shaft, at a depth of 460 to 600 m.
2006: A high-resolution aeromagnetic, horizontal gradiometer and XDS-VLF-EM survey was carried out on the O’Brien and Kewagama properties in June 2006. The survey, which was the first phase of the 2006 exploration program, was conducted by Terraquest Ltd with a flight line spacing of 50 m. Data from this survey was used to define drill targets north of the CLLFZ.
A diamond drilling program was then carried out on the property. Five (5) holes totalling 2,237.0 m (KW06-12 to KW06-16) were drilled on the No. 2 Vein, Zone 36 East and the North Zone.
The 2006 drilling program confirmed the discovery of the North Zone, confirming the potential for gold mineralization north of the CLLFZ. At the time, the North Zone extended for more than 300 m along strike, from section 43E to 53E.
2008: In the fall of 2008, an exploration drilling program targeted two priority sectors on the Kewagama property: the area between Zone 36 East and the Kewagama mine, and the down-dip extensions of the gold zones below the old Kewagama mine stopes.
Eleven (11) holes totalling 4,946.8 m were drilled on the property (KW08-151, KW08-154 to KW08-160, KW08-164, KW-08-155A and KW08-163A).
Holes KW08-155A, 157 and 158 were drilled in the area between Zone 36 East and the former Kewagama mine. Hole KW08-157 cut a narrow high-grade zone. In addition, several high-grade quartz veins were intersected in the sedimentary rock of the Cadillac Group in hole KW08-155. To the east, in the stratigraphic extension of the O’Brien mine, hole KW08-155A cut a wide low-grade gold zone. Seven (7) holes were also drilled on the old Kewagama mine site (KW08-151, 154, 156, 159, 160, 163A and 164). Hole KW08-164, drilled nearly 160 m below the operating levels of the Kewagama mine, intersected a wide highly altered zone.
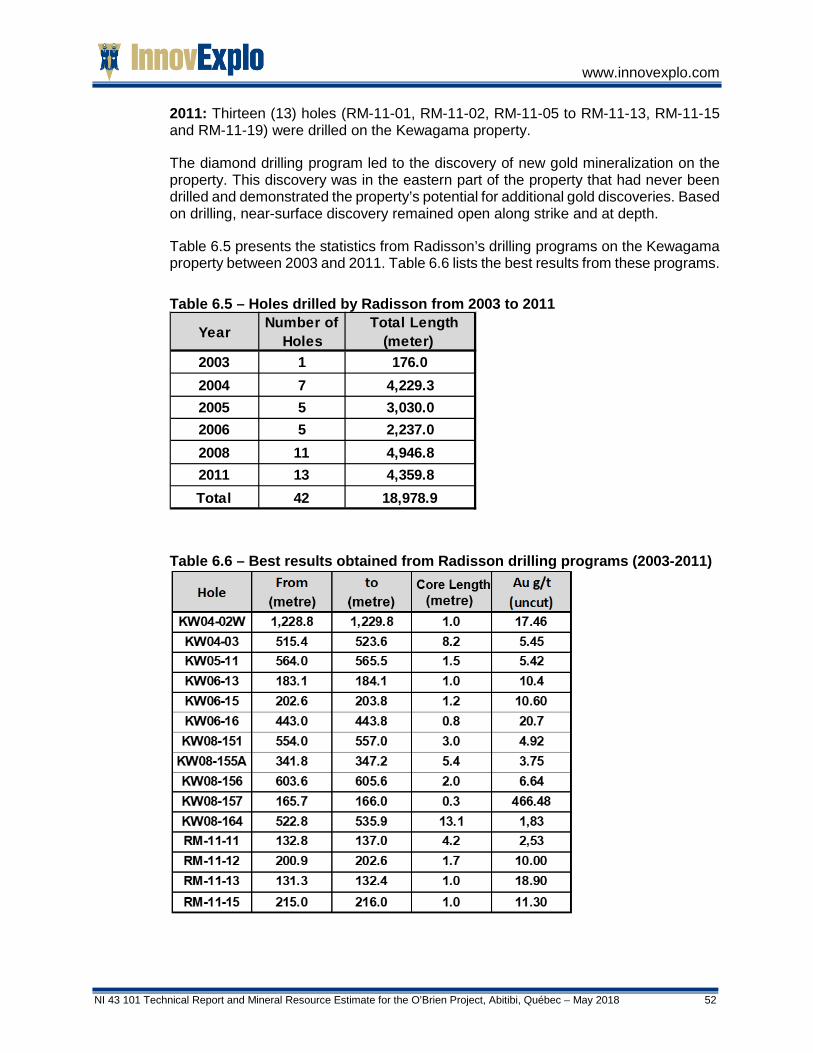
www.innovexplo.com
NI 43 101 Technical Report and Mineral Resource Estimate for the O’Brien Project, Abitibi, Québec – May 2018 52
2011: Thirteen (13) holes (RM-11-01, RM-11-02, RM-11-05 to RM-11-13, RM-11-15 and RM-11-19) were drilled on the Kewagama property.
The diamond drilling program led to the discovery of new gold mineralization on the property. This discovery was in the eastern part of the property that had never been drilled and demonstrated the property’s potential for additional gold discoveries. Based on drilling, near-surface discovery remained open along strike and at depth.
Table 6.5 presents the statistics from Radisson’s drilling programs on the Kewagama property between 2003 and 2011. Table 6.6 lists the best results from these programs.
Table 6.5 – Holes drilled by Radisson from 2003 to 2011
Table 6.6 – Best results obtained from Radisson drilling programs (2003-2011)
Year Number of Holes
Total Length (meter)
2003 1 176.02004 7 4,229.32005 5 3,030.02006 5 2,237.02008 11 4,946.82011 13 4,359.8Total 42 18,978.9
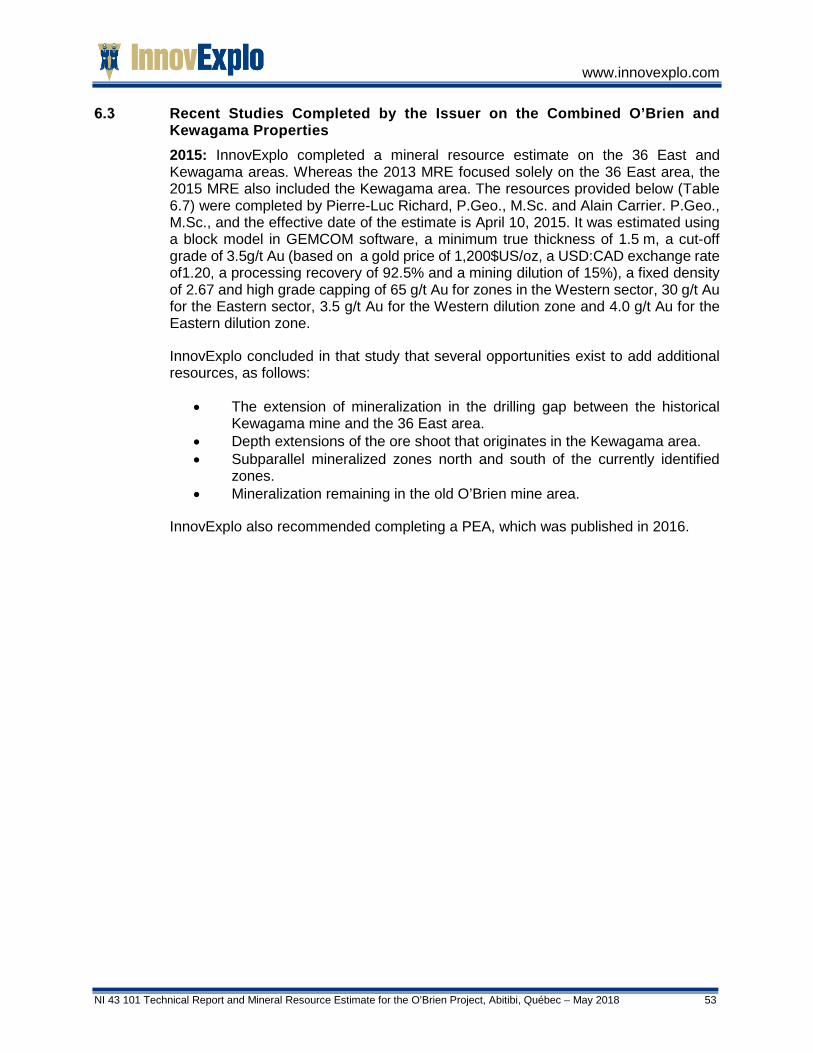
www.innovexplo.com
NI 43 101 Technical Report and Mineral Resource Estimate for the O’Brien Project, Abitibi, Québec – May 2018 53
Recent Studies Completed by the Issuer on the Combined O’Brien and Kewagama Properties 2015: InnovExplo completed a mineral resource estimate on the 36 East and Kewagama areas. Whereas the 2013 MRE focused solely on the 36 East area, the 2015 MRE also included the Kewagama area. The resources provided below (Table 6.7) were completed by Pierre-Luc Richard, P.Geo., M.Sc. and Alain Carrier. P.Geo., M.Sc., and the effective date of the estimate is April 10, 2015. It was estimated using a block model in GEMCOM software, a minimum true thickness of 1.5 m, a cut-off grade of 3.5g/t Au (based on a gold price of 1,200$US/oz, a USD:CAD exchange rate of1.20, a processing recovery of 92.5% and a mining dilution of 15%), a fixed density of 2.67 and high grade capping of 65 g/t Au for zones in the Western sector, 30 g/t Au for the Eastern sector, 3.5 g/t Au for the Western dilution zone and 4.0 g/t Au for the Eastern dilution zone.
InnovExplo concluded in that study that several opportunities exist to add additional resources, as follows:
• The extension of mineralization in the drilling gap between the historical Kewagama mine and the 36 East area.
• Depth extensions of the ore shoot that originates in the Kewagama area. • Subparallel mineralized zones north and south of the currently identified
zones. • Mineralization remaining in the old O’Brien mine area.
InnovExplo also recommended completing a PEA, which was published in 2016.
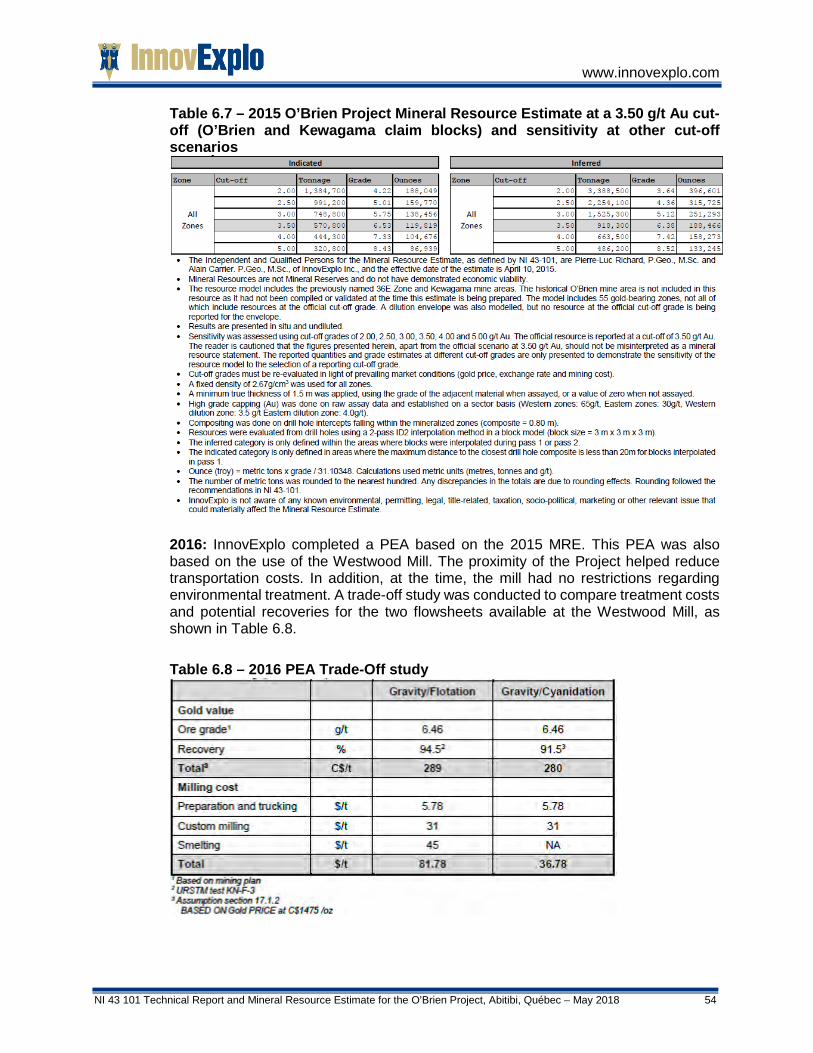
www.innovexplo.com
NI 43 101 Technical Report and Mineral Resource Estimate for the O’Brien Project, Abitibi, Québec – May 2018 54
Table 6.7 – 2015 O’Brien Project Mineral Resource Estimate at a 3.50 g/t Au cut-off (O’Brien and Kewagama claim blocks) and sensitivity at other cut-off scenarios
2016: InnovExplo completed a PEA based on the 2015 MRE. This PEA was also based on the use of the Westwood Mill. The proximity of the Project helped reduce transportation costs. In addition, at the time, the mill had no restrictions regarding environmental treatment. A trade-off study was conducted to compare treatment costs and potential recoveries for the two flowsheets available at the Westwood Mill, as shown in Table 6.8.
Table 6.8 – 2016 PEA Trade-Off study
www.innovexplo.com
NI 43 101 Technical Report and Mineral Resource Estimate for the O’Brien Project, Abitibi, Québec – May 2018 55
The proposed mining plan was prepared using the inferred and indicated resources estimated by InnovExplo. Due to the narrow vein nature of the orebody, two (2) underground mining methods were considered in the study: modified Avoca and long-hole mining with captive sublevels.
The 2016 PEA was based on an underground mine with access by decline to a vertical depth of 550 m in the 36 East area and 250 m in the Kewagama area. The guideline used in the stope design was a minimum mining width of 1.8 m for subvertical stopes. The subvertical structures were cut at 18-m vertical intervals corresponding to access level elevations. The conversion of mineral resources to potential mineral reserves takes into account dilution and losses during mining operations. The mineral resources are already diluted to a minimum width of 1.8 m.
Mining recovery was established at 85% to take into account pillar requirements. A 30% dilution was also taken into account for stope excavation. Finally, a 95% recovery was applied to account for mining operating losses.
In the opinion of the author, Laurent Roy, P.Eng., the mine plan should be achievable given the flexibility and number of available working places. Table 6.9 and Table 6.10 summarize the annual tonnage distribution according to the mine plan and the cash flow analysis.
Table 6.9 – Mine plan tonnage distribution
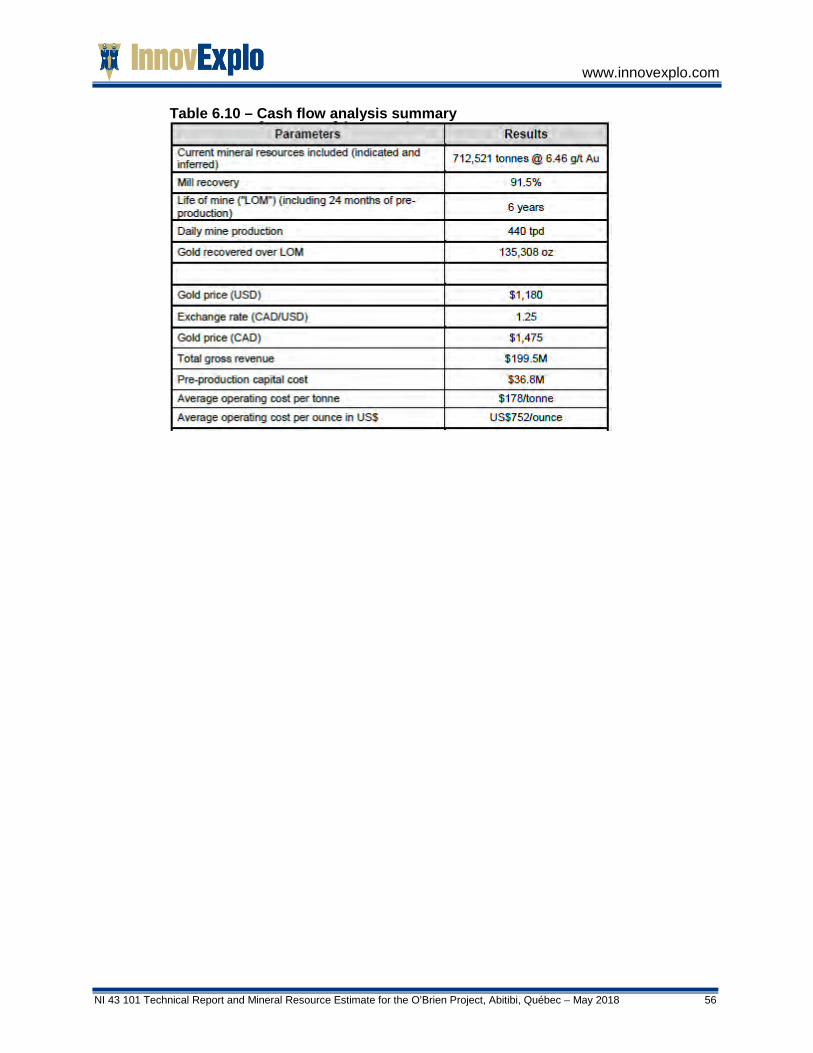
www.innovexplo.com
NI 43 101 Technical Report and Mineral Resource Estimate for the O’Brien Project, Abitibi, Québec – May 2018 56
Table 6.10 – Cash flow analysis summary
www.innovexplo.com
NI 43 101 Technical Report and Mineral Resource Estimate for the O’Brien Project, Abitibi, Québec – May 2018 57
7. GEOLOGICAL SETTING AND MINERALIZATION
Abitibi Terrane (Abitibi Subprovince) Previously, the Abitibi Greenstone Belt has been subdivided into northern and southern parts based on stratigraphic and structural criteria (e.g., Dimroth et al., 1982; Ludden et al., 1986; Chown et al., 1992). Previous publications used an allochthonous model of greenstone belt development that portrayed the belt as a collage of unrelated fragments. Thurston et al. (2008) presented the first geochronologically constrained stratigraphic and/or lithotectonic map (Figure 7.1) covering the entire breadth of the Abitibi Greenstone Belt from the Kapuskasing Structural Zone eastward to the Grenville Province. According to Thurston et al. (2008), Superior Province greenstone belts consist of mainly volcanic units unconformably overlain by largely sedimentary Timiskaming-style assemblages, and field and geochronological data indicate that the Abitibi Greenstone Belt developed autochthonously.
The Abitibi Greenstone Belt is composed of east-trending synclines largely composed of volcanic rocks and intervening domes cored by synvolcanic and/or syntectonic plutonic rocks (gabbro-diorite, tonalite and granite) alternating with east-trending bands of turbiditic wackes (MERQ-OGS, 1984; Ayer et al., 2002a; Daigneault et al., 2004; Goutier and Melançon, 2007). Most of the volcanic and sedimentary strata dip vertically and are generally separated by abrupt, east-trending faults with variable dip. Some of these faults, such as the Porcupine-Destor Fault, display evidence for overprinting deformation events including early thrusting, later strike-slip and extension events (Goutier, 1997; Benn and Peschler, 2005; Bateman et al., 2008). Two ages of unconformable successor basins occur: early, widely distributed Porcupine-style basins of fine-grained clastic rocks, followed by Timiskaming-style basins of coarser clastic and minor volcanic rocks which are largely proximal to major strike-slip faults, such as the Porcupine-Destor Fault Zone, the Cadillac–Larder Lake Fault Zone (“CLLFZ”) and other similar faults in the northern Abitibi Greenstone Belt (Ayer et al., 2002a; Goutier and Melançon, 2007). In addition, the Abitibi Greenstone Belt is cut by numerous late-tectonic plutons from syenite and gabbro to granite with lesser dykes of lamprophyre and carbonatite. The metamorphic grade in the greenstone belt displays greenschist to sub-greenschist facies (Jolly, 1978; Powell et al., 1993; Dimroth et al., 1983; Benn et al., 1994) except around plutons where amphibolite grade prevails (Joly, 1978).
The following more detailed description of the new subdivision of the Abitibi Greenstone Belt is mostly modified and summarized from Thurston et al. (2008) and references therein.

www.innovexplo.com
NI 43 101 Technical Report and Mineral Resource Estimate for the O’Brien Project, Abitibi, Québec – May 2018 58
Figure 7.1 –Stratigraphic map of the Abitibi Greenstone Belt. The geology of the southern Abitibi Greenstone Belt is based
on Ayer et al. (2005) and the Québec portion on Goutier and Melançon (2007) Figure modified from Thurston et al. (2008)

www.innovexplo.com
NI 43 101 Technical Report and Mineral Resource Estimate for the O’Brien Project, Abitibi, Québec – May 2018 59
The Abitibi Greenstone Belt is now subdivided into seven discrete volcanic stratigraphic episodes on the basis of groupings of numerous U-Pb zircon ages. New U-Pb zircon ages and recent mapping by the Ontario Geological Survey and Géologie Québec clearly show similarity in timing of volcanic episodes and ages of plutonic activity between the northern and southern Abitibi Greenstone Belt as indicated in Figure 7.1. These seven volcanic episodes are listed from oldest to youngest:
1. Pre-2750 Ma volcanic episode; 2. Pacaud Assemblage (2750-2735 Ma); 3. Deloro Assemblage (2734-2724 Ma); 4. Stoughton-Roquemaure Assemblage (2723-2720 Ma); 5. Kidd-Munro Assemblage (2719-2711 Ma); 6. Tisdale Assemblage (2710-2704 Ma); 7. Blake River Assemblage (2704-2695 Ma).
Cadillac Area Two types of successor basins are present in the Abitibi Greenstone Belt: early turbidite-dominated (Porcupine Assemblage; Ayer et al., 2002a) laterally extensive basins, succeeded by aerially more restricted alluvial-fluvial or Timiskaming-style basins (Thurston and Chivers, 1990).
The geographic limit (Figure 7.1) between the northern and southern parts of the Abitibi Greenstone Belt has no tectonic significance but is herein provided merely for reader convenience and is similar to the limits between the internal and external zones of Dimroth et al. (1982) and that between the Central Granite-Gneiss and Southern Volcanic zones of Ludden et al. (1986). The boundary passes south of the wackes of the Chicobi and Scapa groups with a maximum depositional age of 2698.8 ± 2.4 Ma (Ayer et al., 1998, 2002b).
The following description of the Cadillac area is mostly modified and summarized from et Doucet et Lafrance (2005), and references therein.
The Cadillac area is underlain by rocks of the Southern Volcanic Zone of the Abitibi Subprovince intruded by Proterozoic diabase dykes. The CLLFZ runs along an E-W axis and separates the Pontiac metasedimentary Subprovince to the south from the Abitibi volcano-sedimentary Subprovince to the north. In Québec, about forty or so gold deposits, which have produced over 60 million ounces of gold since the early 20th century, are associated with this major structure and its subsidiary faults.
Intrusive rocks in the Cadillac area include mafic sills (gabbro and diorite) occurring in the Blake River and Piché groups, the synvolcanic Mooshla Pluton, composed of gabbro, quartz diorite, tonalite and trondhjemite, as well as N-S and NE-SW-trending Proterozoic diabase dykes. North of the CLLFZ, regional metamorphism ranges from the greenschist facies to the upper greenschist facies, but the metamorphic grade increases south of the fault to reach the amphibolite facies.
From north to south, the following six major lithological units (groups) are observed: Malartic, Kewagama, Blake River, Cadillac, Piché and Pontiac (Figure 7.2).
www.innovexplo.com
NI 43 101 Technical Report and Mineral Resource Estimate for the O’Brien Project, Abitibi, Québec – May 2018 60
The Malartic Group is composed of ultramafic volcanic rocks (komatiites) and tholeiitic basalts (Trudel et al., 1992). The Kewagama Group contains wackes and pelitic rocks. The Blake River Group comprises the Hebecourt and Bousquet formations. The Hebecourt Formation is composed of massive and pillowed basalts, gabbro sills and rhyolites of tholeiitic affinity. According to Lafrance et al. (2003c), the Bousquet Formation includes a lower member and an upper member. The lower member is composed of an intermediate scoriaceous tuff; mafic, intermediate and felsic volcanic rocks; and felsic and mafic subvolcanic intrusions. The upper member consists of massive felsic volcanic rocks and volcaniclastic units. Rocks of the lower member are tholeiitic to transitional, whereas those of the upper member show a transitional to calc-alkaline affinity (Lafrance et aI., 2003c). The Cadillac Group is composed of wackes, pelitic schists with bands of polymictic conglomerate and iron formation.
In the Cadillac area, the Piché Group is composed of volcanic rocks (tholeiitic basalts, porphyritic andesites and calc-alkaline block tuffs) interbedded with conglomerates, wackes, graphitic schists and pyritic cherts. Most of the orebodies in the southern part of the Cadillac mining camp are hosted in rocks of the Piché Group, which forms a thin band several tens of kilometres long that follows the trace of the CLLFZ (Figure 7.2).
Sedimentary rocks, mainly wackes, of the Pontiac Group lie south of the CLLFZ. Volcanic and sedimentary rocks in the Cadillac area form a series of E-W-trending steeply dipping monoclonal panels. Volcanic and sedimentary sequences are separated by longitudinal faults parallel to lithological contacts such as the CLLFZ and Lac Imau faults (Figure 7.2).

www.innovexplo.com
NI 43 101 Technical Report and Mineral Resource Estimate for the O’Brien Project, Abitibi, Québec – May 2018 61
Figure 7.2 – Geological synthesis of the Cadillac mining camp showing the location of active and closed mines, as well as
ore deposits and showings. Modified from Lafrance et al. (2003a, 2003b)
www.innovexplo.com
NI 43 101 Technical Report and Mineral Resource Estimate for the O’Brien Project, Abitibi, Québec – May 2018 62
Property Geology The following description of geology on the O’Brien Project is mostly modified and summarized from Doucet and Lafrance (2005) and Evans (2007) and retains the references therein.
The Project straddles the Piché Group volcanic rocks that separate Pontiac Group metasedimentary rocks to the south from Cadillac Group metasedimentary rocks to the north. In the property area, all lithologies strike east-west and dip steeply south at approximately 85°.
The CLLFZ is a major regional crustal break that consists mainly of chlorite-talc-carbonate ultramafic schist, and ranges in thickness from 30 to 100 m in the mine area and narrows significantly to about 12 m wide to the east of Zone 36 East. Across the Project, the fault is subparallel and close to the Piché Group-Cadillac Group contact but is generally enveloped by Cadillac Group sedimentary rocks (argillites, greywackes and, to a lesser extent, chert).
7.3.1 Cadillac Group The Cadillac Group metasedimentary rocks are in the footwall of the mineralization and predominantly in the CLLFZ footwall, and hence the majority of the diamond drill holes did not intersect the Cadillac Group rocks. The limited drill hole intersections show the presence of argillite, greywacke, some pebble conglomerate-like units, and some iron formation.
7.3.2 Piché Group The veins of the Project were mostly injected into the volcanic and sedimentary rocks of the Piché Group. From south to north, the Piché Group stratigraphy is divided into the following units:
• Southern volcanics: massive to well foliated, locally pillowed basalts; • Southern QFP dyke; • Central volcanics: tuff and foliated basalt; • Polygenic matrix supported conglomerate (“Mine Conglomerate”); • Northern QFP dyke; • Northern volcanics: tuff and foliated basalts (with small quantities of argillite,
greywacke, chert and massive to variably porphyritic basalt flows).
All the above lithologies generally strike east-west with more pronounced flexures locally. The rock varies from slightly to highly schistose and foliation increases progressively towards the CLLFZ.
7.3.2.1 Quartz-feldspar porphyry The southern and northern QFPs are much alike. They are characterized by generally sharp transposed contacts, abundant quartz and feldspar phenocrysts ranging in size from 0.1 to 0.5 cm, and range in colour from greyish to buff-beige, set in an aphanitic to fine-grained matrix of intermediate composition. Feldspar phenocrysts are locally

www.innovexplo.com
NI 43 101 Technical Report and Mineral Resource Estimate for the O’Brien Project, Abitibi, Québec – May 2018 63
altered and appears as ‘ghosts’. In general, the QFPs are intensely sheared and show a more or less brownish biotite and chlorite alteration. The strong foliation often produces an augen texture with phenocrysts. The latter units are continuous horizontally and vertically in the 36 East area and are useful stratigraphic marker horizons. The north and south QFP units are thicker in the vicinity of the O’Brien mine. It is unclear whether these units are duplicated by folding and faulting. The south QFP generally hosts the PC and PN veins, and the north QFP is spatially associated with the IN Vein.
7.3.2.2 Conglomerate The O’Brien mine conglomerate is represented in the 36 East area by well-bedded greywacke and argillite with the sporadic presence (2% to 5%) of greyish granitic pebbles, greenish volcanics elongated pebbles and other components. The pebbles tend to be somewhat flattened, consistent with north-south compression. The IS Vein is located mainly in this relatively competent lithology. The conglomerate unit is another useful marker horizon.
7.3.2.3 Volcanic rocks The volcanic rocks consist mainly of mafic tuffs and flows. The volcanic rocks generally have tholeiitic signatures (Trudel et al., 1992). In general, the flows are fine grained and exhibit greenschist facies mineral assemblages. The tuffs are of mafic composition and are very abundant. The tuffs can be finely bedded to very schistose and may be the expression of deformed mafic flows. Locally present are massive to pillowed, fine-grained basalt or lesser amounts of gabbro and amphibolites.
Schistosity is more developed in the central and northern volcanic units than the southern unit. Greywacke and argillite lenses occur more frequently between the volcanic rocks in the northern units. The southern volcanic rocks contain the PS Vein. The central volcanic rocks are locally mineralized by the PN and IS veins. The north volcanic unit and sediment interlayers host the IX, FS, and FV veins.
7.3.2.4 Graphitic schist and argillite Thin layers of graphitic schist and argillite are present in the volcanics of the Piché Group. These are highly sheared and deformed, characterized by tight folding, and often display breccias or slickensides with graphite. Pyrite is abundant, finely laminated and deformed.
7.3.3 Pontiac Group The metasedimentary rocks of the Pontiac Group consist mainly of greywacke and some argillite, which is sometimes graphitic. In general, the sediments are well stratified. Some zones display weak biotitic alteration or chloritization. Small-scale folding is observed in places. Some greyish to smokey quartz veins and veinlets, similar to gold-bearing veins, appear locally, and some of these host gold (OB-95-48, 52, 53, 54 and 56A).

www.innovexplo.com
NI 43 101 Technical Report and Mineral Resource Estimate for the O’Brien Project, Abitibi, Québec – May 2018 64
Mineralization The following description of mineralization is mostly modified and summarized from Evans (2007) and retains the references therein.
7.4.1 O’Brien mine Gold production at the O’Brien mine came from a few quartz veins running almost parallel to the formations. The mine’s productive sector was generally limited to a narrow strip that included the O’Brien Mine conglomerate and the northern QFP dyke. Approximately 95% of the O’Brien ore came from four veins (No. 1, No. 4, No. 9 or “F”) in the eastern part of the mine. The veins contained high-grade shoots that occasionally yielded considerable amounts of visible gold. The main veins generally strike from 083° to 098°, and dip steeply to the south (-84° to -90°). The stopes averaged 0.75 to 0.90 m wide. Gold mineralization extends vertically down to at least the 3450' level.
7.4.1.1 No. 1 Vein The No. 1 Vein was the most productive in terms of tonnage and occurs mainly in the conglomerate. This vein comprises No. 1 Vein NE-SW (080º to 090º Az.) and No. 1 Vein NW-SE (090º to 095º Az.).
No. 1 Vein NE-SW extends from surface to at least the 3000' level and is over 500 ft in strike length. The richest and most productive portion of this vein was from an ore shoot 15 to 60 m long that plunges about 85º to the east from about the 750' level down to at least the 3000' level, at its intersection with Vein No. 1 NW-SE, at the conglomerate hanging wall contact. A second moderate-grade shoot, about 15 to 45 m long, plunges about 60º to the east from about the 1000' level to the 2500' level.
Vein No. 1 NW-SE extends from about the 750' level to at least the 3450' level, and ranges in horizontal length from about 15 to 180 m. Higher grade shoots plunging about 85º to the east seem to be controlled by vein intersections and vein folds. Both of these veins average 30 cm thick (Mills, 1950).
7.4.1.2 No. 4 Vein The No. 4 Vein is spatially associated with the North QFP dyke. It extends from surface down to at least the 3450' level and has a 1,000 ft strike length. It averaged 30 cm thick (Blais, 1954). Approximately 50% of the gold produced came from this vein. This was due to an exceptionally high-grade ore shoot, only 9 to 15 m horizontally, but which extended for 190 m from the 500' level down to the 1125' level.
7.4.1.3 No. 9 Vein The No. 9 Vein is located in the northern greywacke and volcanic units. This brown vein is rich in biotite and arsenopyrite. It is also wider than the others. The stopes were rarely less than 1.2 m wide and could reach 6 m in certain folded zones where visible gold was common. It was mined out from the 1250' level down to the 1375' level along a horizontal length of about 50 m.

www.innovexplo.com
NI 43 101 Technical Report and Mineral Resource Estimate for the O’Brien Project, Abitibi, Québec – May 2018 65
7.4.2 Zone 36 East area The main mineralized structures (“veins”) are generally narrow, ranging in true thickness from several centimetres to 6.7 m, but have good continuity both horizontally and vertically. Gold-bearing veins occur in different lithologies of the Piché Group and the Pontiac Group. The veins cross the stratigraphy at low angles and are occasionally folded, particularly in volcanic and argillic host rocks. Generally, the veins strike east-west (085° to 097°), dip steeply to the south (-80° to -90°) and contain higher-grade shoots that plunge steeply to the east.
After the 1994-95 drilling program, Radisson completed a new geological interpretation that retained eight of the ten veins (structures) defined by Novamin. These veins were, from south to north: PS, PC, PN, IS, IN, IX, FS and FV. They were located in a 75 m wide corridor within the Piché Group metasedimentary rocks and metavolcanic rocks, and were observed to be best developed between 3,200E and 4,400E.
For the current report, InnovExplo completed a 3D geological interpretation that identified more structures than before.
Often, the veins occur as a group of quartz veinlets scattered in a very sheared and altered zone that has no obvious main vein. Only very competent lithologies, like the conglomerate and the QFPs, host large veins. In some drill core, the quartz veinlets exhibit small tight folds (Bisson, 1995).
Gold grades vary considerably. The gold occurs mainly as fine to coarse free grains that are heterogeneously distributed, mainly in the quartz veins, and to a lesser extent, in the wallrock. Higher gold grades occur in short, steeply plunging shoots with a similar style to those mined at the O’Brien mine (Bisson, 1996).
The colour of the gold-bearing quartz veins varies from milky to greyish to dark smokey, and sometimes individual veins contain all three colours in varied proportions. The quartz veins are narrow and range from a couple of centimetres to over a metre wide. The quartz is generally very deformed and brecciated. The veins sometimes contain altered mineralized wallrock xenoliths.
7.4.3 Kewagama area The following description of the Kewagama mine is mostly modified and summarized from Dresser and Denis (1949) and retains the references therein.
The gold mineralization occurs in rocks of the Piché Group to the south of the CLLFZ, which strikes east-west in this area and dips 80° to 85° to the south. North of the CLLFZ lies a considerable width of tuffs and agglomerates. In the vicinity of the mine workings, the highly sheared rocks of the Piché Group have an aggregate width of 100 to 130 m. The succession from north to the south is as follows: greenstone (15 to 25 m); North QFP (3 to 10 m); conglomerate (12 to 25 m); greenstone and tuffs (3 to 7 m); South QFP (3 to 9 m); and greenstone (about 60 m).
www.innovexplo.com
NI 43 101 Technical Report and Mineral Resource Estimate for the O’Brien Project, Abitibi, Québec – May 2018 66
The only gold mineralization of particular interest disclosed by extensive underground workings is found in the winze, in a 25-ft raise above the winze and in the sublevels driven from the winze. These workings revealed an ore shoot with a vertical extent of 70 m and an east-west length of 4.5 to 25 m, in which irregular and discontinuous stringers of blue quartz carry free gold. The majority of these veins are parallel and are contained within the North QFP near its north margin, but some continue into the greenstone north of the porphyry. Individual veins are rarely more than 10 cm wide and 3 m long; occasionally, two or three are parallel to one another or overlap for part of their length. Some sections of these narrow veins are decidedly high grade, but in any stoping operation there would be considerable dilution.
The Kewagama ore shoot described above occurs in the same rocks as the high-grade shoot in the historical No. 4 Vein mined at the O’Brien mine, and resembles it for its short lateral extent compared to vertical, and for the fact that it contains the same type of blue quartz and associated minerals. It differs from the O’Brien shoot in that it does not follow one definite fracture, instead consisting of a series of irregular overlapping stringers, and for the fact that it is of much lower grade as a whole.
Hydrothermal Alteration The following description of hydrothermal alteration is mostly modified and summarized from Evans (2007) and retains the references therein.
Wallrock alteration ranges from several centimetres to over a metre thick, equally pervasive on both sides of the veins. The mineralized zones are usually comprised of a greater proportion of altered wallrock than actual veins. In general, the wallrock is well foliated and has a distinctive dark brown to brownish grey colour due to intense biotite alteration. The brownish alteration is an easily recognizable indicator of potential gold-bearing mineralization. Biotite tends to occur as 1 to 2 mm thick layers of predominantly fine-grained biotite parallel to the foliation. On average the mineralized zones contain about 5% biotite but can contain over 20% biotite.
Generally, zones of biotite alteration accompanied by silicification and sulphidation will yield gold values. Of all the sulphides, arsenopyrite is the most abundant and characteristic of the O’Brien mine. Arsenopyrite occurs mainly in intensely altered wallrock where it can be abundant (2% to 10%). The finer grained and needle-like varieties of arsenopyrite are more likely to contain gold. Coarser grained, euhedral rhombic arsenopyrite is less likely to contain gold (Bisson, personal communication 1998).
Fine- to medium-grained, subhedral to euhedral pyrite is frequently observed generally overprinting the foliation (0.5% to 2%). Some pyrite is associated with gold-bearing zones (Hatch, 1998). Minor quantities of pyrrhotite and chalcopyrite are present in the mineralized zones (Bisson, 1995).
Carbonate alteration is mainly calcitic in microveinlet form, but it is also found frequently in all lithologies as more massive pervasive replacement. At times, iron carbonate veinlets are visible. Tourmaline is frequent but not always observed; it is generally found in small amounts in association with wallrock xenoliths.

www.innovexplo.com
NI 43 101 Technical Report and Mineral Resource Estimate for the O’Brien Project, Abitibi, Québec – May 2018 67
8. MINERAL DEPOSIT TYPES Greenstone-hosted quartz-carbonate vein deposits occur as quartz and quartz-carbonate veins, with valuable amounts of gold and silver, in faults and shear zones located within deformed terranes of ancient to recent greenstone belts commonly metamorphosed at greenschist facies (Dubé and Gosselin, 2007). Greenstone-hosted quartz-carbonate vein deposits are a subtype of lode gold deposits (Poulsen et al., 2000) (Figure 8.1). They are also known as mesothermal, orogenic. They consist of simple to complex networks of gold-bearing, laminated quartz-carbonate fault-fill veins in moderately to steeply dipping, compressional brittle-ductile shear zones and faults, with locally associated extensional veins and hydrothermal breccias. They can coexist regionally with iron formation-hosted vein and disseminated deposits, as well as with turbidite-hosted quartz-carbonate vein deposits (Figure 8.2). They are typically distributed along reverse-oblique crustal-scale major fault zones, commonly marking the convergent margins between major lithological boundaries such as volcano-plutonic and sedimentary domains. These major structures are characterized by different increments of strain, and consequently several generations of steeply dipping foliations and folds resulting in a fairly complex geological collisional setting.
Figure 8.1 – Inferred crustal levels of gold deposition showing the different types of lode gold deposits and the inferred deposit clan (from Dubé et al., 2001; Poulsen et al., 2000)
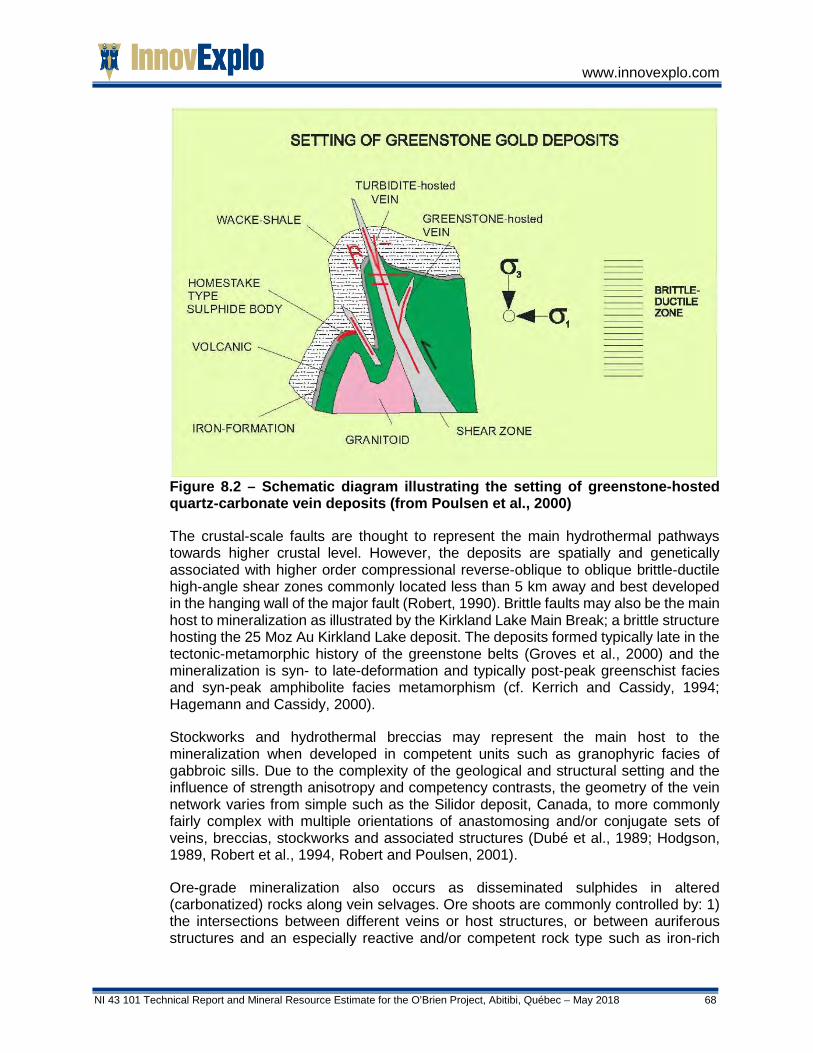
www.innovexplo.com
NI 43 101 Technical Report and Mineral Resource Estimate for the O’Brien Project, Abitibi, Québec – May 2018 68
Figure 8.2 – Schematic diagram illustrating the setting of greenstone-hosted quartz-carbonate vein deposits (from Poulsen et al., 2000)
The crustal-scale faults are thought to represent the main hydrothermal pathways towards higher crustal level. However, the deposits are spatially and genetically associated with higher order compressional reverse-oblique to oblique brittle-ductile high-angle shear zones commonly located less than 5 km away and best developed in the hanging wall of the major fault (Robert, 1990). Brittle faults may also be the main host to mineralization as illustrated by the Kirkland Lake Main Break; a brittle structure hosting the 25 Moz Au Kirkland Lake deposit. The deposits formed typically late in the tectonic-metamorphic history of the greenstone belts (Groves et al., 2000) and the mineralization is syn- to late-deformation and typically post-peak greenschist facies and syn-peak amphibolite facies metamorphism (cf. Kerrich and Cassidy, 1994; Hagemann and Cassidy, 2000).
Stockworks and hydrothermal breccias may represent the main host to the mineralization when developed in competent units such as granophyric facies of gabbroic sills. Due to the complexity of the geological and structural setting and the influence of strength anisotropy and competency contrasts, the geometry of the vein network varies from simple such as the Silidor deposit, Canada, to more commonly fairly complex with multiple orientations of anastomosing and/or conjugate sets of veins, breccias, stockworks and associated structures (Dubé et al., 1989; Hodgson, 1989, Robert et al., 1994, Robert and Poulsen, 2001).
Ore-grade mineralization also occurs as disseminated sulphides in altered (carbonatized) rocks along vein selvages. Ore shoots are commonly controlled by: 1) the intersections between different veins or host structures, or between auriferous structures and an especially reactive and/or competent rock type such as iron-rich

www.innovexplo.com
NI 43 101 Technical Report and Mineral Resource Estimate for the O’Brien Project, Abitibi, Québec – May 2018 69
gabbro (geometric ore shoot); or 2) the slip vector of the controlling structure(s) (kinematic ore shoot). For laminated fault-fill veins, the kinematic ore shoot will be oriented at a high angle to the slip vector (Robert et al., 1994; Robert and Poulsen, 2001).
At the district scale, the greenstone-hosted quartz-carbonate-vein deposits are associated with large-scale carbonate alteration commonly distributed along major fault zones and associated subsidiary structures (Dubé and Gosselin, 2007). At the deposit scale, the nature, distribution and intensity of the wall-rock alteration is largely controlled by the composition and competence of the host rocks and their metamorphic grade. Typically, the alteration haloes are zoned and characterized, at greenschist facies, by iron-carbonatization and sericitization with sulphidation of the immediate vein selvages (mainly pyrite, less commonly arsenopyrite).
The main gangue minerals are quartz and carbonate with variable amounts of white micas, chlorite, scheelite and tourmaline. The sulphide minerals typically constitute less than 10% of the ore. The main ore minerals are native gold with pyrite, pyrrhotite and chalcopyrite without significant vertical zoning. (Dubé and Gosselin, 2007)
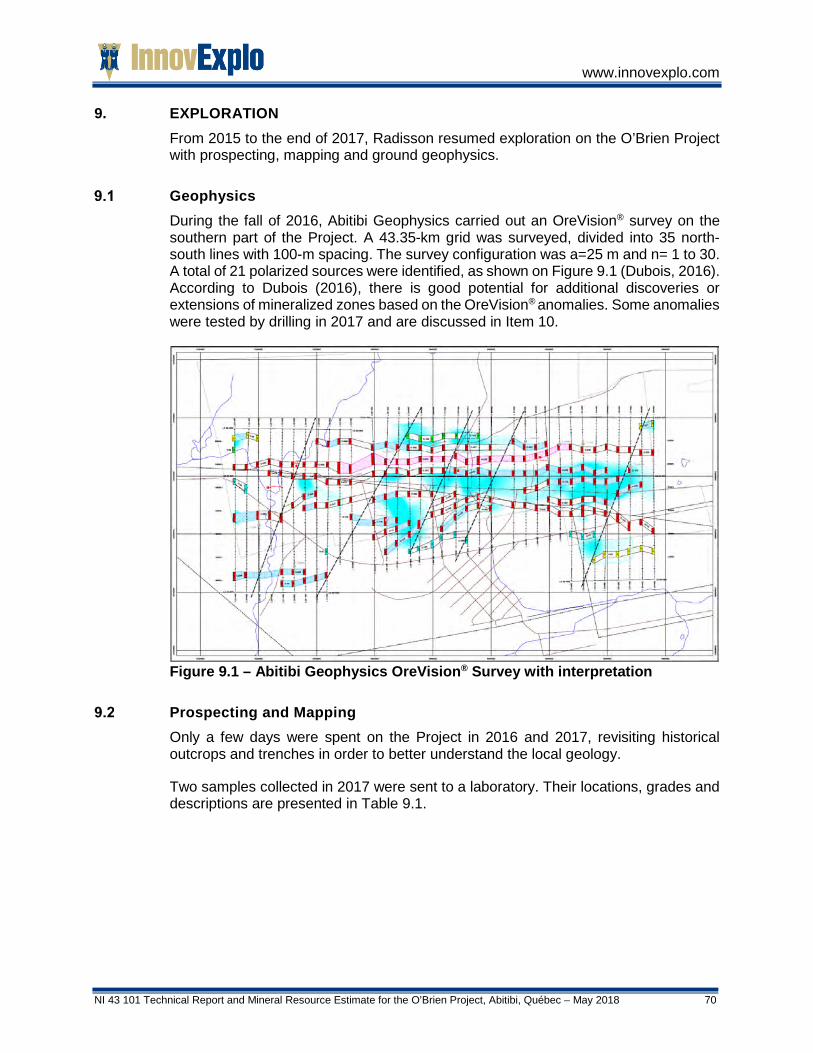
www.innovexplo.com
NI 43 101 Technical Report and Mineral Resource Estimate for the O’Brien Project, Abitibi, Québec – May 2018 70
9. EXPLORATION From 2015 to the end of 2017, Radisson resumed exploration on the O’Brien Project with prospecting, mapping and ground geophysics.
Geophysics During the fall of 2016, Abitibi Geophysics carried out an OreVision® survey on the southern part of the Project. A 43.35-km grid was surveyed, divided into 35 north-south lines with 100-m spacing. The survey configuration was a=25 m and n= 1 to 30. A total of 21 polarized sources were identified, as shown on Figure 9.1 (Dubois, 2016). According to Dubois (2016), there is good potential for additional discoveries or extensions of mineralized zones based on the OreVision® anomalies. Some anomalies were tested by drilling in 2017 and are discussed in Item 10.
Figure 9.1 – Abitibi Geophysics OreVision® Survey with interpretation
Prospecting and Mapping Only a few days were spent on the Project in 2016 and 2017, revisiting historical outcrops and trenches in order to better understand the local geology.
Two samples collected in 2017 were sent to a laboratory. Their locations, grades and descriptions are presented in Table 9.1.
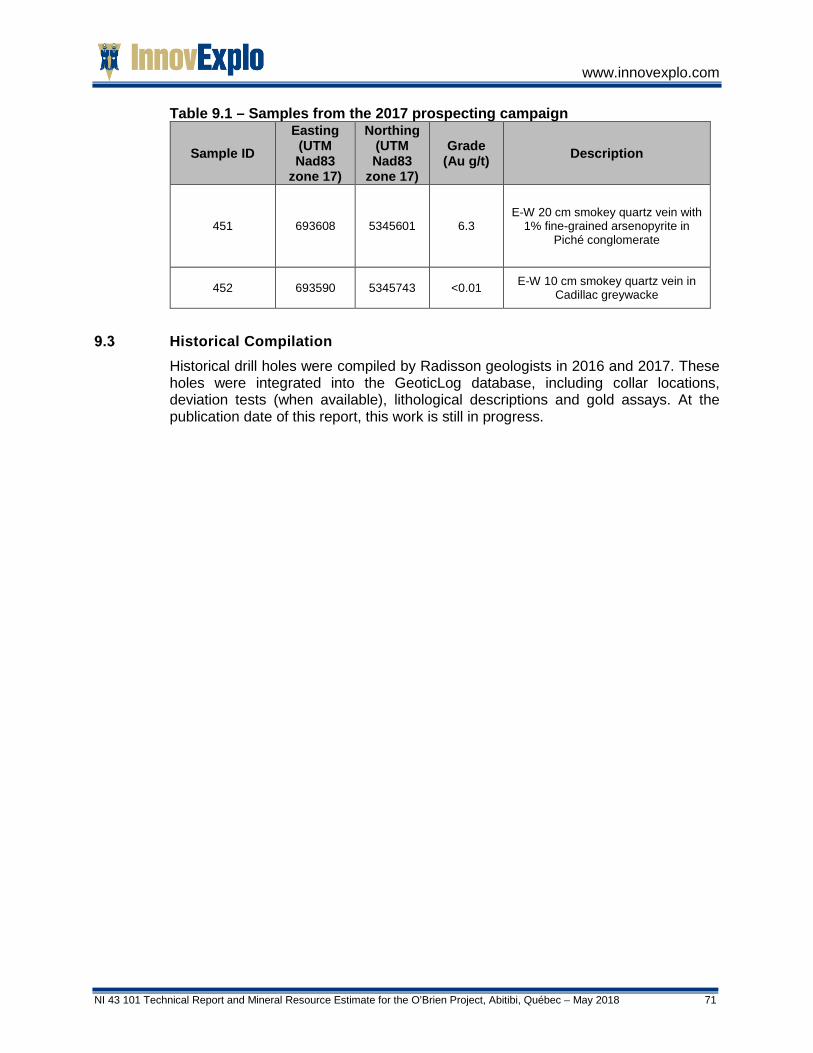
www.innovexplo.com
NI 43 101 Technical Report and Mineral Resource Estimate for the O’Brien Project, Abitibi, Québec – May 2018 71
Table 9.1 – Samples from the 2017 prospecting campaign
Sample ID Easting (UTM Nad83
zone 17)
Northing (UTM Nad83
zone 17)
Grade (Au g/t) Description
451 693608 5345601 6.3 E-W 20 cm smokey quartz vein with
1% fine-grained arsenopyrite in Piché conglomerate
452 693590 5345743 <0.01 E-W 10 cm smokey quartz vein in Cadillac greywacke
Historical Compilation Historical drill holes were compiled by Radisson geologists in 2016 and 2017. These holes were integrated into the GeoticLog database, including collar locations, deviation tests (when available), lithological descriptions and gold assays. At the publication date of this report, this work is still in progress.

www.innovexplo.com
NI 43 101 Technical Report and Mineral Resource Estimate for the O’Brien Project, Abitibi, Québec – May 2018 72
10. DRILLING Radisson resumed diamond drilling in December 2015. Drill holes OB-16-01 to OB-17-62 were included in the current resources estimate (except for OB-17-51).
Drilling Methodology From 2015 to 2017, all drilling on the O’Brien Project was performed by Rouillier Drilling Inc. from Amos, Quebec. All holes were drilled from surface, with NQ core caliber (47.6 mm core diameter). RQD (Rock Quality Designation) measurements was completed on most drilled core. The overall average RQD is 85%.
Diamond drill holes were planned using vertical cross sections and plan views in order to intercept interpreted veins or structural features at the proper angle. The software was AutoCAD and GeoticGraph. In-house geologists and consultants were involved in the targeting and follow-up phases of the drilling program. Radisson geologists and technicians used a handheld Garmin GPS (model 64s) to position the hole. Drill hole collars are systematically surveyed by professional surveyors (Corriveau J.L. & A ssoc. Inc.) approximately twice per year. Deviation surveys consist of single shots only taken at the beginning and end of each hole, with additional tests every 30 m. The REFLEX EZ-TRACTM instrument was used to record azimuth and dip information. The instrument was handled by the drilling contractor, and survey information was transcribed and provided in paper format to Radisson geologists. Casings were left in place and capped with a metal plug identifying the hole.
Core Logging Procedures At the rig, the driller helper place the core into core boxes, marking off every 3 m with wooden blocks. Once a core box is full, the helper wrap the box with tape. At the start of each day, a Radisson technician bring core boxes from the rig to the core shack, an old building near the dismantled No. 2 Shaft.
In the core shack, Radisson employees remove the tape and place the boxes on the logging tables. The technicians rotate the core so that all pieces slant one way, showing a cross-sectional view, at about a 45° angle. They check that distances are correctly indicated on the wooden blocks placed every 3 m. The core is measure in each box and the boxes are labelled.
RQD was measure by either geologists or geological technicians. Any breakage under 10 cm is recorded. Core from the O’Brien Project are of very good quality and recovery is above 99.8%. The geologists use GeoticLog logging software (Microsoft Access platform).
Lithologies (principal and secondary), alteration, mineralization, veins, magnetism, samples and assay results are compiled in the database. Geological technicians and geologists are responsible for taking photographs of the wet core, once samples are marked on the core. Complete descriptions are exported into an Excel spreadsheet and sent to the geologist in charge of the project.
Sample length typically ranges from 0.5 to 1.5 m, with some exceptions from 0.2 to 9 m. The sampled core is considered representative. Once logged and/or labelled, the
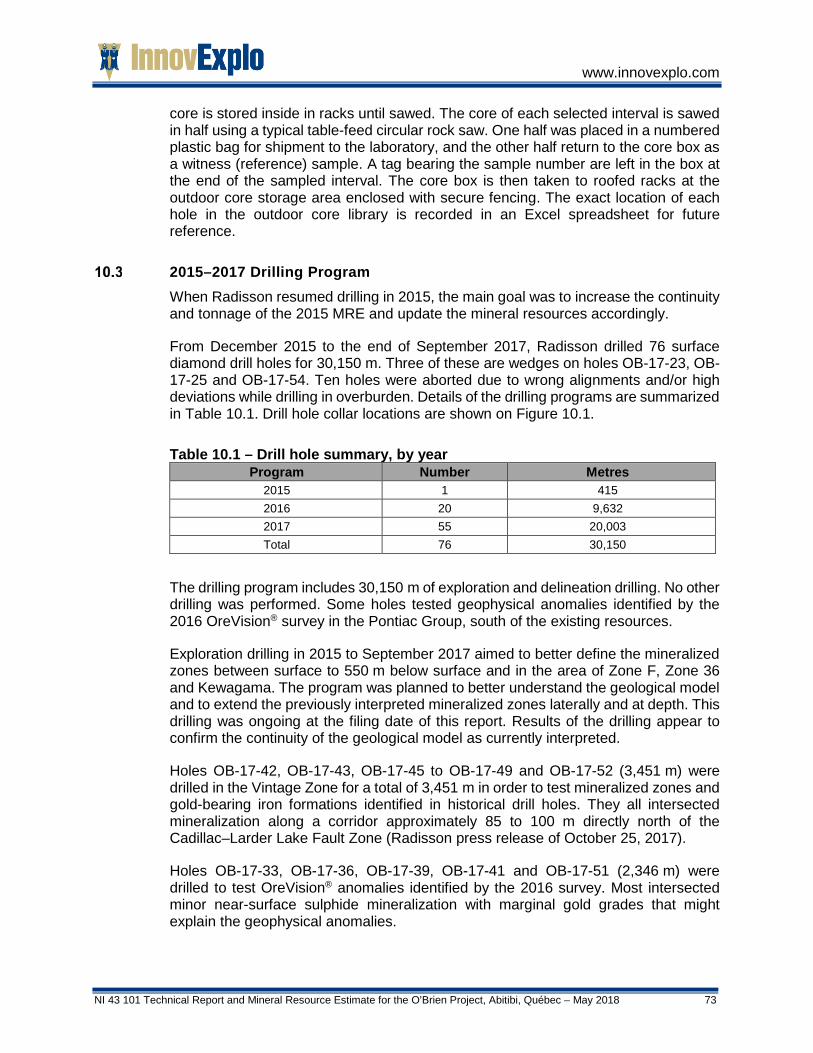
www.innovexplo.com
NI 43 101 Technical Report and Mineral Resource Estimate for the O’Brien Project, Abitibi, Québec – May 2018 73
core is stored inside in racks until sawed. The core of each selected interval is sawed in half using a typical table-feed circular rock saw. One half was placed in a numbered plastic bag for shipment to the laboratory, and the other half return to the core box as a witness (reference) sample. A tag bearing the sample number are left in the box at the end of the sampled interval. The core box is then taken to roofed racks at the outdoor core storage area enclosed with secure fencing. The exact location of each hole in the outdoor core library is recorded in an Excel spreadsheet for future reference.
2015–2017 Drilling Program When Radisson resumed drilling in 2015, the main goal was to increase the continuity and tonnage of the 2015 MRE and update the mineral resources accordingly.
From December 2015 to the end of September 2017, Radisson drilled 76 surface diamond drill holes for 30,150 m. Three of these are wedges on holes OB-17-23, OB-17-25 and OB-17-54. Ten holes were aborted due to wrong alignments and/or high deviations while drilling in overburden. Details of the drilling programs are summarized in Table 10.1. Drill hole collar locations are shown on Figure 10.1.
Table 10.1 – Drill hole summary, by year Program Number Metres
2015 1 415 2016 20 9,632 2017 55 20,003 Total 76 30,150
The drilling program includes 30,150 m of exploration and delineation drilling. No other drilling was performed. Some holes tested geophysical anomalies identified by the 2016 OreVision® survey in the Pontiac Group, south of the existing resources.
Exploration drilling in 2015 to September 2017 aimed to better define the mineralized zones between surface to 550 m below surface and in the area of Zone F, Zone 36 and Kewagama. The program was planned to better understand the geological model and to extend the previously interpreted mineralized zones laterally and at depth. This drilling was ongoing at the filing date of this report. Results of the drilling appear to confirm the continuity of the geological model as currently interpreted.
Holes OB-17-42, OB-17-43, OB-17-45 to OB-17-49 and OB-17-52 (3,451 m) were drilled in the Vintage Zone for a total of 3,451 m in order to test mineralized zones and gold-bearing iron formations identified in historical drill holes. They all intersected mineralization along a corridor approximately 85 to 100 m directly north of the Cadillac–Larder Lake Fault Zone (Radisson press release of October 25, 2017).
Holes OB-17-33, OB-17-36, OB-17-39, OB-17-41 and OB-17-51 (2,346 m) were drilled to test OreVision® anomalies identified by the 2016 survey. Most intersected minor near-surface sulphide mineralization with marginal gold grades that might explain the geophysical anomalies.
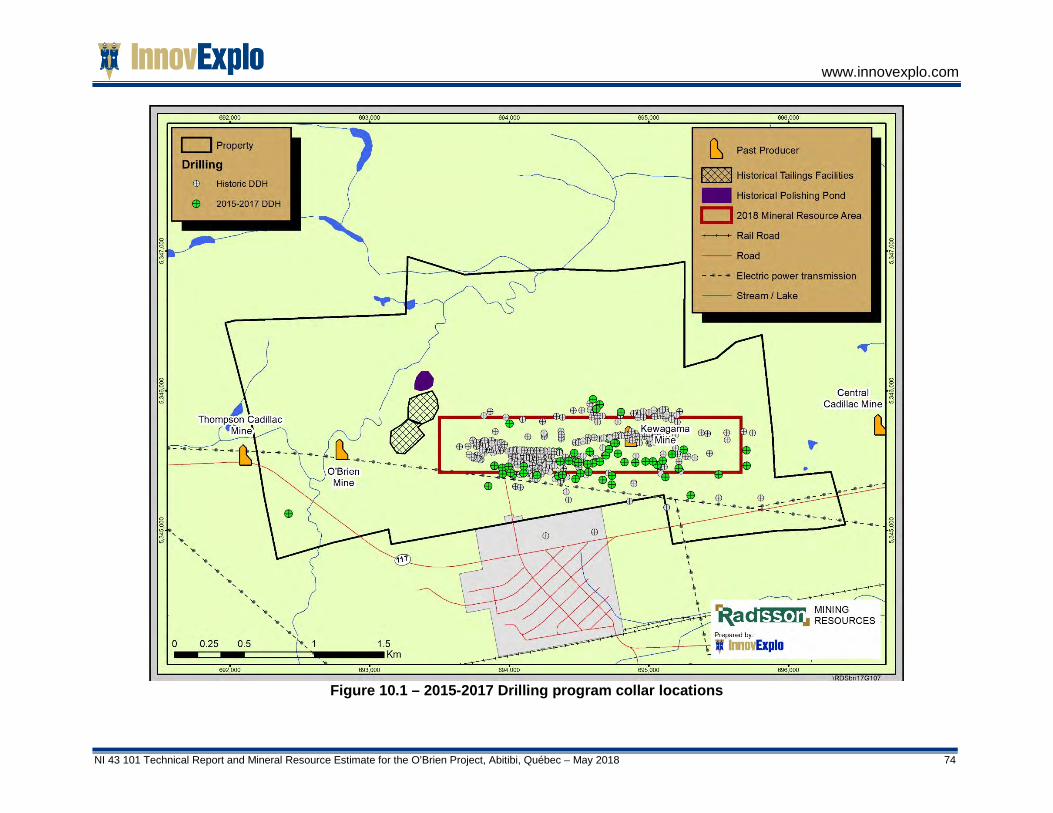
www.innovexplo.com
NI 43 101 Technical Report and Mineral Resource Estimate for the O’Brien Project, Abitibi, Québec – May 2018 74
Figure 10.1 – 2015-2017 Drilling program collar locations
www.innovexplo.com
NI 43 101 Technical Report and Mineral Resource Estimate for the O’Brien Project, Abitibi, Québec – May 2018 75
11. SAMPLE PREPARATION, ANALYSES AND SECURITY The following paragraphs describe the Radisson sample preparation, analysis and security procedures for its diamond drilling programs in 2015, 2016 and 2017, up to drill hole OB-17-62, which was the last hole considered in the current resource estimate. The information was provided by the geology team at the O’Brien Project. InnovExplo reviewed the QA/QC procedures and results for the 2016 to September 2017 drilling programs. The reader is referred to Richard et al. (2015) for details on the 2015 program.
Core handling, Sampling and Security Core boxes are received on a daily basis at the core shack on the Project. Drill core is logged and sampled by experienced and qualified geologists or by a geologist-in-training under the supervision of a qualified geologist. Samples usually range from 0.5 m to 1.0 m in length and, whenever possible, sample contacts respect lithological contacts, the appearance of mineralization, and changes in alteration type, vein type or vein density. Sampled core intervals are identified by geologists with marks on the core and sample tags placed at the end of the interval. Core samples are sawed in half (NQ core diameter). Sawing is carried out by an experienced technician who follows the geologist’s markings using an electric core saw. One half of the core is placed in a plastic bag with the matching sample tag while the other half is replaced in the core box and stored for future reference. Individual sample bags are placed in rice bags along with the list of samples, and samples are usually shipped to the laboratory once a drill hole has been fully sampled. The laboratories usually offer their own transport service. In rare cases, a commercial carrier, such as RP Express or Manitoulin Transport, is used.
Laboratories Accreditation and Certification The International Organization for Standardization (“ISO”) and the International Electrotechnical Commission (“IEC”) form the specialized system for worldwide standardization. ISO/IEC 17025 General Requirements for the Competence of Testing and Calibration Laboratories sets out the criteria for laboratories wishing to demonstrate that they are technically competent, operating an effective quality system, and able to generate technically valid calibration and test results. The standard forms the basis for the accreditation of competence of laboratories by accreditation bodies. ISO 9001 applies to management support, procedures, internal audits and corrective actions. It provides a framework for existing quality functions and procedures.
For the 2016-2017 drilling program, samples were prepared at the sample preparation facilities of Swastika Laboratories Ltd (“Swastika”) in Swastika, Ontario, and Activation Laboratories Ltd (“ActLabs”) in Val-d’Or, Québec. Actlabs sent the prepared samples to their assay facility in Ste-Germaine-Boulé (herein referred to by “Techni-Lab”) whereas Swastika does sample preparation and assaying at the same facility. Both are commercial laboratories independent of Radisson with no interests in the Project. Both laboratories received ISO/IEC 17025 accreditation through the Standards Council of Canada (“SCC”).

www.innovexplo.com
NI 43 101 Technical Report and Mineral Resource Estimate for the O’Brien Project, Abitibi, Québec – May 2018 76
Laboratory Preparation and Assays
11.3.1 Techni-Lab
• Samples are dried to 60°C and then crushed to 80% passing 8 mesh and split to 250 g using a Jones riffle splitter or rotary split. The subsample is pulverized to 90% passing 200 mesh.
• Core samples are analyzed by fire assay with AA from 30 g pulps (TMT-G5B). The lower detection limit is 8 ppb.
• When assay results are higher than 5 g/t Au, core sample pulps are re-assayed by FA with gravimetric finish (TMT-G5C).
• If visible gold is observed, the sample is sent for metallic sieve. In that case, the entire sample is pulverized and assayed;
• Assay results are provided as Excel spreadsheets.
11.3.2 Swastika
• Samples are weighed upon receipt (implemented during the 2017 drilling program when the issuer switched to Swastika).
• Samples are dried to 80°C and then crushed to >80% passing 1,700 microns and split to 250 g using a rotary split. The subsample is pulverized to >90% passing 107 microns.
• Core samples are analyzed by fire assay with atomic absorption spectroscopy (AA) from 30 g pulps. The lower detection limit is 0.01 g/t.
• When assay results are higher than 5 g/t Au, core sample pulps are re-assayed by fire assay with gravimetric finish.
• If visible gold is observed, the sample is sent for metallic sieve. In that case, the entire sample is pulverized and assayed;
• Assay results are provided as Excel spreadsheets.
Quality Assurance and Quality Control (QA/QC) The issuer’s QA/QC program for drill core includes the insertion of blanks and standards in the flow stream of core samples. For each group of 20 samples, the issuer inserted one blank and one standard.
Both laboratories have their own internal QA/QC program. At Techni-Lab, one blank and one standard are inserted every 13 samples. At Swastika, one blank and one standard are inserted every 20 samples.
The discussion below details the results of the blanks and standards inserted as part of the issuer’s QA/QC program only.
11.4.1 Blank samples The field blank for the 2015 to September 2017 drilling program was derived from barren rock (crushed decorative marble). Each sample of the blank material was placed into a plastic sample bag and given a sample identification number. Blanks were sent to both laboratories used.
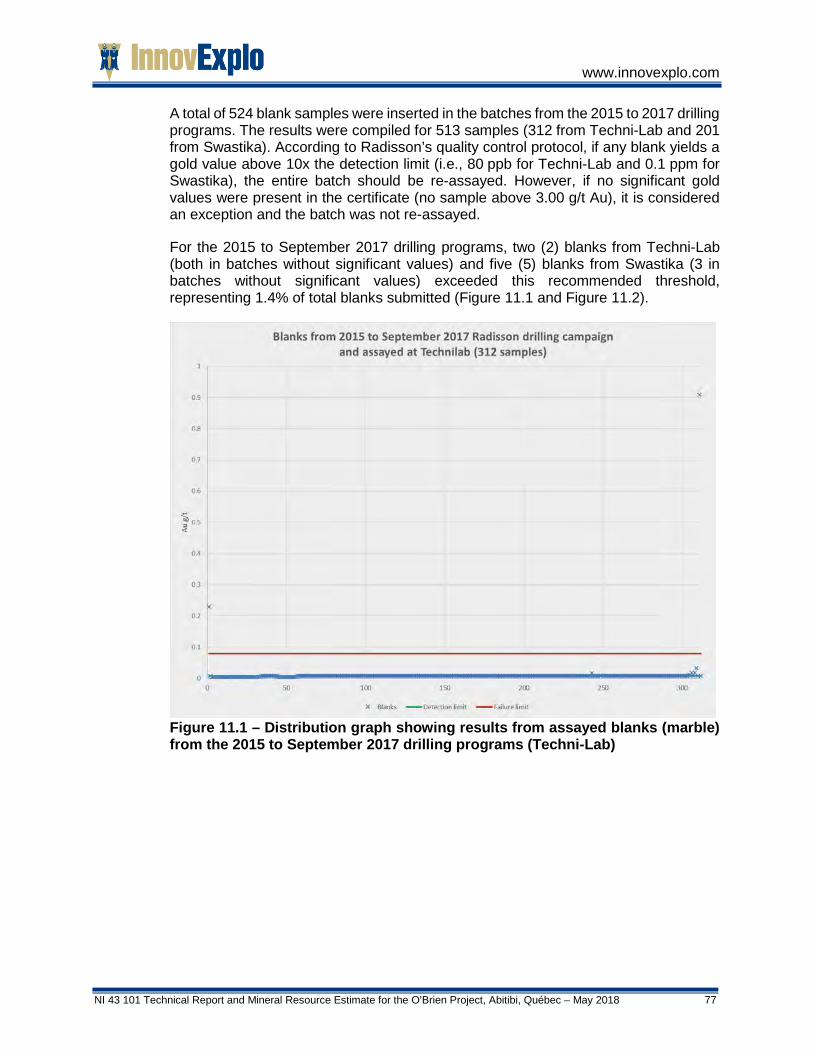
www.innovexplo.com
NI 43 101 Technical Report and Mineral Resource Estimate for the O’Brien Project, Abitibi, Québec – May 2018 77
A total of 524 blank samples were inserted in the batches from the 2015 to 2017 drilling programs. The results were compiled for 513 samples (312 from Techni-Lab and 201 from Swastika). According to Radisson’s quality control protocol, if any blank yields a gold value above 10x the detection limit (i.e., 80 ppb for Techni-Lab and 0.1 ppm for Swastika), the entire batch should be re-assayed. However, if no significant gold values were present in the certificate (no sample above 3.00 g/t Au), it is considered an exception and the batch was not re-assayed.
For the 2015 to September 2017 drilling programs, two (2) blanks from Techni-Lab (both in batches without significant values) and five (5) blanks from Swastika (3 in batches without significant values) exceeded this recommended threshold, representing 1.4% of total blanks submitted (Figure 11.1 and Figure 11.2).
Figure 11.1 – Distribution graph showing results from assayed blanks (marble) from the 2015 to September 2017 drilling programs (Techni-Lab)

www.innovexplo.com
NI 43 101 Technical Report and Mineral Resource Estimate for the O’Brien Project, Abitibi, Québec – May 2018 78
Figure 11.2 – Distribution graph showing results from assayed blanks (marble) from the 2015 to September 2017 drilling program (Swastika)
11.4.2 Standards Accuracy was monitored by inserting standards. Standards are used to detect assays problems with specific sample batches and long-term biases in the overall dataset. The definition of a quality control failure is when assays for a standard are outside three standard deviations (3SD). If two consecutive standards are outside 2SD, it is also considered problematic. Outliers are excluded from the calculation of the standard deviation.
Five (5) different certified reference materials (CRMs) were used as standards for the 2015 to September 2017 drilling programs. The CRMs were randomly inserted in sample batches. Table 11.1 shows the details for each CRM.
According to quality control protocols, a batch should be re-analyzed if its standard yields a gold value above or below 3SD of the standard’s grade (i.e., an outlier) unless the certificate contains no significant value (no sample above 3.00 g/t Au). Applying such criteria to the Radisson database, InnovExplo determined that some batches warrant re-analysis (Table 11.1).
It should be noted that five (5) of the failed standards, all from Techni-Lab, can probably be attributed to insertion errors since the grades match the recommended grades of other CRMs: one CRM-02, two CRM-04 and two CRM-05. One of the three batches with a failed CRM-02 standard from Swastika contained significant values (> 3.00 g/t Au).

www.innovexplo.com
NI 43 101 Technical Report and Mineral Resource Estimate for the O’Brien Project, Abitibi, Québec – May 2018 79
Table 11.1 – Summary of batches with failed standards during the 2015 to September 2017 Radisson drilling programs
Note: The number in parenthesis in the “count failure” column the number of batches for the failed standards that
contain significant values (> 3.00 g/t Au).
Conclusions on the QA/QC for the 2017 drilling campaign A statistical analysis of the QA/QC data provided by Radisson revealed some analytical issues.
Of the 513 results for blanks received before the database close-out date, seven (7) blanks returned values higher than the accepted threshold (up to 0.909 g/t Au), although five (5) were contained in a batch without significant values. This may suggest contamination during sample preparation at the laboratory. The other two certificates with the failed blanks should be re-assayed.
A review is recommended of all batches with significant gold values in which a CRM failed to return an acceptable value. Where the reason for such failure cannot be explained or if the explanation warrants it, the entire batch should be re-assayed.
An insertion protocol for field duplicates should be considered for a project at this stage of exploration. Also, the insertion of reject and pulp duplicates should be considered given the nature of gold at the Project (coarse gold). The nugget effect would be easier to qualify with this kind of protocol.
InnovExplo is in the opinion that the sample preparation, analysis and security procedures and QA/QC protocols used by Radisson for the O’Brien Project are appropriate for an advanced exploration program. Duplicates should also be implemented to complete the QA/QC coverage.
AllExcl. Gross
outliersAll
Excl. Gross outliers
2SD 3SD 2SD 3SD +/-2SD +/-3SD
CRM-01 Technilab 5 5 0.99 0.99 3.6 3.6 0.92 0.88 1.06 1.10 0 0 100.0% 100.0% 0CRM-02 Technilab 218 213 1.03 1.01 6.9 2.8 0.93 0.88 1.10 1.15 7 2 95.8% 99.1% 2CRM-02 Swastika 159 159 0.98 0.98 2.6 2.6 0.91 0.87 1.05 1.09 4 0 97.5% 98.1% 3 (1)CRM-03 Technilab 11 10 5.93 5.93 3.5 3.5 5.63 5.47 6.24 6.39 0 0 100.0% 100.0% 0CRM-04 Technilab 55 53 6.03 5.88 12.4 3 5.51 5.33 6.26 6.44 0 2 92.5% 96.2% 2CRM-04 Swastika 33 33 5.70 5.70 2.1 2.1 5.48 5.37 5.93 6.04 0 0 97.0% 100.0% 0CRM-05 Technilab 41 39 17.47 18.22 10.2 2.5 17.16 16.63 19.28 19.81 0 2 92.3% 94.9% 2CRM-05 Swastika 17 17 17.58 17.58 1.3 1.3 17.04 16.77 18.12 18.39 0 0 100.0% 100.0% 0
LabQuantity inserted
Quantity in graph
Average of results (g/t Au)ID
# count failure
(+/- 3SD)Outliers
Gross outliers
Precision (%) Passing quality control (%)
Lower process limit
Upper process limit
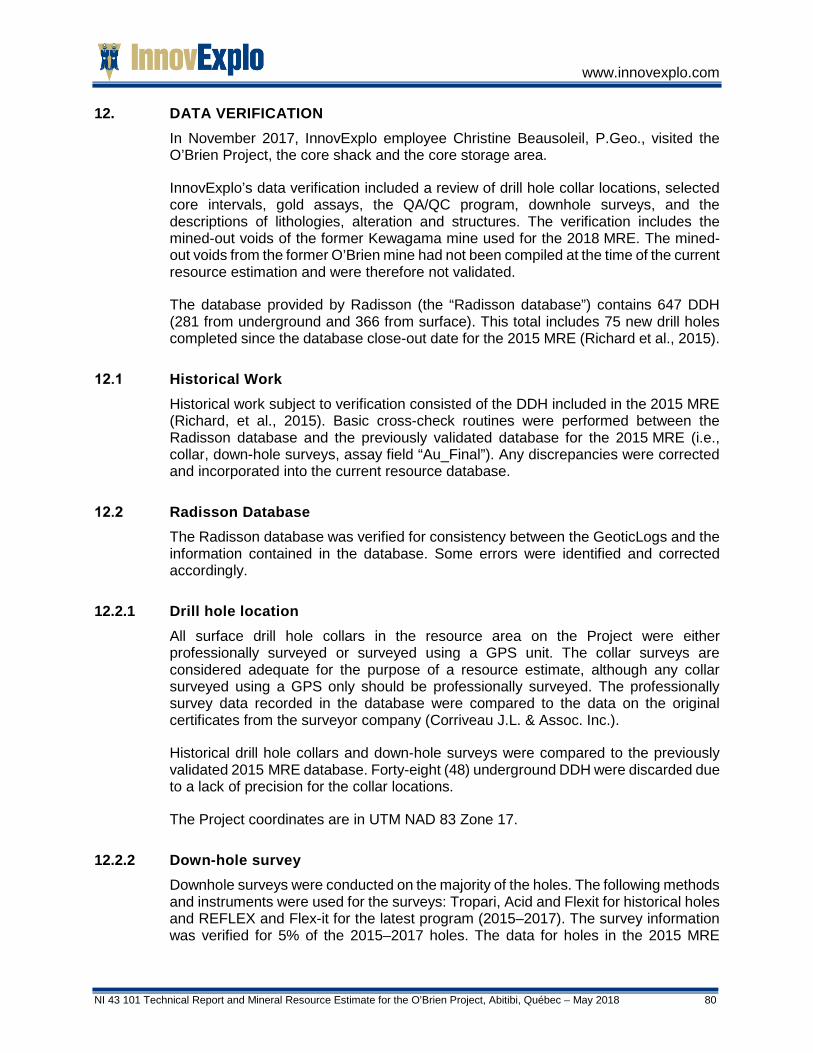
www.innovexplo.com
NI 43 101 Technical Report and Mineral Resource Estimate for the O’Brien Project, Abitibi, Québec – May 2018 80
12. DATA VERIFICATION In November 2017, InnovExplo employee Christine Beausoleil, P.Geo., visited the O’Brien Project, the core shack and the core storage area.
InnovExplo’s data verification included a review of drill hole collar locations, selected core intervals, gold assays, the QA/QC program, downhole surveys, and the descriptions of lithologies, alteration and structures. The verification includes the mined-out voids of the former Kewagama mine used for the 2018 MRE. The mined-out voids from the former O’Brien mine had not been compiled at the time of the current resource estimation and were therefore not validated.
The database provided by Radisson (the “Radisson database”) contains 647 DDH (281 from underground and 366 from surface). This total includes 75 new drill holes completed since the database close-out date for the 2015 MRE (Richard et al., 2015).
Historical Work Historical work subject to verification consisted of the DDH included in the 2015 MRE (Richard, et al., 2015). Basic cross-check routines were performed between the Radisson database and the previously validated database for the 2015 MRE (i.e., collar, down-hole surveys, assay field “Au_Final”). Any discrepancies were corrected and incorporated into the current resource database.
Radisson Database The Radisson database was verified for consistency between the GeoticLogs and the information contained in the database. Some errors were identified and corrected accordingly.
12.2.1 Drill hole location All surface drill hole collars in the resource area on the Project were either professionally surveyed or surveyed using a GPS unit. The collar surveys are considered adequate for the purpose of a resource estimate, although any collar surveyed using a GPS only should be professionally surveyed. The professionally survey data recorded in the database were compared to the data on the original certificates from the surveyor company (Corriveau J.L. & Assoc. Inc.).
Historical drill hole collars and down-hole surveys were compared to the previously validated 2015 MRE database. Forty-eight (48) underground DDH were discarded due to a lack of precision for the collar locations.
The Project coordinates are in UTM NAD 83 Zone 17.
12.2.2 Down-hole survey Downhole surveys were conducted on the majority of the holes. The following methods and instruments were used for the surveys: Tropari, Acid and Flexit for historical holes and REFLEX and Flex-it for the latest program (2015–2017). The survey information was verified for 5% of the 2015–2017 holes. The data for holes in the 2015 MRE
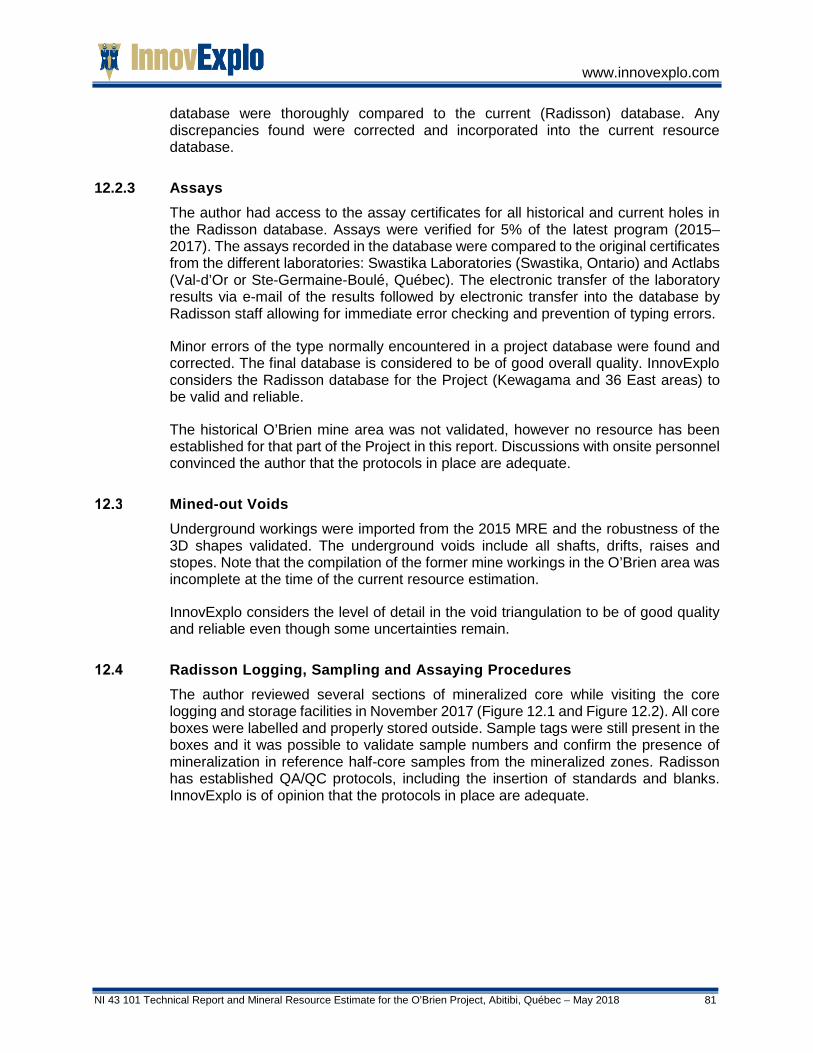
www.innovexplo.com
NI 43 101 Technical Report and Mineral Resource Estimate for the O’Brien Project, Abitibi, Québec – May 2018 81
database were thoroughly compared to the current (Radisson) database. Any discrepancies found were corrected and incorporated into the current resource database.
12.2.3 Assays The author had access to the assay certificates for all historical and current holes in the Radisson database. Assays were verified for 5% of the latest program (2015–2017). The assays recorded in the database were compared to the original certificates from the different laboratories: Swastika Laboratories (Swastika, Ontario) and Actlabs (Val-d’Or or Ste-Germaine-Boulé, Québec). The electronic transfer of the laboratory results via e-mail of the results followed by electronic transfer into the database by Radisson staff allowing for immediate error checking and prevention of typing errors.
Minor errors of the type normally encountered in a project database were found and corrected. The final database is considered to be of good overall quality. InnovExplo considers the Radisson database for the Project (Kewagama and 36 East areas) to be valid and reliable.
The historical O’Brien mine area was not validated, however no resource has been established for that part of the Project in this report. Discussions with onsite personnel convinced the author that the protocols in place are adequate.
Mined-out Voids Underground workings were imported from the 2015 MRE and the robustness of the 3D shapes validated. The underground voids include all shafts, drifts, raises and stopes. Note that the compilation of the former mine workings in the O’Brien area was incomplete at the time of the current resource estimation.
InnovExplo considers the level of detail in the void triangulation to be of good quality and reliable even though some uncertainties remain.
Radisson Logging, Sampling and Assaying Procedures The author reviewed several sections of mineralized core while visiting the core logging and storage facilities in November 2017 (Figure 12.1 and Figure 12.2). All core boxes were labelled and properly stored outside. Sample tags were still present in the boxes and it was possible to validate sample numbers and confirm the presence of mineralization in reference half-core samples from the mineralized zones. Radisson has established QA/QC protocols, including the insertion of standards and blanks. InnovExplo is of opinion that the protocols in place are adequate.
www.innovexplo.com
NI 43 101 Technical Report and Mineral Resource Estimate for the O’Brien Project, Abitibi, Québec – May 2018 82
Figure 12.1 – Logging facility visited in November 2017
Figure 12.2 – Outdoor core storage site visited in November 2017

www.innovexplo.com
NI 43 101 Technical Report and Mineral Resource Estimate for the O’Brien Project, Abitibi, Québec – May 2018 83
Conclusion Overall, InnovExplo is of the opinion that the data verification process demonstrates the validity of the data and protocols for the Kewagama and 36 East areas of the Project. InnovExplo considers the Radisson database to be valid and of sufficient quality to be used for the mineral resource estimate herein.
www.innovexplo.com
NI 43 101 Technical Report and Mineral Resource Estimate for the O’Brien Project, Abitibi, Québec – May 2018 84
13. MINERAL PROCESSING AND METALLURGICAL TESTING No metallurgical testwork has been performed by the issuer since the testwork reported in the PEA of Poirier et al., 2016 (Item 6 for a summary).
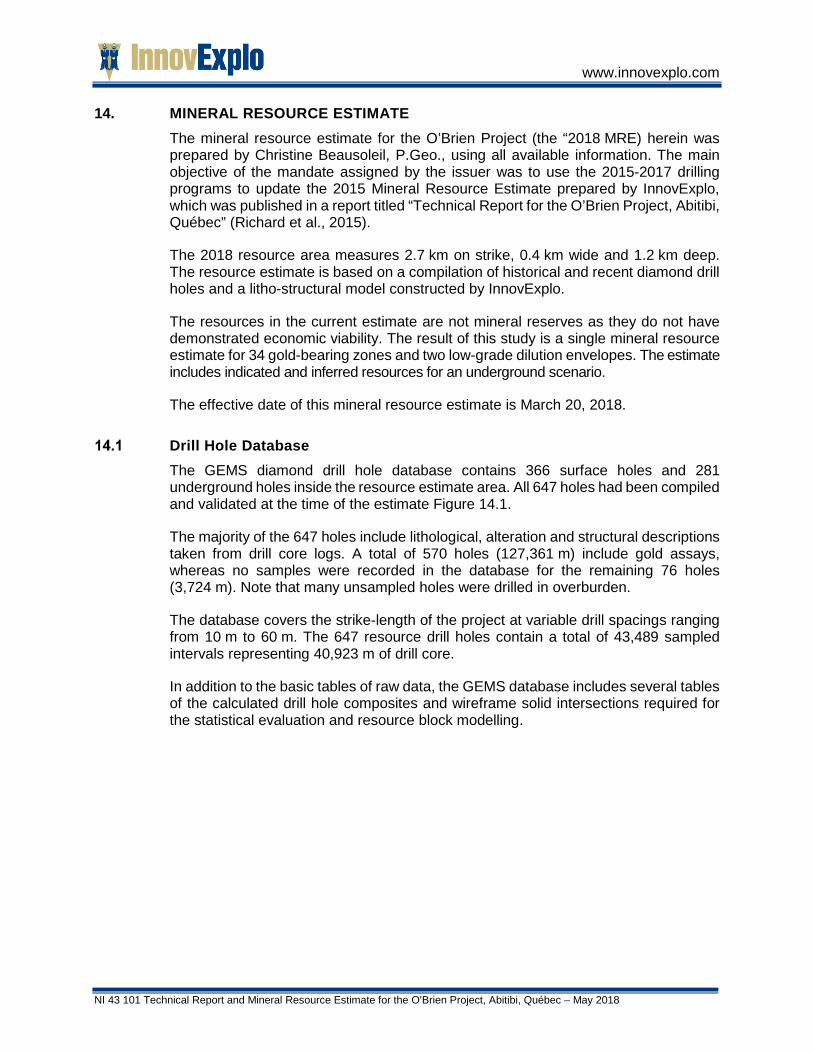
www.innovexplo.com
NI 43 101 Technical Report and Mineral Resource Estimate for the O’Brien Project, Abitibi, Québec – May 2018
14. MINERAL RESOURCE ESTIMATE The mineral resource estimate for the O’Brien Project (the “2018 MRE) herein was prepared by Christine Beausoleil, P.Geo., using all available information. The main objective of the mandate assigned by the issuer was to use the 2015-2017 drilling programs to update the 2015 Mineral Resource Estimate prepared by InnovExplo, which was published in a report titled “Technical Report for the O’Brien Project, Abitibi, Québec” (Richard et al., 2015).
The 2018 resource area measures 2.7 km on strike, 0.4 km wide and 1.2 km deep. The resource estimate is based on a compilation of historical and recent diamond drill holes and a litho-structural model constructed by InnovExplo.
The resources in the current estimate are not mineral reserves as they do not have demonstrated economic viability. The result of this study is a single mineral resource estimate for 34 gold-bearing zones and two low-grade dilution envelopes. The estimate includes indicated and inferred resources for an underground scenario.
The effective date of this mineral resource estimate is March 20, 2018.
Drill Hole Database The GEMS diamond drill hole database contains 366 surface holes and 281 underground holes inside the resource estimate area. All 647 holes had been compiled and validated at the time of the estimate Figure 14.1.
The majority of the 647 holes include lithological, alteration and structural descriptions taken from drill core logs. A total of 570 holes (127,361 m) include gold assays, whereas no samples were recorded in the database for the remaining 76 holes (3,724 m). Note that many unsampled holes were drilled in overburden.
The database covers the strike-length of the project at variable drill spacings ranging from 10 m to 60 m. The 647 resource drill holes contain a total of 43,489 sampled intervals representing 40,923 m of drill core.
In addition to the basic tables of raw data, the GEMS database includes several tables of the calculated drill hole composites and wireframe solid intersections required for the statistical evaluation and resource block modelling.
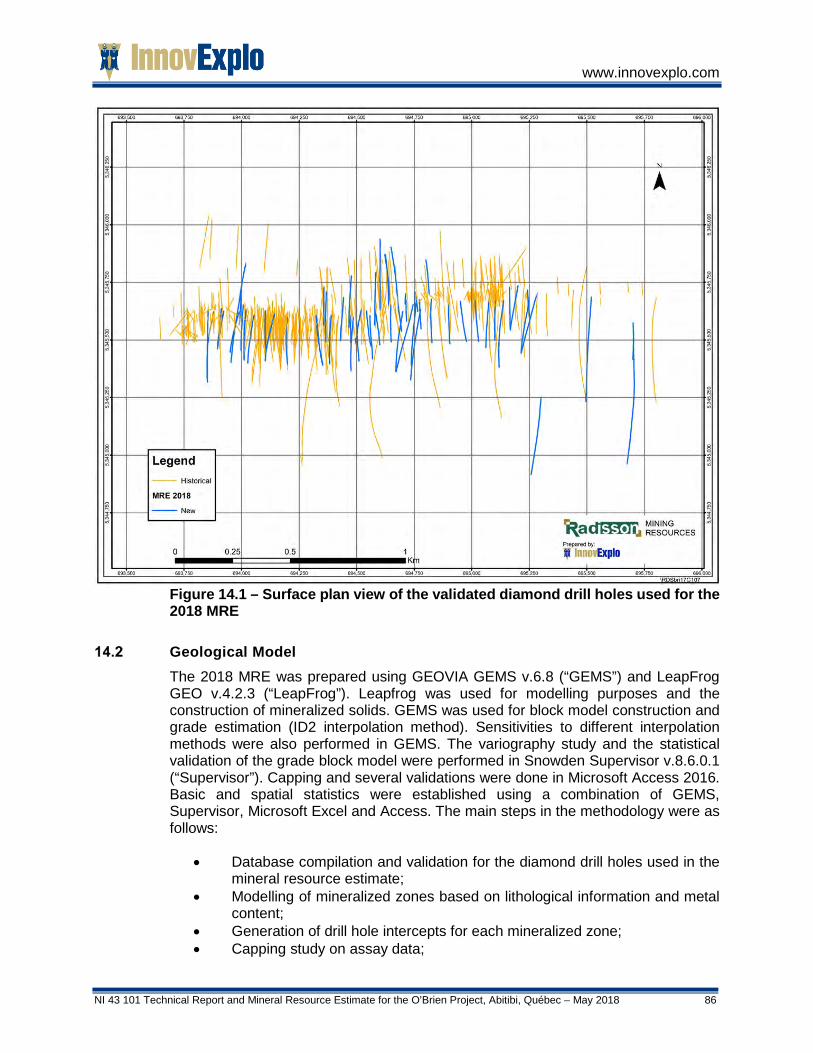
www.innovexplo.com
NI 43 101 Technical Report and Mineral Resource Estimate for the O’Brien Project, Abitibi, Québec – May 2018 86
Figure 14.1 – Surface plan view of the validated diamond drill holes used for the 2018 MRE
Geological Model The 2018 MRE was prepared using GEOVIA GEMS v.6.8 (“GEMS”) and LeapFrog GEO v.4.2.3 (“LeapFrog”). Leapfrog was used for modelling purposes and the construction of mineralized solids. GEMS was used for block model construction and grade estimation (ID2 interpolation method). Sensitivities to different interpolation methods were also performed in GEMS. The variography study and the statistical validation of the grade block model were performed in Snowden Supervisor v.8.6.0.1 (“Supervisor”). Capping and several validations were done in Microsoft Access 2016. Basic and spatial statistics were established using a combination of GEMS, Supervisor, Microsoft Excel and Access. The main steps in the methodology were as follows:
• Database compilation and validation for the diamond drill holes used in the mineral resource estimate;
• Modelling of mineralized zones based on lithological information and metal content;
• Generation of drill hole intercepts for each mineralized zone; • Capping study on assay data;
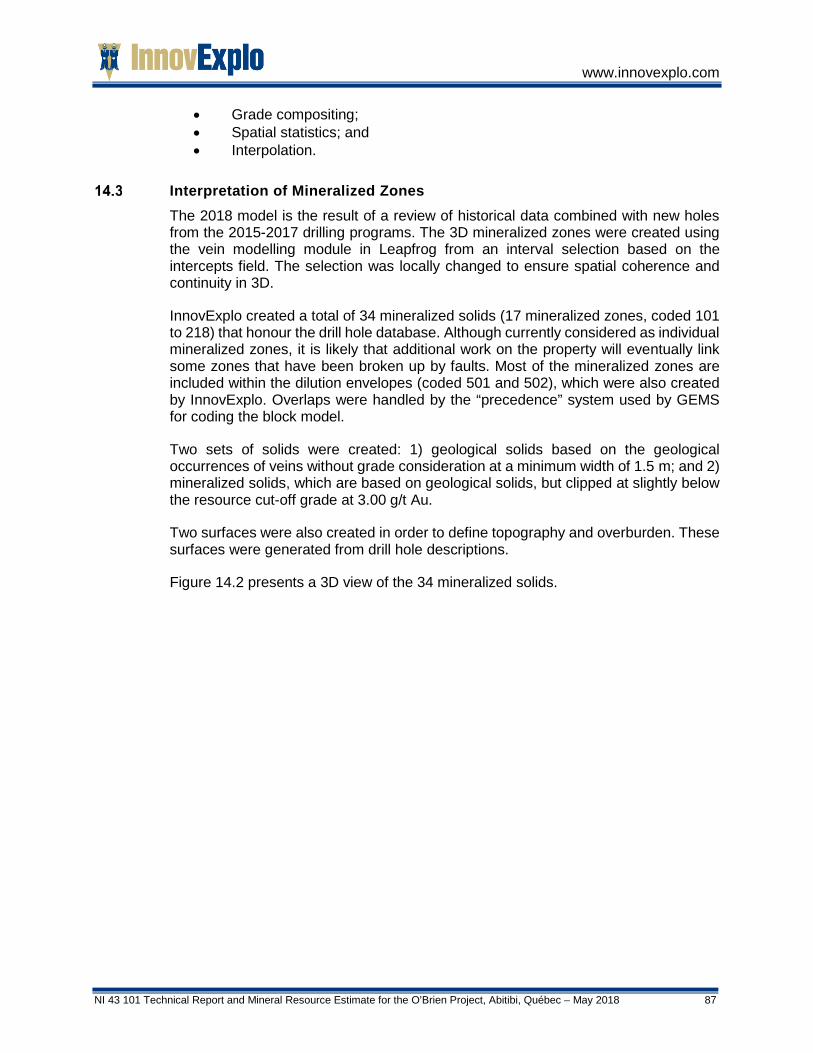
www.innovexplo.com
NI 43 101 Technical Report and Mineral Resource Estimate for the O’Brien Project, Abitibi, Québec – May 2018 87
• Grade compositing; • Spatial statistics; and • Interpolation.
Interpretation of Mineralized Zones The 2018 model is the result of a review of historical data combined with new holes from the 2015-2017 drilling programs. The 3D mineralized zones were created using the vein modelling module in Leapfrog from an interval selection based on the intercepts field. The selection was locally changed to ensure spatial coherence and continuity in 3D.
InnovExplo created a total of 34 mineralized solids (17 mineralized zones, coded 101 to 218) that honour the drill hole database. Although currently considered as individual mineralized zones, it is likely that additional work on the property will eventually link some zones that have been broken up by faults. Most of the mineralized zones are included within the dilution envelopes (coded 501 and 502), which were also created by InnovExplo. Overlaps were handled by the “precedence” system used by GEMS for coding the block model.
Two sets of solids were created: 1) geological solids based on the geological occurrences of veins without grade consideration at a minimum width of 1.5 m; and 2) mineralized solids, which are based on geological solids, but clipped at slightly below the resource cut-off grade at 3.00 g/t Au.
Two surfaces were also created in order to define topography and overburden. These surfaces were generated from drill hole descriptions.
Figure 14.2 presents a 3D view of the 34 mineralized solids.

www.innovexplo.com
NI 43 101 Technical Report and Mineral Resource Estimate for the O’Brien Project, Abitibi, Québec – May 2018 88
Figure 14.2 – 3D view of the 34 mineralized solids, looking northeast
High Grade Capping For drill hole assay intervals that intersect interpreted mineralized zones, codes were automatically attributed based on the name of the 3D solids, and these coded intercepts were used to analyze sample lengths and generate statistics for high grade capping and compositing.
Basic univariate statistics were performed on the raw assay datasets for the mineralized zones and dilution envelopes. The number of samples for each dataset were as follows: 7,273 (mineralized zones) and 36,269 (dilution envelopes).
A total of 103 samples from the mineralized zones and 63 from the dilution envelopes were capped at 30 g/t Au for the mineralized zones and 5 g/t Au for the dilution envelopes. The capping of high grades affected 1.42% of all samples within the block model. Table 14.1 presents a summary of the statistical analysis for each dataset. Figure 14.3 and Figure 14.4 present graphs supporting the capping values.
Table 14.1 – Summary statistics for the raw assays by dataset
100 m
www.innovexplo.com
NI 43 101 Technical Report and Mineral Resource Estimate for the O’Brien Project, Abitibi, Québec – May 2018 89
Figure 14.3 – Different graphs supporting a capping grade of 30 g/t Au for the mineralized zones
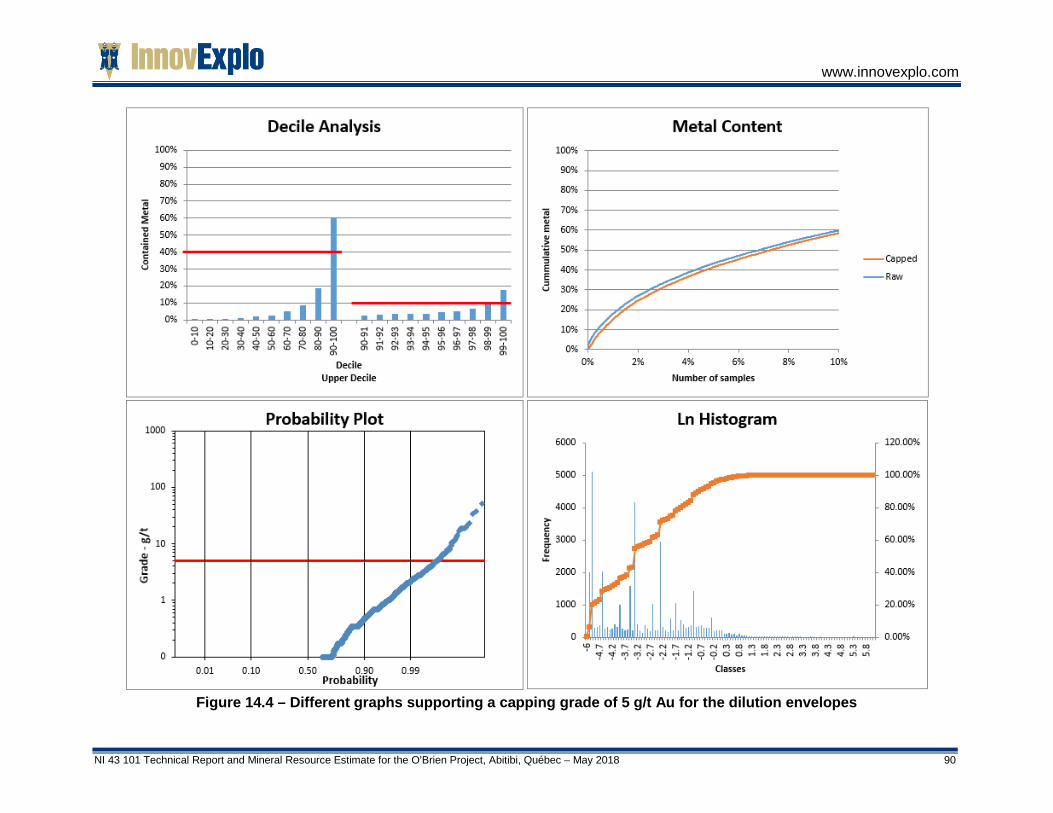
www.innovexplo.com
NI 43 101 Technical Report and Mineral Resource Estimate for the O’Brien Project, Abitibi, Québec – May 2018 90
Figure 14.4 – Different graphs supporting a capping grade of 5 g/t Au for the dilution envelopes
www.innovexplo.com
NI 43 101 Technical Report and Mineral Resource Estimate for the O’Brien Project, Abitibi, Québec – May 2018 91
Underground Voids Underground voids remain the same as those used for the 2015 MRE. They were validated for any discrepancies or construction errors. They represent the voids in the 36 East and Kewagama areas. The compilation for the former O’Brien mine was incomplete at the time this resource estimate was being produced.
These voids were coded, and the block model depleted accordingly.
Figure 14.5 presents a 3D view of the underground voids considered in the 2015 MRE and used for the 2018 MRE herein.

www.innovexplo.com
NI 43 101 Technical Report and Mineral Resource Estimate for the O’Brien Project, Abitibi, Québec – May 2018 92
Figure 14.5 – 3D view of the underground workings in the 36 East and Kewagama areas in relation to resource blocks (red), looking northeast. Note that the compilation of the underground workings to the west (former O’Brien mine) is incomplete.
100 m
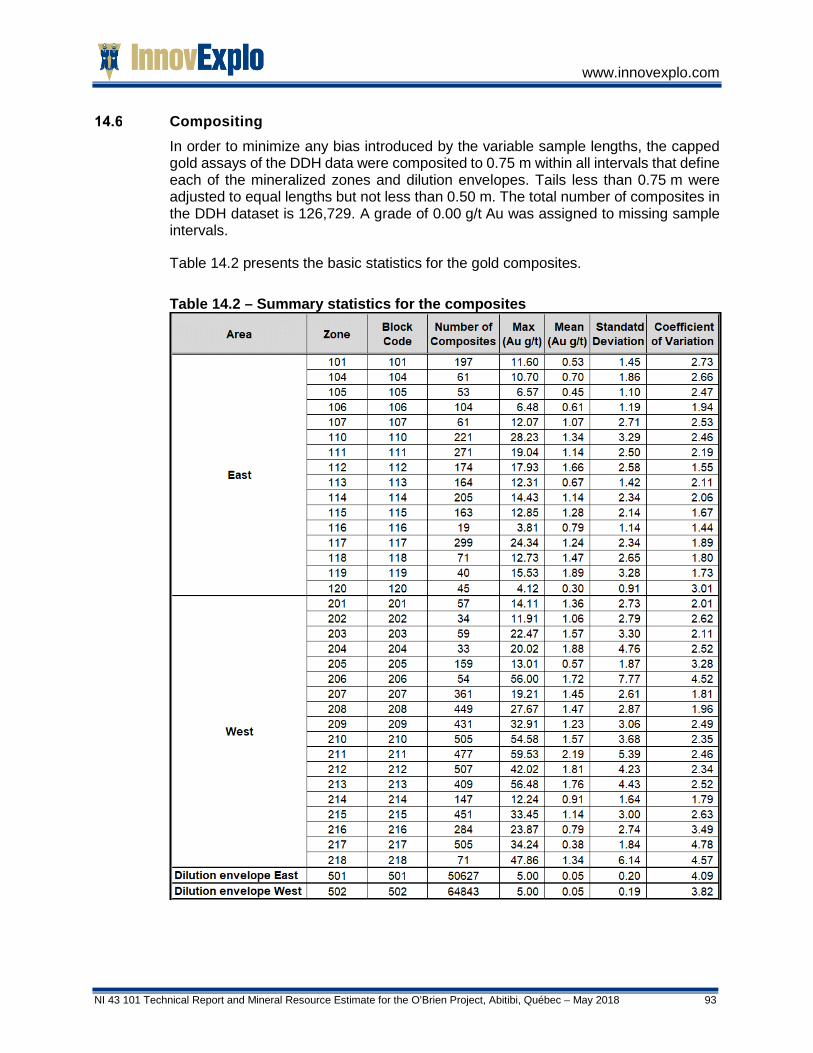
www.innovexplo.com
NI 43 101 Technical Report and Mineral Resource Estimate for the O’Brien Project, Abitibi, Québec – May 2018 93
Compositing In order to minimize any bias introduced by the variable sample lengths, the capped gold assays of the DDH data were composited to 0.75 m within all intervals that define each of the mineralized zones and dilution envelopes. Tails less than 0.75 m were adjusted to equal lengths but not less than 0.50 m. The total number of composites in the DDH dataset is 126,729. A grade of 0.00 g/t Au was assigned to missing sample intervals.
Table 14.2 presents the basic statistics for the gold composites.
Table 14.2 – Summary statistics for the composites

www.innovexplo.com
NI 43 101 Technical Report and Mineral Resource Estimate for the O’Brien Project, Abitibi, Québec – May 2018 94
Density The drill hole database contains limited information on density.
Historical mineral resource estimates used a tonnage factor of 12.0 cubic feet per short ton (ft3/ton). The metric equivalent of a tonnage factor of 12.0 ft3/ton is a density factor of approximately 2.67 g/cm3. However, it is believed that 2.67 is slightly too low based on the mineralogy of the mineralization. The author selected 2.75 g/cm3 for the current resource estimate based on known mineralogy, validated by photographs and descriptions compiled during the data verification process.
Table 14.3 illustrates how a density factor of approximately 2.75 g/cm3 is more appropriate based on the typical mineralogy encountered in the deposit.
Table 14.3 – Mineral density factors and relative abundance in O’Brien Project mineralization
A density of 2.00 g/cm3 was assigned to overburden, and 1.00 g/cm3 was assigned to underground workings.
Bulk densities were used to calculate tonnages from the volume estimates in the resource-grade block model.
Block Model A block model was established for the mineralized zones and dilution envelopes. The block model covers an area sufficiently large to host an open-pit if necessary. The model has been pushed down to a depth of approximately 1,700 m below surface. The block model was not rotated (Y-axis oriented along a N000 azimuth). Block dimensions reflect the sizes of mineralized zones and plausible mining methods. Table 14.4 presents the properties of the block model.
Table 14.4 – Block model properties
Mineral Specific Gravity (Dana, 1958) Relative Abondance (%)Quartz 2.65 - 2.66 87Biotite 2.80 - 3.20 5Calcite 2.72 5Arsenopyrite 5.90 - 6.20 2Pyrite 4.95 - 5.10 1

www.innovexplo.com
NI 43 101 Technical Report and Mineral Resource Estimate for the O’Brien Project, Abitibi, Québec – May 2018 95
All blocks with more than 0.001% of their volume falling within a selected solid were assigned the corresponding solid block code in their respective folder. A percent block model was generated, reflecting the proportion of each block inside every solid (each individual mineralized zone, individual dilution envelope, overburden, country rock, underground voids). Precedence was respected during the process.
Table 14.5 provides details about the naming convention for the corresponding GEMS solids, as well as the rock codes and block codes assigned to each individual solid. The multi-folder percent block model thus generated was used in the mineral resource estimation.
Table 14.5 – Block model
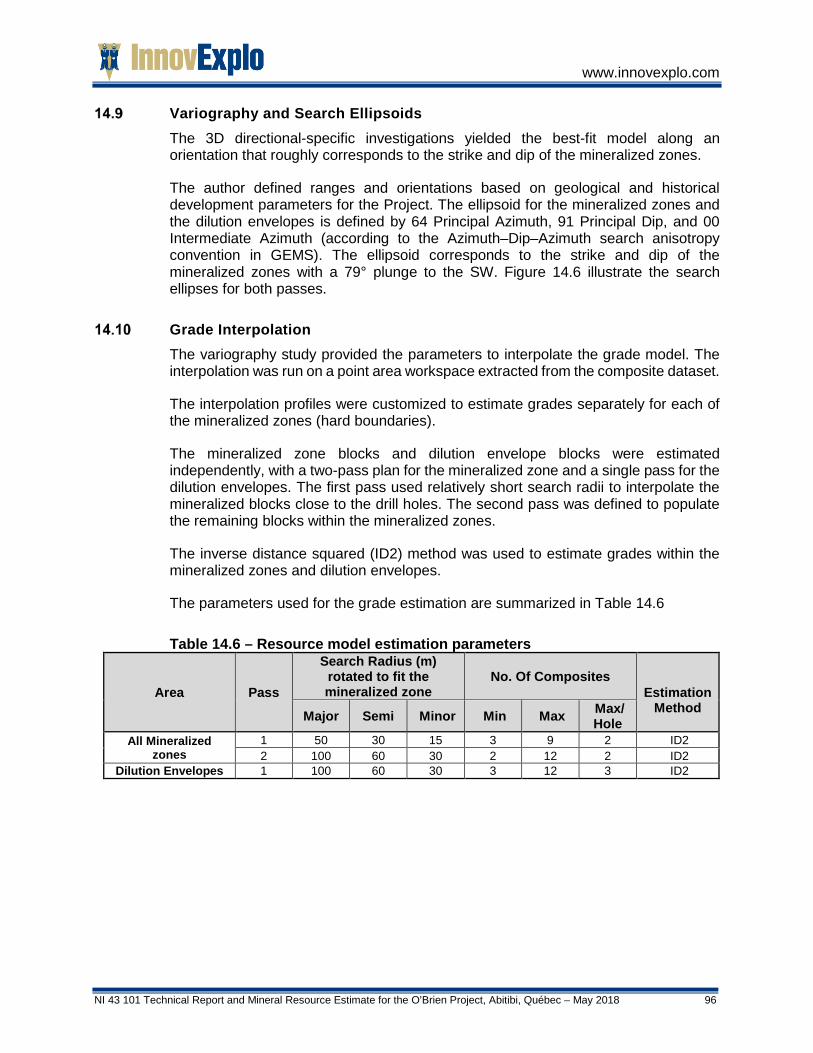
www.innovexplo.com
NI 43 101 Technical Report and Mineral Resource Estimate for the O’Brien Project, Abitibi, Québec – May 2018 96
Variography and Search Ellipsoids The 3D directional-specific investigations yielded the best-fit model along an orientation that roughly corresponds to the strike and dip of the mineralized zones.
The author defined ranges and orientations based on geological and historical development parameters for the Project. The ellipsoid for the mineralized zones and the dilution envelopes is defined by 64 Principal Azimuth, 91 Principal Dip, and 00 Intermediate Azimuth (according to the Azimuth–Dip–Azimuth search anisotropy convention in GEMS). The ellipsoid corresponds to the strike and dip of the mineralized zones with a 79° plunge to the SW. Figure 14.6 illustrate the search ellipses for both passes.
Grade Interpolation The variography study provided the parameters to interpolate the grade model. The interpolation was run on a point area workspace extracted from the composite dataset.
The interpolation profiles were customized to estimate grades separately for each of the mineralized zones (hard boundaries).
The mineralized zone blocks and dilution envelope blocks were estimated independently, with a two-pass plan for the mineralized zone and a single pass for the dilution envelopes. The first pass used relatively short search radii to interpolate the mineralized blocks close to the drill holes. The second pass was defined to populate the remaining blocks within the mineralized zones.
The inverse distance squared (ID2) method was used to estimate grades within the mineralized zones and dilution envelopes.
The parameters used for the grade estimation are summarized in Table 14.6
Table 14.6 – Resource model estimation parameters
Area Pass
Search Radius (m) rotated to fit the mineralized zone
No. Of Composites Estimation
Method Major Semi Minor Min Max Max/ Hole
All Mineralized zones
1 50 30 15 3 9 2 ID2 2 100 60 30 2 12 2 ID2
Dilution Envelopes 1 100 60 30 3 12 3 ID2

www.innovexplo.com
NI 43 101 Technical Report and Mineral Resource Estimate for the O’Brien Project, Abitibi, Québec – May 2018 97
Figure 14.6 – 3D view of Zone 1_S, looking north-northeast, showing all drill holes and the ellipsoid of Pass 1 (50m x 30m x 15m), Pass 2 (100m x 60m x 30m)
Cut-off Parameters A cut-off grade was calculated using the parameters presented in Table 14.7. The result was 3.48 g/t Au, which was rounded to 3.50 g/t Au for the official underground cut-off grade (UCoG).
Table 14.7 – Input parameters used for the underground cut-off grade estimation Input parameter Value
Gold price (US$/oz) 1,300.00 Exchange rate (USD:CAD) 1.30 Recovery (%) 87.40 Gold Price (C$/oz) 1,690.00 Gold selling costs (C$/oz) 5.00 Net gold price (C$/oz) 1,685.00 Global mining costs (C$/t) 67.50 Processing costs (C$/t) 65.00 G&A + Environmental cost (C$/t) 32.50 Total cost (C$/t) 165.00
In the author’s opinion, the selected cut-off grade of 3.50 g/t Au provides an adequate estimate based on current knowledge and is instrumental in outlining the mineral potential of the deposit for an underground mining scenario. Although the block model covers an area of reasonable size for an open pit mine, this option was not investigated as it was beyond the scope of the mandate.

www.innovexplo.com
NI 43 101 Technical Report and Mineral Resource Estimate for the O’Brien Project, Abitibi, Québec – May 2018 98
Mineral Resource Classification
14.12.1 Mineral resource classification definition The resource classification definitions used for this report are those published by the Canadian Institute of Mining, Metallurgy and Petroleum in their document “CIM Definition Standards for Mineral Resources and Reserves”.
Measured Mineral Resource: that part of a Mineral Resource for which quantity, grade or quality, densities, shape, physical characteristics are so well established that they can be estimated with confidence sufficient to allow the appropriate application of technical and economic parameters, to support production planning and evaluation of the economic viability of the deposit. The estimate is based on detailed and reliable exploration, sampling and testing information gathered through appropriate techniques from locations such as outcrops, trenches, pits, workings and drill holes that are spaced closely enough to confirm both geological and grade continuity.
Indicated Mineral Resource: that part of a Mineral Resource for which quantity, grade or quality, densities, shape and physical characteristics can be estimated with a level of confidence sufficient to allow the appropriate application of technical and economic parameters, to support mine planning and evaluation of the economic viability of the deposit. The estimate is based on detailed and reliable exploration and testing information gathered through appropriate techniques from locations such as outcrops, trenches, pits, workings and drill holes that are spaced closely enough for geological and grade continuity to be reasonably assumed.
Inferred Mineral Resource: that part of a Mineral Resource for which quantity and grade or quality can be estimated on the basis of geological evidence and limited sampling and reasonably assumed, but not verified, geological and grade continuity. The estimate is based on limited information and sampling gathered through appropriate techniques from locations such as outcrops, trenches, pits, workings and drill holes.
Due to the uncertainty that may be attached to Inferred Mineral Resources, it cannot be assumed that all or any part of an Inferred Mineral Resource will be upgraded to an Indicated or Measured Mineral Resource as a result of continued exploration. Confidence in the estimate is insufficient to allow the meaningful application of technical and economic parameters or to enable an evaluation of economic viability worthy of public disclosure. Inferred Mineral Resources must be excluded from estimates forming the basis of feasibility or other economic studies.
14.12.2 Mineral resource classification for the O’Brien Project Indicated resources were defined for blocks estimated in the first pass (minimum 2 DDH within a search radius of 50 m x 30 m x 15 m) and within 25 m of a drill hole.
Inferred resources were defined for blocks within 50 m of a drill hole with an occasional block influence as far as 60-65 m where the mineralization trend is demonstrated by multiple adjacent holes.
Measured resources were not defined for the Project.
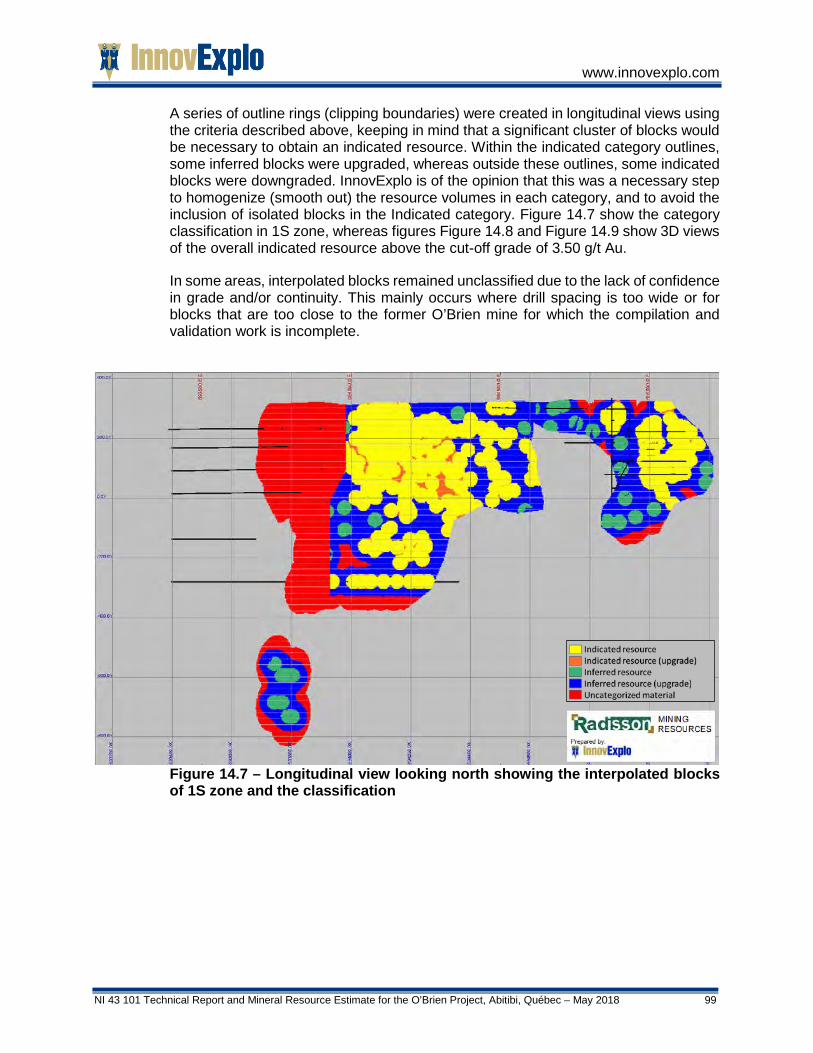
www.innovexplo.com
NI 43 101 Technical Report and Mineral Resource Estimate for the O’Brien Project, Abitibi, Québec – May 2018 99
A series of outline rings (clipping boundaries) were created in longitudinal views using the criteria described above, keeping in mind that a significant cluster of blocks would be necessary to obtain an indicated resource. Within the indicated category outlines, some inferred blocks were upgraded, whereas outside these outlines, some indicated blocks were downgraded. InnovExplo is of the opinion that this was a necessary step to homogenize (smooth out) the resource volumes in each category, and to avoid the inclusion of isolated blocks in the Indicated category. Figure 14.7 show the category classification in 1S zone, whereas figures Figure 14.8 and Figure 14.9 show 3D views of the overall indicated resource above the cut-off grade of 3.50 g/t Au.
In some areas, interpolated blocks remained unclassified due to the lack of confidence in grade and/or continuity. This mainly occurs where drill spacing is too wide or for blocks that are too close to the former O’Brien mine for which the compilation and validation work is incomplete.
Figure 14.7 – Longitudinal view looking north showing the interpolated blocks of 1S zone and the classification
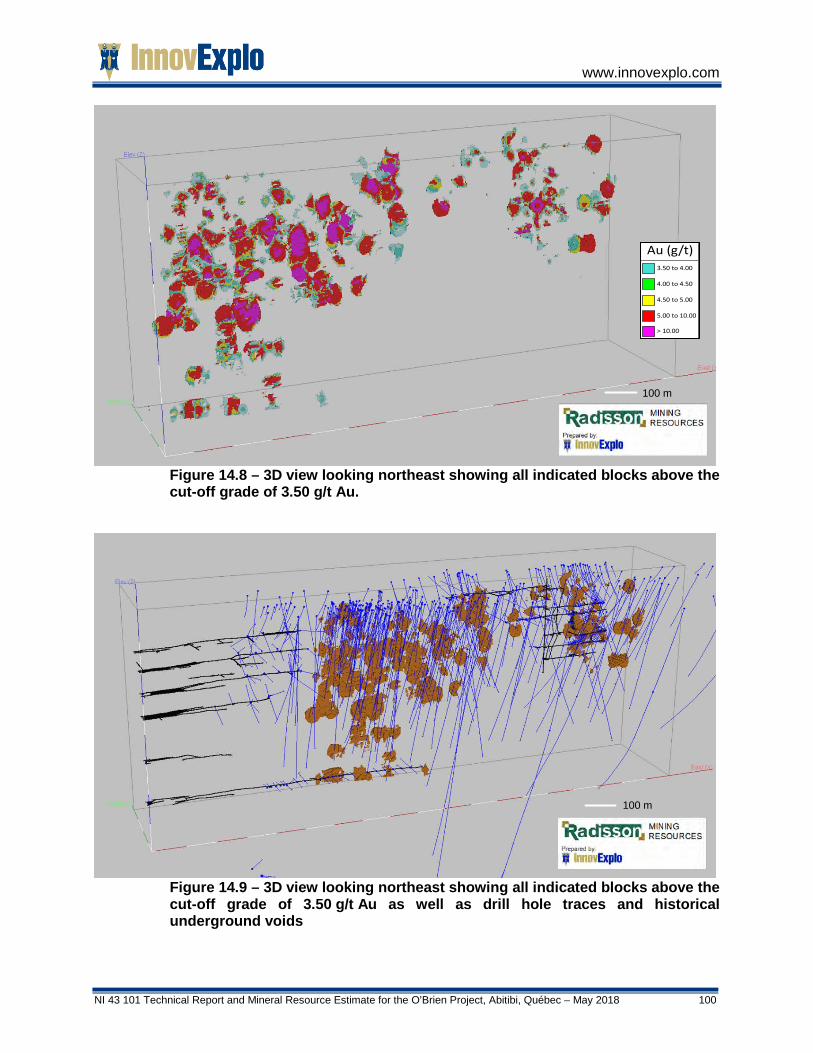
www.innovexplo.com
NI 43 101 Technical Report and Mineral Resource Estimate for the O’Brien Project, Abitibi, Québec – May 2018 100
Figure 14.8 – 3D view looking northeast showing all indicated blocks above the cut-off grade of 3.50 g/t Au.
Figure 14.9 – 3D view looking northeast showing all indicated blocks above the cut-off grade of 3.50 g/t Au as well as drill hole traces and historical underground voids
100 m
100 m
3.50 to 4.00
4.00 to 4.50
4.50 to 5.00
5.00 to 10.00
> 10.00
Au (g/t)

www.innovexplo.com
NI 43 101 Technical Report and Mineral Resource Estimate for the O’Brien Project, Abitibi, Québec – May 2018 101
Mineral Resource Estimate InnovExplo is of the opinion that the current mineral resource estimate can be categorized as Indicated and Inferred mineral resources based on data density, search ellipse criteria, drill hole density, and interpolation parameters. InnovExplo considers the 2018 MRE to be reliable and based on quality data, reasonable hypotheses and parameters that follow CIM Definition Standards.
Table 14.8 displays the results of the 2018 in situ Mineral Resource Estimate for the O’Brien Project (17 mineralized zones and 2 dilution envelopes) at the official 3.50 g/t Au cut-off grade, as well as the sensitivity at other cut-off grades. The reader should be cautioned that the figures presented in Table 14.8 should not be misinterpreted as a mineral resource statement apart from the official scenario at 3.50 g/t Au. The reported quantities and grade estimates at different cut-off grades are only presented to demonstrate the sensitivity of the resource model to the selection of a reporting cut-off grade.
Table 14.8 presents the results of the in situ Mineral Resource Estimate at a cut-off grade of 3.5 g/t Au and Table 14.9 breaks down the estimate by zone.
Table 14.8 – 2018 O’Brien Project Mineral Resource Estimate at a 3.50 g/t Au cut-off, sensitivity at other cut-off scenarios
Notes to Accompany Mineral Resource Table: 1. The independent qualified person for the 2018 MRE, as defined by NI 43-101, is Christine Beausoleil, P. Geo,
of InnovExplo Inc. The effective date of the estimate is March 20, 2018. 2. The Mineral Resources are classified as Indicated and Inferred Mineral Resources and are based on the 2014
CIM Definition Standards. 3. These Mineral Resources are not Mineral Reserves as they do not have demonstrated economic viability. 4. Results are presented in-situ and undiluted. 5. Sensitivity was assessed using cut-off grades from 2.5 g/t Au to 5.0 g/t Au. The official in-situ resource is reported
at a cut-off grade of 3.5 g/t Au. Cut-off grades must be re-evaluated in light of prevailing market conditions (gold price, exchange rate and mining cost).
6. A top cut of 30 g/t gold (5.0 g/t gold for the dilution envelope) was applied to assay grades prior to compositing grades for interpolation into model blocks using an inverse distance squared (ID2) method and was based on 0.75 m composites within a block model made of 3 m long x 3 m wide x 3 m high blocks.
7. Density data (g/cm3) was established at 2.75 g/cm3. 8. A minimum true thickness of 1.5 m was applied, using the grade of the adjacent material when assayed or a
value of zero when not assayed for 17 different mineralised zones. 9. The number of metric tons and ounces was rounded to the nearest unit. Any discrepancies in the totals are due
to rounding effects; rounding followed the recommendations in Form 43-101F1. 10. InnovExplo is not aware of any known environmental, permitting, legal, title-related, taxation, socio-political,
marketing or other relevant issues that could materially affect the mineral resource estimate.
Zones Cut-off TonnagesGrade
(g/t Au) Ounces Zones Cut-off TonnagesGrade
(g/t Au) Ounces
2.50 1,800,104 5.14 297,466 2.50 2,054,524 4.22 278,6443.00 1,409,734 5.81 263,108 3.00 1,519,190 4.74 231,6123.50 1,125,447 6.45 233,491 3.50 1,157,021 5.22 194,0844.00 910,885 7.09 207,696 4.00 830,615 5.80 154,8334.50 751,753 7.70 186,019 4.50 538,938 6.65 115,1405.00 624,734 8.30 166,671 5.00 416,123 7.21 96,508
Indicated Resources
All Zones
Inferred Resources
All Zones
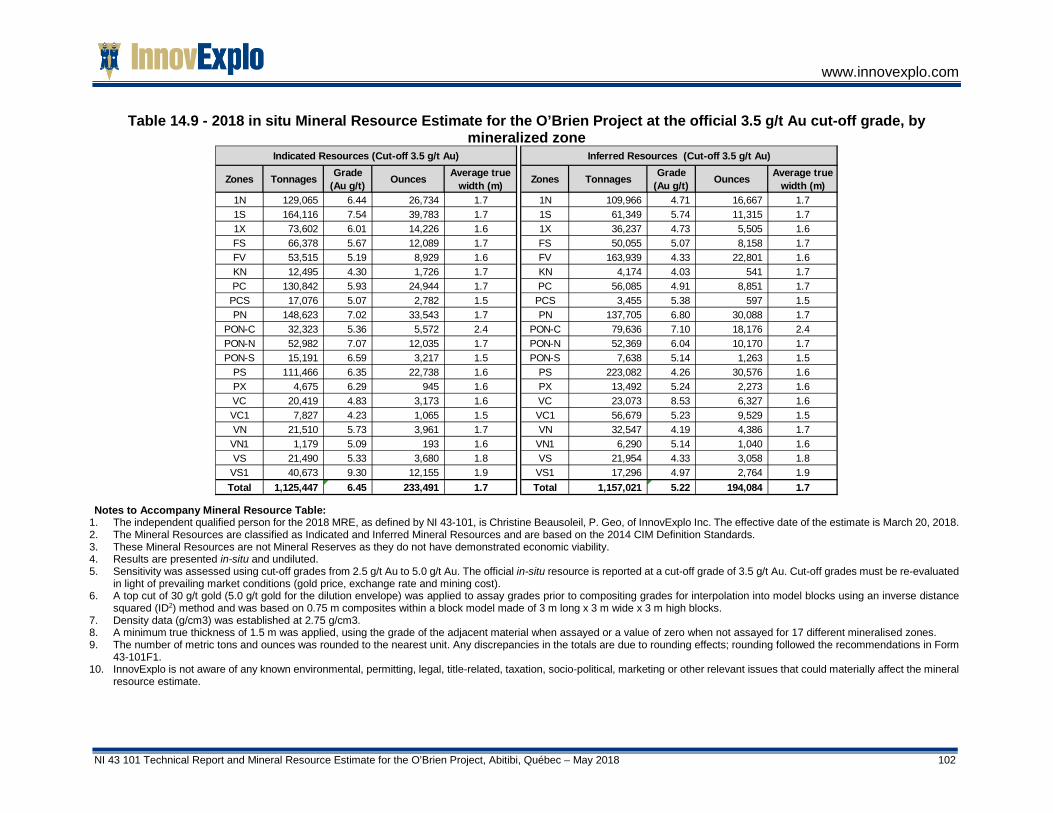
www.innovexplo.com
NI 43 101 Technical Report and Mineral Resource Estimate for the O’Brien Project, Abitibi, Québec – May 2018 102
Table 14.9 - 2018 in situ Mineral Resource Estimate for the O’Brien Project at the official 3.5 g/t Au cut-off grade, by mineralized zone
Notes to Accompany Mineral Resource Table:
1. The independent qualified person for the 2018 MRE, as defined by NI 43-101, is Christine Beausoleil, P. Geo, of InnovExplo Inc. The effective date of the estimate is March 20, 2018. 2. The Mineral Resources are classified as Indicated and Inferred Mineral Resources and are based on the 2014 CIM Definition Standards. 3. These Mineral Resources are not Mineral Reserves as they do not have demonstrated economic viability. 4. Results are presented in-situ and undiluted. 5. Sensitivity was assessed using cut-off grades from 2.5 g/t Au to 5.0 g/t Au. The official in-situ resource is reported at a cut-off grade of 3.5 g/t Au. Cut-off grades must be re-evaluated
in light of prevailing market conditions (gold price, exchange rate and mining cost). 6. A top cut of 30 g/t gold (5.0 g/t gold for the dilution envelope) was applied to assay grades prior to compositing grades for interpolation into model blocks using an inverse distance
squared (ID2) method and was based on 0.75 m composites within a block model made of 3 m long x 3 m wide x 3 m high blocks. 7. Density data (g/cm3) was established at 2.75 g/cm3. 8. A minimum true thickness of 1.5 m was applied, using the grade of the adjacent material when assayed or a value of zero when not assayed for 17 different mineralised zones. 9. The number of metric tons and ounces was rounded to the nearest unit. Any discrepancies in the totals are due to rounding effects; rounding followed the recommendations in Form
43-101F1. 10. InnovExplo is not aware of any known environmental, permitting, legal, title-related, taxation, socio-political, marketing or other relevant issues that could materially affect the mineral
resource estimate.
Zones Tonnages Grade(Au g/t) Ounces Average true
width (m) Zones Tonnages Grade(Au g/t) Ounces Average true
width (m)1N 129,065 6.44 26,734 1.7 1N 109,966 4.71 16,667 1.71S 164,116 7.54 39,783 1.7 1S 61,349 5.74 11,315 1.71X 73,602 6.01 14,226 1.6 1X 36,237 4.73 5,505 1.6FS 66,378 5.67 12,089 1.7 FS 50,055 5.07 8,158 1.7FV 53,515 5.19 8,929 1.6 FV 163,939 4.33 22,801 1.6KN 12,495 4.30 1,726 1.7 KN 4,174 4.03 541 1.7PC 130,842 5.93 24,944 1.7 PC 56,085 4.91 8,851 1.7
PCS 17,076 5.07 2,782 1.5 PCS 3,455 5.38 597 1.5PN 148,623 7.02 33,543 1.7 PN 137,705 6.80 30,088 1.7
PON-C 32,323 5.36 5,572 2.4 PON-C 79,636 7.10 18,176 2.4PON-N 52,982 7.07 12,035 1.7 PON-N 52,369 6.04 10,170 1.7PON-S 15,191 6.59 3,217 1.5 PON-S 7,638 5.14 1,263 1.5
PS 111,466 6.35 22,738 1.6 PS 223,082 4.26 30,576 1.6PX 4,675 6.29 945 1.6 PX 13,492 5.24 2,273 1.6VC 20,419 4.83 3,173 1.6 VC 23,073 8.53 6,327 1.6VC1 7,827 4.23 1,065 1.5 VC1 56,679 5.23 9,529 1.5VN 21,510 5.73 3,961 1.7 VN 32,547 4.19 4,386 1.7
VN1 1,179 5.09 193 1.6 VN1 6,290 5.14 1,040 1.6VS 21,490 5.33 3,680 1.8 VS 21,954 4.33 3,058 1.8
VS1 40,673 9.30 12,155 1.9 VS1 17,296 4.97 2,764 1.9Total 1,125,447 6.45 233,491 1.7 Total 1,157,021 5.22 194,084 1.7
Indicated Resources (Cut-off 3.5 g/t Au) Inferred Resources (Cut-off 3.5 g/t Au)
www.innovexplo.com
NI 43 101 Technical Report and Mineral Resource Estimate for the O’Brien Project, Abitibi, Québec – May 2018 103
15. MINERAL RESERVE ESTIMATE Not applicable at the current stage of the Project.
16. MINING METHODS Not applicable at the current stage of the Project.
17. RECOVERY METHOD Not applicable at the current stage of the Project.
18. PROJECT INFRASTRUCTURE Not applicable at the current stage of the Project.
19. MARKET STUDIES AND CONTRACTS Not applicable at the current stage of the Project.
20. ENVIRONMENTAL STUDIES, PERMITTING AND SOCIAL OR COMMUNITY IMPACT Not applicable at the current stage of the Project.
21. CAPITAL AND OPERATING COSTS Not applicable at the current stage of the Project.
22. ECONOMIC ANALYSIS Not applicable at the current stage of the Project.

www.innovexplo.com
NI 43 101 Technical Report and Mineral Resource Estimate for the O’Brien Project, Abitibi, Québec – May 2018 104
23. ADJACENT PROPERTIES The vicinity of the O’Brien Project has seen a considerable amount of exploration and mining activities, some of which are ongoing. A number of producers and mineral occurrences are found within a few kilometres of the Project. The properties immediately adjacent to the Project (Figure 23.1) are held by the following companies: Agnico Eagle Mines Ltd (to the north and south); Renforth Resources Inc. (to the west) and Globex Mining Enterprises (to the east).
Agnico Eagle Properties Two major deposits, Bousquet-1 and Bousquet -2, are found on the properties held by Agnico Eagle Mines (“Agnico Eagle”) along the northern boundary of the O’Brien Project. The Bousquet deposits are located about 7 km west-northwest of the resource area presented in this report. They were mined by Lac Minerals Ltd between 1979 and 1996. By 1996, production totalled 10.8 Mt at 5.96 g/t Au (Beaudoin et al, 2014).
Along the same stratigraphic horizon as the Bousquet deposits, and less than 2 km to the east, the LaRonde mine has been in operation since 1988, and has produced more than 5.0 Moz of gold as well as valuable byproducts (silver, zinc, copper and lead). The mine still has 3.1 Moz of gold in proven and probable reserves (18 Mt grading 5.4 g/t Au). The deep extension of the LaRonde mine achieved commercial production in November 2011 and is the focus of ongoing mining activities, with an estimated mine life that will last until 2028 with the LaRonde Zone 5 (Agnico Eagle website).
The stratigraphic horizon related to the Bousquet and LaRonde-Dumagami deposits is located within the bimodal volcanics of the Blake River Group.
These deposits are described as gold-rich VMS deposits and cannot be compared or associated with the deposits found on the O’Brien Project. They occur along a different stratigraphic horizon, about 2 km north of the resource estimate area presented in this report.
In April 2015, Agnico Eagle acquired the property adjacent to the southern boundary of the O’Brien Project. In 2015, the property was registered to 9265-9911 Québec Inc.

www.innovexplo.com
NI 43 101 Technical Report and Mineral Resource Estimate for the O’Brien Project, Abitibi, Québec – May 2018 105
Figure 23.1 – Adjacent properties of the O’Brien Project, showing past and current producers

www.innovexplo.com
NI 43 101 Technical Report and Mineral Resource Estimate for the O’Brien Project, Abitibi, Québec – May 2018 106
New Alger Property In August 2016, Renforth Resources Inc. (“Renforth”) announced the completion of the New Alger JV with Cadillac Ventures Inc., resulting in Renforth assuming 100% ownership of the New Alger mining concession, subject to a 2% NSR royalty that applies to the entire property. In February 2018, Renforth consolidated their position by almost doubling its area with to acquisition of 58 whole and fractionated mining claims.
The New Alger Property contains two areas of gold occurrences, the Thompson-Cadillac Mine Area and the Pontiac Vein System.
The Thompson-Cadillac mine was discovered in 1924. The mine property was first staked by E. J. Thompson during the same gold rush that discovered the O’Brien mine. The Thompson Cadillac mine is located just over 2 km west of the resource area presented in this report, and a few hundred metres west of the O’Brien Project boundary. It is located along the same stratigraphic horizon as the resource area presented in this report, and it shares the same orogenic-type geological setting. Gold mineralization is found in quartz veins associated with the Cadillac–Larder Lake Fault Zone (“CLLFZ”), within tension fractures located in a conglomerate unit and basalts from the Piché Group. The mineralization contains arsenopyrite, pyrrhotite and pyrite, with local occurrences of free gold. The latest resource estimate for the New Alger deposit from April 2014 states inferred resources of 3,007,000 t at a grade of 2.08 g/t Au for 201,000 ounces of gold (Wellstead and Newton, 2014).
The Pontiac Vein System is a recent discovery located south of the mine. It is also a surface occurrence of gold in quartz veins, traced on surface aver 450 m.
Pandora Wood Property According to Pressacco (2008), the Pandora Wood property, held equally by Globex Mining Enterprises Inc. (“Globex”) and Canadian Malartic Corporation (“Canadian Malartic”), hosts two former gold producers: the Central Cadillac mine and the Wood-Cadillac mine. The Central Cadillac mine was discovered in 1933 and is 3 km east of the resource area presented in this report. From 1939 to 1943, production from the Central Cadillac mine was 185,541 t at 5.14 g/t Au for a total of 954 kg of gold and 115 kg of silver. From June 1947 to August 1949, production was reported as 233,329 t at 4.33 g/t Au for a total of 1,010 kg of gold and 130 kg of silver, apparently all or mostly from the Wood-Cadillac segment as the contribution from the Central Cadillac mine was not specified. The combined production for these two periods amounts to 418,870 t at 4.69 g/t Au for a total of 1,964 kg of gold.
Mineralization in these deposits is also orogenic, closely related to the CLLFZ. Most of the mineralization comes from horizontal quartz-tourmaline veins found in a 15-m interval between the CLLFZ and iron formations. The veins and their strongly tourmalinized wallrocks are slightly mineralized with pyrite, arsenopyrite and free gold. The veins also contain chalcopyrite and massive scheelite. Late quartz veinlets containing gold crosscut the older mineralized veins as well as silicified greywackes. Gold mineralization associated with arsenopyrite and pyrite was also found in talc-chlorite schists of the CLLFZ.

www.innovexplo.com
NI 43 101 Technical Report and Mineral Resource Estimate for the O’Brien Project, Abitibi, Québec – May 2018 107
In 2004, a joint venture between Globex and Queenston Mining Inc. commenced their exploration on the property. The work concentrated on the Ironwood deposit where gold mineralization is associated with an alteration assemblage of pyrrhotite-arsenopyrite-pyrite (± calcite/quartz) that is hosted by an oxide iron formation. A mineral resource estimate completed in 2008 indicates that the Ironwood deposit contains 243,200 t of inferred resources grading 17.26 g/t Au.
This “resource” is historical in nature and should not be relied upon. It is unlikely it complies with NI 43-101 requirements or follows CIM Definition Standards, and it has not been verified to determine its relevance or reliability. It is included in this section for illustrative purposes only and should not be disclosed out of context. InnovExplo did not review the databases, key assumptions, parameters or methods used for this estimate.
In December 2012, Globex entered into a JV with Osisko Mining Inc. After the 2014 takeover of Osisko Mining, Canadian Malartic became the JV partner.
Comments on Item 23 InnovExplo has been unable to verify the above information for adjacent properties to the O’Brien Project. The presence of significant mineralization on these properties is not necessarily indicative of similar mineralization on the O’Brien Project. Moreover, InnovExplo did not review the technical and economic parameters used to produce the mineral resource estimates for these adjacent properties.
www.innovexplo.com
NI 43 101 Technical Report and Mineral Resource Estimate for the O’Brien Project, Abitibi, Québec – May 2018 108
24. OTHER RELEVANT DATA AND INFORMATION All relevant data and information regarding the issuer’s Project have been disclosed under the relevant sections of this report.

www.innovexplo.com
NI 43 101 Technical Report and Mineral Resource Estimate for the O’Brien Project, Abitibi, Québec – May 2018 109
25. INTERPRETATIONS AND CONCLUSIONS The objective of InnovExplo’s mandate was to prepare a mineral resource estimate for the O’Brien Project in the 36 East and Kewagama areas using recent and validated historical diamond drill hole data (2015 to September 2017). This Technical Report and the mineral resource estimate presented herein meet this objective.
InnovExplo created a litho-structural model of the Project using all available geological and analytical information. In order to conduct accurate resource modelling of the deposit, InnovExplo based its mineralized-zone wireframe model on the drill hole database and the author’s knowledge of the O’Brien mine. A total of 17 mineralized zones were modelized into 34 solids combined with two dilution envelopes using the vein modeling module in Leapfrog from an interval selection based on the intercepts field. The selection was locally changed to ensure spatial coherence and continuity in 3D. The interpolation of the mineralized zones was constrained by the wireframes.
InnovExplo concludes the following after conducting a detailed review of all pertinent information and completing the 2018 MRE:
• Geological and grade continuity were demonstrated for the 17 gold-bearing zones of the O’Brien Project.
• The additional recent and historical drill holes provided sufficient information to update the previous (2015) mineral resource estimate.
• The estimated Indicated Resources now stand at 233,491 ounces of gold (1,125,447 t at 6.45 g/t Au) and Inferred Resources at 194,084 ounces of gold (1,157,021 t at 5.22 g/t Au).
• The 2018 Indicated Resources represent a 95% increase in ounces compared to the 2015 estimate. The 2018 Inferred Resources represent a 3% increase in total ounces compared to the 2015 estimate. Grade decreased by 1% in the Indicated category, whereas it decreased by 18% in the Inferred category. Note that additional diamond drill holes from the latest drilling programs (2015-2017) in the gap between the 36 East and Kewagama areas is mainly responsible for the resources increasing from the previous (2015) resource estimate.
• It is likely that additional diamond drilling on multiple zones would increase the indicated Resources and upgrade some of the Inferred Resources to Indicated Resources.
• There is also the potential for upgrading some of the Indicated Resources to Measured Resources through detailed geological mapping, infill drilling and systematic channel sampling from the underground workings.
InnovExplo also believes there are several opportunities to add additional resources to the O’Brien Project:
• Target 1: o Zone F between old O’Brien and Zone 36E.
• Target 2: o Near surface thickening of Zone 36E.
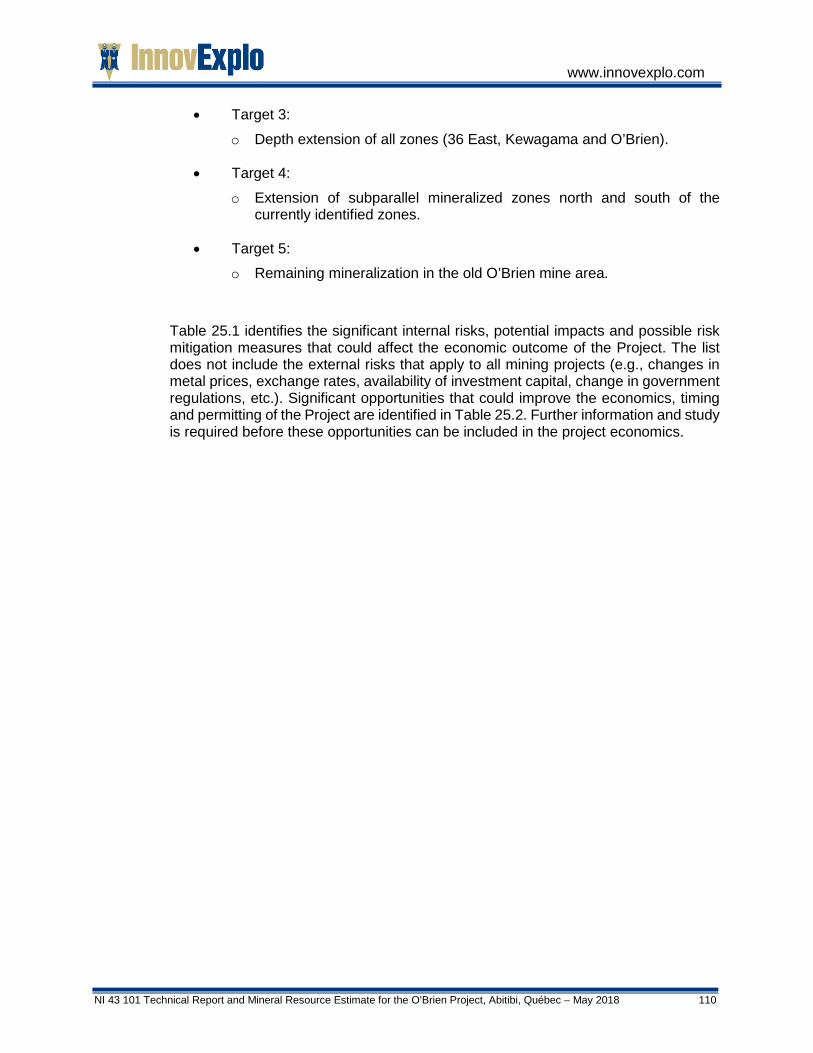
www.innovexplo.com
NI 43 101 Technical Report and Mineral Resource Estimate for the O’Brien Project, Abitibi, Québec – May 2018 110
• Target 3: o Depth extension of all zones (36 East, Kewagama and O’Brien).
• Target 4: o Extension of subparallel mineralized zones north and south of the
currently identified zones.
• Target 5: o Remaining mineralization in the old O’Brien mine area.
Table 25.1 identifies the significant internal risks, potential impacts and possible risk mitigation measures that could affect the economic outcome of the Project. The list does not include the external risks that apply to all mining projects (e.g., changes in metal prices, exchange rates, availability of investment capital, change in government regulations, etc.). Significant opportunities that could improve the economics, timing and permitting of the Project are identified in Table 25.2. Further information and study is required before these opportunities can be included in the project economics.

www.innovexplo.com
NI 43 101 Technical Report and Mineral Resource Estimate for the O’Brien Project, Abitibi, Québec – May 2018 111
Table 25.1 – Risks of the O’Brien Project RISK Potential Impact Possible Risk Mitigation
Proximity of the historical O’Brien mine where environmental, economic, and/or technical potential issues could arise from the presence of 8,938 barrels of arsenic trioxide stored underground at level 1500' (Historical precautions may have failed to contain the arsenic trioxide within the containment area over the last 30 years) This underground storage site is classified as a class 1 dangerous waste material site by the GERLED group, a government entity with the mandate to catalogue and monitor all known dangerous waste material sites in the Province of Québec (the Ministry may be reluctant to now provide an authorization to disturb the area)..
• Although the current resources are located away from the storage facility, the act of pumping water (which would be necessary to bring the O’Brien Project to production) could potentially disturb the groundwater and therefore affect the current situation, which is believed to be stable.
• An eventual drilling program could breach the confinement facility.
• A buffer zone around the drifts where the barrels are stored should be modelled in 3D, and this buffer zone should be excluded from any future drilling program.
• Maintain the sampling program to potentially determine whether the concrete plugs from 1985 and the surrounding lithologies have continued to contain the arsenic trioxide, by Applying the recommendations from the basic hydrogeological study (Fournier et Leblanc, 2018).
• Discussions with the Québec Ministry of Environment could be initiated to determine what can be done to adequately address a number of scenarios.
Social acceptability • Possibility that portions or the entirety of the O’Brien Project could not be explored or exploited.
• Develop a pro-active and transparent strategy to identify all stakeholders and develop a communication plan. Organize information sessions, publish information on the mining project, and meet with host communities.
Metallurgical recoveries below expectation
• Recovery might differ from what is currently being assumed.
• Further variability testing of the deposit to confirm metallurgical conditions and efficiencies.
To date, only limited testwork to determine whether waste rock would be potentially acid generating (PAG)
• Additional capital may be required to prepare a storage site for PAG waste.
• Further testing to confirm whether the waste is PAG or non-acid generating (NAG).
Surface and/or underground geotechnical evaluations not available
• The minimum mining width used for the resource estimate might need to be adjusted if assumptions differ from reality.
• Geotechnical assessments at a larger scale to confirm rock quality (underground and at surface) to validate assumptions.

www.innovexplo.com
NI 43 101 Technical Report and Mineral Resource Estimate for the O’Brien Project, Abitibi, Québec – May 2018 112
Table 25.2 – Opportunities of the O’Brien Project OPPORTUNITIES Explanation Potential benefit
Conduct specific gravity tests from core samples
Potential to increase or confirm the 2.75 g/cm3 specific gravity value currently used for the resource estimate.
An increase in specific gravity increases the tonnage and therefore the ounces of gold.
Compilation of the old O’Brien mine workings
Potential to locate historical underground stopes, channel samples and drill holes with enough precision to allow this area to be added to the geological model.
An entirely new area could be added that is not considered in the current resource estimate presented in this report.
Compilation and validation of all historical underground channel samples
Potential to upgrade some indicated resources to the measured category.
Adding measured resources increases the economic value of the mining project.
Surface definition diamond drilling
Potential to upgrade some inferred resources to the indicated category.
Adding indicated resources increases the economic value of the mining project.
Surface exploration diamond drilling on Target 1 Extension of mineralization in the F zone, between Old O’Brien mine and 36 East Zone.
Potential to identify additional inferred/indicated resources.
Adding inferred and/or indicated resources increases the economic value of the mining project.
Surface exploration diamond drilling on Target 2 Depth and towards surface extensions of the ore shoot that originates in the 36 East Zone.
Potential to identify additional inferred/indicated resources.
Adding inferred and/or indicated resources increases the economic value of the mining project.
Surface exploration diamond drilling on Target 3 Depth extension of all zones (36 East, Kewagama and O’Brien)
Potential to identify additional inferred resources.
Adding inferred resources increases the economic value of the mining project.
Surface exploration diamond drilling on Target 4 Extension of subparallel mineralized zones north and south of the currently identified zones
Potential to identify additional inferred resources.
Adding inferred resources increases the economic value of the mining project.
Target 5: Identification of remaining mineralization in the old O’Brien mine area through compilation and drilling
Potential to identify additional inferred resources.
Adding inferred resources increases the economic value of the mining project.
Positive PEA results on the current resources
Potential to upgrade confidence in the economic potential of the project.
Could potentially lead to a prefeasibility study.
Underground bulk sample Test mining and metallurgical assumptions and validate the resource model
Could potentially lead to a prefeasibility study

www.innovexplo.com
NI 43 101 Technical Report and Mineral Resource Estimate for the O’Brien Project, Abitibi, Québec – May 2018 113
InnovExplo concludes that the 2018 MRE presented herein allows the O’Brien Project to advance to the PEA study stage.
InnovExplo considers the 2018 MRE to be reliable, thorough, based on quality data, reasonable hypotheses, and parameters compliant with NI 43-101 and CIM standards regarding mineral resource estimations.
Figure 25.1 shows a 3D view looking north of the Indicated and Inferred resources presented in this report. The Kewagama and 36 East areas are identified (formerly Zone 36 East and the Kewagama mine). All currently modelled underground mine voids appear on this figure.
Figure 25.2 shows a composite longitudinal view of the Indicated and Inferred resources, and the historical O’Brien mine workings. Note that contours for mined-out areas (stopes) are approximate, and most of the underground workings (drifts, shafts, raises, etc.) are missing as modelling was incomplete at the time of writing this report.
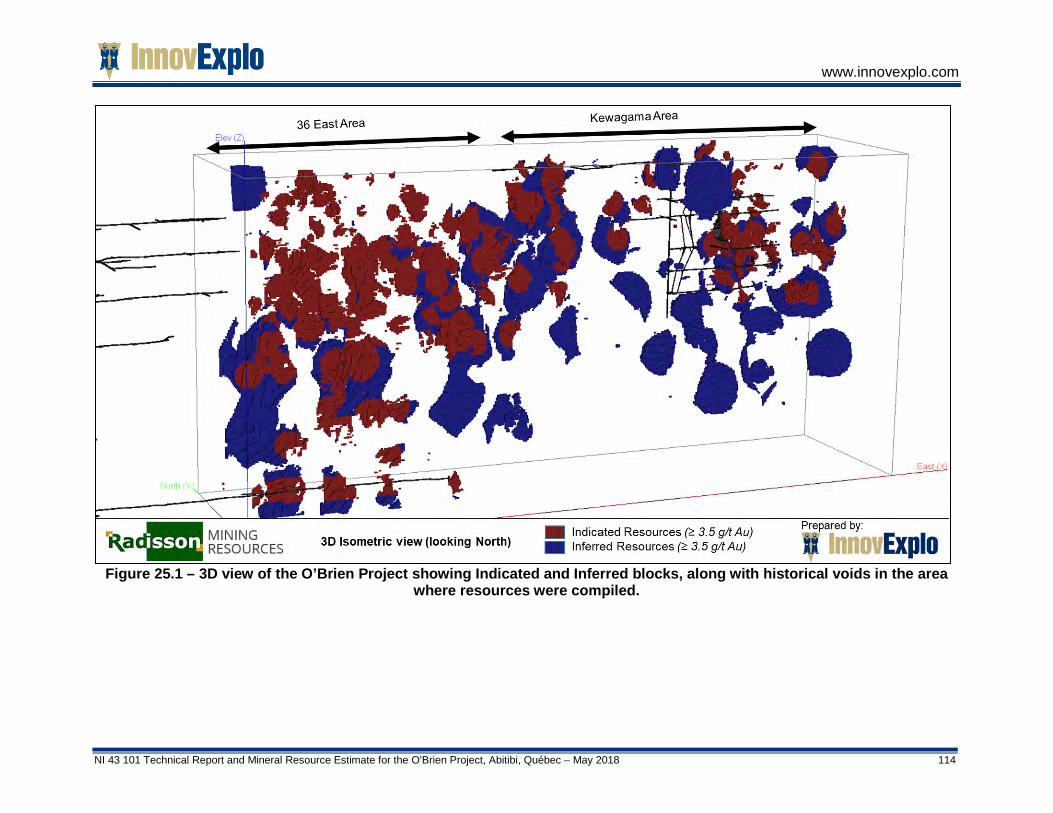
www.innovexplo.com
NI 43 101 Technical Report and Mineral Resource Estimate for the O’Brien Project, Abitibi, Québec – May 2018 114
Figure 25.1 – 3D view of the O’Brien Project showing Indicated and Inferred blocks, along with historical voids in the area
where resources were compiled.
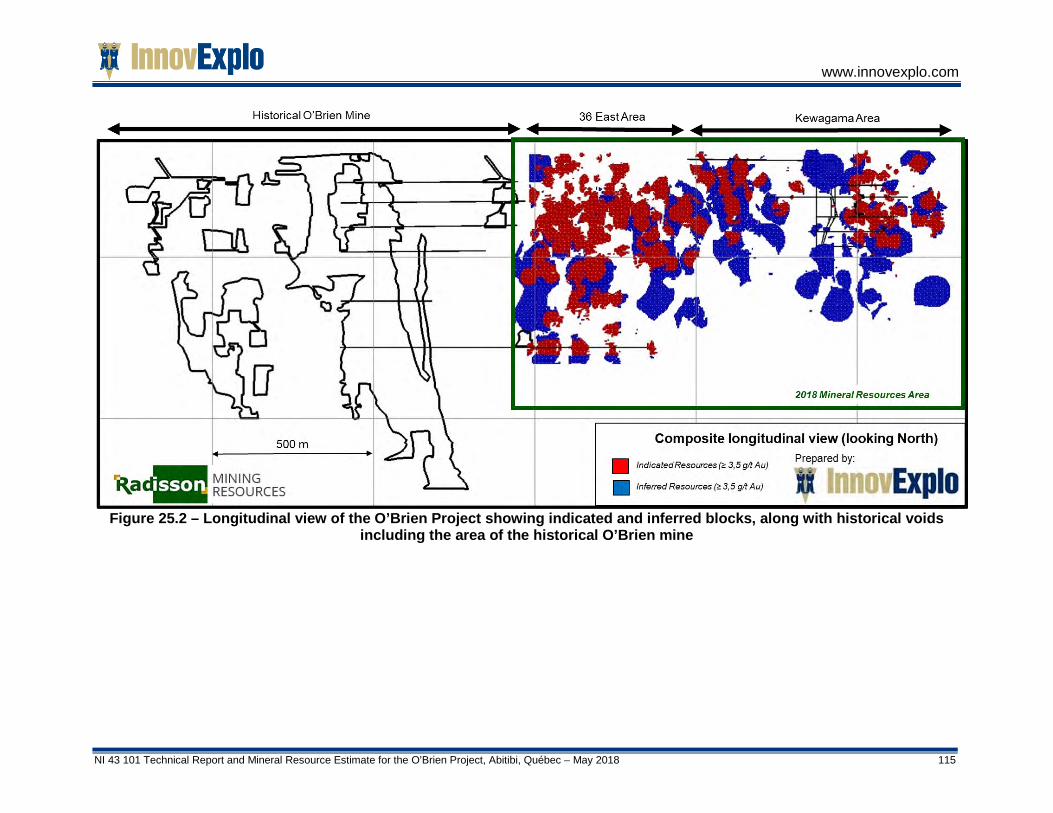
www.innovexplo.com
NI 43 101 Technical Report and Mineral Resource Estimate for the O’Brien Project, Abitibi, Québec – May 2018 115
Figure 25.2 – Longitudinal view of the O’Brien Project showing indicated and inferred blocks, along with historical voids
including the area of the historical O’Brien mine

www.innovexplo.com
NI 43 101 Technical Report and Mineral Resource Estimate for the O’Brien Project, Abitibi, Québec – May 2018 116
26. RECOMMENDATIONS Based on the results of the 2018 Mineral Resource Estimate, InnovExplo recommends that the O’Brien Project be advanced to the next phase, which would be a PEA.
In parallel with the PEA, more work is warranted.
The company should complete the 3D compilation of the remaining historical openings, which would have a positive impact on locating all remaining historical underground drill holes and channel samples. The remaining historical data (drill holes, channel samples, etc.) should also be compiled. InnovExplo recommends prioritizing the eastern area of the former O’Brien Mine and use to upgrade the current model and resource estimate.
Conversion drilling should be devoted to upgrading part of the Inferred resources to the Indicated category, while exploration drilling should target the currently identified areas of interests described in this report, but also target the discovery of additional zones over the entire project.
The stakeholder mapping and communication plan should be pursued. A baseline environmental study should be completed and should include addressing the arsenic trioxide underground storage area located at level 1500’ in the old O’Brien mine, west of the No. 3 Shaft in the 15-G-West and 15-F-West drifts, 1,100 meters west of western boundary of current resources. Based on the results of this study, appropriate actions (to be determined) should be carried out.
InnovExplo also recommends an underground bulk sample to test and validate the different mining and metallurgical assumptions and validate the geological and resources model.
In summary, InnovExplo recommends a two-phase work program as follows:
• Phase 1: o 3D compilation of historical voids of the eastern part of the former
O’Brien Mine o Continue surface conversion drilling o Social Licence Management o Environmental and hydrogeological characterization testing o Waste rock and old waste pad characterization o Initiate the documentation and different studies in preparation for
legislative permitting process o Update the Mineral Resource Estimation
• Phase 2: o PEA on Phase 1 Mineral Resource Estimation o Continue surface conversion drilling o Compile all remaining historical openings and historical data from
Kewagama and O’Brien areas.
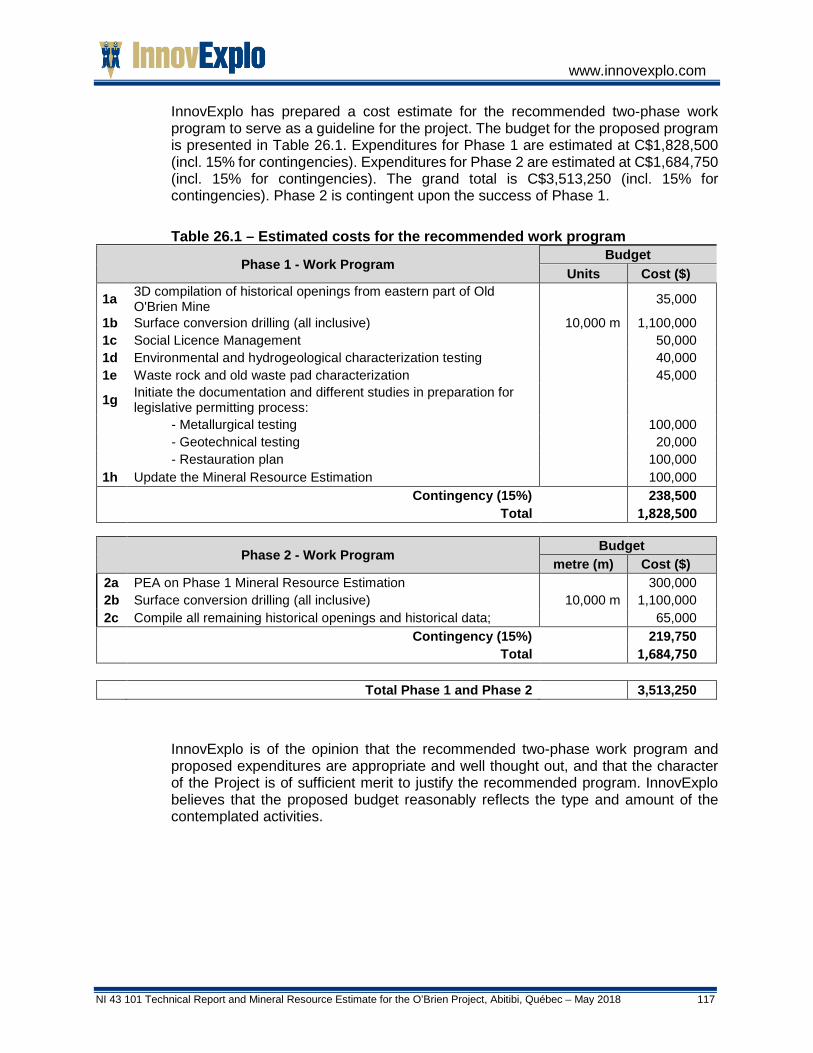
www.innovexplo.com
NI 43 101 Technical Report and Mineral Resource Estimate for the O’Brien Project, Abitibi, Québec – May 2018 117
InnovExplo has prepared a cost estimate for the recommended two-phase work program to serve as a guideline for the project. The budget for the proposed program is presented in Table 26.1. Expenditures for Phase 1 are estimated at C$1,828,500 (incl. 15% for contingencies). Expenditures for Phase 2 are estimated at C$1,684,750 (incl. 15% for contingencies). The grand total is C$3,513,250 (incl. 15% for contingencies). Phase 2 is contingent upon the success of Phase 1.
Table 26.1 – Estimated costs for the recommended work program
Phase 1 - Work Program Budget
Units Cost ($)
1a 3D compilation of historical openings from eastern part of Old O'Brien Mine
35,000
1b Surface conversion drilling (all inclusive) 10,000 m 1,100,000 1c Social Licence Management 50,000 1d Environmental and hydrogeological characterization testing 40,000 1e Waste rock and old waste pad characterization 45,000
1g Initiate the documentation and different studies in preparation for legislative permitting process:
- Metallurgical testing 100,000 - Geotechnical testing 20,000 - Restauration plan 100,000 1h Update the Mineral Resource Estimation 100,000 Contingency (15%) 238,500 Total 1,828,500
Phase 2 - Work Program Budget metre (m) Cost ($)
2a PEA on Phase 1 Mineral Resource Estimation 300,000 2b Surface conversion drilling (all inclusive) 10,000 m 1,100,000 2c Compile all remaining historical openings and historical data; 65,000 Contingency (15%) 219,750 Total 1,684,750 Total Phase 1 and Phase 2 3,513,250
InnovExplo is of the opinion that the recommended two-phase work program and proposed expenditures are appropriate and well thought out, and that the character of the Project is of sufficient merit to justify the recommended program. InnovExplo believes that the proposed budget reasonably reflects the type and amount of the contemplated activities.

www.innovexplo.com
NI 43 101 Technical Report and Mineral Resource Estimate for the O’Brien Project, Abitibi, Québec – May 2018 118
27. REFERENCES Ayer, J.A., Ketchum, J., and Trowell, N.F., 2002b, New geochronological and
neodymium isotopic results from the Abitibi greenstone belt, with emphasis on the timing and the tectonic implications of Neoarchean sedimentation and volcanism: Ontario Geological Survey Open File Report 6100, p. 5-1–5-16.
Ayer, J., Amelin, Y., Corfu, F., Kamo, S., Ketchum, J.F., Kwok, K., and Trowell, N.F., 2002a, Evolution of the Abitibi greenstone belt based on U-Pb geochronology: Autochthonous volcanic construction followed by plutonism, regional deformation and sedimentation: Precambrian Research, v. 115, p. 63–95.
Ayer, J.A., Trowell, N.F., Amelin, Y., and Corfu, F., 1998, Geological compilation of the Abitibi greenstone belt: Toward a revised stratigraphy based on compilation and new geochronology results: Ontario Geological Survey Miscellaneous Paper 169, p. 4-1–4-14.
Ayer, J.A., Thurston, P.C., Bateman, R., Dubé, B., Gibson, H.L., Hamilton, M.A., Hathway, B., Hocker, S.M., Houlé, M.G., Hudak, G., Ispolatov, V.O., Lafrance, B., Lesher, C.M., MacDonald, P.J., Péloquin, A.S., Piercey, S.J., Reed, L.E. and Thompson, P.H. 2005. Overview of results from the Greenstone Architecture Project: Discover Abitibi Initiative; Ontario Geological Survey, Open File Report 6154, 146p. Barrie, C., 2006. High Resolution Horizontal Magnetic Gradient & XDS-VLF-EM Airborne Survey, O’Brien Kewagama Project, Cadillac, Quebec. Operations Report prepared by Terraquest Ltd for Radisson Mining Resources Inc. Report # B-193. 23 pages.
Bateman, R., Ayer, J.A., and Dubé, B., 2008, The Timmins-Porcupine gold camp, Ontario: Anatomy of an Archean greenstone belt and ontogeny of gold mineralizations. Economic Geology, v. 103, p. 1285–1308.
Beaudoin, G., Mercier-Langevin, P., Dubé, B., Taylor, B. E., 2014, Low-Temperature Alteration at the World-Class LaRonde Penna Archean Au-Rich Volcanogetic Massive Sulfide Deposit, Abitibi Subprovince, Québec, Canada: Evidence from Whole-Rock Oxygen Isotopes, Economic Geology, v. 109, pp. 167-182.
Bell, L. V., 1937. O’Brien Gold Mines Limited and Kewagama Gold Mines Ltd. In Mining Properties and Development in the Rouyn-Bell River District during 1936. Department of Mines and Fisheries, Province of Quebec, Canada. P. R. No. 116. Pages 34-35.
Bell, L. V., and MacLean, A., 1929. Cadillac O’Brien Property of M. J. O’Brien Co. In Report on the Geology of Bousquet-Cadillac Gold Area. Abitibi district, Annual Report Quebec Bureau of Mines for the Calender Year 1929, Part C. Pages 48-52.
Benn, K., and Peschler, A.P., 2005, A detachment fold model for fault zones in the Late Archean Abitibi greenstone belt: Tectonophysics, v. 400, p. 85–104.
Benn, K., Miles, W., Ghassemi, M. R., Gillet, J., 1994. Crustal structure and kinematic framework of the north-western Pontiac Subprovince, Québec: an integrated

www.innovexplo.com
NI 43 101 Technical Report and Mineral Resource Estimate for the O’Brien Project, Abitibi, Québec – May 2018 119
structural and geophysical study. Canadian Journal; of Earth Sciences, Vol. 31, pages 271-281.
Bisson, Y., 2004. Rapport préliminaire de campagne de forage 2004, Propriétés O’Brien et Kewagama, Canton Cadillac. Ressources Minières Radisson Inc. 42 pages. GM 61529.
Bisson, Y., 1996. Rapport de campagne 1995-1996, Propriété O’Brien, Canton Cadillac. Ressources Minières Radisson Inc. Internal Report. 36 pages.
Bisson, Y., 1995. 1994-1995 Winter Drilling Campaign Report. O’Brien Property Zone 36 East. Internal Report of Radisson Mining Resources Inc. 45 pages.
Bisson, Y., 1994. Historical Facts of the O’Brien Mine. Internal Report of Radisson Mining Resources Inc. 14 pages.
Blais, R.A., 1954; A Petrologic and Decrepitometric Study of the Gold Mineralization at the O’Brien Mine, Northwestern Québec, University of Toronto Ph.D. Thesis.
Brereton, W. E., 1973. Report on Overburden Drilling, Kewagama Mine, Cadillac Township, Quebec. Report prepared by Driftex Limited for Derry, Michener & Booth. 6 pages. GM 30024.
Browm, R. A, 1948. O’Brien Mine. In Structure of Geology of Canadian Ore Deposits, A symposium Arranged by a Committee of the Geology Division Canadian Institute of Mining and Metallurgy Pages 809-816.
Brethour, G. W., 1976. DHH logs of underground drilling. Darius Gold Mines Ltd. 102 pages. GM 32969.
Brethour, G. W., 1975b. DHH logs of underground drilling. Darius Gold Mines Ltd. 39 pages. GM 31977.
Brethour, G. W., 1975a. Summary of U/G Exploration to date February 28, 1975. Darius Gold Mines Ltd. 1 page. GM 30838.
Brethour, G. W., 1974. Underground Work report to April 1, 1974. Darius Gold Mines Ltd. 1 page. GM 29876.
the area where the barrels were stored after the concrete walls were demolished. Charlton (1985) mentions that the barrels were rusted and in very bad shape. He also added that the sides of the
Charlton, J. D., 1994. O’Brien Property Reevaluation. Report prepared for Radisson Mining Resources Inc. Internal Report. 12 pages.
Chown, E. H., Daigneault, R., Mueller, W., and Mortensen, J., 1992. Tectonic evolution of the Northern Volcanic Zone of Abitibi Belt. Canadian Journal of Earth Sciences, v. 29, pp. 2211-2225.
Cooke, H. C., James, W. F., and Mawdsley, J. B., 1931. O’Brien Claims. In Geology and Ore Deposits of Rouyn-Harricanaw Region, Quebec, Memoir 166, Geological Survey, Canada Department of Mines. Pages 267-269.

www.innovexplo.com
NI 43 101 Technical Report and Mineral Resource Estimate for the O’Brien Project, Abitibi, Québec – May 2018 120
Daigneault, R., Mueller, W.U., Chown, E.H., 2004. Abitibi greenstone belt plate tectonics: the diachronous history of arc development, accretion and collision. In Eriksson, P.G., Altermann, W., Nelson, D.R., Mueller, W.U., Catuneanu, O. (Eds.). The Precambrian Earth: Tempos and Events, Series: Developments in Precambrian geology, vol. 12, Elsevier, pages. 88–103.
Dana, E.S. and Ford, W.E., 1958; Dana’s Textbook of Mineralogy With an Extended Treatise on Crystallography and Physical Mineralogy, Fourth Edition, November 1958.
Darius Gold Mines Inc., 1979. DDH logs of holes GF-79-1 to GF-79-24. 288 pages. GM 35984.
David, M., and Gauthier, E., 2012. Forage au diamant, propriétés O’Brien et Kewagama. Ressources Minières Radisson Inc. 3 pages. GM 67344.
de l’Étoile, R. and Salmon, B., 2013. Technical Report on the O’Brien Project Mineral Resource Estimate, Quebec, Canada. NI-43-101 Report prepared for Radisson Mining Resources Inc. by RPA Inc. 99 pages.
Dimroth, E, Imrech, L., Rocheleau, M., Goulet, N., 1983. Evolution of the south-central part of the Archean Abitibi Belt, Quebec. Part III: plutonic and metamorphic evolution and geotectonic model. Canadian Journal of Earth Sciences, Vol. 20, pages 1374-1388.
Dimroth, E, Imrech, L., Rocheleau, M., Goulet, N., 1982. Evolution of the south-central part of the Archean Abitibi Belt, Quebec. Part I: stratigraphy and paleostratigraphic model. Canadian Journal of Earth Sciences, Vol. 19, pages 1729-1758.
Doucet, P. and Lafrance, B., 2005. The deep-seated gold potential of the Cadillac mining camp. Géologie Québec. Ministère des Ressources naturelles du Québec. 8 pages. PRO 2005-02.
Dresser, J. A., and Denis, T. C., 1949. . O’Brien Gold Mines Limited and Kewagama Gold Mines Ltd. In Geology of Quebec, Vol III, Economic Geology, Department of Mines, Province of Quebec, Canada., Geological Report 20. Pages 197-200.
Dubé, B. and Gosselin, P. 2007, Greenstone-Hosted Quartz-Carbonate Vein Deposits. In Goodfellow, W. D., ed. Mineral Deposits of Canada: A Synthesis of Major Deposit-Types, District Metallogeny, the Evolution of Geological Provinces, and Exploration Methods. Geological Association of Canada, Mineral Deposits Division, Special Publication No. 5. p. 49-73.
Dubé, B., O’Brien, S., and Dunning, G. R., 2001. Gold deposits in deformed terranes: examples of epithermal and quartz-carbonate shear-zone-related gold systems in the Newfoundland Appalachians and their implications for exploration. In North Atlantic Symposium, St-John’s, NF, Canada. Extended abstracts volume, May 27-30, 2001. p. 31-35.
Dubé, B., Poulsen K.H., and Guha, J., 1989. The effects of layer anisotropy on auriferous shear zones: The Norbeau mine, Quebec: Economic Geology, v. 84, p. 871-878.
www.innovexplo.com
NI 43 101 Technical Report and Mineral Resource Estimate for the O’Brien Project, Abitibi, Québec – May 2018 121
Dubois, M., 2016. Levé OreVision, Projet O’Brien, Rapport d’Interprétation. 31 pages
Dugas, G., Duquette, G, and Latulippe, M., 1967. Annotated Bibliography on Metallic Mineralization in the regions of Noranda, Matagami, Val-d’Or, Chibougamau. Quebec Department of Natural Resources, Special Paper2. Page 41. ES 002.
Evans, L., 2007. Technical Report on the O’Brien mine Zone 36 East Mineral Resource Estimate, Cadillac, Quebec, Canada. NI-43-101 Report prepared for Radisson Mining Resources Inc. by Scott Wilson Roscoe Postle Associates Inc.94 pages.
Fournier, V. and Leblanc. Y., 2017. Projet d’exploitation d’une mine souterraine, étude hydrogéologique de base : Ressources Minière Radisson Inc. – Projet O’Brien. Richelieu Hydrogéologie Inc. 46 pages.
Gagné, M. R., and Masson, J., 2013. A Step Foward! An Act to Amend the Minig Act (2013 S.Q., c. 32). Mining Bulletin. Fasken Martineau. 7 pages.
Glover, M. J., 1989. 1989 Diamond drilling summary report, O’Brien mine property, Project 5036. Breakwater Resources Ltd. Internal report. 31 pages.
Goutier, J., and Melançon, M., 2007, Compilation géologique de la Sous-province de l’Abitibi (version préliminaire): Ministère des Ressources naturelles et de la Faune du Québec.
Goutier, J., 1997, Géologie de la région de Destor: Ministère des Ressources naturelles du Québec 37 pages. RG 96-13.
Groves, D.I., Goldfarb, R.J., Know-Robinson, C.M., Ojala, J., Gardoll, S., Yun, G., and Holyland, P., 2000, Late-kinematic timing of orogenic gold deposits and significance for computer-based exploration techniques with emphasis on the Yilgarn block, Western Australia: Ore Geology Reviews, v. 17, p. 1-38.
Gunning, H. C., 1937. O’Brien Gold Mines Limited and Canadian Gold Operators Ltd. In Cadillac Area, Quebec, Memoir 206, Geological Survey, Canada Department of Mines. Pages 49-57.
Guzon, V., 2012. Mining Rights in the Province of Quebec. Blakes Bulletin Real Estate – Mining Tenures July 2012. Blake, Cassels & Graydon LLP. 7 pages.
Hagemann, S.G., and Cassidy, K.F., 2000, Archean orogenic lode gold deposits, in Hagemann, S.G., and Brown, P.E., eds., Gold in 2000: Society of Economic Geologists, Reviews in Economic Geology, v. 13, p. 9-68.
Hodgson, C.J., 1989, The structure of shear-related, vein-type gold deposits: A review: Ore Geology Reviews, v. 4, p. 635-678.
Jolly, W. T., 1978. Metamorphic history of the Archean Abitibi Belt. In Metamorphism in the Canadian Shield. Geological Survey of Canada, Paper 78-10, pp. 63-78.
Karpoff, B. S., and Evans, L., 1998. Resource Estimate of the O’Brien Mine Zone 36 East, Quebec. Report prepared by Roscoe Postle Associates Inc. for Radisson Mining Resources Inc. Internal Report. 100 pages.
www.innovexplo.com
NI 43 101 Technical Report and Mineral Resource Estimate for the O’Brien Project, Abitibi, Québec – May 2018 122
Kelly, D., 2003. Résultats préliminaires des travaux de forages, propriété Kewagama. Ressources Minières Radisson. 12 pages. GM 60151.
Kerrich, R., and Cassidy, K.F., 1994. Temporal relationships of lode gold mineralization to accretion, magmatism, metamorphism and deformation – Archean to present: A review: Ore Geology Reviews, v. 9, p. 263-310.
Kroon, A. S., 1997. Qualification Report Update, O’Brien Property, Cadillac Township. Report prepared by Kilborn SNC-Lavalin for Radisson Mining Resources, Internal Report. 66 pages.
Kroon, A. S., 1996. Qualification Report, O’Brien Property, Cadillac Township. Report prepared by Kilborn SNC-Lavalin for Radisson Mining Resources, Internal Report. 57 pages.
Lafleur, P. J., 1980. DDH logs of surface holes. Darius Gold Mines Inc. 22 pages. GM 38542.
Lafrance, B, Mercier-Langevin, P. Dubé. B., Galley, A.G., Hannington, M.D., Davis, D.W., Moorhead, J., Pilote, P., Mueller, W.U., 2003a. Carte synthèse de la Formation de Bousquet: partie ouest. Ministère des Ressources naturelles, de la Faune et des Parcs, Québec; DV 2003-08, echelle 1 : 20 000.
Lafrance, B, Mercier-Langevin, P. Dubé. B., Galley, A.G., Hannington, M.D., Davis, D.W., Moorhead, J., Pilote, P., Mueller, W.U., 2003b. Carte synthèse de la Formation de Bousquet: partie est. Ministère des Ressources naturelles, de la Faune et des Parcs, Québec; DV 2003-08, echelle 1 : 20 000.
Lafrance, B., Moorhead, J., Davis, D.W., 2003. Cadre géologique du camp minier de Doyon-Bousquet-LaRonde, Ministère des Ressources naturelles, Québec, ET 2002-07, 43 pages.
Lelièvre, J., 1994. Revue de la métallurgie du minerai O’Brien (Analyses et recommandations). Centre spécialisé en technologie minérale, division de l’Abitibi-Témiscamingue. Internal report. 21 pages
Laronde, D. J., 1980. Report of Kewagama Gold Mines Ltd. Kewagama Gold Mines (Quebec) Limited. 13 pages. GM 36988.
Ludden, J.N., Hubert, C., and Gariépy, C., 1986, The tectonic evolution of the Abitibi greenstone belt of Canada: Geological Magazine, v. 123, p. 153-166.
National Assembly, 2013. Bill 70 (2013, chapter 32) An Act to amend the Mining Act. Québec Official Publisher 2013. 32 pages.
MERQ-OGS, 1984, Lithostratigraphic map of the Abitibi subprovince: Ontario Geological Survey and Ministère de l’Énergie et des Ressources, Québec, Map 2484 and DV 83–16.
Mills, J.W., 1950, Structural Control of Orebodies as Illustrated by the Use of Vein Contours at the O’Brien Gold Mine, Cadillac, Quebec, Econ. Geol., Vol. 45, pp. 786-807.
O’Brien Gold Mine Ltd, 1929. Cross-sections and location plans of holes 1 to 12 drilled in 1929. GM 07451- A.
www.innovexplo.com
NI 43 101 Technical Report and Mineral Resource Estimate for the O’Brien Project, Abitibi, Québec – May 2018 123
Paquet, A., 1989. Rapport de caractérisation Lieu 08-28B « dépôt de trioxide d’arsenic O’Brien-Darius ». Groupe de caractérisation et de surveillance des lieux d’élimination de et d’entreposage de déchets dangereux. Ministère de l’Environnement du Québec. Internal report. 55 pages.
Pelchat, C., 1996. 1995 Geological Mapping Report, Kewagama Property. Brewater Resources Ltd. 16 pages. GM 53820.
Poirier, S., Richard, P-L., Turcotte, B., Roy, L., Lavoie, A., Poirier, É., Dion-St-Pierre, M-C. and Lamontagne, A., 2016. Technical Teport and Preliminary Assessment for the O’Brien Project, Abitibi, Québec (according to National Instrument 43-101 and Form 43-101F1). Report prepared for Radisson Mining Resources Inc. by InnovExplo Inc. 107 pages.
Poissant, L.-M., 1997. La contamination par l’Arsenic des puits domestiques en Abitibi-Témiscamingue, étude descriptive. Régie Régionale de la Santé et des Services Sociaux de l’Abitibi-Témiscamingue - Direction régionale de la santé publique, 99 pages.
Pouliot, J.-L., 1964. Sondage au diamant. Kewagama Gold Mines Ltd.1 pages. GM 14780.
Poulsen, K. H., Robert, F., and Dubé, B., 2000. Geological classification of Canadian cold deposits. Geological Survey of Canada, Bulletin 540, 106 pages.
Powell, W. D., Carmichael, D. M., and Hodgon, C. J., 1993. Thermobarometry in a subgreenschist to greenschist transition in metabasite of the Abitibi greenstone belt, Superior Province, Canada. Journal of Metamorphic Geology, Vol. 11, pages 165-178.Quan, W. Ng See, 1987. O’Brien property, 2130, Diamond Drilling. Novamin Ressources Inc. 31 pages. GM 45791.
Pressacco, R., 2008, Technical Report for the Mineral Resource Estimate, Ironwood Project, Cadillac Township, Québec, (NTS 32D/01), Globex Mining Enterprises Inc and Queenston Mining Inc., 93 p.
Rive, M., 1982. Darius. In Rapport des géologues résidents 1981. Direction Générale de la recherche géologique et minérale. Ministère de l’Énergie et des Ressources. Pages 10-11. DPV 868.
Rive, M., 1981. Darius. In Rapport des géologues résidents 1980. Direction Générale de la recherche géologique et minérale. Ministère de l’Énergie et des Ressources. Page 4. DPV 814.
Robert, F., and Poulsen, K.H., 2001. Vein formation and deformation in greenstone gold deposits, in Richards, J.P., and Tosdal, R.M., eds., Structural Controls on Ore Genesis: Society of Economic Geologists, Reviews in Economic Geology, v. 14, p. 111-155.
Robert, F., Poulsen, K.H., and Dubé, B., 1994, Structural analysis of lode gold deposits in deformed terranes and its application: Geological Survey of Canada, Short course notes, Open File Report 2850, 140 p.
Robert, F., 1990, Structural setting and control of gold-quartz veins of the Val d'Or area, southeastern Abitibi subprovince, in Ho, S.E., Robert, F., and Groves, D.I., eds., Gold and Base-Metal Mineralization in the Abitibi subprovince,
www.innovexplo.com
NI 43 101 Technical Report and Mineral Resource Estimate for the O’Brien Project, Abitibi, Québec – May 2018 124
Canada, with Emphasis on the Quebec Segment: University of Western Australia, Short Course Notes, v. 24, p. 167-210
Sauvé, T., and Trudel, P., 1991. Géologie de la mine O’Brien, région de Cadillac. Ministère des Ressources naturelles du Québec. 39 pages. ET 89-07.
Schaaf, R. E., 1979. Exploration and development Merits Kewagama Gold Mines (Quebec) Ltd, Cadillac Gold Property, Cadillac Township, Quebec. Kewagama Gold Mines Ltd. 74 pages. GM 36987.
Schaaf, R. E., 1976f. Mineral Inventory Compilation, H-4-14 Vein, O’Brien Project, Cadillac Township, Quebec. Darius Gold Mines Inc. Progress Report 5. 7 pages. GM 32217.
Schaaf, R. E., 1976e. Mineral Inventory Compilation, F9 Vein, No. 3 Shaft Zone, O’Brien Project, Cadillac Township, Quebec. Darius Gold Mines Inc. Progress Report 4b. 11 pages. GM 32217.
Schaaf, R. E., 1976d. Mineral Inventory Compilation, F9 Vein, No. 3 Shaft Zone, O’Brien Project, Cadillac Township, Quebec. Darius Gold Mines Inc. Progress Report 4a. 1 pages. GM 32217.
Schaaf, R. E., 1976c. Mineral Inventory Compilation, F9 Vein, No. 2 Shaft Zone, O’Brien Project, Cadillac Township, Quebec. Darius Gold Mines Inc. Progress Report 3. 5 pages. GM 32217. Schaaf, R. E., 1976b. Mineral Inventory Compilation, O’Brien Project, Cadillac Township, Quebec. Darius Gold Mines Inc. Progress Report 2 (No. 1 N Vein). 3 pages. GM 32217.
Schaaf, R. E., 1976a. Mineral Inventory Compilation, O’Brien Project, Cadillac Township, Quebec. Darius Gold Mines Inc. Progress Report 1 (No. 1 S Vein). 11 pages. GM 32217.
Schaaf, R. E., 1972. Report of Ferris (O’Brien property). Internal Report, 20 pages.
Scobie, A. G., 1972. An Investigation of the Recovery of Gold from a sample submitted by R. E. Schaaf, O’Brien Mill tailing Project. Report prepared by Lakefield research of Canada Limited. Internal Report
Thompson, I. S., 1974. Report on Diamond Drilling, August-September 1974, Cadillac Township, Quebec. Kewagama Gold Mines (Quebec) Ltd. 11 pages. GM 30587.
Thurston, P.C., Ayer, J.A., Goutier, J., and Hamilton, M.A., 2008, Depositional gaps in the Abitibi greenstone belt stratigraphy: A key to exploration for syngenetic mineralization. Economic Geology, v. 103, p. 1097−1134.
Thurston, P.C., and Chivers, K.M., 1990, Secular variation in greenstone sequence development emphasizing Superior province, Canada: Precambrian Research, v. 46, p. 21–58.
Trudel, P., Sauvé, P., Tourigny, G., Hubert, C., and Roy, L., 1992. Synthèse des caractéristiques géologiques des gisements d’or de la région de Cadillac (Abitibi). Ministère des Ressources naturelles du Québec.106 pages. MM 91-01.

www.innovexplo.com
NI 43 101 Technical Report and Mineral Resource Estimate for the O’Brien Project, Abitibi, Québec – May 2018 125
Vaillant, R. L., and Hutchinson, R. W., 1982. Stratisgraphic and genesis of gold deposits, Bousquet region, northwestern Quebec. Canadian institute of Mining and metallurgy, special volume 24, pages 27-40.
Vincent, R., 2009. Journeaux de sondages des campagnes de forages de 2006 à 2008, propriétés O’Brien et Kewagama, Cadillac Québec. GM-64406.
Wellstead, M., Newton, B.H., 2014, Technical Report on the 2014 ddh Program and Mineral Resource Estimate, New Alger Property, Abitibi-Temiscamingue, Québec, Renforth Resources Inc., Billiken Management Services, 133 p.
Wright, J. L., 1986. Magnetometer, VLF, and IP Geophysical Surveys - Fall 1985, O’Brien Mine property. Novamin Resources Inc. 18 pages. GM 43306.