nomura sec 2_2014_1q_pres
TRANSCRIPT

I will now give you an overview of our financial results for the first quarter of the year ending March 2014 using the document titled “Consolidated Results of Operations”.
Please turn to page three.

2

3
For the first quarter, we reported a significant increase in both revenue and income compared to the same period last year, driven by a strong contribution from our Japan businesses, particularly Retail.
First quarter net revenue was 431.3 billion yen, income before income taxes was 113.2 billion yen, and net income was 65.9 billion yen. Annualized ROE for the quarter was 11.3 percent.
Following a secondary offering of shares in March, Nomura Real Estate Holdings was converted from a consolidated subsidiary into an equity-method affiliate. Accordingly, from the first quarter of this year, Nomura Real Estate Holdings’ operating revenues, expenses, and net income will no longer be reflected in our consolidated results. Instead, only approximately 34 percent of the company’s net income will be included in our net revenue as equity in earnings of affiliates.
As a result of this deconsolidation and a one-off gain of 50.1 billion yen from the secondary offering in the previous quarter, both net revenue and income before income taxes declined quarter on quarter.
Net revenue from the three business segments was 381.1 billion yen and income before income taxes was 113 billion yen, exceeding the already strong previous quarter. As shown on the right, three segment income before income taxes has increased for four straight quarters and was at the highest level since the quarter ended June 2007.
The performance of each business is shown from page six onwards, which I will discuss in a moment.

4
For now, please turn to page four for an overview of our results.
As I said, because we booked a one-off gain last quarter on the secondary offering of Nomura Real Estate shares and as the company has been deconsolidated from this quarter, net revenue and income before income taxes declined on a quarter-on-quarter basis. However, as shown on the far right, we reported a substantial profit improvement on a year-on-year basis.

5
Please turn to page five for our business segment results.
As shown at the bottom of the page, we booked full career retirement related expenses of 9 billion yen during the first quarter.
To date our internal rules stipulated that when a person left the firm voluntarily they would forfeit stock options and other deferred compensation at the time of their resignation. However, this year we have introduced “Full Career Retirement” provisions which permit the recipients of the awards to continue to vest in the awards upon voluntary termination if certain criteria based on corporate title and length of service within Nomura are met. This is standard practice among our international peers.
By introducing this provision, even though compensation payments will be deferred, we have to recognize the full expense at the time the criteria are met. We expect these expenses to arise each year in the April-June quarter when deferred compensation is granted. However, the total amount will differ depending on the firm’s full year performance and total compensation levels.
The “Other” segment includes a gain of 5.9 billion yen as a result of changes to our own and our counterparty credit spreads, the main factor being a slight widening of our own credit spread.

6
Please turn to page six for our business segment results.
Retail net revenue was 166.3 billion yen, up 20 percent from last quarter. Income before income taxes grew 42 percent to 81.1 billion yen, representing the best quarter since we started disclosing quarterly results in the year ended March 2002.
The market rally in Japan in April and May drove robust sales of stocks and equity-related investment trusts. Total sales for the quarter reached approximately 7 trillion yen as we continued to deliver products tailored to client needs.

7
The graph on the bottom left of page seven shows net asset inflows of 188.1 billion yen and investment trust inflows of 262.1 billion yen, demonstrating solid net inflows amid the market rally when some investors sold to lock in profits.
The graph on the bottom right shows recurring revenue, a key performance indicator, which was at 13.8 billion yen. This puts us ahead of plan as we work towards our revenue target for the year ending March 2016.

8
Please turn to pages eight and nine for Asset Management.
Net revenue in Asset Management increased 10 percent quarter on quarter to 20.2 billion yen. This represents our best quarter since March 2008 driven by dividend income and an expansion in assets under management.
Income before income taxes grew 71 percent to 6.7 billion yen.
Profits remained strong despite the full career retirement related expenses I mentioned.
Inflows into the investment trust business totaled 406 billion yen and the investment advisory business booked inflows of 349 billion yen. Net assets under management increased by 1.2 trillion yen from the end of March to 29.1 trillion yen as of the end of June on the back of better investment performance due to the improved environment.

9
10
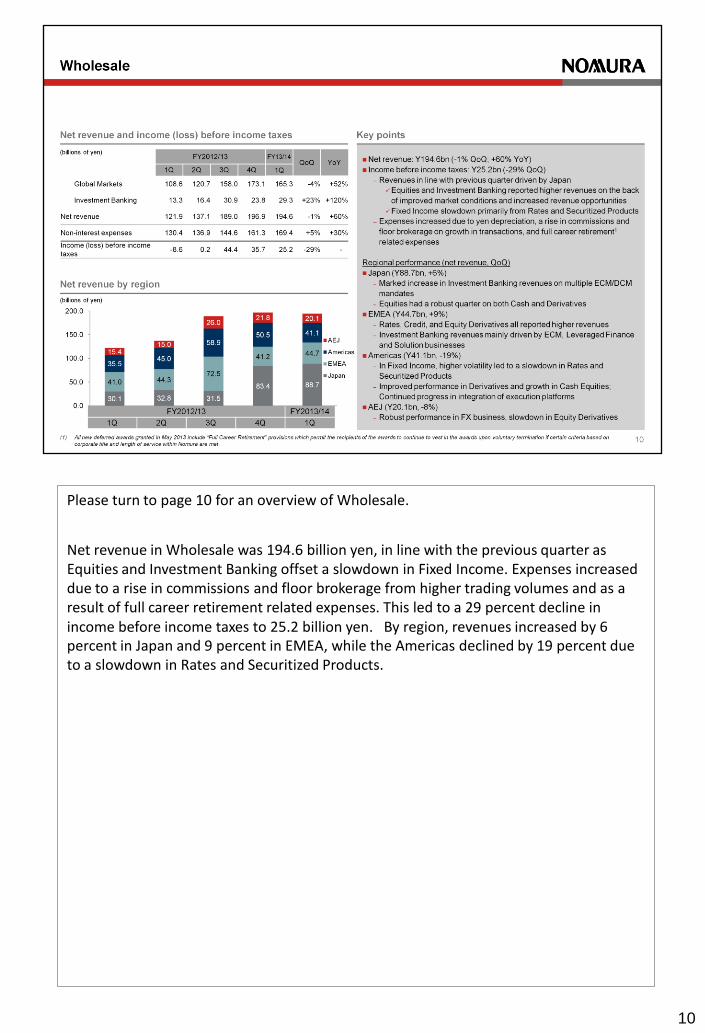
Please turn to page 10 for an overview of Wholesale.
Net revenue in Wholesale was 194.6 billion yen, in line with the previous quarter as Equities and Investment Banking offset a slowdown in Fixed Income. Expenses increased due to a rise in commissions and floor brokerage from higher trading volumes and as a result of full career retirement related expenses. This led to a 29 percent decline in income before income taxes to 25.2 billion yen. By region, revenues increased by 6 percent in Japan and 9 percent in EMEA, while the Americas declined by 19 percent due to a slowdown in Rates and Securitized Products.

11
Please turn to page 11 for an overview of Global Markets results.
Net revenue in Global Markets was 165.3 billion yen. Revenues were resilient as client revenues expanded in all regions despite heightened volatility in the market.
Fixed Income booked net revenue of 97.6 billion yen. As you can see on the top right, EMEA and AEJ remained resilient while the US reported a slowdown mainly in Rates and Securitized Products, resulting in an overall decline in revenues of 14 percent.
Equities reported a 13 percent rise in net revenue to 67.8 billion yen on the back of robust performance in the cash business in Japan and the Americas, including Instinet, and an improvement in the derivatives business in EMEA and the Americas.
12
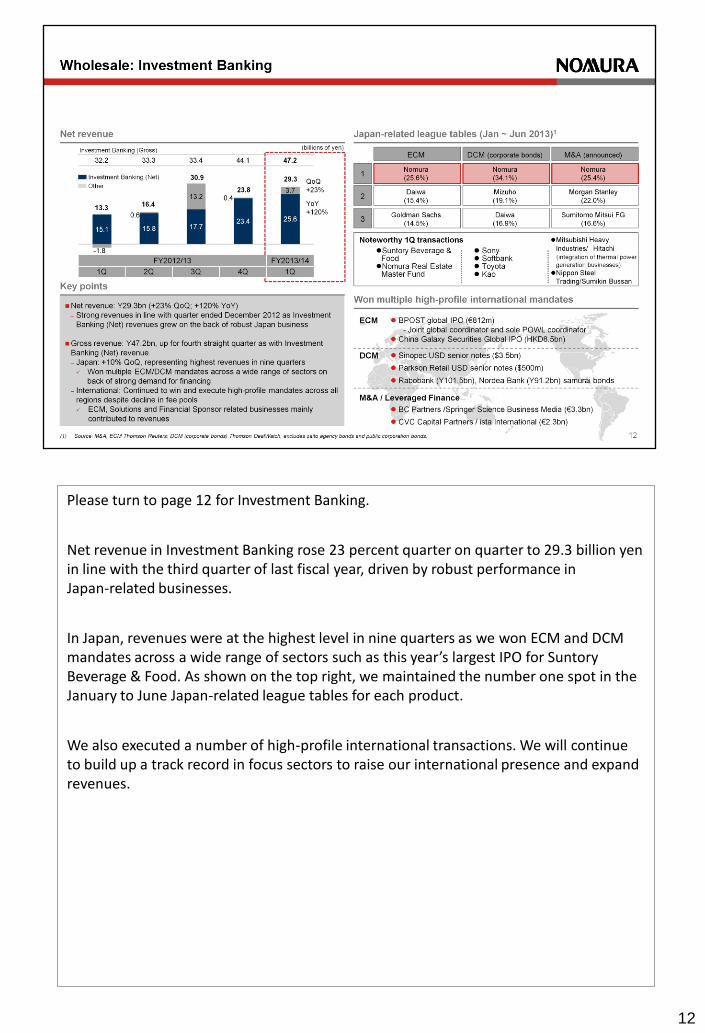
Please turn to page 12 for Investment Banking.
Net revenue in Investment Banking rose 23 percent quarter on quarter to 29.3 billion yen in line with the third quarter of last fiscal year, driven by robust performance in Japan-related businesses.
In Japan, revenues were at the highest level in nine quarters as we won ECM and DCM mandates across a wide range of sectors such as this year’s largest IPO for Suntory Beverage & Food. As shown on the top right, we maintained the number one spot in the January to June Japan-related league tables for each product.
We also executed a number of high-profile international transactions. We will continue to build up a track record in focus sectors to raise our international presence and expand revenues.

13
Please turn to page 13 for an overview of expenses.
Non-interest expenses declined by 34 percent to 318.1 billion yen due to the deconsolidation of Nomura Real Estate Holdings. “Other” expenses, which previously included cost of goods sold at Nomura Real Estate Holdings, declined by 77 percent this quarter.
Excluding Nomura Real Estate Holdings, expenses increased by 8 percent. Compensation and benefits rose due to higher bonus accruals given the robust Japan business, yen depreciation, and full career retirement related expenses of 9 billion yen. Commissions and floor brokerage also increased due to higher trading volumes, primarily in Equities. Restructuring expenses were 2.4 billion yen, down by 5.1 billion yen from last quarter’s total of 7.5 billion yen.
As shown on the bottom right, the 1 billion dollar cost reductions we announced in September last year were 87 percent complete at the end of June and we plan to have them fully completed by March next year.
We are starting to see the benefits of cost reductions and some areas are declining. However, due to the factors I just mentioned, we won’t see tangible results at the firm-wide level until the second half of the current fiscal year. We are maintaining our cost discipline and will continue to focus on lowering our breakeven point.

14
Please turn to page 14 for an update on our balance sheet.
Total assets at the end of June were 4.2 trillion yen, gross leverage was 17.7 times, and net leverage was 10.6 times.
On a Basel 3 basis, our Tier 1 ratio and Tier 1 common ratio were both 11.9 percent.
The 10 percent figure shown on the top right is calculated by applying the 2019 Basel 3 standards to our balance at the end of June. This figure is roughly the same as at the end of March.

15
On page 15, there are no significant changes to our funding and liquidity from March so I will leave it for you to look through later.
That concludes today’s presentation.


17

18

19

20

21

22

23

24

25

26

27

28

29

30

31

32

33

