nonstationary evolution and compositional heterogeneity in ... · at palacky university on june 21,...
TRANSCRIPT

Syst. Biol. 58(4):381–394, 2009Copyright c© Society of Systematic BiologistsDOI:10.1093/sysbio/syp037Advance Access publication on July 15, 2009
Nonstationary Evolution and Compositional Heterogeneity in BeetleMitochondrial Phylogenomics
NATHAN C. SHEFFIELD1,2,∗ , HOJUN SONG1, STEPHEN L. CAMERON3, AND MICHAEL F. WHITING1
1Department of Biology, Brigham Young University, Provo, UT 84602, USA;2Program in Computational Biology & Bioinformatics, Institute for Genome Sciences and Policy, Duke University, Box 90090, Durham, NC 27708, USA;3Australian National Insect Collection, Commonwealth Scientific and Industrial Research Organisation, Entomology, PO Box 1700, Canberra, Australian
Capital Territory, 2601, Australia;∗Correspondence to be sent to: Program in Computational Biology & Bioinformatics, Institute for Genome Sciences and Policy, Duke University,
Box 90090, Durham, NC 27708, USA; E-mail: [email protected].
Nathan C. Sheffield and Hojun Song have contributed equally to this work.
Abstract.—Many published phylogenies are based on methods that assume equal nucleotide composition among taxa.Studies have shown, however, that this assumption is often not accurate, particularly in divergent lineages. Nonstationarysequence evolution, when taxa in different lineages evolve in different ways, can lead to unequal nucleotide composition.This can cause inference methods to fail and phylogenies to be inaccurate. Recent advancements in phylogenetic theoryhave proposed new models of nonstationary sequence evolution; these models often outperform equivalent stationarymodels. A variety of new phylogenetic software implementing such models has been developed, but the studies employingthe new methodology are still few. We discovered convergence of nucleotide composition within mitochondrial genomesof the insect order Coleoptera (beetles). We found variation in base content both among species and among genes in thegenome. To this data set, we have applied a broad range of phylogenetic methods, including some traditional stationarymodels of evolution and all the more recent nonstationary models. We compare 8 inference methods applied to the samedata set. Although the more commonly used methods universally fail to recover established clades, we find that someof the newer software packages are more appropriate for data of this nature. The software packages p4, PHASE, andnhPhyML were able to overcome the systematic bias in our data set, but parsimony, MrBayes, NJ, LogDet, and PhyloBayeswere not. [Base compositional heterogeneity; Coleoptera; LogDet; model of evolution; nonstationary evolution; nucleotidecomposition; phylogeny.]
Most traditional models of DNA evolution invokethe “stationarity assumption,” which implies that basecomposition is constant over all lineages in the data set(Galtier and Gouy 1995). This is a valid assumption forsome data sets; however, when the assumption is vi-olated, phylogenetic methods can inaccurately groupspecies whose base composition is similar, regardlessof evolutionary history (Collins et al. 1994; Lockhartet al. 1994; Ho and Jermiin 2004; Jermiin et al. 2004; Coxet al. 2008). Although there has been argument as tothe magnitude of the problem (van den Bussche et al.1998; Conant and Lewis 2001; Gruber et al. 2007), its ex-istence is widely accepted. The easiest solution is simplyto avoid nonstationary genes (Collins et al. 2005), butthis is not always possible. A distance-based transfor-mation method known as LogDet/Paralinear distances(Lake 1994; Lockhart et al. 1994) can correct for compo-sitional bias and is commonly used (e.g., Gibson et al.2005; Gruber et al. 2007), but its effectiveness is not uni-versal (Foster and Hickey 1999; Tarrıo et al. 2001). Datarecoding is also widely used in several forms, such asamino acid translations (Loomis and Smith 1990), RYcoding (Brown et al. 1982; Phillips and Penny 2003),discarding/downweighting third codon positions (e.g.,Chang and Campbell 2000; Delsuc et al. 2003), or Day-hoff coding (Hrdy et al. 2004). Such methods are usuallyable to overcome bias problems, but they also discarduseful signal and can introduce artifactual relationships(Campbell et al. 2000; Tarrıo et al. 2000; Cameron et al.2006; Fenn et al. 2008).
Recently, several complex statistical approaches havebeen proposed and implemented in software such asp4 (Foster 2004), nhPhyML (Boussau and Gouy 2006),PHASE (Gowri-Shankar and Rattray 2007), and Phy-loBayes (Blanquart and Lartillot 2006). nhPhyML is amaximum likelihood method based on the evolution-ary model of Galtier and Gouy (1995), which modelsnonstationary evolution by specifying a different GCcontent for each branch in the tree. In p4, PHASE, andPhyloBayes, varying numbers of “composition vectors”model nonstationary evolution in a Bayesian frame-work. These software packages have all been shown tosucceed in some cases; however, their efficacy has notbeen thoroughly tested using real data sets.
Although theoretical and simulation studies haveidentified and explored the problem relatively thor-oughly (Galtier and Gouy 1995; Jermiin et al. 2004), therehave only been a handful of studies applying avail-able methods to real data sets. Of the few such studies,most are based on widely divergent taxa because con-vergent nucleotide composition is more common andnoticeable in divergent lineages (e.g., Loomis and Smith1990; Galtier and Gouy 1995; Herbeck et al. 2005). Lessoften, studies uncover the issue at lower levels suchas within Lepidoptera (Campbell et al. 2000) or Mam-malia (van den Bussche et al. 1998; Gibson et al. 2005)or even within the genus Drosophila (Rodrıguez-Trelleset al. 1999; Tarrıo et al. 2000). Most of these studieshave focused on the effect of compositional bias in re-latively few genes. How compositional bias can affect
381
at Palacky U
niversity on June 21, 2010 http://sysbio.oxfordjournals.org
Dow
nloaded from
382 SYSTEMATIC BIOLOGY VOL. 58
phylogenetic inference in complex heterogeneous datasets has not been explored thoroughly (but see Collinset al. 2005; Gibson et al. 2005; Rodriguez-Ezpeleta et al.2007).
We investigated the effect of base compositional het-erogeneity in phylogenetic reconstruction using mito-chondrial genome (mtgenome) data of the insect orderColeoptera (beetles). We have previously describedcomplete mtgenomes for 6 beetle species (Sheffield et al.2008) and found that there is considerable variation inbase composition among beetles. When we constructeda preliminary phylogeny of Coleoptera using both par-simony and Bayesian methods, we found some unex-pected groupings. Because mtgenome data are knownto be capable of resolving insect ordinal relationships ac-curately (see also Rubinoff and Holland 2005; Cameronet al. 2007; Fenn et al. 2008), we investigated the causeof the surprising preliminary results.
In particular, we noticed 3 unusual relationshipsin our initial analysis. First, the preliminary analy-ses placed Tetraphalerus bruchi within the suborderPolyphaga. Tetraphalerus is a member of a family Om-matidae, 1 of 3 extant families of the basal suborderArchostemata (Lawrence and Newton 1982; Beutelet al. 2008). Archostemata is recorded from the Meso-zoic, with at least 13 known extinct species from theJurassic and Cretaceous, and thus represents one ofthe oldest living lineages of Coleoptera (Crowson 1960;Ponomarenko 1969; Beutel et al. 2008). Archostematacontains mostly wood-boring beetles and its mono-phyly is well supported by several synapomorphies,including the reduction of the anterior tentorial arms,the reduction of the frontoclypeal suture, the distinctlyreduced mentum, a median ridge on the first abdominalventrite, and other adult and larval features (Beutel et al.2008). Beutel and Haas (2000) found Archostemata to besister to the remaining Coleoptera based on morpho-logical data, and Hughes et al. (2006) found the samerelationship based on a phylogenomic analysis using 66ribosomal protein expressed sequence tags (ESTs). Themost comprehensive molecular phylogeny of Coleopterato date (Hunt et al. 2007) found that Archostemata wassister to Myxophaga. Therefore, it is likely that place-ment of Tetraphalerus within Polyphaga is erroneous.Second, our initial analyses found that the monophyleticTenebrionidae did not group with other cucujiformtaxa, thereby rendering the infraorder Cucujiformiaparaphyletic. Cucujiformia is a diverse clade withinColeoptera that contains more than half of all beetlesand includes weevils, darkling beetles, leaf beetles,and longhorn beetles. Its monophyly is strongly sup-ported morphologically by cryptonephridic Malpighiantubules (Poll 1932; Stammer 1934), nonfunctional and re-duced spiracles on eighth abdominal segment (Crowson1960), and other characters (Wachmann 1977; Caveney1986). Both the EST study (Hughes et al. 2006) andthe molecular phylogeny (Hunt et al. 2007) unambigu-ously found Cucujiformia monophyletic and Tenebrion-idae to belong to this group with high support values.Therefore, a paraphyletic Cucujiformia as found in our
preliminary analyses is likely incorrect. Finally, ouranalyses failed to recover a monophyletic Elateroideabecause the elaterid Pyrophorus divergens formed astrong group with other polyphagans belonging to dif-ferent lineages. The monophyly of Elateroidea sensuLawrence (1988) is supported by a single pair of well-developed stemmata in larvae and the presence ofonly 4 Malpighian tubules in adults and has also beenconsistently supported by molecular data (Bocakovaet al. 2007; Hunt et al. 2007). Therefore, Elateridae fallingoutside of the remaining Elateroidea is probably inaccu-rate. Other relationships derived from the preliminaryanalyses were difficult to assess given that single rep-resentatives from diverse lineages were included. Wesuspected that the incorrect groupings with high sup-port values might be because a number of divergenttaxa share similar base composition.
Herein, we test our data set for compositional het-erogeneity (among species and among genes) that maycause incorrect phylogenetic relationships. Using the 3relationships described above as indicator relationshipsof correct topology, we examine several commonly usedphylogenetic inference methods (distance, parsimony,and Bayesian) and explore a number of methods that aredesigned to overcome the systematic bias arising fromnonstationarity. We focus our comparison on model-based methods because these methods have not beenthoroughly compared using empirical data. We alsopresent the result of amino acid recoding here for com-parison. We demonstrate that there is compositionalheterogeneity among species and that it is distributed ina complex manner among the 13 protein-coding genesof the mtgenome. We show that standard phylogeneticmethods consistently fail to recover the correct topol-ogy, whereas some of the new methods that explicitlyaccount for the bias can overcome the problem.
MATERIALS AND METHODS
Taxon and Character SamplingEighteen taxa were analyzed in this study, includ-
ing 13 coleopteran in-group and 5 out-group (3 lepi-dopteran and 2 dipteran) taxa (Table 1). We sequencedcomplete coding regions from 5 new coleopteran speciesfor this study: Chauliognathus opacus (Cantharidae),Adelium sp. (Tenebrionidae), Apatides fortis (Bostrichi-dae), Lucanus mazama (Lucanidae), and Acmaeodera sp.(Buprestidae) (GenBank accession numbers FJ613418–FJ613422; Table 1). Descriptions of these new mtgenomesare presented in Appendix Table A1. The in-groupsampling represents 2 suborders (Archostemata andPolyphaga), 4 infraorders, 8 superfamilies, and 12 fami-lies within Coleoptera.
We generated the complete mtgenomes used in thisstudy using the primer-walking protocols of Cameronet al. (2007) modified for Coleoptera (primers availablefrom H.S.). We annotated the new mtgenomes usingMOSAS (http://mosas.byu.edu), following Sheffieldet al. (2008). For the present study, we used all 13
at Palacky U
niversity on June 21, 2010 http://sysbio.oxfordjournals.org
Dow
nloaded from

2009 SHEFFIELD ET AL.—COMPOSITIONAL BIAS IN COLEOPTERAN MTGENOMES 383
TAB
LE
1.Ta
xaus
edin
this
stud
y
Taxa
incl
uded
Ord
erSu
bord
erIn
frao
rder
Supe
rfam
ilyFa
mily
Gen
Bank
Ref
eren
ce
Ano
phel
esga
mbi
aeD
ipte
ra—
——
Cul
icid
aeN
C00
2084
Bear
det
al.(
1993
)D
roso
phila
yaku
baD
ipte
ra—
——
Dro
soph
ilida
eN
C00
1322
Cla
ryan
dW
olst
enho
me
(198
5)O
stri
nia
nubi
alis
Lepi
dopt
era
——
—C
ram
bida
eN
C00
3367
Coa
tes
etal
.(20
05)
Bom
byx
mor
iLe
pido
pter
a—
——
Bom
byci
dae
NC
0023
55(u
npub
lishe
d)A
nthe
raea
pern
yiLe
pido
pter
a—
——
Satu
rniid
aeN
C00
4622
(unp
ublis
hed)
Tetr
apha
leru
sbr
uchi
Col
eopt
era
Arc
host
emat
a—
—O
mm
atid
aeN
C01
1328
Shef
field
etal
.(20
08)
Cri
ocer
isdu
odec
impu
ncta
taC
oleo
pter
aPo
lyph
aga
Cuc
ujif
orm
iaC
hrys
omel
oide
aC
hrys
omel
idae
NC
0033
72Fr
iedr
ich
and
Muq
im(2
003)
Pria
silp
haob
scur
aC
oleo
pter
aPo
lyph
aga
Cuc
ujif
orm
iaC
ucuj
oide
aPh
loeo
stic
hida
eN
C01
1326
Shef
field
etal
.(20
08)
Cha
etos
oma
scar
itide
sC
oleo
pter
aPo
lyph
aga
Cuc
ujif
orm
iaC
lero
idea
Cha
etos
omat
idae
NC
0113
24Sh
effie
ldet
al.(
2008
)Tr
ibol
ium
cast
aneu
mC
oleo
pter
aPo
lyph
aga
Cuc
ujif
orm
iaTe
nebr
iono
idea
Tene
brio
nida
eN
C00
3081
Stew
arta
ndBe
chen
bach
(200
3)A
deliu
msp
.C
oleo
pter
aPo
lyph
aga
Cuc
ujif
orm
iaTe
nebr
iono
idea
Tene
brio
nida
eFJ
6134
22Th
isst
udy
Pyro
coel
iaru
faC
oleo
pter
aPo
lyph
aga
Elat
erif
orm
iaEl
ater
oide
aLa
mpy
rida
eN
C00
3970
Bae
etal
.(20
04)
Pyro
phor
usdi
verg
ens
Col
eopt
era
Poly
phag
aEl
ater
ifor
mia
Elat
eroi
dea
Elat
erid
aeN
C00
9964
Arn
oldi
etal
.(20
07)
Rha
goph
thal
mus
lufe
ngen
sis
Col
eopt
era
Poly
phag
aEl
ater
ifor
mia
Elat
eroi
dea
Rha
goph
thal
mid
aeN
C01
0969
Liet
al.(
2007
)C
haul
iogn
athu
sop
acus
Col
eopt
era
Poly
phag
aEl
ater
ifor
mia
Elat
eroi
dea
Can
thar
idae
FJ61
3418
This
stud
yA
cmae
oder
asp
.C
oleo
pter
aPo
lyph
aga
Elat
erif
orm
iaBu
pres
toid
eaBu
pres
tida
eFJ
6134
20Th
isst
udy
Apa
tides
fort
isC
oleo
pter
aPo
lyph
aga
Bost
rich
ifor
mia
Bost
rich
oide
aBo
stri
chid
aeFJ
6134
21Th
isst
udy
Luca
nus
maz
ama
Col
eopt
era
Poly
phag
aSc
arab
aeif
orm
iaSc
arab
aeoi
dea
Luca
nida
eFJ
6134
19Th
isst
udy
protein-coding genes for phylogenetic analysis. Wealigned nucleotide sequences for each gene individu-ally with MUSCLE (Edgar 2004) and concatenated thealignments to form a single matrix consisting of 11 633aligned nucleotide characters, which we used through-out the study. We also aligned amino acid translations ofeach gene separately and used the concatenated aminoacid data matrix (3880 characters) to examine the effectof amino acid recoding. To test how nucleotide align-ment might affect our results, we back translated theamino acid alignments into nucleotide sequences us-ing ClustalW as implemented in MEGA 4.0 (Tamuraet al. 2007). The resulting matrix after concatenation ofindividual alignments consisted of 11 655 nucleotidecharacters
Assessment of the Degree of HeterogeneityWe calculated base composition of each taxon for each
of the 13 protein-coding genes as well as that of the finalconcatenated data set. Because AT% (or reciprocal GC%)represented the compositional bias the best (Fig. 1), wecompared the calculated AT% for each gene among thebeetle species included in this study. We mapped the to-tal AT% for each species onto the resulting phylogeny toexamine the distribution pattern of compositional bias.
To measure the variation in evolutionary pattern,we calculated the disparity index (ID) (Kumar andGadagkar 2001) for all 13 genes together and pairwise.We also tested the homogeneity of substitution pattern(ID test) using a Monte–Carlo method with 1000 repli-cates as implemented in MEGA 4.0 (Tamura et al. 2007).We calculated the probability of rejecting the null hy-pothesis that sequences have evolved with the samepattern of substitution at α < 0.01. All positions con-taining gaps and missing data were removed from thedata set (complete deletion option).
Phylogenetic Analyses and Comparison of MethodsWe analyzed the data using several different inference
methods to compare the effect of base compositionalheterogeneity. We measured topological accuracy bythe presence of the 3 indicator relationships: 1) a sisterrelationship between monophyletic Archostemata andPolyphaga, 2) a monophyletic Cucujiformia (Tenebri-onidae grouping with other cucujiform taxa), and 3) amonophyletic Elateroidea. Because these relationshipsare well established, deviations serve as an indicator ofmisleading phylogenetic signal. Due to limited taxonsampling in our analysis, we were less concerned aboutthe internal relationships within these clades. Our aimin this study was not so much to explore the relation-ships within Coleoptera, which would require moreextensive taxon sampling, but to determine the mostrobust methods against the systematic bias.
For our analysis, we divided the methods into 2groups. The first group consisted of methods not de-signed to deal with compositional bias, and we call these
at Palacky U
niversity on June 21, 2010 http://sysbio.oxfordjournals.org
Dow
nloaded from

384 SYSTEMATIC BIOLOGY VOL. 58
FIGURE 1. Base composition as calculated based on different pairs of bases across Coleoptera for our data set.
approaches “time homogeneous.” We analyzed the dataset in a conventional manner using distance, parsimony,and Bayesian methods. We performed neighbor join-ing (NJ) in PAUP* 4b10 (Swofford 2002) under severaldistance models (JC, HKY85, and GTR), both with andwithout gamma-distributed among-site rate hetero-geneity, each with 1000 bootstrap replicates to assessnodal support. For the parsimony analysis, for each nu-cleotide alignment, we performed 1000 random addi-tion heuristic search replicates for each of 100 bootstrapiterations in PAUP* 4b10 (gaps were treated as miss-ing). We also ran the parsimony analysis on the aminoacid alignment to determine the effect of data recoding.For the Bayesian analysis, we performed a partitionedmodel analysis with a separate GTR + G + I model foreach gene (per recommendation by MrModelTest ver-sion 2; Nylander 2004) and ran 4 separate runs eachwith 4 chains for 10 million generations, sampling every1000 trees in MrBayes 3.1.1 (Ronquist and Huelsenbeck2003). We repeated this analysis after partitioning thedata by codon position (instead of by gene) as well. Weplotted the likelihood trace in R (R Development CoreTeam 2008) and examined sliding and cumulative splitposterior probabilities using AWTY (Nylander et al.2008) for each run to assess convergence and discardedthe first 1 million generations as burn-in.
We also analyzed the data set using robust methodsthat have been designed to account for compositionalbias, which we call “time heterogeneous” approaches.We performed a NJ analysis under a LogDet trans-formation (Lockhart et al. 1994). Because the LogDettransformation is known to be affected by inclusionof invariable sites (Steel et al. 2000), we estimated theproportion of invariable sites under various modelsof sequence evolution (F81, F81 + G, HKY85, HKY85+ G, GTR, and GTR + G) and removed the estimatedproportions for the LogDet analyses. In a likelihoodframework, we used the nonstationary nonhomoge-
neous model of evolution of Galtier and Gouy (1998) asimplemented in nhPhyML (Boussau and Guoy 2006).Although recent improvements have increased the tree-searching capabilities in nhPhyML, search space is stilllimited. Studies employing this model have been re-stricted to testing the likelihood of opposing hypotheses(trees) rather than relying on tree search to yield themaximum likelihood estimate. Because this softwarerequired an input topology, we supplied 2 rooted trees,one from the LogDet analysis and another from the p4analysis (see below). We used nhPhyML-Discrete lim-ited to 4 base content frequency categories and with a4-category discrete gamma model of among-site ratevariation. We also tried other settings for nhPhyMLsuch as ignoring among-site rate variation and using acontinuous range of equilibrium frequencies. To analyzethe data from a nonstationary Bayesian framework, weused 3 different software packages: p4 v.0.85-0.86 (Foster2004), PhyloBayes 2.3 (Blanquart and Lartillot 2006), andPHASE 2.1alpha (Gowri-Shankar and Rattray 2007). Forour p4 analysis, we adjusted tuning numbers by handduring preliminary runs to achieve acceptance propor-tions near 40% for most proposals (topology changesstayed near 5%). We used a single GTR + I + dG modelwith 4 gamma categories and 3 composition vectors. Weperformed 3 runs with 4 chains each for 3 million gener-ations, sampling every 1000 trees. We discarded the first2 million generations as burn-in. For PhyloBayes, weperformed 2 runs for each of 4 analyses using the fol-lowing parameter combinations: -cat -gtr, -cat -poisson,-ncat 3 -gtr, and -ncat 3 -poisson. Each run continuedfor 10 000–30 000 points (differences in computationalrequirements changed the length of the runs). The alphaversion of PHASE 2.1 includes a reversible jump al-gorithm that allows a variable number of compositionvectors to be used to describe the data. We performed4 runs each with 4 chains for 9 million generations,sampling every 500 trees. We used a different starting
at Palacky U
niversity on June 21, 2010 http://sysbio.oxfordjournals.org
Dow
nloaded from
2009 SHEFFIELD ET AL.—COMPOSITIONAL BIAS IN COLEOPTERAN MTGENOMES 385
random seed and initial number of composition vectors(1, 2, 5, and 10) for each iteration. We discarded the first3 million generations as burn-in. For these Bayesianruns, we assessed convergence by monitoring log likeli-hood traces using R (R Development Core Team 2008),cumulative and sliding window split frequencies us-ing AWTY (Nylander et al. 2008), across-run topologyconsensus trees, and the PhyloBayes bpcomp run com-parison utility.
RESULTS
Level of Base Compositional HeterogeneityThe total AT% of all included coleopteran species
ranged between 65.63% and 78.19% with a mean of71.41 (±4.88)%. The 5 out-group taxa had a total AT%between 76.00% and 79.58% with a mean of 78.02(±1.54)%. Among beetles, Acmaeodera, Apatides, Lucanus,Pyrophorus, Tetraphalerus, and Tribolium had total AT%below 70%. Other beetles with the exception of Adelium(70.42%) had higher AT% than the out-groups. When wecompared base composition for individual genes, therewas a considerable amount of interspecific variation(Fig. 7).
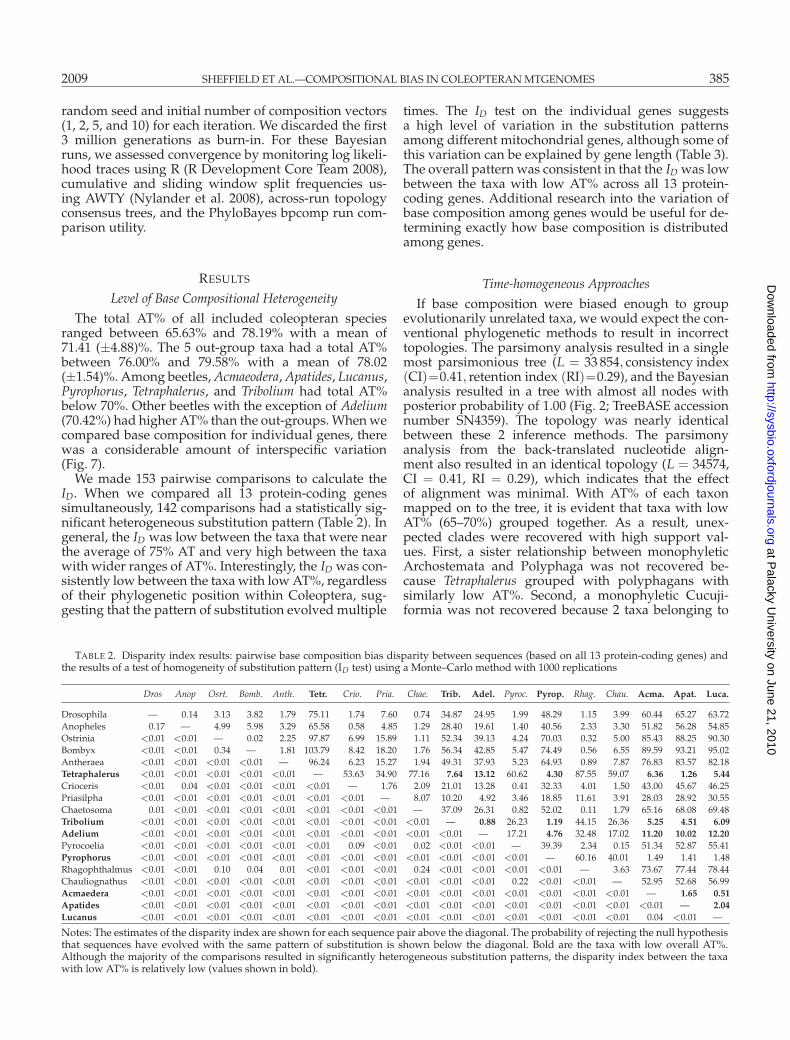
We made 153 pairwise comparisons to calculate theID. When we compared all 13 protein-coding genessimultaneously, 142 comparisons had a statistically sig-nificant heterogeneous substitution pattern (Table 2). Ingeneral, the ID was low between the taxa that were nearthe average of 75% AT and very high between the taxawith wider ranges of AT%. Interestingly, the ID was con-sistently low between the taxa with low AT%, regardlessof their phylogenetic position within Coleoptera, sug-gesting that the pattern of substitution evolved multiple
times. The ID test on the individual genes suggestsa high level of variation in the substitution patternsamong different mitochondrial genes, although some ofthis variation can be explained by gene length (Table 3).The overall pattern was consistent in that the ID was lowbetween the taxa with low AT% across all 13 protein-coding genes. Additional research into the variation ofbase composition among genes would be useful for de-termining exactly how base composition is distributedamong genes.
Time-homogeneous ApproachesIf base composition were biased enough to group
evolutionarily unrelated taxa, we would expect the con-ventional phylogenetic methods to result in incorrecttopologies. The parsimony analysis resulted in a singlemost parsimonious tree (L = 33 854, consistency index(CI)=0.41, retention index (RI)=0.29), and the Bayesiananalysis resulted in a tree with almost all nodes withposterior probability of 1.00 (Fig. 2; TreeBASE accessionnumber SN4359). The topology was nearly identicalbetween these 2 inference methods. The parsimonyanalysis from the back-translated nucleotide align-ment also resulted in an identical topology (L = 34574,CI = 0.41, RI = 0.29), which indicates that the effectof alignment was minimal. With AT% of each taxonmapped on to the tree, it is evident that taxa with lowAT% (65–70%) grouped together. As a result, unex-pected clades were recovered with high support val-ues. First, a sister relationship between monophyleticArchostemata and Polyphaga was not recovered be-cause Tetraphalerus grouped with polyphagans withsimilarly low AT%. Second, a monophyletic Cucuji-formia was not recovered because 2 taxa belonging to
TABLE 2. Disparity index results: pairwise base composition bias disparity between sequences (based on all 13 protein-coding genes) andthe results of a test of homogeneity of substitution pattern (ID test) using a Monte–Carlo method with 1000 replications
Dros Anop Osrt. Bomb. Anth. Tetr. Crio. Pria. Chae. Trib. Adel. Pyroc. Pyrop. Rhag. Chau. Acma. Apat. Luca.
Drosophila — 0.14 3.13 3.82 1.79 75.11 1.74 7.60 0.74 34.87 24.95 1.99 48.29 1.15 3.99 60.44 65.27 63.72Anopheles 0.17 — 4.99 5.98 3.29 65.58 0.58 4.85 1.29 28.40 19.61 1.40 40.56 2.33 3.30 51.82 56.28 54.85Ostrinia <0.01 <0.01 — 0.02 2.25 97.87 6.99 15.89 1.11 52.34 39.13 4.24 70.03 0.32 5.00 85.43 88.25 90.30Bombyx <0.01 <0.01 0.34 — 1.81 103.79 8.42 18.20 1.76 56.34 42.85 5.47 74.49 0.56 6.55 89.59 93.21 95.02Antheraea <0.01 <0.01 <0.01 <0.01 — 96.24 6.23 15.27 1.94 49.31 37.93 5.23 64.93 0.89 7.87 76.83 83.57 82.18Tetraphalerus <0.01 <0.01 <0.01 <0.01 <0.01 — 53.63 34.90 77.16 7.64 13.12 60.62 4.30 87.55 59.07 6.36 1.26 5.44Crioceris <0.01 0.04 <0.01 <0.01 <0.01 <0.01 — 1.76 2.09 21.01 13.28 0.41 32.33 4.01 1.50 43.00 45.67 46.25Priasilpha <0.01 <0.01 <0.01 <0.01 <0.01 <0.01 <0.01 — 8.07 10.20 4.92 3.46 18.85 11.61 3.91 28.03 28.92 30.55Chaetosoma 0.01 <0.01 <0.01 <0.01 <0.01 <0.01 <0.01 <0.01 — 37.09 26.31 0.82 52.02 0.11 1.79 65.16 68.08 69.48Tribolium <0.01 <0.01 <0.01 <0.01 <0.01 <0.01 <0.01 <0.01 <0.01 — 0.88 26.23 1.19 44.15 26.36 5.25 4.51 6.09Adelium <0.01 <0.01 <0.01 <0.01 <0.01 <0.01 <0.01 <0.01 <0.01 <0.01 — 17.21 4.76 32.48 17.02 11.20 10.02 12.20Pyrocoelia <0.01 <0.01 <0.01 <0.01 <0.01 <0.01 0.09 <0.01 0.02 <0.01 <0.01 — 39.39 2.34 0.15 51.34 52.87 55.41Pyrophorus <0.01 <0.01 <0.01 <0.01 <0.01 <0.01 <0.01 <0.01 <0.01 <0.01 <0.01 <0.01 — 60.16 40.01 1.49 1.41 1.48Rhagophthalmus <0.01 <0.01 0.10 0.04 0.01 <0.01 <0.01 <0.01 0.24 <0.01 <0.01 <0.01 <0.01 — 3.63 73.67 77.44 78.44Chauliognathus <0.01 <0.01 <0.01 <0.01 <0.01 <0.01 <0.01 <0.01 <0.01 <0.01 <0.01 0.22 <0.01 <0.01 — 52.95 52.68 56.99Acmaedera <0.01 <0.01 <0.01 <0.01 <0.01 <0.01 <0.01 <0.01 <0.01 <0.01 <0.01 <0.01 <0.01 <0.01 <0.01 — 1.65 0.51Apatides <0.01 <0.01 <0.01 <0.01 <0.01 <0.01 <0.01 <0.01 <0.01 <0.01 <0.01 <0.01 <0.01 <0.01 <0.01 <0.01 — 2.04Lucanus <0.01 <0.01 <0.01 <0.01 <0.01 <0.01 <0.01 <0.01 <0.01 <0.01 <0.01 <0.01 <0.01 <0.01 <0.01 0.04 <0.01 —
Notes: The estimates of the disparity index are shown for each sequence pair above the diagonal. The probability of rejecting the null hypothesisthat sequences have evolved with the same pattern of substitution is shown below the diagonal. Bold are the taxa with low overall AT%.Although the majority of the comparisons resulted in significantly heterogeneous substitution patterns, the disparity index between the taxawith low AT% is relatively low (values shown in bold).
at Palacky U
niversity on June 21, 2010 http://sysbio.oxfordjournals.org
Dow
nloaded from

386 SYSTEMATIC BIOLOGY VOL. 58
TABLE 3. ID test summary
Gene Number of comparisons with Proportion of significant Aligned length ofsignificant heterogeneity heterogeneity from all gene partition
comparisons (out of 153) (%)
nd2 123 80.39 1099cox1 121 79.08 1549cox2 101 66.01 689atp8 32 20.92 218atp6 105 68.63 750cox3 97 63.40 792nd3 78 50.98 361nd5 117 76.47 1773nd4 106 69.28 1391nd4l 29 18.95 306nd6 76 49.67 561cytb 118 77.12 1156nd1 92 60.13 988Notes: Summary of the ID test on individual gene partitions. For each gene, a total of 153 pairwise comparisons were made and shown hereare the number of comparisons with the probability of rejecting the null hypothesis that sequences have evolved with the same pattern ofsubstitution at the α < 0.01 level. The same number is also shown in the form of proportion. There is a positive correlation between the resultof ID test and the length of gene (Pearson correlation coefficient = 0.8117).
Tenebrionidae (Tribolium and Adelium) grouped withother low AT% taxa, thereby forming a paraphyleticCucujiformia with a clade formed by Cleroidea (Chaeto-soma), Chrysomeloidea (Crioceris), and Cucujoidea (Pri-asilpha). Third, a monophyletic Elateroidea was notrecovered because 1 of the 4 members of the superfamilyincluded in the analysis (Pyrophorus) grouped with otherlow AT% taxa, resulting in a paraphyletic Elateroidea.Finally, 3 divergent polyphagan taxa, Apatides, Lucanus,and Acmaeodera, were closely grouped, presumablybecause they share similarly low AT% (although thisgrouping could be feasible due to small taxon sam-
pling; see Hunt 2007). The codon position partitionedBayesian analysis yielded a similar topology, althougha monophyletic Elateroidea was recovered. The other2 unexpected relationships (the erroneous Tetraphalerusand Cucujiformia groupings) were equivalent.
Time-heterogeneous ApproachesLogDet transformation has been shown to correct
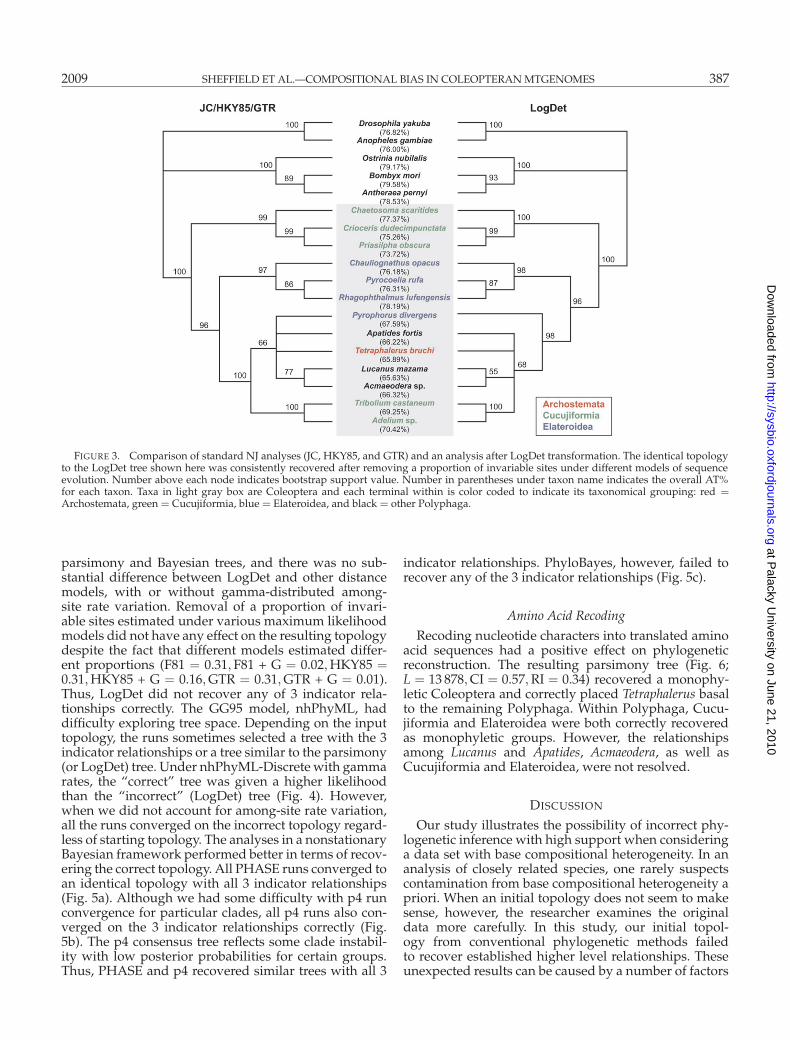
for compositional bias (Lockhart et al. 1994), but it didnot help recover the correct topology for our data set(Fig. 3). It recovered nearly the same topology as the
FIGURE 2. The single most parsimonious tree with bootstrap support values and the Bayesian tree with posterior probability. Number inparentheses under taxon name indicates the overall AT% for each taxon. Taxa in light gray box are Coleoptera and each terminal within is colorcoded to indicate its taxonomical grouping: red = Archostemata, green = Cucujiformia, blue = Elateroidea, and black = other Polyphaga.
at Palacky U
niversity on June 21, 2010 http://sysbio.oxfordjournals.org
Dow
nloaded from
2009 SHEFFIELD ET AL.—COMPOSITIONAL BIAS IN COLEOPTERAN MTGENOMES 387
FIGURE 3. Comparison of standard NJ analyses (JC, HKY85, and GTR) and an analysis after LogDet transformation. The identical topologyto the LogDet tree shown here was consistently recovered after removing a proportion of invariable sites under different models of sequenceevolution. Number above each node indicates bootstrap support value. Number in parentheses under taxon name indicates the overall AT%for each taxon. Taxa in light gray box are Coleoptera and each terminal within is color coded to indicate its taxonomical grouping: red =Archostemata, green = Cucujiformia, blue = Elateroidea, and black = other Polyphaga.
parsimony and Bayesian trees, and there was no sub-stantial difference between LogDet and other distancemodels, with or without gamma-distributed among-site rate variation. Removal of a proportion of invari-able sites estimated under various maximum likelihoodmodels did not have any effect on the resulting topologydespite the fact that different models estimated differ-ent proportions (F81 = 0.31,F81 + G = 0.02,HKY85 =0.31,HKY85 + G = 0.16,GTR = 0.31,GTR + G = 0.01).Thus, LogDet did not recover any of 3 indicator rela-tionships correctly. The GG95 model, nhPhyML, haddifficulty exploring tree space. Depending on the inputtopology, the runs sometimes selected a tree with the 3indicator relationships or a tree similar to the parsimony(or LogDet) tree. Under nhPhyML-Discrete with gammarates, the “correct” tree was given a higher likelihoodthan the “incorrect” (LogDet) tree (Fig. 4). However,when we did not account for among-site rate variation,all the runs converged on the incorrect topology regard-less of starting topology. The analyses in a nonstationaryBayesian framework performed better in terms of recov-ering the correct topology. All PHASE runs converged toan identical topology with all 3 indicator relationships(Fig. 5a). Although we had some difficulty with p4 runconvergence for particular clades, all p4 runs also con-verged on the 3 indicator relationships correctly (Fig.5b). The p4 consensus tree reflects some clade instabil-ity with low posterior probabilities for certain groups.Thus, PHASE and p4 recovered similar trees with all 3
indicator relationships. PhyloBayes, however, failed torecover any of the 3 indicator relationships (Fig. 5c).
Amino Acid RecodingRecoding nucleotide characters into translated amino
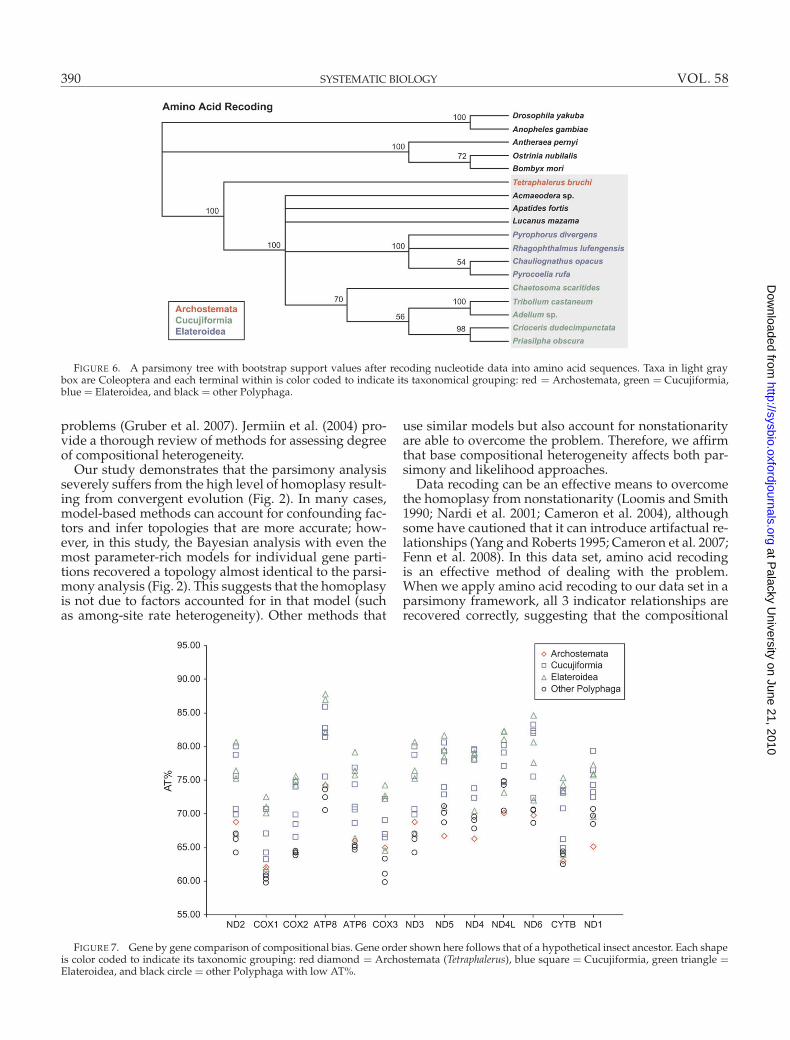
acid sequences had a positive effect on phylogeneticreconstruction. The resulting parsimony tree (Fig. 6;L = 13 878,CI = 0.57,RI = 0.34) recovered a monophy-letic Coleoptera and correctly placed Tetraphalerus basalto the remaining Polyphaga. Within Polyphaga, Cucu-jiformia and Elateroidea were both correctly recoveredas monophyletic groups. However, the relationshipsamong Lucanus and Apatides, Acmaeodera, as well asCucujiformia and Elateroidea, were not resolved.
DISCUSSION
Our study illustrates the possibility of incorrect phy-logenetic inference with high support when consideringa data set with base compositional heterogeneity. In ananalysis of closely related species, one rarely suspectscontamination from base compositional heterogeneity apriori. When an initial topology does not seem to makesense, however, the researcher examines the originaldata more carefully. In this study, our initial topol-ogy from conventional phylogenetic methods failedto recover established higher level relationships. Theseunexpected results can be caused by a number of factors
at Palacky U
niversity on June 21, 2010 http://sysbio.oxfordjournals.org
Dow
nloaded from

388 SYSTEMATIC BIOLOGY VOL. 58
FIGURE 4. Results of nhPhyML-Discrete with gamma-distributed rate variation. The analysis results in different topologies, dependingon which input tree is used. Each coleopteran terminal within is color coded to indicate its taxonomical grouping: red = Archostemata,green= Cucujiformia, blue = Elateroidea, and black = other Polyphaga.
other than nonstationary evolution, such as long-branchattraction (Felsenstein 1978; Bergsten 2005), heterotachy(Kolaczkowski and Thornton 2004; Philippe et al. 2005;Ruano-Rubio and Fares 2007), and among-site rate vari-ation (Yang 1996; Steel et al. 2000). A combination ofthese and other factors is at work in any evolutionaryanalysis. As such, it would be overly simplistic to as-sume that nonstationary evolution is the only factoraffecting this or any other data set, even when map-ping composition onto the topology seems to makeit so clear. Our nhPhyML results illustrate this in ourdata set: using this method, it is not enough to solelyaccount for compositional bias; one must also accountfor among-site rate heterogeneity. Along the same lines,
our Bayesian analyses that account for among-site rateheterogeneity but not compositional bias end up in al-most the same place as the parsimony analysis. In thisdata set, nonstationary evolution does appear to be oneof the major confounding factors, as evidenced by theresults of the ID test as well as the fact that some ofthe new Bayesian methods that employ nonstationaryevolutionary models succeed where alternatives fail.
Unfortunately, it is not always straightforward topredict if a data set will have a problem with bias.Studies that have given exact numbers of where toexpect problems, such as 10% base compositional dif-ference (Eyre-Walker 1998), have been rebutted by otherstudies with data where lower differences have caused
at Palacky U
niversity on June 21, 2010 http://sysbio.oxfordjournals.org
Dow
nloaded from

2009 SHEFFIELD ET AL.—COMPOSITIONAL BIAS IN COLEOPTERAN MTGENOMES 389
FIGURE 5. Comparison of 3 Bayesian methods implementing algorithms to account for compositional heterogeneity. a) p4, b) PHASE, andc) PhyloBayes. Number below each node indicates posterior probability. The trees shown are 50% majority rule consensus tree for (a) and (b) and–cat –poisson analysis tree for (c). Number in parentheses next to taxon name indicates the overall AT% for each taxon. Each coleopteran terminalwithin is color coded to indicate its taxonomical grouping: red = Archostemata, green = Cucujiformia, blue = Elateroidea, and black = otherPolyphaga.
at Palacky U
niversity on June 21, 2010 http://sysbio.oxfordjournals.org
Dow
nloaded from
390 SYSTEMATIC BIOLOGY VOL. 58
FIGURE 6. A parsimony tree with bootstrap support values after recoding nucleotide data into amino acid sequences. Taxa in light graybox are Coleoptera and each terminal within is color coded to indicate its taxonomical grouping: red = Archostemata, green = Cucujiformia,blue= Elateroidea, and black = other Polyphaga.
problems (Gruber et al. 2007). Jermiin et al. (2004) pro-vide a thorough review of methods for assessing degreeof compositional heterogeneity.
Our study demonstrates that the parsimony analysisseverely suffers from the high level of homoplasy result-ing from convergent evolution (Fig. 2). In many cases,model-based methods can account for confounding fac-tors and infer topologies that are more accurate; how-ever, in this study, the Bayesian analysis with even themost parameter-rich models for individual gene parti-tions recovered a topology almost identical to the parsi-mony analysis (Fig. 2). This suggests that the homoplasyis not due to factors accounted for in that model (suchas among-site rate heterogeneity). Other methods that
use similar models but also account for nonstationarityare able to overcome the problem. Therefore, we affirmthat base compositional heterogeneity affects both par-simony and likelihood approaches.
Data recoding can be an effective means to overcomethe homoplasy from nonstationarity (Loomis and Smith1990; Nardi et al. 2001; Cameron et al. 2004), althoughsome have cautioned that it can introduce artifactual re-lationships (Yang and Roberts 1995; Cameron et al. 2007;Fenn et al. 2008). In this data set, amino acid recodingis an effective method of dealing with the problem.When we apply amino acid recoding to our data set in aparsimony framework, all 3 indicator relationships arerecovered correctly, suggesting that the compositional
FIGURE 7. Gene by gene comparison of compositional bias. Gene order shown here follows that of a hypothetical insect ancestor. Each shapeis color coded to indicate its taxonomic grouping: red diamond = Archostemata (Tetraphalerus), blue square = Cucujiformia, green triangle =Elateroidea, and black circle = other Polyphaga with low AT%.
at Palacky U
niversity on June 21, 2010 http://sysbio.oxfordjournals.org
Dow
nloaded from
2009 SHEFFIELD ET AL.—COMPOSITIONAL BIAS IN COLEOPTERAN MTGENOMES 391
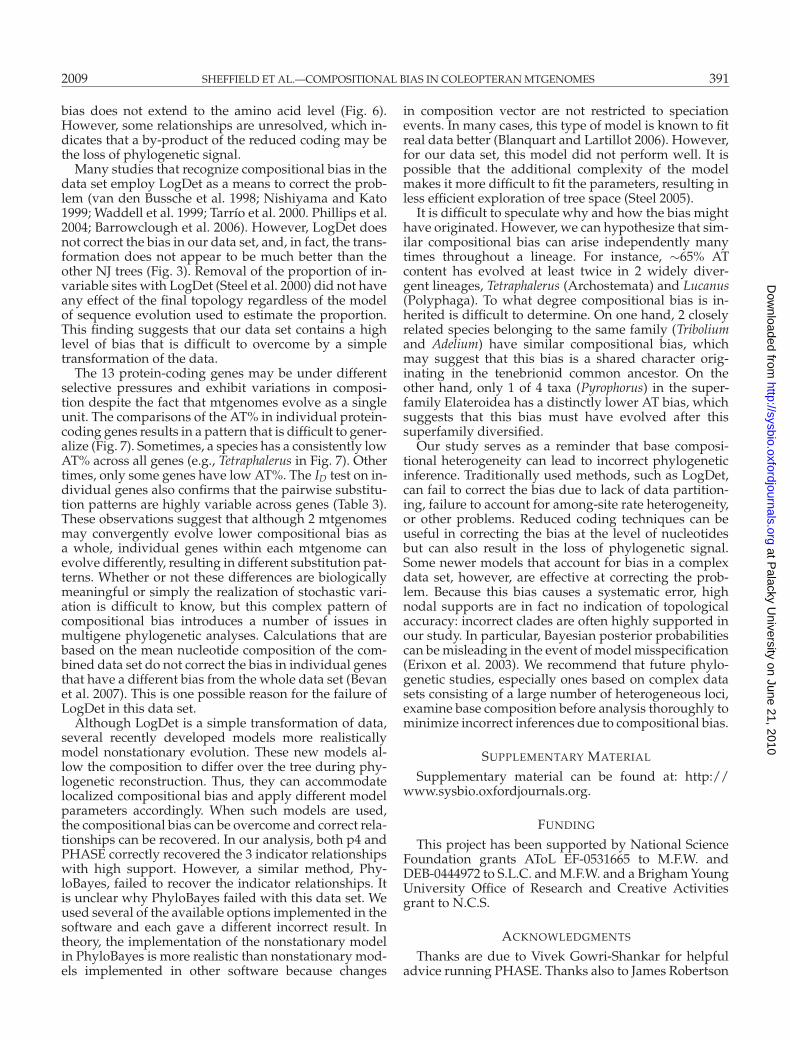
bias does not extend to the amino acid level (Fig. 6).However, some relationships are unresolved, which in-dicates that a by-product of the reduced coding may bethe loss of phylogenetic signal.
Many studies that recognize compositional bias in thedata set employ LogDet as a means to correct the prob-lem (van den Bussche et al. 1998; Nishiyama and Kato1999; Waddell et al. 1999; Tarrıo et al. 2000. Phillips et al.2004; Barrowclough et al. 2006). However, LogDet doesnot correct the bias in our data set, and, in fact, the trans-formation does not appear to be much better than theother NJ trees (Fig. 3). Removal of the proportion of in-variable sites with LogDet (Steel et al. 2000) did not haveany effect of the final topology regardless of the modelof sequence evolution used to estimate the proportion.This finding suggests that our data set contains a highlevel of bias that is difficult to overcome by a simpletransformation of the data.
The 13 protein-coding genes may be under differentselective pressures and exhibit variations in composi-tion despite the fact that mtgenomes evolve as a singleunit. The comparisons of the AT% in individual protein-coding genes results in a pattern that is difficult to gener-alize (Fig. 7). Sometimes, a species has a consistently lowAT% across all genes (e.g., Tetraphalerus in Fig. 7). Othertimes, only some genes have low AT%. The ID test on in-dividual genes also confirms that the pairwise substitu-tion patterns are highly variable across genes (Table 3).These observations suggest that although 2 mtgenomesmay convergently evolve lower compositional bias asa whole, individual genes within each mtgenome canevolve differently, resulting in different substitution pat-terns. Whether or not these differences are biologicallymeaningful or simply the realization of stochastic vari-ation is difficult to know, but this complex pattern ofcompositional bias introduces a number of issues inmultigene phylogenetic analyses. Calculations that arebased on the mean nucleotide composition of the com-bined data set do not correct the bias in individual genesthat have a different bias from the whole data set (Bevanet al. 2007). This is one possible reason for the failure ofLogDet in this data set.
Although LogDet is a simple transformation of data,several recently developed models more realisticallymodel nonstationary evolution. These new models al-low the composition to differ over the tree during phy-logenetic reconstruction. Thus, they can accommodatelocalized compositional bias and apply different modelparameters accordingly. When such models are used,the compositional bias can be overcome and correct rela-tionships can be recovered. In our analysis, both p4 andPHASE correctly recovered the 3 indicator relationshipswith high support. However, a similar method, Phy-loBayes, failed to recover the indicator relationships. Itis unclear why PhyloBayes failed with this data set. Weused several of the available options implemented in thesoftware and each gave a different incorrect result. Intheory, the implementation of the nonstationary modelin PhyloBayes is more realistic than nonstationary mod-els implemented in other software because changes
in composition vector are not restricted to speciationevents. In many cases, this type of model is known to fitreal data better (Blanquart and Lartillot 2006). However,for our data set, this model did not perform well. It ispossible that the additional complexity of the modelmakes it more difficult to fit the parameters, resulting inless efficient exploration of tree space (Steel 2005).
It is difficult to speculate why and how the bias mighthave originated. However, we can hypothesize that sim-ilar compositional bias can arise independently manytimes throughout a lineage. For instance, ∼65% ATcontent has evolved at least twice in 2 widely diver-gent lineages, Tetraphalerus (Archostemata) and Lucanus(Polyphaga). To what degree compositional bias is in-herited is difficult to determine. On one hand, 2 closelyrelated species belonging to the same family (Triboliumand Adelium) have similar compositional bias, whichmay suggest that this bias is a shared character orig-inating in the tenebrionid common ancestor. On theother hand, only 1 of 4 taxa (Pyrophorus) in the super-family Elateroidea has a distinctly lower AT bias, whichsuggests that this bias must have evolved after thissuperfamily diversified.
Our study serves as a reminder that base composi-tional heterogeneity can lead to incorrect phylogeneticinference. Traditionally used methods, such as LogDet,can fail to correct the bias due to lack of data partition-ing, failure to account for among-site rate heterogeneity,or other problems. Reduced coding techniques can beuseful in correcting the bias at the level of nucleotidesbut can also result in the loss of phylogenetic signal.Some newer models that account for bias in a complexdata set, however, are effective at correcting the prob-lem. Because this bias causes a systematic error, highnodal supports are in fact no indication of topologicalaccuracy: incorrect clades are often highly supported inour study. In particular, Bayesian posterior probabilitiescan be misleading in the event of model misspecification(Erixon et al. 2003). We recommend that future phylo-genetic studies, especially ones based on complex datasets consisting of a large number of heterogeneous loci,examine base composition before analysis thoroughly tominimize incorrect inferences due to compositional bias.
SUPPLEMENTARY MATERIAL
Supplementary material can be found at: http://www.sysbio.oxfordjournals.org.
FUNDING
This project has been supported by National ScienceFoundation grants AToL EF-0531665 to M.F.W. andDEB-0444972 to S.L.C. and M.F.W. and a Brigham YoungUniversity Office of Research and Creative Activitiesgrant to N.C.S.
ACKNOWLEDGMENTS
Thanks are due to Vivek Gowri-Shankar for helpfuladvice running PHASE. Thanks also to James Robertson
at Palacky U
niversity on June 21, 2010 http://sysbio.oxfordjournals.org
Dow
nloaded from

392 SYSTEMATIC BIOLOGY VOL. 58
for comments on an earlier version of this manuscript.Helpful comments from J. Sullivan, T. Buckley,M. Phillips, G. Naylor, and C. Lakner improved ourmanuscript.
REFERENCES
Arnoldi F.G.C., Ogoh K., Ohmiya Y., Viviani V.R. 2007. Mitochondrialgenome sequence of the Brazilian luminescent click beetle Pyropho-rus divergens (Coleoptera: Elateridae): mitochondrial genes utilityto investigate the evolutionary history of Coleoptera and its biolu-minescence. Gene 405:1–9.
Bae J.S., Kim I., Sohn H.D., Jin B.R. 2004. The mitochondrial genomeof the firefly, Pyrocoelia rufa: complete DNA sequence, genome or-ganization, and phylogenetic analysis with other insects. Mol. Phy-logenet. Evol. 32:978–985.
Barrowclough G.F., Groth J.G., Mertz L.A. 2006. The rag-1 exon in theavian order caprimulgiformes: phylogeny, heterozygosity, and basecomposition. Mol. Phylogenet. Evol. 41:238–248.
Beard C.B., Hamm D.M., Collins F.H. 1993. The mitochondrial genomeof the mosquito Anopheles gambiae. DNA sequence, genome orga-nization, and comparisons with mitochondrial sequences of otherinsects. Insect Mol. Biol. 2:103–124.
Bergsten J. 2005. A review of long-branch attraction. Cladistics 21:163–193.
Beutel R.G., Ge S., Hornschemeyer T. 2008. On the head morphology ofTetraphalerus, the phylogeny of Archostemata and the basal branch-ing events in Coleoptera. Cladistics 24:270–298.
Beutel R.G., Haas F. 2000. Phylogenetic relationships of the subordersof Coleoptera (Insecta). Cladistics 16:103–141.
Bevan R.B., Bryant D., Lang B.F. 2007. Accounting for gene rate het-erogeneity in phylogenetic inference. Syst. Biol. 56:194–205.
Blanquart S., Lartillot N. 2006. A Bayesian compound stochastic pro-cess for modeling nonstationary and nonhomogeneous sequenceevolution. Mol. Biol. Evol. 23:2058.
Bocakova M., Bocak L., Hunt T., Teravainen M., Vogler A.P. 2007.Molecular phylogenetics of Elateriformia (Coleoptera): evolution ofbioluminescence and neoteny. Cladistics 23:477–496.
Boussau B., Gouy M. 2006. Efficient likelihood computations with non-reversible models of evolution. Syst. Biol. 55:756–768.
Brown W.M., Prager E.M., Wang A., Wilson A.C. 1982. MitochondrialDNA sequences of primates: tempo and mode of evolution. J. Mol.Evol. 18:225–239.
Cameron S.L., Barker S.C., Whiting M.F. 2006. Mitochondrial genomicsand the relationships and validity of the new insect order Man-tophasmatodea. Mol. Phylogenet. Evol. 38:274–279.
Cameron S.L., Lambkin C.L., Barker S.C., Whiting M.F. 2007. A mito-chondrial genome phylogeny of Diptera: whole genome sequencedata accurately resolve relationships over broad timescales withhigh precision. Syst. Entomol. 32:40–59.
Cameron S.L., Miller K.B., D’Haese C.A., Whiting M.F., Barker S.C.2004. Mitochondrial genome data alone are not enough to un-ambiguously resolve the relationships of Entognatha, Insecta andCrustacea sensu lato (Athropoda). Cladistics 20:534–557.
Campbell D.L., Brower A.V.Z., Pierce N.E. 2000. Molecular evolu-tion of the wingless gene and its implications for the phylogeneticplacement of the butterfly family Riodinidae (Lepidoptera: Papil-ionoidea). Mol. Biol. Evol. 17:684–696.
Caveney S. 1986. The phylogenetic significance of ommatidium struc-ture in the compound eyes of polyphagan beetles. Can. J. Zool.64:1787–1819.
Chang B.S.W., Campbell D.L. 2000. Bias in phylogenetic reconstructionof vertebrate rhodopsin sequences. Mol. Biol. Evol. 17:1220–1231.
Clary D.O., Wolstenholme D.R. 1985. The mitochondrial DNAmolecule of Drosophila yakuba: Nucleotide sequence, gene orga-nization, and genetic code. J. Mol. Evol. 22:252–271.
Coates B.S., Sumerford D.V., Hellmich R.L., Lewis L.C. 2005. Partialmitochondrial genome sequences of Ostrinia nubilalis and Ostriniafurnicalis. Int. J. Biol. Sci. 1:13.
Collins T.M., Fedrigo O., Naylor G.J.P. 2005. Choosing the best genesfor the job: the case for stationary genes in genome-scale phyloge-nies. Syst. Biol. 54:493–500.
Collins T.M., Wimberger P.H., Naylor G.J.P. 1994. Compositional bias,character-state bias, and character-state reconstruction using parsi-mony. Syst. Biol. 43:482–496.
Conant G.C., Lewis P.O. 2001. Effects of nucleotide composition biason the success of the parsimony criterion in phylogenetic inference.Mol. Biol. Evol. 18:1024–1033.
Cox C.J., Foster P.G., Hirt R.P., Harris S.R., Embley T.M. 2008. The ar-chaebacterial origin of eukaryotes. Proc. Natl. Acad. Sci. U.S.A. 105:20356–20361
Crowson R.A. 1960. The phylogeny of Coleoptera. Annu. Rev. Ento-mol. 5:111–134.
Delsuc F., Philips M.J., Penny D. 2003. Comment on ”Hexapod origins:monophyletic or paraphyletic?” Science 301:1482e.
Edgar R.C. 2004. MUSCLE: multiple sequence alignment with highaccuracy and high throughput. Nucleic Acids Res. 32:1792.
Erixon P., Svennblad B., Britton T., Oxelman B. 2003. Reliability ofBayesian posterior probabilities and bootstrap frequencies in phy-logenetics. Syst. Biol. 52:665–673.
Eyre-Walker A. 1998. Problems with parsimony in sequences of biasedbase composition. J. Mol. Evol. 47:686–690.
Felsenstein J. (1978). Cases in which parsimony or compatibility meth-ods will be positively misleading. Syst. Zool. 27:401–410.
Fenn J.D., Song H., Cameron S.L., Whiting M.F. 2008. A mitochondrialgenome phylogeny of Orthoptera (Insecta) and approaches to max-imizing phylogenetic signal found within mitochondrial genomedata. Mol. Phylogenet. Evol. 49:59–68.
Foster P.G. 2004. Modeling compositional heterogeneity. Syst. Biol.53:485–495.
Foster P.G., Hickey D.A. 1999. Compositional bias may affectboth DNA-based and protein-based phylogenetic reconstructions.J. Mol. Evol. 48:284–90.
Friedrich M., Muqim N. 2003. Sequence and phylogenetic analysis ofthe complete mitochondrial genome of the flour beetle Triboliumcastanaeum. Mol. Phylogenet. Evol. 26:502–512.
Galtier N., Gouy M. 1995. Inferring phylogenies from DNA se-quences of unequal base compositions. Proc. Natl. Acad. Sci. U.S.A.92:11317–11321.
Galtier N., Gouy M. 1998. Inferring pattern and process: maximum-likelihood implementation of a nonhomogeneous model of DNAsequence evolution for phylogenetic analysis. Mol. Biol. Evol.15:871–879.
Gibson A., Gowri-Shankar V., Higgs P.G., Rattray M. 2005. A com-prehensive analysis of mammalian mitochondrial genome basecomposition and improved phylogenetic methods. Mol. Biol. Evol.22:251–264.
Gowri-Shankar V., Rattray M. 2007. A reversible jump method forBayesian phylogenetic inference with a nonhomogeneous substi-tution model. Mol. Biol. Evol. 24:1286–1299.
Gruber K.F., Voss R.S., Jansa S.A. 2007. Base-compositional hetero-geneity in the RAG1 locus among didelphid marsupials: implica-tions for phylogenetic inference and the evolution of GC content.Syst. Biol. 56:83–96.
Herbeck J.T., Degnan P.H., Wernegreen J.J. 2005. Nonhomogeneousmodel of sequence evolution indicates independent origins ofprimary endosymbionts within the enterobacteriales (gamma-Proteobacteria). Mol. Biol. Evol. 22:520–532.
Ho S.Y., Jermiin L. 2004. Tracing the decay of the historical signal inbiological sequence data. Syst. Biol. 53:623–637.
Hrdy I., Hirt R.P., Dolezal P., Bardonova L., Foster P.G., Tachezy J.,Embley T.M. 2004. Trichomonas hydrogenosomes contain thenadh dehydrogenase module of mitochondrial complex I. Nature432:618–622.
Hughes J., Longhorn S.J., Papadopoulou A., Theodorides K., de RivaA., Mejia-Chang M., Foster P.G., Vogler A.P. 2006. Dense taxonomicEST sampling and its applications for molecular systematics of theColeoptera (beetles). Mol. Biol. Evol. 23:268–278.
Hunt T., Bergsten J., Levkanicova Z., Papadopoulou A., John O.S.,Wild R., Hammond P.M., Ahrens D., Balke M., Caterino M.S. 2007.A comprehensive phylogeny of beetles reveals the evolutionaryorigins of a superradiation. Science 318:1913.
Jermiin L., Ho S.Y., Ababneh F., Robinson J., Larkum A.W. 2004. Thebiasing effect of compositional heterogeneity on phylogenetic esti-mates may be underestimated. Syst. Biol. 53:638–643.
at Palacky U
niversity on June 21, 2010 http://sysbio.oxfordjournals.org
Dow
nloaded from
2009 SHEFFIELD ET AL.—COMPOSITIONAL BIAS IN COLEOPTERAN MTGENOMES 393
Kolaczkowski B., Thornton J.W. 2004. Performance of maximum par-simony and likelihood phylogenetics when evolution is heteroge-neous. Nature 431:980–984.
Kumar S., Gadagkar S.R. 2001. Disparity index: a simple statistic tomeasure and test the homogeneity of substitution patterns betweenmolecular sequences. Genetics 158:1321–1327.
Lake J.A. 1994. Reconstructing evolutionary trees from DNA and pro-tein sequences: paralinear distances. Proc. Natl. Acad. Sci. U.S.A.91:1455–1459.
Lawrence J.F. 1988. Rhinorrhipidae, a new beetle family fromAustralia, with comments on the phylogeny of the Elateriformia.Invertebr. Taxon. 2:1–53.
Lawrence J.F., Newton A.F. Jr. 1982. Evolution and classification of bee-tles. Annu. Rev Ecol. Syst. 13:261–290.
Li X., Ogoh K., Ohba N., Liang X., Ohmiya Y. 2007. Mitochon-drial genomes of two luminous beetles, Rhagophthalmus lufen-gensis and R. ohbai (Arthropoda, Insecta, Coleoptera). Gene 392:196–205.
Lockhart P.J., Steel M.A., Hendy M.D., Penny D. 1994. Recovering evo-lutionary trees under a more realistic model of sequence evolution.Mol. Biol. Evol. 11:605.
Loomis W.F., Smith D.W. 1990. Molecular phylogeny of Dictyosteliumdiscodeum by protein sequence comparison. Proc. Natl. Acad. Sci.U.S.A. 87:9093–9097.
Nardi F., Carapelli A., Fanciulli P.P., Dallai R., Frati F. 2001. Thecomplete mitochondrial DNA sequence of the basal hexapodTetrodontophora bielanensis: evidence for heteroplasmy and tRNAtranslocations. Mol. Biol. Evol. 18:1293–1304.
Nishiyama T., Kato M. 1999. Molecular phylogenetic analysis amongbryophytes and tracheophytes based on combined data of plas-tid coded genes and the 18s rrna gene. Mol. Biol. Evol. 16:1027–1036.
Nylander J.A.A. 2004. MrModeltest. Version 2. Program distributed bythe author. Evolutionary Biology Centre, Uppsala University.
Nylander J.A.A., Wilgenbusch J.C., Warren D.L., Swofford D.L. 2008.AWTY (are we there yet?): a system for graphical explorationof mcmc convergence in Bayesian phylogenetics. Bioinformatics24:581–583.
Philippe H., Zhou Y., Brinkmann H., Rodrigue N., Delsuc F. 2005. Het-erotachy and long-branch attraction in phylogenetics. BMC Evol.Biol. 5:50.
Phillips M.J., Delsuc F., Penny D. 2004. Genome-scale phylogeny andthe detection of systematic biases. Mol. Biol. Evol. 21:1455–1458.
Phillips M.J., Penny D. 2003. The root of the mammalian tree inferredfrom whole mitochondrial genomes. Mol. Phylogenet. Evol. 28:171–185.
Poll M. 1932. Note sur la fonction des tubes de Malpighi desColeopteres. Bull. Ann. Soc. Ent. Belg. 72:103–109.
Ponomarenko A.G. 1969. Historical development of the Coleoptera-Archostemata. Trudy Paleontol. Inst. Akad. Nauk SSSR 125:1–240.
R Development Core Team. 2008. R: a language and environment forstatistical computing. Vienna (Austria): R Foundation for StatisticalComputing. Available from: URL http://www.R-project.org.
Rodriguez-Ezpeleta N., Brinkmann H., Roure B., Lartillot N., LangB.F., Philippe H. 2007. Detecting and overcoming systematic errorsin genome-scale phylogenies. Syst. Biol. 56:389–399.
Rodrıguez -Trelles F., Tarrıo R., Ayala F.J. 1999. Molecular evolutionand phylogeny of the Drosophila saltans species group inferred fromthe Xdh gene. Mol. Phylogenet. Evol. 13:110–121.
Ronquist F., Huelsenbeck J.P. 2003. MrBayes 3: Bayesian phylogeneticinference under mixed models. Bioinformatics 19:1572–1574.
Ruano-Rubio V., Fares M.A. 2007. Artifactual phylogenies caused bycorrelated distribution of substitution rates among sites and lin-eages: the good, the bad, and the ugly. Syst. Biol. 56:68–82.
Rubinoff D., Holland B.S. 2005. Between two extremes: mitochondrialDNA is neither the panacea nor the nemesis of phylogenetic andtaxonomic inference. Syst. Biol. 54:952–961.
Sheffield N.C., Song H., Cameron S.L., Whiting M.F. 2008. A com-parative analysis of mitochondrial genomes in Coleoptera (Arthro-poda: Insecta) and genome descriptions of six new beetles. Mol.Biol. Evol. 25: 2499–2509.
Stammer H.J. 1934. Bau und bedeutung der malpighischen gefasse dercoleopteren. Zoomorphology 29:196–217.
Steel M. 2005. Should phylogenetic models be trying to ‘fit an ele-phant’? Trends Genet. 21:307–309.
Steel M., Huson D., Lockhart P.J. 2000. Invariable sites models andtheir use in phylogeny reconstruction. Syst. Biol. 49:225–232.
Stewart J.B., Beckenbach A.T. 2003. Phylogenetic and genomic analy-sis of the complete mitochondrial DNA sequence of the spotted as-paragus beetle Crioceris duodecimpunctata. Mol. Phylogenet. Evol.26:513–526.
Swofford D.L. 2002. PAUP*. Phylogenetic analysis using parsi-mony (*and other methods). Version 4. Sunderland (MA): SinauerAssoicates.
Tamura K., Dudley J., Nei M., Kumar S. 2007. MEGA4: molecular evo-lutionary genetics analysis (MEGA) software version 4.0. Mol. Biol.Evol. 24:1596.
Tarrıo R., Rodrıguez-Trelles F., Ayala F.J. 2000. Tree rooting with out-groups when they differ in their nucleotide composition from theingroup: the Drosophila saltans and willistoni groups, a case study.Mol. Phylogenet. Evol. 16:344–349.
Tarrıo R., Rodrıguez-Trelles F., Ayala F.J. 2001. Shared nucleotidecomposition biases among species and their impact on phyloge-netic reconstructions of the Drosophilidae. Mol. Biol. Evol. 18:1464–1473.
van den Bussche R.A., Baker R.J., Huelsenbeck J.P., Hillis D.M. 1998.Base compositional bias and phylogenetic analyses: a test of the“flying DNA” hypothesis. Mol. Phylogenet. Evol. 10:408–416.
Wachmann E. 1977. Vergleichende analyse der feinstrukturellen or-ganisation offener rhabdome in den augen der Cucujiformia(lnsecta, Coleoptera), unter besonderer berucksichtigung derChrysomelidae. Zoomorphology 88:95–131.
Waddell P.J., Okada N., Hasegawa M. 1999. Towards resolving theinterordinal relationships of placental mammals. Syst. Biol. 48:1–5.
Yang Z. 1996. Among-site rate variation and its impact on phyloge-netic analyses. Trends. Ecol. Evol. 11:367–372.
Yang Z., Roberts D. 1995. On the use of nucleic acid sequences to inferearly branchings in the tree of life. Mol. Biol. Evol. 12:451–458.
Received 17 October 2008; reviews returned 7 January 2009;accepted 21 May 2009
Associate Editor: Thomas Buckley
at Palacky U
niversity on June 21, 2010 http://sysbio.oxfordjournals.org
Dow
nloaded from
394 SYSTEMATIC BIOLOGY VOL. 58
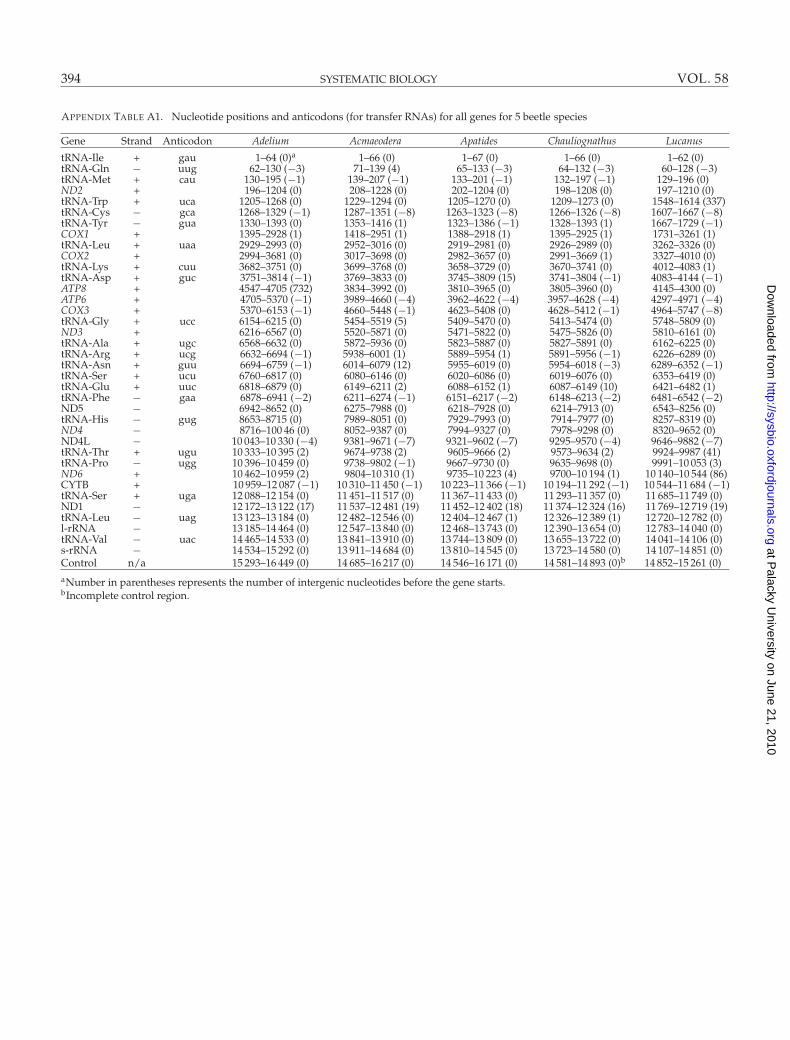
APPENDIX TABLE A1. Nucleotide positions and anticodons (for transfer RNAs) for all genes for 5 beetle species
Gene Strand Anticodon Adelium Acmaeodera Apatides Chauliognathus Lucanus
tRNA-Ile + gau 1–64 (0)a 1–66 (0) 1–67 (0) 1–66 (0) 1–62 (0)tRNA-Gln − uug 62–130 (−3) 71–139 (4) 65–133 (−3) 64–132 (−3) 60–128 (−3)tRNA-Met + cau 130–195 (−1) 139–207 (−1) 133–201 (−1) 132–197 (−1) 129–196 (0)ND2 + 196–1204 (0) 208–1228 (0) 202–1204 (0) 198–1208 (0) 197–1210 (0)tRNA-Trp + uca 1205–1268 (0) 1229–1294 (0) 1205–1270 (0) 1209–1273 (0) 1548–1614 (337)tRNA-Cys − gca 1268–1329 (−1) 1287–1351 (−8) 1263–1323 (−8) 1266–1326 (−8) 1607–1667 (−8)tRNA-Tyr − gua 1330–1393 (0) 1353–1416 (1) 1323–1386 (−1) 1328–1393 (1) 1667–1729 (−1)COX1 + 1395–2928 (1) 1418–2951 (1) 1388–2918 (1) 1395–2925 (1) 1731–3261 (1)tRNA-Leu + uaa 2929–2993 (0) 2952–3016 (0) 2919–2981 (0) 2926–2989 (0) 3262–3326 (0)COX2 + 2994–3681 (0) 3017–3698 (0) 2982–3657 (0) 2991–3669 (1) 3327–4010 (0)tRNA-Lys + cuu 3682–3751 (0) 3699–3768 (0) 3658–3729 (0) 3670–3741 (0) 4012–4083 (1)tRNA-Asp + guc 3751–3814 (−1) 3769–3833 (0) 3745–3809 (15) 3741–3804 (−1) 4083–4144 (−1)ATP8 + 4547–4705 (732) 3834–3992 (0) 3810–3965 (0) 3805–3960 (0) 4145–4300 (0)ATP6 + 4705–5370 (−1) 3989–4660 (−4) 3962–4622 (−4) 3957–4628 (−4) 4297–4971 (−4)COX3 + 5370–6153 (−1) 4660–5448 (−1) 4623–5408 (0) 4628–5412 (−1) 4964–5747 (−8)tRNA-Gly + ucc 6154–6215 (0) 5454–5519 (5) 5409–5470 (0) 5413–5474 (0) 5748–5809 (0)ND3 + 6216–6567 (0) 5520–5871 (0) 5471–5822 (0) 5475–5826 (0) 5810–6161 (0)tRNA-Ala + ugc 6568–6632 (0) 5872–5936 (0) 5823–5887 (0) 5827–5891 (0) 6162–6225 (0)tRNA-Arg + ucg 6632–6694 (−1) 5938–6001 (1) 5889–5954 (1) 5891–5956 (−1) 6226–6289 (0)tRNA-Asn + guu 6694–6759 (−1) 6014–6079 (12) 5955–6019 (0) 5954–6018 (−3) 6289–6352 (−1)tRNA-Ser + ucu 6760–6817 (0) 6080–6146 (0) 6020–6086 (0) 6019–6076 (0) 6353–6419 (0)tRNA-Glu + uuc 6818–6879 (0) 6149–6211 (2) 6088–6152 (1) 6087–6149 (10) 6421–6482 (1)tRNA-Phe − gaa 6878–6941 (−2) 6211–6274 (−1) 6151–6217 (−2) 6148–6213 (−2) 6481–6542 (−2)ND5 − 6942–8652 (0) 6275–7988 (0) 6218–7928 (0) 6214–7913 (0) 6543–8256 (0)tRNA-His − gug 8653–8715 (0) 7989–8051 (0) 7929–7993 (0) 7914–7977 (0) 8257–8319 (0)ND4 − 8716–100 46 (0) 8052–9387 (0) 7994–9327 (0) 7978–9298 (0) 8320–9652 (0)ND4L − 10 043–10 330 (−4) 9381–9671 (−7) 9321–9602 (−7) 9295–9570 (−4) 9646–9882 (−7)tRNA-Thr + ugu 10 333–10 395 (2) 9674–9738 (2) 9605–9666 (2) 9573–9634 (2) 9924–9987 (41)tRNA-Pro − ugg 10 396–10 459 (0) 9738–9802 (−1) 9667–9730 (0) 9635–9698 (0) 9991–10 053 (3)ND6 + 10 462–10 959 (2) 9804–10 310 (1) 9735–10 223 (4) 9700–10 194 (1) 10 140–10 544 (86)CYTB + 10 959–12 087 (−1) 10 310–11 450 (−1) 10 223–11 366 (−1) 10 194–11 292 (−1) 10 544–11 684 (−1)tRNA-Ser + uga 12 088–12 154 (0) 11 451–11 517 (0) 11 367–11 433 (0) 11 293–11 357 (0) 11 685–11 749 (0)ND1 − 12 172–13 122 (17) 11 537–12 481 (19) 11 452–12 402 (18) 11 374–12 324 (16) 11 769–12 719 (19)tRNA-Leu − uag 13 123–13 184 (0) 12 482–12 546 (0) 12 404–12 467 (1) 12 326–12 389 (1) 12 720–12 782 (0)l-rRNA − 13 185–14 464 (0) 12 547–13 840 (0) 12 468–13 743 (0) 12 390–13 654 (0) 12 783–14 040 (0)tRNA-Val − uac 14 465–14 533 (0) 13 841–13 910 (0) 13 744–13 809 (0) 13 655–13 722 (0) 14 041–14 106 (0)s-rRNA − 14 534–15 292 (0) 13 911–14 684 (0) 13 810–14 545 (0) 13 723–14 580 (0) 14 107–14 851 (0)Control n/a 15 293–16 449 (0) 14 685–16 217 (0) 14 546–16 171 (0) 14 581–14 893 (0)b 14 852–15 261 (0)aNumber in parentheses represents the number of intergenic nucleotides before the gene starts.bIncomplete control region.
at Palacky U
niversity on June 21, 2010 http://sysbio.oxfordjournals.org
Dow
nloaded from