north american airlines€¦ · review of 11 north american airlines. ... in airline stock pricing...
TRANSCRIPT

����������September 2000
Stern Stewart ResearchNorth American Airlines
Justin Pettit(212) 261-0706
Michael Goldberg(212) 261-0678
��� ������������
• In conjunction with Morgan Stanley Dean Witter, we have undertaken an economicreview of 11 North American Airlines. After recasting all data to an “apples-to-apples”economic basis with EVA®, we benchmark both performance and valuation, and relatethese to strategy. We also evaluate the economics of the industry and examine the casefor airline consolidation in the North American market.
• Unable to earn a return in excess of the cost of capital over most of the business cycle,the industry creates little wealth, measured by the excess enterprise value over bookvalue (i.e. Market Value Added among airlines is poor) – only one-half the airlines havecreated wealth, and the top four airlines account for 82% of the industry’s $20 billion ofwealth creation.
• Consolidation offers a glimmer of hope for this economically challenged industry – bybetter utilizing aircraft, eliminating wasteful duplicity of cost, activities and assetsthrough route optimization, and better leveraging expertise in management, preventativemaintenance, centralized purchasing and fuel cost hedging.
• After years of poor returns, Air Canada delivered a 215% return to owners from July 99to July 00. Notwithstanding the cost of extra perks to frequent business travellers, a levelof service that stands above many carriers, integration issues, and a sea of fare discounts,the merger still created C$1.5 billion dollars of new wealth for the economy.
• Cost leadership, particularly fuel and labour, and asset utilization are the keys tofinancial outperformance. But industry valuations imply a significant expectation forperformance mean-reversion, particularly for margin advantages. However, velocity(asset utilization) is a source of financial advantage that is treated much more attractivelyin airline stock pricing – capitalized as a sustainable advantage, achievable throughconsolidation.

EVAluation is a series of periodic reports from Stern Stewart & Co., drawing on the depth of our experience andinternal research, to cover issues of valuation, organisational design, decision making, remuneration, and corporategovernance. We assist in understanding how actions affect value. We believe that all stakeholders benefit from thecreation of value through both innovation and efficiency.
Stern Stewart & Co., 1345 Avenue of the Americas, New York, NY 10105Current Operations Value , COV , Future Growth Value and FGV are trademarks of Stern Stewart & Co.
EVA® is a registered trademark of Stern Stewart & Co. Copyright 2000 All Rights Reserved for Stern Stewart & Co.
The views expressed in this report are based on Stern Stewart & Co.’s general knowledge, analysis andunderstanding of value, incentives and corporate governance issues. All estimates and opinions included in thisreport constitute our judgment as of the date of the report and may be subject to change without notice. Nowarranties are given and no liability is accepted in contract, tort (including negligence) or otherwise by SternStewart for any loss, or damage that may arise from actions based on any information, opinions,recommendations or conclusions contained in this report. This report is being submitted to selected recipientsonly. It may not be reproduced (in whole or in part) to any person without the prior written permission of SternStewart & Co.

1
THE NEW MATH; 4 > 8
OVERVIEW
Stern Stewart & Co., in conjunction with Morgan Stanley Dean Witter, compiled and analyzeddata from 11 publicly traded North American carriers. Our North American airline reviewbenchmarks financial performance, valuations, and reviews different strategies in the industry.We also evaluate the economic case for consolidation in the North American market. Our reviewidentified and adjusted material accounting issues, including operating leases, deferred taxes andemployee pensions, to establish a comparable economic basis for measurement and evaluation.
Not surprisingly, the industry fares very poorly in our analysis. Unable to earn a return in excessof the cost of capital over most of the business cycle, the industry creates little wealth. Wealthcreation, as measured by the excess enterprise value over book value, or Market Value Added(MVA), among airlines is poor – only one-half the airlines have created wealth, and the top fourairlines account for 82% of the industry’s $20 billion wealth creation.
Consolidation offers a glimmer of hope for this economically-challenged industry – by betterutilizing aircraft, eliminating waste through route optimization, and better leveraging expertise inmanagement, preventative maintenance, centralized purchasing and fuel cost hedging.
As a case study, we evaluated the economic impact of the Air Canada-Canadian Airlines merger.Notwithstanding on-going labour challenges, the merger seems to have proven an economicsuccess. After years of poor returns, Air Canada delivered a 215% return to owners from July 99to July 00. Notwithstanding the cost of extra perks to frequent business travellers, a level ofservice that stands above many carriers, integration issues, and a sea of fare discounts, the mergerstill created C$1.5 billion dollars of new wealth for the economy through efficiencies.
NORTH AMERICAN AIRLINE INDUSTRY ECONOMICS
Industry wealth creation, as measured by the excess enterprise value over book value, or MarketValue Added (MVA) among airlines is poor – only one-half the airlines have created wealth, andthe top four airlines account for 82% of the industry’s $20 billion wealth creation (Figure 1).
$20,905
$5,174
$3,925
$3,817
$3,801
$678
$246
($67)
($106)
($1,105)
$1,947
($5,000) $--- $5,000 $10,000 $15,000 $20,000 $25,000 $30,000 $35,000
Continental
America West
Alaska
Air Canada
Northwest
AMR
Delta
UAL
USAir
Southwest
Gateway
Enterprise Value ($MM’s)
Capital
MarketValueAdded
Figure 1. Top 4 Airlines Create 82% of Industry’s $20 billion Wealth; Many Create None
The industry cannotearn its cost ofcapital over thebusiness cycle – onlyone-half the airlineshave created wealth
… consolidationoffers hope throughbetter equipmentutilization, routeoptimization, andleveragingmanagement,maintenance,purchasing and fuelhedging expertise.

2
THE NEW MATH; 4 > 8
Regulatory Policy & Wealth Creation in the Face of Globalism
Why all the fuss about shareowner value and creating wealth? What about other stakeholders?
Asia’s economic crisis demonstrated the risk to social and economic stability and standards ofliving created by poor market discipline, a general apathy toward value maximization, and weaksystems of corporate governance – the measures, incentives, tools and controls that supportdecision making. Prolonged periods of pervasive capital misallocation and mismanagementdestroy massive amounts of wealth and undermine the economy.
A basic and fundamental tenet of capitalism is the obligation to maximize shareowner value – anexpectation of a return is created with every dollar raised and invested, or each dollar of profit thatis retained rather than distributed. A tacit promise to maximize value is made. The litmus testbehind any decision to raise, invest, or retain a dollar must be to create more value than could havebeen achieved with an otherwise alternative investment opportunity of similar risk.
For example, what would happen if “Brick Bank” paid only a 5% return on savings accounts while“E-Bank” offered 15% on money market accounts of virtually equal risk? Obviously, a 15%return is much better than 5%, when all else equal. Consequently, many people will storm intoBrick Bank, withdraw their life’s savings, and march down the street to E-Bank.
This example illustrates that capital is a scarce resource that all businesses, and even governmentagencies, must compete for and efficiently manage. This means that they must provide customer-valued products and services effectively and efficiently to maximize the utility of their investedcapital. The limited supply of, and liquid markets for, capital require that its users maximize itsvalue - maximize shareowner value, or face the flight of capital to more attractive opportunities.
If managing for value is embracing the interests of owners, what then of the interests of otherstakeholders? Let’s start with a look at who these owners are, for they are not rich youngprofessionals on Wall Street. Our mutual funds, pension plans, life insurance policies, and manysmall investor holdings represent the vast majority of stock ownership. Our largest institutionalinvestors represent the savings of everyday citizens. We each invest our life’s savings and bearrisk, in the hopes of the best return possible.
But this need not imply a conflict between the interests of customers, employees, owners and themanagers, executives and directors who act as stewards of our savings. Fashionable shareowner-stakeholder discussions belie a confusion of means and ends. Value maximization, the heart ofeconomic growth, is a long-term proposition that delivers higher economic output and prosperitythrough productivity gains, employment growth and higher wages. The interests of stakeholdersand of society are best served when our scarce resources are put to their most productive uses, asrevealed in our comparison of Japan’s top and bottom ten wealth creators over the past three years.
Stakeholder Top 10 Bottom 10 .
Revenue (Customers) +24% -13%Size of Workforce +12% -14%Total Investment +24% -2%Wealth Creation +107% -151%
Globalism presents both an opportunity and a challenge. As historically insular product, labourand capital markets become increasingly global, companies will continue to face increasingcompetitive pressures. Under pressure to perform, investors are warming to notions of shareowneractivism and heightened corporate governance. Market liquidity and the emergence of moresophisticated and demanding institutional investors have made the consequences of destroyingshareowner value much more important to employees, executives, directors and policymakers.
In Asia, we sawhow prolongedperiods of capitalmisallocationdestroys wealth andundermines theeconomy ...
… the interests ofsociety are bestserved when ourscarce resources areput to their mostproductive uses.

3
THE NEW MATH; 4 > 8
Figure 1 depicts a rank ordering of the North American airline industry’s major participants, onthe basis of wealth creation, or Market Value Added (MVA). MVA is the excess enterprise valueover its book value, or total capital employed. If management has made the company morevaluable as a going concern than the value of total capital invested – it has created wealth.1
For example, Southwest has an enterprise value of $11.7 billion, yet only $6.6 billion of capital isinvested – thus $5.1 billion of wealth has been created – $1.77 has been created from each dollarinvested. Continental has a nearly identical enterprise value of $12.2 billion, but this is achievedwith $12.9 billion of capital invested – twice the capital of Southwest. Thus, Continental hasdestroyed $700 million of wealth – each dollar invested is now only worth 95 cents!
At a macro level, size is not the competitive advantage in this industry that one might assume,perhaps because the industry remains fragmented and over-supplied. Even the largest player,AMR, is unable to earn its cost of capital or create any significant level of MVA. While AMR,Northwest and Continental account for 40% of the industry’s economic capital, they create only16% of the wealth! In fact, in a regression of size (capital employed) versus wealth created(MVA) for the 11 carriers we found an inverse correlation!
Figure 2 shows the industry (11 airlines summed) return on capital, cost of capital and EconomicValue Added (EVA), over the past ten years. From 1990 through 1994, the industry failed to earnits cost of capital. The industry operated around an economic “break-even” in 1995-1996. From1997 to 1999, the industry has earned a return above the cost of capital (positive EVA). Clearly,the aggregate economic losses far exceed the sum of the economic profits (EVA), indicating anuneconomic industry – typically a good sign of the need for consolidation or major change.
(4.0%)
(2.0%)
---%
2.0%
4.0%
6.0%
8.0%
10.0%
12.0%
1990 1991 1992 1993 1994 1995 1996 1997 1998 1999
($8,000)
($3,000)
$2,000
$7,000
$12,000
$17,000
$22,000
EVA
ROCE
Cost ofCapital(C*)
Cost of Capital
Return on Capital Employed
Indicates need forindustry consolidation
Figure 2. Can Consolidation Cure Chronic Returns?
Even the large carriers suffer – the North American market as a whole remains far too competitiveto discern any advantage even for the larger carriers. In fact, the opposite may be true. AMR wasunable to earn its cost of capital in 1999 and has earned its cost of capital in only 2 of the past 10years! Meanwhile, smaller airlines such as Alaska, America West and Southwest have beenachieving positive EVA. 1 We included Gateway in our study to provide context and illustrate how a typical well-performing company scores on themetrics presented. Gateway’s enterprise value is similar to leading airline companies, yet it achieves this value on asmaller capital base as a result of its significantly higher EVA.
Southwest hascreated $1.77 fromevery dollar –Continental hasturned each dollarinto 95 cents.
The industry isuneconomic in mostyears – too muchcapital is allocatedto this sector.

4
THE NEW MATH; 4 > 8
O’ Canada!
The case for consolidation in the North American airline market is perhaps best illustrated by theeconomic success of the recent Air Canada-Canadian Airlines merger. Notwithstanding on-going labour challenges within Air Canada – common to such times of turbulent change, themerger seems to have proven a success.
After years of poor returns, Air Canada delivered a 215% return to owners from July 99 to July00. Notwithstanding the cost of extra perks to frequent business travellers, a level of service thatstands above many carriers, integration issues, and a sea of fare discounts, investors enjoyed oneof the few real airline stock return bonanzas since deregulation. The merger efficiencies createdC$1.5 billion dollars of new wealth for the economy and increased the combined airlineenterprise value by 14 percent.
Air Canada-Canadian AirlinesMerger Study (C$000s)
12,294,722
2,943,459
1,525,584
7,825,679
$6.20
$19.50
$-
$2,000,000
$4,000,000
$6,000,000
$8,000,000
$10,000,000
$12,000,000
$14,000,000
6/30/1999 Ent. Val. Added 6/30/2000
$-
$5.00
$10.00
$15.00
$20.00
$25.00
CanadianAirlinesEV
AirCanadaEV
AC.CN+215%
And the tremendous amount of wealth created by this transaction is not a speculative, stockmarket illusion; rather, this economic value has already been created through efficiencies evidentin the current operations value (COV). We estimate that the net present value of normalizedannual operating cashflow after tax has already increased by at least C$1.5 billion.
Thus, the market value increase from July 1999 to July 2000, can be accorded to an increasedCOV, while none of this increase is premised on increased expectations – future growth value(FGV).
Clearly, the market has been proven correct in assigning such tremendous economic benefit tothis merger – real economic efficiencies achieved through the better utilization of expensiveaircraft, eliminating costly waste through route optimization, and better leveraging cost andexpertise in preventative maintenance, centralized purchasing, fuel cost hedging, and generalmanagement.
Analysts, investors, executives and policymakers can learn from this “test-case” – potential gainsfrom a consolidating North American airline industry that leads to a “Big 4” (AC/CP,AMR/NWAC, UAL/U, DAL/CAL) may be too enormous to ignore. Clearly, the question is notif, but how, the integration should be best managed to maximize the net benefit to all.
After years of poorreturns – AirCanada delivered215% to its owners.
The tremendouswealth created isnot a speculativebubble, but realgains in cashflow.
A “Big 4” may offergains in utilization,waste reduction andleveraging specificexpertise.

5
THE NEW MATH; 4 > 8
PERFORMANCE BENCHMARKING
Performance, in terms of EVA as a percentage of capital (the spread between the return on capitaland cost of capital), for each airline is charted in Pareto form in Figure 3 – dollarized amounts areshown above each bar. Just over half the industry earned more than the cost of capital, but thatmany cannot – even in a good year – is even more telling.
($150)($248)
$143
$32
($134) ($22) ($36) ($232) ($458) ($355) ($315) ($472)
(10.0%)
(5.0%)
---%
5.0%
10.0%
15.0%
20.0%1990-1
999
Avera
ge
An
nu
alE
VA
(%o
fC
ap
ital&
$M
M’s
)
Gat
eway
Del
ta
AM
R
Nort
hwes
t
USA
ir
Air
Can
ada
Contin
enta
l
Tran
sW
orldAirl
ines
Southwes
tUAL
Ala
ska
Am
eric
aW
est H
ldg
Figure 3. All airlines (except Southwest) destroy value over the business cycle
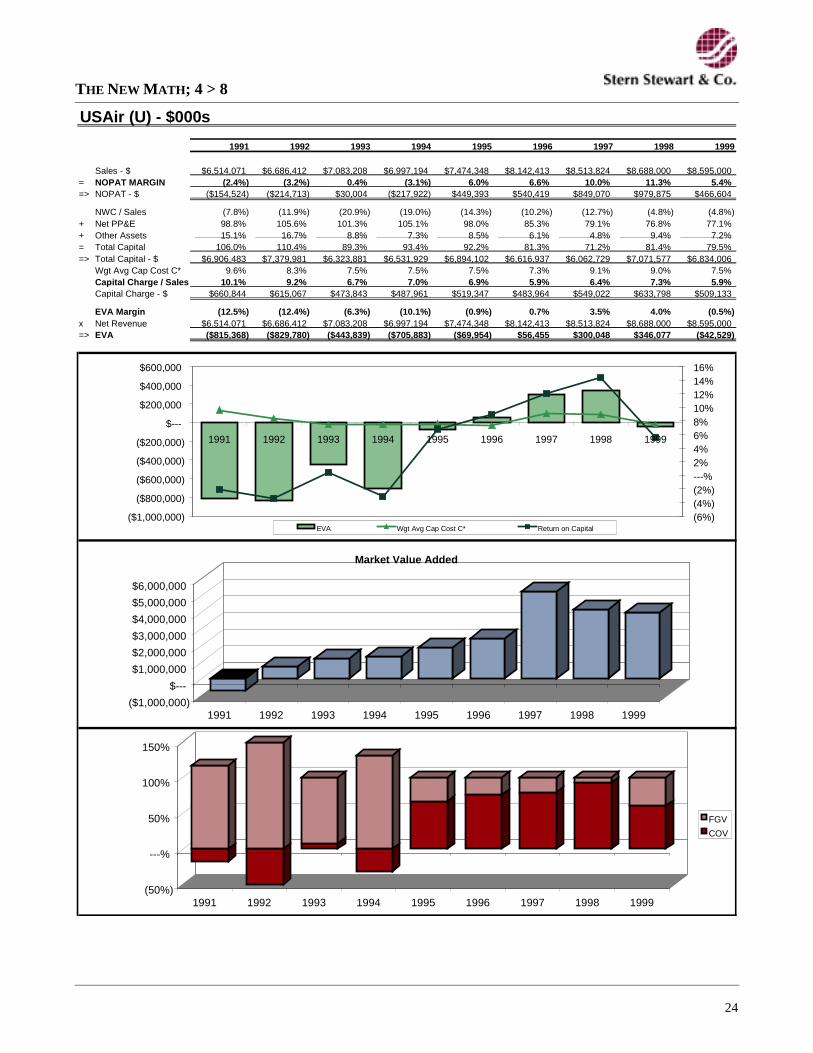
USAir and Air Canada highlight the impact of a business model’s capital utilization, or velocity, indetermining financial performance. USAir’s profit margin of 5.4% trails Air Canada’s 8.4%. Butwhile USAir has nearly twice the revenue of Air Canada, it does so with only 30% more propertyand equipment. Fixed asset turns are 1.30x for USAir and only 0.86x at Air Canada. USAir alsoedges out Air Canada with working capital at -5% of sales, versus only -2% at Air Canada. Thus,return on capital (6.8%) is more (versus 5.8%). Despite the prevalence of high velocity businessmodels in the “New Economy”, asset turns among airlines remain poor across the board – theindustry is plagued with too much capital.
Airline(1999)
NOPATMargin
NWC/Sales
AssetTurns
Return onCapital
EVA($MM’s)
Delta 13.9% -10.9% 0.80x 11.6% $750Southwest 16.2 -5.6 0.78 13.2 246America West 13.3 -8.0 1.01 11.4 93Alaska 12.2 -11.8 0.84 10.9 86UAL 15.5 -15.0 0.69 11.2 756Northwest 11.8 -12.0 0.99 10.3 331Continental 12.7 1.8 1.04 9.0 220USAir 5.4 -4.8 1.30 6.8 -43AMR 7.8 -14.2 0.74 5.8 -307Air Canada 8.4 -2.2 0.86 5.8 -147TWA -0.1 -7.1 1.18 -0.1 -167
Figure 4. USAir versus Air Canada – The Capital Velocity Opportunity
Nearly half theindustry was unableto earn the cost ofcapital in a goodyear …
… despite highvelocity businessmodels in the “NewEconomy”, thisindustry remainsplagued with toomuch capital.
6
THE NEW MATH; 4 > 8
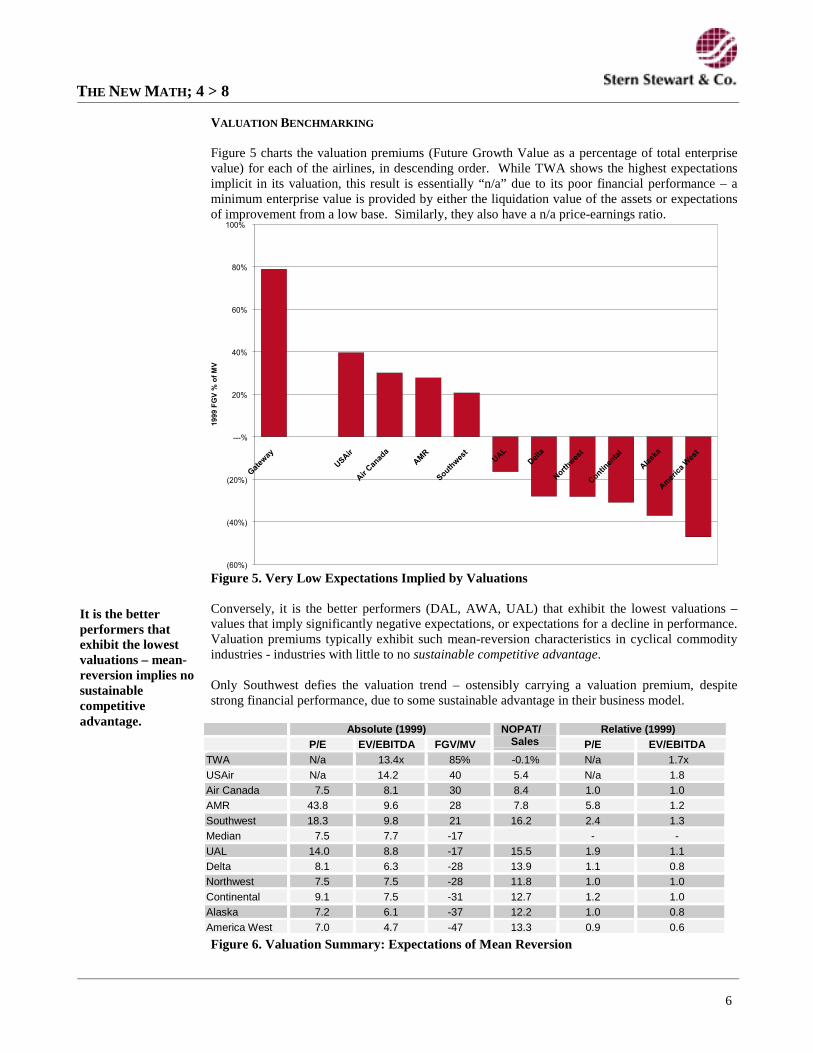
VALUATION BENCHMARKING
Figure 5 charts the valuation premiums (Future Growth Value as a percentage of total enterprisevalue) for each of the airlines, in descending order. While TWA shows the highest expectationsimplicit in its valuation, this result is essentially “n/a” due to its poor financial performance – aminimum enterprise value is provided by either the liquidation value of the assets or expectationsof improvement from a low base. Similarly, they also have a n/a price-earnings ratio.
(60%)
(40%)
(20%)
---%
20%
40%
60%
80%
100%
1999
FG
V%
of
MV
Gat
eway
Del
ta
AM
R
Nort
hwes
t
USA
ir
Air
Can
ada
Contin
enta
l
Southwes
tUAL
Ala
ska
Am
eric
aW
est
Figure 5. Very Low Expectations Implied by Valuations
Conversely, it is the better performers (DAL, AWA, UAL) that exhibit the lowest valuations –values that imply significantly negative expectations, or expectations for a decline in performance.Valuation premiums typically exhibit such mean-reversion characteristics in cyclical commodityindustries - industries with little to no sustainable competitive advantage.
Only Southwest defies the valuation trend – ostensibly carrying a valuation premium, despitestrong financial performance, due to some sustainable advantage in their business model.
Absolute (1999) Relative (1999)P/E EV/EBITDA FGV/MV
NOPAT/Sales P/E EV/EBITDA
TWA N/a 13.4x 85% -0.1% N/a 1.7xUSAir N/a 14.2 40 5.4 N/a 1.8Air Canada 7.5 8.1 30 8.4 1.0 1.0AMR 43.8 9.6 28 7.8 5.8 1.2Southwest 18.3 9.8 21 16.2 2.4 1.3Median 7.5 7.7 -17 - -UAL 14.0 8.8 -17 15.5 1.9 1.1Delta 8.1 6.3 -28 13.9 1.1 0.8Northwest 7.5 7.5 -28 11.8 1.0 1.0Continental 9.1 7.5 -31 12.7 1.2 1.0Alaska 7.2 6.1 -37 12.2 1.0 0.8America West 7.0 4.7 -47 13.3 0.9 0.6
Figure 6. Valuation Summary: Expectations of Mean Reversion
It is the betterperformers thatexhibit the lowestvaluations – mean-reversion implies nosustainablecompetitiveadvantage.

7
THE NEW MATH; 4 > 8
Performance, Value & Strategy
Many of us complain that pennies are simply not worth the effort – why then, when a companyannounces that it will miss quarterly earnings estimates by a mere penny, does the stockplummet? When does a penny matter?
Simplistically, one can express a company’s value as the net present value of all futurecashflow.2 While present value concepts are more easily, and therefore more commonly, appliedto fixed income valuation (e.g., the value of bonds), the same concept also holds for stocks,albeit with much less certainty in the forward numbers. Therefore, a business generating $100per year, every year, can be valued into perpetuity as $1000, assuming a 10% cost of capital, ortime value of money ($100 ÷ 10% = $1000). This base, or zero-growth, case implies a“multiplier” of 10 times operating cashflow, and is the current operations value (COV).3
Now, let’s try a growth case where operating cashflow grows at a rate of 5% per year, forever.While many of us might think that forever is a long time, it may not be long enough to justifysome of the recent internet stock prices! Our simple case can be valued on a present value basisat $100 ÷ (10% - 5%), or $2000. The growth case implies a multiplier of 20 times and happensto illustrate a price level common to today’s marketplace, where many stock prices imply amultiplier of 20 times or more. In this example, the market has based one half of the stock priceon the present value of current operating cashflows, forever, and the other half on profitablegrowth expectations above this level – i.e., fifty percent of the value is COV, while theremainder is future growth value (FGV). The FGV term subsumes not only expected growth,but also implicitly values any real options. For example, the 5% growth assumption might reallybe a proxy for a 90% likelihood of no growth, and a 10% chance of 50% growth.
Strategically, enterprise value is not maximized solely through the maximization of CurrentOperations Value (COV), but through the simultaneous maximization of the sum of both COVand Future Growth Value (FGV), including the value of real options.
While the valuation of internet stocks might be interpreted as proof of a patient and forward-looking stock market, leading business strategists are concerned that many of today’scorporations remain overly fixated on the near-term.4 The implications for business strategy,financial policy, financial management and compensation strategies are far-reaching.
2 This can also be expressed as the mathematically equivalent sum of capital and the present value of all future EVA.3 The current operations value can be also expressed as the sum of capital invested, plus the present value of current EVAinto perpetuity, with no growth. The nominal zero-growth assumption implies decay in real terms.4 See, for example, the roundtable discussion led by C.K. Prahlad of the University of Michigan, Journal of AppliedCorporate Finance, Volume 12, Number 2 (Summer 1999).
Market
Value
PV ofFCF
PV of EVAGrowth
PV ofCurrentLevel of
EVA
Capital
FutureGrowthValue(FGV)
CurrentOperationsValue (COV)
Strategically,enterprise value ismaximized throughthe simultaneousmaximization ofCurrent OperationsValue (COV) andFuture GrowthValue (FGV)

8
THE NEW MATH; 4 > 8
When a company misses its earnings number, what are the implications for its net present value?If the miss has no implications for the future, the value of the stock is reduced by only one cent.A miss expected to persist for four quarters is worth four cents. A permanent miss, using ourmultiplier of 10 times, is worth 40 cents. If the shortfall has implications for growthopportunities, we might expect a much larger impact, like our example with a 20 timesmultiplier. A one-penny shortfall on the quarter can thus be worth a 40-cent reduction in theperpetuity value, and another 40-cent reduction in growth value – an 80-cent impact!
0%
50%
100%
0.0%
EVA per Dollar of Capital (Return on Capital minus Cost of Capital)
Fu
ture
Gro
wth
Val
ue
(FG
V)
as a
% o
f M
arke
t V
alu
e
High EVALow EVA
Lo
w F
GV
Hig
h F
GV
TURNAROUNDS
SUPER STARSEXPENSIVE
BARGAINS
“Hot” stocks and sectors with extremefuture upside, or
Poor performers with a protectivevaluation floor (liquidation value), or
Overvalued candidates for a sale.
(TWA, Polaroid, Motorola)
Perennial high performers that aretypically fully valued.
Invests for FGV (strategy), convertsFGV investment into COV (execution),
and renews FGV.
(LUV, Dell, Gateway)
Out of favour stocks and sectors facing anexpected (cyclical) downturn, or
Strong performers with a valuation constraint(unscalable business model), or
Undervalued candidates forgrowth/purchase.
(AWA, DAL, DuPont)
Disappointments awaiting breakthroughchange.
Candidates for turnaround.
(CP, Sears, Xerox)
A healthy dose of investor prudence can lead to a larger stock price impact – where there’ssmoke, there’s fire. Managers have significant financial incentives to do just about anything toavoid falling short. And aggressive accounting practices often understate how bad things reallyare (e.g. revenue recognition, offsetting gains and losses, and reversals in acquisition,restructuring, warranty, bad debt, inventory and actuarial reserves). So when a company doesmiss by a penny, it may warrant a more dramatic, downward revision of expectations and FGV.
The matrix maps companies based on both financial performance (EVA) and valuation (FGV).Both qualities are scaled on company size for comparability, giving us Future Growth Value as apercentage of total enterprise value, and return on capital versus cost of capital.
Superstars (LUV, Dell, Gateway) are perennial high performers that enjoy full valuations, withstrategies to invest in the intangibles that drive FGV, convert FGV to COV through operationalexcellence and great execution, and perpetually renew FGV for their future. Turnarounds (CP,Sears, Xerox) are often perennial disappointments awaiting breakthrough change.
“Hot” stocks and sectors with high expectations for upside, or poor performers with a minimumvaluation floor often seem Expensive and can be candidates for sale (TWA, Polaroid, Motorola).
Bargains are often out-of-favour stocks and sectors or cyclicals facing a downturn, or strongperformers with a valuation constraint (unscalable business model) that may be candidates forinvestment (AWA, DAL, DuPont).
A focus on thedevelopment ofFuture GrowthValue, conversion toCurrent OperationsValue and renewal
of Future GrowthValue directsstrategic thinking
FGV
COV
Renewal
Conversion

9
THE NEW MATH; 4 > 8
SUCCESSFUL AIRLINE STRATEGIES
Consolidation offers hope, not through increased scale, but through velocity – the increased assetutilization that comes with industry consolidation. Size alone brings no performance advantage –a simple regression analysis of our industry database found no significant correlation between size(either in terms of revenue or capital) and performance (return on capital and EVA). However,margins, working capital and fixed asset turns, together explain 94% of the variation in financialperformance among airlines.
Nor does scale have any bearing on market expectations of future performance – valuationpremiums are not correlated with size. Yet, both profit margin and overall financial performanceare both strongly inversely correlated with valuation premiums – market expectations declineconsiderably with increased margins or increased levels of overall performance. Investors do notexpect these conditions to be sustainable. Again, the exception to this trend is Southwest (LUV).While working capital and fixed asset efficiency are significant financial performance drivers,they do not suffer from the same valuation discount in the marketplace – velocity is fullycapitalized into valuations as a sustainable condition, a source of competitive advantage.
Figure 7 illustrates the Valuation/Performance Matrix as applied to the North American AirlineIndustry. As the only airline to inhabit the top-right quadrant (“Superstars”), LUV deservesspecial notice. LUV achieves both a performance and valuation premium despite the lowestrevenue per plane in the industry (tied with TWA at $16.1 MM), among the lowest Load Factors(69%), and RASM that is only slightly better than TWA (8.96 cents). However, LUV also has thelowest unit cost (CASM 7.48 cents). No hub cities, a homogenous fleet (737), no-frills service,ticketless operations, no defined benefit pension, one of the youngest fleets (9.1 years), andeffective fuel purchasing and hedging (53 cents/gallon) help minimize cost.
Figure 7. Valuation/Performance Matrix: Only LUV Stands Apart
While AC was close, there are no domestic airlines in the lower-left quadrant (“Turnarounds”)because no matter how poorly an airline performs, there is typically a price floor – thus lowerlevels of performance imply higher expectations for the future to maintain the minimum enterprisevalue, say, an asset-based liquidation value. Also close was CAL with among the best load factors(73%), RASM (11 cents) and revenue per plane ($24 MM) but also a high cost structure (CASM10 cents), despite a significant fuel cost advantage (49 cents/gallon). The valuation may also beweak due to a perceived dependency on NWAC for growth - its real-option value.
Margins, workingcapital and fixedasset turns explain94% of variation inperformance, yetsize offers noadvantage …
… nor does sizehave a bearing invaluations …
… margins are notcapitalized – theyaren’t expected tobe sustainable –only velocitysupports value as asustainablecompetitiveadvantage.
No matter howpoorly an airlineperforms, there is aprice floor.
TWAGTW
U
AC
LUVAMR
NWACDALCAL
ALK
UAL
AWA
(100%)
(75%)
(50%)
(25%)
---%
25%
50%
75%
100%
(10%) (5%) ---% 5% 10% 15% 20%
EVA per Dollar of Capital (Return on Capital minus Cost of Capital)
FGV% ofMV

10
THE NEW MATH; 4 > 8
TWA dominates the problematic upper-left quadrant (“Expensive”) with very poor financialperformance, but a significant value-implied expectation for improvement. TWA has one of theworst RASM (8 cents) in the industry, coupled with an old fleet (17 years) and a high costoperation (CASM 10 cents). Employee and asset utilization are also the worst in the industry, yetsomehow the subsequent valuation downside seems limited.
In the lower-right quadrant (“Bargains”) DAL and AWA have achieved excellent financialperformance as cost leaders (CASM 9 and 8 cents, respectively), in part due to very low fuel costs(52 and 53 cents per gallon). Load factors and RASM are also very good for these two airlines(11 and 9 cents RASM). However, the DAL/AWA valuations imply an expectation that theseconditions are not sustainable – the present value of current operations exceeds the current totalenterprise value, such that negative market expectations are implied, that is, a significant downturnin financial performance is expected.
Competition, substitute services, price-elasticity and the discretionary nature of much travel limitsthe degree to which pricing can play a major degree of freedom in the value dynamic for airlines.Cost leadership, particularly fuel and labour, as well as asset utilization are the keys to financialoutperformance. However, industry valuations tend to imply a significant expectation forperformance mean-reversion. This is especially true for margin advantages; however, workingcapital and asset utilization are a source of financial advantage that are treated much moreattractively in airline stock pricing – as sustainable advantages.
IN CLOSING
Our economic review of 11 North American Airlines recasts all data to an “apples-to-apples”economic basis with EVA to evaluate the economics of the industry, benchmark performance andvaluation, and examine the case for airline consolidation in the North American market.
Unable to earn a return in excess of the cost of capital over most of the business cycle, the industrycreates little wealth, measured by the excess enterprise value over book value (i.e. Market ValueAdded among airlines is poor) – only one-half the airlines have created wealth, and the top fourairlines account for 82% of the industry’s $20 billion of wealth creation.
The industry is uneconomic in most years – unable to earn the cost of capital. Too much capital isallocated to this sector. At a macro level, size is not the competitive advantage that one mightassume, perhaps because the industry remains fragmented and over-supplied. Even the largecarriers suffer - the North American market as a whole remains far too competitive to discern anyadvantage even for the larger carriers. In fact, the opposite may be true. AMR was unable to earnits cost of capital in 1999 and has earned its cost of capital only twice in the past ten years.
Size brings no performance advantage. However, margins, working capital and fixed asset turns,together explain 94% of the variation in financial performance among airlines. Nor does size haveany bearing on market expectations of future performance – valuation premiums are not correlatedwith size. Yet, both profit margin and overall financial performance are both strongly inverselycorrelated with valuation premiums – investors do not expect these conditions to be sustainable.Working capital and fixed asset efficiency are significant financial performance drivers that do notsuffer from the same valuation discount in the marketplace – velocity is fully capitalized intovaluations as a sustainable condition, a source of competitive advantage.
Consolidation offers a glimmer of hope for this economically-challenged industry – by betterutilizing aircraft, eliminating operational waste through route optimization, and better leveragingexpertise in management, preventative maintenance, centralized purchasing and fuel cost hedging.After years of poor returns, Air Canada delivered a 215% return to owners from July 99 to July00, notwithstanding the cost of extra perks to frequent business travellers, a level of service thatstands above many carriers, integration issues, and a sea of fare discounts.
DAL/AWAvaluations imply amarket expectationthat financialoutperformancewill not continue.
We recast all datato an economicbasis to betterevaluate theindustry andbenchmarkperformance andvaluation.
Airline valuation isdominated bymean-reversionexpectations, exceptfor gains madethrough velocity.

11
THE NEW MATH; 4 > 8
APPENDIX A: WHAT IS EVA?
“There is no profit unless you earn the cost of capital.” Peter Drucker.
EVA measures profit after the cost of all capital employed.5 It is the one measure that properlyaccounts for the trade-offs between the income statement and balance sheet in creating value.EVA is also the spread between a company’s return on and cost of capital, times invested capital:
EVA = (Rate of Return - Cost of Capital) x Capital
For example, a $1000 investment in a hot-dog stand produces a 5% return, where investments ofsimilar risk elsewhere can earn 15%. The EVA from this case would be:
EVA = (5% - 15%) x $1000 = -$100
Another way to think of EVA comes from multiplying through by capital:
EVA = Operating Profit - A Capital Chargewhere,
Capital Charge = Cost of Capital x Capital
For example, although the accounting profit in this example is $50, there was an opportunity toearn $150:
EVA = $50 - $150 = -$100
Under EVA, a business is effectively charged by investors for the use of capital through a “line ofcredit” that bears interest at a rate equal to the cost of capital - shareowner accountability can thusbe effectively decentralized into the operating units. EVA simultaneously focuses on both theprofit and loss statement and the balance sheet and can be tailored to remedy accountinganomalies that fail to reflect economic value. Finally, EVA sets a required rate of return – the costof capital – as a hurdle rate below which performance is unacceptable.
Although in any given business there are countless individual operating actions that can createvalue, eventually they must all fall into one of four categories measured by an increase in EVA.
Specifically, EVA can be increased through the following four means:
1. Fix. Improve the returns on existing capital through higher prices or margins, morevolume, or lower costs.
2. Harvest. Through rationalizing, liquidating, or curtailing investments in operations thatcannot generate returns greater than the cost of capital. This might be throughdivestitures or through withdrawing from unprofitable markets.
3. Grow. Profitable growth through investing capital, where increased profits will cover thecost of additional capital. Investments in working capital and production capacity may berequired to facilitate increased sales, new products or new markets.
4. Optimize Cost of Capital. Through reducing the cost of capital but maintaining thefinancial flexibility necessary to support the business strategy through the prudent use ofdebt, risk management, and other financial products.
EVA Companies measure, report, and reward performance on the basis of EVA and use EVA toevaluate, execute and communicate strategies, investments, plans, tactics and decisions. 5 The EVA framework is presented in more detail in the book, The Quest for Value, Harper Collins, 1991 by BennettStewart. EVA is a registered trademark of Stern Stewart & Co.
EVA measures profitless the cost of allcapital employed
EVA simultaneouslycaptures both profitand capital efficiency
EVA is not just aperformancemeasure – it is anintegratedperformancemeasurement,management andreward system

THE NEW MATH; 4 > 8
12
APPENDIX B: EVA FOR DELTA AIRLINES
123$7 &DSLWDO�&KDUJH�#�����
Net income $1,101 Net Working Capital Charge ($118) + Interest expense 889 - Pension recorded on BS Charge 168 + Tax adjustment 87 + PPE Charge 1,348 - Unusual income / Other 32 + Other Charge 232 = NOPAT $2,044 = Capital Charge $1,294
= EVA $750
1,101
889
87 (32)
2,044
118
168
(1,348)
(232)
750
$---
$500
$1,000
$1,500
$2,000
$2,500
Net income Interestexpense
Taxadjustment
Unusualincome /
Other
NOPAT Net WorkingCapitalCharge
Pensionrecorded onBS Charge
PPE Charge Other Charge EVA
Delta’s EVA Breakdown
&DSLWDO�&KDUJH123$7
+ + - = - -+ + =

THE NEW MATH; 4 > 8
13
APPENDIX C: GLOBAL AIRLINE PERFORMANCE SUMMARY ($000S)Air Canada 1990 1991 1992 1993 1994 1995 1996 1997 1998 1999NOPAT (45,523) (111,032) (252,822) (124,402) 209,802 307,994 302,416 428,958 204,359 368,243 Capital 3,183,972 3,533,483 3,152,011 3,144,711 5,924,640 6,325,407 6,285,139 6,379,943 6,363,918 6,631,783 ROCE (1.6%) (3.5%) (7.2%) (3.9%) 6.7% 5.2% 4.8% 6.8% 3.2% 5.8% Cost of Capital (C*) 8.0% 8.0% 8.0% 8.0% 8.9% 8.2% 8.2% 8.9% 6.1% 8.1% EVA (Beg Cap) (276,971) (365,538) (535,266) (375,057) (70,392) (178,420) (214,346) (132,425) (182,098) (147,135) Market Value 2,899,000 3,409,130 3,063,523 3,414,569 6,357,751 6,338,902 6,381,169 6,968,150 6,139,657 6,877,312
Alaska 1990 1991 1992 1993 1994 1995 1996 1997 1998 1999NOPAT 42,394 47,654 (38,499) 15,550 115,485 110,239 120,848 176,125 226,295 252,888 Capital 1,169,251 1,277,375 1,412,067 1,524,440 1,875,894 1,929,817 2,140,917 2,372,517 2,328,682 2,739,976 ROCE 4.4% 4.1% (3.0%) 1.1% 7.6% 5.9% 6.3% 8.2% 9.5% 10.9% Cost of Capital (C*) 9.8% 9.1% 8.3% 7.2% 7.3% 7.1% 6.9% 7.5% 7.5% 7.2% EVA (Beg Cap) (51,266) (59,146) (144,586) (85,536) 3,971 (23,370) (12,997) 14,862 48,102 85,688 Market Value 1,205,817 1,543,591 1,640,929 1,737,555 2,048,536 2,128,100 2,363,600 2,847,499 2,926,540 2,869,364
America West 1990 1991 1992 1993 1994 1995 1996 1997 1998 1999NOPAT 6,206 (38,800) 20,882 169,258 92,783 196,979 168,469 187,386 270,042 294,361 Capital 2,196,171 2,272,034 1,932,797 1,997,970 2,464,258 2,366,730 2,351,428 2,514,378 2,572,040 2,800,831 ROCE 0.3% (1.8%) 0.9% 8.8% 4.6% 8.0% 7.1% 8.0% 10.7% 11.4% Cost of Capital (C*) 8.9% 8.9% 8.9% 8.2% 7.7% 8.3% 7.9% 7.8% 7.9% 7.8% EVA (Beg Cap) (188,594) (233,600) (180,647) 10,189 (60,262) (7,801) (18,503) 3,034 70,652 92,970 Market Value 2,345,852 2,468,632 2,216,525 2,257,388 2,277,822 2,495,742 2,416,736 2,577,948 2,487,472 2,710,675
AMR 1990 1991 1992 1993 1994 1995 1996 1997 1998 1999NOPAT 12,213 88,971 596,727 854,153 1,343,743 1,463,293 1,899,171 2,006,285 2,171,015 1,379,600 Capital 11,224,719 18,256,765 20,765,084 17,022,285 22,703,175 21,998,737 21,936,238 21,634,952 23,620,429 25,042,891 ROCE 0.1% 0.8% 3.3% 4.1% 7.9% 6.4% 8.6% 9.1% 10.0% 5.8% Cost of Capital (C*) 10.3% 9.9% 8.9% 8.5% 8.7% 9.0% 8.7% 8.9% 8.8% 7.1% EVA (Beg Cap) (888,632) (1,025,395) (1,035,780) (908,367) (132,795) (571,185) (25,289) 50,986 264,277 (306,898) Market Value 10,826,315 19,964,399 23,975,421 19,705,969 24,974,691 26,505,891 26,685,162 29,448,896 28,603,063 28,695,765
Continental 1990 1991 1992 1993 1994 1995 1996 1997 1998 1999NOPAT (881,850) 3,660 103,424 (259,193) (30,626) 494,347 738,675 862,649 959,588 1,096,084 Capital 6,297,401 6,046,881 5,899,346 7,290,258 7,777,256 7,961,978 8,412,778 9,600,154 12,188,675 12,924,344 ROCE (10.4%) 0.1% 1.7% (4.4%) (0.4%) 6.4% 9.3% 10.3% 10.0% 9.0% Cost of Capital (C*) 12.6% 13.2% 13.1% 15.5% 8.3% 8.1% 8.1% 8.4% 7.6% 7.2% EVA (Beg Cap) (1,950,928) (830,009) (685,997) (1,176,364) (637,404) (135,567) 90,667 159,259 229,796 219,718 Market Value 8,572,406 8,586,844 8,587,952 5,297,462 6,013,943 7,322,664 8,200,355 10,217,606 11,279,293 12,211,238
Delta 1990 1991 1992 1993 1994 1995 1996 1997 1998 1999NOPAT 422,687 (189,097) (276,582) (144,885) 222,592 737,876 931,456 1,499,113 1,729,640 2,044,220 Capital 7,631,769 9,340,343 9,765,601 10,840,059 10,180,226 10,249,701 9,879,129 15,200,039 17,626,302 19,079,749 ROCE 6.3% (2.5%) (3.0%) (1.5%) 2.1% 7.2% 9.1% 15.2% 11.4% 11.6% Cost of Capital (C*) 10.4% 10.5% 9.4% 8.4% 8.4% 9.0% 8.6% 8.7% 8.2% 7.3% EVA (Beg Cap) (269,772) (992,893) (1,158,316) (961,255) (688,508) (180,470) 50,366 640,518 485,573 750,449 Market Value 7,557,177 9,788,400 11,560,116 11,497,895 11,581,850 15,625,431 14,720,215 19,223,965 24,472,444 22,900,195
Northwest 1990 1991 1992 1993 1994 1995 1996 1997 1998 1999NOPAT (226,762) (263,684) (765,452) 232,727 859,295 877,418 1,034,691 1,235,540 64,288 1,207,249 Capital 7,703,563 7,996,563 5,955,237 7,155,316 8,715,022 8,818,564 9,384,730 10,608,999 11,686,805 12,363,614 ROCE (3.1%) (3.4%) (9.6%) 3.9% 12.0% 10.1% 11.7% 13.2% 0.6% 10.3% Cost of Capital (C*) 11.2% 11.0% 10.2% 9.3% 8.7% 9.2% 8.7% 8.8% 8.1% 7.5% EVA (Beg Cap) (1,055,009) (1,111,076) (1,581,101) (321,110) 238,487 75,183 268,911 407,118 (798,186) 330,738 Market Value 7,663,700 7,956,700 6,373,300 8,622,556 11,248,207 14,127,049 12,592,204 15,264,987 12,807,432 13,082,586
Southwest 1990 1991 1992 1993 1994 1995 1996 1997 1998 1999NOPAT 56,218 53,120 156,656 263,132 290,366 310,489 365,902 494,314 623,160 764,938 Capital 1,482,501 1,910,356 2,326,523 2,663,507 3,629,519 4,289,802 5,002,405 5,451,345 5,810,060 6,560,977 ROCE 4.0% 3.6% 8.2% 11.3% 10.9% 8.6% 8.5% 9.9% 11.4% 13.2% Cost of Capital (C*) 10.3% 9.9% 9.6% 8.9% 9.6% 9.2% 8.8% 8.8% 8.2% 8.9% EVA (Beg Cap) (88,093) (94,007) (26,987) 55,618 34,343 (22,517) (10,650) 53,843 176,836 246,100 Market Value 1,530,616 2,641,327 4,091,195 6,777,007 4,573,132 5,909,224 6,212,201 8,466,199 10,417,690 11,735,015
TWA 1990 1991 1992 1993 1994 1995 1996 1997 1998 1999NOPAT (53,581) 241,952 (311,907) (298,747) (155,190) (53,206) (59,242) 108,911 145,219 (3,085) Capital 2,337,275 1,764,604 1,558,543 806,733 716,534 1,142,852 1,722,710 2,178,138 2,088,493 2,845,232 ROCE (2.3%) 10.4% (17.7%) (19.2%) (19.2%) (7.4%) (5.2%) 6.3% 6.7% (0.1%) Cost of Capital (C*) 9.2% 9.2% 9.2% 7.6% 8.2% 8.3% 8.2% 7.7% 7.8% 7.9% EVA (Beg Cap) (267,442) 241,952 (473,368) (417,041) (221,423) (112,822) (152,727) (23,737) (23,805) (167,449) Market Value 3,635,963 3,183,148 3,487,796 2,904,283 3,052,716 3,077,398 3,595,885 4,261,608 3,985,187 4,870,617
UAL 1990 1991 1992 1993 1994 1995 1996 1997 1998 1999NOPAT 412,028 47,699 125,145 807,981 1,146,918 1,454,000 1,479,863 1,822,958 1,855,440 2,796,394 Capital 6,432,397 13,220,202 17,726,047 17,049,290 16,472,340 16,988,217 20,379,340 22,753,618 24,909,567 26,425,676 ROCE 7.8% 0.7% 0.9% 4.6% 6.7% 8.8% 8.7% 8.9% 8.2% 11.2% Cost of Capital (C*) 12.8% 10.4% 10.0% 9.3% 8.3% 7.7% 7.2% 7.4% 6.6% 8.2% EVA (Beg Cap) (263,492) (619,129) (1,196,052) (840,770) (274,233) 180,503 252,796 316,139 348,283 756,300 Market Value 8,179,772 15,718,834 21,463,690 22,968,938 20,752,683 21,846,082 24,118,098 26,837,994 25,110,954 30,621,505
USAir 1990 1991 1992 1993 1994 1995 1996 1997 1998 1999NOPAT (333,045) (154,524) (214,713) 30,004 (217,922) 449,393 540,419 849,070 979,875 466,604 Capital 6,906,483 7,379,981 6,323,881 6,531,929 6,894,102 6,616,937 6,062,729 7,071,577 6,834,006 8,397,000 ROCE (5.3%) (2.2%) (2.9%) 0.5% (3.3%) 6.5% 8.2% 14.0% 13.9% 6.8% Cost of Capital (C*) 9.7% 9.6% 8.3% 7.5% 7.5% 7.5% 7.3% 9.1% 9.0% 7.5% EVA (Beg Cap) (945,252) (815,368) (829,780) (443,839) (705,883) (69,954) 56,455 300,048 346,077 (42,529) Market Value 5,895,354 6,656,694 7,343,259 8,058,375 8,201,639 8,477,676 9,060,729 13,159,209 11,558,962 12,945,805

THE NEW MATH; 4 > 8
14
Air Canada (AC) - $000s
1991 1992 1993 1994 1995 1996 1997 1998 1999
Revenue - $ $3,114,379 $2,883,914 $2,781,672 $2,937,083 $3,295,012 $3,579,112 $4,012,386 $3,981,698 $4,393,940 = NOPAT MARGIN (3.6%) (8.8%) (4.5%) 7.1% 9.3% 8.4% 10.7% 5.1% 8.4% => NOPAT - $ ($111,032) ($252,822) ($124,402) $209,802 $307,994 $302,416 $428,958 $204,359 $368,243
NWC / Sales 11.8% 4.2% 3.4% 12.9% 7.9% 11.8% 3.2% 5.7% (1.6%) + Net PP&E 70.7% 97.0% 86.8% 69.0% 146.5% 139.1% 125.1% 123.8% 115.7% + Other Assets 19.7% 21.3% 23.1% 25.1% 25.4% 25.9% 28.4% 30.7% 30.7% = Total Capital 102.2% 122.5% 113.3% 107.1% 179.8% 176.7% 156.6% 160.2% 144.8% => Total Capital - $ $3,183,972 $3,533,483 $3,152,012 $3,144,711 $5,924,640 $6,325,407 $6,285,139 $6,379,942 $6,363,918
Wgt Avg Cap Cost C* 8.0% 8.0% 8.0% 8.9% 8.2% 8.2% 8.9% 6.1% 8.1% Capital Charge / Sales 8.2% 9.8% 9.0% 9.5% 14.8% 14.4% 14.0% 9.7% 11.7% Capital Charge - $ $254,506 $282,443 $250,655 $280,194 $486,414 $516,762 $561,383 $386,457 $515,378
EVA Margin (11.7%) (18.6%) (13.5%) (2.4%) (5.4%) (6.0%) (3.3%) (4.6%) (3.3%) x Net Revenue $3,114,379 $2,883,914 $2,781,672 $2,937,083 $3,295,012 $3,579,112 $4,012,386 $3,981,698 $4,393,940 => EVA ($365,538) ($535,266) ($375,057) ($70,392) ($178,420) ($214,346) ($132,425) ($182,098) ($147,135)
($400,000)
($200,000)
$---
$200,000
$400,000
$600,000
1991 1992 1993 1994 1995 1996 1997 1998 1999
Market Value Added
($600,000)
($500,000)
($400,000)
($300,000)
($200,000)
($100,000)
$---
1991 1992 1993 1994 1995 1996 1997 1998 1999
(10%)
(8%)
(6%)
(4%)
(2%)
---%
2%
4%
6%
8%
10%
EVA Wgt Avg Cap Cost C* Return on Capital
(150%)
(100%)
(50%)
---%
50%
100%
150%
200%
250%
1991 1992 1993 1994 1995 1996 1997 1998 1999
FGV
COV
THE NEW MATH; 4 > 8
15
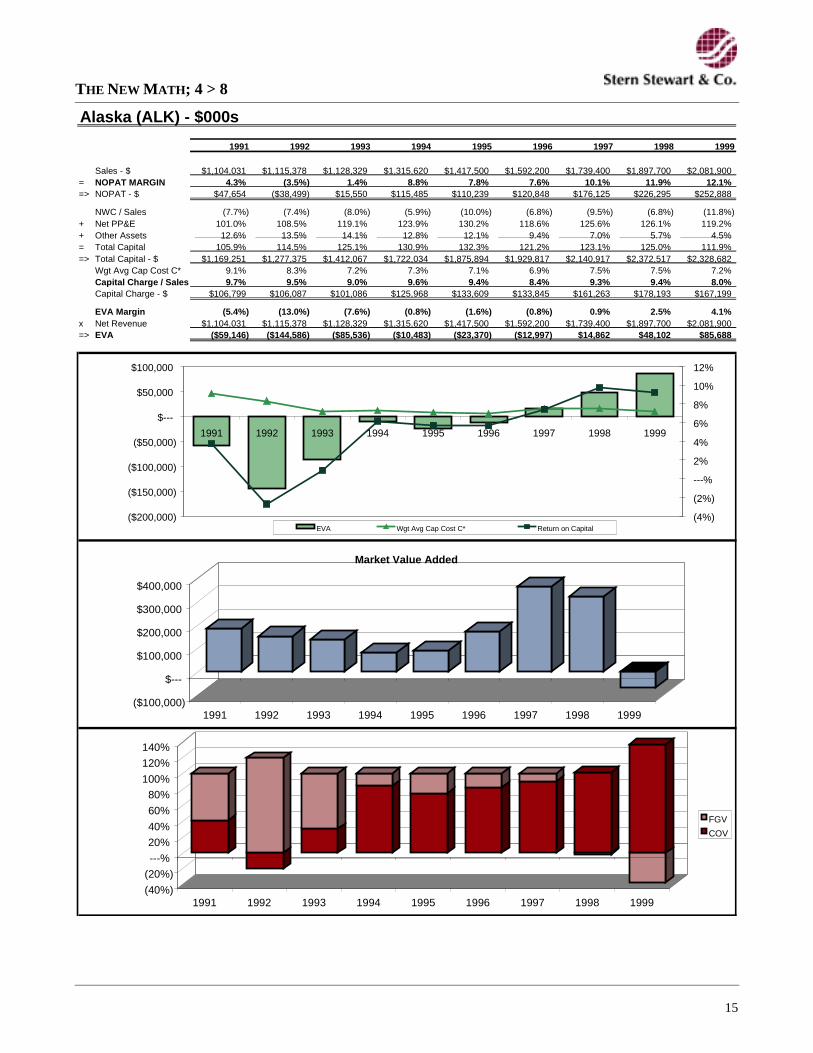
Alaska (ALK) - $000s
1991 1992 1993 1994 1995 1996 1997 1998 1999
Sales - $ $1,104,031 $1,115,378 $1,128,329 $1,315,620 $1,417,500 $1,592,200 $1,739,400 $1,897,700 $2,081,900 = NOPAT MARGIN 4.3% (3.5%) 1.4% 8.8% 7.8% 7.6% 10.1% 11.9% 12.1% => NOPAT - $ $47,654 ($38,499) $15,550 $115,485 $110,239 $120,848 $176,125 $226,295 $252,888
NWC / Sales (7.7%) (7.4%) (8.0%) (5.9%) (10.0%) (6.8%) (9.5%) (6.8%) (11.8%) + Net PP&E 101.0% 108.5% 119.1% 123.9% 130.2% 118.6% 125.6% 126.1% 119.2% + Other Assets 12.6% 13.5% 14.1% 12.8% 12.1% 9.4% 7.0% 5.7% 4.5% = Total Capital 105.9% 114.5% 125.1% 130.9% 132.3% 121.2% 123.1% 125.0% 111.9% => Total Capital - $ $1,169,251 $1,277,375 $1,412,067 $1,722,034 $1,875,894 $1,929,817 $2,140,917 $2,372,517 $2,328,682
Wgt Avg Cap Cost C* 9.1% 8.3% 7.2% 7.3% 7.1% 6.9% 7.5% 7.5% 7.2% Capital Charge / Sales 9.7% 9.5% 9.0% 9.6% 9.4% 8.4% 9.3% 9.4% 8.0% Capital Charge - $ $106,799 $106,087 $101,086 $125,968 $133,609 $133,845 $161,263 $178,193 $167,199
EVA Margin (5.4%) (13.0%) (7.6%) (0.8%) (1.6%) (0.8%) 0.9% 2.5% 4.1% x Net Revenue $1,104,031 $1,115,378 $1,128,329 $1,315,620 $1,417,500 $1,592,200 $1,739,400 $1,897,700 $2,081,900 => EVA ($59,146) ($144,586) ($85,536) ($10,483) ($23,370) ($12,997) $14,862 $48,102 $85,688
($100,000)
$---
$100,000
$200,000
$300,000
$400,000
1991 1992 1993 1994 1995 1996 1997 1998 1999
Market Value Added
($200,000)
($150,000)
($100,000)
($50,000)
$---
$50,000
$100,000
1991 1992 1993 1994 1995 1996 1997 1998 1999
(4%)
(2%)
---%
2%
4%
6%
8%
10%
12%
EVA Wgt Avg Cap Cost C* Return on Capital
(40%)
(20%)
---%
20%
40%
60%
80%
100%
120%
140%
1991 1992 1993 1994 1995 1996 1997 1998 1999
FGV
COV

THE NEW MATH; 4 > 8
16
America West (AWA) - $000s
1991 1992 1993 1994 1995 1996 1997 1998 1999
Sales - $ $1,413,925 $1,294,140 $1,325,364 $1,408,794 $1,550,642 $1,739,526 $1,874,956 $2,023,284 $2,210,884 = NOPAT MARGIN (2.7%) 1.6% 12.8% 6.6% 12.7% 9.7% 10.0% 13.3% 13.3% => NOPAT - $ ($38,800) $20,882 $169,258 $92,783 $196,979 $168,469 $187,386 $270,042 $294,361
NWC / Sales (3.2%) 0.9% (2.0%) 1.3% 3.1% 1.2% (4.7%) (3.4%) (6.0%) + Net PP&E 159.5% 170.6% 142.7% 134.6% 115.9% 101.8% 100.4% 99.5% 98.9% + Other Assets (1.0%) 4.1% 5.1% 5.9% 39.9% 33.0% 29.7% 28.1% 23.5% = Total Capital 155.3% 175.6% 145.8% 141.8% 158.9% 136.1% 125.4% 124.3% 116.3% => Total Capital - $ $2,196,171 $2,272,034 $1,932,797 $1,997,970 $2,464,258 $2,366,730 $2,351,428 $2,514,378 $2,572,040
Wgt Avg Cap Cost C* 8.9% 8.9% 8.2% 7.7% 8.3% 7.9% 7.8% 7.9% 7.8% Capital Charge / Sales 13.8% 15.6% 12.0% 10.9% 13.2% 10.7% 9.8% 9.9% 9.1% Capital Charge - $ $194,800 $201,529 $159,069 $153,045 $204,780 $186,972 $184,352 $199,390 $201,391
EVA Margin (16.5%) (14.0%) 0.8% (4.3%) (0.5%) (1.1%) 0.2% 3.5% 4.2% x Net Revenue $1,413,925 $1,294,140 $1,325,364 $1,408,794 $1,550,642 $1,739,526 $1,874,956 $2,023,284 $2,210,884 => EVA ($233,600) ($180,647) $10,189 ($60,262) ($7,801) ($18,503) $3,034 $70,652 $92,970
($200,000)
($100,000)
$---
$100,000
$200,000
$300,000
1991 1992 1993 1994 1995 1996 1997 1998 1999
Market Value Added
($250,000)
($200,000)
($150,000)
($100,000)
($50,000)
$---
$50,000
$100,000
$150,000
1991 1992 1993 1994 1995 1996 1997 1998 1999
(4%)
(2%)
---%
2%
4%
6%
8%
10%
12%
EVA Wgt Avg Cap Cost C* Return on Capital
(50%)
---%
50%
100%
150%
1991 1992 1993 1994 1995 1996 1997 1998 1999
FGV
COV

THE NEW MATH; 4 > 8
17
AMR (AMR) - $000s
1991 1992 1993 1994 1995 1996 1997 1998 1999
Sales - $ $12,887,000 $14,396,000 $15,701,000 $16,137,000 $16,910,000 $17,753,000 $18,570,000 $19,205,000 $17,730,000 = NOPAT MARGIN 0.7% 4.1% 5.4% 8.3% 8.7% 10.7% 10.8% 11.3% 7.8% => NOPAT - $ $88,971 $596,727 $854,153 $1,343,743 $1,463,293 $1,899,171 $2,006,285 $2,171,015 $1,379,600
NWC / Sales (13.0%) (14.1%) (12.6%) (11.8%) (10.7%) (11.3%) (12.2%) (12.3%) (14.2%) + Net PP&E 89.2% 125.4% 136.6% 110.3% 136.7% 124.8% 122.7% 117.8% 135.1% + Other Assets 10.9% 15.5% 8.2% 7.0% 8.3% 10.4% 7.6% 7.2% 12.3% = Total Capital 87.1% 126.8% 132.3% 105.5% 134.3% 123.9% 118.1% 112.7% 133.2% => Total Capital - $ $11,224,718 $18,256,765 $20,765,084 $17,022,285 $22,703,175 $21,998,737 $21,936,238 $21,634,952 $23,620,429
Wgt Avg Cap Cost C* 9.9% 8.9% 8.5% 8.7% 9.0% 8.7% 8.9% 8.8% 7.1% Capital Charge / Sales 8.6% 11.3% 11.2% 9.2% 12.0% 10.8% 10.5% 9.9% 9.5% Capital Charge - $ $1,114,366 $1,632,506 $1,762,520 $1,476,539 $2,034,478 $1,924,459 $1,955,299 $1,906,739 $1,686,499
EVA Margin (8.0%) (7.2%) (5.8%) (0.8%) (3.4%) (0.1%) 0.3% 1.4% (1.7%) x Net Revenue $12,887,000 $14,396,000 $15,701,000 $16,137,000 $16,910,000 $17,753,000 $18,570,000 $19,205,000 $17,730,000 => EVA ($1,025,395) ($1,035,780) ($908,367) ($132,795) ($571,185) ($25,289) $50,986 $264,277 ($306,898)
$---
$1,000,000
$2,000,000
$3,000,000
$4,000,000
$5,000,000
$6,000,000
1991 1992 1993 1994 1995 1996 1997 1998 1999
Market Value Added
($1,200,000)
($1,000,000)
($800,000)
($600,000)
($400,000)
($200,000)
$---
$200,000
$400,000
1991 1992 1993 1994 1995 1996 1997 1998 1999
---%
2%
4%
6%
8%
10%
12%
EVA Wgt Avg Cap Cost C* Return on Capital
---%
20%
40%
60%
80%
100%
1991 1992 1993 1994 1995 1996 1997 1998 1999
FGV
COV
THE NEW MATH; 4 > 8
18
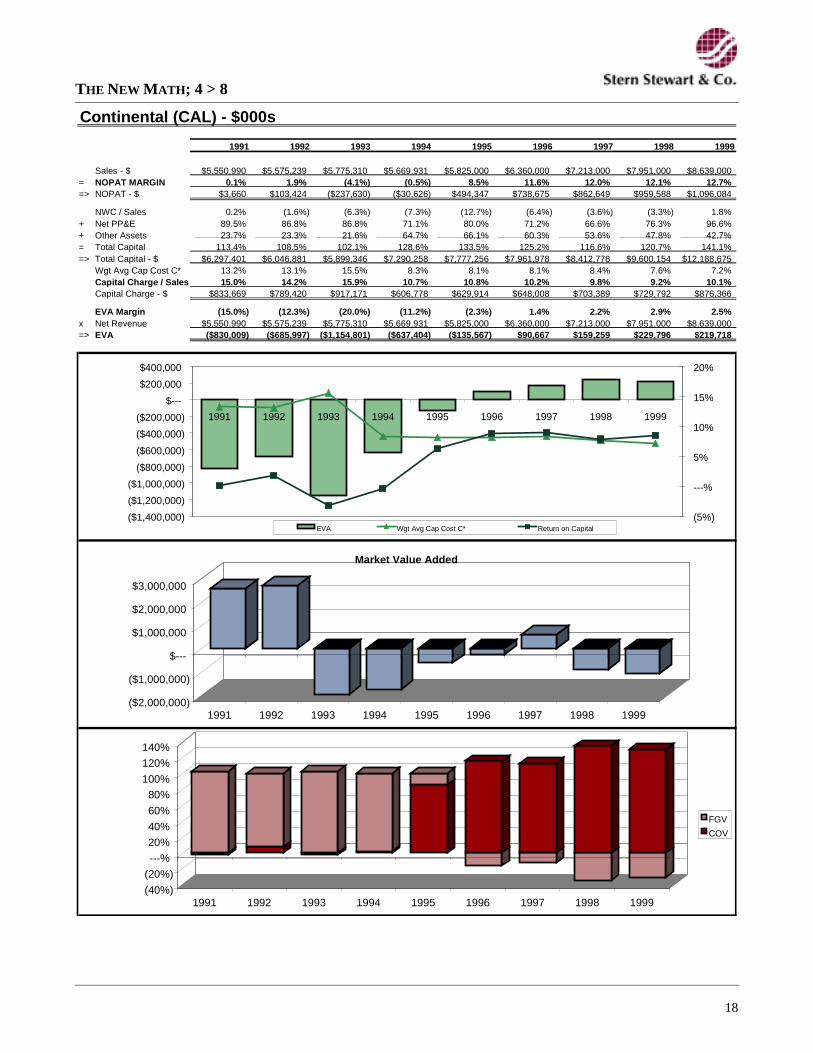
Continental (CAL) - $000s
1991 1992 1993 1994 1995 1996 1997 1998 1999
Sales - $ $5,550,990 $5,575,239 $5,775,310 $5,669,931 $5,825,000 $6,360,000 $7,213,000 $7,951,000 $8,639,000 = NOPAT MARGIN 0.1% 1.9% (4.1%) (0.5%) 8.5% 11.6% 12.0% 12.1% 12.7% => NOPAT - $ $3,660 $103,424 ($237,630) ($30,626) $494,347 $738,675 $862,649 $959,588 $1,096,084
NWC / Sales 0.2% (1.6%) (6.3%) (7.3%) (12.7%) (6.4%) (3.6%) (3.3%) 1.8% + Net PP&E 89.5% 86.8% 86.8% 71.1% 80.0% 71.2% 66.6% 76.3% 96.6% + Other Assets 23.7% 23.3% 21.6% 64.7% 66.1% 60.3% 53.6% 47.8% 42.7% = Total Capital 113.4% 108.5% 102.1% 128.6% 133.5% 125.2% 116.6% 120.7% 141.1% => Total Capital - $ $6,297,401 $6,046,881 $5,899,346 $7,290,258 $7,777,256 $7,961,978 $8,412,778 $9,600,154 $12,188,675
Wgt Avg Cap Cost C* 13.2% 13.1% 15.5% 8.3% 8.1% 8.1% 8.4% 7.6% 7.2% Capital Charge / Sales 15.0% 14.2% 15.9% 10.7% 10.8% 10.2% 9.8% 9.2% 10.1% Capital Charge - $ $833,669 $789,420 $917,171 $606,778 $629,914 $648,008 $703,389 $729,792 $876,366
EVA Margin (15.0%) (12.3%) (20.0%) (11.2%) (2.3%) 1.4% 2.2% 2.9% 2.5% x Net Revenue $5,550,990 $5,575,239 $5,775,310 $5,669,931 $5,825,000 $6,360,000 $7,213,000 $7,951,000 $8,639,000 => EVA ($830,009) ($685,997) ($1,154,801) ($637,404) ($135,567) $90,667 $159,259 $229,796 $219,718
($2,000,000)
($1,000,000)
$---
$1,000,000
$2,000,000
$3,000,000
1991 1992 1993 1994 1995 1996 1997 1998 1999
Market Value Added
($1,400,000)
($1,200,000)
($1,000,000)
($800,000)
($600,000)
($400,000)
($200,000)
$---
$200,000
$400,000
1991 1992 1993 1994 1995 1996 1997 1998 1999
(5%)
---%
5%
10%
15%
20%
EVA Wgt Avg Cap Cost C* Return on Capital
(40%)
(20%)
---%
20%
40%
60%
80%
100%
120%
140%
1991 1992 1993 1994 1995 1996 1997 1998 1999
FGV
COV

THE NEW MATH; 4 > 8
19
Delta (DAL) - $000s
1991 1992 1993 1994 1995 1996 1997 1998 1999
Sales - $ $9,170,613 $10,836,785 $11,996,650 $12,359,000 $12,194,000 $12,455,000 $13,590,000 $14,138,000 $14,711,000 = NOPAT MARGIN (2.1%) (2.6%) (1.2%) 1.8% 6.1% 7.5% 11.0% 12.2% 13.9% => NOPAT - $ ($189,097) ($276,582) ($144,885) $222,592 $737,876 $931,456 $1,499,113 $1,729,640 $2,044,220
NWC / Sales (7.0%) (1.0%) (8.0%) (0.2%) (3.6%) (5.7%) (5.3%) (9.7%) (10.9%) + Net PP&E 81.6% 78.9% 88.8% 87.5% 85.3% 84.4% 75.0% 111.9% 124.8% + Other Assets 8.6% 8.3% 0.5% 0.4% 1.8% 3.6% 3.0% 5.4% 5.9% = Total Capital 83.2% 86.2% 81.4% 87.7% 83.5% 82.3% 72.7% 107.5% 119.8% => Total Capital - $ $7,631,769 $9,340,343 $9,765,601 $10,840,059 $10,180,226 $10,249,701 $9,879,129 $15,200,039 $17,626,302
Wgt Avg Cap Cost C* 10.5% 9.4% 8.4% 8.4% 9.0% 8.6% 8.7% 8.2% 7.3% Capital Charge / Sales 8.8% 8.1% 6.8% 7.4% 7.5% 7.1% 6.3% 8.8% 8.8% Capital Charge - $ $803,796 $881,734 $816,370 $911,100 $918,346 $881,090 $858,595 $1,244,068 $1,293,771
EVA Margin (10.8%) (10.7%) (8.0%) (5.6%) (1.5%) 0.4% 4.7% 3.4% 5.1% x Net Revenue $9,170,613 $10,836,785 $11,996,650 $12,359,000 $12,194,000 $12,455,000 $13,590,000 $14,138,000 $14,711,000 => EVA ($992,893) ($1,158,316) ($961,255) ($688,508) ($180,470) $50,366 $640,518 $485,573 $750,449
$---
$1,000,000
$2,000,000
$3,000,000
$4,000,000
$5,000,000
$6,000,000
$7,000,000
1991 1992 1993 1994 1995 1996 1997 1998 1999
Market Value Added
($1,500,000)
($1,000,000)
($500,000)
$---
$500,000
$1,000,000
1991 1992 1993 1994 1995 1996 1997 1998 1999
(4%)
(2%)
---%
2%
4%
6%
8%
10%
12%
EVA Wgt Avg Cap Cost C* Return on Capital
(40%)
(20%)
---%
20%
40%
60%
80%
100%
120%
140%
1991 1992 1993 1994 1995 1996 1997 1998 1999
FGV
COV
THE NEW MATH; 4 > 8
20
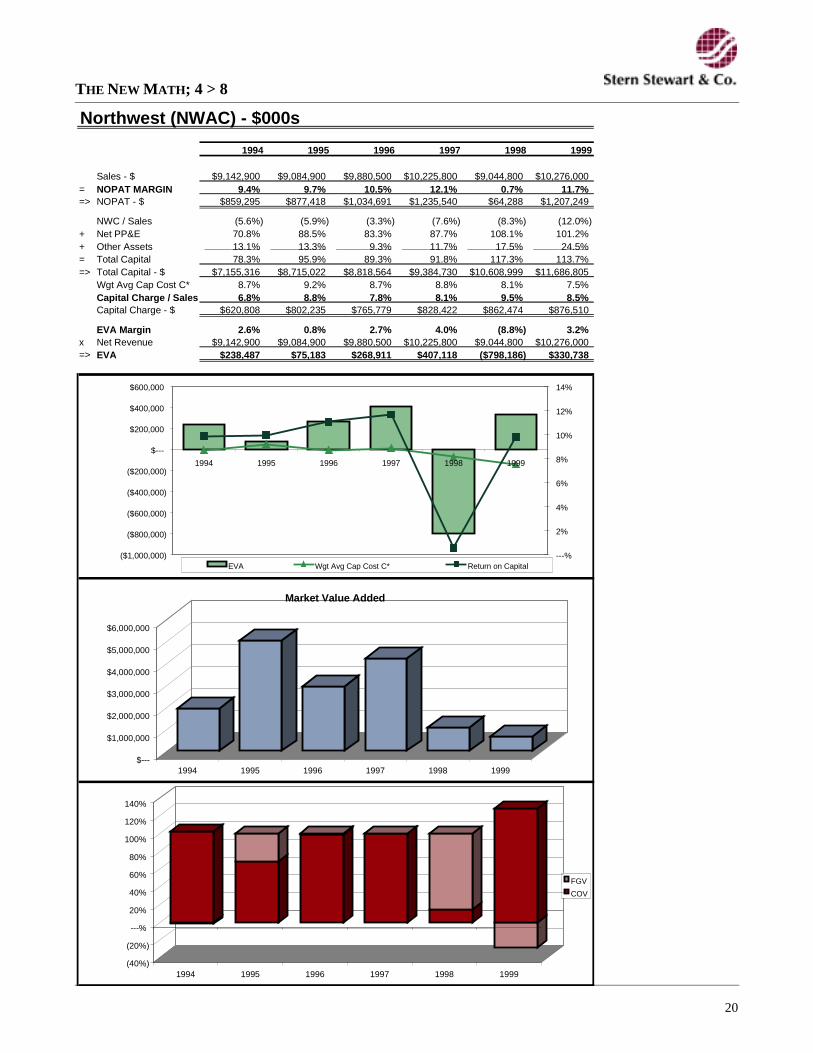
Northwest (NWAC) - $000s
1994 1995 1996 1997 1998 1999
Sales - $ $9,142,900 $9,084,900 $9,880,500 $10,225,800 $9,044,800 $10,276,000 = NOPAT MARGIN 9.4% 9.7% 10.5% 12.1% 0.7% 11.7% => NOPAT - $ $859,295 $877,418 $1,034,691 $1,235,540 $64,288 $1,207,249
NWC / Sales (5.6%) (5.9%) (3.3%) (7.6%) (8.3%) (12.0%) + Net PP&E 70.8% 88.5% 83.3% 87.7% 108.1% 101.2% + Other Assets 13.1% 13.3% 9.3% 11.7% 17.5% 24.5% = Total Capital 78.3% 95.9% 89.3% 91.8% 117.3% 113.7% => Total Capital - $ $7,155,316 $8,715,022 $8,818,564 $9,384,730 $10,608,999 $11,686,805
Wgt Avg Cap Cost C* 8.7% 9.2% 8.7% 8.8% 8.1% 7.5% Capital Charge / Sales 6.8% 8.8% 7.8% 8.1% 9.5% 8.5% Capital Charge - $ $620,808 $802,235 $765,779 $828,422 $862,474 $876,510
EVA Margin 2.6% 0.8% 2.7% 4.0% (8.8%) 3.2% x Net Revenue $9,142,900 $9,084,900 $9,880,500 $10,225,800 $9,044,800 $10,276,000 => EVA $238,487 $75,183 $268,911 $407,118 ($798,186) $330,738
$---
$1,000,000
$2,000,000
$3,000,000
$4,000,000
$5,000,000
$6,000,000
1994 1995 1996 1997 1998 1999
Market Value Added
($1,000,000)
($800,000)
($600,000)
($400,000)
($200,000)
$---
$200,000
$400,000
$600,000
1994 1995 1996 1997 1998 1999
---%
2%
4%
6%
8%
10%
12%
14%
EVA Wgt Avg Cap Cost C* Return on Capital
(40%)
(20%)
---%
20%
40%
60%
80%
100%
120%
140%
1994 1995 1996 1997 1998 1999
FGV
COV

THE NEW MATH; 4 > 8
21
Southwest (LUV) - $000s
1991 1992 1993 1994 1995 1996 1997 1998 1999
Sales - $ $1,313,605 $1,685,178 $2,296,673 $2,591,933 $2,872,751 $3,406,170 $3,816,821 $4,163,980 $4,735,587 = NOPAT MARGIN 4.0% 9.3% 11.5% 11.2% 10.8% 10.7% 13.0% 15.0% 16.2% => NOPAT - $ $53,120 $156,656 $263,132 $290,366 $310,489 $365,902 $494,314 $623,160 $764,938
NWC / Sales (3.4%) 5.2% 6.8% (0.9%) (6.9%) (3.6%) (0.1%) 1.4% (5.6%) + Net PP&E 118.6% 109.5% 95.8% 104.5% 133.7% 130.0% 131.5% 129.8% 128.5% + Other Assets (2.4%) (1.3%) (1.2%) (0.8%) (0.5%) (0.4%) (0.4%) (0.3%) (0.3%) = Total Capital 112.9% 113.4% 101.3% 102.8% 126.3% 125.9% 131.1% 130.9% 122.7% => Total Capital - $ $1,482,501 $1,910,356 $2,326,523 $2,663,507 $3,629,519 $4,289,802 $5,002,405 $5,451,345 $5,810,060
Wgt Avg Cap Cost C* 9.9% 9.6% 8.9% 9.6% 9.2% 8.8% 8.8% 8.2% 8.9% Capital Charge / Sales 11.2% 10.9% 9.0% 9.9% 11.6% 11.1% 11.5% 10.7% 11.0% Capital Charge - $ $147,127 $183,643 $207,514 $256,024 $333,006 $376,551 $440,471 $446,324 $518,838
EVA Margin (7.2%) (1.6%) 2.4% 1.3% (0.8%) (0.3%) 1.4% 4.2% 5.2% x Net Revenue $1,313,605 $1,685,178 $2,296,673 $2,591,933 $2,872,751 $3,406,170 $3,816,821 $4,163,980 $4,735,587 => EVA ($94,007) ($26,987) $55,618 $34,343 ($22,517) ($10,650) $53,843 $176,836 $246,100
$---
$1,000,000
$2,000,000
$3,000,000
$4,000,000
$5,000,000
$6,000,000
1991 1992 1993 1994 1995 1996 1997 1998 1999
Market Value Added
($150,000)
($100,000)
($50,000)
$---
$50,000
$100,000
$150,000
$200,000
$250,000
$300,000
1991 1992 1993 1994 1995 1996 1997 1998 1999
---%
2%
4%
6%
8%
10%
12%
14%
EVA Wgt Avg Cap Cost C* Return on Capital
---%
20%
40%
60%
80%
100%
1991 1992 1993 1994 1995 1996 1997 1998 1999
FGV
COV

THE NEW MATH; 4 > 8
22
TWA (TWA) - $000s
1993 1994 1995 1996 1997 1998 1999
Sales - $ $3,154,441 $3,407,702 $3,316,829 $3,554,407 $3,327,952 $3,259,147 $3,308,712 = NOPAT MARGIN (9.5%) (4.6%) (1.6%) (1.7%) 3.3% 4.5% (0.1%) => NOPAT - $ ($298,747) ($155,190) ($53,206) ($59,242) $108,911 $145,219 ($3,085)
NWC / Sales 1.2% 0.0% (3.0%) 0.8% (7.1%) (5.9%) (6.7%) + Net PP&E 52.6% 44.7% 45.6% 41.6% 70.5% 86.8% 84.9% + Other Assets (4.4%) (21.1%) (21.1%) (10.2%) (11.7%) (14.1%) (15.0%) = Total Capital 49.4% 23.7% 21.6% 32.2% 51.8% 66.8% 63.1% => Total Capital - $ $1,558,543 $806,733 $716,534 $1,142,852 $1,722,710 $2,178,138 $2,088,493
Wgt Avg Cap Cost C* 7.6% 8.2% 8.3% 8.2% 7.7% 7.8% 7.9% Capital Charge / Sales 3.8% 1.9% 1.8% 2.6% 4.0% 5.2% 5.0% Capital Charge - $ $118,293 $66,233 $59,616 $93,485 $132,649 $169,024 $164,364
EVA Margin (13.2%) (6.5%) (3.4%) (4.3%) (0.7%) (0.7%) (5.1%) x Net Revenue $3,154,441 $3,407,702 $3,316,829 $3,554,407 $3,327,952 $3,259,147 $3,308,712 => EVA ($417,041) ($221,423) ($112,822) ($152,727) ($23,737) ($23,805) ($167,449)
$---
$500,000
$1,000,000
$1,500,000
$2,000,000
$2,500,000
1993 1994 1995 1996 1997 1998 1999
Market Value Added
($450,000)
($400,000)
($350,000)
($300,000)
($250,000)
($200,000)
($150,000)
($100,000)
($50,000)
$---
1993 1994 1995 1996 1997 1998 1999
(40%)
(35%)
(30%)
(25%)
(20%)
(15%)
(10%)
(5%)
---%
5%
10%
15%
EVA Wgt Avg Cap Cost C* Return on Capital
(200%)
(150%)
(100%)
(50%)
---%
50%
100%
150%
200%
250%
300%
1993 1994 1995 1996 1997 1998 1999
FGV
COV
THE NEW MATH; 4 > 8
23
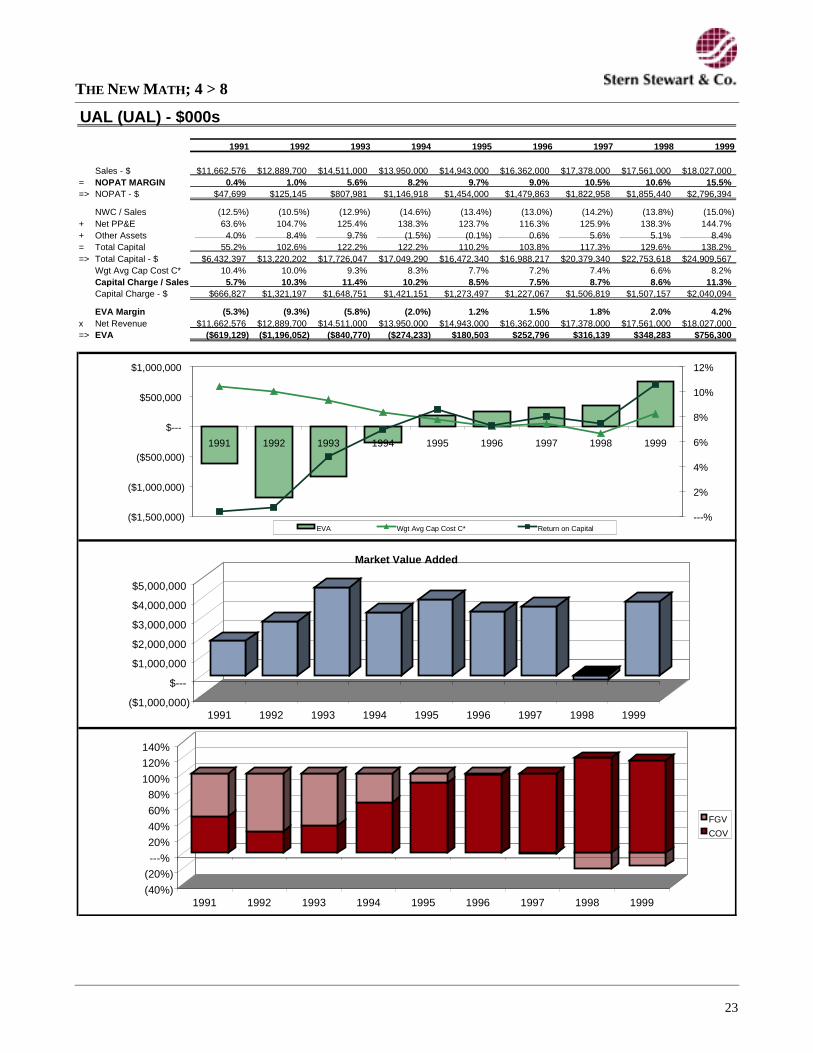
UAL (UAL) - $000s
1991 1992 1993 1994 1995 1996 1997 1998 1999
Sales - $ $11,662,576 $12,889,700 $14,511,000 $13,950,000 $14,943,000 $16,362,000 $17,378,000 $17,561,000 $18,027,000 = NOPAT MARGIN 0.4% 1.0% 5.6% 8.2% 9.7% 9.0% 10.5% 10.6% 15.5% => NOPAT - $ $47,699 $125,145 $807,981 $1,146,918 $1,454,000 $1,479,863 $1,822,958 $1,855,440 $2,796,394
NWC / Sales (12.5%) (10.5%) (12.9%) (14.6%) (13.4%) (13.0%) (14.2%) (13.8%) (15.0%) + Net PP&E 63.6% 104.7% 125.4% 138.3% 123.7% 116.3% 125.9% 138.3% 144.7% + Other Assets 4.0% 8.4% 9.7% (1.5%) (0.1%) 0.6% 5.6% 5.1% 8.4% = Total Capital 55.2% 102.6% 122.2% 122.2% 110.2% 103.8% 117.3% 129.6% 138.2% => Total Capital - $ $6,432,397 $13,220,202 $17,726,047 $17,049,290 $16,472,340 $16,988,217 $20,379,340 $22,753,618 $24,909,567
Wgt Avg Cap Cost C* 10.4% 10.0% 9.3% 8.3% 7.7% 7.2% 7.4% 6.6% 8.2% Capital Charge / Sales 5.7% 10.3% 11.4% 10.2% 8.5% 7.5% 8.7% 8.6% 11.3% Capital Charge - $ $666,827 $1,321,197 $1,648,751 $1,421,151 $1,273,497 $1,227,067 $1,506,819 $1,507,157 $2,040,094
EVA Margin (5.3%) (9.3%) (5.8%) (2.0%) 1.2% 1.5% 1.8% 2.0% 4.2% x Net Revenue $11,662,576 $12,889,700 $14,511,000 $13,950,000 $14,943,000 $16,362,000 $17,378,000 $17,561,000 $18,027,000 => EVA ($619,129) ($1,196,052) ($840,770) ($274,233) $180,503 $252,796 $316,139 $348,283 $756,300
($1,000,000)
$---
$1,000,000
$2,000,000
$3,000,000
$4,000,000
$5,000,000
1991 1992 1993 1994 1995 1996 1997 1998 1999
Market Value Added
($1,500,000)
($1,000,000)
($500,000)
$---
$500,000
$1,000,000
1991 1992 1993 1994 1995 1996 1997 1998 1999
---%
2%
4%
6%
8%
10%
12%
EVA Wgt Avg Cap Cost C* Return on Capital
(40%)
(20%)
---%
20%
40%
60%
80%
100%
120%
140%
1991 1992 1993 1994 1995 1996 1997 1998 1999
FGV
COV
THE NEW MATH; 4 > 8
24
USAir (U) - $000s
1991 1992 1993 1994 1995 1996 1997 1998 1999
Sales - $ $6,514,071 $6,686,412 $7,083,208 $6,997,194 $7,474,348 $8,142,413 $8,513,824 $8,688,000 $8,595,000 = NOPAT MARGIN (2.4%) (3.2%) 0.4% (3.1%) 6.0% 6.6% 10.0% 11.3% 5.4% => NOPAT - $ ($154,524) ($214,713) $30,004 ($217,922) $449,393 $540,419 $849,070 $979,875 $466,604
NWC / Sales (7.8%) (11.9%) (20.9%) (19.0%) (14.3%) (10.2%) (12.7%) (4.8%) (4.8%) + Net PP&E 98.8% 105.6% 101.3% 105.1% 98.0% 85.3% 79.1% 76.8% 77.1% + Other Assets 15.1% 16.7% 8.8% 7.3% 8.5% 6.1% 4.8% 9.4% 7.2% = Total Capital 106.0% 110.4% 89.3% 93.4% 92.2% 81.3% 71.2% 81.4% 79.5% => Total Capital - $ $6,906,483 $7,379,981 $6,323,881 $6,531,929 $6,894,102 $6,616,937 $6,062,729 $7,071,577 $6,834,006
Wgt Avg Cap Cost C* 9.6% 8.3% 7.5% 7.5% 7.5% 7.3% 9.1% 9.0% 7.5% Capital Charge / Sales 10.1% 9.2% 6.7% 7.0% 6.9% 5.9% 6.4% 7.3% 5.9% Capital Charge - $ $660,844 $615,067 $473,843 $487,961 $519,347 $483,964 $549,022 $633,798 $509,133
EVA Margin (12.5%) (12.4%) (6.3%) (10.1%) (0.9%) 0.7% 3.5% 4.0% (0.5%) x Net Revenue $6,514,071 $6,686,412 $7,083,208 $6,997,194 $7,474,348 $8,142,413 $8,513,824 $8,688,000 $8,595,000 => EVA ($815,368) ($829,780) ($443,839) ($705,883) ($69,954) $56,455 $300,048 $346,077 ($42,529)
($1,000,000)
$---
$1,000,000
$2,000,000
$3,000,000
$4,000,000
$5,000,000
$6,000,000
1991 1992 1993 1994 1995 1996 1997 1998 1999
Market Value Added
($1,000,000)
($800,000)
($600,000)
($400,000)
($200,000)
$---
$200,000
$400,000
$600,000
1991 1992 1993 1994 1995 1996 1997 1998 1999
(6%)(4%)(2%)---%2%4%6%8%10%12%14%16%
EVA Wgt Avg Cap Cost C* Return on Capital
(50%)
---%
50%
100%
150%
1991 1992 1993 1994 1995 1996 1997 1998 1999
FGV
COV

����������Past Issues
EVA & Strategy: Jonah is Back!
Compensation Strategy for the New Economy Age
EVA & Strategy
Internet Valuation
Applications in Real Options & Value Based Strategy
ABC, the Balanced Scorecard & EVA
The Value of R&D
The Capitalist Manifesto
Lessons from Gorbachev
U.K. Remuneration Practices
For copies please visit the Stern Stewart website at www.eva.com.

Stern Stewart & Co.
NEW YORK
1345 Avenue of the Americas
NewYork, NY 10105
212/261-0600
LOS ANGELES
1901 Avenue of the Stars
Suite 1245
Los Angeles,CA 90067
310/407-0930
LONDON
13 Saint George Street
Mayfair, London WIR 9DE
44-171/399-3600
TOKYO
3F, Toranomon 45 Mori Building
5-1-5,Toranomon, Minato-Ku
Tokyo, Japan 105-0001
81-3/3431-3310
PARIS
264 Rue de Faubourg
Saint Honore, 75008 Paris
33-1/56 33 17 70
SINGAPORE
80 Raffles Place
UOB Plaza 1,#28-02
Singapore, 048624
65/538-3532
MUNICH
Salvatorplatz 4
D-80333 München
Tel.: +49 (0)89/24 20 71-0
Fax: +49 (0)89/24 20 71-11
SYDNEY
Grosvenor Place
225 George Street, Level 23
Sydney, NSW 2000
61-2/9251-3055
MILAN
Ambrosetti Stern Stewart Italia
Galleria Pattari, 2
20122 Milano
39-02/725-6501
JOHANNESBURG
Suite 316, South Tower
Sandton Square
Sandton 2196
27-11/883-5894
SÃO PAULO
Rua do Rócio, 291 - cj. 91
Vila Olímpia
São Paulo, SP, Brasil 04552-000
55-11/3040-0851
WWW .EVA .COM