north lanarkshire council report 24 september 1998 ref ce/o11/002/001 1 purpose 1.1 the purpose of...
TRANSCRIPT
NORTH LANARKSHIRE COUNCIL
To: POLICY AND RESOURCES (POLICY PLANNING AND PERFORMANCE REVIEW) SUB-COMMITTEE
From: CHIEF EXECUTIVE
REPORT
Subject: PUBLICATION OF 1997/98 STATUTORY PERFORMANCE INDICATORS
Date: 24 September 1998 Ref CE/O11/002/001
1 Purpose
1.1 The purpose of this report is to advise the committee of the publication of performance indicators for 1997/98 in compliance with statutory requirements.
2 Background
2.1 Under the Local Government Act 1992, The Accounts Commission for Scotland requires all local authorities to publish specific performance information relating to their activities in any financial year, the so-called ‘statutory performance indicators’. These must be published as a statutory advertisement in a newspaper or newspapers circulating in the council’s area. In previous years, the deadline for publication was set at 3 1 December each year but for 1997/98, this deadline has been brought forward by three months to 30 September.
2.2 The Accounts Commission strongly advocates that statutory performance information should also be included in a council’s own newspaper in addition to the statutory advertisement.
2.3 The Council’s Best Value Plan includes a commitment to produce an Annual Performance Report to be circulated to all households.
3 Publication of the Statutory Advertisement
3.1 The Chief Executive’s Department has consulted with relevant departments to co- ordinate the collection, calculation and internal audit of the required information and the design and production of the statutory advertisement.
3.2 All indicators were collected and audited by the end of August 1998 enabling the publication of the statutory advertisement in the week commencing 7& September 1998.
3.3 In order to ensure full and comprehensive coverage of the North Lanarkshire area, the statutory advertisement was placed in the following newspapers: Cumbernauld News, Kilsyth Chronicle, Airdrie & Coatbridge Advertiser, Motherwell Times, Bellshill Speaker and Wishaw Press as well as the Lothian Courier, Hamilton Advertiser and Kirkintilloch Herald.
3.4 A reduced copy of the advertisement, showing the format and layout, is attached at ANNEX 1. The full set of performance indicators for 1997/98 - as well as those for
IN[i:\pol\i&rX)l pi\03pi\l996.97\nportB6-97\pr960924pub2.doc] 17/09/98

1996/97 and the 1996/97 Scottish Averages (where available) - is contained in a separate report to the Policy and Resources (Policy Planning And Performance Review) Sub-C ommitt ee .
4 Publication of Performance Information in the North Lanarkshire News
4.1 In accordance with the Council’s Best Value Plan and the Accounts Commission’s recommendation to make performance information as widely available as possible, a selection of the statutory performance indicators covering a range of Council services has been included in a feature entitled Peflormunce Report in the latest edition of the North Lanarkshire News, due to be distributed during September. The indicators included are those which have been identified by the Accounts Commission as X e y Performance Indicators” and published, by them - separately from their main annual report - in a series of service based pamphlets.
4.2 Publishing a limited number of indicators in this format allows the Council’s performance in respect of these service areas to be examined in greater detail than is possible in the statutory advertisement. The service areas covered are: - education, environment, finance, housing, leisure, libraries and social work.
4.3 Graphs are used (rather than tables of figures) to better illustrate how the Council’s performance in 1997/98 compares to that in 1996/97 and, where appropriate, to Scottish Averages for 1996/97 and any national targets or benchmarks that exist.
4.4 Some commentary is included on the performance of the Council during 1997/98 in the light of (i) performance levels achieved in the previous year; (ii) the average performance of Scottish councils and (iii) any national targets or benchmarks. The comments include additional background information about some indicators, explanations of the Councils performance and, where relevant, an indication of action taken to improve future performance.
4.5 The content of the North Lanarkshire News feature is included in ANNEX 2.
5 Recommendations
5.1 The committee is asked to:
(a) note that the Council has complied with its statutory duty to publish performance information well within the deadline;
(b) note that the Council has complied with the commitment in the Best Value Plan to circulate an Annual Performance Report to all households.
- \ fl Chief Executive
Local Government Access to Information Act: for furfher information about this report? please contact Graham A. Reid, information and Research Manager, on Extension 2266.
IN[i:\polU6rWpiD3pi\lQQ&97tep(rrt96-9~~24pub2.doc] 1 7/09/98

ANNEX 1
Accounts Commission Statutory Performance Indicators
Statutory Advertisement
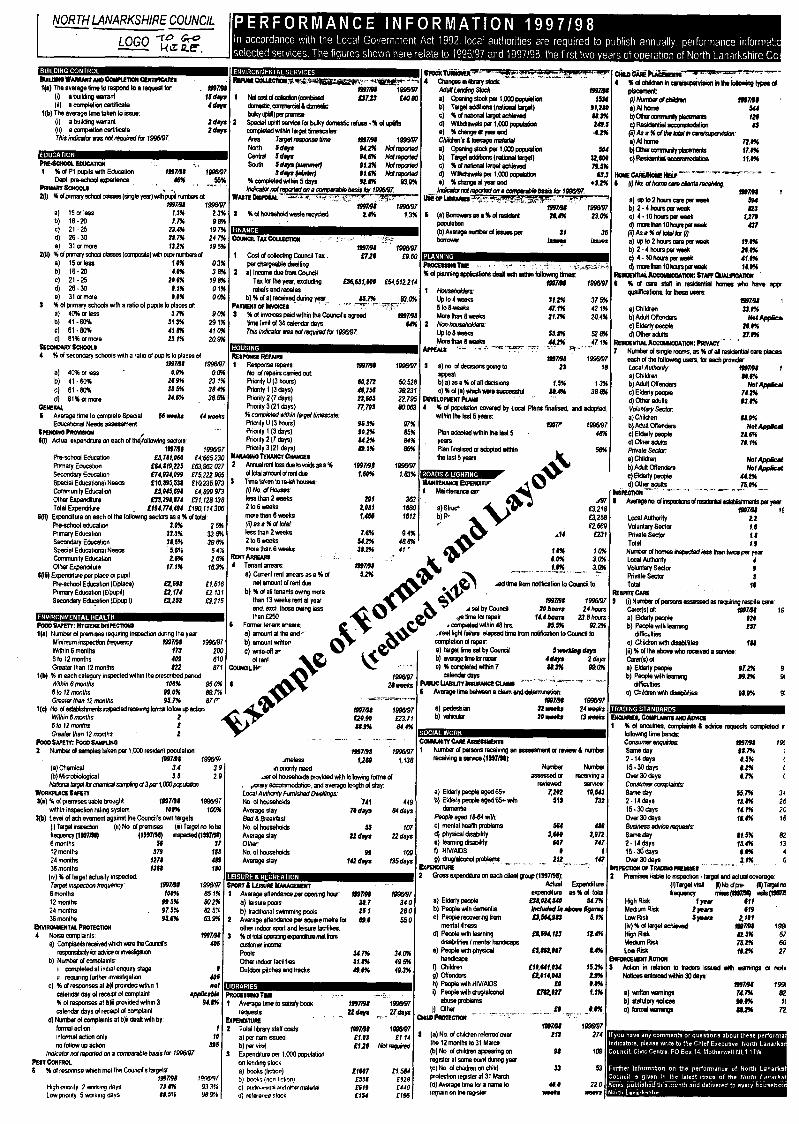
The first page of this ANNEX contains a reduced copy of the statutory advertisement as passed to the publishers at the beginning of September. This page is included only to show the format and layout of the advertisement. The detailed content of the advertisement may be examined in the subsequent pages of this ANNEX.
Note that most newspapers were able to carry the advertisement on a single page but some required one and one-third pages.
lN[i:bolh&r\Ol piU)lpi\l996-97\report96-97~r980924pub2.d0~] 17/09/98
1997AI laOW7 7 a) 4rnule9 ’ 06% om c) 61 .Boy 185% 384% 4 B I W a m r e 346% , 385%
b) 41.W 2S9% 23 1%
OEllERLL 6 Average lme 10 mnplele Spenal 56 nwb 44 lreeks
Educa(~maINeedsas%ssml
m 7 m
60.272 46,756 23.605 77,7OJ
96 m 90 2% 842% co.l%
1997,9191 1.60%
291 2081 Lis(
7.6% 542% 31.2%
m1m 52%
6 m t h r I 1 2 m l h s 379 24 m l h s 1278 36 months 1368
(iv)Kdtsrpet~dually inspeaed Twge(m~--m h u e n c y l B 7 M 6 monlhs 100% 12monlhr 99 5% 24 months 97 5% 36months 956%
DMRoWylllU PRorECEcTKII 4 N m conplainls
a) ~mer&Hhrchnwe*semeCands
b) Nw&i d complainls WV6WlU-u-
I completed al inilial e w r y slag I requring IulM inveslgalm
c) %dresponteralb)ipondedmlhml calm& day d me# d cmplaint %drespomaral b j i i p w M m l h i n 3 cam dap d recepl d conplaint
Q Nunba d mp!ainls a1 b b M mlh by l m a l adnn inlmnal adion only no ldlov w xlm
No olhw&d& 99 Aveageday
lld
l(a) The average time to respond to a request for: 1997198 (i) a building warrant (ii) a completion certificate
The average time taken to issue: (i) a building warrant (ii) a completion certificat@ This indicator was not required for 199647.
l(b)
15 days 4 days
2 days 2 days
B A @
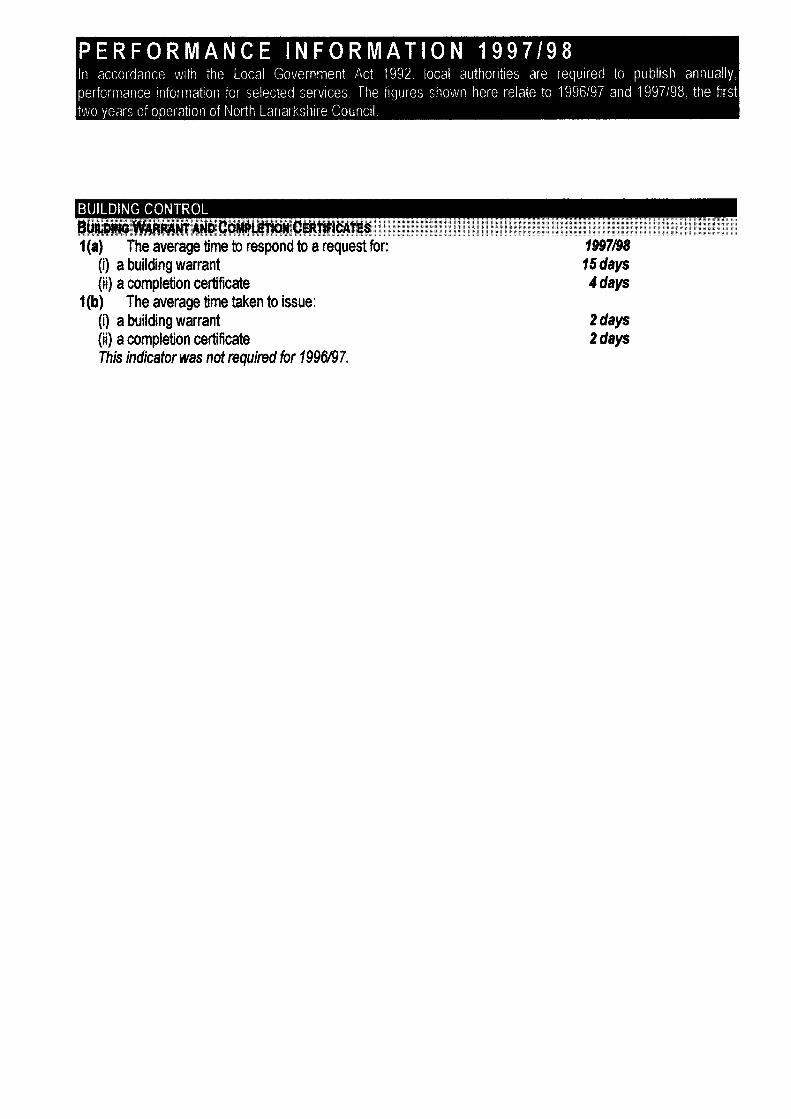
PRE=SCH~~L EDUCATION 1 % of P I pupils with Education Dept. pre-school experience 1997198: 46% 799w97: 55% PRIMARY SCHoaLS 2(i) % of primary school classes (single year) with pupil numbers of:
1997198 199W97 a) 15 or less 1.3% 2.3%
C) 21 -25 23.4% 19.7% d) 26 - 30 28.7% 24.7% e) 31 or more 13.2% 79.5%
% of primary s c h d classes (composite) with pupil numbers of: a) 15 or less 1.0% 0.3% b) 16-20 4.0% 3.8% C) 21 - 25 20.6% 19.8%
b) 16-20 7.7% 9.8%
2(i1)
d) 26-30 0.1% 0.1% e) 31 or more 0.0% 0.0%
a) 40%orless 3.7% 9.0% 3 % of primary schools with a ratio of pupils to places of:
b) 41 - 60% 31.3% 29.1% C) 61 -80% 41.8% 41.0% dl 81 % or more 23.1% 20.9%
S€C&DARY SCHOOLS 4 % of secondary schools with a ratio of pupils to places of:
1997198 1996/97 a) 40%orless 0.0% 0.0% b) 41 -60% 26.9% 23.7% c ) 61 -80% 38.5% 38.4% d) 81%or more 34.6% 38.5%
5 Average time to complete Special 1997198 1996/97 Educational Needs assessment 56 weeks 44 weeks
6(i) Actual expenditure on each of the following sectors: 1997198 1996/97
Pre-school Education €5,781, 060 f 4,665,230 Primary Education f 6 4 819, 225 €63,962,027 Secondary Education €74934,099 f 75,222,965 Special Educational €10,895,538 f 10,235,973 Needs Community Education €5,045,698 f4,899,973 Other Expenditure €33,298,874 f31,128,138 Total Expenditure f194,774,494 f790,174,306
Expenditure on each of the following sectors as a % of total: Pre-school education 3.0% 2.5% Primary Education 33.3% 33.6% Secondary Education 38.5% 39.6% Special Educational 5.6% 5.4% Needs Community Education 2.6% 2.6% Other Expenditure 17.1% 76.3%
Pre-school Education (#place) €2,698 f7,616 Primary Education (flpupil) f2 , 174 f2,13 1 Secondary Education (flpupil) €3,252 f3,215
6(ii)
6(iii) Expenditure per place or pupil:

l(a) Number of premises requiring inspection during the year: Minimum inspection frequency: 1997B8 199W97 Within 6 months 173 200 6 to 12 months 409 610 Greater than 12 months 822 871
Within 6 months 100% 95.0% 6 to 12 months 99.0% 89.7% Greater than 12 months 95.7% 87.0%
Within 6 months 2 5 6 to 12 months 2 1 Greater than 12 months 2 0
2 Number of samples taken per 1,000 resident population:
1 (b) % in each category inspected within the prescribed period:
1 (c) No. of establishments inspected receiving formal follow up action:
(a) Chemical (b) Microbiological
1997h8 199W97 3.4 3.9 3.5 2.9
National target for chemical sampling of 3 per 1,000 population
3(a) % of premises liable 1997198 199W97 brought within inspection rating 100% 100% system
(i) Target inspection frequency (1997N8) (ii) No. of premises (1997198) (iii) Target no. to be inspected (1997198) 6 months 56 37 12 months 379 188 24 months 1278 489 36 months 1368 180 (iv) % of target actually inspected: Target inspection frequency: 1997B8 199647 6 months 1OVh 85.7% 12 months 99.5% 80.2% 24 months 97.5% 82.5% 36 months 95.6% 63.9%
3(b) Level of achievement against the Council's own targets:
~VIRONIIIEWTAL PROTECTION 4 Noise complaints: 1997/98
a) 406 b) Number of complaints: i completed at initial enquiry stage 0 ii requiring further investigation 406 c) % of responses at b)i provided within 1 calendar day of receipt of complaint not applicable
94.8%
Complaints received which were the Council's Fesponsibilii for advice or investigation
% of responses at b)ii provided within 3 calendar days of receipt of complaint
d) Number of complaints at b)ii dealt with by: formal action informal action only no follow up action
1 I0
395
5 % of response which met the Council's targets: 1997B8 199W97 High priority: 2 working days 73.8% 93.3% Low priority: 5 working days 88.5% 98.9%
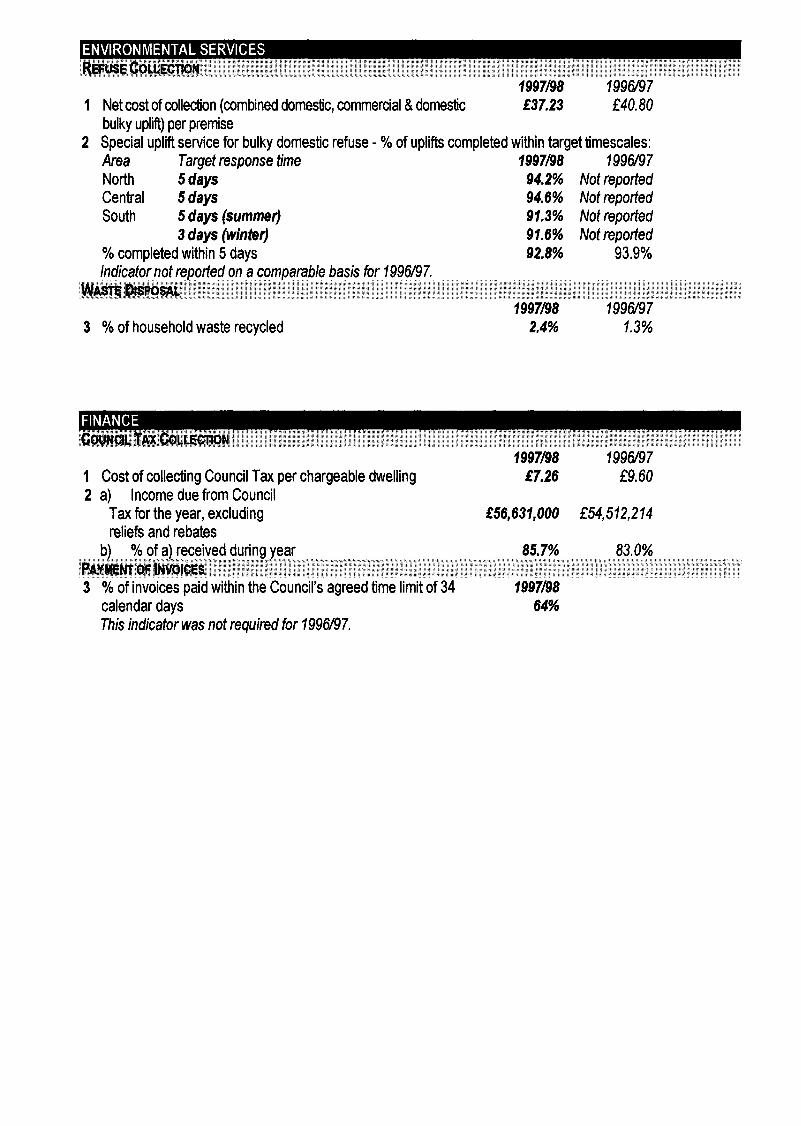
1997198 799w97 1 Net cost of collection (combined domestic, commercial & domestic €37.23 f 40.80
bulky upli) per premise 2 Special uplift service for bulky domestic refuse - % of uplifts completed within target timescales:
North 5 days 94.2% Not reported Central W a y s 94.6% Not reported South 5 days (summer) 91.3% Not reported
3 days (winter) 91.6% Not reported
Area Target response time 1997798 199w97
% completed within 5 days 92.8% 93.9%
1997198 799w97 3 % of household waste recycled 2.4% 7.3%
1997198 799w97 1 Cost of collecting Council Tax per chargeable dwelling f7.26 f 9.60 2 a)
Tax for the year, excluding €56,631,000 f 54,512,2 74 reliefs and rebates
Income due from Council
3 % of invoices paid within the Council’s agreed time limit of 34 1997798 calendar days 64% This indicator was not required for 799W97.

1 Response repairs: No. of repairs carried out. Priority U (3 hours) Priority 1 (3 days) Priority 2 (7 days) Priority 3 (21 days) % completed within farget timescale: Priority U (3 hours) Priority 1 (3 days) Priority 2 (7 days)
1997B8 1996/97
60,272 50,528 46,756 39,231 23,605 22,795 77,703 80,063
96.3% 97% 90.2% 85% 84.2% 84%
2
3
Annual rent loss due to voids as a % of total amount 1997B8 1996197 of rent due Time taken to re-let houses: (0 No. of Houses: less than 2 weeks 2 to 6 weeks more than 6 weeks (ii) as a % of total; less than 2 weeks 2 to 6 weeks
1.60% 1.83%
291 363 2,081 1880 1,466 1612
7.6% 9.4% 54.2% 48.8%
more than 6 weeks 38.2% 41.8%
4 Tenant arrears: 1997B8 1996/97 5.2% 5.7%
2.7% 1.3%
a) Current rent arrears as a % of net amount of
b) % of all tenants owing more than 13 weeks rent due
rent at year end, excl. those owing less than f 250
5 Former tenant arrears: a) amount at the end of year E 787,205 f 705,727 b) amount written off during year €266,130 f91,734
0.7% 0.2% C) write-off as a % of net amount of rent due in
1997B8 199619 7
7 Gross administration cost per case E 20.90 f23.71
1997198 1996197 1,269 1,138 9 (a) Number of homeless househotds in priority need
(b) Number of households provided with following forms of temporary accommodation, and average length of stay: Local Authority Furnished Dwellings: No. of households 741 449 Average stay 70 days 84 days Bed & Breakfast; No. of households 55 107 Average stay 22 days 22 days Other; No. of households 99 109 Average stay 142 days 135 days
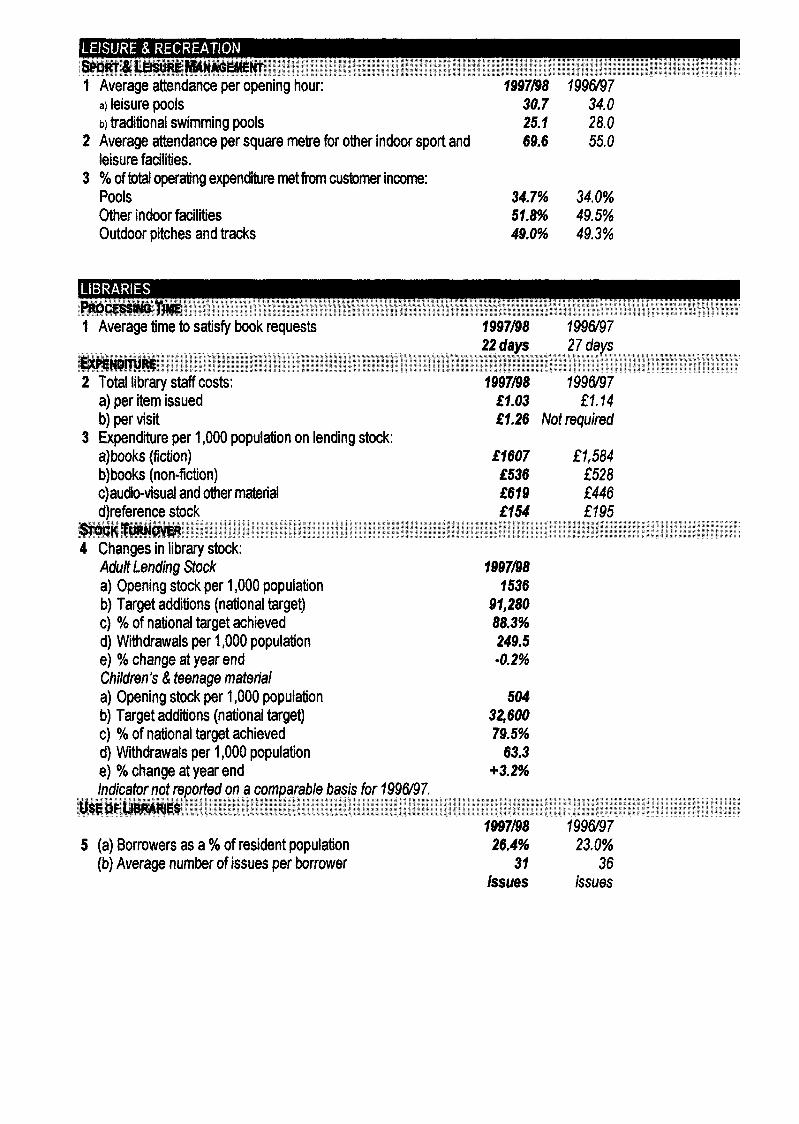
Average attendance per opening hour: 1997f98 199647 a) leisure pools 30.7 34.0 b) traditional swimming pools 25.1 28.0 Average attendance per square metre for other indoor sport and 69.6 55.0 leisure facilities. % of total opetating expenditure met from customer income: Pools 34.7% 34.0% Other indoor facilities 51.8% 49.5% Outdoor pitches and tracks 49.0% 49.3%
1 Average time to satisfy book requests 1997198 199w97
2 Total library staff costs: 1997/98 1996/97 a) per item issued €1.03 €1-14 b) per visit f 1.26 Not required
a) books (fiction) E 1607 f 1,584 b)books (non-fiction) f 536 f 528 c)audio-visual and other material €619 €446 dkeference stock f 154 f f05
3 Expenditure per 1,000 population on lending stock:
- - - - . - I - - - - - - - - - STOCK TURNOVER 4 Changes in library stock:
Adult Lending Stock a) Opening stock per 1,000 population b) Target additions (national target) c) % of national target achieved d) Withdrawals per 1,000 population e) % change at year end Children's & teenage material a) Opening stock per 1,000 population b) Target additions (national target) c) % of national target achieved d) Withdrawals per 1,000 population e) % change at year end Indicator not reDorted on a comDarable basis for 199W97.
1997/98 1536
91,280 88.3% 249.5 -0.2%
504 3&600 79.5%
63.3 +3.2%
5 (a) Borrowers as a % of resident population (b) Average number of issues per borrower
US€ OF LlBRAR4ES 1997/98 799w97
26.4% 23.0% 31 36
issues issues

1997h8 799m7
Up to 4 weeks 31.2% 37.5% 5 to 8 weeks 47.1% 42.7% More than 8 weeks 21.7% 20.4%
Up to 8 weeks 55.8% 52.8%
1 Householders:
2 Non-householders:
3 a) no. of decisions going to appeal 23 78 b) a) as a % of all decisions 1.5% 7.3%
4 % of population covered by Local Plans finalised, and adopted, within the last 5 years: 1997h8 799w97
Plan adopted within the last 5 48% 48% years Plan finalised or adopted within the 56% 56% last 5 years
1 Maintenance expenditure per kilometre:
a) Structural maintenance b) Routine maintenance c) Winter maintenance d) Surveys, inspections
a) Surfacing b) Surface dressing Total % of surface treated
2 Carriageway surface treatments:
199719% f3,104 f2,247 f 1,672
f 14
1.0% 0.0% 1.0%
799w97 €3,278 €3,258 €2,669
f237
7.0% 3.0% 3.0%
&PARS RESPONSE Traffic light failure: elapsed time from notification to Council to completion of repair:
1997198 799w97 a) target time set by Council 20 hours 24 hours b) average time for repair 14.4 hours 23.8 hours c) % completed within 48 hrs. 95.5% 92.2% Street light failure: elapsed time from notification to Council to completion of repair: a) target time set by Council 5 working days b) average time for repair 4 days 2 days c) % completed within 7 88.3% 99.0%
calendar days
5 Average time between a claim and determination: 1997/98 7996/97
a) pedestrian 32 weeks 24 weeks b) vehicular 20 weeks 73 weeks

CCHlWWlY W ASSESSMENTS 1 Number of persons receiving an assessment or review & number receiving a service (1997/98):
Number assessed or reviewed: Number receiving a service: a)Elderly people aged 65+ 7,202 10,643 b)Elderly people aged 65+ with dementia 513 732 People aged 18-64 with: c)mental health problems 564 486 d)physical disability 3,600 3,972 e)learning disability 607 747 9 HlVlAlDS 0 1 g)drug/alcohol problems 212 147
2 Gross expenditure on each client Qroup (1997198): - . .
a)Elderly people b)People with dementia c)People recovering from mental illness d)People with learning disabilities I mental handicaps e)People with physical handicaps 9 Children g)Offenders h)People with HlVlAlDS i) People with druglalcohol abuse problems il Other
Actual expenditure Expenditure as % of total f38,024,540 54.7% IncIuded in above figures f3,564,983 5.1% €8,594,123 12.4% f5,862,087 8.4%
€10,641,034 15.3% f2,014,043 2.9%
€0 0.0% f 762,027 1.1%
€0 0.0% C H h PROTECTION
1997198 199w97 213 274 98 1 09 33 53
40.0 weeks 22.0 weeks
3 (a) No. of children referred over the 12 months to 31 March (b) No. of children appearing on register at some point during year (c) No. of children on child protection register at 31 March (d) Average time for a name to remain on the register
4 % of children in carelsupervision in the following types of placement:
a) At home 544 569 b) Other community placements 126 138 c) Residential accommodation 85 92 (i(J As a % of the total in care/supervision: a) At home 72.0% 71.0% b) Other community placements 17.0% 17.0% c) Residential accommodation 11.0% 12.0%
Hob% CARE/HOME HELP 5 (i) No. of home care clients receiving:
1997198 199W97 a)up to 2 hours care per week 594 685 b)2 - 4 hours per week 823 1021 c)4 - 10 hours per week 1,279 1404 d)more than 10 hours per week 437 325 (ii) As a % of total for (i):
b)2 - 4 hours per week 26.0% 30.0% c)4 - 10 hours per week 41.0% 41.0% d)more than 10 hours per week 14.0% 10.0%
CHW) CARE PIACEMENTS
(i) Number of children 1997198 199687
a)up to 2 hours care per week 19.0% 20.0%

RESlDENTIAl ACCOMMODATION: aAFF QUAlIFlCATlON 6 % of care staff in residential homes who have appropriate qualifications, for these users:
1997198 199W97 a) Children 33.wo 24.0% b) Adult Offenders Not Applicable c) Elderly people 26.0% 25.0% d) Other adults 27.0% 27.0%
7 Number of single rooms, as % of all residential care places for each of the following users, for each provider: RESIDENTIAL ACCOMMODATION: PRIWACY
1997/98 199W97 80.6% 80.7%
Not Applicable 74.2% 71.6% 93.8% 93.8%
88.9% 77.8% Not Applicable 28.6% 28.6% 70.1% 67.8%
Not Applicable Not Applfcable 44.2% 42.7%
Local Authority: a) Children b) Adult Offenders c) Elderly people d) Other adults Vokrntaty Sector a) Children b) Adult Offenders c) Elderly people d) Other adults Private Sector a) Children b) Adult Offenders c) Elderly people d) Other adults 75.0% 75.0%
8 Average no. of inspections of residential establishments per year: 1997198 199647
Local Authority 2.2 0.95 Voluntary Sector 1.6 0.98 Private Sector 1.8 0.97 Total 1.9 0.97 Number of homes inspected less than twice per year Local Authority 4 22 Voluntary Sector 9 25 Private Sector 3 75 Total 16 62 _ _
RESP~TE CARE 9 (i) Number of persons assessed as requiring respite care:
Carer(s) of: 1997198 1996/97 a)Elderly people 920 7767 b)People with learning difficulties 257 235 c)Children with disabilities 188 170 (ii) % of the above who received a service: Carer(s) of: a)Elderly people 97.2% 97.0% b)People with learning difficulties 99.2% 98.0% c)Children with disabilities 98.9% 93.0%

Consumer enquiries: 7997198 799w97 Same day 2 - 14 days 15 - 30 days Over 30 days Consumer complaints: Same day 2 - 14 days 15 - 30 days Over 30 days Business advice requests: Same day 2 - 14 days 15 - 30 days
98.7% 0.5% 0.2% 0.7%
55.7% 73.8% 14.1% 16.4%
87.5% 15.4% 0.0%
700% 0.0% 0.0% 0.0%
34.5% 26.4% 20.9% 18.3%
82.0% 73.3% 4.5%
Over 30 davs 3.7% 0.0% lNSPECTloX OF k D I N B PR€MSES 2 Premises liable to inspection - target and actual coverage:
(i)Target visit (ii) No. of premises (iii) Target no. of frequency (1997198) visits (1997198)
High Risk 7 year 671 599 Medium Risk 2 years 679 310 Low Risk 5 years 2,707 420
(iv) % of target achieved: High Risk Medium Risk Low Risk
1997/98 199w97 82.5% 57.3% 75.2% 60.0% 70.2% 27.5%
ENFORCEMEW A m w 3 Action in relation to traders issued with warnings or notices: Notices enforced within 30 days:
7997198 7996/97 a)written warnings 74.7% 82.0% b)statutory notices 90.0% 7 00% c)formal warnings 88.2% 72.7%

ANNEX 2
Publication of Performance Information
Performance Report in North Lanarkshire News
The first two pages of this ANNEX contain a reduced copy of the Performance Report feature which will be included in the North Lanarkshire News issue to be published and distributed in September. These two pages are included only to show the format and layout of the feature. The detailed content of the feature may be examined in the subsequent pages of this ANNEX.
IN[i:\polU&rU)l piU)3pi\~996-9l\rrport96-97\pt980924pub2.doc] 17/09/98

14 North Lanarkshire N e w
Percentage of Prim 1 children with Educ%n
Department pre-schooling
Education Percentage of pdmay s c h d classes that are single year with more than 30 pupils I Performl
i North Lanarkshire Council has reso!ved to publish i annual performance report for the information of i households in the area. The first of these reporb : highli hts the 25 key indicators of performance i ident4ed by the Accounts Commission for Scotlar i as being of articular interest to the public. The i report enab/& comparison o f the Council's _ . .
Percentage of schools with occupancy levels of over 80%
............................................................... i Finance Perantage of
tax due in the year which is collected in
the same year Average time to complete assessments of special
educational needs
: The Coundl's performance has lmpond substanuily h 1 9 9 7 m md b 4 h excess of the lam* grmp a w l g e
I'Councifs are grouped rnfo 'lamdies' /or hn p r l ~ m v n c e tndulcr The average shown rs h e i m a g e fci uie family gmup,
: .............................................................. i Housing
s $ q $ g g g g $ i 1996197 U 1997/98 W
Weeks Folbwing the reuuihnnt of new professional staff In thn area n k anmpltCd
that the figures for 1998/99 will show a consderable'tmprovmunt on performance
Percentage of Coundl houK remits ................................................................................................... .: ................................ :
Environment comdeted within
Food hygiene - percentage of
Percenta e of household wasfe recycled
target timesale
premises inspected within the
target time Emergency
ithin 3 hours) (W
NLC 1996197
NLC 1997198 Greater than 12 months
6
Pnonty 1 (3 days)
6to12 months
PriOnty 2 (7 days)
Prionty 3 (21 days)
Wnhln i months
3 3 5 3 3 - Scottish (I
The StabsUCi show a cmslstent Improvement agalnst both bn pre figures and the Scotm,
(Note ha! h e n IS no ScoUrsh Avmge avalbfe /or uie Greater m h r a t & ..............................................................
Average attendance per openin hour at swimmkng pools
Leisure Scotbrh Office Target - A new computer system was hkoduccd tha year to deal with the phncin
r p p l u h process and the Counc~l'r performance remans above the ~tdl average Trading standards: pe-e of enquides.
complaints and advice rqwrtr completed within the stated timescales
Lnsure Pools
Tradibond Pools
Bdsinns Aavice RequtN (completea in 30 days)
Consmer Com lamb (cornpletea in 18days)
Consumer Enquinei (COompletM Idme day)
The -nt drop In mime k pady due to teethlng pmbkn wath the htroducdon o ~ l m p r o v c d Computer I tem for rKordlng skeet 11 ht
faibres.Preiimmary figures for the flmt quarter o ~ 9 9 8 1 9 9 show a consderafk Improvement In p r f m n c e .
0 6 U g b l s People per Hwr
Scottish Average (1996l97) U NLC 1996197 0
NLC 1997198 W
The flgures fw bDth typs of pcak have dropped sllfihf between 19%/97 and 1997198. but the figures for the irrt ha o 1998 rhow a rlght
tmprDvcMnL
Scottlrh Average 1996197 W NLC 1996197 U NLC 1997198 W
The councll cmunues to maintain standards whkh (om re f a w r a & with &: scottkh average.
North Lanarkshire New%
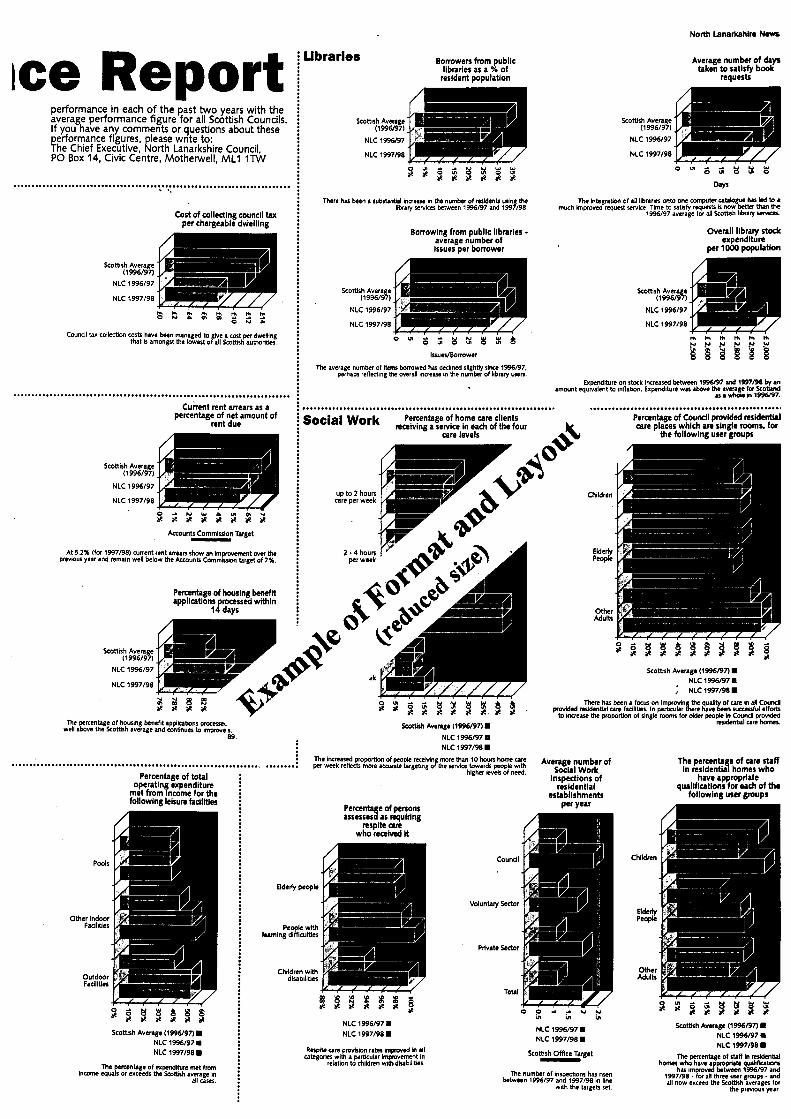
ice Report performance in each of the past two years with the avera e performance figure for all Scottish Councils. If youghave any comments or questions about these yrformance figures, lease write to:
he Chief Executive, Rorth Lanarkshire Council, PO Box 14, Civic Centre, Motherwell, MLI 1TW
........................................................................... . -. Cost of collecting council tax
per chargeable dwelling
Cwnal tu colktlon cosh have bm, managed to be a cost pr dwelling that is amongst m~ lowest ofan scomrh authonbn.
........................................................................... Cukent rent arrears as a
percentage of net amount of rent due
At 5 2% (fw 1937/98) cunent rent m a n show an hpmemnt M the previcur year and remain well below the Accounts Commhwa target of 7%.
Percentage of housing ben& appliations roccssed within
i Bdays
Scottish Avera e
NLC 1996197
NLC 1997/98
~1996/9%
Libraries Borrowers from public libraries as a % of
resident population
Average number of days taken to satisfy book
requests
The hte r a w of an llbrarks onto ON mmplter utlbye hn led 0 a m w h hprovd requn t W N K ~ Time to raMy rquerts K 1101 ktla h n the
1996197 average fw d Scottah llbny - There has been a subrtantrrl hcrease in me number of nr!&nk mln the k a r y semes between 1 W 9 7 and 199$190
Borrowing from public libraries - average number of issues per borrower
Overall library stock expenditure
per 1000 popuhtlon
Expenditure on stock increased ktmn 1-7 ud 1997/98 an m w n t qurvatent to inflaton. E z p d i t u i e was a h the waa e fa -%md
L( a d e n 1-7.
Percentage of Council provlded midtntW care places which are single rooms. for
the following user groups
I.. ....................................................
IrwnlBormwer
The average number of itnnr tonowed has declimd slightly slm 1996l97. perhapr reflecbng Ue overall increm in the number of library UWR.
................................................................... Percentage of home can clients
receiving a service in each of the four care levels
Work
Children
Elderly People
Other M u b
. . s q
The rcentage of houslng benefit rppliutlons p m ~ well a!& the Scottah average an4 ornunuer to impwe s.
89 Sconish Average (1996197) 1
NLC 1 W 9 7 U NLC 1-7/90 1
Scottish Average (1996l97) 1 NLC 1996l97 U
; NLC1997B81
There hrr been a f m n on Impown the qu of ure h aI Coud I rrrdenll care facilitn In pamcVlu &we haw% IuMIfyl eft- case the womrtlon of singk room for ddn pop* h C d pmvded
mu!enll ure hana.
Percentage of total operatin expenditure
met fromkcome for the following leisure facilities
Pwls
Other Indoor FaaliUer
Ou tdwr Faalltier
e of persons EEs3as nquiring nspite M
who received It
L x
Scottish A v m g e ( l W 9 7 ) 1 NLC 1996197 U NLC is97198 m
The pertmtage of expndttun met ha l n m eqw I or exceeds mC Scotbh average h
aU cases.
NLC 1996197 W NLC 1997198 1
Rep& a r e provkbn rater npoved h all categories with a plmcular Impovement in
relaUon to children w1!41dkabilltks.
residential establishments
per year
cound
Voluntary Sector
Ptlvate Sector
Tolal
0 6 ' ; N g NLC 1996197 NLC 1997/98 1
Scottlsh Office Target - The number of hspdions has rim
between 1996197 and 1997198 in llne with the targets set.
The percenta e of are staff in nsidentig homes who
have appropriate qualtfications for each of the
following user groups
Scottkh Avenge (15%/97) 1 NLC 15%/97 U NLC 1-7/90 1
The m @ e of s1.H h mdmbll oprtrte qwlif*lmnr
has i m p d & t m n 1996/97 and 1997/98. fw all three user grovps. ud all now exceed the ScoRkh averages (01
the prmour year
homn who have r

1 Performaice Report i North Lanarkshire Council has resolved to publish an i annual performance report for the information of all i households in the area. The first of these reports : highli hts the 25 key indicators of performance i identi f ied by the Accounts Commission for Scotland i as being of articular interest to the public. The : report enab P es comparison of the Council's ........................................................................
14 North Lanarkshire News
Percentage of Primary 1 children with Education
Department pre-schooling
Education
.........
g G 8 g 8 8 8 a $ * $ * $ $ *
During 1997/98 there was a si nificant investment in the provision of nursery places in North Lanarkshire and &is will be reflected in greatly improved figures
for the 1998/99 school session.
Average time to complete assessments of special
educational needs
Weeks Following the recruitment of new professional staff in this area, it is anticipated
that the figures for 1598/99 will show a considerable improvement in performance.
performance in each of the past t w o years with the average performance figure for all Scottish Councils. If you have any comments or questions about these
The Chief Executive, orth Lanarkshire Council, PO Box 14, Civic Centre, Motherwell, M L I 1TW
erformance figures, lease write to:
. . . . . . . . . . . . . . . . . . . . . . . . . . . . . . .
Percentage of primary school classes that are single year with more than 30 pupils
O N P ~ C O ~ ~ ~ ~ ~ N $ $ $ $ $ g $ $ $ $ $ N O Q I C O O
The Council's policy of investin in education, especial1 at the early stages, is reflected in the number of sinje year classes caterin ror over 30 pup~ls. The
Council is well on target to meet the Government deahne of reducin Primary 1, 2 and 3 class sizes to a maximum of 3 0 % ~ 2001.
Percentage of schools with occupancy levels of over 80%
1996197 El 1997198
Primary school occupancy rates have increased due to 20 new nursery schools being opened, in 1997/98, using spare primary school capacity. This trend is set
to increase with further nursery schools (within primary schools) scheduled to open during the current financial year. Failing seconda school rolls and the
static capacity of the school buildings are reflected in the f 3 in secondary school occupancy rates. The secondary school roll fell by 353 between 1996/97 to
1997/98.
.
. . . . . . . . . . . .................................................
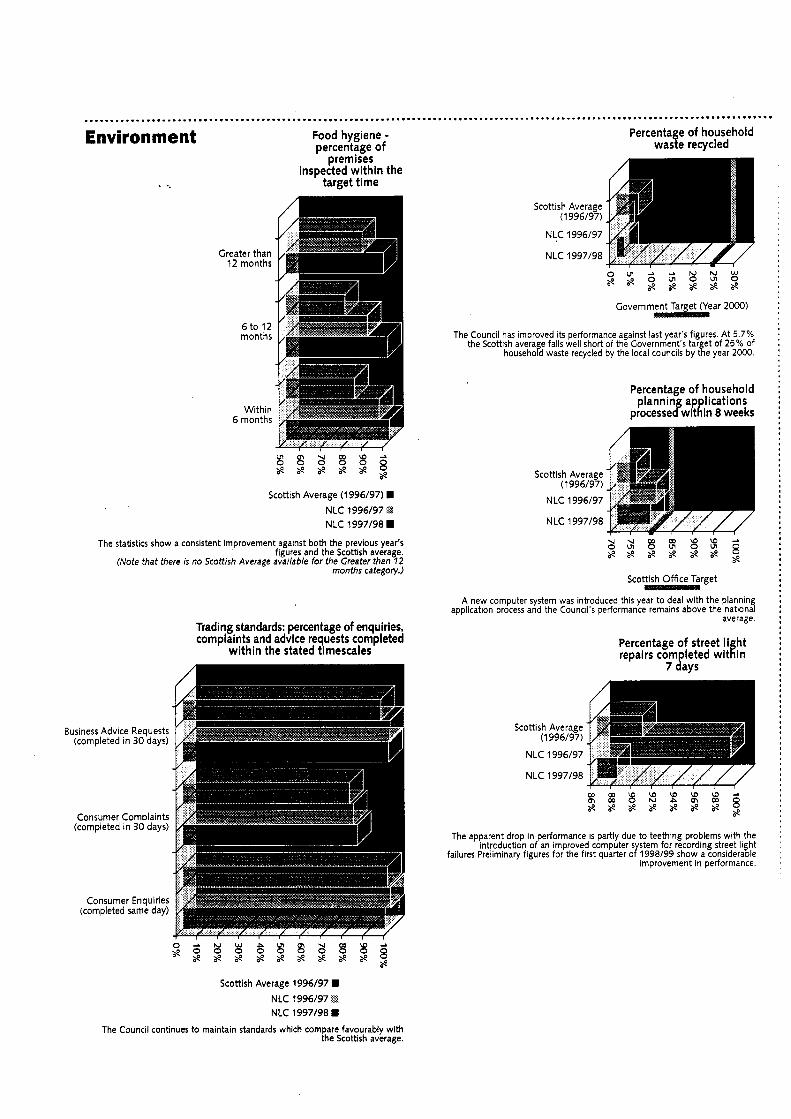
..................................................................................................................................... Environment
. *.
Food hygiene - percentage of
premises inspected within the
target time
C rea 12
6
iter than months
6 t o 1 2 months
Within months
Scottish Average (1996/97) H NLC 1996/97 %I NLC 1997/9a
The statistics show a consistent improvement against both the previous year's figures and the Scottish average.
(Note that there is no Scottish Average available for the Greater than 72 months categofy.)
Trading standards: percentage of enquiries, complaints and advice requests completed
within the stated timescales
Percentage of household waste recycled
Government Target (Year 2000)
The Council has improved its performance against last year's figures. At 5.7% the Scottish avera e falls well short of the Government's tar et of 25% of
househob waste recycled by the local councils by t%e year 2000.
Percentage of household plannin ap lications
processetfwitt!in 8 weeks
Scottish Office Target
A new computer system was introduced this year to deal with the plannin application process and the Council's performance remains above the nation3
average.
Percentage of street Ii ht repairs completed wit f in
' 7 days
The apparent drop in performance is partly due to teething problems with the introduction of an improved computer s stem for recording street li ht
failures.Preliminaty figures for the first quarter 0/1998/99 show a considera%le improvement in performance.
s e % 8 8 8 8 8 8 8 g $ a e $ $ $ a p a e a p $
Scottish Average 1996/97 H NLC 1996/97 '2 NLC 1997/98 H
ae
The Council continues to maintain standards which compare favourably with the Scottish average.
...................................................................... ............................................................................ Finance Percentage of council
tax due in the year which is collected in
the same year Cost of collecting council tax
per chargeable dwelling
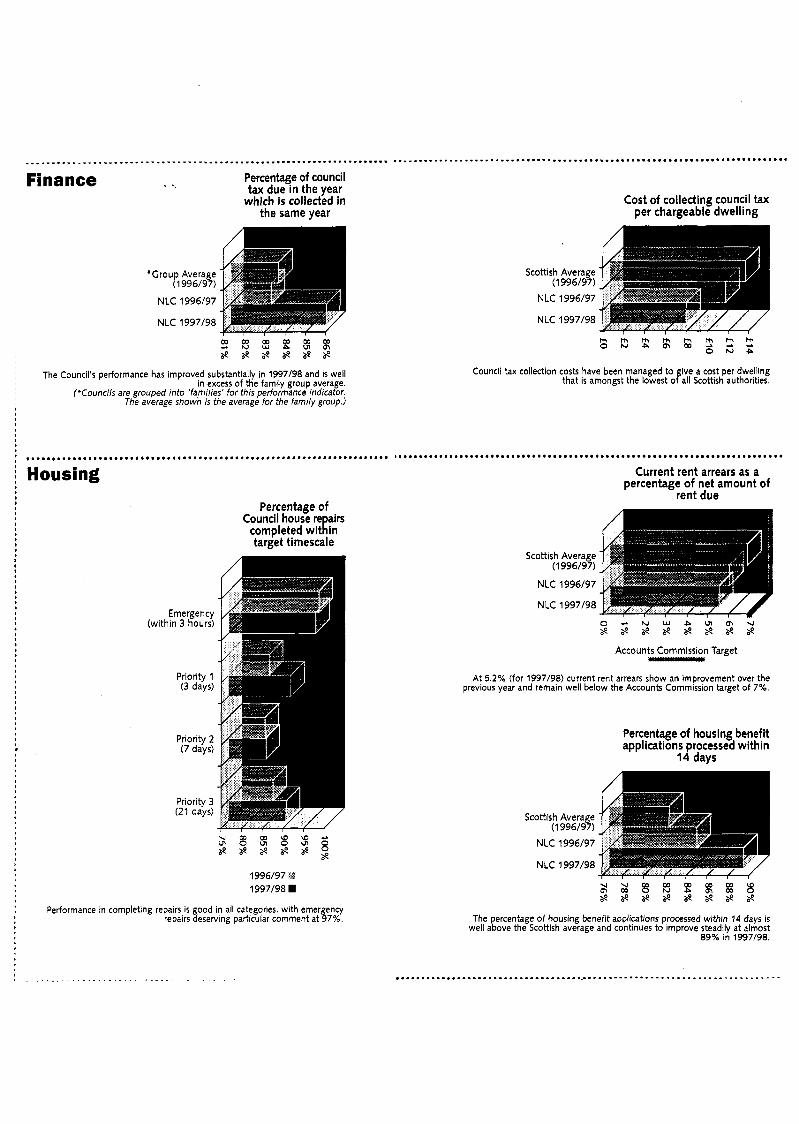
1 The Council's performance has improved substantially in 1997/98 and is well in excess of the family group average.
('Councils are grouped into 'fa,mi/ies' for this performance indicator. The average shown is the average for the family group.)
Council tax collection costs have been managed to ive a cost per dwelling that is amongst the lowest ofal l Scottish authorities.
' Housing
Percentage of Council house re airs
target timescale completed wit R in
Emergency (within 3 hours)
Priority 1 (3 days)
Priority 2 (7 days)
Priority 3 (21 days)
1996197 +A I 997198
Performance in completing repairs is good in all categones, with emergency repairs deserving particular comment at 97%
Current rent arrears as a percentage of net amount of -
rent due
O - - \ N W P V I O \ \ I $ $ $ $ $ $ $ $
Accounts Commission Target - At 5.2% (for 1997198) current rent arrears show an improvement over the
previous year and remain well below the Accounts Commission target of 7%.
Percentage of housing benefit applications processed within
14 days
The percentage of housing benefit applications processed within 14 days is well above the Scottish average and continues to improve steadily at almost
89% in 1997198.
............................................ .......................... - _ - - : Leisure
Average attendance per opening hour at swimming pools
Leisure Pools
. ..
Traditional Pools
People per Hour
Scottish Average (1996/97) W NLC1996/97 I NLC 1997/98
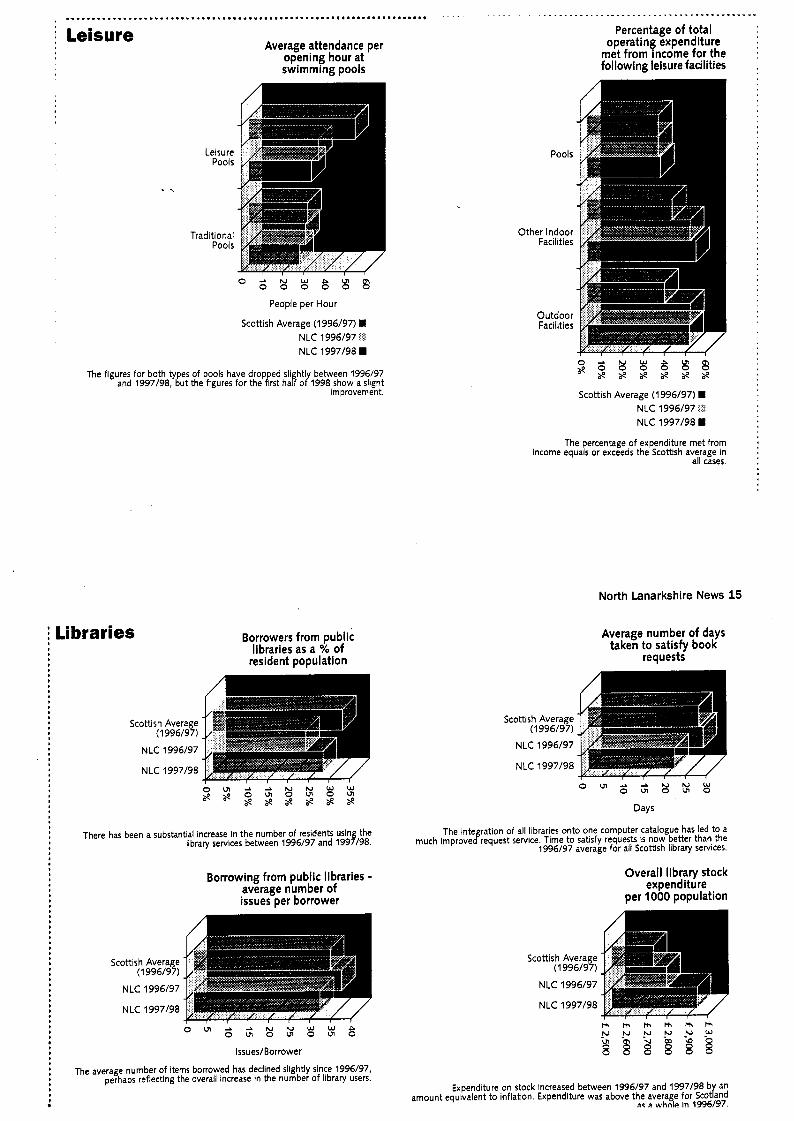
The figures for both types of pools have drop ed sli htl between 1996/97 and 1997/98, but the figures for the irst ha6 oY1998 show a slight
improvement.
I Libraries Borrowers from public libraries as a % of
resident population
There has been a substantial increase in the number of residents using the library services between 1996/97 and 1997/98.
Borrowing from public libraries - average number of issues per borrower
e G g B g % 8 O V I
Issues/Borrower
The average number of items bonowed has declined slightly since 1996/97, perhaps reflecting the overail increase in the number of library users.
Percentage of total operating expenditure
met from income for the following leisure facilities
Pools
Other Indoor Facilities
Outdoor Facilities
Scottish Average (1996/97) H NLC 1996/97 , t NLC 1997/98 W
The percentage of expenditure met from income equals or exceeds the Scothsh average in
all cases.
North Lanarkshire News 15
Average number of days taken to satisfy book
requests
O V I g G g Z g Days
The inte ration of all libraries onto one computer catalogue has led to a much mprovetrequest service Time to satisfy requests IS now better than the
1996/97 average for all Scottish library services
Overall library stock expenditure
per 1000 population
~ . m m m m m
Expenditure on stock increased between 1996/97 and 1997/98 b an amount equivalent to inflation. Expenditure was above the average for Scothd
ac a whnle in 1996/97.
. ............................................................... Percentage of home care clients
Work . receiving a service in each of the four
up to 2 hours care pet' r k e k
2 - 4 hours per week
4 - 10 hours per week
care levels
Children
Elderly People
Other Adults
10 more than
hours per week
. /*. . C l W . .. .
leari
Elderly people
Scottish Average (1996197) H
NLC 1996/97 $I NLC 1997198
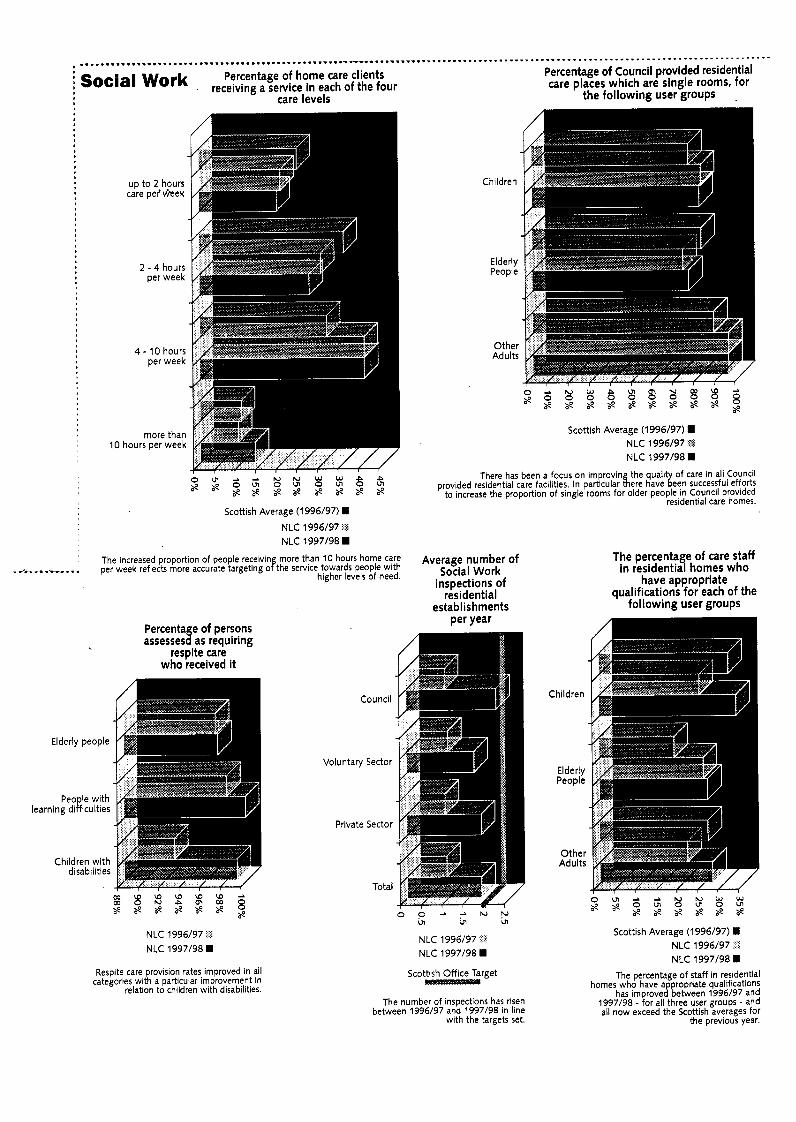
The increased proportion of people receivin more than 10 hours home care per week reflects more accurate targeting ofthe service towards people with
higher levels of need
Peo le with ning diliculties
Children with disabilities
Percenta e of persons
respite care who received it
assesses d as requiring
Council
Voluntary Sector
Private Sector
Total
NLC1996/97 I
NLC 1997/98 H
Respite care provision rates improved in all categories with a particular improvement in
relation to children with disabilities
Percentage of Council provided residential care places which are single rooms, for
the following user groups .
Scottish Average (1996197) H NLC 1996197 '3 NLC 1997198 H
There has been a focus on improvin the quali of care in all Council provided residential care facilities In particular &ere haveteen successful efforts
to increase the proportion of single rooms for older people in Council provided residential care homes
Average number of Social Work
inspections of residential
establishments per year
Children
Elderly People
Other Adults
: O O A - - \ N 0 VI
NLC1996197 ' NLC 1997/98 H
Scottish Office Target
The number of inspections has risen between 1996/97 and 1997/98 in line
with the targets set.
The percenta e of care staff in residentii! homes who
have appropriate qualifications for each of the
following user groups
Scottish Average (1996197) H NLC 1996197 NLC 1997198
The percentage of staff in residential ropriate qualifications
has improve&etween 1996/97 and 1997198 - for all three user groups - and all now exceed the Scottish averages for
the previous year
homes who have a