notation 2 3 general acronyms and...
TRANSCRIPT

Final Solar PEIS xxvii July 2012
NOTATION 1 2 3 The following is a list of acronyms and abbreviations, chemical names, and units of 4 measure used in this document. Some acronyms used only in tables may be defined only in those 5 tables. 6 7 GENERAL ACRONYMS AND ABBREVIATIONS 8 9 AADT annual average daily traffic 10 AASHTO American Association of State Highway and Transportation Officials 11 AC alternating current 12 ACC air-cooled condenser 13 ACEC Area of Critical Environmental Concern 14 ADEQ Arizona Department of Environmental Quality 15 ACHP Advisory Council on Historic Preservation 16 ADOT Arizona Department of Transportation 17 ADWR Arizona Department of Water Resources 18 AERMOD AMS/EPA Regulatory Model 19 AFC Application for Certification 20 AGL above ground level 21 AIM Assessment, Inventory and Monitoring 22 AIRFA American Indian Religious Freedom Act 23 AMA active management area 24 AML animal management level 25 ANHP Arizona National Heritage Program 26 APE area of potential effect 27 APLIC Avian Power Line Interaction Committee 28 APP Avian Protection Plan 29 APS Arizona Public Service 30 AQCR Air Quality Control Region 31 AQRV air quality–related value 32 ARB Air Resources Board 33 ARRA American Recovery and Reinvestment Act of 2009 34 ARRTIS Arizona Renewable Resource and Transmission Identification Subcommittee 35 ARS Agricultural Research Service 36 ARZC Arizona and California 37 ATSDR Agency for Toxic Substances and Disease Registry 38 AUM animal unit month 39 AVSE Arlington Valley Solar Energy 40 AVWS Audio Visual Warning System 41 AWBA Arizona Water Banking Authority 42 AWEA American Wind Energy Association 43 AWRM Active Water Resource Management 44 AZDA Arizona Department of Agriculture 45 AZGFD Arizona Game and Fish Department 46
Final Solar PEIS xxviii July 2012
AZGS Arizona Geological Survey 1 2 BA biological assessment 3 BAP base annual production 4 BEA Bureau of Economic Analysis 5 BISON-M Biota Information System of New Mexico 6 BLM Bureau of Land Management 7 BLM-CA Bureau of Land Management, California 8 BMP best management practice 9 BNSF Burlington Northern Santa Fe 10 BO biological opinion 11 BOR U.S. Bureau of Reclamation 12 BPA Bonneville Power Administration 13 BRAC Blue Ribbon Advisory Council on Climate Change 14 BSE Beacon Solar Energy 15 BSEP Beacon Solar Energy Project 16 BTS Bureau of Transportation Statistics 17 18 CAA Clean Air Act 19 CAAQS California Air Quality Standards 20 CAISO California Independent System Operator 21 Caltrans California Department of Transportation 22 C-AMA California-Arizona Maneuver Area 23 CAP Central Arizona Project 24 CARB California Air Resources Board 25 CAReGAP California Regional Gap Analysis Project 26 CASQA California Stormwater Quality Association 27 CASTNET Clean Air Status and Trends NETwork 28 CAWA Colorado Agricultural Water Alliance 29 CCC Civilian Conservation Corps 30 CDC Centers for Disease Control and Prevention 31 CDCA California Desert Conservation Area 32 CDFG California Department of Fish and Game 33 CDNCA California Desert National Conservation Area 34 CDOT Colorado Department of Transportation 35 CDOW Colorado Division of Wildlife (now Colorado Parks and Wildlife) 36 CDPHE Colorado Department of Public Health and Environment 37 CDWR California Department of Water Resources 38 CEC California Energy Commission 39 CEQ Council on Environmental Quality 40 CES constant elasticity of substitution 41 CESA California Endangered Species Act 42 CESF Carrizo Energy Solar Farm 43 CFR Code of Federal Regulations 44 CGE computable general equilibrium 45 CHAT crucial habitat assessment tool 46

Final Solar PEIS xxix July 2012
CIRA Cooperative Institute for Research in the Atmosphere 1 CLFR compact linear Fresnel reflector 2 CNDDB California Natural Diversity Database 3 CNEL community noise equivalent level 4 CNHP Colorado National Heritage Program 5 Colorado DWR Colorado Division of Water Resources 6 CO2e carbon dioxide equivalent 7 CPC Center for Plant Conservation 8 CPUC California Public Utilities Commission 9 CPV concentrating photovoltaic 10 CRBSCF Colorado River Basin Salinity Control Forum 11 CREZ competitive renewable energy zone 12 CRPC Cultural Resources Preservation Council 13 CRSCP Colorado River Salinity Control Program 14 CSA Candidate Study Area 15 CSC Coastal Services Center 16 CSFG carbon-sequestration fossil generation 17 CSP concentrating solar power 18 CSQA California Stormwater Quality Association 19 CSRI Cultural Systems Research, Incorporated 20 CTG combustion turbine generator 21 CTPG California Transmission Planning Group 22 CTSR Cumbres & Toltec Scenic Railroad 23 CUP Conditional Use Permit 24 CVP Central Valley Project 25 CWA Clean Water Act 26 CWCB Colorado Water Conservation Board 27 CWHRS California Wildlife Habitat Relationship System 28 29 DC direct current 30 DEM digital elevation model 31 DHS U.S. Department of Homeland Security 32 DIMA Database for Inventory, Monitoring and Assessment 33 DLT dedicated-line transmission 34 DNA Determination of NEPA Adequacy 35 DNI direct normal insulation 36 DNL day-night average sound level 37 DoD U.S. Department of Defense 38 DOE U.S. Department of Energy 39 DOI U.S. Department of the Interior 40 DOL U.S. Department of Labor 41 DOT U.S. Department of Transportation 42 DRECP California Desert Renewable Energy Conservation Plan 43 DSM demand-side management 44 DSRP Decommissioning and Site Reclamation Plan 45 DTC/C-AMA Desert Training Center/California–Arizona Maneuver Area 46

Final Solar PEIS xxx July 2012
DWMA Desert Wildlife Management Area 1 DWR Division of Water Resources 2 3 EA environmental assessment 4 EBID Elephant Butte Irrigation District 5 ECAR East Central Area Reliability Coordination Agreement 6 ECOS Environmental Conservation Online System (USFWS) 7 EERE Energy Efficiency and Renewable Energy (DOE) 8 Eg band gap energy 9 EIA Energy Information Administration (DOE) 10 EIS environmental impact statement 11 EISA Energy Independence and Security Act of 2007 12 EMF electromagnetic field 13 E.O. Executive Order 14 EPA U.S. Environmental Protection Agency 15 EPRI Electric Power Research Institute 16 EQIP Environmental Quality Incentives Program 17 ERCOT Electric Reliability Council of Texas 18 ERO Electric Reliability Organization 19 ERS Economic Research Service 20 ESA Endangered Species Act of 1973 21 ESRI Environmental Systems Research Institute 22 23 FAA Federal Aviation Administration 24 FBI Federal Bureau of Investigation 25 FEMA Federal Emergency Management Agency 26 FERC Federal Energy Regulatory Commission 27 FHWA Federal Highway Administration 28 FIRM Flood Insurance Rate Map 29 FLPMA Federal Land Policy and Management Act of 1976 30 FONSI Finding of No Significant Impact 31 FR Federal Register 32 FRCC Florida Reliability Coordinating Council 33 FSA Final Staff Assessment 34 FTE full-time equivalent 35 FY fiscal year 36 37 G&TM generation and transmission modeling 38 GCRP U.S. Global Climate Research Program 39 GDA generation development area 40 GHG greenhouse gas 41 GIS geographic information system 42 GMU game management unit 43 GPS global positioning system 44 GTM Generation and Transmission Model 45
46
Final Solar PEIS xxxi July 2012
GUAC Groundwater Users Advisory Council 1 GWP global warming potential 2 3 HA herd area 4 HAP hazardous air pollutant 5 HAZCOM hazard communication 6 HCE heat collection element 7 HCP Habitat Conservation Plan 8 HMA herd management area 9 HMMH Harris Miller Miller & Hanson, Inc. 10 HRSG heat recovery steam generator 11 HSPD Homeland Security Presidential Directive 12 HTF heat transfer fluid 13 HUC hydrologic unit code 14 HVAC heating, ventilation, and air-conditioning 15 16 I Interstate 17 IARC International Agency for Research on Cancer 18 IBA important bird area 19 ICE internal combustion engine 20 ICPDS Imperial County Planning & Development Services 21 ICWMA Imperial County Weed Management Area 22 IDT interdisplinary team 23 IEC International Electrochemical Commission 24 IFR instrument flight rule 25 IID Imperial Irrigation District 26 IM Instruction Memorandum 27 IMPS Iron Mountain Pumping Station 28 IMS interim mitigation strategy 29 INA Irrigation Non-Expansion Area 30 IOP Interagency Operating Procedure 31 IOU investor-owned utility 32 IPCC Intergovernmental Panel on Climate Change 33 ISA Independent Science Advisor; Instant Study Area 34 ISB Intermontane Seismic Belt 35 ISCC integrated solar combined cycle 36 ISDRA Imperial Sand Dunes Recreation Area 37 ISEGS Ivanpah Solar Energy Generating System 38 ISO independent system operator; iterative self-organizing 39 ITFR Interim Temporary Final Rulemaking 40 ITP incidental take permit 41 IUCNNR International Union for Conservation of Nature and Natural Resources 42 IUCNP International Union for Conservation of Nature Pakistan 43 44 KGA known geothermal resources area 45 KML keyhole markup language 46
Final Solar PEIS xxxii July 2012
KOP key observation point 1 KSLA known sodium leasing area 2 3 LCC Landscape Conservation Cooperative 4 LCCRDA Lincoln County Conservation, Recreation, and Development Act of 2004 5 LCOE levelized cost of energy 6 Ldn day-night average sound level 7 LDWMA Low Desert Weed Management Area 8 Leq equivalent sound pressure level 9 LiDAR light detection and ranging 10 LLA limited land available 11 LLRW low-level radioactive waste (waste classification) 12 LPN listing priority number 13 LRG Lower Rio Grande 14 LSA lake and streambed alteration 15 LSE load-serving entity 16 LTMP long-term monitoring and adaptive management plan 17 LTVA long-term visitor area 18 19 MAAC Mid-Atlantic Area Council 20 MAIN Mid-Atlantic Interconnected Network 21 MAPP methyl acetylene propadiene stabilizer; Mid-Continent Area Power Pool 22 MCAS Marine Corps Air Station 23 MCL maximum contaminant level 24 MEB Marine Expeditionary Brigade 25 MFP Management Framework Plan 26 MIG Minnesota IMPLAN Group 27 MLA maximum land available 28 MOA military operating area 29 MOU Memorandum of Understanding 30 MPDS maximum potential development scenario 31 MRA Multiple Resource Area 32 MRI Midwest Research Institute 33 MRO Midwest Reliability Organization 34 MSDS Material Safety Data Sheet 35 MSL mean sea level 36 MTR military training route 37 MVEDA Mesilla Valley Economic Development Alliance 38 MWA Mojave Water Agency 39 MWD Metropolitan Water District 40 MWMA Mojave Weed Management Area 41 NAAQS National Ambient Air Quality Standard(s) 42 NADP National Atmospheric Deposition Program 43 NAGPRA Native American Graves Protection and Repatriation Act 44 NAHC Native American Heritage Commission (California) 45 NAIC North American Industrial Classification System 46

Final Solar PEIS xxxiii July 2012
NASA National Aeronautics and Space Administration 1 NCA National Conservation Area 2 NCCAC Nevada Climate Change Advisory Committee 3 NCDC National Climatic Data Center 4 NCES National Center for Education Statistics 5 NDAA National Defense Authorization Act 6 NDCNR Nevada Department of Conservation and Natural Resources 7 NDEP Nevada Division of Environmental Protection 8 NDOT Nevada Department of Transportation 9 NDOW Nevada Department of Wildlife 10 NDWP Nevada Division of Water Planning 11 NDWR Nevada Division of Water Resources 12 NEAP Natural Events Action Plan 13 NEC National Electric Code 14 NED National Elevation Database 15 NEP Natural Events Policy 16 NEPA National Environmental Policy Act of 1969 17 NERC North American Electricity Reliability Corporation 18 NGO non-governmental organization 19 NHA National Heritage Area 20 NHD National Hydrography Dataset 21 NHNM National Heritage New Mexico 22 NHPA National Historic Preservation Act of 1966 23 NID National Inventory of Dams 24 NLCS National Landscape Conservation System 25 NMAC New Mexico Administrative Code 26 NMBGMR New Mexico Bureau of Geology and Mineral Resources 27 NMDGF New Mexico Department of Game and Fish 28 NM DOT New Mexico Department of Transportation 29 NMED New Mexico Environment Department 30 NMED-AQB New Mexico Environment Department-Air Quality Board 31 NMFS National Marine Fisheries Service 32 NMOSE New Mexico Office of the State Engineer 33 NMSU New Mexico State University 34 NNHP Nevada Natural Heritage Program 35 NNL National Natural Landmark 36 NNSA National Nuclear Security Administration 37 NOA Notice of Availability 38 NOAA National Oceanic and Atmospheric Administration 39 NOI Notice of Intent 40 NP National Park 41 NPDES National Pollutant Discharge Elimination System 42 NPL National Priorities List 43 NPS National Park Service 44 NPV net present value 45 NRA National Recreation Area 46
Final Solar PEIS xxxiv July 2012
NRCS Natural Resources Conservation Service 1 NREL National Renewable Energy Laboratory 2 NRHP National Register of Historic Places 3 NRS Nevada Revised Statutes 4 NSC National Safety Council 5 NSO no surface occupancy 6 NSTC National Science and Technology Council 7 NTHP National Trust for Historic Preservation 8 NTS Nevada Test Site 9 NTTR Nevada Test and Training Range 10 NVCRS Nevada Cultural Resources Inventory System 11 NV DOT Nevada Department of Transportation 12 NWCC National Wind Coordinating Committee 13 NWI National Wetlands Inventory 14 NWIS National Water Information System (USGS) 15 NWPP Northwest Power Pool 16 NWR National Wildlife Refuge 17 NWSRS National Wild and Scenic River System 18 19 O&M operation and maintenance 20 ODFW Oregon Department of Fish and Wildlife 21 OHV off-highway vehicle 22 ONA Outstanding Natural Area 23 ORC organic Rankine cycle 24 OSE/ISC Office of the State Engineer/Interstate Stream Commission 25 OSHA Occupational Safety and Health Administration 26 OTA Office of Technology Assessment 27 28 PA Programmatic Agreement 29 PAD Preliminary Application Document 30 PAH polycyclic aromatic hydrocarbon 31 PAT peer analysis tool 32 PCB polychlorinated biphenyl 33 PCM purchase change material 34 PCS power conditioning system 35 PCU power converting unit 36 PEIS programmatic environmental impact statement 37 PFYC potential fossil yield classification 38 PGH Preliminary General Habitat 39 PIER Public Interest Energy Research 40 P.L. Public Law 41 PLSS Public Land Survey System 42 PM particulate matter 43 PM2.5 particulate matter with a diameter of 2.5 μm or less 44 PM10 particulate matter with a diameter of 10 μm or less 45 PPA Power Purchase Agreement 46
Final Solar PEIS xxxv July 2012
P-P-D population-to-power density 1 PPH Preliminary Priority Habitat 2 POD plan of development 3 POU publicly owned utility 4 PPA Power Purchase Agreement 5 PPE personal protective equipment 6 PSD Prevention of Significant Deterioration 7 PURPA Public Utility Regulatory Policy Act 8 PV photovoltaic 9 PVID Palo Verde Irrigation District 10 PWR public water reserve 11 12 QRA qualified resource area 13 14 R&I relevance and importance 15 RAC Resource Advisory Council 16 RCE Reclamation Cost Estimate 17 RCI residential, commercial, and industrial (sector) 18 RCRA Resource Conservation and Recovery Act of 1976 19 RD&D research, development, and demonstration; research, development, and 20 deployment 21 RDBMS Relational Database Management System 22 RDEP Restoration Design Energy Project 23 REA Rapid Ecoregional Assessment 24 REAT Renewable Energy Action Team 25 REDA Renewable Energy Development Area 26 REDI Renewable Energy Development Infrastructure 27 REEA Renewable Energy Evaluation Area 28 ReEDS Regional Energy Deployment System 29 REPG Renewable Energy Policy Group 30 RETA Renewable Energy Transmission Authority 31 RETAAC Renewable Energy Transmission Access Advisory Committee 32 RETI Renewable Energy Transmission Initiative 33 REZ renewable energy zone 34 RF radio frequency 35 RFC Reliability First Corporation 36 RFDS reasonably foreseeable development scenario 37 RGP Rio Grande Project 38 RGWCD Rio Grande Water Conservation District 39 RMP Resource Management Plan 40 RMPA Rocky Mountain Power Area 41 RMZ Resource Management Zone 42 ROD Record of Decision 43 ROI region of influence 44 ROS recreation opportunity spectrum 45 ROW right-of-way 46

Final Solar PEIS xxxvi July 2012
RPG renewable portfolio goal 1 RPS Renewable Portfolio Standard 2 RRC Regional Reliability Council 3 RSEP Rice Solar Energy Project 4 RSI Renewable Systems Interconnection 5 RTO regional transmission organization 6 RTTF Renewable Transmission Task Force 7 RV recreational vehicle 8 9 SAAQS State Ambient Air Quality Standard(s) 10 SAMHSA Substance Abuse and Mental Health Services Administration 11 SCADA supervisory control and data acquisition 12 SCE Southern California Edison 13 SCRMA Special Cultural Resource Management Area 14 SDRREG San Diego Regional Renewable Energy Group 15 SDWA Safe Drinking Water Act of 1974 16 SEGIS Solar Energy Grid Integration System 17 SEGS Solar Energy Generating System 18 SEI Sustainable Energy Ireland 19 SEIA Solar Energy Industrial Association 20 SES Stirling Energy Systems 21 SETP Solar Energy Technologies Program (DOE) 22 SEZ solar energy zone 23 SHPO State Historic Preservation Office(r) 24 SIP State Implementation Plan 25 SLRG San Luis & Rio Grande 26 SMA Special Management Area 27 SMART specific, measurable, achievable, relevant, and time sensitive 28 SMP suggested management practice 29 SNWA Southern Nevada Water Authority 30 SPP Southwest Power Pool 31 SRMA Special Recreation Management Area 32 SSA Socorro Seismic Anomaly 33 SSI self-supplied industry 34 ST solar thermal 35 STG steam turbine generator 36 SUA special use airspace 37 SWAT Southwest Area Transmission 38 SWIP Southwest Intertie Project 39 SWPPP Stormwater Pollution Prevention Plan 40 SWReGAP Southwest Regional Gap Analysis Project 41 42 TAP toxic air pollutant 43 TCC Transmission Corridor Committee 44 TDS total dissolved solids 45 TEPPC Transmission Expansion Planning Policy Committee 46

Final Solar PEIS xxxvii July 2012
TES thermal energy storage 1 TRACE Transmission Routing and Configuration Estimator 2 TSA Transportation Security Administration 3 TSCA Toxic Substances Control Act of 1976 4 TSDF treatment, storage, and disposal facility 5 TSP total suspended particulates 6 7 UACD Utah Association of Conservation Districts 8 UBWR Utah Board of Water Resources 9 UDA Utah Department of Agriculture 10 UDEQ Utah Department of Environmental Quality 11 UDNR Utah Department of Natural Resources 12 UDOT Utah Department of Transportation 13 UDWQ Utah Division of Water Quality 14 UDWR Utah Division of Wildlife Resources 15 UGS Utah Geological Survey 16 UNEP United Nations Environmental Programme 17 UNPS Utah Native Plant Society 18 UP Union Pacific 19 UREZ Utah Renewable Energy Zone 20 USACE U.S. Army Corps of Engineers 21 USAF U.S. Air Force 22 USC United States Code 23 USDA U.S. Department of Agriculture 24 USFS U.S. Forest Service 25 USFWS U.S. Fish and Wildlife Service 26 USGS U.S. Geological Survey 27 Utah DWR Utah Division of Water Rights 28 UTTR Utah Test and Training Range 29 UWS Underground Water Storage, Savings and Replenishment Act 30 31 VACAR Virginia–Carolinas Subregion 32 VCRS Visual Contrast Rating System 33 VFR visual flight rule 34 VOC volatile organic compound 35 VRHCRP Virgin River Habitat Conservation & Recovery Program 36 VRI Visual Resource Inventory 37 VRM Visual Resource Management 38 39 WA Wilderness Area 40 WECC Western Electricity Coordinating Council 41 WECC CAN Western Electricity Coordinating Council–Canada 42 WEG wind erodibility group 43 Western Western Area Power Administration 44 WGA Western Governors’ Association 45 WGFD Wyoming Game and Fish Department 46

Final Solar PEIS xxxviii July 2012
WHA wildlife habitat area 1 WHO World Health Organization 2 WIA Wyoming Infrastructure Authority 3 WRAP Water Resources Allocation Program; Western Regional Air Partnership 4 WRCC Western Regional Climate Center 5 WREZ Western Renewable Energy Zones 6 WRRI Water Resources Research Institute 7 WSA Wilderness Study Area 8 WSC wildlife species of special concern 9 WSMR White Sands Missile Range 10 WSR Wild and Scenic River 11 WSRA Wild and Scenic Rivers Act of 1968 12 WWII World War II 13 WWP Western Watersheds Project 14 15 YPG Yuma Proving Ground 16 17 ZITA zone identification and technical analysis 18 ZLD zero liquid discharge 19 20 21 CHEMICALS 22 23 CH4 methane 24 CO carbon monoxide 25 CO2 carbon dioxide 26 27 H2S hydrogen sulfide 28 Hg mercury 29 30 N2O nitrous oxide 31 NH3 ammonia 32
NO2 nitrogen dioxide NOx nitrogen oxides O3 ozone Pb lead SF6 sulfur hexafluoride SO2 sulfur dioxide SOx sulfur oxides
33 34 UNITS OF MEASURE 35 36 ac-ft acre-foot (feet) 37 bhp brake horsepower 38 39 C degree(s) Celsius 40
cf cubic foot (feet) 41 cfs cubic foot (feet) per second 42 cm centimeter(s) 43 44 dB decibel(s) 45
dBA A-weighted decibel(s)
F degree(s) Fahrenheit ft foot (feet) ft2 square foot (feet) ft3 cubic foot (feet) g gram(s) gal gallon(s)

Final Solar PEIS xxxix July 2012
GJ gigajoule(s) 1 gpcd gallon per capita per day 2 gpd gallon(s) per day 3 gpm gallon(s) per minute 4 GW gigawatt(s) 5 GWh gigawatt hour(s) 6 GWh/yr gigawatt hour(s) per year 7 8 h hour(s) 9 ha hectare(s) 10 Hz hertz 11 12 in. inch(es) 13 14 J joule(s) 15 16 K degree(s) Kelvin 17 kcal kilocalorie(s) 18 kg kilogram(s) 19 kHz kilohertz 20 km kilometer(s) 21 km2 square kilometer(s) 22 kPa kilopascal(s) 23 kV kilovolt(s) 24 kVA kilovolt-ampere(s) 25 kW kilowatt(s) 26 kWh kilowatt-hour(s) 27 kWp kilowatt peak 28 29 L liter(s) 30 lb pound(s) 31 32 m meter(s) 33 m2 square meter(s) 34 m3 cubic meter(s) 35 mg milligram(s) 36 Mgal million gallons 37 mi mile(s) 38 mi2 square mile(s) 39 min minute(s) 40 mm millimeter(s) 41 MMt million metric ton(s) 42 MPa megapascal(s) 43 mph mile(s) per hour 44 MVA megavolt-ampere(s) 45 MW megawatt(s) 46
MWe megawatt(s) electric MWh megawatt-hour(s) ppm part(s) per million psi pound(s) per square inch psia pound(s) per square inch absolute rpm rotation(s) per minute s second(s) scf standard cubic foot (feet) TWh terawatt hour(s) VdB vibration velocity decibel(s) W watt(s) yd2 square yard(s) yd3 cubic yard(s) yr year(s) μg microgram(s) μm micrometer(s)
Final Solar PEIS 8.1-1 July 2012
8 UPDATE TO AFFECTED ENVIRONMENT AND IMPACT ASSESSMENT 1 FOR PROPOSED SOLAR ENERGY ZONES IN ARIZONA 2
3 4 The U.S. Department of the Interior Bureau of Land Management (BLM) has carried 5 17 solar energy zones (SEZs) forward for analysis in this Final Solar Programmatic 6 Environmental Impact Statement (PEIS). These SEZs total approximately 285,000 acres 7 (1,153 km2) of land potentially available for development. This chapter includes analyses of 8 potential environmental impacts for the proposed SEZs in Arizona, Brenda and Gillespie, as well 9 as a summary of the Bullard Wash SEZ and why it was eliminated from further consideration. 10 The SEZ-specific analyses provide documentation from which the BLM will tier future project 11 authorizations, thereby limiting the required scope and effort of project-specific National 12 Environmental Policy Act of 1969 (NEPA) analyses. 13 14
The BLM is committed to collecting additional SEZ-specific resource data and 15 conducting additional analysis in order to more efficiently facilitate future development in 16 SEZs. The BLM developed action plans for each of the 17 SEZs carried forward as part of 17 the Supplement to the Draft Solar PEIS (BLM and DOE 2011). These action plans described 18 additional data that could be collected for individual SEZs and proposed data sources and 19 methods for the collection of those data. Work is under way to collect additional data as 20 specified under these action plans (e.g., additional data collection to support evaluation of 21 cultural, visual, and water resources has begun). As the data become available, they will be 22 posted on the project Web site (http://solareis.anl.gov) for use by applicants and the BLM and 23 other agency staff. 24 25 To accommodate the flexibility described in the BLM’s program objectives and in light 26 of anticipated changes in technologies and environmental conditions over time, the BLM has 27 removed some of the prescriptive SEZ-specific design features presented in the Draft Solar PEIS 28 (BLM and DOE 2010) and the Supplement to the Draft (e.g., height restrictions on technologies 29 used to address visual resource impacts). Alternatively, the BLM will give full consideration to 30 any outstanding conflicts in SEZs as part of the competitive process being developed through 31 rulemaking (see Section 2.2.2.2.1). 32 33 In preparing selected parcels for competitive offer, the BLM will review all existing 34 analysis for an SEZ and consider any new or changed circumstances that may affect the 35 development of the SEZ. The BLM will also work with appropriate federal, state, and local 36 agencies, and affected tribes, as necessary, to discuss SEZ-related issues. This work would 37 ultimately inform how a parcel would be offered competitively (e.g., parcel size and 38 configuration, technology limitations, mitigation requirements, and parcel-specific competitive 39 process). Prior to issuing a notice of competitive offer, the BLM would complete appropriate 40 NEPA analysis to support the offer. This analysis would tier to the analysis for SEZs in the Solar 41 PEIS to the extent practicable. 42 43
It is the BLM’s goal to compile all data, information, and analyses for SEZs from the 44 Draft Solar PEIS, the Supplement to the Draft, and this Final PEIS into a single location 45
Final Solar PEIS 8.1-2 July 2012
accessible via the project Web site (http://solareis.anl.gov) for ease of use by applicants and the 1 BLM and other agency staff. 2
3 This chapter is an update to the information on Arizona SEZs presented in the Draft Solar 4 PEIS. As stated previously, the Bullard Wash SEZ was dropped from further consideration 5 through the Supplement to the Draft Solar PEIS. For the remaining two Arizona SEZs, Brenda 6 and Gillespie, the information presented in this chapter supplements and updates, but does not 7 replace, the information provided in the corresponding Chapter 8 on proposed SEZs in Arizona 8 in the Draft Solar PEIS. Corrections to incorrect information in Sections 8.1 and 8.3 of the Draft 9 Solar PEIS and in Sections C.1.1 and C.1.2 of the Supplement to the Draft are provided in 10 Sections 8.1.26 and 8.3.26 of this Final Solar PEIS. 11 12 13 8.1 BRENDA 14 15 16 8.1.1 Background and Summary of Impacts 17 18 19
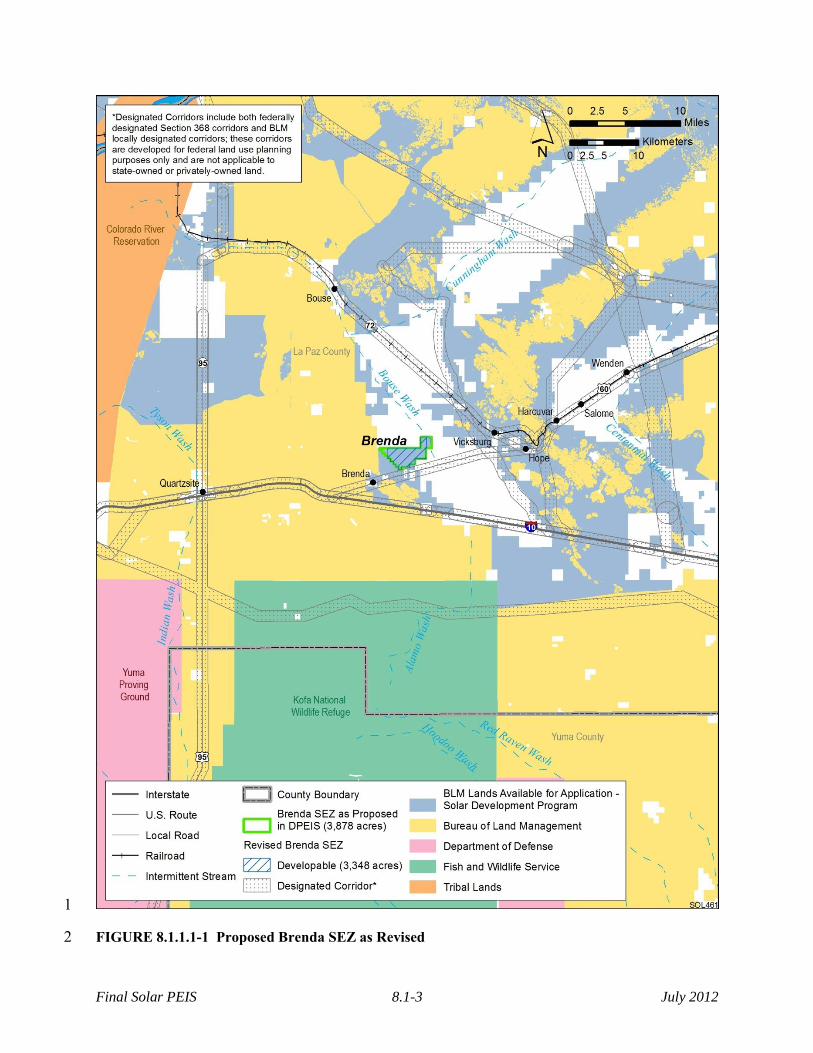
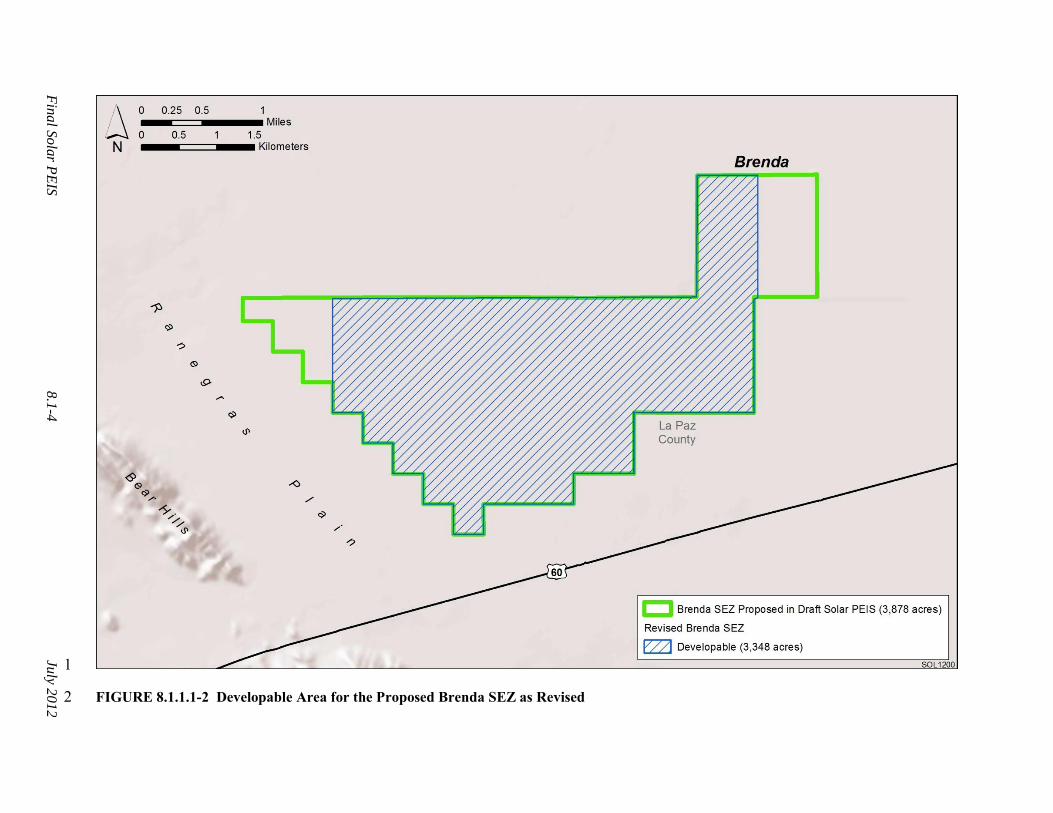
8.1.1.1 General Information 20 21 The proposed Brenda SEZ is located in La Paz County in west-central Arizona, 32 mi 22 (52 km) east of the California border. In 2008, the county population was 20,005, while adjacent 23 Riverside County to the west in California had a population of 2,087,917. The towns of 24 Quartzsite and Salome in La Paz County are about 18 mi (29 km) west of and 18 mi (29 km) east 25 of the SEZ, respectively. 26 27 The nearest major road access to the SEZ is via U.S. 60, which runs southwest to 28 northeast along the southeast border of the Brenda SEZ. The nearest railroad stop is 11 mi 29 (18 km) away. As of October 28, 2011, there were no pending right-of-way (ROW) applications 30 for solar projects within the SEZ. 31 32 As published in the Draft Solar PEIS and the Supplement to the Draft, the proposed 33 Brenda SEZ had a total area of 3,878 acres (16 km2) (see Figure 8.1.1.1-1). For this Final Solar 34 PEIS, the SEZ boundaries were reduced, thus eliminating the area of Bouse Wash on the east 35 side of the SEZ and eliminating the area on the west side of the SEZ to the west of the county 36 road (a total of 530 acres [2.1 km2]) (see Figure 8.1.1.1-2). Eliminating the area of Bouse Wash 37 is primarily intended to avoid impacts on habitats and species that utilize the wash. Eliminating 38 the area of the SEZ west of the county road avoids splitting solar development on the SEZ and 39 associated internal access and security issues. In addition, the new boundary limits solar 40 development to a distance of about 0.75 mi (1.2 km) east of the Plomosa Special Resource 41 Management Area (SRMA) and avoids crossing a well-vegetated drainage with wildlife values. 42 The remaining SEZ area is 3,348 acres (13.5 km2). No additional areas for non-development 43 were identified within the SEZ. 44 45
Final Solar PEIS 8.1-3 July 2012
1
FIGURE 8.1.1.1-1 Proposed Brenda SEZ as Revised 2
Fin
al S
ola
r PE
IS
8.1
-4
July 2
012
1
FIGURE 8.1.1.1-2 Developable Area for the Proposed Brenda SEZ as Revised 2

Final Solar PEIS 8.1-5 July 2012
Because of the extensive potential impacts from solar development in the portion of the 1 proposed Brenda SEZ that has been eliminated, those lands are proposed as solar ROW 2 exclusion areas; that is, applications for solar development on those lands will not be accepted by 3 the BLM. 4 5 The analyses in the following sections update the affected environment and potential 6 environmental, cultural, and socioeconomic impacts associated with utility-scale solar energy 7 development in the proposed Brenda SEZ as described in the Draft Solar PEIS. 8 9 10
8.1.1.2 Development Assumptions for the Impact Analysis 11 12 Maximum solar development of the Brenda SEZ is assumed to be 80% of the SEZ area 13 over a period of 20 years, a maximum of 2,678 acres (10.8 km2). Full development of the Brenda 14 SEZ would allow development of facilities with an estimated total of between 298 MW (power 15 tower, dish engine, or photovoltaic [PV] technologies, 9 acres/MW [0.04 km2/MW]) and 16 536 MW (solar trough technologies, 5 acres/MW [0.02 km2/MW]) of electrical power capacity. 17 18 Availability of transmission from SEZs to load centers will be an important consideration 19 for future development in SEZs. For the proposed Brenda SEZ, updated data indicate that the 20 nearest existing transmission line is a 500-kV east–west line located about 12 mi (19 km) south 21 of the SEZ (the Draft Solar PEIS had indicated that the closest existing line was a 161-kV line 22 19 mi [31 km] to the west of the SEZ). It is possible that a new transmission line could be 23 constructed from the SEZ to the existing line, but the available capacity on the existing 500-kV 24 could be inadequate for 298 to 536 MW of new capacity. Therefore, at full build-out capacity, 25 new transmission and/or upgrades of existing transmission lines would likely be required to 26 bring electricity from the proposed Brenda SEZ to load centers. An assessment of the most likely 27 load center destinations for power generated at the Brenda SEZ and a general assessment of the 28 impacts of constructing and operating new transmission facilities to those load centers are 29 provided in Section 8.1.23. In addition, the generic impacts of transmission and associated 30 infrastructure construction and of line upgrades for various resources are discussed in Chapter 5 31 of this Final Solar PEIS. Project-specific analyses would also be required to identify the specific 32 impacts of new transmission construction and line upgrades for any projects proposed within the 33 SEZ. 34 35 The transmission assessment for the Brenda SEZ has been updated, and the hypothetical 36 transmission corridor assessed in the Draft Solar PEIS is no longer applicable. For this updated 37 assessment, the 575 acres (2.3 km2) of land disturbance for a hypothetical transmission corridor 38 to the existing transmission line is no longer assumed (although the impacts of required new 39 transmission overall are addressed in Section 8.1.23). 40 41 For the proposed Brenda SEZ, existing road access should be adequate to support 42 construction and operation of solar facilities, because U.S. 60 runs along the southeast border of 43 the SEZ. Thus, no additional road construction outside of the SEZ was assumed to be required to 44 support solar development, as summarized in Table 8.1.1.2-1. 45 46

Final Solar PEIS 8.1-6 July 2012
TABLE 8.1.1.2-1 Assumed Development Acreages, Solar MW Output, and Nearest Major 1 Access Road and Transmission Line for the Proposed Brenda SEZ as Revised 2
Total Developable Acreage
and Assumed Developed Acreage
(80% of Total)
Assumed Maximum
SEZ Output for Various
Solar Technologies
Distance to Nearest State,
U.S. or Interstate Highway
Distance
and Capacity of Nearest Existing
Transmission Line
Assumed Area of Road
ROW
Distance to Nearest
Designated Corridorf
3,348 acresa and
2,678 acres 298 MWb 536 MWc
U.S. 60 adjacent
12 mid,e and 500 kV
0 acres Adjacent
a To convert acres to km2, multiply by 0.004047. b Maximum power output if the SEZ were fully developed using power tower, dish engine, or PV
technologies, assuming 9 acres/MW (0.04 km2/MW) of land required. c Maximum power output if the SEZ were fully developed using solar trough technologies, assuming
5 acres/MW (0.02 km2/MW) of land required. d In the Draft Solar PEIS, the nearest transmission line identified was a 161-kV line 19 mi (31 km) from
the SEZ; this information has been updated. e To convert mi to km, multiply by 1.6093. f BLM-designated corridors are developed for federal land use planning purposes only and are not
applicable to state-owned or privately owned land. 3 4
8.1.1.3 Programmatic and SEZ-Specific Design Features 5 6 The proposed programmatic design features for each resource area to be required under 7 BLM’s Solar Energy Program are presented in Section A.2.2 of Appendix A of this Final Solar 8 PEIS. These programmatic design features are intended to avoid, reduce, and/or mitigate adverse 9 impacts of solar energy development and will be required for development on all BLM-10 administered lands, including SEZ and non-SEZ lands. 11 12 The discussions below addressing potential impacts of solar energy development on 13 specific resource areas (Sections 8.1.2 through 8.1.22) also provide an assessment of the 14 effectiveness of the programmatic design features in mitigating adverse impacts from solar 15 development within the SEZ. SEZ-specific design features to address impacts specific to the 16 proposed Brenda SEZ may be required in addition to the programmatic design features. The 17 proposed SEZ-specific design features for the Brenda SEZ have been updated on the basis of 18 revisions to the SEZ since the Draft Solar PEIS (such as boundary changes and the identification 19 of non-development areas), and on the basis of comments received on the Draft and Supplement 20 to the Draft Solar PEIS. All applicable SEZ-specific design features identified to date (including 21 those from the Draft Solar PEIS that are still applicable) are presented in Sections 8.1.2 through 22 8.1.22. 23 24 25
Final Solar PEIS 8.1-7 July 2012
8.1.2 Lands and Realty 1 2 3
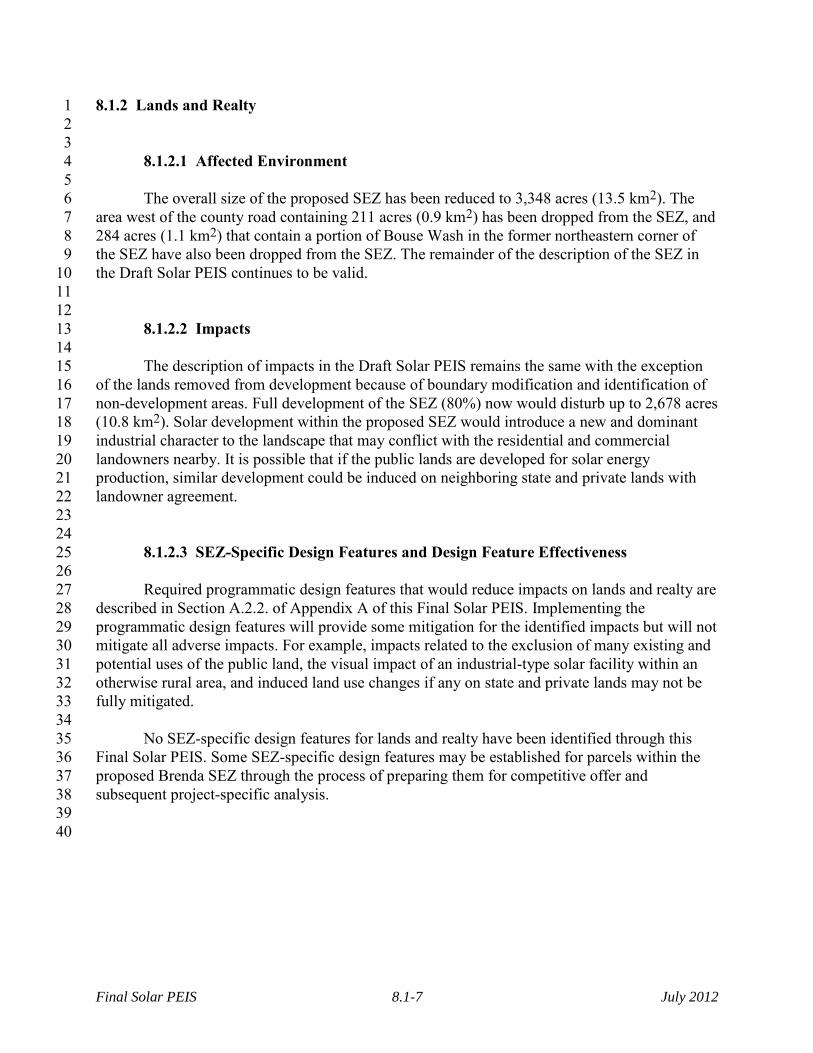
8.1.2.1 Affected Environment 4 5 The overall size of the proposed SEZ has been reduced to 3,348 acres (13.5 km2). The 6 area west of the county road containing 211 acres (0.9 km2) has been dropped from the SEZ, and 7 284 acres (1.1 km2) that contain a portion of Bouse Wash in the former northeastern corner of 8 the SEZ have also been dropped from the SEZ. The remainder of the description of the SEZ in 9 the Draft Solar PEIS continues to be valid. 10 11 12
8.1.2.2 Impacts 13 14 The description of impacts in the Draft Solar PEIS remains the same with the exception 15 of the lands removed from development because of boundary modification and identification of 16 non-development areas. Full development of the SEZ (80%) now would disturb up to 2,678 acres 17 (10.8 km2). Solar development within the proposed SEZ would introduce a new and dominant 18 industrial character to the landscape that may conflict with the residential and commercial 19 landowners nearby. It is possible that if the public lands are developed for solar energy 20 production, similar development could be induced on neighboring state and private lands with 21 landowner agreement. 22 23 24
8.1.2.3 SEZ-Specific Design Features and Design Feature Effectiveness 25 26 Required programmatic design features that would reduce impacts on lands and realty are 27 described in Section A.2.2. of Appendix A of this Final Solar PEIS. Implementing the 28 programmatic design features will provide some mitigation for the identified impacts but will not 29 mitigate all adverse impacts. For example, impacts related to the exclusion of many existing and 30 potential uses of the public land, the visual impact of an industrial-type solar facility within an 31 otherwise rural area, and induced land use changes if any on state and private lands may not be 32 fully mitigated. 33 34 No SEZ-specific design features for lands and realty have been identified through this 35 Final Solar PEIS. Some SEZ-specific design features may be established for parcels within the 36 proposed Brenda SEZ through the process of preparing them for competitive offer and 37 subsequent project-specific analysis. 38 39 40
Final Solar PEIS 8.1-8 July 2012
8.1.3 Specially Designated Areas and Lands with Wilderness Characteristics 1 2 3
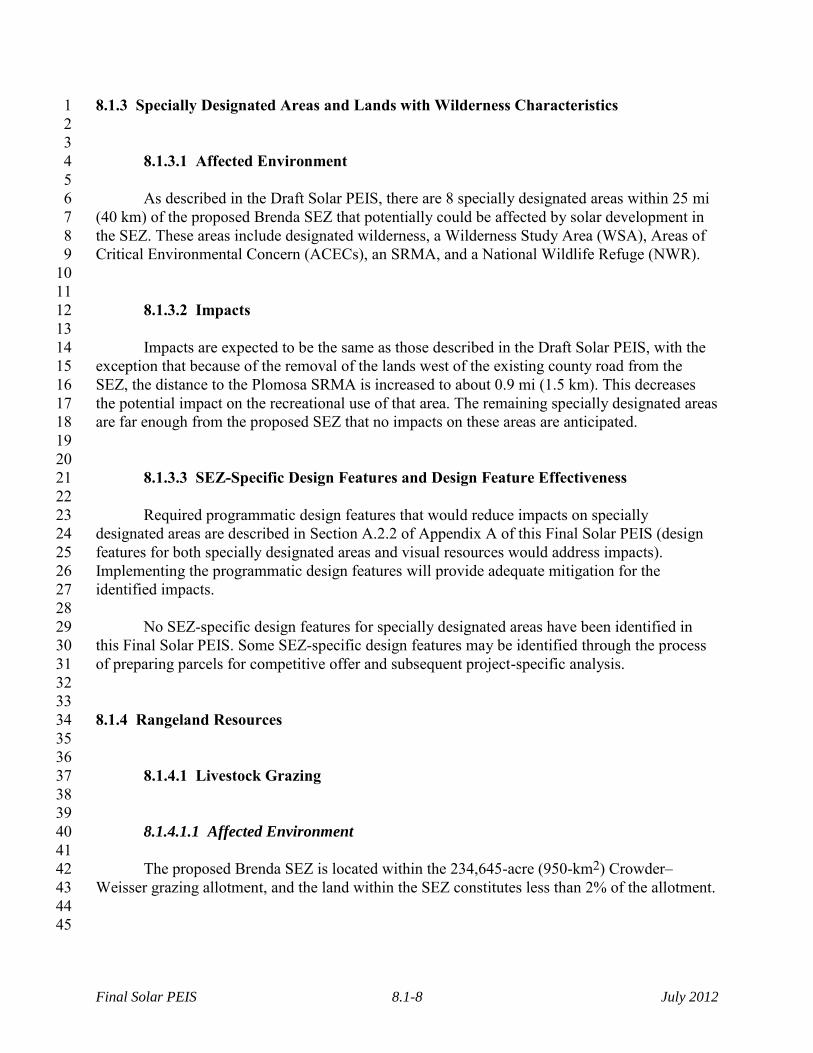
8.1.3.1 Affected Environment 4 5 As described in the Draft Solar PEIS, there are 8 specially designated areas within 25 mi 6 (40 km) of the proposed Brenda SEZ that potentially could be affected by solar development in 7 the SEZ. These areas include designated wilderness, a Wilderness Study Area (WSA), Areas of 8 Critical Environmental Concern (ACECs), an SRMA, and a National Wildlife Refuge (NWR). 9 10 11
8.1.3.2 Impacts 12 13 Impacts are expected to be the same as those described in the Draft Solar PEIS, with the 14 exception that because of the removal of the lands west of the existing county road from the 15 SEZ, the distance to the Plomosa SRMA is increased to about 0.9 mi (1.5 km). This decreases 16 the potential impact on the recreational use of that area. The remaining specially designated areas 17 are far enough from the proposed SEZ that no impacts on these areas are anticipated. 18 19 20
8.1.3.3 SEZ-Specific Design Features and Design Feature Effectiveness 21 22 Required programmatic design features that would reduce impacts on specially 23 designated areas are described in Section A.2.2 of Appendix A of this Final Solar PEIS (design 24 features for both specially designated areas and visual resources would address impacts). 25 Implementing the programmatic design features will provide adequate mitigation for the 26 identified impacts. 27 28 No SEZ-specific design features for specially designated areas have been identified in 29 this Final Solar PEIS. Some SEZ-specific design features may be identified through the process 30 of preparing parcels for competitive offer and subsequent project-specific analysis. 31 32 33 8.1.4 Rangeland Resources 34 35 36
8.1.4.1 Livestock Grazing 37 38 39
8.1.4.1.1 Affected Environment 40 41 The proposed Brenda SEZ is located within the 234,645-acre (950-km2) Crowder–42 Weisser grazing allotment, and the land within the SEZ constitutes less than 2% of the allotment. 43 44 45

Final Solar PEIS 8.1-9 July 2012
8.1.4.1.2 Impacts 1 2 The analysis in the Draft Solar PEIS identified the potential for a loss of 315 animal unit 3 months (AUMs) of livestock forage (less than 2% of the total amount of the permitted forage ) 4 from the allotment, based on impacts from development within the SEZ. It was recognized that 5 because of the large size of the allotment, it might be possible to accommodate any lost AUMs 6 elsewhere in the allotment; however, should that not be possible, there would be an 7 undetermined adverse economic impact upon the permittee. The overall impact is anticipated to 8 be small. 9 10 Economic impacts of the loss of grazing capacity must be determined at the allotment-11 specific level. For most public land grazing operations, any loss of grazing capacity is an 12 economic concern, but it is not possible to assess the extent of that specific impact at this 13 programmatic level. For that reason, only a general assessment is made based on the projected 14 loss of livestock AUMs; this assessment does not consider potential impacts on management 15 costs, the impacts of reducing the scale of an operation, or the impact on the value of the ranch, 16 including private land values and other grazing associated assets. 17 18 19
8.1.4.1.3 SEZ-Specific Design Features and Design Feature Effectiveness 20 21 Required programmatic design features that would reduce impacts on livestock grazing 22 are described in Section A.2.2 of Appendix A of this Final Solar PEIS. Implementing the 23 programmatic design features will provide some mitigation for identified impacts but will not 24 mitigate the loss of livestock AUMs or the loss of value in ranching operations, including private 25 land values. 26 27 No SEZ-specific design features to protect livestock grazing have been identified in this 28 Final Solar PEIS. Some SEZ-specific design features may be identified through the process of 29 preparing parcels for competitive offer and subsequent project-specific analysis. 30 31 32
8.1.4.2 Wild Horses and Burros 33 34 35
8.1.4.2.1 Affected Environment 36 37 As presented in the Draft Solar PEIS, no wild horse or burro herd management areas 38 (HMAs) occur within the proposed Brenda SEZ or in close proximity to it. The reduction in size 39 of the SEZ does not alter this finding. 40 41 42
8.1.4.2.2 Impacts 43 44 As presented in the Draft Solar PEIS, solar energy development within the proposed 45 Brenda SEZ would not affect wild horses and burros. 46

Final Solar PEIS 8.1-10 July 2012
8.1.4.2.3 SEZ-Specific Design Features and Design Feature Effectiveness 1 2 On the basis of impact analyses conducted for the Draft Solar PEIS, updates to those 3 analyses due to changes to the SEZ boundaries, and consideration of comments received as 4 applicable, no SEZ-specific design features to address wild horses and burros are required for the 5 proposed Brenda SEZ. 6 7 8 8.1.5 Recreation 9 10 11
8.1.5.1 Affected Environment 12 13 The description of the area within and around the proposed Brenda SEZ in the Draft 14 Solar PEIS remains valid. The proposed SEZ is located within 15 mi (24 km) of Quartzsite, 15 Arizona, an area that attracts large numbers of winter visitors to the area. The Plomosa SRMA 16 provides a recreational outlet to winter visitors and to others interested in desert and backcountry 17 driving. 18 19 20
8.1.5.2 Impacts 21 22 Recreational users would be excluded from areas developed for solar energy production, 23 and they might avoid areas near the SEZ within the Plomosa SRMA. With the removal of the 24 portion of the SEZ west of the county road on the western boundary of the SEZ, impacts on 25 recreational access to the SRMA would no longer be a concern. In addition, lands that are 26 outside of the proposed SEZ may be acquired or managed for mitigation of impacts on other 27 resources (e.g., sensitive species). Managing these lands for mitigation could further exclude or 28 restrict recreational use, potentially leading to additional losses in recreational opportunities in 29 the region. The impact of acquisition and management of mitigation lands would be considered 30 as a part of the environmental analysis of specific solar energy projects. 31 32 33
8.1.5.3 SEZ-Specific Design Features and Design Feature Effectiveness 34 35 Required programmatic design features that would reduce impacts on recreational 36 resources are described in Section A.2.2 of Appendix A of this Final Solar PEIS. Implementing 37 the programmatic design features will provide adequate mitigation for the identified impacts but 38 will not mitigate the loss of recreational access to public lands developed for solar energy 39 production. 40 41 On the basis of impact analyses conducted for the Draft Solar PEIS, updates to those 42 analyses due to changes to the SEZ boundaries, and consideration of comments received as 43 applicable, no SEZ-specific design features for recreation for the proposed Brenda SEZ have 44 been identified. Some SEZ-specific design features may be identified through the process of 45 preparing parcels for competitive offer and subsequent project-specific analysis. 46

Final Solar PEIS 8.1-11 July 2012
8.1.6 Military and Civilian Aviation 1 2 3
8.1.6.1 Affected Environment 4 5 The description in the Draft Solar PEIS remains valid. The proposed Brenda SEZ is 6 covered by three military training routes (MTRs) with 300-ft (91-m) above-ground-level (AGL) 7 operating limits. 8 9 10
8.1.6.2 Impacts 11 12 Through comments on the Draft Solar PEIS, the military has indicated that construction 13 of solar energy and related facilities higher than 250 ft (76 m) could interfere with military 14 training activities and could be a safety concern. 15 16 17
8.1.6.3 SEZ-Specific Design Features and Design Feature Effectiveness 18 19 Required programmatic design features that would reduce impacts on military and 20 civilian aviation are described in Section A.2.2 of Appendix A of this Final Solar PEIS. The 21 programmatic design features require early coordination with the DoD to identify, avoid, 22 minimize, and/or mitigate, if possible, potential impacts on the use of military airspace. 23 24 No SEZ-specific design features for military and civilian aviation have been identified in 25 this Final Solar PEIS. Some SEZ-specific design features may be identified through the process 26 of preparing parcels for competitive offer and subsequent project-specific analysis. 27 28 29 8.1.7 Geologic Setting and Soil Resources 30 31 32
8.1.7.1 Affected Environment 33 34 35
8.1.7.1.1 Geologic Setting 36 37 Data provided in the Draft Solar PEIS remain valid, with the following updates: 38 39
• The terrain of the proposed Brenda SEZ slopes gently to the northeast 40 (Figure 8.1.7.1-1). The boundaries of the proposed SEZ have been changed to 41 eliminate a portion of the Bouse Wash floodplain (to the east) and the small 42 area to the west of the county road. Based on these changes, the elevations 43 range from about 1,240 ft (380 m) along its southwest border to about 1,105 ft 44 (340 m) at the northeast corner. 45
46

Fin
al S
ola
r PE
IS
8.1
-12
July 2
012
1
FIGURE 8.1.7.1-1 General Terrain of the Proposed Brenda SEZ as Revised 2

Final Solar PEIS 8.1-13 July 2012
8.1.7.1.2 Soil Resources 1 2 Data provided in the Draft Solar PEIS remain valid, with the following updates: 3 4
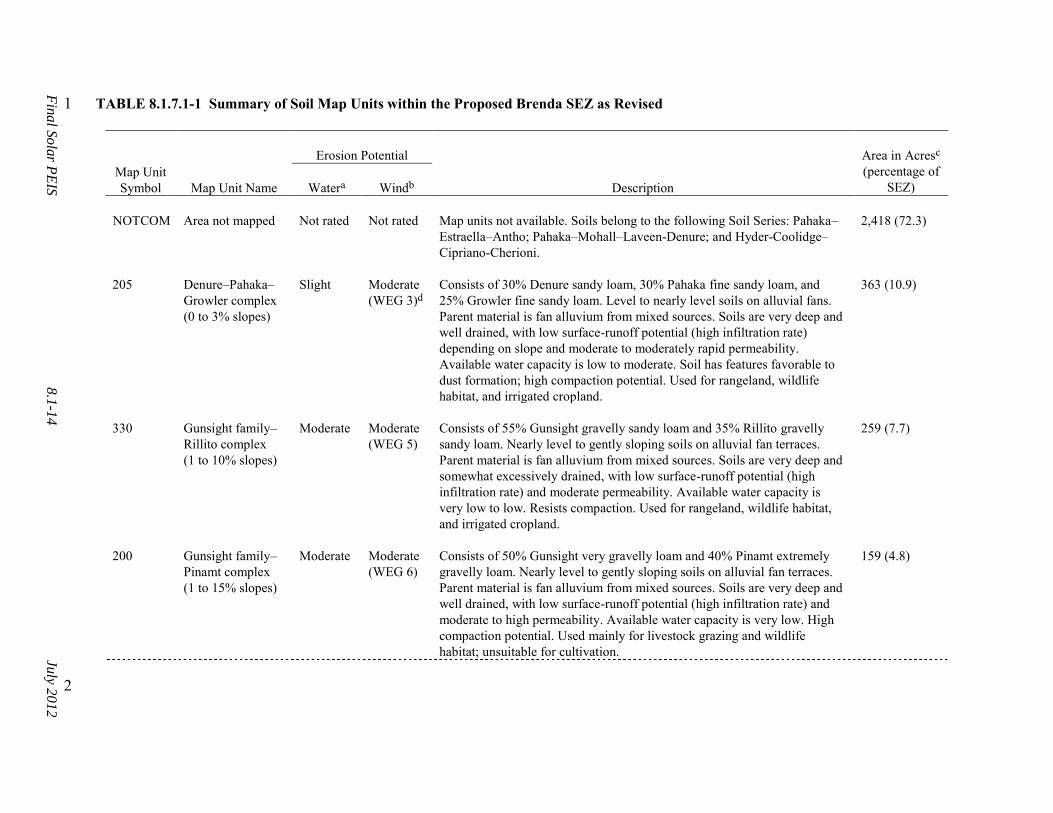
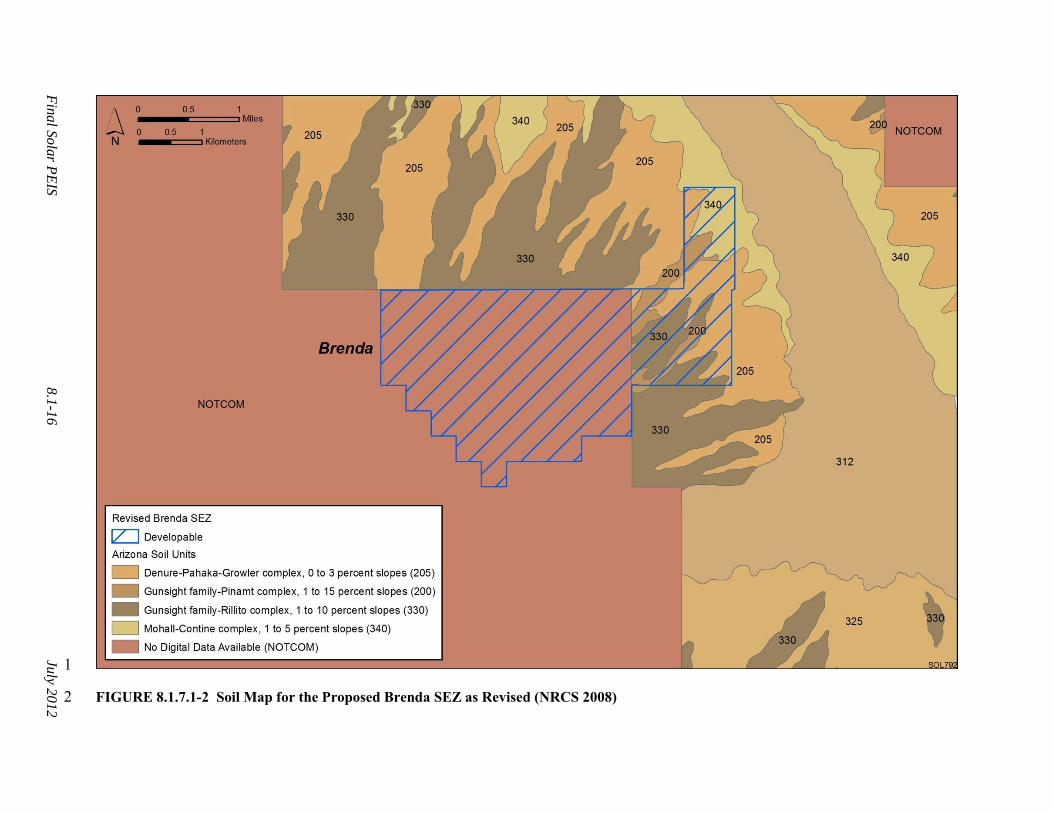
• Soils within the proposed Brenda SEZ as revised are predominantly the sandy 5 loams and gravelly sandy loams of the Denure–Pahaka–Growler and Gunsight 6 family–Rillito complexes, which now make up about 19% of the soil coverage 7 at the site (Table 8.1.7.1-1). Most of the map unit composition (about 72%) 8 within the proposed SEZ has not been delineated. 9
10 • Soil unit coverage at the proposed Brenda SEZ as revised is shown in 11
Figure 8.1.7.1-2. The new SEZ boundaries eliminate 217 acres (0.88 km2) of 12 the western portion of the site that has not been mapped for soils; 149 acres 13 (0.60 km2) of the Gadsden–Glenbar complex; 118 acres (0.48 km2) of the 14 Mohali–Contine complex, and 48 acres (0.19 km2) of the Denure–Pahaka–15 Growler complex. 16
17 18
8.1.7.2 Impacts 19 20 Impacts on soil resources would occur mainly as a result of ground-disturbing activities 21 (e.g., grading, excavating, and drilling), especially during the construction phase of a solar 22 project. Because impacts on soil resources result from ground-disturbing activities in the project 23 area, soil impacts would be roughly proportional to the size of a given solar facility, with larger 24 areas of disturbed soil having a greater potential for impacts than smaller areas (Section 5.7). 25 The assessment of impacts provided in the Draft Solar PEIS remains valid, with the following 26 updates: 27 28
• Impacts related to wind erodibility are somewhat reduced because the change 29 in boundaries eliminates 315 acres (1.3 km2) of moderately erodible soils 30 from development. 31
32 • Impacts related to water erodibility are somewhat reduced because the change 33
in boundaries eliminates 267 acres (1.1 km2) of moderately erodible soils 34 from development. 35
36 37
8.1.7.3 SEZ-Specific Design Features and Design Feature Effectiveness 38 39 Required programmatic design features that would reduce impacts on soils are described 40 in Appendix A of this Final Solar PEIS. Implementing the programmatic design features 41 described in Section A.2.2 of Appendix A, as required under BLM’s Solar Energy Program, will 42 reduce the potential for soil impacts during all project phases. 43 44 45
Fin
al S
ola
r PE
IS
8.1
-14
July 2
01
2
TABLE 8.1.7.1-1 Summary of Soil Map Units within the Proposed Brenda SEZ as Revised 1
Erosion Potential
Area in Acresc (percentage of
SEZ) Map Unit Symbol
Map Unit Name
Watera
Windb
Description
NOTCOM Area not mapped Not rated Not rated Map units not available. Soils belong to the following Soil Series: Pahaka–
Estraella–Antho; Pahaka–Mohall–Laveen-Denure; and Hyder-Coolidge–Cipriano-Cherioni.
2,418 (72.3)
205 Denure–Pahaka–
Growler complex (0 to 3% slopes)
Slight Moderate (WEG 3)d
Consists of 30% Denure sandy loam, 30% Pahaka fine sandy loam, and 25% Growler fine sandy loam. Level to nearly level soils on alluvial fans. Parent material is fan alluvium from mixed sources. Soils are very deep and well drained, with low surface-runoff potential (high infiltration rate) depending on slope and moderate to moderately rapid permeability. Available water capacity is low to moderate. Soil has features favorable to dust formation; high compaction potential. Used for rangeland, wildlife habitat, and irrigated cropland.
363 (10.9)
330 Gunsight family–
Rillito complex (1 to 10% slopes)
Moderate Moderate (WEG 5)
Consists of 55% Gunsight gravelly sandy loam and 35% Rillito gravelly sandy loam. Nearly level to gently sloping soils on alluvial fan terraces. Parent material is fan alluvium from mixed sources. Soils are very deep and somewhat excessively drained, with low surface-runoff potential (high infiltration rate) and moderate permeability. Available water capacity is very low to low. Resists compaction. Used for rangeland, wildlife habitat, and irrigated cropland.
259 (7.7)
200 Gunsight family–
Pinamt complex (1 to 15% slopes)
Moderate Moderate (WEG 6)
Consists of 50% Gunsight very gravelly loam and 40% Pinamt extremely gravelly loam. Nearly level to gently sloping soils on alluvial fan terraces. Parent material is fan alluvium from mixed sources. Soils are very deep and well drained, with low surface-runoff potential (high infiltration rate) and moderate to high permeability. Available water capacity is very low. High compaction potential. Used mainly for livestock grazing and wildlife habitat; unsuitable for cultivation.
159 (4.8)
2

Fin
al S
ola
r PE
IS
8.1
-15
July 2
01
2
TABLE 8.1.7.1-1 (Cont.)
Erosion Potential
Area in Acresc (percentage of
SEZ) Map Unit Symbol
Map Unit Name
Watera
Windb
Description
340 Mohall–Contine
complex (1 to 5% slopes)
Moderate Moderate (WEG 3)
Consists of 50% Mohall sandy loam and 40% Contine sandy loam. Level to nearly level soils on basin floors. Parent material is mixed stream alluvium. Soils are very deep and well drained, with slow to moderate surface runoff potential and moderately slow to slow permeability. Available water capacity is low. Soil has moderate resistance to dust propagation. Used for rangeland, wildlife habitat, and irrigated cropland.
146 (4.4)
a Water erosion potential rates the hazard of soil loss from off-road and off-trail areas after disturbance activities that expose the soil surface. The ratings
are based on slope and soil erosion factor K (whole soil; does not account for the presence of rock fragments) and represent soil loss caused by sheet or rill erosion where 50 to 75% of the surface has been exposed by ground disturbance. A rating of “slight” indicates that erosion is unlikely under ordinary climatic conditions. A rating of “moderate” indicates that erosion could be expected under ordinary climatic conditions.
b Wind erosion potential here is based on the wind erodibility group (WEG) designation: groups 1 and 2, high; groups 3 through 6, moderate; and groups 7 and 8, low (see footnote d for further explanation).
c To convert acres to km2, multiply by 0.004047. d WEGs are based on soil texture, content of organic matter, effervescence of carbonates, content of rock fragments, and mineralogy, and also take into
account soil moisture, surface cover, soil surface roughness, wind velocity and direction, and the length of unsheltered distance (USDA 2004). Groups range in value from 1 (most susceptible to wind erosion) to 8 (least susceptible to wind erosion). The NRCS provides a wind erodibility index, expressed as an erosion rate in tons per acre (4,000 m2) per year, for each of the wind erodibility groups: WEG 1, 220 tons (200 metric tons) per acre (4,000 m2) per year (average); WEG 2, 134 tons (122 metric tons) per acre (4,000 m2) per year; WEGs 3 and 4 (and 4L), 86 tons (78 metric tons) per acre (4,000 m2) per year; WEG 5, 56 tons (51 metric tons) per acre (4,000 m2) per year; WEG 6, 48 tons (44 metric tons) per acre (4,000 m2) per year; WEG 7, 38 tons (34 metric tons) per acre (4,000 m2) per year; and WEG 8, 0 tons (0 metric tons) per acre (4,000 m2) per year.
Source: NRCS (2010). 1 2
Fin
al S
ola
r PE
IS
8.1
-16
July 2
01
2
1
FIGURE 8.1.7.1-2 Soil Map for the Proposed Brenda SEZ as Revised (NRCS 2008) 2

Final Solar PEIS 8.1-17 July 2012
On the basis of impact analyses conducted for the Draft Solar PEIS, updates to those 1 analyses due to changes to the SEZ boundaries, and consideration of comments received as 2 applicable, no SEZ-specific design features were identified for soil resources at the proposed 3 Brenda SEZ as revised. Some SEZ-specific design features may be identified through the process 4 of preparing parcels for competitive offer and subsequent project-specific analysis. 5 6 7 8.1.8 Minerals (Fluids, Solids, and Geothermal Resources) 8 9 A mineral potential assessment for the proposed Brenda SEZ has been prepared and 10 reviewed by BLM mineral specialists knowledgeable about the region where the SEZ is located 11 (BLM 2012). The BLM is proposing to withdraw the SEZ from settlement, sale, location, or 12 entry under the general land laws, including the mining laws, for a period of 20 years (see 13 Section 2.2.2.2.4 of the Final Solar PEIS). The potential impacts of this withdrawal are discussed 14 in Section 8.1.24. 15 16 17
8.1.8.1 Affected Environment 18 19 There are no oil and gas leases, mining claims, or geothermal leases located within the 20 proposed Brenda SEZ. The description in the Draft Solar PEIS remains valid. 21 22 23
8.1.8.2 Impacts 24 25 There are no anticipated impacts on mineral resources from the development of solar 26 energy facilities in the proposed SEZ. The analysis of impacts on mineral resources in the Draft 27 Solar PEIS remains valid. 28 29 30
8.1.8.3 SEZ-Specific Design Features and Design Feature Effectiveness 31 32 Required programmatic design features that would reduce impacts on mineral resources 33 are described in Section A.2.2 of Appendix A of this Final Solar PEIS. Implementing the 34 programmatic design features will provide adequate protection of mineral resources. On the basis 35 of impact analyses conducted for the Draft Solar PEIS, updates to those analyses due to changes 36 to the SEZ boundaries, and consideration of comments received as applicable, no SEZ-specific 37 design features for minerals have been identified in this Final Solar PEIS. Some SEZ-specific 38 design features may be identified through the process of preparing parcels for competitive offer 39 and subsequent project-specific analysis. 40 41 42
Final Solar PEIS 8.1-18 July 2012
8.1.9 Water Resources 1 2 3
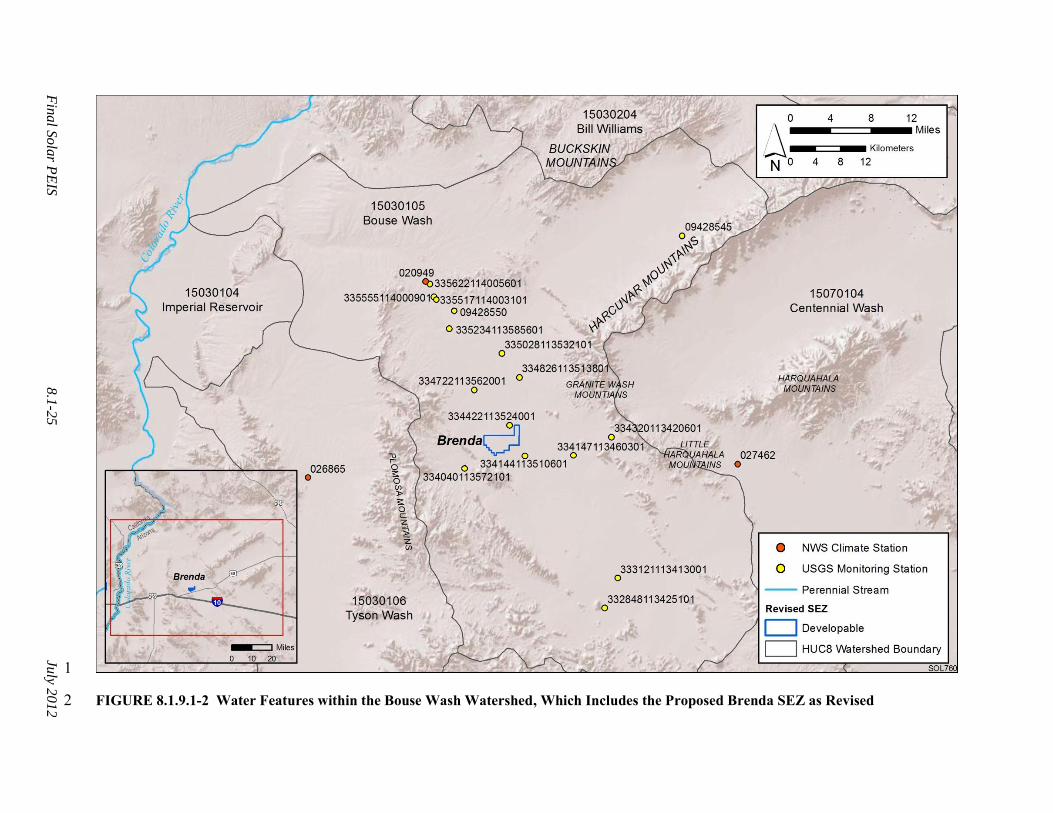
8.1.9.1 Affected Environment 4 5 The overall size of the Brenda SEZ has been reduced by 15% from the area described in 6 the Draft Solar PEIS, resulting in a total area of 3,348 acres (13.5 km2). The description of the 7 affected environment given in the Draft Solar PEIS relevant to water resources at the Brenda 8 SEZ remains valid and is summarized in the following paragraphs. 9 10 The proposed Brenda SEZ is located within the Lower Colorado hydrologic subregion of 11 the Lower Colorado hydrologic region. The valley region is known as the Ranegras Plain, a 12 desert valley nestled between mountain ranges to the east and west–southwest. Precipitation in 13 the valley is between 4 in./yr (10 cm/yr) and 8 in./yr (20 cm/yr), and evaporation is estimated to 14 be 115 in./yr (292 cm/yr). No perennial surface water features, flood hazards, or wetlands have 15 been identified within the Brenda SEZ. Bouse Wash and an unnamed intermittent/ephemeral 16 stream flow through portions of the eastern and western sides of the Brenda SEZ, and these 17 braided stream channel areas have been classified as non-development areas. The proposed SEZ 18 is located in the Ranegras Plain groundwater basin where available groundwater occurs primarily 19 in basin-fill deposits, with a general southeast to northwest flow pattern. Reported groundwater 20 recharge estimates range from 1,000 to 6,000 ac-ft/yr (1.2 million to 7.4 million m3/yr), which 21 primarily occurs through focused recharge in intermittent/ephemeral stream channels. 22 Groundwater surface elevations have declined over several decades resulting from agricultural 23 use, which has also resulted in land subsidence. Levels of total dissolved solids (TDS) and 24 fluoride in the basin are considered high, and both contaminants are often found present above 25 the secondary maximum contaminant level (MCL). In addition, concentrations of hexavalent 26 chromium, selenium, arsenic, and nitrate have all been recorded above the MCL. 27 28 The Arizona Department of Water Resources (ADWR) is responsible for water 29 conservation and distribution throughout the state and created guidelines in 2010 to manage 30 water for solar-generating facilities. While there are no surface water rights available in the 31 Ranegras Plains Basin, it is legal to pump groundwater without a permit; however, current 32 groundwater withdrawals exceed the estimated recharge of the basin. Between 2000 and 2005, 33 groundwater withdrawals from the Ranegras Plain Basin for agriculture averaged 28,800 ac-ft/yr 34 (35 million m3/yr) and for municipal water use averaged 400 ac-ft/yr (490,000 m3/yr). 35 36 In addition to the water resources information provided in the Draft Solar PEIS, this 37 section provides a planning-level inventory of available climate, surface water, and groundwater 38 monitoring stations within the immediate vicinity of the Brenda SEZ and surrounding basin. 39 Additional data regarding climate, surface water, and groundwater conditions are presented in 40 Tables 8.1.9.1-1 through 8.1.9.1-7 and in Figures 8.1.9.1-1 and 8.1.9.1-2. Fieldwork and 41 hydrologic analyses needed to determine 100-year floodplains and jurisdictional water bodies 42 would need to be coordinated with appropriate federal, state, and local agencies. Areas within the 43 Brenda SEZ that are found to be within a 100-year floodplain will be identified as non-44 development areas. Any water features within the Brenda SEZ determined to be jurisdictional 45 will be subject to the permitting process described in the Clean Water Act (CWA). 46

Final Solar PEIS 8.1-19 July 2012
TABLE 8.1.9.1-1 Watershed and Water Management Basin 1 Information Relevant to the Proposed Brenda SEZ as 2 Revised 3
Basin
Name
Area
(acres)b Subregion (HUC4)a Lower Colorado (1503) 12,016,053 Cataloging unit (HUC8) Bouse Wash (15030105) 1,048,871 Groundwater basin Rangegras Plain 583,680 SEZ Brenda 3,348 a HUC = Hydrologic Unit Code; a USGS system for
characterizing nested watersheds that includes large-scale subregions (HUC4) and small-scale cataloging units (HUC8).
b To convert acres to km2, multiply by 0.004047. 4 5
TABLE 8.1.9.1-2 Climate Station Information Relevant to the Proposed Brenda SEZ as 6 Revised 7
Climate Station (COOP IDa)
Elevationb (ft)c
Distance to SEZ (mi)d
Period of Record
Mean Annual Precipitation
(in.)e
Mean Annual
Snowfall (in.)
Bouse, Arizona (020949) 925 17 1932–2011 5.50 0.10 Quartzsite, Arizona (026865) 875 20 1908–2011 4.99 0.10 Salome 17 SE (027462) 1,599 23 1987–1998 6.31 0.00 a National Weather Service’s Cooperative Station Network station identification code. b Surface elevations for the proposed Brenda SEZ range from 1,110 to 1,235 ft. c To convert ft to m, multiply by 0.3048. d To convert mi to km, multiply by 1.6093. e To convert in. to cm, multiply by 2.540.
Source: NOAA (2012). 8 9
10
Final Solar PEIS 8.1-20 July 2012
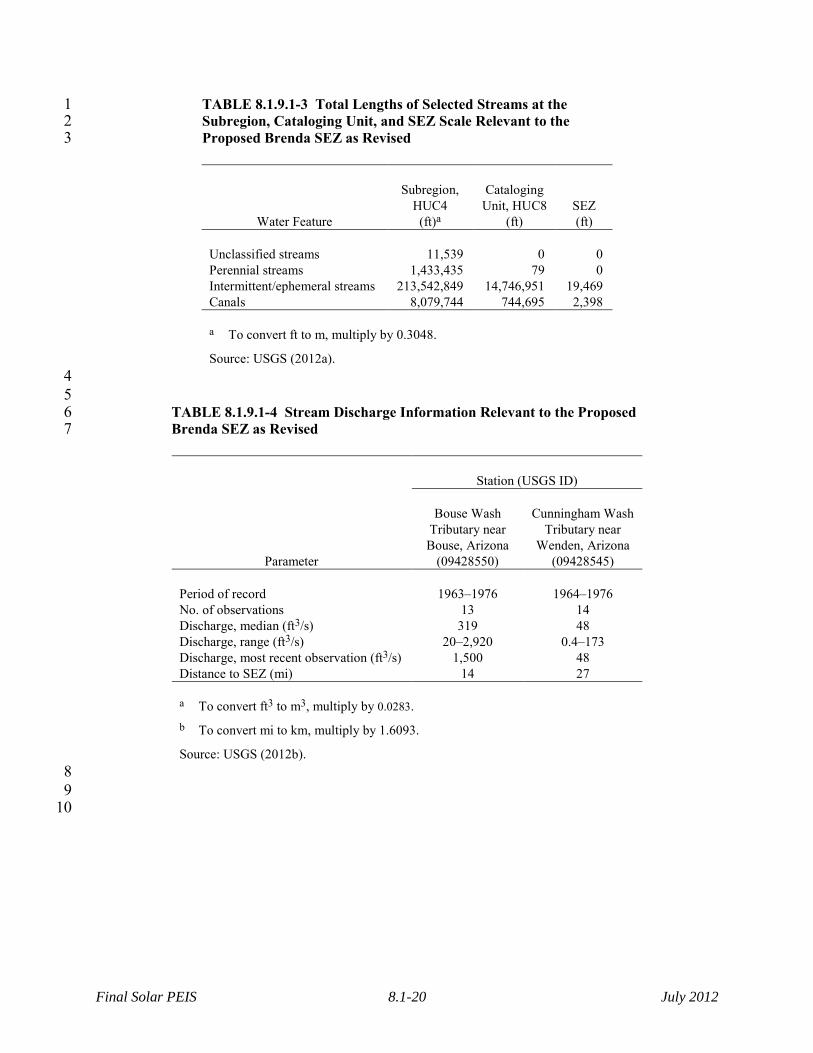
TABLE 8.1.9.1-3 Total Lengths of Selected Streams at the 1 Subregion, Cataloging Unit, and SEZ Scale Relevant to the 2 Proposed Brenda SEZ as Revised 3
Water Feature
Subregion,
HUC4 (ft)a
Cataloging
Unit, HUC8 (ft)
SEZ (ft)
Unclassified streams 11,539 0 0 Perennial streams 1,433,435 79 0 Intermittent/ephemeral streams 213,542,849 14,746,951 19,469 Canals 8,079,744 744,695 2,398 a To convert ft to m, multiply by 0.3048.
Source: USGS (2012a). 4 5
TABLE 8.1.9.1-4 Stream Discharge Information Relevant to the Proposed 6 Brenda SEZ as Revised 7
Station (USGS ID)
Parameter
Bouse Wash
Tributary near Bouse, Arizona
(09428550)
Cunningham Wash
Tributary near Wenden, Arizona
(09428545) Period of record 1963–1976 1964–1976 No. of observations 13 14 Discharge, median (ft3/s) 319 48 Discharge, range (ft3/s) 20–2,920 0.4–173 Discharge, most recent observation (ft3/s) 1,500 48 Distance to SEZ (mi) 14 27 a To convert ft3 to m3, multiply by 0.0283. b To convert mi to km, multiply by 1.6093.
Source: USGS (2012b). 8 9
10

Final Solar PEIS 8.1-21 July 2012
TABLE 8.1.9.1-5 Surface Water Quality Data Relevant to the Proposed Brenda SEZ as 1 Revised 2
Station (USGS ID)
Period of Record
No of
Records No water quality data are available for surface water stations in the SEZ’s HUC8. NAa NA a NA = no data collected for this parameter.
Source: USGS (2012b). 3 4
8.1.9.2 Impacts 5 6 7
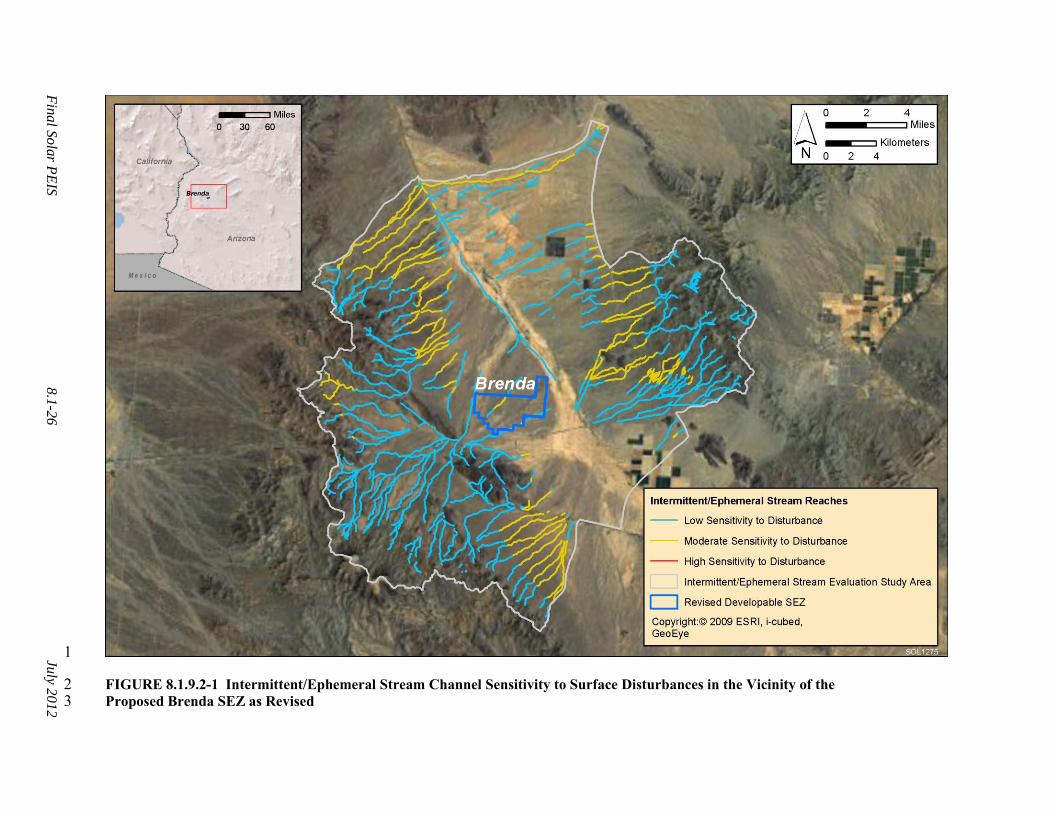
8.1.9.2.1 Land Disturbance Impacts on Water Resources 8 9 The discussion of land disturbance effects on water resources in the Draft Solar PEIS 10 remains valid. As stated in the Draft Solar PEIS, land disturbance impacts in the vicinity of the 11 proposed Brenda SEZ could potentially affect drainage patterns, along with groundwater 12 recharge and discharge properties. The alteration of natural drainage pathways during 13 construction can lead to impacts related to flooding, loss of water delivery to downstream 14 regions, and alterations to riparian vegetation and habitats. The alteration of the SEZ boundaries 15 to exclude Bouse Wash and another intermittent/ephemeral stream on the west side of the SEZ 16 reduces the potential for adverse impacts associated with land disturbance activities. 17 18 Land clearing, land leveling, and vegetation removal during the development of the SEZ 19 have the potential to disrupt intermittent/ephemeral stream channels. Several programmatic 20 design features described in Section A.2.2 of Appendix A of this Final Solar PEIS would avoid, 21 minimize, and/or mitigate impacts associated with the disruption of intermittent/ephemeral water 22 features. Additional analyses of intermittent/ephemeral streams are presented in this update, 23 including an evaluation of functional aspects of stream channels with respect to groundwater 24 recharge, flood conveyance, sediment transport, geomorphology, and ecological habitats. Only a 25 summary of the results from these surface water analyses is presented in this section; more 26 information on methods and results is presented in Appendix O. 27 28 The study region considered for the intermittent/ephemeral stream evaluation relevant to 29 the Brenda SEZ is a subset of the Bouse Wash watershed (HUC8), for which information 30 regarding stream channels is presented in Tables 8.1.9.1-3 and 8.1.9.1-4 of this Final Solar PEIS. 31 The results of the intermittent/ephemeral stream evaluation are shown in Figure 8.1.9.2-1, which 32 depicts flow lines from the National Hydrography Dataset (USGS 2012a) labeled as low, 33 moderate, and high sensitivity to land disturbance. Within the study area, 69% of the 34 intermittent/ephemeral stream channels had low sensitivity, and 31% had moderate sensitivity to 35 land disturbance. One intermittent/ephemeral channel reach within the Brenda SEZ was 36 classified with moderate sensitivity to land disturbance (Figure 8.1.9.2-1). 37 38

Fin
al S
ola
r PE
IS
8.1
-22
July 2
012
TABLE 8.1.9.1-6 Water Quality Data from Groundwater Samples Relevant to the Proposed Brenda SEZ as Revised 1
Station (USGS ID)a
Parameter
334040113572101
334147113460301
334320113420601
334722113562001
334826113513801
335028113532101
335234113585601
335517114003101
Period of record 1948–1999 1986–1999 1974–1999 1946–1989 1990–2000 1967–1985 1974–1980 1958–1965 No. of records 12 4 5 7 10 4 4 4 Temperature (°C)b 30.5 (21.5–32) 31.75 (31–32) 32 (28–33) 29 (28.7–29.5) 27 (26.5–28) 27 (26–30) 25.5 (25–26) 26.7 (26.5–26.7) Total dissolved solids (mg/L) 396 (380–443) 1,224.5
(978–2,110) 279 (277–280) 825.5 (758–847) 2,730
(1,630–5,130) 2,780
(1,020–4,260) 424.5 (373–477) 914
Dissolved oxygen (mg/L) 6.15 (5.4–7.3) 4 (3.9–4.2) 5 (4.6–5.2) 5.1 2.05 (0.8–3.3) 4.9 NA NA pH 7.95 (7.8–8.0) 8.2 (7.8–8.3) 8.55 (8.5–8.6) 7.65 (7.4–8) 7.7 (7.6–8) 7.7 (6.7–8) 7.2 (7–7.4) 6.85 (6.5–7.2) Nitrate + nitrite (mg/L as N) 5.2 (3.4–7.07) 8.4 (5.8–13.1) 2 (1.9–2.08) 4.9 (4.4–5) 6.85 (5.67–24) 14 (4.5–19) 6.5 (4.8–8.2) NA Phosphate (mg/L) 0.043
(<0.031–0.123) <0.031 <0.031
(0–<0.031) <0.031
(0–<0.031) <0.031
(<0.031–0.037) 0.03
(<0.031–0.03) 0.015
(0–0.03) NA
Organic carbon (mg/L) NAc NA NA NA NA NA NA NA Calcium (mg/L) 15 (13–16.4) 81.5 (48–176) 4.34 (3.9–4.7) 44.5 (42–47) 140.5 (71–344) 112.5 (50–340) 57 (52–62) 59 (58–60) Magnesium (mg/L) 13 (12–15) 2.94 (1.8–7.75) 0.42 (0.3–0.51) 6.55 (6.4–8.6) 30.4 (14–72) 27 (12–80) 8.3 (7.8–8.8) 7.9 (3.8–186) Sodium (mg/L) 110 (100–123) 330 (280–507) 96.6 (92–97) 230 (220–230) 712 (470–1,210) 610 (270–950) 75 (65–85) NA Chloride (mg/L) 24 (17–34) 355.5 (240–508) 31.7 (30–33) 230 (206–240) 510 (340–1,200) 425 (220–800) 49.5 (18–81) 193 (179–200) Sulfate (mg/L) 13.5 (8.17–27) 347.5 (290–777) 43 (40.8–47) 227 (200–230) 1,175 (580–2,100) 765 (320–1,900) 5.15 (3.5–6.8) 340 (328–380) Arsenic (µg/L) 6 (5–7) 34 (30–36) 15 (13–16) 32 (28–36) 0.5 (<1–1) 12 8 NA Fluoride (mg/L) 0.4 (0.2–0.5) 7.22
(< 0.10–8.6) 0.84 (0.5–0.9) 4.7 (4.3–5.2) 4.46 (2.8–7) 4.7 (4–4.9) 0.95 (0.8–1.1) 4.85 (4.5–5)
Hexavalent chromium (µg/L) 19.5 (7–23) 14.5 (< 1–28) 20 (16–24) 28.5 (12–45) <1 23.5 (5–42) 0 NA a Median values are listed; the range in values is shown in parentheses. b To convert °C to °F, multiply by 1.8, then add 32. c NA = no data collected for this parameter.
Source: USGS (2012b). 2 3
4

Fin
al S
ola
r PE
IS
8.1
-23
July 2
012
TABLE 8.1.9.1-7 Groundwater Surface Elevations Relevant to the Proposed Brenda SEZ as Revised 1
Station (USGS ID)
Parameter
332848113425101
333121113413001
334144113510601
334422113524001
335555114000901
335622114005601
Period of record 1963–1998 1965–2006 1948–1993 1967–2006 1983–1993 1945–1991 No. of observations 6 26 5 22 13 49 Surface elevation (ft)a 1,438 1,350 1,129 1,123 955 925 Well depth (ft) 350 455 1,005 1,459 130 176 Depth to water, median (ft) 241.2 337.5 130.9 154.5 71.3 36.6 Depth to water, range (ft) 228–333 330–343.7 128–132.1 146.05–158.7 67.5–71.6 26.92–51.95 Depth to water, most recent observation (ft) 238.5 343.6 132.1 158.7 71.6 49.5 Distance to SEZ (mi)b 19 17 3 2 16 17 a To convert ft to m, multiply by 0.3048. b To convert mi to km, multiply by 1.6093.
Source: USGS (2012b). 2 3

Fin
al S
ola
r PE
IS
8.1
-24
July 2
012
1
FIGURE 8.1.9.1-1 Water Features near the Proposed Brenda SEZ as Revised 2
Fin
al S
ola
r PE
IS
8.1
-25
July 2
012
1
FIGURE 8.1.9.1-2 Water Features within the Bouse Wash Watershed, Which Includes the Proposed Brenda SEZ as Revised 2
Fin
al S
ola
r PE
IS
8.1
-26
July 2
012
1
FIGURE 8.1.9.2-1 Intermittent/Ephemeral Stream Channel Sensitivity to Surface Disturbances in the Vicinity of the 2 Proposed Brenda SEZ as Revised 3

Final Solar PEIS 8.1-27 July 2012
8.1.9.2.2 Water Use Requirements for Solar Energy Technologies 1 2 Changes in the Brenda SEZ boundaries resulted in changes to the estimated water use 3 requirements and a reduction in the land affected by surface disturbances. This section presents 4 changes in water use estimates for the reduced SEZ area and additional analyses pertaining to 5 groundwater. The additional analyses of groundwater include a basin-scale groundwater budget 6 and a simplified, one-dimensional groundwater model of potential groundwater drawdown. Only 7 a summary of the results from these groundwater analyses is presented in this section; more 8 information on methods and results is presented in Appendix O. 9 10 Table 8.1.9.2-1 presents the revised estimates of water requirements for both construction 11 and operation of solar facilities at the Brenda SEZ, assuming full build-out of the SEZ and 12 accounting for its decreased size. A basin-scale groundwater budget was assembled using 13 available data on groundwater inputs, outputs, and storage, with results presented in 14 Table 8.1.9.2-2. 15 16 The estimated total water use requirements during the peak construction year are as high 17 as 1,758 ac-ft/yr (2.2 million m3/yr), which is potentially greater than the average annual 18 recharge to the basin but constitutes a minor portion of current groundwater withdrawals and 19 estimated groundwater storage in the Ranegras Plain basin. Given the short duration of 20 construction activities, the water use estimate for construction is not a primary concern to water 21 resources in the basin. The long duration of groundwater pumping during operations (20 years) 22 poses a greater threat to groundwater resources. This analysis considered low, medium, and 23 high groundwater pumping scenarios that represent full build-out of the SEZ, assuming PV, 24 dry-cooled parabolic trough, and wet-cooled parabolic trough, respectively (a 30% operational 25 time was considered for all solar facility types on the basis of operations estimates for proposed 26 utility-scale solar energy facilities). The low, medium, and high pumping scenarios result in 27 groundwater withdrawals that range from 15 to 2,687 ac-ft/yr (18,500 to 3.3 million m3/yr), or 28 300 to 53,750 ac-ft (370,000 to 66.3 million m3) over the 20-year operational period. From a 29 groundwater budgeting perspective, the high pumping scenario would represent 76% of the low-30 end estimate of total annual groundwater inputs to the basin and 1% of the estimated 31 groundwater storage over the 20-year operational period. However, given the current imbalance 32 between groundwater inputs and outputs (Table 8.1.9.2-2), this groundwater withdrawal rate 33 could potentially result in a 5% decrease in the estimated aquifer storage over the 20-year 34 operational period. The low and medium pumping scenarios have annual withdrawals that 35 represent less than 1% and 11%, respectively, of the low estimate of groundwater inputs to the 36 basin (Table 8.1.9.2-2), which are more in the realm of suitable recharge-based sustainable yield 37 estimates, although sustainable yield estimates based solely on recharge are typically not 38 recommended (Zhou 2009). 39 40 Groundwater budgeting allows for quantification of complex groundwater processes 41 at the basin scale, but it ignores the temporal and spatial components of how groundwater 42 withdrawals affect groundwater surface elevations, groundwater flow rates, and connectivity 43 to surface water features such as streams, wetlands, playas, and riparian vegetation. A 44 45 46

Final Solar PEIS 8.1-28 July 2012
TABLE 8.1.9.2-1 Estimated Water Requirements for the Proposed Brenda SEZ as 1 Reviseda 2
Activity
Parabolic Trough
Power Tower
Dish Engine
PV Construction—Peak Year Water use requirements Fugitive dust control (ac-ft)b 1,313 1,758 1,758 1,758 Potable supply for workforce (ac-ft) 74 40 17 8 Total water use requirements (ac-ft) 1,387 1,798 1,775 1,766 Wastewater generated Sanitary wastewater (ac-ft) 74 40 17 8 Operations Water use requirements Mirror/panel washing (ac-ft/yr) 268 149 149 15 Potable supply for workforce (ac-ft/yr) 8 3 3 <1 Dry cooling (ac-ft/yr) 107–536 60–298 NA NA Wet cooling (ac-ft/yr) 2,411–7,767 1,339–4,315 NA NA Total water use requirements Non-cooled technologies (ac-ft/yr) NAc NA 152 15 Dry-cooled technologies (ac-ft/yr) 383–812 212–450 NA NA Wet-cooled technologies (ac-ft/yr) 2,687–8,043 1,491–4,467 NA NA Wastewater generated Blowdown (ac-ft/yr) 152 85 NA NA Sanitary wastewater (ac-ft/yr) 8 2 3 <1 a See Section M.9.2 of Appendix M of the Draft Solar PEIS for methods used in estimating water
use requirements. b To convert ac-ft to m3, multiply by 1,234. c NA = not applicable.
3 4 one dimensional groundwater modeling analysis was performed to present a simplified depiction 5 of the spatial and temporal effects of groundwater withdrawals by examining groundwater 6 drawdown in a radial direction around the center of the SEZ for the low, medium, and high 7 pumping scenarios. A detailed discussion of the groundwater modeling analysis is presented 8 in Appendix O. It should be noted, however, that the aquifer parameters used for the 9 one-dimensional groundwater model (Table 8.1.9.2-3) represent available literature data and that 10 the model aggregates these value ranges into a simplistic representation of the aquifer. 11 12 Currently, the depth to groundwater ranges between 160 and 240 ft (49 and 73 m) in the 13 vicinity of the SEZ. The modeling results suggest that groundwater withdrawals for solar energy 14 development would result in groundwater drawdown in the vicinity of the SEZ (approximately a 15

Final Solar PEIS 8.1-29 July 2012
TABLE 8.1.9.2-2 Groundwater Budget for the Ranegras 1 Plain Groundwater Basin, Which Includes the Proposed 2 Brenda SEZ as Revised 3
Process
Amount
Inputs
Groundwater recharge (ac-ft/yr)a,b 400–5,500 Underflow from Butler Valley (ac-ft/yr) 300 Irrigation return flow (ac-ft/yr) 2,800
Outputs
Underflow to Bouse Wash (ac-ft/yr) 860 Irrigation withdrawals (ac-ft/yr) 27,500 Public withdrawals (ac-ft/yr) 400 Evapotranspiration (ac-ft/yr) 800–1,300
Storage
Aquifer storage (ac-ft)c 9,000,000–27,000,000 a Groundwater recharge includes mountain front,
intermittent/ephemeral channel seepage, and direct infiltration recharge processes.
b To convert ac-ft to m3, multiply by 1,234. c Source: ADWR (2011).
Source: Tillman et al. (2011). 4 5 2-mi [3.2-km] radius) that ranges from 15 to 75 ft (4.6 to 23 m) for the high pumping scenario, 6 3 to 10 ft (1 to 3 m) for the medium pumping scenario, and less than 1 ft (0.3 m) for the low 7 pumping scenario (Figure 8.1.9.2-2). The modeled groundwater drawdown for the high pumping 8 scenario suggests a potential for 10 ft (3 m) of drawdown at a distance of 3 mi (5 km) from the 9 center of the SEZ, which could impair groundwater-surface water connectivity via infiltration 10 processes during channel inundation, along with alterations to the riparian vegetation along 11 Bouse Wash and the unnamed intermittent/ephemeral stream along the western edge of the SEZ. 12 13 14
8.1.9.2.3 Off-Site Impacts: Roads and Transmission Lines 15 16 As stated in the Draft Solar PEIS, impacts associated with the construction of roads 17 and transmission lines primarily deal with water use demands for construction, water quality 18 concerns relating to potential chemical spills, and land disturbance effects on the natural 19 hydrology. Water needed for transmission line construction activities (e.g., for soil compaction, 20 dust suppression, and potable supply for workers) could be trucked to the construction area from 21

Final Solar PEIS 8.1-30 July 2012
TABLE 8.1.9.2-3 Aquifer Characteristics and 1 Assumptions Used in the One-Dimensional 2 Groundwater Model for the Proposed Brenda SEZ as 3 Revised 4
Parameter
Valuea
Aquifer type/conditions Basin fill/unconfined Aquifer thickness (ft)b,c 1,100–1,493
(1,493) Hydraulic conductivity (ft/day)d 0.1–43
(3.5) Transmissivity (ft2/day)d 1,000–41,000
(5,225) Storage coefficientd 0.05–0.15
(0.05) Analysis period (yr) 20 High pumping scenario (ac-ft/yr)e 2,687 Medium pumping scenario (ac-ft/yr)f 383 Low pumping scenario (ac-ft/yr)g 15 a Values used for the model are in parentheses. b See Metzger (1951) and Johnson (1990). c To convert ft to m, multiply by 0.3048. d See Anderson and Freethey (1995). e To convert ac-ft to m3, multiply by 1,234. f Equivalent to full build-out water use requirements for
wet-cooled, parabolic trough, and a 30% operational time. g Equivalent to full build-out water use requirements for
dry-cooled, parabolic trough, and a 30% operational time. h Equivalent to full build-out water use requirements for PV.
5 6 an off-site source. If this occurred, water use impacts at the SEZ would be negligible. The Draft 7 Solar PEIS assessment of impacts on water resources from road and transmission line 8 construction remains valid. 9 10 11
8.1.9.2.4 Summary of Impacts on Water Resources 12 13 The additional information and analyses of water resources presented in this update agree 14 with the information provided in the Draft Solar PEIS, which indicates that the Brenda SEZ is 15 located in a desert valley with predominately intermittent/ephemeral surface water features and 16 groundwater in a basin-fill aquifer. Historical groundwater use in the region has led to 17 groundwater declines ranging from 25 to 146 ft (7.6 to 44 m) from 1946 to 2006, along with land 18 subsidence of 1.9 in. (5 cm) that occurred between 2004 and 2010. These baseline conditions 19 suggest that water resources are scarce in the vicinity of the Brenda SEZ, and that the primary 20

Final Solar PEIS 8.1-31 July 2012
1
FIGURE 8.1.9.2-2 Estimated One-Dimensional Groundwater Drawdown Resulting from 2 High, Medium, and Low Groundwater Pumping Scenarios over the 20-Year Operational 3 Period at the Proposed Brenda SEZ as Revised 4
5 6 potential for impacts resulting from solar energy development comes from surface disturbances 7 and groundwater use. 8 9 The change in boundaries of the Brenda SEZ resulted in a decrease in total water demand 10 by approximately 15% for all technologies (Table 8.1.9.2-1), and the areas excluded from the 11 SEZ contain portions of Bouse Wash along the northeastern edge of the SEZ and an unnamed 12 wash along the western edge of the SEZ. These changes in the SEZ boundaries have reduced 13 potential impacts associated with groundwater withdrawals and surface disturbance on surface 14 water features. 15 16 Disturbance to intermittent/ephemeral stream channels within the Brenda SEZ should not 17 pose a significant impact on the critical functions of groundwater recharge, sediment transport, 18 flood conveyance, and ecological habit given the relatively small footprint of the Brenda SEZ 19 with respect to the study area, along with the sensitivity of identified intermittent/ephemeral 20 streams. The proposed water use for full build-out scenarios at the Brenda SEZ indicate that the 21 low and medium pumping scenarios are preferable, given that the high pumping scenario has the 22 potential to greatly affect both the annual and long-term groundwater budget, and that the high 23 pumping scenario may impair potential groundwater-surface water connectivity in Bouse Wash 24 and the unnamed intermittent/ephemeral stream along the western edge of the SEZ. 25 26
Predicting impacts associated with groundwater withdrawals in desert regions is often 27 difficult given the heterogeneity of aquifer characteristics, the long time period between the onset 28

Final Solar PEIS 8.1-32 July 2012
of pumping and its effects, and limited data. One of the primary mitigation measures to protect 1 water resources is the implementation of long-term monitoring and adaptive management (see 2 Section A.2.4 of Appendix A). For groundwater, this requires the combination of monitoring and 3 modeling to fully identify the temporal and spatial extent of potential impacts. The BLM is 4 currently working on the development of a more detailed numerical groundwater model for the 5 Brenda SEZ, which would more accurately predict potential impacts on surface water features 6 and groundwater drawdown. This modeling framework can also be used to interpret groundwater 7 monitoring data and guide adaptive management plans. When the detailed model is completed, it 8 will be made available through the project Web site (http://solareis.anl.gov) for use by 9 applicants, the BLM, and other stakeholders. 10 11 12
8.1.9.3 SEZ-Specific Design Features and Design Feature Effectiveness 13 14 Required programmatic design features that would reduce impacts on surface water 15 and groundwater are described in Section A.2.2 of Appendix A of this Final Solar PEIS. 16 Implementing the programmatic design features will provide some protection of and reduce 17 impacts on water resources. 18 19 On the basis of impact analyses conducted for the Draft Solar PEIS, updates to those 20 analyses due to changes to the SEZ boundaries, and consideration of comments received as 21 applicable, the following SEZ-specific design feature has been identified: 22 23
• Groundwater analyses suggest that full build-out of wet-cooled technologies is 24 not feasible; for mixed-technology development scenarios, any proposed wet-25 cooled projects should utilize water conservation practices. 26
27 The need for additional SEZ-specific design features will be identified through the 28 process of preparing parcels for competitive offer and subsequent project-specific analysis. 29 30 31 8.1.10 Vegetation 32 33 34
8.1.10.1 Affected Environment 35 36 Revisions to the boundaries of the proposed Brenda SEZ have eliminated the Bouse 37 Wash area on the east side and the area to the west of the county road on the west side from the 38 SEZ. In addition, the assumed transmission line was removed from consideration. 39 40 As presented in the Draft Solar PEIS, four cover types were identified within the area of 41 the proposed Brenda SEZ, while nine cover types were identified in the area of indirect effects, 42 including the previously assumed transmission line corridor and within 5 mi (8 km) of the SEZ 43 boundary. For this updated assessment, a specifically located hypothetical transmission line is no 44 longer being assumed (see Section 8.1.23 for an updated transmission assessment for this SEZ). 45 Sensitive habitats on the SEZ include desert dry wash and dry wash woodland. Characteristic 46

Final Solar PEIS 8.1-33 July 2012
Sonoran Desert species observed on the SEZ include creosotebush, saguaro cactus, palo verde, 1 ironwood, acacia, and ocotillo. Because of the change in SEZ boundaries, the Agriculture and 2 Sonora-Mojave Mixed Salt Desert Scrub cover types no longer occur within the SEZ. 3 Figure 8.1.10.1-1 shows the cover types within the affected area of the Brenda SEZ as revised. 4 5 6
8.1.10.2 Impacts 7 8 As presented in the Draft Solar PEIS, the construction of solar energy facilities within the 9 proposed Brenda SEZ would result in direct impacts on plant communities because of the 10 removal of vegetation within the facility footprint during land-clearing and land-grading 11 operations. Approximately 80% of the SEZ would be expected to be cleared with full 12 development of the SEZ. As a result of the change in boundaries of the proposed SEZ, 13 approximately 2,678 acres (10.8 km2) would be cleared. 14 15 Overall impact magnitude categories were based on professional judgment and include 16 (1) small: a relatively small proportion ( 1%) of the cover type within the SEZ region would be 17 lost; (2) moderate: an intermediate proportion (>1 but 10%) of a cover type would be lost; 18 (3) large: >10% of a cover type would be lost. 19 20 21
8.1.10.2.1 Impacts on Native Species 22 23 The analysis presented in the Draft Solar PEIS based on the original Brenda SEZ 24 developable area indicated that development would result in a small impact on all land cover 25 types occurring within the SEZ (Table 8.1.10.1-1 in the Draft Solar PEIS). Development within 26 the revised Brenda SEZ could still directly affect some of the cover types evaluated in the Draft 27 Solar PEIS, with the exception of Agriculture and Sonora-Mojave Mixed Salt Desert Scrub. The 28 small reduction in the developable area would result in reduced impact levels on these cover 29 types in the affected area; however, the impact magnitudes would remain unchanged compared 30 to original estimates in the Draft Solar PEIS. 31 32 With the change in SEZ boundaries and the change in transmission analysis, direct 33 impacts on Bouse Wash or the previously identified hypothetical transmission corridor are no 34 longer predicted. However, direct impacts on dry washes, dry wash woodland, ironwood 35 (including those outside of washes) could still occur. Indirect impacts on habitats associated with 36 washes or chenopod scrub habitats within or near the SEZ, as described in the Draft Solar PEIS, 37 could also occur. Groundwater use within the SEZ could affect groundwater-dependent 38 communities, such as mesquite bosque communities and microphyll (palo verde/ironwood) 39 woodland communities (including ironwood and palo verde located outside of washes). 40 41 42 43

Fin
al S
ola
r PE
IS
8.1
-34
July 2
012
1
FIGURE 8.1.10.1-1 Land Cover Types within the Proposed Brenda SEZ as Revised 2

Final Solar PEIS 8.1-35 July 2012
8.1.10.2.2 Impacts from Noxious Weeds and Invasive Plant Species 1 2 As presented the Draft Solar PEIS, land disturbance from project activities and indirect 3 effects of construction and operation within the Brenda SEZ could potentially result in the 4 establishment or expansion of noxious weeds and invasive species populations, potentially 5 including those species listed in Section 8.1.10.1 of the Draft Solar PEIS. Impacts such as 6 reduced restoration success and possible widespread habitat degradation could still occur; 7 however, a small reduction in the potential for such impacts would result from the reduced 8 developable area of the SEZ. 9 10 11
8.1.10.3 SEZ-Specific Design Features and Design Feature Effectiveness 12 13 Required programmatic design features are described in Section A.2.2 of Appendix A of 14 this Final Solar PEIS. SEZ-specific species and habitats will determine how programmatic 15 design features are applied, for example: 16 17
• All dry wash, dry wash woodland, saguaro cactus, and ironwood (including 18 those outside of washes) communities within the SEZ shall be avoided to the 19 extent practicable, and any impacts minimized and mitigated in consultation 20 with appropriate agencies. A buffer area should be maintained around dry 21 washes and dry wash woodland habitats to reduce the potential for impacts. 22
23 • Appropriate engineering controls shall be used to minimize impacts on dry 24
wash, dry wash woodland, and chenopod scrub, including downstream 25 occurrences, resulting from surface water runoff, erosion, sedimentation, 26 altered hydrology, accidental spills, or fugitive dust deposition to these 27 habitats. Appropriate buffers and engineering controls will be determined 28 through agency consultation. 29
30 • Groundwater withdrawals shall be limited to reduce the potential for indirect 31
impacts on groundwater-dependent communities, such as mesquite bosque 32 communities, and microphyll (palo verde/ironwood) communities. 33
34 It is anticipated that implementation of these programmatic design features will reduce a 35 high potential for impacts from invasive species and impacts on dry wash, dry wash woodland, 36 mesquite bosque, and saguaro cactus communities to a minimal potential for impact. Residual 37 impacts on groundwater-dependent habitats could result from limited groundwater withdrawal 38 and the like; however, it is anticipated that these impacts would be avoided in the majority 39 of instances. 40 41 On the basis of impact analyses conducted for the Draft Solar PEIS, updates to those 42 analyses due to changes to the SEZ boundaries, and consideration of comments received as 43 applicable, no SEZ-specific design features for vegetation have been identified. Some 44 SEZ-specific design features may be identified through the process of preparing parcels 45 for competitive offer and subsequent project-specific analysis. 46
Final Solar PEIS 8.1-36 July 2012
8.1.11 Wildlife and Aquatic Biota 1 2 For the assessment of potential impacts on wildlife and aquatic biota, overall impact 3 magnitude categories were based on professional judgment and include (1) small: a relatively 4 small proportion ( 1%) of the species’ habitat within the SEZ region would be lost; 5 (2) moderate: an intermediate proportion (>1 but 10%) of the species’ habitat would be lost; 6 and (3) large: >10% of the species’ habitat would be lost. 7 8 9
8.1.11.1 Amphibians and Reptiles 10 11 12
8.1.11.1.1 Affected Environment 13 14 As presented in the Draft Solar PEIS, representative amphibian and reptile species 15 expected to occur within the Brenda SEZ include the Great Basin spadefoot (Spea 16 intermontana), red-spotted toad (Bufo punctatus), desert horned lizard (Phrynosoma 17 platyrhinos), Great Basin collared lizard (Crotaphytus bicinctores), side-blotched lizard (Uta 18 stansburiana), western whiptail (Cnemidophorus tigris), zebra-tailed lizard (Callisaurus 19 draconoides), coachwhip (Masticophis flagellum), common kingsnake (Lampropeltis gentula), 20 glossy snake (Arizona elegans), gophersnake (Pituophis catenifer), groundsnake (Sonora 21 semiannulata), and nightsnake (Hypsiglena torquata). The Mohave rattlesnake (Crotalus 22 scutulatus), sidewinder (C. cerastes), and western diamond-backed rattlesnake (C. atrox) would 23 be the most common poisonous snake species expected to occur on the SEZ. The reduction in 24 size of the Brenda SEZ does not alter the potential for these species to occur in the affected area. 25 26 27
8.1.11.1.2 Impacts 28 29 As presented in the Draft Solar PEIS, solar energy development within the Brenda SEZ 30 could affect potentially suitable habitats for the representative amphibian and reptile species. 31 The analysis presented in the Draft Solar PEIS for the original Brenda SEZ indicated that 32 development would result in a small overall impact on the representative amphibian and reptile 33 species (Table 8.1.11.1-1 in the Draft Solar PEIS). The reduction in size of the Brenda SEZ 34 would result in reduced habitat impacts for all representative amphibian and reptile species; the 35 resultant impact levels for all the representative species would be small. 36 37 38
8.1.11.1.3 SEZ-Specific Design Features and Design Feature Effectiveness 39 40 Required programmatic design features are described in Section A.2.2 of Appendix A 41 of this Final Solar PEIS. With the implementation of required programmatic design features, 42 impacts on amphibian and reptile species are anticipated to be small. 43 44 Because of the change in the SEZ boundaries, the SEZ-specific design feature identified 45 in the Draft Solar PEIS (i.e., Bouse Wash should be avoided) is no longer applicable. On the 46

Final Solar PEIS 8.1-37 July 2012
basis of impact analyses conducted for the Draft Solar PEIS, updates to those analyses due to 1 changes to the SEZ boundaries, and consideration of comments received as applicable, no SEZ-2 specific design features for amphibian and reptile species have been identified. Some SEZ-3 specific design features may be identified through the process of preparing parcels for 4 competitive offer and subsequent project-specific analysis. 5 6 7
8.1.11.2 Birds 8 9 10
8.1.11.2.1 Affected Environment 11 12 As presented in the Draft Solar PEIS, a large number of bird species could occur or have 13 potentially suitable habitat within the affected area of the proposed Brenda SEZ. Representative 14 bird species identified in the Draft Solar PEIS included (1) shorebirds: killdeer (Charadrius 15 vociferus); (2) passerines: ash-throated flycatcher (Myiarchus cinerascens), black-tailed 16 gnatcatcher (Polioptila melanura), black-throated sparrow (Amphispiza bilineata), Brewer’s 17 sparrow (Spizella breweri), cactus wren (Campylorhynchus brunneicapillus), common poorwill 18 (Phalaenoptilus nuttallii), common raven (Corvus corax), Costa’s hummingbird (Calypte 19 costae), Gila woodpecker (Melanerpes uropygialis), greater roadrunner (Geococcyx 20 californianus), horned lark (Eremophila alpestris), ladder-backed woodpecker (Picoides 21 scalaris), Le Conte’s thrasher (Toxostoma lecontei), lesser nighthawk (Chordeiles acutipennis), 22 loggerhead shrike (Lanius ludovicianus), Lucy’s warbler (Vermivora luciae), phainopepla 23 (Phainopepla nitens), Say’s phoebe (Sayornis saya), and verdin (Auriparus flaviceps); 24 (3) raptors: American kestrel (Falco sparverius), golden eagle (Aquila chrysaetos), prairie falcon 25 (Falco mexicanus), red-tailed hawk (Buteo jamaicensis), and turkey vulture (Cathartes aura); 26 and (4) upland gamebirds: Gambel’s quail (Callipepla gambelii), mourning dove (Zenaida 27 macroura), and white-winged dove (Zenaida asiatica). The reduction in size of the Brenda SEZ 28 does not alter the potential for these species or other bird species to occur in the affected area. 29 30 31
8.1.11.2.2 Impacts 32 33 Solar energy development within the Brenda SEZ could affect potentially suitable bird 34 habitats. The analysis presented in the Draft Solar PEIS indicated that development would result 35 in a small overall impact on the representative bird species (Table 8.1.11.2-1 in the Draft Solar 36 PEIS). The reduction in size of the Brenda SEZ would result in reduced habitat impacts for all 37 representative bird species; the resultant impact levels for all the representative bird species 38 would be small. 39 40 41
8.1.11.2.3 SEZ-Specific Design Features and Design Feature Effectiveness 42 43 Required programmatic design features are described in Section A.2.2 of Appendix A 44 of this Final Solar PEIS. With the implementation of required programmatic design features, 45 impacts on bird species are anticipated to be small. 46

Final Solar PEIS 8.1-38 July 2012
Because of the change in the SEZ boundaries, one of the SEZ-specific design features 1 identified in the Draft Solar PEIS (i.e., Bouse Wash shall be avoided) is no longer applicable. On 2 the basis of impact analyses conducted for the Draft Solar PEIS, updates to those analyses due to 3 changes to the SEZ boundaries, and consideration of comments received as applicable, no SEZ-4 specific design features have been identified for birds. Some SEZ-specific design features may 5 be identified through the process of preparing parcels for competitive offer and subsequent 6 project-specific analysis. 7 8 9
8.1.11.3 Mammals 10 11 12
8.1.11.3.1 Affected Environment 13 14 As presented in the Draft Solar PEIS, a large number of mammal species were identified 15 that could occur or have potentially suitable habitat within the affected area of the proposed 16 Brenda SEZ. Representative mammal species identified in the Draft Solar PEIS included (1) big 17 game species: cougar (Puma concolor) and mule deer (Odocoileus hemionus); (2) furbearers and 18 small game species: the American badger (Taxidea taxus), black-tailed jackrabbit (Lepus 19 californicus), bobcat (Lynx rufus), coyote (Canis latrans), desert cottontail (Sylvilagus 20 audubonii), gray fox (Urocyon cinereoargenteus), javelina or collared peccary (Pecari tajacu), 21 kit fox (Vulpes macrotis), ringtail (Bassariscus astutus), and striped skunk (Mephitis mephitis); 22 and (3) small nongame species: Arizona pocket mouse (Perognathus amplus), Botta’s pocket 23 gopher (Thomomys bottae), cactus mouse (Peromyscus eremicus), canyon mouse (P. crinitis), 24 deer mouse (P. maniculatus), desert pocket mouse (Chaetodipus penicillatus), desert shrew 25 (Notiosorex crawfordi), desert woodrat (Neotoma lepida), Merriam’s pocket mouse (Dipodomys 26 merriami), round-tailed ground squirrel (Spermophilus tereticaudus), southern grasshopper 27 mouse (Onychomys torridus), and white-tailed antelope squirrel (Ammospermophilus leucurus). 28 Bat species that may occur within the area of the SEZ include the big brown bat (Eptesicus 29 fuscus), Brazilian free-tailed bat (Tadarida brasiliensis), California myotis (Myotis californicus), 30 silver-haired bat (Lasionycteris noctivagans), spotted bat (Euderma maculatum), and western 31 pipistrelle (Pipistrellus hesperus). However, roost sites for the bat species (e.g., caves, hollow 32 trees, rock crevices, or buildings) would be limited, to absent, within the SEZ. Several other 33 special status bat species that could occur within the SEZ area are addressed in Section 8.1.12.1. 34 35 36
8.1.11.3.2 Impacts 37 38 As presented in the Draft Solar PEIS, solar energy development within the Brenda SEZ 39 could affect potentially suitable habitats of mammal species. The analysis presented in the Draft 40 Solar PEIS indicated that development would result in a small overall impact on the 41 representative mammal species analyzed (Table 8.1.11.3-1 in the Draft Solar PEIS). The 42 reduction in size of the Brenda SEZ would result in reduced habitat impacts for all representative 43 mammal species; resultant impact levels for all representative mammal species would still be 44 small. 45 46

Final Solar PEIS 8.1-39 July 2012
8.1.11.3.3 SEZ-Specific Design Features and Design Feature Effectiveness 1 2 Required programmatic design features that would reduce impacts on mammal species 3 are described in Section A.2.2 of Appendix A of this Final Solar PEIS. With the implementation 4 of required programmatic design features, impacts on mammal species are anticipated to be 5 small. 6 7 Because of the change in the SEZ boundaries, one of the SEZ-specific design features 8 identified in Section 8.1.11.3.3 of the Draft Solar PEIS (i.e., Bouse Wash should be avoided) is 9 no longer applicable. On the basis of impact analyses conducted for the Draft Solar PEIS, 10 updates to those analyses due to changes to the SEZ boundaries, and consideration of comments 11 received as applicable, no SEZ-specific design features for mammals have been identified. Some 12 SEZ-specific design features may be identified through the process of preparing parcels for 13 competitive offer and subsequent project-specific analysis. 14 15 16
8.1.11.4 Aquatic Biota 17 18 19
8.1.11.4.1 Affected Environment 20 21 There are no permanent water bodies or perennial streams within the boundaries of the 22 Brenda SEZ. The boundaries of the Brenda SEZ given in the Draft Solar PEIS have been 23 reduced. Based on the boundary changes, updates to the Draft Solar PEIS include the following: 24 25
• Bouse Wash is no longer located within the SEZ, but it is located within the 26 area of potential indirect effects within 5 mi (8 km) of the SEZ. 27
28 • Intermittent streams are the only surface water feature in the area of direct and 29
indirect effects, and their area represents less than 2% of the total amount of 30 intermittent stream present in the 50-mi (80-km) SEZ region. 31
32 Aquatic biota present in the surface water features in the Brenda SEZ have not been 33 characterized. As stated in Appendix C of the Supplement to the Draft Solar PEIS, site surveys 34 can be conducted at the project-specific level to characterize the aquatic biota, if present, in 35 Bouse Wash. 36 37 38
8.1.11.4.2 Impacts 39 40 The types of impacts from the development of utility-scale solar energy facilities that 41 could affect aquatic habitats and biota are discussed in Section 5.10.3 of the Draft Solar PEIS 42 and this Final Solar PEIS. Aquatic habitats could be affected by solar energy development in a 43 number of ways, including (1) direct disturbance, (2) deposition of sediments, (3) changes in 44 water quantity, and (4) degradation of water quality. The impact assessment provided in the 45 Draft Solar PEIS remains valid, with the following update: 46
Final Solar PEIS 8.1-40 July 2012
• Bouse Wash is no longer located within the SEZ; therefore, Bouse Wash 1 would not be directly affected by construction activities. However, as 2 described in the Draft Solar PEIS, Bouse Wash could be affected indirectly by 3 solar development activities within the SEZ. 4
5 6
8.1.11.4.3 SEZ-Specific Design Features and Design Feature Effectiveness 7 8 Required programmatic design features that would reduce impacts on aquatic biota are 9 described in Section A.2.2 of Appendix A of this Final Solar PEIS. SEZ-specific resources and 10 conditions will guide how programmatic design features are applied, for example: 11 12
• Appropriate engineering controls shall be implemented to minimize the 13 amount of contaminants and sediment entering Bouse Wash. 14
15 It is anticipated that implementation of the programmatic design features will reduce 16 impacts on aquatic biota, and if the utilization of water from groundwater or surface water 17 sources is adequately controlled to maintain sufficient water levels in nearby aquatic habitats, the 18 potential impacts on aquatic biota from solar energy development at the Brenda SEZ would be 19 small. 20 21 On the basis of impact analyses conducted for the Draft Solar PEIS, updates to those 22 analyses due to changes to the SEZ boundaries, and consideration of comments received as 23 applicable, no SEZ-specific design features for aquatic biota have been identified. Some 24 SEZ-specific design features may be identified through the process of preparing parcels for 25 competitive offer and subsequent project-specific analysis. 26 27 28 8.1.12 Special Status Species 29 30 31
8.1.12.1 Affected Environment 32 33 As presented in the Draft Solar PEIS, 20 special status species were identified that could 34 occur or have potentially suitable habitat within the affected area of the proposed Brenda SEZ. 35 The reduction in size of the Brenda SEZ by 530 acres (2.1 km2) does not alter the potential for 36 these species or any additional special status species to occur in the affected area. In the Draft 37 Solar PEIS, the Sonoran population of the desert tortoise (Gopherus agassizii) was described as 38 under review for listing under the Endangered Species Act (ESA). Since publication of the Draft 39 Solar PEIS, the Sonoran population of the desert tortoise was determined to be a candidate for 40 listing under the ESA with a Listing Priority Number (LPN) of 6 (75 CFR 78094). 41 42 43
44

Final Solar PEIS 8.1-41 July 2012
8.1.12.2 Impacts 1 2 Overall impact magnitude categories were based on professional judgment and include 3 (1) small: a relatively small proportion ( 1%) of the special status species’ habitat within the 4 SEZ region would be lost; (2) moderate: an intermediate proportion (>1 but 10%) of the special 5 status species’ habitat would be lost; and (3) large: >10% of the special status species’ habitat 6 would be lost. 7 8 As presented in the Draft Solar PEIS, solar energy development within the Brenda SEZ 9 could affect potentially suitable habitats of special status species. The analysis presented in the 10 Draft Solar PEIS for the original Brenda SEZ indicated that development would result in no 11 impact or a small overall impact on all special status species. Development within the revised 12 Brenda SEZ could still affect the same 20 special status species as evaluated in the Draft Solar 13 PEIS. The reduction in size of the Brenda SEZ would result in reduced (but still small) impact 14 levels compared to original estimates in the Draft Solar PEIS. 15 16 17
8.1.12.3 SEZ-Specific Design Features and Design Feature Effectiveness 18 19 Required programmatic design features that would reduce impacts on special status and 20 rare species are described in Section A.2.2 of Appendix A of this Final Solar PEIS. SEZ-specific 21 resources and conditions will guide how programmatic design features are applied, for example: 22 23
• Pre-disturbance surveys shall be conducted within the area of direct effects to 24 determine the presence and abundance of special status species, including 25 those identified in Table 8.1.12.1-1 of the Draft Solar PEIS. Disturbance to 26 occupied habitats for these species shall be avoided or minimized to the extent 27 practicable. If avoiding or minimizing impacts on occupied habitats is not 28 possible, translocation of individuals from areas of direct effect or 29 compensatory mitigation of direct effects on occupied habitats may be used to 30 reduce impacts. A comprehensive mitigation strategy for special status species 31 that uses one or more of these options to offset the impacts of development 32 shall be developed in coordination with the appropriate federal and state 33 agencies. 34
35 • Disturbance of dunes and sand flats in the area of direct effects shall be 36
avoided or minimized to reduce impacts on the arid tansy-aster. 37 38
• Disturbance of any agricultural and riparian habitats in the area of direct 39 effects shall be avoided or minimized to reduce impacts on the lowland 40 leopard frog. 41
42 • Consultation with the USFWS and the Arizona Game and Fish Department 43
(AZGFD) shall be conducted to address the potential for impacts on the 44 Sonoran population of bald eagle, a species listed as threatened under the ESA 45 and California Endangered Species Act (CESA). Consultation would identify 46

Final Solar PEIS 8.1-42 July 2012
an appropriate survey protocol, avoidance measures, and, if appropriate, 1 reasonable and prudent alternatives, reasonable and prudent measures, and 2 terms and conditions for incidental take statements. 3
4 • Coordination with the USFWS and AZGFD should be conducted to address 5
the potential for impacts on the Sonoran population of the desert tortoise, a 6 species under review for listing under the ESA. Coordination would identify 7 an appropriate survey protocol and mitigation requirements, which may 8 include avoidance, minimization, translocation, or compensation. 9
10 It is anticipated that implementation of these programmatic design features will reduce 11 the majority of impacts on the special status species from habitat disturbance and groundwater 12 use. 13 14 On the basis of impact analyses conducted for the Draft Solar PEIS, updates to those 15 analyses due to changes to the SEZ boundaries, and consideration of comments received as 16 applicable, no new SEZ-specific design features for special status species have been identified. 17 Some SEZ-specific design features may be identified through the process of preparing parcels 18 for competitive offer and subsequent project-specific analysis. 19 20 21 8.1.13 Air Quality and Climate 22 23 24
8.1.13.1 Affected Environment 25 26 Except as noted below, the information for air quality and climate presented for the 27 affected environment of the Draft Solar PEIS remains valid. 28 29 30
8.1.13.1.1 Existing Air Emissions 31 32 The Draft Solar PEIS presented La Paz County emissions data for 2002. More recent data 33 for 2008 (EPA 2011a) were reviewed for this Final Solar PEIS. The two emissions inventories 34 used different sources and assumptions. For example, the 2008 data did not include biogenic 35 volatile organic compound (VOC) emissions. All emissions except PM10 (particulate matter with 36 an aerodynamic diameter of 10 μm or less) were lower in the more recent data; PM10 emissions 37 were about 2% higher in the 2008 data. These changes would not affect the modeled air quality 38 impacts presented in this update. 39 40 41
8.1.13.1.2 Air Quality 42 43 The calendar quarterly average National Ambient Air Quality Standard (NAAQS) of 44 1.5 µg/m3 for lead (Pb) presented in Table 8.1.13.1-2 of the Draft Solar PEIS has been replaced 45 by the rolling 3-month standard (0.15 µg/m3). The federal 24-hour and annual sulfur dioxide 46
Final Solar PEIS 8.1-43 July 2012
(SO2), 1-hour ozone (O3), and annual PM10 (particulate matter with a diameter of 10 µm or less) 1 standards have been revoked as well (EPA 2011b). Arizona adopted the NAAQS, and these 2 changes are thus reflected in the Arizona State Ambient Air Quality Standards (SAAQS). These 3 changes will not affect the modeled air quality impacts presented in this update. 4 5 6
8.1.13.2 Impacts 7 8 9
8.1.13.2.1 Construction 10 11 12 Methods and Assumptions 13 14 Except as noted below, the methods and modeling assumptions have not changed from 15 those presented in the Draft Solar PEIS. 16 17 The developable area of the proposed Brenda SEZ was reduced by 530 acres (2.1 km2) 18 by eliminating the area of Bouse Wash on the east side of the SEZ and eliminating the area on 19 the west side of the SEZ to the west of the county road. In the Draft Solar PEIS, concentrations 20 at human receptors and cities were estimated indirectly from contours based on modeled 21 concentrations at gridded receptors. In this Final Solar PEIS, concentrations are estimated 22 directly at those receptors. 23 24 Modeling for the Draft Solar PEIS assumed that up to 3,000 acres (12.1 km2) would be 25 disturbed at any one time. This Final Solar PEIS assumed that up to 2,678 acres (10.8 km2), or 26 80% of the developable area, would be disturbed at any one time. 27 28 29 Results 30 31 Since the annual PM10 standard has been rescinded, the discussion of annual PM10 32 impacts in the Draft Solar PEIS is no longer applicable. 33 34 As noted in Table 8.1.13.2-1 of the Draft Solar PEIS, the background levels of 24-hour 35 PM10 and PM2.5 (particulate matter with an aerodynamic diameter of 2.5 μm or less) available 36 for the Draft Solar PEIS were above the standard levels, and any increase from construction 37 emissions would increase levels already above the standard levels. Background levels of annual 38 PM2.5 were about 90% of the standard level. 39 40 With the reduced size of the Brenda SEZ, predicted concentrations for this Final Solar 41 PEIS, as shown in Table 8.1.13.2-1, would be lower than or comparable to those presented in the 42 Draft Solar PEIS. However, the conclusions in the Draft Solar PEIS remain valid at the 43 boundary. Predicted 24-hour PM10 and 24-hour and annual PM2.5 concentration levels could 44 exceed the standard levels at the SEZ boundaries and in the immediate surrounding areas during 45
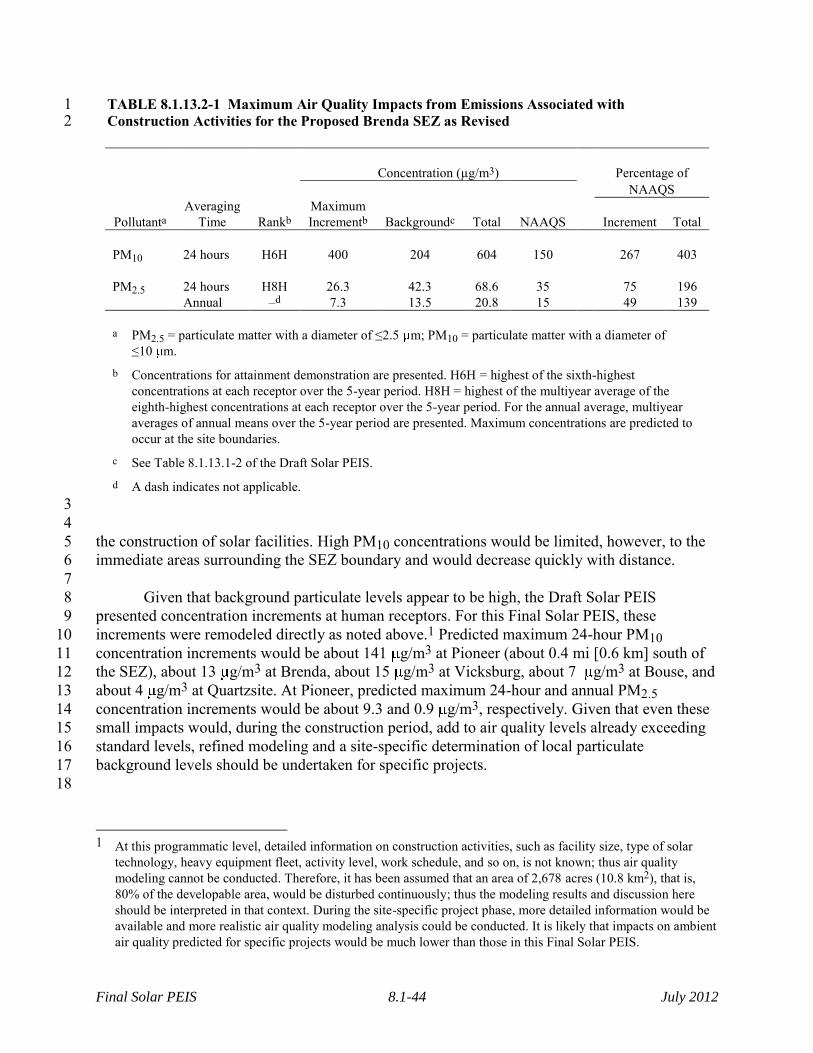
Final Solar PEIS 8.1-44 July 2012
TABLE 8.1.13.2-1 Maximum Air Quality Impacts from Emissions Associated with 1 Construction Activities for the Proposed Brenda SEZ as Revised 2
Concentration (µg/m3)
Percentage of NAAQS
Pollutanta Averaging
Time Rankb Maximum Incrementb Backgroundc Total NAAQS Increment Total
PM10 24 hours H6H 400 204 604 150 267 403 PM2.5 24 hours H8H 26.3 42.3 68.6 35 75 196 Annual –d 7.3 13.5 20.8 15 49 139 a PM2.5 = particulate matter with a diameter of ≤2.5 m; PM10 = particulate matter with a diameter of
≤10 m. b Concentrations for attainment demonstration are presented. H6H = highest of the sixth-highest
concentrations at each receptor over the 5-year period. H8H = highest of the multiyear average of the eighth-highest concentrations at each receptor over the 5-year period. For the annual average, multiyear averages of annual means over the 5-year period are presented. Maximum concentrations are predicted to occur at the site boundaries.
c See Table 8.1.13.1-2 of the Draft Solar PEIS. d A dash indicates not applicable.
3 4 the construction of solar facilities. High PM10 concentrations would be limited, however, to the 5 immediate areas surrounding the SEZ boundary and would decrease quickly with distance. 6 7 Given that background particulate levels appear to be high, the Draft Solar PEIS 8 presented concentration increments at human receptors. For this Final Solar PEIS, these 9 increments were remodeled directly as noted above.1 Predicted maximum 24-hour PM10 10 concentration increments would be about 141 g/m3 at Pioneer (about 0.4 mi [0.6 km] south of 11 the SEZ), about 13 g/m3 at Brenda, about 15 g/m3 at Vicksburg, about 7 g/m3 at Bouse, and 12 about 4 g/m3 at Quartzsite. At Pioneer, predicted maximum 24-hour and annual PM2.5 13 concentration increments would be about 9.3 and 0.9 g/m3, respectively. Given that even these 14 small impacts would, during the construction period, add to air quality levels already exceeding 15 standard levels, refined modeling and a site-specific determination of local particulate 16 background levels should be undertaken for specific projects. 17 18
1 At this programmatic level, detailed information on construction activities, such as facility size, type of solar
technology, heavy equipment fleet, activity level, work schedule, and so on, is not known; thus air quality modeling cannot be conducted. Therefore, it has been assumed that an area of 2,678 acres (10.8 km2), that is, 80% of the developable area, would be disturbed continuously; thus the modeling results and discussion here should be interpreted in that context. During the site-specific project phase, more detailed information would be available and more realistic air quality modeling analysis could be conducted. It is likely that impacts on ambient air quality predicted for specific projects would be much lower than those in this Final Solar PEIS.
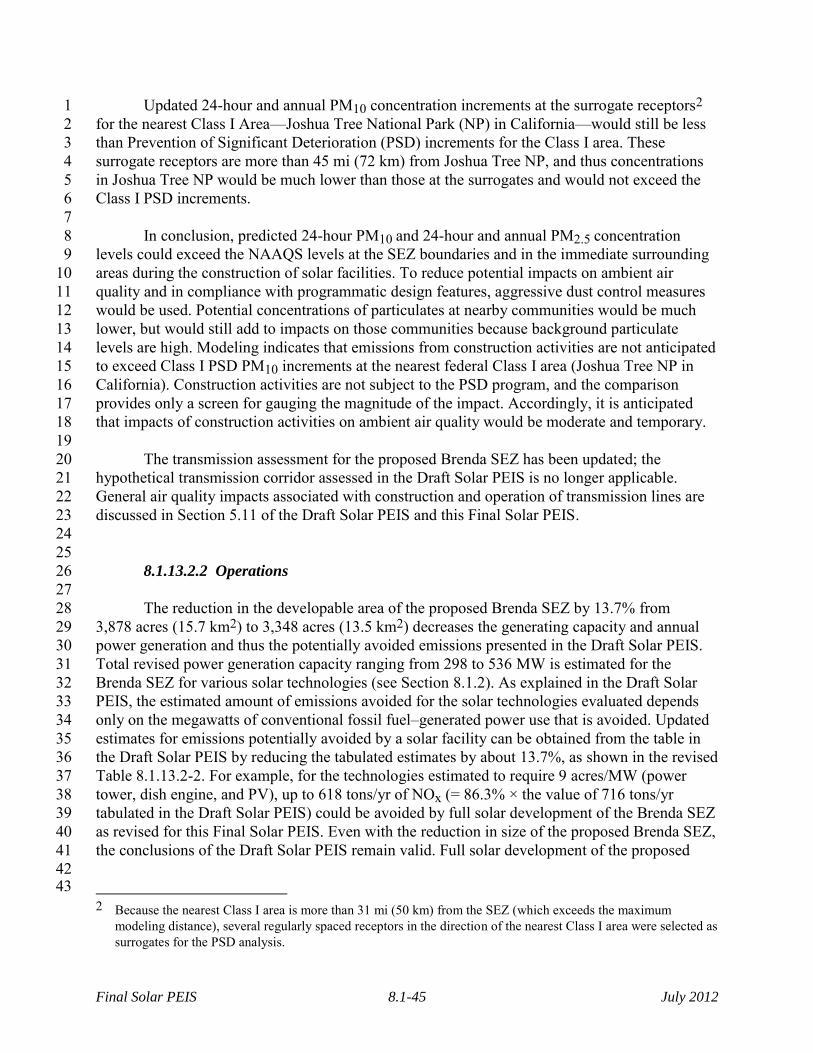
Final Solar PEIS 8.1-45 July 2012
Updated 24-hour and annual PM10 concentration increments at the surrogate receptors2 1 for the nearest Class I Area—Joshua Tree National Park (NP) in California—would still be less 2 than Prevention of Significant Deterioration (PSD) increments for the Class I area. These 3 surrogate receptors are more than 45 mi (72 km) from Joshua Tree NP, and thus concentrations 4 in Joshua Tree NP would be much lower than those at the surrogates and would not exceed the 5 Class I PSD increments. 6 7 In conclusion, predicted 24-hour PM10 and 24-hour and annual PM2.5 concentration 8 levels could exceed the NAAQS levels at the SEZ boundaries and in the immediate surrounding 9 areas during the construction of solar facilities. To reduce potential impacts on ambient air 10 quality and in compliance with programmatic design features, aggressive dust control measures 11 would be used. Potential concentrations of particulates at nearby communities would be much 12 lower, but would still add to impacts on those communities because background particulate 13 levels are high. Modeling indicates that emissions from construction activities are not anticipated 14 to exceed Class I PSD PM10 increments at the nearest federal Class I area (Joshua Tree NP in 15 California). Construction activities are not subject to the PSD program, and the comparison 16 provides only a screen for gauging the magnitude of the impact. Accordingly, it is anticipated 17 that impacts of construction activities on ambient air quality would be moderate and temporary. 18 19 The transmission assessment for the proposed Brenda SEZ has been updated; the 20 hypothetical transmission corridor assessed in the Draft Solar PEIS is no longer applicable. 21 General air quality impacts associated with construction and operation of transmission lines are 22 discussed in Section 5.11 of the Draft Solar PEIS and this Final Solar PEIS. 23 24 25
8.1.13.2.2 Operations 26 27 The reduction in the developable area of the proposed Brenda SEZ by 13.7% from 28 3,878 acres (15.7 km2) to 3,348 acres (13.5 km2) decreases the generating capacity and annual 29 power generation and thus the potentially avoided emissions presented in the Draft Solar PEIS. 30 Total revised power generation capacity ranging from 298 to 536 MW is estimated for the 31 Brenda SEZ for various solar technologies (see Section 8.1.2). As explained in the Draft Solar 32 PEIS, the estimated amount of emissions avoided for the solar technologies evaluated depends 33 only on the megawatts of conventional fossil fuel–generated power use that is avoided. Updated 34 estimates for emissions potentially avoided by a solar facility can be obtained from the table in 35 the Draft Solar PEIS by reducing the tabulated estimates by about 13.7%, as shown in the revised 36 Table 8.1.13.2-2. For example, for the technologies estimated to require 9 acres/MW (power 37 tower, dish engine, and PV), up to 618 tons/yr of NOx (= 86.3% × the value of 716 tons/yr 38 tabulated in the Draft Solar PEIS) could be avoided by full solar development of the Brenda SEZ 39 as revised for this Final Solar PEIS. Even with the reduction in size of the proposed Brenda SEZ, 40 the conclusions of the Draft Solar PEIS remain valid. Full solar development of the proposed 41 42
43 2 Because the nearest Class I area is more than 31 mi (50 km) from the SEZ (which exceeds the maximum
modeling distance), several regularly spaced receptors in the direction of the nearest Class I area were selected as surrogates for the PSD analysis.
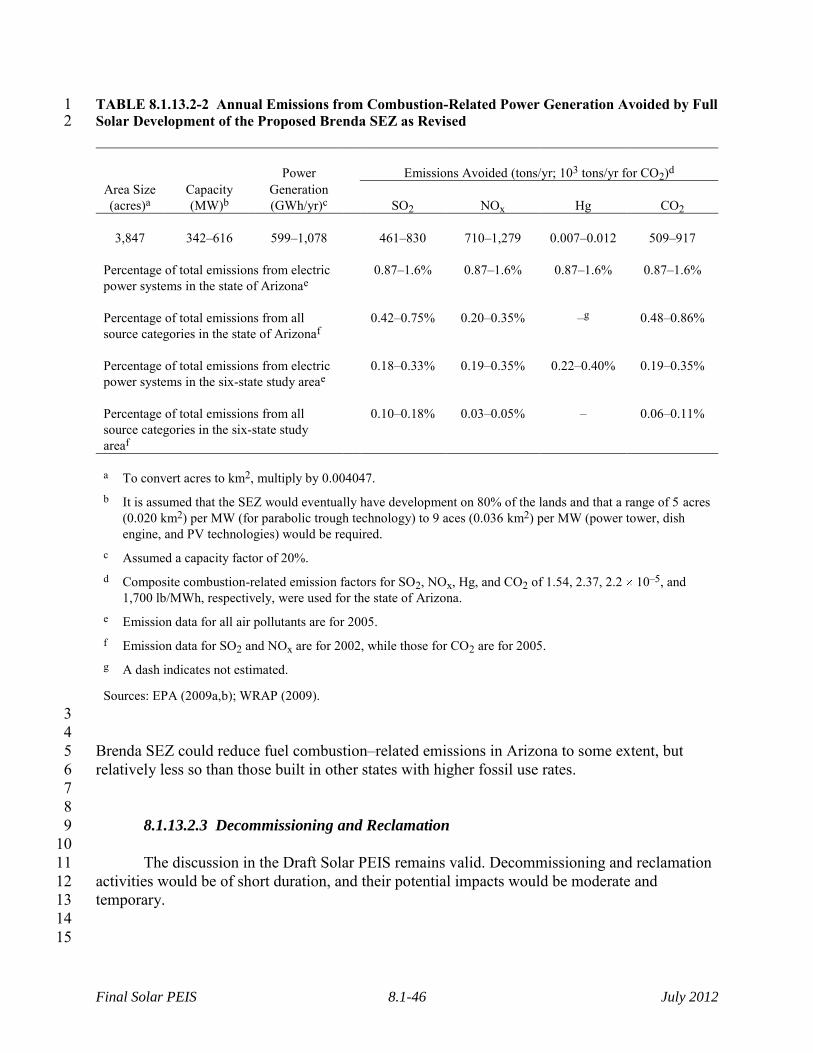
Final Solar PEIS 8.1-46 July 2012
TABLE 8.1.13.2-2 Annual Emissions from Combustion-Related Power Generation Avoided by Full 1 Solar Development of the Proposed Brenda SEZ as Revised 2
Power Emissions Avoided (tons/yr; 103 tons/yr for CO2)d
Area Size Capacity Generation (acres)a (MW)b (GWh/yr)c SO2 NOx Hg CO2
3,847 342–616 599–1,078 461–830 710–1,279 0.007–0.012 509–917
Percentage of total emissions from electric power systems in the state of Arizonae
0.87–1.6% 0.87–1.6% 0.87–1.6% 0.87–1.6%
Percentage of total emissions from all source categories in the state of Arizonaf
0.42–0.75% 0.20–0.35% –g 0.48–0.86%
Percentage of total emissions from electric power systems in the six-state study areae
0.18–0.33% 0.19–0.35% 0.22–0.40% 0.19–0.35%
Percentage of total emissions from all source categories in the six-state study areaf
0.10–0.18% 0.03–0.05% – 0.06–0.11%
a To convert acres to km2, multiply by 0.004047.
b It is assumed that the SEZ would eventually have development on 80% of the lands and that a range of 5 acres (0.020 km2) per MW (for parabolic trough technology) to 9 aces (0.036 km2) per MW (power tower, dish engine, and PV technologies) would be required.
c Assumed a capacity factor of 20%. d Composite combustion-related emission factors for SO2, NOx, Hg, and CO2 of 1.54, 2.37, 2.2 10–5, and
1,700 lb/MWh, respectively, were used for the state of Arizona. e Emission data for all air pollutants are for 2005. f Emission data for SO2 and NOx are for 2002, while those for CO2 are for 2005. g A dash indicates not estimated.
Sources: EPA (2009a,b); WRAP (2009). 3 4 Brenda SEZ could reduce fuel combustion–related emissions in Arizona to some extent, but 5 relatively less so than those built in other states with higher fossil use rates. 6 7 8
8.1.13.2.3 Decommissioning and Reclamation 9 10 The discussion in the Draft Solar PEIS remains valid. Decommissioning and reclamation 11 activities would be of short duration, and their potential impacts would be moderate and 12 temporary. 13 14 15
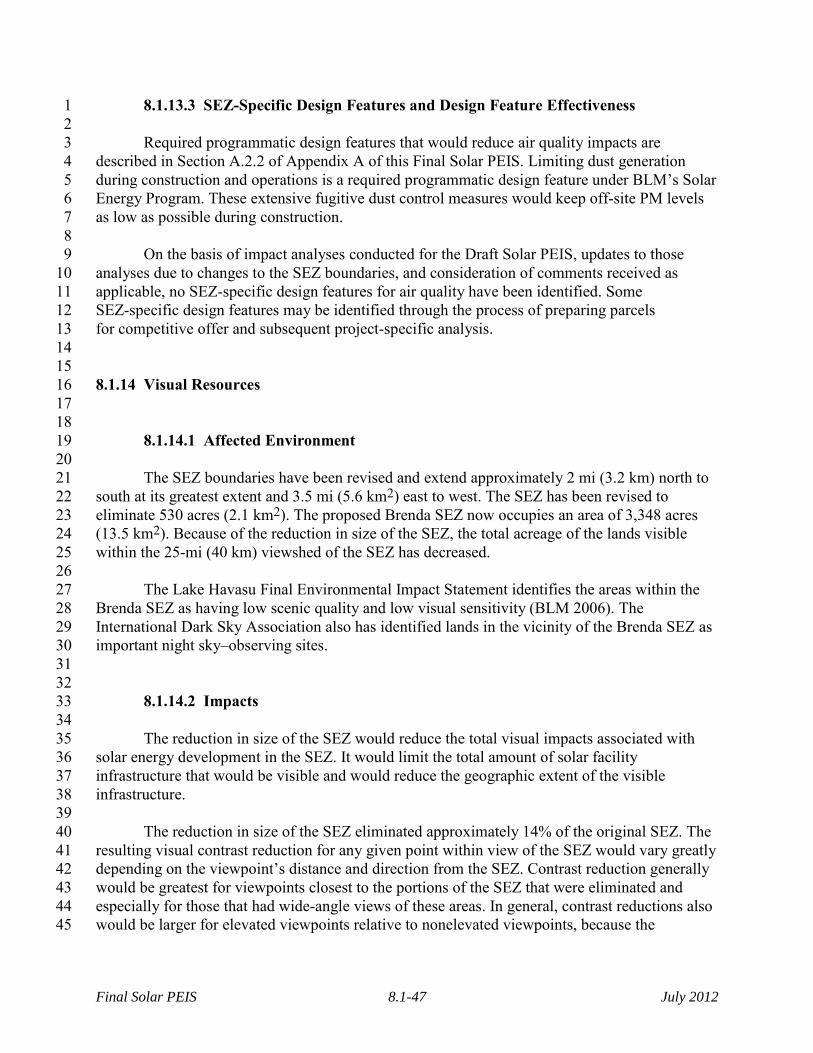
Final Solar PEIS 8.1-47 July 2012
8.1.13.3 SEZ-Specific Design Features and Design Feature Effectiveness 1 2 Required programmatic design features that would reduce air quality impacts are 3 described in Section A.2.2 of Appendix A of this Final Solar PEIS. Limiting dust generation 4 during construction and operations is a required programmatic design feature under BLM’s Solar 5 Energy Program. These extensive fugitive dust control measures would keep off-site PM levels 6 as low as possible during construction. 7 8 On the basis of impact analyses conducted for the Draft Solar PEIS, updates to those 9 analyses due to changes to the SEZ boundaries, and consideration of comments received as 10 applicable, no SEZ-specific design features for air quality have been identified. Some 11 SEZ-specific design features may be identified through the process of preparing parcels 12 for competitive offer and subsequent project-specific analysis. 13 14 15 8.1.14 Visual Resources 16 17 18
8.1.14.1 Affected Environment 19 20 The SEZ boundaries have been revised and extend approximately 2 mi (3.2 km) north to 21 south at its greatest extent and 3.5 mi (5.6 km2) east to west. The SEZ has been revised to 22 eliminate 530 acres (2.1 km2). The proposed Brenda SEZ now occupies an area of 3,348 acres 23 (13.5 km2). Because of the reduction in size of the SEZ, the total acreage of the lands visible 24 within the 25-mi (40 km) viewshed of the SEZ has decreased. 25 26 The Lake Havasu Final Environmental Impact Statement identifies the areas within the 27 Brenda SEZ as having low scenic quality and low visual sensitivity (BLM 2006). The 28 International Dark Sky Association also has identified lands in the vicinity of the Brenda SEZ as 29 important night sky–observing sites. 30 31 32
8.1.14.2 Impacts 33 34 The reduction in size of the SEZ would reduce the total visual impacts associated with 35 solar energy development in the SEZ. It would limit the total amount of solar facility 36 infrastructure that would be visible and would reduce the geographic extent of the visible 37 infrastructure. 38 39 The reduction in size of the SEZ eliminated approximately 14% of the original SEZ. The 40 resulting visual contrast reduction for any given point within view of the SEZ would vary greatly 41 depending on the viewpoint’s distance and direction from the SEZ. Contrast reduction generally 42 would be greatest for viewpoints closest to the portions of the SEZ that were eliminated and 43 especially for those that had wide-angle views of these areas. In general, contrast reductions also 44 would be larger for elevated viewpoints relative to nonelevated viewpoints, because the 45

Final Solar PEIS 8.1-48 July 2012
reduction in area of the solar facilities would be more apparent when looking down at the SEZ 1 than when looking across it. 2 3 4
8.1.14.2.1 Impacts on the Proposed Brenda SEZ 5 6 Although the reduction in size of the SEZ discussed in Section 8.1.14.2 would reduce 7 visual contrasts associated with solar development, solar development within the SEZ still would 8 involve major modification of the existing character of the landscape and would likely dominate 9 the views from most locations within the SEZ. Additional impacts would occur as a result of the 10 construction, operation, and decommissioning of related facilities, such as access roads and 11 electric transmission lines. In general, strong visual contrasts from solar development still would 12 be expected to be observed from viewing locations within the SEZ. 13 14 15
8.1.14.2.2 Impacts on Lands Surrounding the Proposed Brenda SEZ 16 17 For the Draft Solar PEIS, preliminary viewshed analyses were conducted to identify 18 which lands surrounding the proposed SEZ could have views of solar facilities in at least some 19 portion of the SEZ (see Appendixes M and N of the Draft Solar PEIS for important information 20 on assumptions and limitations of the methods used). Four viewshed analyses were conducted, 21 assuming four different heights representative of project elements associated with potential solar 22 energy technologies: PV and parabolic trough arrays, 24.6 ft (7.5 m); solar dishes and power 23 blocks for CSP technologies, 38 ft (11.6 m); transmission towers and short solar power towers, 24 150 ft (45.7 m); and tall solar power towers, 650 ft (198.1 m). 25 26 These same viewsheds were recalculated in order to account for the boundary changes. 27 Figure 8.1.14.2-1 shows the combined results of the viewshed analyses for all four solar 28 technologies. The colored portions indicate areas with clear lines of sight to one or more areas 29 within the SEZ and from which solar facilities within these areas of the SEZ would be expected 30 to be visible, assuming the absence of screening vegetation or structures and adequate lighting 31 and other atmospheric conditions. The light brown areas are locations from which PV and 32 parabolic trough arrays located in the SEZ could be visible. Solar dishes and power blocks for 33 CSP technologies would be visible from the areas shaded light brown and the additional areas 34 shaded light purple. Transmission towers and short solar power towers would be visible from the 35 areas shaded light brown, light purple, and the additional areas shaded dark purple. Power tower 36 facilities located in the SEZ could be visible from areas shaded light brown, light purple, dark 37 purple, and at least the upper portions of power tower receivers could be visible from the 38 additional areas shaded medium brown. 39 40

Final Solar PEIS 8.1-49 July 2012
1
FIGURE 8.1.14.2-1 Viewshed Analyses for the Proposed Brenda SEZ as Revised and 2 Surrounding Lands, Assuming Viewshed Heights of 24.6 ft (7.5 m), 38 ft (11.6 m), 150 ft 3 (45.7 m), and 650 ft (198.1 m) (shaded areas indicate lands from which solar development 4 and/or associated structures within the SEZ could be visible) 5
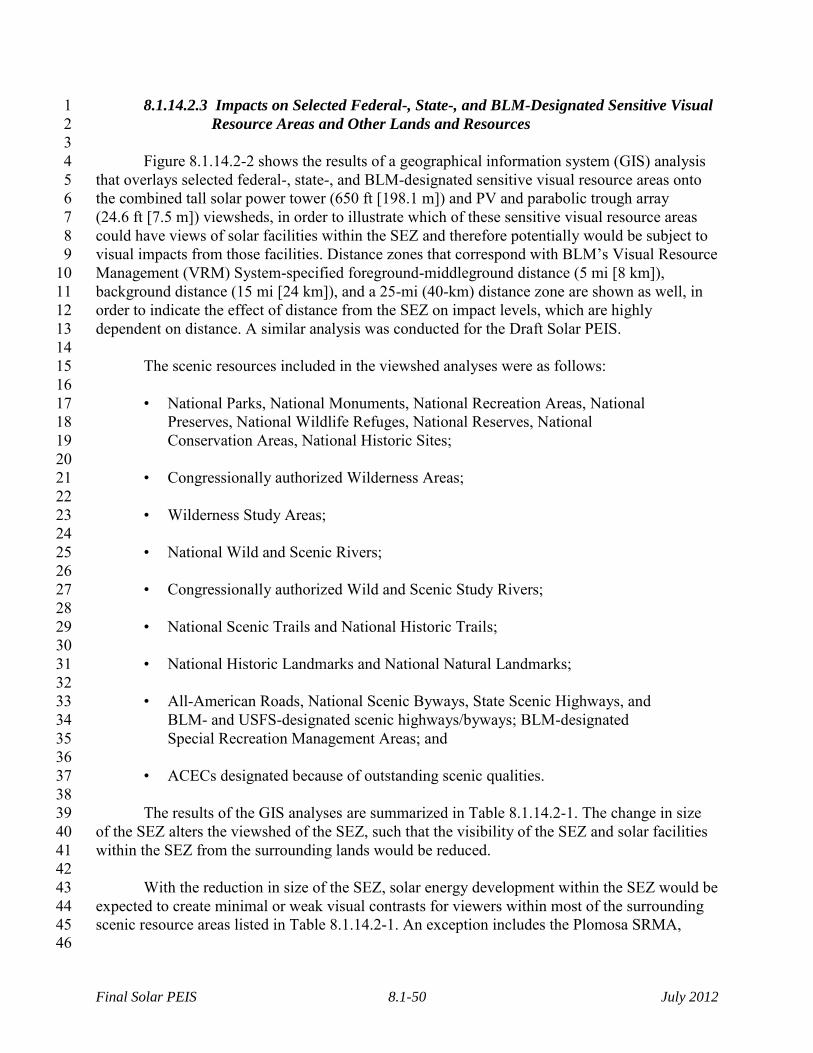
Final Solar PEIS 8.1-50 July 2012
8.1.14.2.3 Impacts on Selected Federal-, State-, and BLM-Designated Sensitive Visual 1 Resource Areas and Other Lands and Resources 2
3 Figure 8.1.14.2-2 shows the results of a geographical information system (GIS) analysis 4 that overlays selected federal-, state-, and BLM-designated sensitive visual resource areas onto 5 the combined tall solar power tower (650 ft [198.1 m]) and PV and parabolic trough array 6 (24.6 ft [7.5 m]) viewsheds, in order to illustrate which of these sensitive visual resource areas 7 could have views of solar facilities within the SEZ and therefore potentially would be subject to 8 visual impacts from those facilities. Distance zones that correspond with BLM’s Visual Resource 9 Management (VRM) System-specified foreground-middleground distance (5 mi [8 km]), 10 background distance (15 mi [24 km]), and a 25-mi (40-km) distance zone are shown as well, in 11 order to indicate the effect of distance from the SEZ on impact levels, which are highly 12 dependent on distance. A similar analysis was conducted for the Draft Solar PEIS. 13 14 The scenic resources included in the viewshed analyses were as follows: 15 16
• National Parks, National Monuments, National Recreation Areas, National 17 Preserves, National Wildlife Refuges, National Reserves, National 18 Conservation Areas, National Historic Sites; 19
20 • Congressionally authorized Wilderness Areas; 21
22 • Wilderness Study Areas; 23
24 • National Wild and Scenic Rivers; 25
26 • Congressionally authorized Wild and Scenic Study Rivers; 27
28 • National Scenic Trails and National Historic Trails; 29
30 • National Historic Landmarks and National Natural Landmarks; 31
32 • All-American Roads, National Scenic Byways, State Scenic Highways, and 33
BLM- and USFS-designated scenic highways/byways; BLM-designated 34 Special Recreation Management Areas; and 35
36 • ACECs designated because of outstanding scenic qualities. 37
38 The results of the GIS analyses are summarized in Table 8.1.14.2-1. The change in size 39 of the SEZ alters the viewshed of the SEZ, such that the visibility of the SEZ and solar facilities 40 within the SEZ from the surrounding lands would be reduced. 41 42 With the reduction in size of the SEZ, solar energy development within the SEZ would be 43 expected to create minimal or weak visual contrasts for viewers within most of the surrounding 44 scenic resource areas listed in Table 8.1.14.2-1. An exception includes the Plomosa SRMA, 45 46

Final Solar PEIS 8.1-51 July 2012
1
FIGURE 8.1.14.2-2 Overlay of Selected Sensitive Visual Resource Areas onto Combined 650-ft 2 (198.1-m) and 24.6-ft (7.5-m) Viewsheds for the Proposed Brenda SEZ as Revised 3
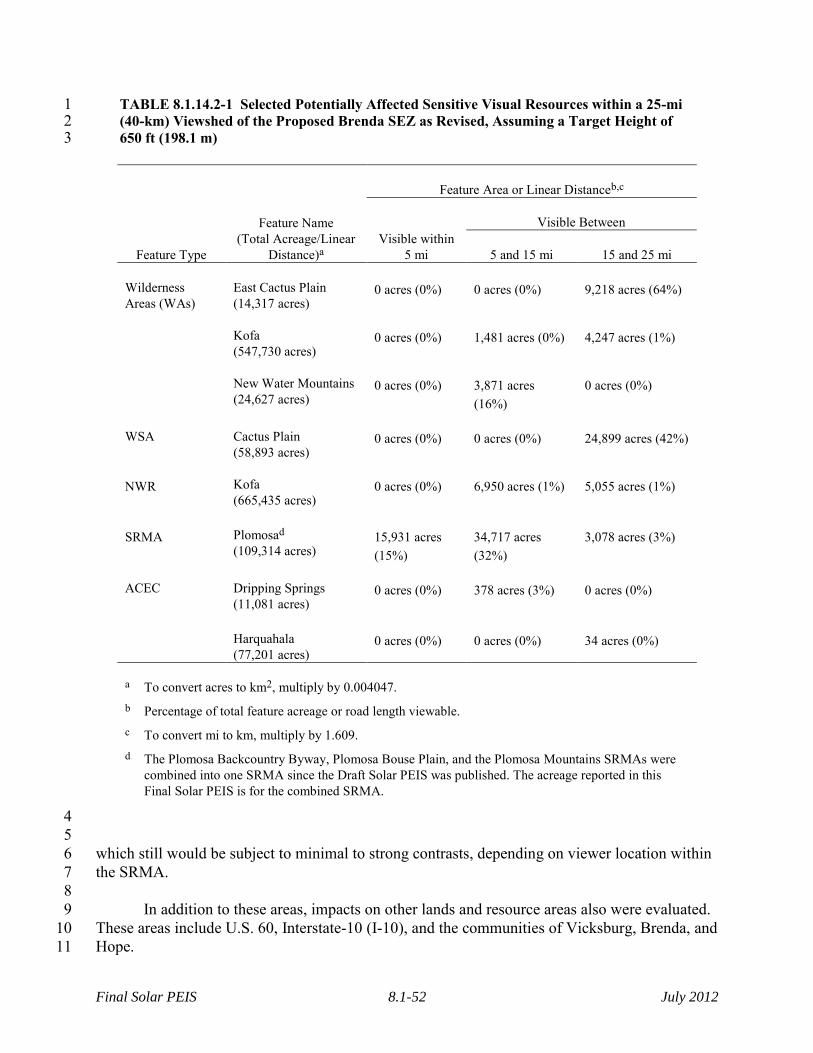
Final Solar PEIS 8.1-52 July 2012
TABLE 8.1.14.2-1 Selected Potentially Affected Sensitive Visual Resources within a 25-mi 1 (40-km) Viewshed of the Proposed Brenda SEZ as Revised, Assuming a Target Height of 2 650 ft (198.1 m) 3
Feature Area or Linear Distanceb,c
Feature Name (Total Acreage/Linear
Distance)a
Visible Between
Feature Type Visible within
5 mi
5 and 15 mi
15 and 25 mi Wilderness Areas (WAs)
East Cactus Plain (14,317 acres)
0 acres (0%) 0 acres (0%) 9,218 acres (64%)
Kofa
(547,730 acres) 0 acres (0%) 1,481 acres (0%) 4,247 acres (1%)
New Water Mountains
(24,627 acres) 0 acres (0%) 3,871 acres
(16%) 0 acres (0%)
WSA Cactus Plain
(58,893 acres) 0 acres (0%) 0 acres (0%) 24,899 acres (42%)
NWR Kofa
(665,435 acres) 0 acres (0%) 6,950 acres (1%) 5,055 acres (1%)
SRMA Plomosad
(109,314 acres) 15,931 acres (15%)
34,717 acres (32%)
3,078 acres (3%)
ACEC Dripping Springs
(11,081 acres) 0 acres (0%) 378 acres (3%) 0 acres (0%)
Harquahala
(77,201 acres) 0 acres (0%) 0 acres (0%) 34 acres (0%)
a To convert acres to km2, multiply by 0.004047. b Percentage of total feature acreage or road length viewable. c To convert mi to km, multiply by 1.609. d The Plomosa Backcountry Byway, Plomosa Bouse Plain, and the Plomosa Mountains SRMAs were
combined into one SRMA since the Draft Solar PEIS was published. The acreage reported in this Final Solar PEIS is for the combined SRMA.
4 5 which still would be subject to minimal to strong contrasts, depending on viewer location within 6 the SRMA. 7 8 In addition to these areas, impacts on other lands and resource areas also were evaluated. 9 These areas include U.S. 60, Interstate-10 (I-10), and the communities of Vicksburg, Brenda, and 10 Hope. 11
Final Solar PEIS 8.1-53 July 2012
8.1.14.2.4 Summary of Visual Resource Impacts for the Proposed Brenda SEZ 1 2 The visual contrast analysis in the Draft Solar PEIS determined that because there could 3 be multiple solar facilities within the Brenda SEZ, a variety of technologies employed, and a 4 range of supporting facilities required, solar development within the SEZ would make it 5 essentially industrial in appearance and would contrast strongly with the surrounding mostly 6 natural-appearing landscape. 7 8 The revision of the SEZ would reduce the visual contrast associated with solar facilities 9 as seen both within the SEZ and from surrounding lands in both daytime- and nighttime views. 10 The reductions in visual contrast can be summarized as follows: 11 12
• Within the Brenda SEZ: Contrasts experienced by viewers within the SEZ 13 would be reduced due to the elimination of acreage within the Bouse Wash 14 and a small area within the western portion of the SEZ. However, strong 15 contrasts still could be observed in the remaining developable area. 16
17 • East Cactus Plain Wilderness Area (WA): A very slight reduction in contrasts 18
would be anticipated; however, solar energy development within the SEZ still 19 would cause minimal contrasts. 20
21 • Kofa WA: A very slight reduction in contrasts would be anticipated; however, 22
solar energy development within the SEZ still would cause minimal to weak 23 contrasts. 24
25 • New Water Mountains: A slight reduction in contrasts would be anticipated; 26
however, solar energy development within the SEZ still would cause minimal 27 to weak contrasts, with higher levels of contrast expected for the higher 28 elevation viewpoints within the WA. 29
30 • Cactus Plain WSA: A very slight reduction in contrasts would be anticipated; 31
however, solar energy development within the SEZ still would cause minimal 32 contrasts. 33
34 • Kofa NWR: A very slight reduction in contrasts would be anticipated; 35
however, solar energy development within the SEZ still would cause minimal 36 to weak contrasts. Higher levels of contrast would be expected for the higher 37 elevation viewpoints within the NWR. 38
39 • Plomosa SRMA: The Plomosa Backcountry Byway, Plomosa Bouse Plain, 40
and the Plomosa Mountains SRMAs were combined into one SRMA since the 41 Draft Solar PEIS was published. As presented in the Draft Solar PEIS, a range 42 of minimal to strong contrasts would have been observed in the three SRMAs, 43 depending on viewer location within the SRMAs. 44
45

Final Solar PEIS 8.1-54 July 2012
• Because of the elimination of acreage within the western portions of the SEZ, 1 a slight overall reduction in contrasts would be anticipated for observers 2 within the combined SRMA; however, solar energy development within the 3 SEZ still would cause minimal to strong contrasts, dependent on the viewer 4 location within the combined Plomosa SRMA. 5
6 • Dripping Springs (and Dripping Springs ACEC): A very slight reduction in 7
contrasts would be anticipated; however, solar development within the SEZ 8 still would cause minimal to weak contrasts, depending on viewer location 9 within the ACEC. Higher levels of contrast would be expected for the higher 10 elevation viewpoints within the ACEC. 11
12 • Harquahala ACEC: No reduction in contrasts would be anticipated; solar 13
development within the SEZ still would cause minimal contrasts. Higher 14 levels of contrast would be expected for the higher elevation viewpoints 15 within the ACEC. 16
17 • U.S. 60: A slight reduction in contrasts would be anticipated due to the 18
elimination of acreage within the eastern and western portions of the SEZ; 19 however, solar development within the SEZ still would cause weak to strong 20 contrasts, depending on viewer location on U.S. 60. 21
22 • I-10: The view from I-10, immediately south of the SEZ, largely is screened 23
by the Bear Hills. Views of the SEZ, however, would be possible from 24 locations east and west of the hills. A slight reduction in contrasts would be 25 anticipated due to the elimination of acreage within the eastern and western 26 portions of the SEZ; solar development within the SEZ still would cause weak 27 to moderate contrasts, depending on viewer location on I-10. 28
29 • Vicksburg: A slight reduction in contrasts would be anticipated; however, 30
solar development within the SEZ still would cause weak to moderate 31 contrasts, depending on viewer location in Vicksburg. 32
33 • Brenda: A slight reduction in contrasts would be anticipated; however, solar 34
development within the SEZ still would cause weak to moderate contrasts, 35 depending on viewer location in Brenda. 36
37 • Hope: A slight reduction in contrasts would be anticipated; solar development 38
within the SEZ still would cause weak contrasts. 39 40 In addition to those areas evaluated within the Draft Solar PEIS, the following areas also 41 may potentially be affected by solar development within the SEZ: 42 43
• La Posa Destination SRMA: This SRMA is located to the south and west of 44 the Brenda SEZ. A portion immediately south of the SEZ would be screened 45 from view of the solar development by the Bear Hills. The northeastern 46
Final Solar PEIS 8.1-55 July 2012
boundary of this SRMA is the I-10 corridor. Solar development within the 1 SEZ would be expected to cause minimal to moderate contrasts, dependent on 2 the viewer’s location within the SRMA. 3
4 • Yuma East Undeveloped SRMA: This SRMA is located approximately 15 mi 5
(24 km) to the southeast of the Brenda SEZ. The western boundary of the 6 SRMA abuts the Kofa NWR. Solar development within the SEZ would be 7 expected to cause minimal contrasts. 8
9 Table 8.4.14.2-2 provides the acreage of these areas that would be visible within the 10 650 ft (198.1 m) viewshed. 11 12 13
8.1.14.3 SEZ-Specific Design Features and Design Feature Effectiveness 14 15 Required programmatic design features that would reduce impacts on visual resources are 16 described in Section A.2.2 of Appendix A of this Final Solar PEIS. While application of the 17 programmatic design features would reduce potential visual impacts somewhat, the degree of 18 effectiveness of these design features could be assessed only at the site- and project-specific 19 level. Given the large-scale, reflective surfaces, and strong regular geometry of utility-scale solar 20 energy facilities and the lack of screening vegetation and landforms within the SEZ viewshed, 21 siting the facilities away from sensitive visual resource areas and other sensitive viewing areas 22 would be the primary means of mitigating visual impacts. The effectiveness of other visual 23 impact mitigation measures generally would be limited. 24 25 On the basis of impact analyses conducted for the Draft Solar PEIS, updates to those 26 analyses due to changes to the SEZ boundaries, and consideration of comments received as 27 applicable, no SEZ-specific design features for visual resources have been identified in this 28 Final Solar PEIS. Some SEZ-specific design features may be identified through the process of 29 preparing parcels for competitive offer and subsequent project-specific analysis. 30 31 32 8.1.15 Acoustic Environment 33 34 35
8.1.15.1 Affected Environment 36 37 The developable area of the proposed Brenda SEZ was reduced by about 13.7% from 38 3,878 acres (15.7 km2) to 3,348 acres (13.5 km2). Distances between the SEZ and nearby noise 39 receptors in this Final Solar PEIS remain the same or increase about 1 mi (1.6 km) compared to 40 the corresponding distance in the Draft Solar PEIS. Except as noted below, the conclusions in the 41 Draft Solar PEIS remain valid. 42 43 44 45
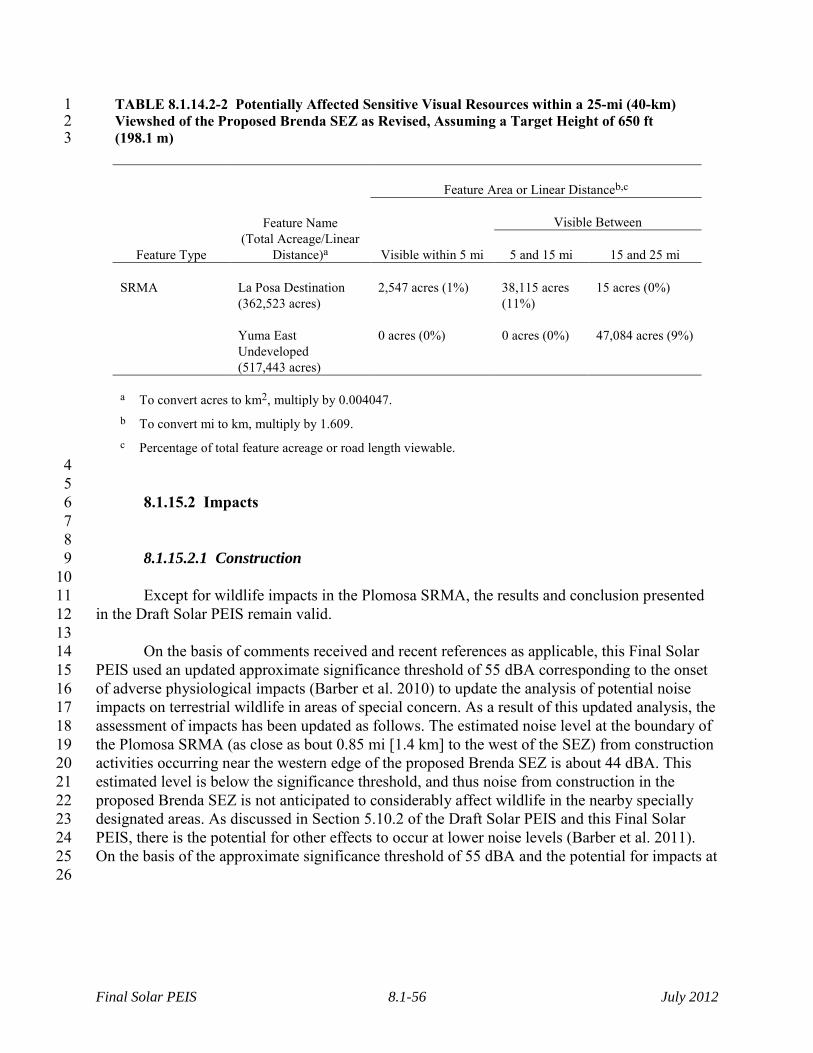
Final Solar PEIS 8.1-56 July 2012
TABLE 8.1.14.2-2 Potentially Affected Sensitive Visual Resources within a 25-mi (40-km) 1 Viewshed of the Proposed Brenda SEZ as Revised, Assuming a Target Height of 650 ft 2 (198.1 m) 3
Feature Area or Linear Distanceb,c
Feature Name (Total Acreage/Linear
Distance)a
Visible Between
Feature Type Visible within 5 mi
5 and 15 mi
15 and 25 mi SRMA La Posa Destination
(362,523 acres) 2,547 acres (1%) 38,115 acres
(11%) 15 acres (0%)
Yuma East
Undeveloped (517,443 acres)
0 acres (0%) 0 acres (0%) 47,084 acres (9%)
a To convert acres to km2, multiply by 0.004047. b To convert mi to km, multiply by 1.609. c Percentage of total feature acreage or road length viewable.
4 5
8.1.15.2 Impacts 6 7 8
8.1.15.2.1 Construction 9 10 Except for wildlife impacts in the Plomosa SRMA, the results and conclusion presented 11 in the Draft Solar PEIS remain valid. 12 13 On the basis of comments received and recent references as applicable, this Final Solar 14 PEIS used an updated approximate significance threshold of 55 dBA corresponding to the onset 15 of adverse physiological impacts (Barber et al. 2010) to update the analysis of potential noise 16 impacts on terrestrial wildlife in areas of special concern. As a result of this updated analysis, the 17 assessment of impacts has been updated as follows. The estimated noise level at the boundary of 18 the Plomosa SRMA (as close as bout 0.85 mi [1.4 km] to the west of the SEZ) from construction 19 activities occurring near the western edge of the proposed Brenda SEZ is about 44 dBA. This 20 estimated level is below the significance threshold, and thus noise from construction in the 21 proposed Brenda SEZ is not anticipated to considerably affect wildlife in the nearby specially 22 designated areas. As discussed in Section 5.10.2 of the Draft Solar PEIS and this Final Solar 23 PEIS, there is the potential for other effects to occur at lower noise levels (Barber et al. 2011). 24 On the basis of the approximate significance threshold of 55 dBA and the potential for impacts at 25
26
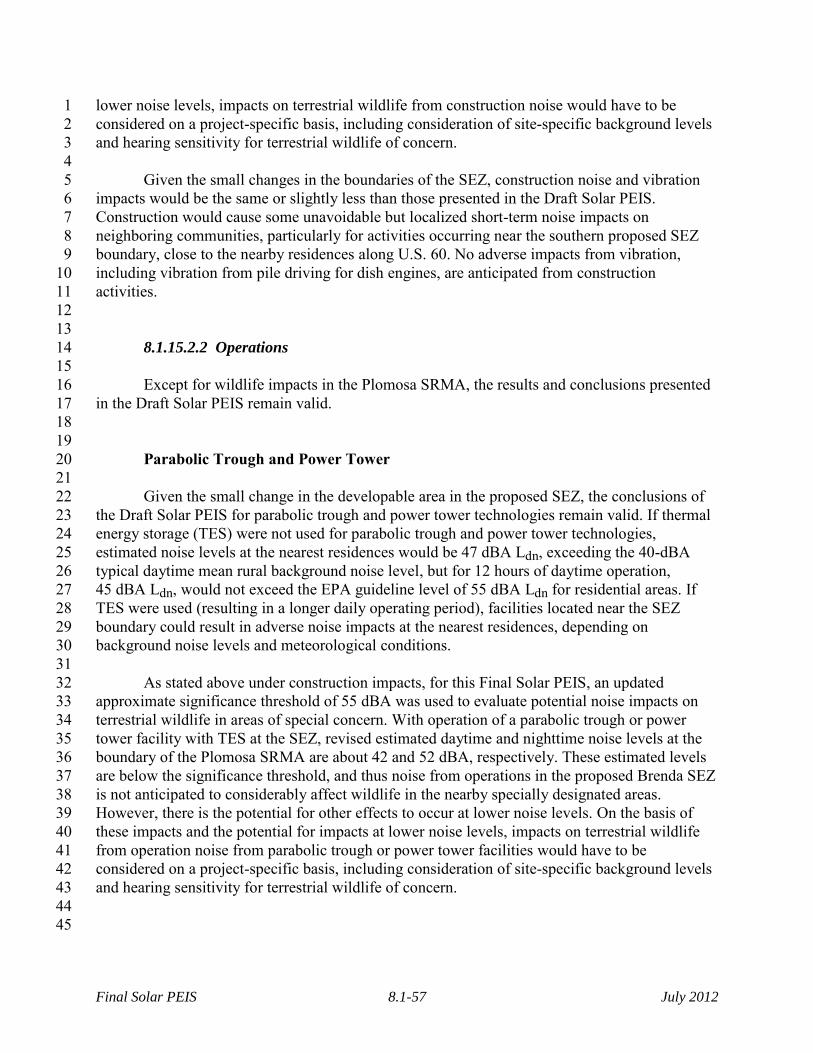
Final Solar PEIS 8.1-57 July 2012
lower noise levels, impacts on terrestrial wildlife from construction noise would have to be 1 considered on a project-specific basis, including consideration of site-specific background levels 2 and hearing sensitivity for terrestrial wildlife of concern. 3 4 Given the small changes in the boundaries of the SEZ, construction noise and vibration 5 impacts would be the same or slightly less than those presented in the Draft Solar PEIS. 6 Construction would cause some unavoidable but localized short-term noise impacts on 7 neighboring communities, particularly for activities occurring near the southern proposed SEZ 8 boundary, close to the nearby residences along U.S. 60. No adverse impacts from vibration, 9 including vibration from pile driving for dish engines, are anticipated from construction 10 activities. 11 12 13
8.1.15.2.2 Operations 14 15 Except for wildlife impacts in the Plomosa SRMA, the results and conclusions presented 16 in the Draft Solar PEIS remain valid. 17 18 19 Parabolic Trough and Power Tower 20 21 Given the small change in the developable area in the proposed SEZ, the conclusions of 22 the Draft Solar PEIS for parabolic trough and power tower technologies remain valid. If thermal 23 energy storage (TES) were not used for parabolic trough and power tower technologies, 24 estimated noise levels at the nearest residences would be 47 dBA Ldn, exceeding the 40-dBA 25 typical daytime mean rural background noise level, but for 12 hours of daytime operation, 26 45 dBA Ldn, would not exceed the EPA guideline level of 55 dBA Ldn for residential areas. If 27 TES were used (resulting in a longer daily operating period), facilities located near the SEZ 28 boundary could result in adverse noise impacts at the nearest residences, depending on 29 background noise levels and meteorological conditions. 30 31 As stated above under construction impacts, for this Final Solar PEIS, an updated 32 approximate significance threshold of 55 dBA was used to evaluate potential noise impacts on 33 terrestrial wildlife in areas of special concern. With operation of a parabolic trough or power 34 tower facility with TES at the SEZ, revised estimated daytime and nighttime noise levels at the 35 boundary of the Plomosa SRMA are about 42 and 52 dBA, respectively. These estimated levels 36 are below the significance threshold, and thus noise from operations in the proposed Brenda SEZ 37 is not anticipated to considerably affect wildlife in the nearby specially designated areas. 38 However, there is the potential for other effects to occur at lower noise levels. On the basis of 39 these impacts and the potential for impacts at lower noise levels, impacts on terrestrial wildlife 40 from operation noise from parabolic trough or power tower facilities would have to be 41 considered on a project-specific basis, including consideration of site-specific background levels 42 and hearing sensitivity for terrestrial wildlife of concern. 43 44 45
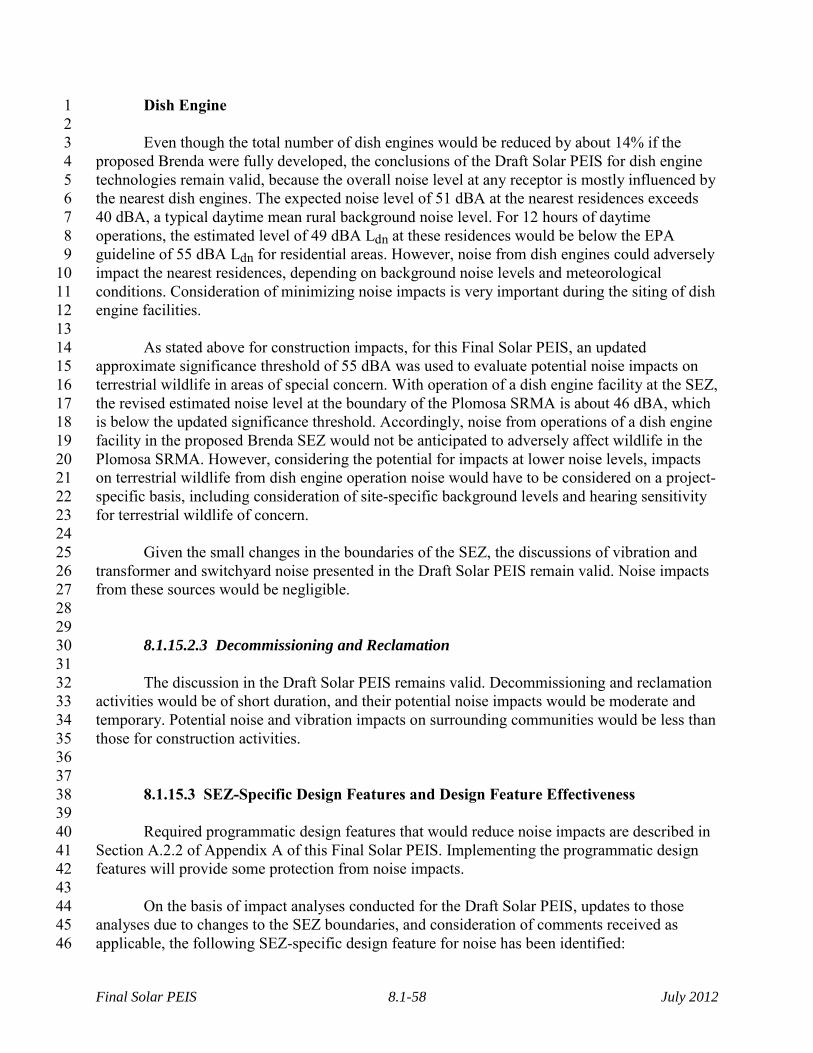
Final Solar PEIS 8.1-58 July 2012
Dish Engine 1 2 Even though the total number of dish engines would be reduced by about 14% if the 3 proposed Brenda were fully developed, the conclusions of the Draft Solar PEIS for dish engine 4 technologies remain valid, because the overall noise level at any receptor is mostly influenced by 5 the nearest dish engines. The expected noise level of 51 dBA at the nearest residences exceeds 6 40 dBA, a typical daytime mean rural background noise level. For 12 hours of daytime 7 operations, the estimated level of 49 dBA Ldn at these residences would be below the EPA 8 guideline of 55 dBA Ldn for residential areas. However, noise from dish engines could adversely 9 impact the nearest residences, depending on background noise levels and meteorological 10 conditions. Consideration of minimizing noise impacts is very important during the siting of dish 11 engine facilities. 12 13 As stated above for construction impacts, for this Final Solar PEIS, an updated 14 approximate significance threshold of 55 dBA was used to evaluate potential noise impacts on 15 terrestrial wildlife in areas of special concern. With operation of a dish engine facility at the SEZ, 16 the revised estimated noise level at the boundary of the Plomosa SRMA is about 46 dBA, which 17 is below the updated significance threshold. Accordingly, noise from operations of a dish engine 18 facility in the proposed Brenda SEZ would not be anticipated to adversely affect wildlife in the 19 Plomosa SRMA. However, considering the potential for impacts at lower noise levels, impacts 20 on terrestrial wildlife from dish engine operation noise would have to be considered on a project-21 specific basis, including consideration of site-specific background levels and hearing sensitivity 22 for terrestrial wildlife of concern. 23 24 Given the small changes in the boundaries of the SEZ, the discussions of vibration and 25 transformer and switchyard noise presented in the Draft Solar PEIS remain valid. Noise impacts 26 from these sources would be negligible. 27 28 29
8.1.15.2.3 Decommissioning and Reclamation 30 31 The discussion in the Draft Solar PEIS remains valid. Decommissioning and reclamation 32 activities would be of short duration, and their potential noise impacts would be moderate and 33 temporary. Potential noise and vibration impacts on surrounding communities would be less than 34 those for construction activities. 35 36 37
8.1.15.3 SEZ-Specific Design Features and Design Feature Effectiveness 38 39 Required programmatic design features that would reduce noise impacts are described in 40 Section A.2.2 of Appendix A of this Final Solar PEIS. Implementing the programmatic design 41 features will provide some protection from noise impacts. 42 43 On the basis of impact analyses conducted for the Draft Solar PEIS, updates to those 44 analyses due to changes to the SEZ boundaries, and consideration of comments received as 45 applicable, the following SEZ-specific design feature for noise has been identified: 46

Final Solar PEIS 8.1-59 July 2012
• Because of the proximity of the proposed Brenda SEZ to nearby residences 1 and the Plomosa SRMA and the relatively high noise levels around the SEZ 2 due to U.S. 60, refined modeling would be warranted along with background 3 noise measurements during project-specific assessments. 4
5 The need for additional SEZ-specific design features will be identified through the 6 process of preparing parcels for competitive offer and subsequent project-specific analysis. 7 8 9 8.1.16 Paleontological Resources 10 11 12
8.1.16.1 Affected Environment 13 14 Data provided in the Draft Solar PEIS remain valid, with the following update: 15 16
• The BLM Regional Paleontologist may have additional information regarding 17 the paleontological potential of the SEZ and be able to update the temporary 18 assignment of potential fossil yield classification (PFYC) Class 3b as used in 19 the Draft Solar PEIS. 20
21 22
8.1.16.2 Impacts 23 24 The potential for impacts on significant paleontological resources is unknown. A more 25 detailed look at the geological deposits of the SEZ is needed to determine whether a 26 paleontological survey is warranted. The assessment provided in the Draft Solar PEIS remains 27 valid. 28 29 30
8.1.16.3 SEZ-Specific Design Features and Design Feature Effectiveness 31 32 Required programmatic design features that would reduce impacts on paleontological 33 resources are described in Section A.2.2 of Appendix A of this Final Solar PEIS. Impacts would 34 be minimized through the implementation of required programmatic design features, including a 35 stop-work stipulation in the event that paleontological resources are encountered during 36 construction, as described in Section A.2.2 of Appendix A. 37 38 On the basis of impact analyses conducted for the Draft Solar PEIS, updates to those 39 analyses due to changes in the SEZ boundaries, and consideration of comments received as 40 applicable, no SEZ-specific design features for paleontological resources have been identified. 41 Because the PFYC of the proposed Brenda SEZ is Class 3b (unknown potential), paleontological 42 surveys would be needed to identify those areas that may have significant paleontological 43 resources; therefore, the need for and nature of any SEZ-specific design features will depend on 44 the findings of future paleontological investigations. Some SEZ-specific design features may be 45
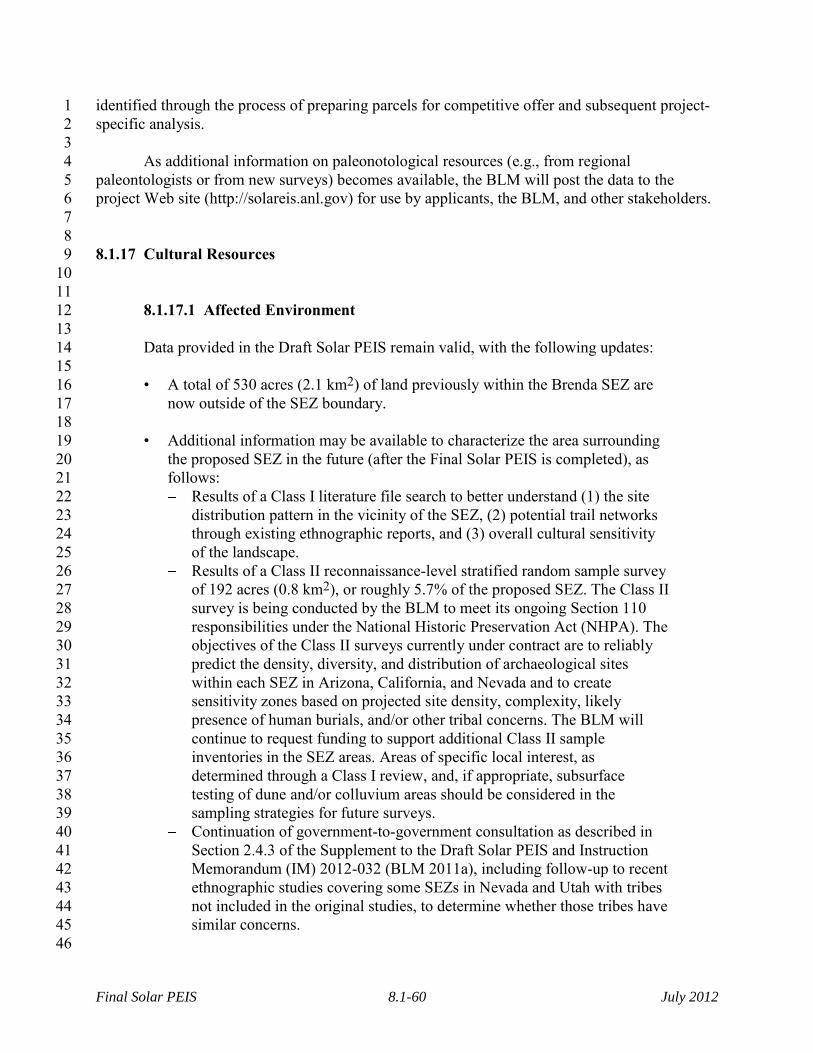
Final Solar PEIS 8.1-60 July 2012
identified through the process of preparing parcels for competitive offer and subsequent project-1 specific analysis. 2 3 As additional information on paleonotological resources (e.g., from regional 4 paleontologists or from new surveys) becomes available, the BLM will post the data to the 5 project Web site (http://solareis.anl.gov) for use by applicants, the BLM, and other stakeholders. 6 7 8 8.1.17 Cultural Resources 9 10 11
8.1.17.1 Affected Environment 12 13 Data provided in the Draft Solar PEIS remain valid, with the following updates: 14 15
• A total of 530 acres (2.1 km2) of land previously within the Brenda SEZ are 16 now outside of the SEZ boundary. 17
18 • Additional information may be available to characterize the area surrounding 19
the proposed SEZ in the future (after the Final Solar PEIS is completed), as 20 follows: 21 Results of a Class I literature file search to better understand (1) the site 22
distribution pattern in the vicinity of the SEZ, (2) potential trail networks 23 through existing ethnographic reports, and (3) overall cultural sensitivity 24 of the landscape. 25
Results of a Class II reconnaissance-level stratified random sample survey 26 of 192 acres (0.8 km2), or roughly 5.7% of the proposed SEZ. The Class II 27 survey is being conducted by the BLM to meet its ongoing Section 110 28 responsibilities under the National Historic Preservation Act (NHPA). The 29 objectives of the Class II surveys currently under contract are to reliably 30 predict the density, diversity, and distribution of archaeological sites 31 within each SEZ in Arizona, California, and Nevada and to create 32 sensitivity zones based on projected site density, complexity, likely 33 presence of human burials, and/or other tribal concerns. The BLM will 34 continue to request funding to support additional Class II sample 35 inventories in the SEZ areas. Areas of specific local interest, as 36 determined through a Class I review, and, if appropriate, subsurface 37 testing of dune and/or colluvium areas should be considered in the 38 sampling strategies for future surveys. 39
Continuation of government-to-government consultation as described in 40 Section 2.4.3 of the Supplement to the Draft Solar PEIS and Instruction 41 Memorandum (IM) 2012-032 (BLM 2011a), including follow-up to recent 42 ethnographic studies covering some SEZs in Nevada and Utah with tribes 43 not included in the original studies, to determine whether those tribes have 44 similar concerns. 45
46
Final Solar PEIS 8.1-61 July 2012
8.1.17.2 Impacts 1 2 As stated in the Draft Solar PEIS, direct impacts on significant cultural resources could 3 occur in the proposed Brenda SEZ; however, further investigation is needed. Data provided in 4 the Draft Solar PEIS remain valid, with the following update: 5 6
• Previously identified potential impacts on cultural resources along the Bouse 7 Wash are no longer applicable with the reduction in size of the SEZ. 8
9 10
8.1.17.3 SEZ-Specific Design Features and Design Feature Effectiveness 11 12 Required programmatic design features that would reduce impacts on cultural resources 13 are described in Section A.2.2 of Appendix A of this Final Solar PEIS. Programmatic design 14 features assume that the necessary surveys, evaluations, and consultations will occur. 15 16 On the basis of impact analyses conducted for the Draft Solar PEIS, updates to those 17 analyses due to changes in the SEZ boundaries, and consideration of comments received as 18 applicable, no SEZ-specific design features for cultural resources have been identified. 19 20 The need for and nature of SEZ-specific design features would be determined in 21 consultation with the Arizona State Historic Preservation Office (SHPO) and affected tribes and 22 would depend on the results of future investigations. Impacts on culturally significant sites and 23 landscapes in the vicinity of the Brenda SEZ at locations such as Ranegras Plain, Granite Wash 24 Pass, Harquahala Mountains, and nearby ACECs and Special Cultural Resource Management 25 Areas (SCRMAs) would need to be avoided, minimized, or otherwise mitigated if solar energy 26 development were to be initiated in the proposed Brenda SEZ. Some SEZ-specific design 27 features may be identified through the process of preparing parcels for competitive offer and 28 subsequent project-specific analysis. 29 30 31 8.1.18 Native American Concerns 32 33 34
8.1.18.1 Affected Environment 35 36 Data provided in the Draft Solar PEIS remain valid. 37 38 39
8.1.18.2 Impacts 40 41 The description of potential concerns provided in the Draft Solar PEIS remains valid. No 42 comments have been received to date concerning the Brenda SEZ; however, the Quechan Indian 43 Tribe has indicated that some of the land in the SEZs lies within their tribal traditional use area. 44 This Tribe has stressed the importance of evaluating impacts on the surrounding landscape as a 45 whole. As consultation with the tribes continues and project-specific analyses are undertaken, it 46

Final Solar PEIS 8.1-62 July 2012
is possible that Native Americans will express concerns over potential visual and other effects of 1 solar energy development within the SEZ. 2 3 In relation to past transmission line projects in the area, the Quechan and Yavapai Tribes 4 have expressed concerns regarding the loss of many resources, including among others natural 5 habitat, wild plant resources, game animals, viewsheds, and cremation or burial sites (see also 6 Section 8.1.18.2 of the Draft Solar PEIS). The construction of utility-scale solar energy facilities 7 within the proposed SEZ would result in the destruction of some plants important to Native 8 Americans and the habitat of some traditionally important animals. 9 10 11
8.1.18.3 SEZ-Specific Design Features and Design Feature Effectiveness 12 13 Required programmatic design features that would reduce impacts on Native American 14 concerns are described in Section A.2.2 of Appendix A of this Final Solar PEIS. For example, 15 impacts would be minimized through the avoidance of sacred sites, water sources, and tribally 16 important plant and animal species. Programmatic design features require that the necessary 17 surveys, evaluations, and consultations would occur. The tribes would be notified regarding the 18 results of archaeological surveys, and they would be contacted immediately upon any discovery 19 of Native American human remains and associated cultural items. 20 21 On the basis of impact analyses conducted for the Draft Solar PEIS, updates to those 22 analyses due to changes in the SEZ boundaries, and consideration of comments received as 23 applicable, no SEZ-specific design features to address Native American concerns have been 24 identified. The need for and nature of SEZ-specific design features would be determined during 25 government-to-government consultation with affected tribes as part of the process of preparing 26 parcels for competitive offer and subsequent project-specific analysis. The Quechan Tribe has 27 requested that they be consulted at the inception of any solar energy project that would affect 28 resources important to them. The Quechan also suggest that the clustering of large solar energy 29 facilities be avoided; that priority for development be given to lands already disturbed by 30 agricultural or military use; and that the feasibility of placing solar collectors on existing 31 structures be considered, thus minimizing or avoiding the use of undisturbed lands (Jackson 32 2009). Potentially significant sites and landscapes in the vicinity of the SEZ associated with the 33 Ranegras Plain, Granite Wash Pass, Harquahala Mountains, and nearby ACECs and SCRMAs, 34 as well as traditional plant and animal resources and important water sources, should be 35 considered and discussed during consultation. 36 37 38 8.1.19 Socioeconomics 39 40 41
8.1.19.1 Affected Environment 42 43 Although the boundaries of the Brenda SEZ have been reduced compared to the 44 boundaries given in the Draft Solar PEIS, the socioeconomic region-of-influence (ROI), the area 45 in which site employees would live and spend their wages and salaries, and into which any 46
Final Solar PEIS 8.1-63 July 2012
in-migration would occur, includes the same counties and communities as described in the Draft 1 Solar PEIS, meaning that no updates to the affected environment information given in the Draft 2 are required. 3 4 5
8.1.19.2 Impacts 6 7 Socioeconomic resources in the ROI around the SEZ could be affected by solar energy 8 development through the creation of direct and indirect employment and income, the generation 9 of direct sales and income taxes, SEZ acreage rental and capacity payments to the BLM, the 10 in-migration of solar facility workers and their families, impacts on local housing markets and on 11 local community service employment. The impact assessment has been updated in the following 12 sections. 13 14 15
8.1.19.2.1 Solar Trough 16 17 18 Construction 19 20 Total construction employment impacts in the ROI (including direct and indirect impacts) 21 from the use of solar trough technologies would be up to 4,683 jobs (Table 8.1.19.2-1). 22 Construction activities would constitute 0.4% of total ROI employment. A solar facility would 23 also produce $275.9 million in income. Direct sales taxes would be $12.3 million, and direct 24 income taxes, $5.6 million. 25 26 Given the scale of construction activities and the low likelihood that the entire 27 construction workforce in the required occupational categories would be available in the local 28 workforce, construction of a solar facility would mean that some in-migration of workers and 29 their families from outside the ROI would be required, with up to 663 persons in-migrating into 30 the ROI. Although in-migration may potentially affect local housing markets, the relatively small 31 number of in-migrants and the availability of temporary accommodations (hotels, motels, and 32 mobile home parks) mean that the impact of solar facility construction on the number of vacant 33 rental housing units would not be expected to be large, with up to 229 rental units expected to be 34 occupied in the ROI. This occupancy rate would represent 0.4% of the vacant rental units 35 expected to be available in the ROI. 36 37 In addition to the potential impact on housing markets, in-migration would affect 38 community service employment (education, health, and public safety). An increase in such 39 employment would be required to meet existing levels of service in the ROI. Accordingly, up to 40 six new teachers, one physician, and one public safety employee (career firefighters and 41 uniformed police officers) would be required in the ROI. These increases would represent less 42 than 0.1% of total ROI employment expected in these occupations. 43 44 45

Final Solar PEIS 8.1-64 July 2012
TABLE 8.1.19.2-1 ROI Socioeconomic Impacts Assuming Full 1 Build-out of the Proposed Brenda SEZ as Revised with 2 Trough Facilities 3
Parameter
Maximum
Annual Construction
Impactsa
Annual Operations Impactsb
Employment (no.) Direct 1,557 117 Total 4,683 191 Incomec Total 275.9 7.2 Direct state taxesc Sales 12.3 0.2 Income 5.6 0.2 BLM paymentsc Rental NAd 0.2 Capacitye NA 3.5 In-migrants (no.) 663 15 Vacant housingf (no.) 229 9 Local community service employment Teachers (no.) 6 0 Physicians (no.) 1 0 Public safety (no.) 1 0 a Construction impacts are based on the development at the site in a
single year; it was assumed that one facility with a combined capacity of up to 536 MW (corresponding to 2,678 acres [11 km2] of land disturbance) could be built.
b Operations impacts are based on full build-out of the site, producing a total output of 536 MW.
c Values are reported in $ million 2008. d NA = not applicable. e The BLM annual capacity payment was based on a fee of
$6,570/MW, established by the BLM in its Solar Energy Interim Rental Policy (BLM 2010a), assuming a solar facility with no storage capability and full build-out of the site. Projects with 3 or more hours of storage would generate higher payments, based on a fee of $7,884/MW.
f Construction activities would affect vacant rental housing; operations activities would affect vacant owner-occupied housing.
4

Final Solar PEIS 8.1-65 July 2012
Operations 1 2 Total operations employment impacts in the ROI (including direct and indirect impacts) 3 of a full build-out of the SEZ using solar trough technologies would be 191 jobs 4 (Table 8.1.19.2-1). Such a solar facility would also produce $7.2 million in income. 5 Direct sales taxes would be $0.2 million, and direct income taxes, $0.2 million. On the basis of 6 fees established by the BLM (BLM 2010a), acreage rental payments would be $0.2 million, and 7 solar generating capacity payments would total at least $3.5 million. 8 9 As for the construction workforce, operation of a solar facility likely would require some 10 in-migration of workers and their families from outside the ROI, with up to 15 persons 11 in-migrating into the ROI. Although in-migration may potentially affect local housing markets, 12 the relatively small number of in-migrants and the availability of temporary accommodations 13 (hotels, motels, and mobile home parks) mean that the impact of solar facility operation on the 14 number of vacant owner-occupied housing units would not be expected to be large, with up to 15 nine owner-occupied units expected to be occupied in the ROI. 16 17 No new community service employment would be required to meet existing levels of 18 service in the ROI. 19 20 21
8.1.19.2.2 Power Tower 22 23 24 Construction 25 26 Total construction employment impacts in the ROI (including direct and indirect impacts) 27 from the use of power tower technologies would be up to 1,865 jobs (Table 8.1.19.2-2). 28 Construction activities would constitute 0.2% of total ROI employment. Such a solar facility 29 would also produce $109.9 million in income. Direct sales taxes would be less than $4.9 million, 30 with direct income taxes of $2.2 million. 31 32
Given the scale of construction activities and the low likelihood that the entire 33 construction workforce in the required occupational categories would be available in the local 34 workforce, construction of a solar facility would mean that some in-migration of workers and 35 their families from outside the ROI would be required, with up to 264 persons in-migrating into 36 the ROI. Although in-migration may potentially affect local housing markets, the relatively small 37 number of in-migrants and the availability of temporary accommodations (hotels, motels, and 38 mobile home parks) mean that the impact of solar facility construction on the number of vacant 39 rental housing units would not be expected to be large, with up to 91 rental units expected to be 40 occupied in the ROI. This occupancy rate would represent 0.1% of the vacant rental units 41 expected to be available in the ROI. 42 43 In addition to the potential impact on housing markets, in-migration would affect 44 community service (education, health, and public safety) employment. An increase in such 45 employment would be required to meet existing levels of service in the ROI. Accordingly, up to 46
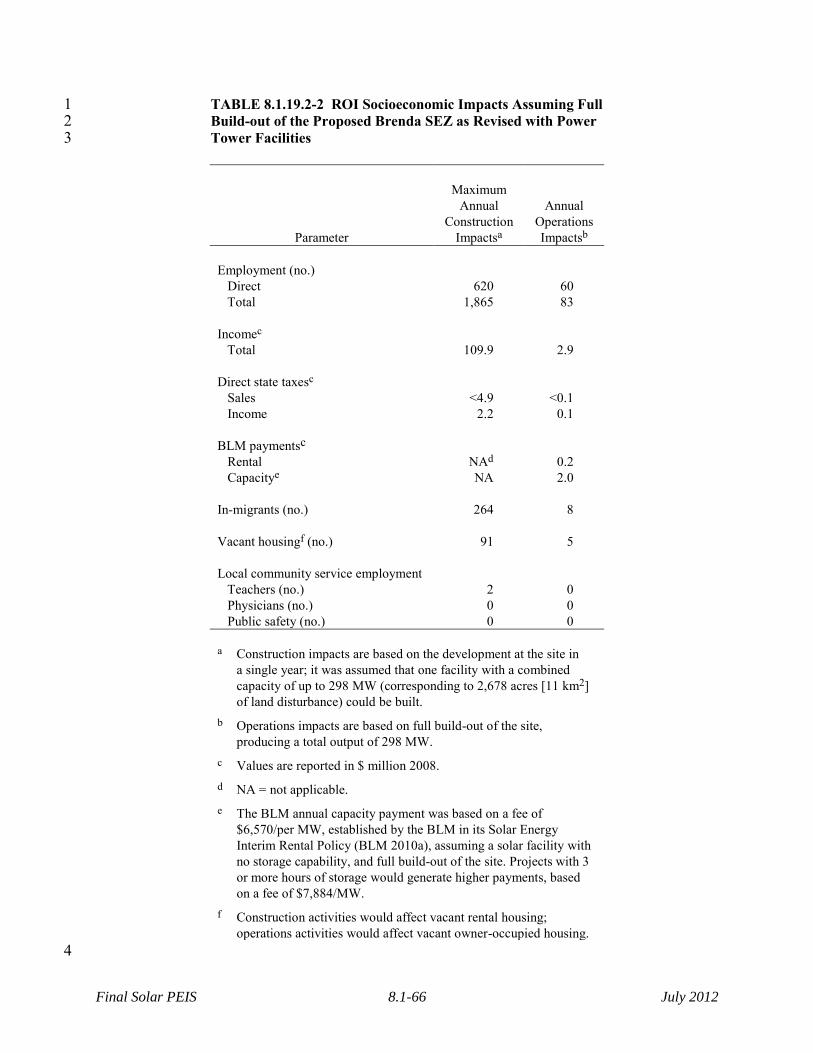
Final Solar PEIS 8.1-66 July 2012
TABLE 8.1.19.2-2 ROI Socioeconomic Impacts Assuming Full 1 Build-out of the Proposed Brenda SEZ as Revised with Power 2 Tower Facilities 3
Parameter
Maximum
Annual Construction
Impactsa
Annual Operations Impactsb
Employment (no.) Direct 620 60 Total 1,865 83 Incomec Total 109.9 2.9 Direct state taxesc Sales <4.9 <0.1 Income 2.2 0.1 BLM paymentsc Rental NAd 0.2 Capacitye NA 2.0 In-migrants (no.) 264 8 Vacant housingf (no.) 91 5 Local community service employment Teachers (no.) 2 0 Physicians (no.) 0 0 Public safety (no.) 0 0 a Construction impacts are based on the development at the site in
a single year; it was assumed that one facility with a combined capacity of up to 298 MW (corresponding to 2,678 acres [11 km2] of land disturbance) could be built.
b Operations impacts are based on full build-out of the site, producing a total output of 298 MW.
c Values are reported in $ million 2008. d NA = not applicable. e The BLM annual capacity payment was based on a fee of
$6,570/per MW, established by the BLM in its Solar Energy Interim Rental Policy (BLM 2010a), assuming a solar facility with no storage capability, and full build-out of the site. Projects with 3 or more hours of storage would generate higher payments, based on a fee of $7,884/MW.
f Construction activities would affect vacant rental housing; operations activities would affect vacant owner-occupied housing.
4

Final Solar PEIS 8.1-67 July 2012
two new teachers would be required in the ROI. This increase would represent less than 0.1% of 1 total ROI employment expected in this occupation. 2 3 4 Operations 5 6 Total operations employment impacts in the ROI (including direct and indirect impacts) 7 of a full build-out of the SEZ using power tower technologies would be 83 jobs 8 (Table 8.1.19.2-2). Such a solar facility would also produce $2.9 million in income. Direct 9 sales taxes would be less than $0.1 million, and direct income taxes, $0.1 million. On the basis of 10 fees established by the BLM (BLM 2010a), acreage rental payments would be $0.2 million, and 11 solar generating capacity payments would total at least $2.0 million. 12 13 As for the construction workforce, operation of a solar facility likely would require some 14 in-migration of workers and their families from outside the ROI, with up to eight persons 15 in-migrating into the ROI. Although in-migration may potentially affect local housing markets, 16 the relatively small number of in-migrants and the availability of temporary accommodations 17 (hotels, motels, and mobile home parks) mean that the impact of solar facility operation on the 18 number of vacant owner-occupied housing units would not be expected to be large, with up to 19 five owner-occupied units expected to be required in the ROI. 20 21 No new community service employment would be required to meet existing levels of 22 service in the ROI. 23 24 25
8.1.19.2.3 Dish Engine 26 27 28 Construction 29 30 Total construction employment impacts in the ROI (including direct and indirect impacts) 31 from the use of dish engine technologies would be up to 758 jobs (Table 8.1.19.2-3). 32 Construction activities would constitute 0.1% of total ROI employment. Such a solar facility 33 would also produce $44.7 million in income. Direct sales taxes would be less than $2.0 million, 34 and direct income taxes, $0.9 million. 35 36 Given the scale of construction activities and the low likelihood that the entire 37 construction workforce in the required occupational categories would be available in the local 38 workforce, construction of a solar facility would mean that some in-migration of workers and 39 their families from outside the ROI would be required, with up to 107 persons in-migrating into 40 the ROI. Although in-migration may potentially affect local housing markets, the relatively small 41 number of in-migrants and the availability of temporary accommodations (hotels, motels, and 42 mobile home parks) mean that the impact of solar facility construction on the number of vacant 43 rental housing units would not be expected to be large, with up to 37 rental units expected to be 44 occupied in the ROI. This occupancy rate would represent 0.1% of the vacant rental units 45 expected to be available in the ROI. 46

Final Solar PEIS 8.1-68 July 2012
TABLE 8.1.19.2-3 ROI Socioeconomic Impacts Assuming 1 Full Build-out of the Proposed Brenda SEZ as Revised with 2 Dish Engine Facilities 3
Parameter
Maximum
Annual Construction
Impactsa
Annual Operations Impactsb
Employment (no.) Direct 252 59 Total 758 81 Incomec Total 44.7 <2.8 Direct state taxesc Sales <2.0 <0.1 Income 0.9 0.1 BLM paymentsc Rental NAd 0.2 Capacitye NA 2.0 In-migrants (no.) 107 7 Vacant housingf (no.) 37 5 Local community service employment Teachers (no.) 1 0 Physicians (no.) 0 0 Public safety (no.) 0 0 a Construction impacts are based on the development at the site in
a single year; it was assumed that one facility with a combined capacity of up to 298 MW (corresponding to 2,678 acres [11 km2] of land disturbance) could be built.
b Operations impacts are based on full build-out of the site, producing a total output of 298 MW.
c Values are reported in $ million 2008. d NA = not applicable. e The BLM annual capacity payment was based on a fee of
$6,570/MW, established by the BLM in its Solar Energy Interim Rental Policy (BLM 2010a), assuming a solar facility with no storage capability and full build-out of the site. Projects with 3 or more hours of storage would generate higher payments, based on a fee of $7,884/MW.
f Construction activities would affect vacant rental housing; operations activities would affect vacant owner-occupied housing.
Final Solar PEIS 8.1-69 July 2012
In addition to the potential impact on housing markets, in-migration would affect 1 community service (education, health, and public safety) employment. An increase in such 2 employment would be required to meet existing levels of service in the ROI. Accordingly, one 3 new teacher would be required in the ROI. This increase would represent less than 0.1% of total 4 ROI employment expected in this occupation. 5 6 7 Operations 8 9 Total operations employment impacts in the ROI (including direct and indirect impacts) 10 of a full build-out of the SEZ using dish engine technologies would be 81 jobs 11 (Table 8.1.19.2-3). Such a solar facility would also produce less than $2.8 million in income. 12 Direct sales taxes would be less than $0.1 million, and direct income taxes, $0.1 million. On the 13 basis of fees established by the BLM (BLM 2010a), acreage rental payments would be 14 $0.2 million, and solar generating capacity payments would total at least $2.0 million. 15 16 As for the construction workforce, operation of a solar facility likely would require some 17 in-migration of workers and their families from outside the ROI, with up to seven persons 18 in-migrating into the ROI. Although in-migration may potentially affect local housing markets, 19 the relatively small number of in-migrants and the availability of temporary accommodations 20 (hotels, motels, and mobile home parks) mean that the impact of solar facility operation on the 21 number of vacant owner-occupied housing units would not be expected to be large, with up to 22 five owner-occupied units expected to be required in the ROI. 23 24 No new community service employment would be required to meet existing levels of 25 service in the ROI. 26 27 28
8.1.19.2.4 Photovoltaic 29 30 31 Construction 32 33 Total construction employment impacts in the ROI (including direct and indirect impacts) 34 from the use of PV technologies would be up to 354 jobs (Table 8.1.19.2-4). Construction 35 activities would constitute less than 0.1% of total ROI employment. Such a solar development 36 would also produce $20.8 million in income. Direct sales taxes would be $0.9 million, and direct 37 income taxes, $0.4 million. 38 39
Given the scale of construction activities and the low likelihood that the entire 40 construction workforce in the required occupational categories would be available in the local 41 workforce, construction of a solar facility would mean that some in-migration of workers and 42 their families from outside the ROI would be required, with up to 50 persons in-migrating into 43 the ROI. Although in-migration may potentially affect local housing markets, the relatively small 44 number of in-migrants and the availability of temporary accommodations (hotels, motels, and 45 mobile home parks) mean that the impact of solar facility construction on the number of vacant 46

Final Solar PEIS 8.1-70 July 2012
TABLE 8.1.19.2-4 ROI Socioeconomic Impacts Assuming 1 Full Build-out of the Proposed Brenda SEZ as Revised with 2 PV Facilities 3
Parameter
Maximum
Annual Construction
Impactsa
Annual Operations Impactsb
Employment (no.) Direct 118 6 Total 354 8 Incomec Total 20.8 0.3 Direct state taxesc Sales 0.9 <0.1 Income 0.4 <0.1 BLM paymentsc Rental NAd 0.2 Capacitye NA 1.6 In-migrants (no.) 50 1 Vacant housingf (no.) 17 0 Local community service employment Teachers (no.) 0 0 Physicians (no.) 0 0 Public safety (no.) 0 0 a Construction impacts are based on the development at the site in
a single year; it was assumed that one facility with a combined capacity of up to 298 MW (corresponding to 2,678 acres [11 km2] of land disturbance) could be built.
b Operations impacts are based on full build-out of the site, producing a total output of 298 MW.
c Values are reported in $ million 2008. d NA = not applicable. e The BLM annual capacity payment was based on a fee of
$5,256/MW, established by the BLM in its Solar Energy Interim Rental Policy (BLM 2010a), assuming full build-out of the site.
f Construction activities would affect vacant rental housing; operations activities would affect owner-occupied housing.
4 5
Final Solar PEIS 8.1-71 July 2012
rental housing units would not be expected to be large, with up to 17 rental units expected to be 1 occupied in the ROI. This occupancy rate would represent less than 0.1% of the vacant rental 2 units expected to be available in the ROI. 3 4 No new community service employment would be required to meet existing levels of 5 service in the ROI. 6 7 8 Operations 9 10 Total operations employment impacts in the ROI (including direct and indirect impacts) 11 of a full build-out of the SEZ using PV technologies would be eight jobs (Table 8.1.19.2-4). 12 Such a solar facility would also produce $0.3 million in income. Direct sales taxes would be 13 less than $0.1 million, and direct income taxes, less than $0.1 million. On the basis of fees 14 established by the BLM (BLM 2010a), acreage rental payments would be $0.2 million, and solar 15 generating capacity payments would total at least $1.6 million. 16 17 As for the construction workforce, operation of a solar facility likely would require some 18 in-migration of workers and their families from outside the ROI, with one person in-migrating 19 into the ROI. Although in-migration may potentially affect local housing markets, the relatively 20 small number of in-migrants and the availability of temporary accommodations (hotels, motels, 21 and mobile home parks) mean that the impact of solar facility operation on the number of vacant 22 owner-occupied housing units would not be expected to be large, with no owner-occupied units 23 expected to be required in the ROI. 24 25 No new community service employment would be required to meet existing levels of 26 service in the ROI. 27 28 29
8.1.19.3 SEZ-Specific Design Features and Design Feature Effectiveness 30 31 Required programmatic design features that would reduce socioeconomic impacts are 32 described in Section A.2.2 of Appendix A of this Final Solar PEIS. On the basis of impact 33 analyses conducted for the Draft Solar PEIS, updates to those analyses due to changes in the SEZ 34 boundaries, and consideration of comments received as applicable, no SEZ-specific design 35 features to address socioeconomic impacts have been identified. Some SEZ-specific design 36 features may be identified through the process of preparing parcels for competitive offer and 37 subsequent project-specific analysis. 38 39 40
Final Solar PEIS 8.1-72 July 2012
8.1.20 Environmental Justice 1 2 3
8.1.20.1 Affected Environment 4 5 The data presented in the Draft Solar PEIS for the proposed Brenda SEZ have not 6 substantially changed. There are no minority or low-income populations in the Arizona portion 7 of the 50-mi (80-km) radius of the SEZ. There is a minority population in the California portion 8 of the 50-mi (80-km) radius of the SEZ. 9 10 11
8.1.20.2 Impacts 12 13 Potential impacts (e.g., from noise and dust during construction and operations, visual 14 impacts, cultural impacts, and effects on property values) on low-income and minority 15 populations could be incurred as a result of the construction and operation of solar facilities 16 involving each of the four technologies. Impacts are likely to be small, although there are 17 minority populations defined by Council on Environmental Quality (CEQ) guidelines 18 (CEQ 1997) (see Section 8.1.20.1 of the Draft Solar PEIS) within the 50-mi (80-km) radius 19 around the boundary of the SEZ. That is, any adverse impacts of solar projects could 20 disproportionately affect minority populations. Because there are no low-income populations 21 within the 50-mi (80-km) radius, there would be no impacts on low-income populations. 22 23 24
8.1.20.3 SEZ-Specific Design Features and Design Feature Effectiveness 25 26 Required programmatic design features that would reduce potential environmental justice 27 impacts are described in Section A.2.2 of Appendix A of this Final Solar PEIS. Implementing the 28 programmatic design features will reduce the potential for environmental justice impacts. 29 30 On the basis of impact analyses conducted for the Draft Solar, updates to those analyses 31 due to changes in the SEZ boundaries, and consideration of comments received as applicable, no 32 SEZ-specific design features for environmental justice have been identified. Some SEZ-specific 33 design features may be identified through the process of preparing parcels for competitive offer 34 and subsequent project-specific analysis. 35 36 37 8.1.21 Transportation 38 39 40
8.1.21.1 Affected Environment 41 42 The reduction in developable area of the proposed Brenda SEZ does not change the 43 information on affected environment for transportation provided in the Draft Solar PEIS. 44 45 46

Final Solar PEIS 8.1-73 July 2012
8.1.21.2 Impacts 1 2 As stated in the Draft Solar PEIS, the primary transportation impacts are anticipated to be 3 from commuting worker traffic. Single projects could involve up to 1,000 workers each day, 4 with an additional 2,000 vehicle trips per day (maximum). The volume of traffic on U.S. 60 5 would represent an increase in traffic of about 130% in the area of the Brenda SEZ for a solar 6 project. Such traffic levels would represent about a 10 or 100% increase in the traffic levels 7 experienced on I-10 or State Route 72 at their junctions with U.S. 60, respectively, if all project 8 traffic were to be routed through I-10 or State Route 72. Because higher traffic volumes would 9 be experienced during shift changes, traffic on I-10 or State Route 72 could experience minor 10 slowdowns during these time periods in the area of their junctions with U.S. 60. Local road 11 improvements would be necessary on any portion of U.S. 60 that might be developed so as not to 12 overwhelm the local access roads near any site access point(s). 13 14 Solar development within the SEZ would affect public access along off-highway vehicle 15 (OHV) routes that are designated open and available for public use. Although open routes 16 crossing areas granted ROWs for solar facilities could be redesignated as closed (see 17 Section 5.5.1 of the Draft Solar PEIS), a programmatic design feature has been included under 18 Recreation (Section A.2.2.6.1 of Appendix A) that requires consideration of replacement of lost 19 OHV route acreage and of access across and to public lands. 20 21 22
8.1.21.3 SEZ-Specific Design Features and Design Feature Effectiveness 23 24 Required programmatic design features that would reduce transportation impacts are 25 described in Section A.2.2 of Appendix A of this Final Solar PEIS. The programmatic design 26 features, including local road improvements, multiple site access locations, staggered work 27 schedules, and ride-sharing, will provide some relief to traffic congestion on local roads leading 28 to the SEZ. Depending on the location of solar facilities within the SEZ, more specific access 29 locations and local road improvements could be implemented. 30 31 On the basis of impact analyses conducted for the Draft Solar PEIS, updates to those 32 analyses due to changes in the SEZ boundaries, and consideration of comments received as 33 applicable, no SEZ-specific design features to address transportation impacts in the proposed 34 Brenda SEZ have been identified. Some SEZ-specific design features may be identified through 35 the process of preparing parcels for competitive offer and subsequent project-specific analysis. 36 37 38 8.1.22 Cumulative Impacts 39 40 The analysis of potential impacts in the vicinity of the proposed Brenda SEZ presented in 41 the Draft Solar PEIS is still generally applicable for this Final Solar PEIS. The size of the 42 developable area of the proposed SEZ has been reduced by about 14%. The following sections 43 include an update to the information presented in the Draft Solar PEIS regarding cumulative 44 effects for the proposed Brenda SEZ. 45 46
Final Solar PEIS 8.1-74 July 2012
8.1.22.1 Geographic Extent of the Cumulative Impact Analysis 1 2 The geographic extent of the cumulative impact analysis has not changed. The extent 3 varies on the basis of the nature of the resource being evaluated and the distance at which the 4 impact may occur (e.g., impacts on air quality may have a greater geographic extent than impacts 5 on visual resources). The BLM, the U.S. Forest Service (USFS), and DoD administer most of the 6 land around the SEZ; the Colorado River Reservation Tribal lands are also about 25 mi (40 km) 7 northwest of the SEZ. The BLM administers approximately 58% of the lands within a 50-mi 8 (80-km) radius of the SEZ. 9 10 11
8.1.22.2 Overview of Ongoing and Reasonably Foreseeable Future Actions 12 13 The Draft Solar PEIS included two other proposed SEZs in Arizona. One of these, 14 Bullard Wash, has been removed from consideration. 15 16 There are approximately 26 pending ROW applications for solar facilities within 50 mi 17 (80 km) of the Brenda SEZ that could generate up to about 16,900 MW of electricity on public 18 lands in Arizona (see Table B-1 of Appendix B of this Final Solar PEIS). However, these 19 applications are in various stages of approval, and for many, environmental assessments have not 20 been completed. Only one, the Quartzsite Solar Energy Project (discussed below), has firm near-21 term plans and environmental documentation and is thus considered a reasonably foreseeable 22 action. As of the end of October 2011, the remainder of the applications were not considered 23 reasonably foreseeable future actions. 24 25 The ongoing and reasonably foreseeable future actions described below are grouped into 26 two categories: (1) actions related to energy production and distribution (Section 8.1.22.2.1); and 27 (2) other ongoing and reasonably foreseeable actions, including those related to electric power 28 generation and distribution, water management, wildlife management, military facility 29 improvement, and mining (Section 8.1.22.2.2). Together, these actions and trends have the 30 potential to affect human and environmental receptors within the geographic range of potential 31 impacts over the next 20 years. 32 33 34
8.1.22.2.1 Energy Production and Distribution 35 36 The list of reasonably foreseeable future actions that relate to energy production and 37 distribution near the proposed Brenda SEZ has been updated and is presented in 38 Table 8.1.22.2-1. Both projects were described in the Draft Solar PEIS. Projects listed in the 39 table are shown in Figure 8.1.22.2-1. 40 41 42
43
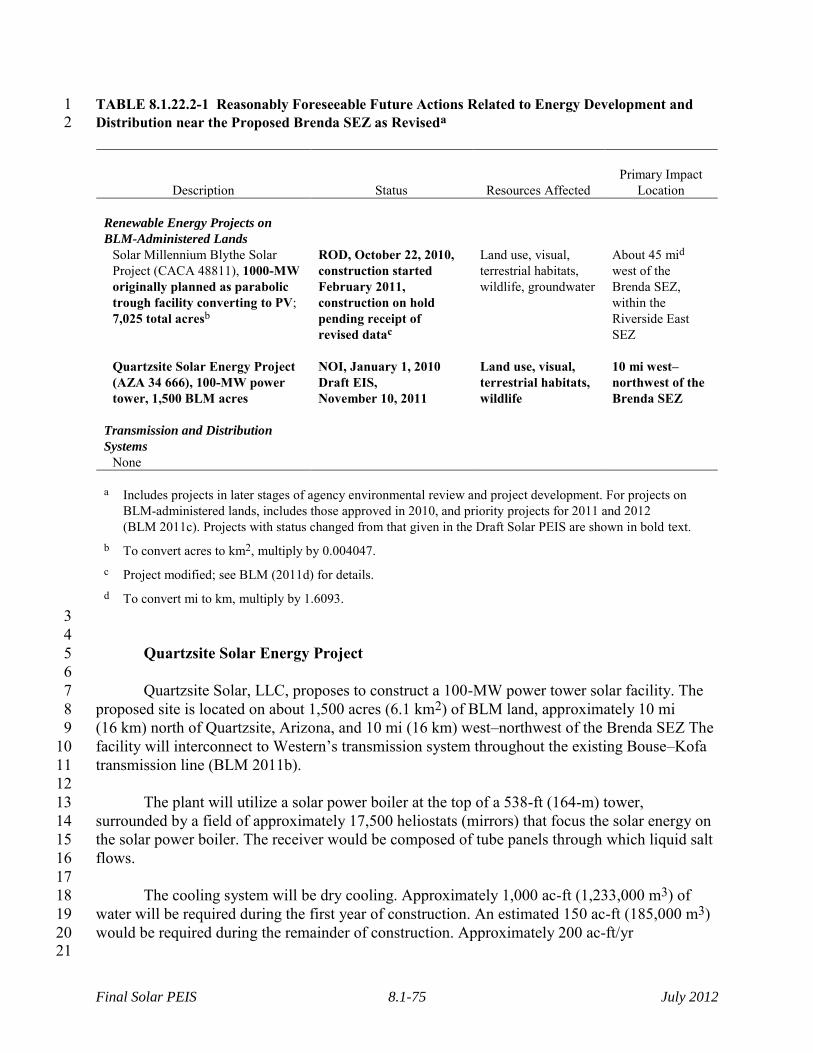
Final Solar PEIS 8.1-75 July 2012
TABLE 8.1.22.2-1 Reasonably Foreseeable Future Actions Related to Energy Development and 1 Distribution near the Proposed Brenda SEZ as Reviseda 2
Description
Status
Resources Affected
Primary Impact
Location Renewable Energy Projects on
BLM-Administered Lands
Solar Millennium Blythe Solar Project (CACA 48811), 1000-MW originally planned as parabolic trough facility converting to PV; 7,025 total acresb
ROD, October 22, 2010, construction started February 2011, construction on hold pending receipt of revised datac
Land use, visual, terrestrial habitats, wildlife, groundwater
About 45 mid west of the Brenda SEZ, within the Riverside East SEZ
Quartzsite Solar Energy Project (AZA 34 666), 100-MW power tower, 1,500 BLM acres
NOI, January 1, 2010 Draft EIS, November 10, 2011
Land use, visual, terrestrial habitats, wildlife
10 mi west–northwest of the Brenda SEZ
Transmission and Distribution
Systems
None a Includes projects in later stages of agency environmental review and project development. For projects on
BLM-administered lands, includes those approved in 2010, and priority projects for 2011 and 2012 (BLM 2011c). Projects with status changed from that given in the Draft Solar PEIS are shown in bold text.
b To convert acres to km2, multiply by 0.004047. c Project modified; see BLM (2011d) for details. d To convert mi to km, multiply by 1.6093.
3 4 Quartzsite Solar Energy Project 5 6 Quartzsite Solar, LLC, proposes to construct a 100-MW power tower solar facility. The 7 proposed site is located on about 1,500 acres (6.1 km2) of BLM land, approximately 10 mi 8 (16 km) north of Quartzsite, Arizona, and 10 mi (16 km) west–northwest of the Brenda SEZ The 9 facility will interconnect to Western’s transmission system throughout the existing Bouse–Kofa 10 transmission line (BLM 2011b). 11 12 The plant will utilize a solar power boiler at the top of a 538-ft (164-m) tower, 13 surrounded by a field of approximately 17,500 heliostats (mirrors) that focus the solar energy on 14 the solar power boiler. The receiver would be composed of tube panels through which liquid salt 15 flows. 16 17 The cooling system will be dry cooling. Approximately 1,000 ac-ft (1,233,000 m3) of 18 water will be required during the first year of construction. An estimated 150 ac-ft (185,000 m3) 19 would be required during the remainder of construction. Approximately 200 ac-ft/yr 20
21

Final Solar PEIS 8.1-76 July 2012
1
FIGURE 8.1.22.2-1 Locations of Existing and Reasonably Foreseeable Renewable Energy 2 Projects on Public Land within a 50-mi (80-km) Radius of the Proposed Brenda SEZ as Revised 3
Final Solar PEIS 8.1-77 July 2012
(250,000 m3) of water would be required during operation. Water will be provided from on-site 1 wells. Construction of the facility will require about 400 to 500 workers at the peak of 2 construction. Operation and maintenance will employ up to 47 workers. 3 4 5
8.1.22.2.2 Other Actions 6 7 Other major ongoing and foreseeable actions identified within 50 mi (80 km) of the 8 proposed Brenda SEZ have been updated and are listed in Table 8.1.22.2-2. All but one of these 9 projects was described in the Draft Solar PEIS. 10 11 12 Fancher Project 13 14 Luxicor Gold, LP, proposes to extract 60,000 tons (54,000 metric tons) of gold ore from 15 an underground mine at a site 26 mi (42 km) south–southeast of the SEZ. The mine site has been 16 extensively disturbed by past mining and exploration. The proposed mining operation would be 17 complete within 3 years, and reclamation would require an additional month. The ore would be 18 hauled to a mill site at the Rio del Monte Mine, located 16 mi (28 km) east of the SEZ on private 19 property near Salome, Arizona. The total project area would be 12.25 acres (0.05 km2), of which 20 only 0.80 acres (0.003 km2) would be new disturbance. Approximately 15 jobs would be created 21 (BLM 2011e). 22 23 24
8.1.22.3 General Trends 25 26 The information on general trends presented in the Draft Solar PEIS remains valid. 27 28 29
8.1.22.4 Cumulative Impacts on Resources 30 31 Total disturbance over 20 years in the proposed Brenda SEZ would be about 2,678 acres 32 (10.8 km2), or 80% of the developable area of the proposed SEZ. This development would 33 contribute incrementally to the impacts from other past, present, and reasonably foreseeable 34 future actions in the region as described in the Draft Solar PEIS. Primary impacts from 35 development in the Brenda SEZ may include impacts on water quantity and quality, air quality, 36 ecological resources such as habitat and species, cultural and visual resources, and specially 37 designated lands. 38 39 One reasonably foreseeable project on BLM-administered land will require additional 40 case processing and environmental review prior to authorization to consider a request to change 41 technology from CSP to PV—the Blythe Solar Millenium Project. The change in technology for 42 this project is expected to result in lower water use. One additional major action within 50 mi 43 (80 km) of the SEZ has been identified that was not known at the time of the Draft Solar PEIS, 44 the Fancher Project. Luxicor Gold, LP, proposes to extract 60,000 tons (54,000 metric tons) of 45 gold ore from an underground mine at a site 26 mi (42 km) south–southeast of the SEZ. 46

Final Solar PEIS 8.1-78 July 2012
TABLE 8.1.22.2-2 Other Major Actions near the Proposed Brenda SEZ as Reviseda 1
Description
Status
Resources Affected
Primary Impact Location
Algae Biomass Project Private enterprise
expected to begin operation in 2010; project on holdb
Land use, terrestrial habitat, visual
Near Vicksburg, about 6 mic east of the SEZ
Bouse-Kofa 161-kV Transmission Line
Operating Terrestrial habitat, wildlife, vegetation, visual
Corridor runs parallel to U.S. 95 in Quartzsite, Arizona, about 18 mi west of the SEZ
Fancher Project EA, September 2011 Terrestrial habitat,
wildlife, air quality, noise/vibration, cultural, visual
Mine site 26 mi south–southeast of the SEZ; mill site 16 mi east of the SEZ
Impact Area Expansion Yuma Proving Ground
EA, March 2010 Terrestrial habitat, wildlife
Boundary about 30 mi south–southwest of the SEZ
Limiting Mountain Lion Predation on Desert Bighorn Sheep on the Kofa NWR
EA, December 2009 Wildlife Boundary 10 mi south of the SEZ
Palo Verde–Devers 500-kV Transmission Line
Operating Terrestrial habitat, wildlife, vegetation, visual
Corridor passes 20 mi south of the SEZ
Parker Dam and Power Plant
Operating since 1942 Aquatic biota 40 mi northwest of the SEZ
Reopening of the Copperstone Mine
EA, May 2010; FONSI October 20, 2010d
Groundwater, terrestrial habitat, wildlife, air quality, noise/vibration, cultural, visual
9.5 mi north of Quartzite and 18 mi northwest of the SEZ
Wild Burro Reduction Cibola-Trigo HMA
EA, July 2010; FONSI July 13, 2010e
Terrestrial habitat, wildlife
About 20 mi west of the SEZ
a Projects whose status has changed from that given in the Draft Solar PEIS are shown in bold text. b See Schwartz (2011) for details. c To convert mi to km, multiply by 1.6093. d See BLM (2010b) for details. e See BLM (2010c) for details.
2 3
Final Solar PEIS 8.1-79 July 2012
In total, reasonably foreseeable solar projects (i.e., the Blythe Solar Millenium Project 1 and the Quartzsite Project) near the proposed Brenda SEZ would have a combined capacity of 2 1,100 MW and encompass approximately 8,525 acres (34.5 km2). No new solar projects have 3 advanced to consideration as reasonably foreseeable since publication of the Draft Solar PEIS, 4 5 Overall, the incremental cumulative impacts associated with development in the proposed 6 Brenda SEZ during construction, operation, and decommissioning are expected to be the same as 7 or less than those discussed in the Draft Solar PEIS. This is because the proposed Bullard Wash 8 SEZ (one of three SEZs in Arizona proposed in the Draft) has been eliminated from 9 consideration, and also because the technology for one of the reasonably foreseeable projects 10 (the Blythe Solar Millenium Project) has been changed from CSP to PV, thus decreasing the 11 projected water use impacts. 12 13 14 8.1.23 Transmission Analysis 15 16 The methodology for this transmission analysis is described in Appendix G of this Final 17 Solar PEIS. This section presents the results of the transmission analysis for the Brenda SEZ, 18 including the identification of potential load areas to be served by power generated at the SEZ 19 and the results of the dedicated-line-transmission (DLT) analysis. Unlike Sections 8.1.2 through 20 8.1.22, this section is not an update of previous analysis for the Brenda SEZ; this analysis was 21 not presented in the Draft Solar PEIS. However, the methodology and a test case analysis were 22 presented in the Supplement to the Draft Solar PEIS. Comments received on the material 23 presented in the Supplement were used to improve the methodology for the assessment presented 24 in this Final Solar PEIS. 25 26 On the basis of its size, the assumption of a minimum of 5 acres (0.02 km2) of land 27 required per MW, and the assumption of a maximum of 80% of the land area developed, the 28 Brenda SEZ is estimated to have the potential to generate 536 MW of marketable solar power at 29 full build-out. 30 31 32
8.1.23.1 Identification and Characterization of Load Areas 33 34 The primary candidates for Brenda SEZ load areas are the major surrounding cities. 35 Figure 8.1.23.1-1 shows the possible load areas for the Brenda SEZ and the estimated portion of 36 their market that could be served by solar generation. Possible load areas for the Brenda SEZ 37 include Phoenix, Arizona; the major cities of San Bernardino and Riverside Counties, California; 38 Las Vegas, Nevada; and San Diego, California, via two different routes (one through Yuma, 39 Arizona, and El Centro, California, and the other through Riverside County, California). 40 41 The two load area groups examined for the Brenda SEZ are as follows: 42 43
1. Phoenix, Arizona, and 44 45
2. Major cities of San Bernardino and Riverside Counties, California. 46

Final Solar PEIS 8.1-80 July 2012
1
FIGURE 8.1.23.1-1 Location of the Proposed Brenda SEZ and Possible Load Areas 2 (Source for background map: Platts 2011) 3
4 5 Figure 8.1.23.1-2 shows the most economically viable transmission scheme for the 6 Brenda SEZ (transmission scheme 1), and Figure 8.1.23.1-3 shows an alternative transmission 7 scheme (transmission scheme 2) that represents a logical choice should transmission scheme 1 8 be infeasible. As described in Appendix G, the alternative shown in transmission scheme 2 9 represents the optimum choice if one or more of the primary linkages in transmission scheme 1 10 are excluded from consideration. The groups provide for linking loads along alternative routes so 11 that the SEZ’s output of 536 MW could be fully allocated. 12 13 Table 8.1.23.1-1 summarizes and groups the load areas according to their associated 14 transmission scheme and provides details on how the megawatt load for each area was estimated. 15 16 17
8.1.23.2 Findings for the DLT Analysis 18 19 The DLT analysis approach assumes that the Brenda SEZ will require all new 20 construction for transmission lines (i.e., dedicated lines) and substations. The new transmission 21 lines(s) would directly convey the 536-MW output of the Brenda SEZ to the prospective load 22 areas for each possible transmission scheme. The approach also assumes that all existing 23 transmission lines in the Western Electricity Coordinating Council (WECC) region are saturated 24

Final Solar PEIS 8.1-81 July 2012
1
FIGURE 8.1.23.1-2 Transmission Scheme 1 for the Proposed Brenda SEZ (Source for 2 background map: Platts 2011) 3
4 5 and have little or no available capacity to accommodate the SEZ’s output throughout the entire 6 10-year study horizon. 7 8 Figures 8.1.23.1-2 and 8.1.23.1-3 display the pathways that new dedicated lines might 9 follow to distribute solar power generated at the Brenda SEZ via the two identified transmission 10 schemes described in Table 8.1.23.1-1. These pathways parallel existing 500-, 345-, 230-kV, 11 and/or lower voltage lines. The intent of following existing lines is to avoid pathways that may 12 be infeasible due to topographical limitations or other concerns. 13 14 For transmission scheme 1, serving Phoenix, with a potential solar market capacity of 15 700 MW, a new line would be constructed following two segments. The first segment would 16 extend about 15 mi (24 km) from the SEZ to the Salome Substation, and the second segment 17 would extend about 105 mi (167 km) from the Salome Substation to Phoenix. The transmission 18 configuration options for each segment were determined by using the line “loadability” curve in 19 American Electric Power’s Transmission Facts (AEP 2010). Appendix G documents the line 20 options used for this analysis and describes how the load area groupings were determined. 21 22

Final Solar PEIS 8.1-82 July 2012
1
FIGURE 8.1.23.1-3 Transmission Scheme 2 for the Proposed Brenda SEZ (Source 2 for background map: Platts 2011) 3
4 5 For transmission scheme 2, the target load centers are the major cities within Riverside 6 and San Bernardino Counties, California. This scheme has four segments. The first segment, 7 from the SEZ to the Salome Substation, is 15 mi (24 km) long; the second segment, from the 8 Salome Substation to the Devers Substation, is about 170 mi (274 km) long; the third segment, 9 from the Devers Substation to the Vista Substation, is about 45 mi (72 km) long; and the last leg, 10 from the Vista Substation to the Etiwanda Substation, is about 15 mi (24 km) long. The design of 11 the transmission lines takes into account the thermal, voltage drop, and stability limits associated 12 with the operation of the various line segments. 13 14 Table 8.1.23.2-1 summarizes the distances to the various load areas over which new 15 transmission lines would need to be constructed, as well as the assumed number of substations 16 that would be required. One substation is assumed to be installed at each load area and an 17 additional one at the SEZ. In general, the total number of substations per scheme is simply equal 18 to the number of load areas associated with the scheme plus one. Substations at the load areas 19 will consist of one or more step-down transformers, while the originating substation at the SEZ 20 would consist of several step-up transformers. For schemes that require the branching of the 21 lines, a switching substation is assumed to be constructed at the appropriate junction. In general, 22 switching stations carry no local load but are assumed to be equipped with switching gears 23 (e.g., circuit breakers and connecting switches) to reroute power as well as, in some cases, with 24
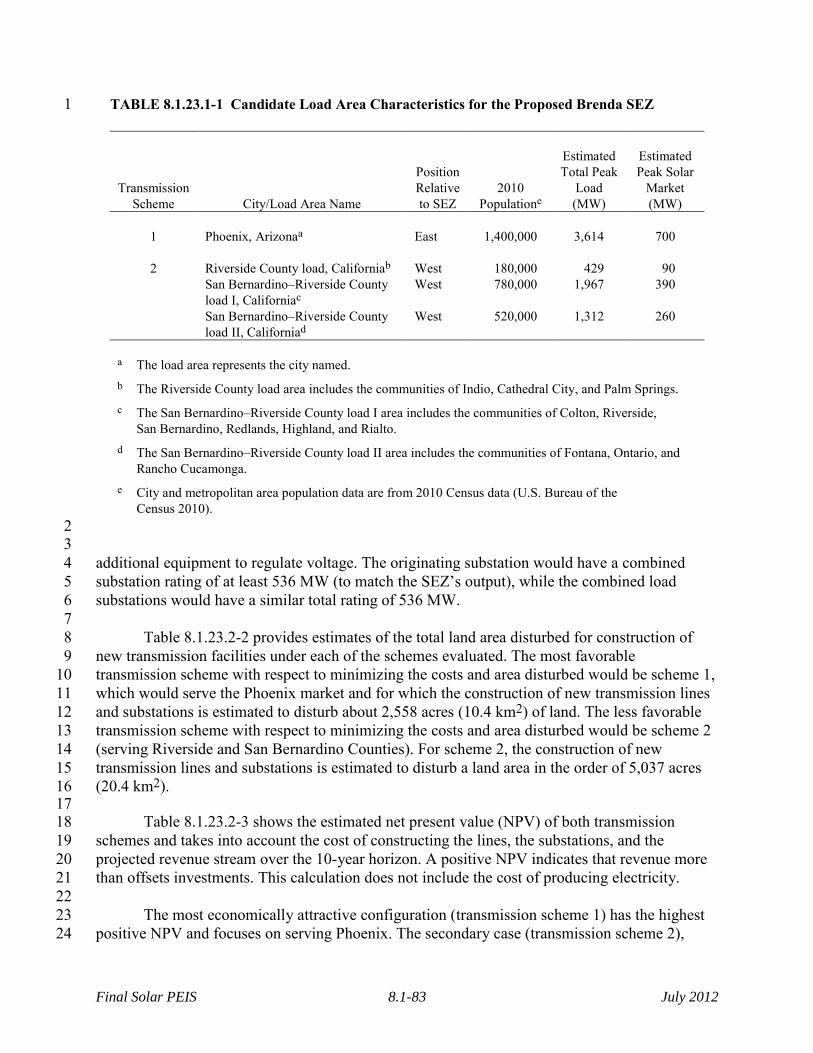
Final Solar PEIS 8.1-83 July 2012
TABLE 8.1.23.1-1 Candidate Load Area Characteristics for the Proposed Brenda SEZ 1
Transmission Scheme
City/Load Area Name
Position Relative to SEZ
2010 Populatione
Estimated Total Peak
Load (MW)
Estimated Peak Solar
Market (MW)
1 Phoenix, Arizonaa East 1,400,000 3,614 700
2 Riverside County load, Californiab West 180,000 429 90 San Bernardino–Riverside County
load I, Californiac West 780,000 1,967 390
San Bernardino–Riverside County load II, Californiad
West 520,000 1,312 260
a The load area represents the city named. b The Riverside County load area includes the communities of Indio, Cathedral City, and Palm Springs. c The San Bernardino–Riverside County load I area includes the communities of Colton, Riverside,
San Bernardino, Redlands, Highland, and Rialto. d The San Bernardino–Riverside County load II area includes the communities of Fontana, Ontario, and
Rancho Cucamonga. e City and metropolitan area population data are from 2010 Census data (U.S. Bureau of the
Census 2010). 2 3 additional equipment to regulate voltage. The originating substation would have a combined 4 substation rating of at least 536 MW (to match the SEZ’s output), while the combined load 5 substations would have a similar total rating of 536 MW. 6 7 Table 8.1.23.2-2 provides estimates of the total land area disturbed for construction of 8 new transmission facilities under each of the schemes evaluated. The most favorable 9 transmission scheme with respect to minimizing the costs and area disturbed would be scheme 1, 10 which would serve the Phoenix market and for which the construction of new transmission lines 11 and substations is estimated to disturb about 2,558 acres (10.4 km2) of land. The less favorable 12 transmission scheme with respect to minimizing the costs and area disturbed would be scheme 2 13 (serving Riverside and San Bernardino Counties). For scheme 2, the construction of new 14 transmission lines and substations is estimated to disturb a land area in the order of 5,037 acres 15 (20.4 km2). 16 17 Table 8.1.23.2-3 shows the estimated net present value (NPV) of both transmission 18 schemes and takes into account the cost of constructing the lines, the substations, and the 19 projected revenue stream over the 10-year horizon. A positive NPV indicates that revenue more 20 than offsets investments. This calculation does not include the cost of producing electricity. 21 22 The most economically attractive configuration (transmission scheme 1) has the highest 23 positive NPV and focuses on serving Phoenix. The secondary case (transmission scheme 2), 24

Final Solar PEIS 8.1-84 July 2012
TABLE 8.1.23.2-1 Potential Transmission Schemes, Estimated Solar Markets, and Distances to 1 Load Areas for the Proposed Brenda SEZ 2
Transmission Scheme
City/Load Area Name
Estimated Peak Solar Market
(MW)e
Total Solar Market (MW)
Sequential Distance
(mi)f
Total Distance
(mi)f
Line Voltage
(kV)
No. of Substations
1 Salome, Arizonaa 0 700 15 120 345 3 Phoenix, Arizonaa 700 105 2 Salome, Arizonaa 0 740 15 245 345, 138 5 Riverside County load,
Californiab 90 170
San Bernardino–Riverside County load I, Californiac
390 45
San Bernardino–Riverside County load II, Californiad
260 15
a The load area represents the city named. b The Riverside County load area includes the communities of Indio, Cathedral City, and Palm Springs. c The San Bernardino–Riverside County load I area includes the communities of Colton, Riverside, San Bernardino,
Redlands, Highland, and Rialto. d The San Bernardino–Riverside County load II area includes the communities of Fontana, Ontario, and Rancho
Cucamonga. e From Table 8.1.23.1-1. f To convert mi to km, multiply by 1.6093.
3 4 which excludes one or more of the primary pathways used in scheme 1, is the less economically 5 attractive option and focuses on delivering power to major cities in Riverside and Bernardino 6 Counties, California. Note that both schemes exhibit positive NPV under the current assumption 7 of a 20% utilization factor. 8 9 Table 8.1.23.2-4 shows the effect of varying the value of the utilization factor on the 10 NPV of the transmission schemes. The table shows that at about 20% utilization, NPVs for both 11 schemes are positive. It also shows that as the utilization factor is increased, the economic 12 viability of the lines also increases. Utilization factors can be raised by allowing the new 13 dedicated lines to market other power generation outputs in the region in addition to that of its 14 associated SEZ. 15 16 The findings of the DLT analysis for the proposed Brenda SEZ are as follows: 17 18
• Transmission scheme 1, which identifies Phoenix as the primary market, 19 represents the most favorable option based on NPV and land use 20 requirements. This scheme would result in new land disturbance of about 21 2,558 acres (10.4 km2). 22
23
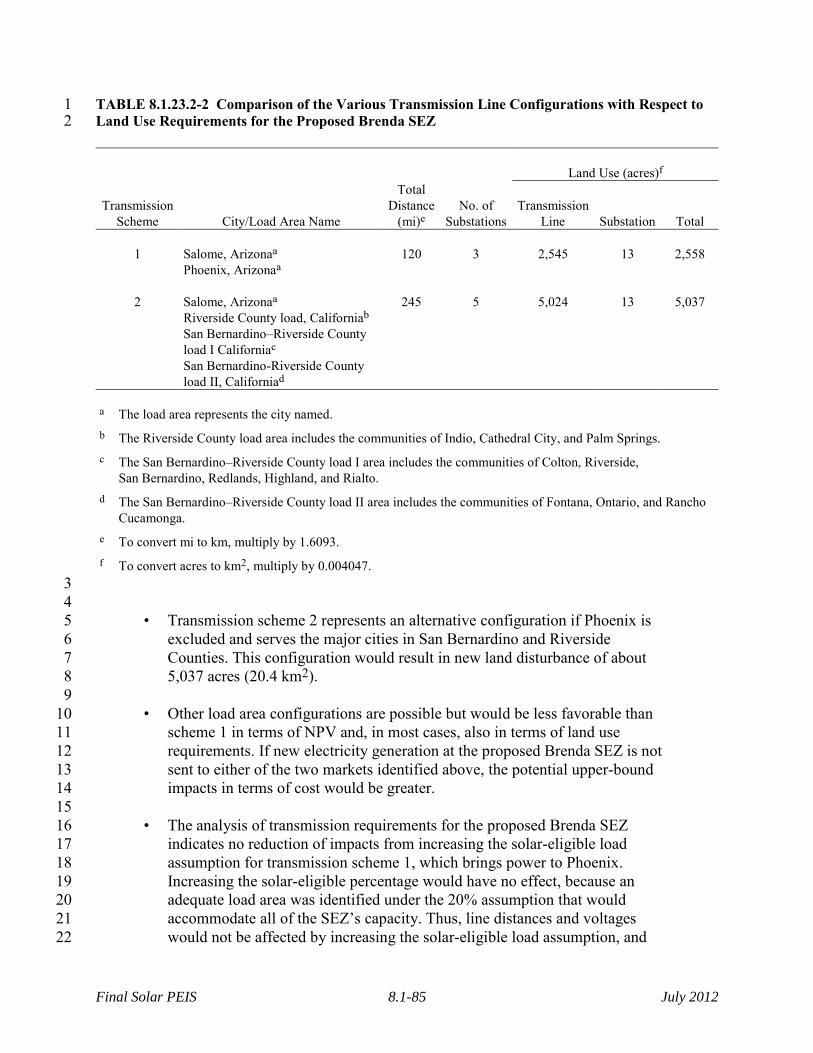
Final Solar PEIS 8.1-85 July 2012
TABLE 8.1.23.2-2 Comparison of the Various Transmission Line Configurations with Respect to 1 Land Use Requirements for the Proposed Brenda SEZ 2
Land Use (acres)f
Transmission
Scheme
City/Load Area Name
Total Distance
(mi)e
No. of
Substations
Transmission
Line
Substation
Total
1 Salome, Arizonaa 120 3 2,545 13 2,558 Phoenix, Arizonaa
2 Salome, Arizonaa 245 5 5,024 13 5,037 Riverside County load, Californiab San Bernardino–Riverside County
load I Californiac
San Bernardino-Riverside County load II, Californiad
a The load area represents the city named. b The Riverside County load area includes the communities of Indio, Cathedral City, and Palm Springs. c The San Bernardino–Riverside County load I area includes the communities of Colton, Riverside,
San Bernardino, Redlands, Highland, and Rialto. d The San Bernardino–Riverside County load II area includes the communities of Fontana, Ontario, and Rancho
Cucamonga. e To convert mi to km, multiply by 1.6093. f To convert acres to km2, multiply by 0.004047.
3 4
• Transmission scheme 2 represents an alternative configuration if Phoenix is 5 excluded and serves the major cities in San Bernardino and Riverside 6 Counties. This configuration would result in new land disturbance of about 7 5,037 acres (20.4 km2). 8
9 • Other load area configurations are possible but would be less favorable than 10
scheme 1 in terms of NPV and, in most cases, also in terms of land use 11 requirements. If new electricity generation at the proposed Brenda SEZ is not 12 sent to either of the two markets identified above, the potential upper-bound 13 impacts in terms of cost would be greater. 14
15 • The analysis of transmission requirements for the proposed Brenda SEZ 16
indicates no reduction of impacts from increasing the solar-eligible load 17 assumption for transmission scheme 1, which brings power to Phoenix. 18 Increasing the solar-eligible percentage would have no effect, because an 19 adequate load area was identified under the 20% assumption that would 20 accommodate all of the SEZ’s capacity. Thus, line distances and voltages 21 would not be affected by increasing the solar-eligible load assumption, and 22
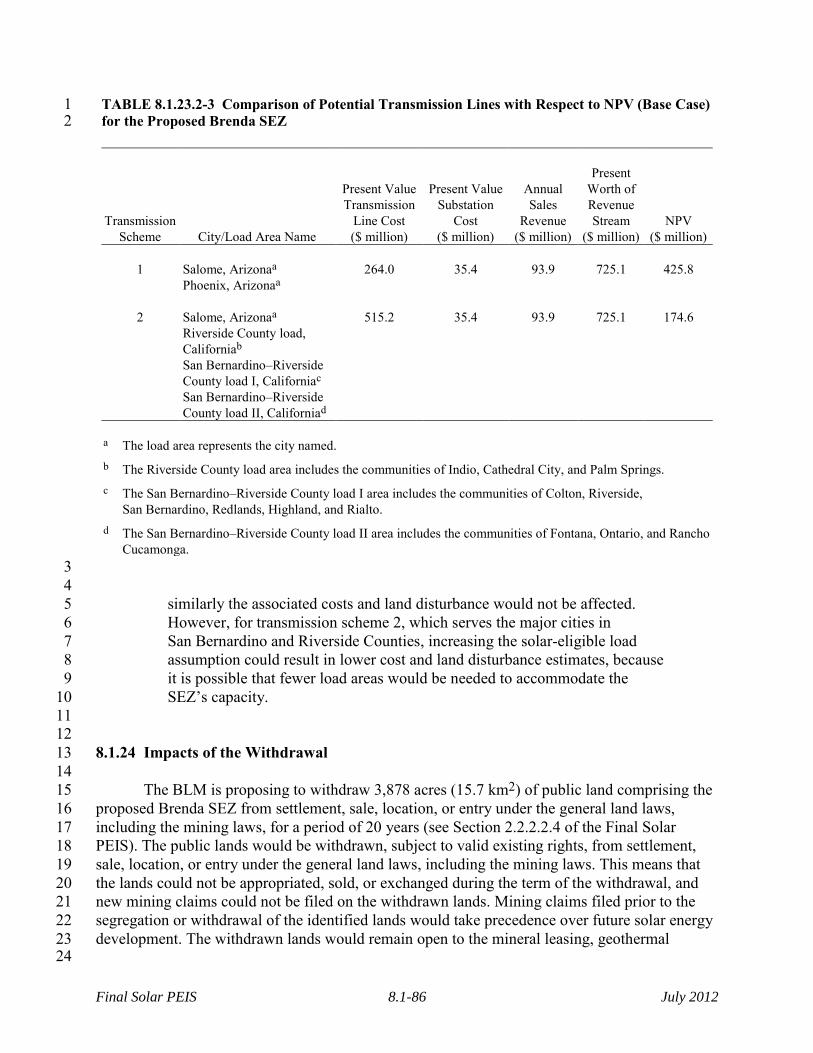
Final Solar PEIS 8.1-86 July 2012
TABLE 8.1.23.2-3 Comparison of Potential Transmission Lines with Respect to NPV (Base Case) 1 for the Proposed Brenda SEZ 2
Transmission Scheme
City/Load Area Name
Present Value Transmission
Line Cost ($ million)
Present Value Substation
Cost ($ million)
Annual Sales
Revenue ($ million)
Present
Worth of Revenue Stream
($ million)
NPV ($ million)
1 Salome, Arizonaa 264.0 35.4 93.9 725.1 425.8
Phoenix, Arizonaa
2 Salome, Arizonaa 515.2 35.4 93.9 725.1 174.6 Riverside County load,
Californiab
San Bernardino–Riverside County load I, Californiac
San Bernardino–Riverside County load II, Californiad
a The load area represents the city named. b The Riverside County load area includes the communities of Indio, Cathedral City, and Palm Springs. c The San Bernardino–Riverside County load I area includes the communities of Colton, Riverside,
San Bernardino, Redlands, Highland, and Rialto. d The San Bernardino–Riverside County load II area includes the communities of Fontana, Ontario, and Rancho
Cucamonga. 3 4
similarly the associated costs and land disturbance would not be affected. 5 However, for transmission scheme 2, which serves the major cities in 6 San Bernardino and Riverside Counties, increasing the solar-eligible load 7 assumption could result in lower cost and land disturbance estimates, because 8 it is possible that fewer load areas would be needed to accommodate the 9 SEZ’s capacity. 10
11 12 8.1.24 Impacts of the Withdrawal 13 14 The BLM is proposing to withdraw 3,878 acres (15.7 km2) of public land comprising the 15 proposed Brenda SEZ from settlement, sale, location, or entry under the general land laws, 16 including the mining laws, for a period of 20 years (see Section 2.2.2.2.4 of the Final Solar 17 PEIS). The public lands would be withdrawn, subject to valid existing rights, from settlement, 18 sale, location, or entry under the general land laws, including the mining laws. This means that 19 the lands could not be appropriated, sold, or exchanged during the term of the withdrawal, and 20 new mining claims could not be filed on the withdrawn lands. Mining claims filed prior to the 21 segregation or withdrawal of the identified lands would take precedence over future solar energy 22 development. The withdrawn lands would remain open to the mineral leasing, geothermal 23
24

Final Solar PEIS 8.1-87 July 2012
TABLE 8.1.23.2-4 Effect of Varying the Utilization Factor on the NPV of the Transmission 1 Schemes for the Proposed Brenda SEZ 2
Transmission
Scheme
City/Load Area Name
NPV ($ million) at Different Utilization Factors
20%
30%
40%
50%
60%
70%
1 Salome, Arizonaa 425.8 788.3 1,150.9 1,513.4 1,876.0 2,238.6 Phoenix, Arizonaa
2 Salome, Arizonaa 174.6 537.1 899.7 1,262.3 1,624.8 1,987.4 Riverside County load,
Californiab
San Bernardino–Riverside County load I, Californiac
San Bernardino–Riverside County load II, Californiad
a The load area represents the city named. b The Riverside County load area includes the communities of Indio, Cathedral City, and Palm Springs. c The San Bernardino–Riverside County load I area includes the communities of Colton, Riverside,
San Bernardino, Redlands, Highland, and Rialto. d The San Bernardino–Riverside County load II area includes the communities of Fontana, Ontario, and
Rancho Cucamonga. 3 4 leasing, and mineral material laws, and the BLM could elect to lease the oil, gas, coal, or 5 geothermal steam resources, or to sell common-variety mineral materials, such as sand and 6 gravel, contained in the withdrawn lands. In addition, the BLM would retain the discretion to 7 authorize linear and renewable energy ROWs on the withdrawn lands. 8 9 The purpose of the proposed land withdrawal is to minimize the potential for conflicts 10 between mineral development and solar energy development for the proposed 20-year 11 withdrawal period. Under the land withdrawal, there would be no mining-related surface 12 development, such as the establishment of open pit mining, construction of roads for hauling 13 materials, extraction of ores from tunnels or adits, or construction of facilities to process the 14 material mined, that could preclude use of the SEZ for solar energy development. For the Brenda 15 SEZ, the impacts of the proposed withdrawal on mineral resources and related economic activity 16 and employment are expected to be negligible because the mineral potential of the lands within 17 the SEZ is low (BLM 2012). There has been no documented mining with the SEZ, and there are 18 no known locatable mineral deposits within the land withdrawal area. According to the Legacy 19 Rehost 2000 System (LR2000) (accessed in January 2012), there are no recorded mining claims 20 within the land withdrawal area. 21 22 Although the mineral potential of the lands within the Brenda SEZ is low, the proposed 23 withdrawal of lands within the SEZ would preclude many types of mining activity over a 20-year 24 period, resulting in the avoidance of potential mining-related adverse impacts. Impacts 25

Final Solar PEIS 8.1-88 July 2012
commonly related to mining development include increased soil erosion and sedimentation, 1 water use, generation of contaminated water in need of treatment, creation of lagoons and ponds 2 (hazardous to wildlife), toxic runoff, air pollution, establishment of noxious weeds and invasive 3 species, habitat destruction or fragmentation, disturbance of wildlife, blockage of migration 4 corridors, increased visual contrast, noise, destruction of cultural artifacts and fossils and/or their 5 context, disruption of landscapes and sacred places of interest to tribes, increased traffic and 6 related emissions, and conflicts with other land uses (e.g., recreational). 7 8 9 8.1.25 References 10 11 Note to Reader: This list of references identifies Web pages and associated URLs where 12 reference data were obtained for the analyses presented in this Final Solar PEIS. It is likely that 13 at the time of publication of this Final Solar PEIS, some of these Web pages may no longer be 14 available or their URL addresses may have changed. The original information has been retained 15 and is available through the Public Information Docket for this Final Solar PEIS. 16 17 ADWR (Arizona Department of Water Resources), 2011, “Ranegras Plain Basin,” Section 7.7 of 18 Arizona Water Atlas, Volume 7: Lower Colorado River Planning Area Water Atlas. Available at 19 http://www.azwater.gov/AzDWR/StatewidePlanning/WaterAtlas/LowerColoradoRiver/ 20 default.htm. Accessed April 9, 2012. 21 22 AEP (American Electric Power), 2010, Transmission Facts. Available at http://www.aep.com/ 23 about/transmission/docs/transmission-facts.pdf. Accessed July 2010. 24 25 Anderson, T.W., and G.W. Freethey, 1995, Simulation of Ground-Water Flow in Alluvial Basins 26 in South-Central Arizona and Parts of Adjacent States, U.S. Geological Survey Professional 27 Paper 1406-D. 28 29 Barber, J.R., et al., 2010, “The Costs of Chronic Noise Exposure for Terrestrial Organisms,” 30 Trends in Ecology and Evolution 25(3):180–189. 31 32 Barber, J.R., et al., 2011, “Anthropogenic Noise Exposure in Protected Natural Areas: 33 Estimating the Scale of Ecological Consequences,” Landscape Ecology 26:1281–1295. 34 35 BLM (Bureau of Land Management), 2006, Lake Havasu Field Office Proposed Resource 36 Management Plan and Final Environmental Impact Statement, Vol. II – Chapters 3, 4, and 5, 37 prepared for U.S. Department of the Interior Bureau of Land Management, Lake Havasu Field 38 Office, Ariz., Sept. 39 40 BLM, 2010a, Solar Energy Interim Rental Policy, U.S. Department of the Interior. Available 41 at http://www.blm.gov/wo/st/en/info/regulations/Instruction_Memos_and_Bulletins/ 42 nationalinstruction/2010/IM_2010-141.html. 43 44
45
Final Solar PEIS 8.1-89 July 2012
BLM, 2010b, Finding of No Significant Impact, Proposed Reopening of the Copperstone Mine, 1 Oct. 20. Available at http://www.blm.gov/pgdata/etc/medialib/blm/az/pdfs/nepa/projects/ 2 yuma/10.Par.18412.File.dat/CO20-10-0015-EA-DR-FONSI-copperstone.pdf. Accessed 3 Jan. 24, 2010. 4 5 BLM, 2010c, Finding of No Significant Impact for Wild Burro Reduction Cibola–Triga Herd 6 Management Area, July 13. Available at http://www.blm.gov/pgdata/etc/medialib/blm/az/pdfs/ 7 nepa/projects/yuma/10.Par.1887.File.dat/C020-2010-0012-EA_DR_FONSI.pdf. Accessed 8 Jan. 25, 2012. 9 10 BLM, 2011a, Instruction Memorandum 2012-032, Native American Consultation and 11 Section 106 Compliance for the Solar Energy Program Described in Solar Programmatic 12 Environmental Impact Statement, U.S. Department of the Interior, Bureau of Land Management, 13 Washington, D.C., Dec. 1. 14 15 BLM, 2011b, Quartzsite Solar Energy Project. Available at http://www.blm.gov/az/st/en/prog/ 16 energy/solar/quartzsite_solar_energy/maps.html. Accessed Jan. 22, 2010. 17 18 BLM, 2011c, 2012 Renewable Energy Priority Projects. Last updated Nov. 22, 2011. Available 19 at http://www.blm.gov/wo/st/en/prog/energy/renewable_energy/2012_priority_projects.html. 20 Accessed Feb. 21, 2012. 21 22 BLM. 2011d, Immediate Temporary Suspension of Activities Issued, Aug. 23. Available at 23 http://www.blm.gov/pgdata/etc/medialib/blm/ca/pdf/palmsprings/blythe_feis0.Par.62829.File. 24 dat/Temporary%20Suspension%20Blythe.pdf. Accessed Jan. 22, 2012. 25 26 BLM, 2011e, Fancher Project Environmental Assessment, Sept. Available at http://www.blm. 27 gov/pgdata/etc/medialib/blm/az/pdfs/nepa/projects/yuma/10.Par.63709.File.dat/AZ-C020-2010-28 0017-EA-fancher.pdf. Accessed Jan. 24, 2012. 29 30 BLM, 2012, Assessment of the Mineral Potential of Public Lands Located within Proposed 31 Solar Energy Zones in Arizona, prepared by Argonne National Laboratory, Argonne, Ill., July. 32 Available at http://solareis.anl.gov/documents/index.cfm. 33 34 BLM and DOE (BLM and U.S. Department of Energy), 2010, Draft Programmatic 35 Environmental Impact Statement for Solar Energy Development in Six Southwestern States, 36 DES 10-59, DOE/EIS-0403, Dec. 37 38 BLM and DOE, 2011, Supplement to the Draft Programmatic Environmental Impact Statement 39 for Solar Energy Development in Six Southwestern States, DES 11-49, DOE/EIS-0403D-S, Oct. 40 41 CEQ (Council on Environmental Quality), 1997, Environmental Justice: Guidance under the 42 National Environmental Policy Act, Executive Office of the President, Dec. Available at 43 http://ceq.hss.doe.gov/nepa/regs/ej/justice.pdf. 44 45

Final Solar PEIS 8.1-90 July 2012
EPA (U.S. Environmental Protection Agency), 2009a, Energy CO2 Emissions by State. 1 Last updated June 12, 2009. Available at http://www.epa.gov/climatechange/emissions/ 2 state_energyco2inv.html. Accessed June 23, 2008. 3 4 EPA, 2009b, eGRID. Last updated Oct. 16, 2008. Available at http://www.epa.gov/cleanenergy/ 5 energy-resources/egrid/index.html. Accessed Jan. 12, 2009. 6 7 EPA, 2011a, 2008 National Emissions Inventory Data, May 24. Available at http://neibrowser. 8 epa.gov/eis-public-web/home.html. Accessed Jan. 3, 2012. 9 10 EPA, 2011b, National Ambient Air Quality Standards (NAAQS). Available at 11 http://www.epa.gov/air/criteria.html. Last updated Nov. 8, 2011. Accessed Nov. 23, 2011. 12 13 FERC (Federal Energy Regulatory Commission), 2011, FERC Form 715: Load Flow Data Set 14 for Western Electricity Coordinating Council, transmitted by D. Burnham (FERC) to Argonne 15 National Laboratory, July 2011. 16 17 Jackson, M., Sr., 2009, “Quechan Indian Tribe’s Comments on Programmatic Environmental 18 Impact Statement for Solar Energy Development,” letter from Jackson (President, Quechan 19 Indian Tribe, Fort Yuma, Ariz.) to Argonne National Laboratory (Argonne, Ill.), Sept. 3. 20 21 Johnson, B.J., 1990, Depth to Water and Altitude of Water Level, Spring 1988 Change in Water 22 Level, 1975–1988, Hydrographs of the Water Level In Selected Wells, and Chemical Quality of 23 Water, 1984–1989, D.W.R. Hydrologic Map Series Report No. 18. 24 25 Metzger, D.G., 1951, Geology and Ground-Water Resources of the Northern Part of the 26 Ranegras Plain Area, Yuma County, Arizona, U.S. Geological Survey, Ground-Water Resources 27 of Arizona No. 23. 28 29 NOAA (National Oceanic and Atmospheric Administration), 2012, National Climatic Data 30 Center (NCDC). Available at http://www.ncdc.noaa.gov/oa/ncdc.html. Accessed Jan. 16, 2012. 31 32 NRCS (Natural Resources Conservation Service), 2008, Soil Survey Geographic (SSURGO) 33 Database for La Paz County, Colorado. Available at http://SoilDataMart.nrcs.usds.gov. 34 35 NRCS, 2010, Custom Soil Resource Report for Kofa Area, Arizona, Parts of La Paz and Yuma 36 Counties (covering the proposed Brenda SEZ), Colorado, U.S. Department of Agriculture, 37 Washington, D.C. 38 39 Platts, 2011, POWERmap, Strategic Desktop Mapping System, The McGraw Hill Companies. 40 Available at http://www.platts.com/Products/powermap. 41 42
43
Final Solar PEIS 8.1-91 July 2012
Schwartz, D., (editor), 2011, “The A.I.M. Interview: Phyco Biosciences’ Ben Cloud,” Algae 1 Industry Magazine.com, Feb. 6. Available at http://www.algaeindustrymagazine.com/a-i-m-2 interview-ben-cloud-ceo-phyco biosciences/?utm_source=feedburner&utm_medium= 3 email&utm_campaign=Feed%3A+AlgaeIndustryMagazine+%28Algae+Industry+ 4 Magazine%29. Accessed Jan. 26, 2012. 5 6 Tillman, F.D., et al., 2011, Water Availability and Use Pilot: Methods Development for a 7 Regional Assessment of Groundwater Availability, Southwest Alluvial Basins, Arizona, Scientific 8 Investigations Report 2011-5071, U.S. Geological Survey. 9 10 U.S. Bureau of the Census, 2010, American FactFinder. Available at http://factfinder2.census. 11 gov. Accessed April 6, 2012. 12 13 USDA (U.S. Department of Agriculture), 2004, Understanding Soil Risks and Hazards—Using 14 Soil Survey to Identify Areas with Risks and Hazards to Human Life and Property, G.B. Muckel 15 (ed.). 16 17 USGS (U.S. Geological Survey), 2012a, National Hydrography Dataset (NHD). Available at 18 http://nhd.usgs.gov. Accessed Jan. 16, 2012. 19 20 USGS, 2012b, National Water Information System (NWIS). Available at http://waterdata.usgs. 21 gov/nwis. Accessed Jan. 16, 2012. 22 23 WRAP (Western Regional Air Partnership), 2009, Emissions Data Management System 24 (EDMS). Available at http://www.wrapedms.org/default.aspx. Accessed June 4, 2009. 25 26 Zhou, Y., 2009, “A Critical Review of Groundwater Budget Myth, Safe Yield, and 27 Sustainability,” Journal of Hydrology (370):207–213. 28 29
30
Final Solar PEIS 8.1-92 July 2012
8.1.26 Errata for the Proposed Brenda SEZ 1 2 This section presents corrections to material presented in the Draft Solar PEIS and the 3 Supplement to the Draft Solar PEIS. The need for these corrections was identified in several 4 ways: through comments received on the Draft Solar PEIS and the Supplement to the Draft 5 (and verified by the authors), through new information obtained by the authors subsequent to 6 publication of the Draft Solar PEIS and the Supplement to the Draft, or through additional 7 review of the original material by the authors. Table 8.1.26-1 provides corrections to information 8 presented in the Draft Solar PEIS and the Supplement to the Draft. 9 10
Fin
al S
ola
r PE
IS
8.1
-93
July 2
012
TABLE 8.1.26-1 Errata for the Proposed Brenda SEZ (Section 8.1 of the Draft Solar PEIS and Section C.1.1 of the Supplement to the 1 Draft Solar PEIS) 2
Section No.
Page No.
Line No.
Figure No.
Table No.
Correction
8.1.11.2 All uses of the term “neotropical migrants” in the text and tables of this section
should be replaced with the term “passerines.”
8.1.14.1 8.1-171 25-27 The Draft PEIS incorrectly indicated that a VRI was completed for the areas included within the Brenda SEZ in 2010. According to the Lake Havasu RMP, the VRI was completed in mid-2004.

Final Solar PEIS 8.1-94 July 2012
1 2 3 4 5 6 7 8 9 10 11 12
This page intentionally left blank. 13 14
15