novel strategies for removal of geosmin and 2mib …
TRANSCRIPT

NOVEL STRATEGIES FOR
REMOVAL OF GEOSMIN AND
2MIB RELATED OFF-FLAVOUR IN
RAS PRODUCTION
Number of words: 23937
LE DANG KHOA TRAN
Student Number: 01700942
Promotors: Dr. ir. Nancy Nevejan, Prof. Dr. Ir. Peter Bossier
Tutors: Brecht Stechele
Master’s Dissertation submitted to Ghent University in partial fulfilment of the requirements
for the degree of Master of Science in Aquaculture
Academic year: 2018-2019

i
Copyright
"The author and the promoters give permission to make this master dissertation
available for consultation and to copy parts of this master dissertation for personal
use. In the case of any other use, the copyright terms have to be respected, in
particular with regard to the obligation to state expressly the source when quoting
results from this master dissertation."
Gent University, 23rd August 2019
Promoter: …………………… Promoter: ………………………
Dr. ir. Nancy Nevejan Prof. Dr. ir. Peter Bossier
Author: ……………………....
Le Dang Khoa Tran

ii
Acknowledgement
Finishing this thesis was my endeavor from the beginning of my journey in
Belgium. With it, I am one step closer to achieving my master’s degree.
Completing it has been a long, difficult but memorable journey. I would like to use
this opportunity to express my deepest gratitude all the peoples who have
supported me.
Firstly, I would like to express my gratefulness to my promoter, Dr Nancy Nevejan
and my tutor, Brecht Stechele for given me the opportunity to take part in their
research and given me invaluable help whenever I needed. My thanks also go to
Project AquaVlan 2, because this work would not have been possible without the
support of the Project AquaVlan 2 which is financed by the Interreg V programme
Flanders-The Netherlands, the cross-border collaboration programme with
financial support from the European Fund for Regional Development
(www.grensregio.eu). Results presented in this thesis are obtained with
infrastructure funded by EMBRC Belgium - FWO agreement 20151029-03 and
Hercules agreement 20140910-03
Secondly, I would like to express my sincere gratitude to Prof. Dr. Ir. Peter Bossier
who has given me the wonderful experience of studying in Ghent University. My
special thanks to the administrative and technical staff at the ARC for their
assistance and advise during my time studying and working there.
Thirdly, I would like to express my appreciation to my parents on my quest for
knowledge. They have given me all the support a parent could give to their son.
This thesis is dedicated to them.
Last but not least, I thank all my colleague from the Master of Science in
Aquaculture program 2017-2019 for their wonderful support both in life and in
work.

iii
Table of Contents
Copyright ................................................................................................ i
Acknowledgement ................................................................................... ii
Table of Contents ................................................................................... iii
List of figures ........................................................................................ vi
List of tables ......................................................................................... viii
List of Abbreviations ............................................................................... ix
Abstract ................................................................................................ xi
Chapter 1. Introduction ............................................................................ 1
1.1 Background information ................................................................... 1
1.2 Research problem identification and justification .................................. 2
1.3 Objective ....................................................................................... 2
Chapter 2. Literature review...................................................................... 3
2.1. Off-flavour in Aquaculture ................................................................ 3
2.2. Introduction to geosmin and 2-methylisoborneol (2-MIB)...................... 3
2.3. Presence of geosmin and 2-MIB in aquaculture systems ....................... 6
2.4. Uptake of geosmin and 2mib in fish ................................................... 8
2.5. Disadvantages due to the taste and odor compounds in aquaculture ....... 9
2.6. Removal of geosmin and 2-MIB ...................................................... 10
2.6.1. Depuration ............................................................................ 10
2.6.2. Physical/Chemical removal ....................................................... 12
2.6.3. Biological removal ................................................................... 13
2.6.4. Geosmin and 2-MIB degrading bacteria ...................................... 16
Chapter 3. Materials and methods ............................................................ 19
3.1. Section 1: Pilot experiment ............................................................ 19
3.1.1 Aim ....................................................................................... 19
3.1.2 Experimental set up ................................................................. 19
3.1.3 Geosmin analysis ..................................................................... 20
3.1.4 Flow cytometer measurement .................................................... 21
3.1.5 Testing bacterial growth on different agar media ........................... 24
3.2. Section 2: Selection for geosmin-degrading fresh water micro-organism 24
3.2.1 Selection ................................................................................ 24
3.3. Section 3: Applicability of isolated strains ......................................... 26

iv
3.3.1. Isolation of geosmin-degrading micro-organism strains ................. 26
3.3.2. Preliminary toxicity screen of isolated strains using Artemia ........... 27
3.3.3. Identification of isolated trains .................................................. 28
3.3.4. BIOLOG™ assay ..................................................................... 28
3.3.5. MTT formazan assay ................................................................ 29
3.3.6. Growth and geosmin degradation activity of isolated strains .......... 30
3.4. Section 3: Evaluation of geosmin and 2-MIB removal capacity of zeolite
filter using different flow rates .............................................................. 31
3.5. Section 4: Statistical analysis ......................................................... 33
Chapter 4. Results ................................................................................. 34
4.1. Section 1: Pilot experiment ............................................................ 34
4.1.1. Growth monitoring .................................................................. 34
4.1.2. Geosmin degradation test ........................................................ 35
4.1.3. Testing bacteria growth on different agar media .......................... 36
4.2. Section 2: Selection for geosmin-degrading fresh water micro-organism 37
4.2.1. Selection experiment ............................................................... 38
4.3. Section 3: Applicability of isolated strains ......................................... 39
4.3.1. growth of the selected micro-organism ....................................... 39
4.3.2. Preliminary toxicity screen of selected strains using Artemia .......... 41
4.3.3. Identification of isolated strains ................................................. 43
4.3.4. BIOLOG™ assay ..................................................................... 43
Table 14. BIOLOG™ result of 5 isolated and identified strains .................. 43
4.3.5. MTT Formazan Assay ............................................................... 45
4.3.6. Growth and geosmin degradation activity of isolated strains .......... 47
4.4. Section 4: Evaluation of geosmin and 2-mib removal capacity of zeolite
filter using different flow rate ............................................................... 51
Chapter 5. Discussion ............................................................................ 52
5.1. Section 1: Pilot experiment ............................................................ 53
5.1.1. Flow cytometry measurement ................................................... 54
5.1.2. Testing bacteria growth on different agar media .......................... 54
5.2. Section 2: Selection for geosmin-degrading freshwater microbes ......... 55
5.2.1. Selection experiment ............................................................... 55
5.3. Section 3: Applicability of isolated strains ......................................... 56
5.3.1. Isolation of geosmin degrading bacteria...................................... 56

v
5.3.2. Toxicity screen on artemia........................................................ 56
5.3.3. Identification .......................................................................... 57
5.3.4. BIOLOG™ assay ..................................................................... 59
5.3.5. MTT-formazan assay ............................................................... 59
5.3.6. Growth and geosmin degradation activity of isolated strains .......... 60
5.4. Section 4: Evaluation of geosmin and 2-mib removal capacity of zeolite
filter using different flow rate ............................................................... 61
5.5. Section 5: Implication for application in aquaculture .......................... 62
Chapter 6 General conclusion .................................................................. 64
Chapter 7: Recommendations for further research ...................................... 66
8. List of references ............................................................................... 67
9. Appendixes ....................................................................................... 79

vi
List of figures
Figure 1. The biochemical pathways for the formation of geosmin and 2MIB in
Streptomycetes and Myxobacteria .............................................................. 6
Figure 2. Schematic of a RAS system (adapted from Yoshino et al., 1999) ....... 7
Figure 3. Schematic description of the geosmin occurrences and transport of
geosmin ................................................................................................ 9
Figure 4. Set-up pilot experiment ............................................................. 21
Figure 5. Glass capped vial for geosmin sampling ....................................... 21
Figure 6. Scheme of sample loading for flow cytometry. ............................. 23
Figure 7. Beckman Coulter CytoFLEX™ flow cytometer ................................ 23
Figure 8. Example of gating for bacteria density estimation using PC5.5 and FITC
.......................................................................................................... 24
Figure 9. L.E.D Techno Spiral System® Spiral plating machine ..................... 25
Figure 10. Tecan Infinite® 200 PRO machine ............................................ 26
Figure 11. Scheme of sample loading in MTT plate. ..................................... 30
Figure 12. Reactors on rotator. ................................................................ 31
Figure 13. Zeolite filter design, input (left) and 2 outflows (right) .................. 32
Figure 14. Zeolite filter flow rate measurements ......................................... 32
Figure 15. Microbial density in fresh mineral water (F++) and salt mineral water
(S++) with geosmine as sole carbon source (33 ng.L-1) monitored by
flowcytometry during 2 weeks ................................................................. 34
Figure 16. flocculant forming in treatment reactor (right) and no flocculant
forming in blank (left) ............................................................................ 35
Figure 17. Potential of mixed bacterial population to breakdown geosmin after 15
days of growth on selective media. .......................................................... 36
Figure 18. Bacteria count on 4 different agar media after 72H of culture. ....... 37
Figure 19. Microbial density of freshwater treatment monitored by flow
cytometry (A), plate counting (B) and OD (C). ........................................... 39
Figure 20. Growth curves in LB of isolated strains. ...................................... 41
Figure 21. Survival rate of Artemia franciscana nauplii challenged with isolated
microbes’ strains after 24 hours (A) and 48 hours (B) ................................. 42
Figure 22. 5 isolated strains cultured in LB broth.. ...................................... 43
Figure 23. MTT formazan results of 2 different treatments ........................... 45

vii
Figure 24. Optical density at 570nm of treatment with cells suspended in 2
different media: mineral medium (A) and distilled water (B).. ....................... 46
Figure 25. Microbial density of different single strain monitored by flow
cytometry (A), plate counting (B) and OD (C). ........................................... 48
Figure 26. Geosmin concentration over 96 hours.. ...................................... 50
Figure 27. Geosmin and 2-MIB levels after zeolite filter at different flow rate .. 51
Figure 28. Schematic of sample loading for flow cytometry. ......................... 80
Figure 29. Screenshot of a typical flowcytometry measurement .................... 82
Figure 30. Normal sample flow (left), distilled water cleaning well (right)....... 83
Figure 31. Strain F1, dye (left) versus no dye (right) ................................... 84
Figure 32. Strain F2, dye (left) versus no dye (right) ................................... 84
Figure 33. Strain F4, dye (left) versus no dye (right) ................................... 85
Figure 34. Strain F9, dye (left) versus no dye (right) ................................... 85
Figure 35. Strain F10, dye (left) versus no dye (right) ................................. 85

viii
List of tables
Table 1. Chemical and physical characteristics of geosmin and 2-MIB............... 4
Table 2. Geosmin and 2-MIB producing bacteria found in RAS (adapted from
(Azaria & van Rijn, 2018) ......................................................................... 8
Table 3. Depuration systems and required time for various fish species (adapted
from Azaria & van Rijn, 2018) ................................................................. 11
Table 4. Biological removal of geosmin and MIB in filters and by different
materials (Adapted from Azaria & van Rijn (2018)) ..................................... 15
Table 5. Summary of geosmin and 2-MIB degrading bacteria (adapted from
Azaria & van Rijn (2018)) ....................................................................... 17
Table 6.Setup of the pilot experiment aiming at selecting micro-organisms that
can grow on geosmin as sole carbon source. Geosmin was added in a
concentration of 33ng.L-1 ........................................................................ 19
Table 7. Content of mineral medium (adapted from Guttman & van Rijn, 2012)
.......................................................................................................... 20
Table 8. Trace element solution (Stanier et al,. 1971) ................................ 20
Table 9. Flow cytometer gain setup for microbial density measurement. ......... 22
Table 10. Excitation and emission peaks of TO and PI dyes (nm) and Detection
bandwidth of FITC, PE and PC5.5 channels (nm) ........................................ 22
Table 11. Content of modified mineral medium (adapted from Guttman & van
Rijn, 2012) (L-1) .................................................................................... 26
Table 12. Different flow rate and retention time used in zeolite experiment ..... 33
Table 13. Identification result of the selected 5 bacterial strains. .................. 43
Table 14. BIOLOG™ result of 5 isolated and identified strains ....................... 43
Table 16. Gain setting for flow cytoFLEX flowcytometer ............................... 81
Table 17. result from zeolite filter test in INAGRO ....................................... 90

ix
List of Abbreviations
2-MIB 2-methylisoborneol
ANOVA Analysis of variance
ARC Aquaculture and Artemia Reference Centre
BLAST Basic Local Alignment Search Tool
CASO Tryptic Soy Agar
CFU Colony forming unit
CSID Chemspider identification
DNA Deoxyribonucleic acid
DO Dissolved oxygen
DW Drinking Water
EBCT Empty Bed Contact Time
FITC Fluorescein isothiocyanate
FSC Front Scatter
HRT Hydraulic Retention Time
ILVO Institute for Agricultural and Fisheries Research (Instituut
voor Landbouw-en Visserijonderzoek)
LB Luria-Bertani
LEU leucine pathway
M Mean
MA Marine Agar
MEP 2-methylerythritol-4-phosphate pathway

x
MEV mevalonate pathway
MM Mineral Medium
MTT Thiazolyl Blue Tetrazolium Bromide
NA Nutrient Agar
NA Not Analysed
NR Not Relevant
OD Optical density
PC5.5 PerCP-Cy™5.5
PE R-phyco- erythrin
PI Propidium Iodide
RAS Recirculated aquaculture systems
rpm Revolutions per minute
SD Standard deviation
SPME Solid-Phase Micro Extraction
SPSS Statistical package for the social sciences
SSC Side Scatter
TO Thiazole orange
UV Ultra Violet

xi
Abstract
Off-flavour of aquaculture RAS products is a major problem for the industry that
affects market demand and prices. Off-flavour originates from geosmin and 2-
methylisobornoel (2-MIB). In this study, micro-organisms, capable of degrading
geosmin, were selected, identified, and evaluated on applicability in RAS systems.
In a first step, micro-organisms capable of degrading geosmin were selected by
inducing growth on the off-flavour molecule as sole carbon source based on the
protocol of Then, thirteen selected strains of bacteria and fungi were evaluated on
several criteria related to applicability in RAS. Growth potential was established
on Luria-Bertani (LB) media. Toxicity of the strains was tested on Artemia.
BIOLOG™ assays were performed on all strains. Strains were identified using 16s
sequencing. Cell metabolic activity on geosmin was tested using Thiazolyl Blue
Tetrazolium Bromide (MTT) assays. Finally, five most promising strains were
evaluated for their geosmin degradation potential using low geosmin
concentrations as sole carbon source. Geosmin degradation was evaluated using
gas chromatography in combination with SPME. The bacterial growth on geosmin
was evaluated using different techniques namely flowcytometry, formation of
flocculants, OD measurements and CFUs.
After 96 hours in LB, all the strains reached stationary phase, indicating that all
selected strains are particularly slow growing micro-organisms. Mortality of
Artemia caused by the different strains in challenge tests varied widely both
between strains and between repeated experiments. Among the tested strains
only 5 strains proved not to be toxic (p<0.05). Identification of the 5 strains
through 16s sequencing revealed 4 genera: Bosea sp., Mycobacterium sp.,
Roseomonas sp. and Brevundimonas sp.. BIOLOG™ assays indicated that the 5
strains varied significantly in affinity for certain C-sources, indicating that strains
are metabolically different from each other. MTT assays clearly showed that
Mycobacterium sp. and Bosea sp. F2 showed an increased metabolic activity when
grown in a with geosmin enriched environment as compared to negative control.
Growth of micro-organisms in media with only geosmin as carbon source resulted
in overall slow growth with Mycobacterium sp. performed best compared to the
others. Roseomonassp. and Brevundimonassp. showed no growth at all over the
duration of the experiment. On the other hand, based on the result of geosmin
degradation test, Mycobacteriumsp. and Brevundimonassp. were the only strains

xii
capable to degrade geosmin, with implication on different mechanisms. Results
from this study are promising, with at least 3 strains (Mycobacterium sp., Bosea
sp. F2 and Brevundimonas sp.) proven to be able to remove geosmin in at least
one test. To be able to apply these strains in biofilters for aquaculture purposes,
further research on toxicity and mechanism of action is required.
In addition to this microbiological approach, physical removal of geosmin and 2MIB
was tested with a specially designed zeolite filter. Tests were carried out in a semi-
commercial and commercial fish farm, but the zeolite filter proved to be ineffective
in removing geosmin and 2-MIB from RAS water.
Keyword: geosmin, 2-methylisoborneol, Mycobacterium, Brevundimonas,
flowcytometry

1
Chapter 1. Introduction
1.1 Background information
Off-flavour of aquaculture products is a major problem for the industry that affects
market demand and prices (Tucker, 2000). The undesirable taste and odor are
linked to the presence of certain metabolites such as aliphatic hydrocarbons,
sulfur-containing compounds, aldehydes, ketones and especially geosmin and 2-
methylisoborneol (2-MIB) (Jüttner, 1988; Kenefick et al, 1986). Repulsive taste
and odor are encountered in many species such as common carp (Cyprinus carpio)
(Tucker, 2000), channel catfish (Ictalurus punctatus) (Lovell et al., 1986; Martin
et al, 1988), rainbow trout (Oncorhynchus mykiss) (Schrader et al, 2010) and
Nile tilapia (Oreochromis niloticus) (Yamprayoon & Noomhorm, 2000) and in
almost all species cultured in recirculation aquaculture systems (RAS) (Azaria &
van Rijn, 2018).
Geosmin and 2-MIB can be produced by several different species belonging to the
genus of Streptomycetes (Gerber & Lechevalier, 1965; Medsker et al, 1969) and
Cyanobacteria (Safferman et al.,1967; Tabachek & Yurkowski,1976).
Furthermore, geosmin and 2-MIB are potentially produced by other organisms
including Myxobacteria (Breheret et al,1999; Dickschat et al, 2005), fungi (Smith
et al, 2008)and amoeba of the genus Vanella (Hayes et al, 1991).
Unlike most other production problems in aquaculture, off-flavour does not affect
the growth or health of the animals (Tucker, 2000), however, its economic impact
is high, making it one of the most severe challenges of the aquaculture industry
worldwide (Jonns et al., 2017). Depuration-keeping fish in running fresh water
without feeding- is the most adapted practice to eliminate off-flavour. Not only
increasing production cost by US$ 8 million, this is also a risky procedure, as
delays in harvest result in additional feed costs and forfeiture of income from
foregone sales since producers are forced to delay the restocking of ponds.
Furthermore, loss of weight and mortality of fish during the holding period is
possible due to disease, water quality deterioration, and bird predation (Tucker,
2000).

2
Although being a serious problem faced by the aquaculture industry, especially in
RAS systems, only a few studies have been carried out to find out the possible
causes and remediate this problem in so far.
1.2 Research problem identification and justification.
As RAS systems provide the ideal condition for micro-organism that produce off-
flavour to thrive, fish produced in RAS has been plague by the odor of geosmin
and 2MIB ever since. Different removal methods have been used including
activated carbon, both granulated and powdered (Azaria & van Rijn, 2018; Chen
et al., 1997; Lalezary et al., 1988) oxidation by UV light. These methods, although
working well in drinking water treatment, performed poorly in the high organic
loaded and high turbidity environment of a RAS system (Cook et al., 2001;
Zoschke et al., 2011). As physical and chemical methods proved unreliable and
inapplicable in RAS systems, biological methods have been turned to as an
alternative. Guttman & van Rijn (2009), McDowall et al (2009) and Hsieh et al
(2010) observed that sludge derived from the digestion basin of a marine system
possesses the ability to absorb and degrade both geosmin and 2-MIB.
Because of their flexibility and ease of application in the biofilter of a RAS system,
micro-organism has been investigated more and more recently. Microbes capable
of degrading geosmin and 2MIB have recently been isolated (Azaria & van Rijn,
2018). This study focusses on a protocol to isolate micro-organism that can
remove geosmin and evaluate certain characteristics of isolates in order to decide
they can be applied in aquaculture.
1.3 Objective.
This study has as objective to develop the protocol to isolate micro-organisms that
are able to degrade geosmin and to test the isolates for their growth, toxicity and
metabolic activity. Furthermore, the ability of zeolite to remove geosmin and 2-
MIB from RAS water was also tested.

3
Chapter 2. Literature review
2.1. Off-flavour in Aquaculture.
Off-flavour of aquaculture products is a major problem for the industry that affects
market demand and prices (Tucker, 2000). Off-flavour can originate from the
animal’s diet or post-harvest management strategy but is mainly caused by
odorous microbial metabolites which are absorbed from the water environment
and deposited in edible tissues(Tucker, 2000; Schrader & Rimando, 2003). The
undesirable taste and odor are linked to the presence of certain metabolites such
as aliphatic hydrocarbons, sulfur-containing compounds, aldehydes, ketones and
especially geosmin and 2-methylisoborneol (2-MIB) (Jüttner, 1988; Kenefick et
al, 1986). The most common description of off-flavour is the musty, earthy smell
which originates from geosmin and 2-MIB, which has been described by Mallevialle
& Suffet (1987) and Suffet et al, (1999). In aquaculture, geosmin and 2-MIB
related undesirable taste and odor have been observed as early as in the mid-
16th century in common carp (Cyprinus carpio) (Tucker, 2000), other recorded
affected species includes channel catfish (Ictalurus punctatus) (Lovell et al., 1986;
Martin et al, 1988), rainbow trout (Oncorhynchus mykiss) (Schrader et al, 2010)
and Nile tilapia (Oreochromis niloticus) (Yamprayoon & Noomhorm, 2000)
cultured in open ponds and in almost all species cultured in RAS systems (Azaria
& van Rijn, 2018). As an interesting anecdote, repulsive taste and odor are not
only encountered in water and aquaculture products but also in others such as
wine (Darriet et al, 2000; Lisanti et al, 2014), fruits (La Guerche et al, 2005)
beans (Buttery et al, 1976).
2.2. Introduction to geosmin and 2-methylisoborneol (2-MIB).
Both geosmin and 2-MIB are tertiary alcohols, each of which exists as (+) and (−)
enantiomers and odor outbreaks are caused by biological production of the
naturally occurring (−) enantiomers (Jüttner & Watson, 2007) while Polak &
Provasi (1992) has stated that (−) geosmin has 11 times lower detection
threshold than its (+) enantiomers. Both geosmin and 2-MIB are very potent
flavour-impairing chemicals with geosmin being described as smelling muddy,
earthy while 2-MIB as musty, camphor, moldy and basement-like (Suffet et al.,
1999). Human detection threshold for these compounds is as low as 10 to 30 ng.L-
1 in water (Srinivasan & Sorial, 2011) and 6 µg.kg-1 in fish (Yurkowski & Tabachek,
1974) However, the human perception of geosmin and 2-MIB greatly varies
4
among individuals and species of fish (Persson, 1980) because both compounds
are lipophilic and are being deposited in the fatty tissue of the cultured animals.
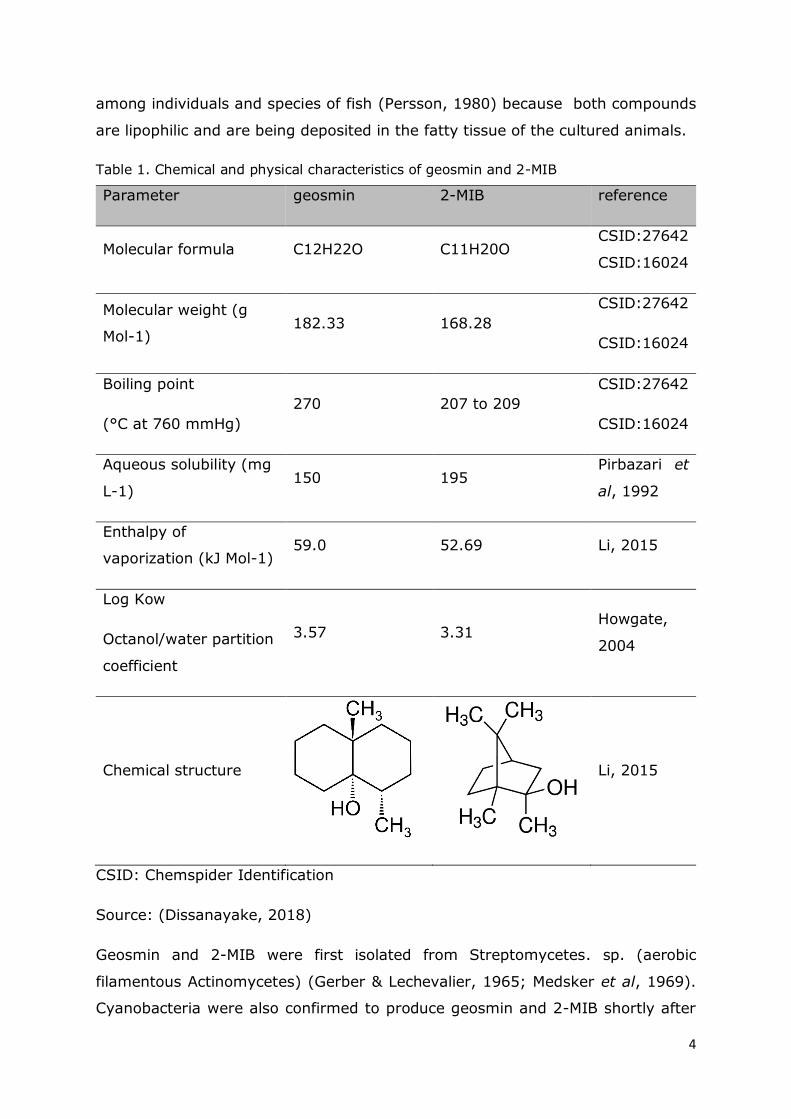
Table 1. Chemical and physical characteristics of geosmin and 2-MIB
Parameter geosmin 2-MIB reference
Molecular formula C12H22O C11H20O CSID:27642
CSID:16024
Molecular weight (g
Mol-1) 182.33 168.28
CSID:27642
CSID:16024
Boiling point
(°C at 760 mmHg)
270 207 to 209
CSID:27642
CSID:16024
Aqueous solubility (mg
L-1) 150 195
Pirbazari et
al, 1992
Enthalpy of
vaporization (kJ Mol-1) 59.0 52.69 Li, 2015
Log Kow
Octanol/water partition
coefficient
3.57 3.31 Howgate,
2004
Chemical structure
Li, 2015
CSID: Chemspider Identification
Source: (Dissanayake, 2018)
Geosmin and 2-MIB were first isolated from Streptomycetes. sp. (aerobic
filamentous Actinomycetes) (Gerber & Lechevalier, 1965; Medsker et al, 1969).
Cyanobacteria were also confirmed to produce geosmin and 2-MIB shortly after

5
by Safferman et al. (1967)and Tabachek & Yurkowski (1976). Furthermore,
geosmin and 2-MIB are potentially produced by other organisms including
Myxobacteria (Breheret et al,1999; Dickschat et al, 2005), fungi (Smith et al,
2008), amoeba of the genus Vanella (Hayes et al, 1991) and interestingly also in
the plant (Symphyogyna brongniartii) (Spörle et al, 1991). Most odor producing
Cyanobacteria species produced either geosmin or 2-MIB, however, there are
records of both compounds been produced simultaneously in strains of Oscillatoria
(Tsuchiya & Matsumoto, 1999; Wu & Jüttner, 1988) and Phormidium sp.
(Izaguirre, 1992).
Although both Actinomycetes and Cyanobacteria can produce odorous
compounds, it is adopted that Cyanobacteria are the cause for most off-tasting
and odorous problems in nutrients enriched environment such as aquaculture
pond (Jüttner, 1995), with geosmin and 2-MIB as a secondary metabolites related
to photosynthesis and pigment synthesis. As Cyanobacteria thrive in nutrient-rich
environments, the seasonal variation of Cyanobacteria is linked closely with the
fluctuation in water quality, making them easier to be identified as compared to
Actinomycetes (Watson et al., 2007). Tucker (2000) stated that because of the
light-limited nature of eutrophic ecosystem, free living organisms that are living
high in the water column have a competitive advantage as compared to the
benthic or substrate attached organism such as Actinomycetes.
On the other hand, Actinomycetes growth is poorly correlated with the production
of geosmin and 2-MIB. Although first identified as a producer of odorous
compounds, the capacity to produce odorous compounds varied greatly between
different strains (Kenefick et al., 1992). Cross (1981) has suggested that
Actinomycetes are relatively inactive in most aquatic environment. This, combined
with the fact that they can be outcompeted by Cyanobacteria in open aquaculture
system, makes it harder to detect and identify them.
According to Jüttner & Watson (2007), these two compounds are believed to be
produced along three different pathways in Streptomycetes and Myxobacteria: 2-
methylerythritol-4-phosphate (MEP) pathway, mevalonate pathway (MEV) and/or
the leucine pathway (LEU).

6
Figure 1. The biochemical pathways for the formation of geosmin and 2MIB in
Streptomycetes and Myxobacteria (Jüttner & Watson, 2007)
According to Jüttner & Watson (2007), MEP is the major isoprenoid biosynthetic
pathway in many bacteria. On the other hand, in some groups of Myxobacteria,
MEV pathway is active in the production of isoprenoids including geosmin (figure
1). MEV pathway also contributes to geosmin production in the stationary growth
phase of Streptomycetes. Furthermore, there are evidences that MEP is active
during growth and MEV in the stationary growth in Actinomycetes (Seto et al.,
1998; Seto et al., 1996)
2.3. Presence of geosmin and 2-MIB in aquaculture systems.
Until recently, it is established that for conventional aquaculture systems such as
ponds, Actinomycetes and Cyanobacteria are the main contributors of odorous
compounds with cyanobacteria dominating in nutrients-rich, outdoor ponds with
direct sunlight (Jüttner, 1995). Observations by Lanciotti, Santini et al(2003) have
shown that during winter, Actinomycetes is the main the producer of off-tasting
compounds.
RAS is a technology for intensive aquaculture, based on the filtration and
recirculation of water, thus limiting discharge to as low as 1%. RAS is also versatile
and can be applied for both indoor and outdoor, and both for marine and fresh

7
water species. Like conventional pond systems, RAS cultured animals are also
subjected to off-tasting problems.
Figure 2. Schematic of a RAS system (adapted from Yoshino et al., 1999) FBF-
Floating Bead Filters; BC- Biological Filter; UV- Ultra Violet; RBC –
rotating biological contactor
Since the RAS environment is high in nutrients and high in turbidity, combined
with the availability of substrate and biofilm in the filtration system, Actinomycetes
play a key role in the production of geosmin and 2-MIB. A recent study of Azaria
& van Rijn (2018) has shown that Actinomycetes accounted for half of the
microorganism identified in a RAS system and they are found in almost all
components of the system.
On the other hand, Lukassen et al., 2017 indicated that Myxococcales,
Actinomycetales, and genus Sorangium were the main geosmin producing bacteria
in European RAS. Specifically, four species of Actinomycetes (Nocardia
cummidelens, Nocardia fluminea, Streptomyces albidoflavus, and Streptomyces
luridiscabiei) were isolated from biosolids from a RAS used for rainbow trout
production (Schrader & Summerfelt, 2010). Relatively high geosmin and 2-MIB
concentrations and higher in vitro production was reported in the aerobic
components (drum filter and a trickling filter) of the RAS (Guttman & van Rijn,
2008).

8
Table 2. Geosmin and 2-MIB producing bacteria found in RAS (adapted from (Azaria &
van Rijn, 2018)
Bacteria Fish Location in
RAS Reference
Nocaradia cummidelends
Rainbow
trout
Biofilter bed
Schrader &
Summerfelt, 2010
Nocardia fluminea Culture tank
Streptomyces luridiscabiei Heat
exchanger
Streptomyces albidoflavus Drum filter
Streptomyces roseoflavus Hybrid
tilapia
Trickling
filter
Guttman & van
Rijn, 2008 Streptomyces
thermocarboxydus
Streptomyces anulatus Brook
trout
Culture
water Auffret et al., 2011 Streptomyces flavogriseus
Myxococcus xanthus
Sorangium sp. Rainbow
trout
Trickling
filter Auffret et al., 2013
Nannocystis sp.
Sorangium sp. Not
reported
Moving bed
filter
Lukassen et al.,
2017 Actinobacteria spp.
Myxobacteria sp.
2.4. Uptake of geosmin and 2mib in fish.
Off-flavour can be taken up in fish tissue via several routes. Fish can ingest
microbial cells containing intracellular storages of geosmin or 2-MIB, as indicated
by the detection of geosmin-producing bacteria in the stomach, skin and intestinal
mucus layer (Gutierrez et al., 2006; Lukassen et al., 2017; Tucker, 2000; Watson
et al., 2016). A major uptake route is passive diffusion through water (From &
Hørlyck, 1984). According to Tucker (2000), most uptakes occurred across the
gills as their structure and functions enhance diffusion of substances between
water and blood. As with most odor-causing compounds, geosmin and 2-MIB are
lipophilic and upon uptake, are transported throughout the animal’s body via the
blood stream before being concentrated and stored in lipid-rich tissues such as
skin or visceral fat (Tucker, 2000).

9
As a result of their lipophilic nature, uptake of geosmin and 2-MIB is relatively
rapid but elimination is much slower (Persson, 1984; Rurangwa & Verdegem,
2015). As both substances are very potent odor inducers, exposing fish for only a
few minutes can cause sufficient accumulation to impair flavour. On the other
hand, elimination process through depurations can take days or even weeks
(Tucker, 2000). According to Johnsen & Lloyd (1992), accumulation of 2-MIB is
effected by the fat content and water temperature with temperature being more
important.
Figure 3. Schematic description of the geosmin occurrences and transport of geosmin
(Chung et al., 2016)
2.5. Disadvantages due to the taste and odor compounds in aquaculture.
Unlike most other production problems of aquaculture, off-flavour does not affect
the growth or health of the animals (Tucker, 2000), however, it’s economic impact
is high, making it one of the most severe difficulty in aquaculture industry
worldwide (Jonns et al., 2017). Most losses are incurred when depurating the fish,
which can go up to 30% of the potential revenues (Tucker, 2000). Products with
off-flavour can hardly find acceptance from the consumers. Furthermore, a first
time buyer may assume that off-flavour is inherent in aquaculture products in
general (Tucker, 2000), making it extremely difficult to compete with wild caught
fisheries products. This all makes market expansion more difficult.

10
Off-flavour has impacted economically both US and European aquaculture.
Production cost of catfish has been reported to increase by US$47 million in 1999
(Mississippi State University/MAFES). Problems caused by off-flavour are
estimated to increase production cost by 0.25 US$ per kilogram of fish (Hanson
et al., 2003) Losses from off-flavour in the United States catfish aquaculture
industry range from US$0.04 to US$0.26 per kg of catfish (farm gate price per kg
of catfish was US$2) (Engle et al., 1995). Catfish farmers are estimated to have
lost up to 12% annual revenue due to off-flavour in catfish (Kinnucan et al., 1988).
In Europe, it is estimated that the cost arising from depuration has reach the value
of 8 million Euros; this has a serious impact on the profit margin of the farmers
utilizing RAS. The three main causes for economic damage to the European
aquaculture industry related to off-flavour are consumer rejection of off-flavoured
fish, reduction of market volumes and prices and costs of depurating off-flavour
from fish crops (CORDIS, European Commission, 2018).
2.6. Removal of geosmin and 2-MIB
2.6.1. Depuration.
As human detection level for geosmin and 2-MIB is very low (Tucker, 2000), the
removal process must be done very well. There are several ways to remove
geosmin and 2-MIB in aquaculture: depuration, physical or chemical removal and
biological removal.
Depuration is the most common method used, based on the fact that the diffusion
of odorous compounds is driven by the difference in gradient between the
environment and the fish body, thus removing the fish from tainted water and
placing it in clean water can facilitate the movement of substances from the fish
flesh, through the gills and epithelial surfaces into the water (Azaria & van Rijn,
2018). On the other hand, the stripping of geosmin and 2-MIB proceeds at a much
slower pace as opposed to their accumulation (Persson, 1984; Rurangwa &
Verdegem, 2015), making depuration a long and potentially risky business, as
delays in harvest that result in additional feed costs and forfeiture of income from
foregone sales because producers are forced to delay restocking ponds.
Furthermore, loss of fish can occur during the holding period from disease, water
quality deterioration, and bird depredation (Tucker, 2000).
11
Depuration is a very disadvantageous process as it contradicts the concept of RAS
by consuming huge quantities of clean water in a flow through system. Also, to
minimize bacterial growth, fish are usually fasted, and this would lead to weight
loss and deteriorated fillet quality (Azaria & van Rijn, 2018; Burr et al., 2012;
Palmeri et al., 2008).To reduce depuration time, several methods are applied such
as using pre-disinfected basins with no aeration (Davidson et al., 2014) and
induced exercise to increase water movement through the gill thus increase
elimination rate (Schram, Schrama, Kusters et al., 2016). The depuration systems
and required time for various fish species are shown in table 3.
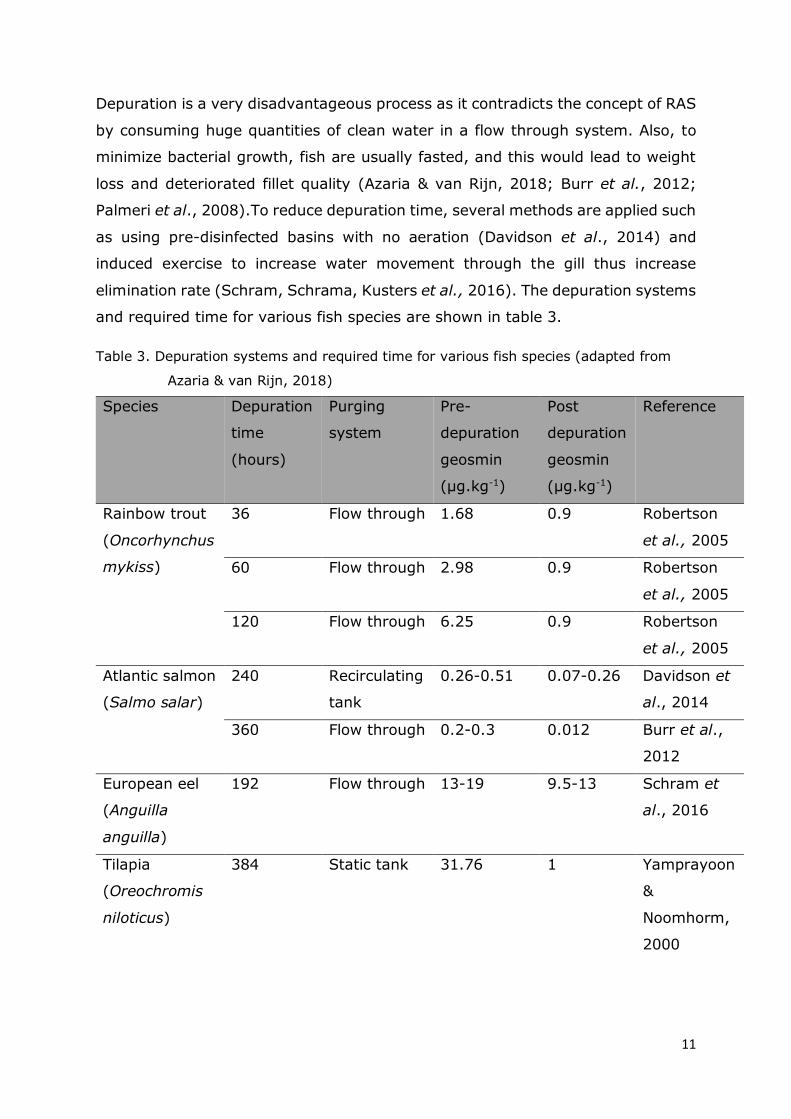
Table 3. Depuration systems and required time for various fish species (adapted from
Azaria & van Rijn, 2018)
Species Depuration
time
(hours)
Purging
system
Pre-
depuration
geosmin
(μg.kg-1)
Post
depuration
geosmin
(μg.kg-1)
Reference
Rainbow trout
(Oncorhynchus
mykiss)
36 Flow through 1.68 0.9 Robertson
et al., 2005
60 Flow through 2.98 0.9 Robertson
et al., 2005
120 Flow through 6.25 0.9 Robertson
et al., 2005
Atlantic salmon
(Salmo salar)
240 Recirculating
tank
0.26-0.51 0.07-0.26 Davidson et
al., 2014
360 Flow through 0.2-0.3 0.012 Burr et al.,
2012
European eel
(Anguilla
anguilla)
192 Flow through 13-19 9.5-13 Schram et
al., 2016
Tilapia
(Oreochromis
niloticus)
384 Static tank 31.76 1 Yamprayoon
&
Noomhorm,
2000
12
2.6.2. Physical/Chemical removal.
As they are hydrophobic, physical filtration of geosmin and 2-MIB by adsorption
materials such as activated carbon is achievable in both granular and powdered
form (Azaria & van Rijn, 2018; Chen et al., 1997; Lalezary et al., 1988). The
effectiveness of this method has been validated in the drinking water industry with
low organic matter content (Cook et al., 2001; Drikas et al., 2009; Herzing et al.,
1977). On the other hand, the effectiveness of activated carbon is greatly
diminished when applied to water with high organic content (Cook et al., 2001;
Zoschke et al., 2011) e.g. RAS water, which usually operate at relatively high
organic residue level (>10mg.L-1) (Azaria & van Rijn, 2018). The explanation for
the reduction in efficiency is the competitive adsorption of organic particles in RAS
water quickly clogged up the pores of activated carbon (Newcombe et al., 2002).
Furthermore, other factors have been proven to affect performance of activated
carbon such as pore volume (Yu et al., 2007). The presence of humic substances
in water also reduces the adsorption capacity of both geosmin and 2-MIB while pH
level has no significant impact on the process (Herzing et al., 1977). Activated
carbon particle size also matter as adsorptive removal of geosmin improved with
decrease in activated carbon particle size down to 1 mm but further particle size
reduction produced little improvement (Matsui et al., 2009). Azaria & van Rijn
(2018) stated that because the capability of manipulating water quality in RAS is
better than in most other aquaculture system, the removal of geosmin and 2-MIB
via activated carbon adsorption is feasible if one can manage the water quality
properly.
Apart from activated carbon, the removal of geosmin and 2-MIB can be achieved
using different materials such as hydrophobic substances such as polystyrene or
paraffin (Kelly et al., 2006). Chen et al (2011) has demonstrated the ability of
tablet ceramic adsorbent (TCA) in the removal of geosmin, stating several
advantages such as long lifecycle, effective regenerative performance and almost
no second contaminations. Zeolite is a microporous, aluminosilicate mineral
commonly used as commercial adsorbent and catalyst (Grace, 2010). The removal
of geosmin and 2-MIB in drinking water by an ultra-stable form of zeolite has been
validated by Ellis & Korth (1993). According to the authors, adsorption by zeolite
is not affected by water hardness and the presence of low concentration of humic
acid. However, removal of geosmin by zeolite has only been reported in laboratory

13
experiments a so far, no commercial application has been reported (Lindholm-
Lehto & Vielma, 2019).
Oxidation by UV, ozone and peroxide is another technology to remove geosmin
and 2-MIB, with experimental reports of removal rate in drinking water as high as
90% for geosmin and 60% for 2-MIB (40–43 ng.L-1 initial concentration) at the UV
dose of 1200 mJ.cm-2 with 6 mg.L-1 H2O2 (Collivignarelli & Sorlini, 2004; Jo et al.,
2011). Similar to adsorption, the efficiency of this method is greatly diminished in
water with high organic matter, both in drinking water and aquaculture water (Ho
et al., 2007; Schrader et al., 2010). Furthermore, the fact that this method incurs
high energy and capital costs (Srinivasan & Sorial, 2011), in combination with the
production of toxic by-product (Tango & Gagnon, 2003), greatly reduces its
applicability. A recent study of Nam-Koong et al (2016) introduced an alternative
method of using ultrasonic induced cavitation to remove off-flavour compound,
independent from the organic load of the water and different water type (tap
water, RAS fresh water, RAS sea water). Chemical approach was also considered
in the form of using biocide to control the growth of Actinomycetes and
Cyanobacteria, but given the operating nature of RAS system, this is implausible
(Schrader & Summerfelt, 2010)
2.6.3. Biological removal.
As physical and chemical methods proved unreliable and poorly applicable in RAS,
a novel method is required to control off-flavour in aquaculture. Biological
degradation of geosmin and 2-MIB was first reported by Silvey & Roach (1964).
Further research has identified strains of Bacillus cereus and Bacillus subtilis to be
responsible for the process (Narayan & Nunez, 1974; Silvey et al., 1970). Most
progress in biological removals of odorous compounds is made in the water
treatment industry (Saito et al., 1999), with biological geosmin and 2-MIB removal
examined in different reactors. Different components of a water treatment plant
and RAS can be utilized as a geosmin and 2-MIB removal unit, for example the
sand filter was used successfully to treat tainted water by McDowall et al.,
(2009)and Hsieh et al., (2010), with the former enriching the filter with geosmin-
degrading Proteobacteria. Combination of adsorption and biodegradation of
geosmin was achieved by 2 different filter types of activated carbon and expanded
clay (Persson et al., 2007). These components can be easily integrated into a RAS
system. Guttman & van Rijn (2009) found that sludge derived from the digestion

14
basin of a marine RAS system possesses the ability to absorb and degrade both
geosmin and 2-MIB. A summary of the biological removal of geosmin and 2-MIB
in different filter materials is shown in Table 4. Bioflocs produced from solid waste
of RAS was tested in vitro for the geosmin and 2-MIB biodegradable capability (Ma
et al., 2016). However, the removal of off-flavour compounds was underlain by
mainly adsorption (>90% of total removal).

15
Table 4. Biological removal of geosmin and MIB in filters and by different
materials (Adapted from Azaria & van Rijn (2018))
Filter type Water
type
EBCT
(min)/HR
T (hours)
Initial level
(ng.L-1)
Removal (%) References
Geosmin MIB Geosmin MIB
Filter
Sand filter DW 15 min 50-200 50-
200
>85 >85 Ho et al
(2007)
Sand filter DW 15 min 100 NA 75 NA McDowall
et al
(2009)
Sand filter DW 173 min 40-130 55-
126
87-96 48-
69
Hsieh et al
(2010)
RAS sludge RAS
water
4.34
hours
NA 800 NA 70 Azaria et al
(2017)
Activated
Carbon
DW 30 min 20 20 96 96 Persson et
al (2007)
Expanded
clay
DW 30 min 20 20 88 82 Persson et
al (2007)
Biomaterial
RAS sludge MM NR 400 450 83 95 Guttman &
van Rijn
(2009)
Biofilm DW NR 2500 NA 90 NA Xue et al
(2012)
Biofloc MM NR 1990 968 93 98 Ma et al
(2016)
EBCT: Empty Bed Contact Time
HRT: Hydraulic Retention Time
DW: Drinking Water
NA: Not Analysed
MM: Mineral Medium
NR: Not Relevant

16
2.6.4. Geosmin and 2-MIB degrading bacteria
As research on the biodegradation of geosmin and 2-MIB has recently started,
very little information regarding the mechanism and microbes involved can be
obtained. Early reports by Silvey et al., (1970) and Narayan & Nunez (1974) on
the degradation of geosmin and 2-MIB by strains of Bacillus cereus and Bacillus
subtilis prove unreliable as further experiments by MacDonald et al. (1987) and
Danglot et al (1983) cannot replicate the results when using the same strains. A
2-MIB degrading consortium of seven Pseudomonas species was isolated by
Izaguirre et al (1988) from sediment samples of MIB-tainted lakes. The
consortium was discovered to be actively degrading MIB when added as the sole
carbon source. On the other hand, it was found that the degradation process can
be greatly enhanced with the addition of another, readily available carbon source.
Similarly, Saito et al (1999) found that geosmin is extremely difficult to biodegrade
when it was used as the sole carbon source. In his experiments, an acceleration
of the reaction was achieved by adding ethanol. Furthermore, McDowall et al
(2009) were able to utilize a geosmin degrading consortium comprised of
Proteobacteria. Three bacterial geosmin-degrading species of the Proteobacteria
phylum, taxonomically related to Sphingopyxis alaskensis, Novosphingobium
stygium, and Pseudomonas veronii were reported by Hoefel et al (2006). These
findings imply that biodegradation of geosmin and 2-MIB is not accomplished by
a single strain of microbes but a consortium of bacteria and in this consortium,
the degradation process relied on metabolic cooperation between the consortium
members (Azaria & van Rijn, 2018). On the other hand, single bacteria
degradation of 2-MIB was achieved with Pseudomonas sp. and Enterobacter sp.
isolated from the backwash water of a water treatment plant (Tanaka et al., 1996),
proving that single strain degradation is not impossible. Experiments performed
by Luo et al. (2016) showed that the amount of 2-MIB removal in the inoculated
reactors was significantly greater than that of geosmin, suggesting that the
removal of 2-MIB is more efficient than that of geosmin. These findings differ from
earlier results of Ho et al. (2012) which demonstrate that geosmin appears to be
degraded more easily than 2-MIB by the bacteria within the sand filters and
bioreactors. A summary of different geosmin and 2-MIB degrading bacteria can
be seen in Table 5.

17
Biodegradation of geosmin and 2-MIB does not mean elimination of the repulsive
odor and taste, as the end products of several bacteria when degrading 2-MIB is
2-methylcamphene and 2-methylenebornane or camphor (Eaton, 2012; Tanaka
et al., 1996). These compounds also have the same muddy smell and taste as 2-
MIB, making the biodegradation process meaningless from the point of removing
off-flavour. Furthermore, several 2-MIB hydroxylation products were identified as
3-hydroxy-2-MIB, 6-hydroxy-2-MIB or 5-keto-2-MIB and 5-hydroxy-2-MIB. These
products, while being less volatile than MIB, still provoke a muddy smell (Eaton,
2012).
Table 5. Summary of geosmin and 2-MIB degrading bacteria (adapted from Azaria & van
Rijn (2018))
Species Compound Range
(ng/L)
Source Reference
Pseudomonas aeruginosa,
Pseudomonas paucimobilis
Pseudomonas
pseudoalcaligenes,
Pseudomonas mendocina,
Pseudomonas vesicularis,
Pseudomonas diminuita,
Moraxella osloensis
2-MIB 290-2×10⁶ Lake
water
Izaguirre et al
(1988)
Pseudomonas sp.,
Enterobacter sp.
2-MIB NA Water
treatment
biofilter
Tanaka et al
(1996)
Bacillus fusiformis, 2-MIB 25-20×106 Lake
water
Lauderdale et al
(2004)
Bacillus sphaericus
Micrococus sp.,
Flavobacterium spp.,
Brevibacterium spp.,
Pseudomonas sp.
2-MIB 515-
4.2×10⁶
Water
treatment
biofilter
Yuan et al (2012)

18
Pseudomonas putida G1,
Rhodococcus ruber T1,
Rhodoccocus
wratilaviensis
2-MIB 0.125×10⁶-
0.5×10⁶
Various Eaton & Sandusky
(2009)
Pseudomonas sp.,
Sphigomonas sp.
2-MIB NA Soil Eaton (2012)
Rhodococcus sp.,
Variovorax sp.,
Comamonas sp.
Geosmin
and 2-MIB
5000-
0.25×10⁶
RAS Guttman & van
Rijn (2012)
Sphingopyxis alaskensis,
Novosphingobium stygiae,
Pseudomonas veronii
Geosmin 40-20×106 Sand
filter
Hoefel et al
(2006)
Sphingopyxis sp. Geosmin 100-1000 Sand
filter
Hoefel et al
(2009)
Chryseobacterium
gambrini,
Sinorhizobium morelense,
Stenotrophomonas
maltophilia
Geosmin 560-2×10⁶ Activated
carbon
filter
Zhou et al (2011)
Pseudomonas sp.,
Rhodococcus
wratislaviensis
Geosmin 9.4×10⁶ Activated
sludge
Eaton & Sandusky
(2010)
Shinella zoogloeoides,
Bacillus idriensis,
Chitinophagaceae
bacterium
2-MIB 20×103 Sand
filter
Du et al (2016)
NA: Not Analysed

19
Chapter 3. Materials and methods
3.1. Section 1: Pilot experiment.
3.1.1 Aim.
The aim of this experiment is to test the feasibility of utilizing bacteria from
biofilter sludge to degrade geosmin in laboratory conditions.
3.1.2 Experimental set up.
The pilot experiment was carried out in the Laboratory of Aquaculture and Artemia
Reference Centre (ARC), Faculty of Bioscience Engineering, Ghent University,
Belgium (Table 6). Sea water sludge samples and fresh water sludge samples
were collected from ARC’s Macrobrachium rosenbergii and Litopenaeus vanamei
RAS culture systems respectively. Samples were filtered through a 30µm sieve,
and inoculated into 6 * 500mL sterilized glass reactors (sealed airtight) containing
100 mL of mineral medium (Table 7 & 8, Guttman & van Rijn, 2012) leading to a
final concentration of 105 cell.mL-1 without replicate. Bacterial densities in sieved
samples were measured using a flow cytometer (Beckman Coulter CytoFLEX™,
Fig. 7). A geosmin stock was prepared containing 5mg of pure geosmin (Wako
chemicals GmbH) in 625mL of autoclaved distilled water. A total of 0.33µg of
geosmin (0.04 mL of stock solution) was added to the glass reactor. This amount
was calculated to provide enough carbon for micro-organism to grow from 105
cells.mL-1 to 108 cells.mL-1 (based on data of Troussellieret al., 1997 (ANNEX I).
Table 6.Setup of the pilot experiment aiming at selecting micro-organisms that can grow
on geosmin as sole carbon source. Geosmin was added in a concentration of
33ng.L-1
Label Content
F++ Mineral medium, Fresh water sludge, geosmin
F+ Mineral medium, Fresh water sludge
F Mineral medium
S++ Mineral medium, Sea water sludge, geosmin, 0.3g NaCl
S+ Mineral medium, Fresh water sludge, 0.3g NaCl
S Mineral medium, 0.3g NaCl

20
Table 7. Content of mineral medium (adapted from Guttman & van Rijn, 2012)
Mineral Amount (L-1)
NH4Cl 0.05 g
MgSO4 · 7H2O 0.05 g
CaCl2 · 2H2O 0.02 g
K2HPO4 0.1g
FeCl3 · 6H2O 0.001 g
trace element solution 0.5 ml
Table 8. Trace element solution (Stanier et al,. 1971)
Mineral Amount (L-1)
H3BO3 2.86g
MnCl2.4H2O 1.81g
ZnSO4.7H2O 0.222g
Na2MOO4.2H2O 0.39g
CuSO4.5H2O 0.079g
Co(NO3)2.6H2O 0.0494g
The reactors were incubated in the dark, preventing algal growth. Temperature
was maintained at 28°C and reactors were shaken continuously (Fig. 4). Every 6
days, 100µL of geosmin stock (0.8µg) was spiked to the reactors to replenish
losses via evaporation and micro-organism’s consumption. After 10 days, the
cultures were diluted back to the original concentration of 105 cell L-1 by inoculating
part of the old cultures into fresh media in autoclaved reactors. The experiment
was carried out for the duration of 15 days. Sampling was carried out every 2 days
to monitor bacterial density with flow cytometer. Water samples were collected
using sterilized syringes and needles, then filter sterilized through 0.2 µm pore
filter. Capped glass vials were filled completely with the filtrate to prevent air
contact (Fig. 5) then stored in -4°C for a maximum of 13 days awaiting analysis.
3.1.3 Geosmin analysis.
At the end of growth experiment on day 15th, the selected bacteria were spiked
again with geosmin 0.33µg. Water samples were taken according to “3.1.1” at 0H,
24H and 96H and sent for Institute for Agricultural and Fisheries Research
(Instituut voor Landbouw-en Visserijonderzoek) – ILVO- for geosmin analysis.

21
For analysis of geosmin and 2-MIB, 10 ml of water was transferred to a SPME-vial
and 4.17 g of NaCl was added together with 20 µl stock solution of internal
standards geosmin-D5 and 2-methyl-d3-isoborneol. Samples were incubated at
80°C for 15 min, followed by extraction at 80°C for 25 min by a DVB/CAR/PDMS
SPME-fiber at an agitator speed of 500 rpm. Separation and detection took place
on an Agilent GC-MS, temperature programmed from 70°C to 230°C. Injection
temperature was 200°C. Separation was done on a select PAH column (Agilent,
30m, 0.25mm, 0.25 µm) with helium as carrier gas. Detection was done by
electron impact ionization in single ion mode with transfer line temperature at
340°C, ion source temperature at 300°C and quadruple temperature at 150°C. All
analyses were done ISO/IEC 17025 accredited.
Figure 4. Set-up pilot experiment Figure 5. Glass capped vial for geosmin
sampling
3.1.4 Flow cytometer measurement.
Protocol for microbial density measurements was adapted from Van Nevel et al,.
2013. A 96 wells plate was used for measurement of cell density with a dead/alive
assay. A total of 100µL of sample was mixed with 5µL of 17µM thiazole orange
(TO) and 5 µL of 1.9mM propidium iodide dye (PI). Dyes were well mixed with the
samples by pipet-mixing and the plates were incubated in the dark for 5 minutes
before measurement. Measurement channels were chosen based on the
compatibility of the detection bandwidth and the emission peak of the dye. In this

22
case Fluorescein isothiocyanate (FITC) channel was used to measure TO and
PerCP-Cy™5.5 (PC 5.5) channel was used to measure PI emission.
The flow cytometer detector sensitivity (gain) was set up as shown in Table 9,
with threshold put on FITC channel at 103. Particles were detected using the ‘area’
option rather than the ‘height’ option of the signal.
Table 9. Flow cytometer gain setup for microbial density measurement.
Gain Setting
Front Scatter (FSC) 165
Side Scatter (SSC) 400
Fluorescein isothiocyanate (FITC) 240
R-phyco- erythrin (PE) 180
Sample measurements were performed at 60µL.Min-1(high) flowrate for a time
period of 60 seconds, with a fixed volume of 60µL. All samples were loaded in
triplicate, followed by a distilled water well to remove the carry-over of
microorganisms between samples (Fig. 6). Bacterial density was determined via
gating on PC 5.5 versus FITC dot plot (Fig. 8).
Table 10. Excitation and emission peaks of TO and PI dyes (nm) and Detection
bandwidth of FITC, PE and PC5.5 channels (nm)
Dye/Channel Excitation peak Emission peak Detection bandwidth
TO 513 532
PI 534 617
FITC 525±40
PE 585±42
PC5.5 690±50

23
Sample Distilled water
Figure 6. Scheme of sample loading for flow cytometry. Measurements were performed
per row.
Figure 7. Beckman Coulter CytoFLEX™ flow cytometer
A
B
C
D
E
F
G
H
1 2 3 5 4 7 6 9 8 10 12 11

24
Figure 8. Example of gating for bacteria density estimation using PC5.5 and FITC
3.1.5 Testing bacterial growth on different agar media
After the selection period of 15 days, the growth of the selected micro-organism
was tested on different general-purpose agar media in order to choose the
medium best suited for isolation during follow-up experiments. The agar media
were chosen based on growth potential (CFU’s) and bacterial variety: Nutrient
Agar (NA); Luria-Bertani (LB); Marine Agar (MA) and Tryptic Soy Agar (CASO).
A total of 50µL of sample from each reactor was taken every 2 days and plated on
4 different agar media to find out the most suitable for these micro-organisms.
Three dilutions of 10-2, 10-3 and 10-4 were made in triplicate. Plates were incubated
in 28°C. Microbial growth was monitored visually at 24, 48 and 72 hours.
3.2. Section 2: Selection for geosmin-degrading fresh water micro-
organism.
The aim of this experiment is to select micro-organism that can utilize geosmin as
the sole carbon source for growth. As off-flavour in freshwater is more prominent
in fresh water RAS, also for practicality reason, only fresh water sludge was used.
3.2.1 Selection.
A subsequent experiment was carried out on freshwater micro-organism whereby
2 treatments were used, F++ and F (control) in triplicate. A modification was made

25
in the mineral media, substituting NH4Cl with NaNO3 to eliminate the possibility of
selecting nitrifying bacteria (Table 12). Sludge from the Macrobrachium
rosenbergii RAS system was filtered through 30µm sieve, then inoculated to 6 *
500mL reactors in order to reach 105 cells. mL-1. Every 6 days, 100µL of geosmin
stock (0.8µg) was spiked to the reactors to replenish losses via evaporation The
selection was carried out for the duration of 15 days. Live bacteria density was
monitored daily using flow cytometry following “3.1.4”. The formation of
flocculants was determined every 4 days by optical density at 550nm wavelength
using the fluorescent spectrophotometer Tecan Infinite® 200 PRO (Fig. 10). 25
measurement were made at different locations for each well, following 5 seconds
of orbital shaking. Water samples from each reactor were also plated on LB agar
every 4 days using a spiral plating machine L.E.D Techno Spiral System® (Fig.
9).Three dilutions were made: 10-2, 10-3 and 10-4. All measurement was carried
out in triplicate.
Figure 9. L.E.D Techno Spiral System® Spiral plating machine

26
Figure 10. Tecan Infinite® 200 PRO machine
Table 11. Content of modified mineral medium (adapted from Guttman & van Rijn,
2012) (L-1)
3.3. Section 3: Applicability of isolated strains.
In this section, bacteria community from both the pilot (Section 1) and selection
experiments (Section 2) were isolated, growth in LB broth, put through a toxicity
screen with Artemia nauplii. The non-toxic strains were selected and further tested
for metabolic activities with BIOLOG™ and MTT-formazan assay.
3.3.1. Isolation of geosmin-degrading micro-organism strains.
Geosmin-degrading micro-organisms from the mixture resulting from the
selection experiments, were isolated and a collection of pure cultures was built
that will be used in follow-up experiments.
Mineral Content
NaNO3 0.08g
MgSO4 · 7H2O 0.05 g
CaCl2 · 2H2O 0.02 g
K2HPO4 0.1g
FeCl3 · 6H2O 0.001 g
trace element solution 0.5 mL

27
13 single colonies were picked from the freshwater plates of the pilot experiment
(6 strains) and sellection experiment (7 strains), based on external morphologies
and used to inoculate sterile Erlenmeyer’s containing 20mL of LB broth. 50µL of
each strain was also plated on LB agar to further confirm the isolation result. For
microscopic observation, 50µL of culture broth was heat-fixed on a glass slide,
followed by Gram staining and observed under the microscope at 40x and 100x
magnification.
Growth curves of the isolated micro-organism was constructed by incubating
single strains in the 96 wells microplate in LB broth in 8 replicates. OD at 550nm
wavelength was measured at 25 different position per well at 12 hours intervals
for a total of 96 hours using the Tecan Infinite® 200 PRO.
3.3.2. Preliminary toxicity screen of isolated strains using Artemia.
The aim of this experiment is to test the toxicity of the isolated strains on aquatic
animals, utilizing Artemia franciscana nauplii as a robust model animal. The non-
toxic strains for Artemia were selected for further analysis.
3.3.2.1. Preparation.
Artemia nauplii was prepared following Kumar et al. (2018).A total 30mg Artemia
cyst (INVE Ocean Nutrition™) were rehydrated in 10mL distilled water for 1 hour,
follow by decapsulation by adding 330µL NaOH and 8mL NaClO for a maximum of
2 minutes. The decapsulation solution was neutralized by adding 10mL Na2S2O3
and washed with 400mL of sterile seawater. The decapsulated cysts were put in
30mL of sterile sea water and incubate for 24 hours for hatching.
Stock cultures of 14 isolated strains was prepared by inoculating 20mL LB broth
with 20µL of pure bacteria solution. The cultures were incubated for 96 hours at
28°C under continuous shaking, to make sure all strains have reached stationary
phase.
3.3.2.2. Assay.
5 artemia nauplii were selected and put into each well of a 96 well plate, containing
100 µL of 109 cells.mL-1bacterial stock, 150 µL of sterile seawater and 1.7 µL (107
CFU.mL-1) of autoclaved Artemia feed strain LVS3 to provide feed for the nauplii
for the duration of the experiment. There were 2 control treatments: Artemia

28
nauplii were kept in sterile LB broth (control 1) and sterile seawater (control 2).
All treatment was repeated 12 times. The plates were incubated at 28°C and
mortality was recorded at 24 and 48 hours post inoculation.
3.3.3. Identification of isolated strains.
Micro-organism DNA samples of 5 strains which shown highest Artemia survival
rate from the toxicity screen was sent to LGC Genomics GmbH for 16S rRNA
extraction and sequencing. Sequenced results were compared with online
database using Basic Local Alignment Search Tool (BLAST)
(https://blast.ncbi.nlm.nih.gov) to identify the micro-organism.
3.3.4. BIOLOG™ assay.
To generate further information regarding the ability of each isolated strain’s to
utilized different carbon source, a BIOLOG™ assay was carried out. BIOLOG is an
assay to measure the metabolism of the microorganism on 31 different carbon
sources. The mechanism of this test is based on the MTT-formazan reaction. If the
carbon source in a well is metabolized, the Mitochondrial Reductase enzyme from
the micro-organism will also reduce the yellow Thiazolyl Blue Tetrazolium Bromide
(MTT) dye to the purple formazan.
3.3.4.1 Micro-organism preparation.
The 5 micro-organisms strains selected by the Artemia assay were cultured in LB
broth for the duration of at least 5 days at 28°C under continuous shaking. The
microbe cells were separated from the media by centrifugation at 4000rpm for 15
minutes at room temperature and discarding the supernatant. The pellets were
resuspended in sterile distilled water and further centrifuged to wash the cells.
The supernatant was discarded, and the pellet re-suspended in 1mL sterile distilled
water.
3.3.4.2. Assay.
Following the instructions of the manufacturer, 100µL of bacteria suspended in
distilled water was added to each well of the BIOLOG EcoPlatetm. The plates were
incubated in 28°C and optical density at 590 nm was measured at 4H, 24H, 48H
and 96H after inoculation respectively. The changing colors of each plate were
also recorded.

29
3.3.5. MTT formazan assay.
The goal of this experiment is to determine the ability of selected micro-organism
to metabolize geosmin as the only carbon source. Cell metabolic activities are
detected by measuring the ability of their Mitochondrial Reductase enzyme to
reduce the yellow Thiazolyl Blue Tetrazolium Bromide (MTT) dye to the purple,
insoluble formazan.
The micro-organisms were prepared according to “3.2.5.1”. For the assay, the 96
wells plates were used. As negative control, 100µL of 5 pure strains of bacteria
were loaded into 5 columns, 8 replicates each. To study the bacterial affinity for
geosmin as sole carbon source, a similar setup was used; with the only difference
that 10µL of 0.66µgµL-1 geosmin stock solution were added to each well. Positive
controls were prepared by inoculating the same micro-organism in easily to
metabolize, general purpose media, in this case LB broth was used. 2 rows of
blank media and blank media with geosmin were also included. To exclude the
metabolic activity based on the minerals in mineral media, the test was repeated
in distilled water. 10µL of MTT dye was added to each well, both control and
treatment. Plates were incubated for 4 hours at 37°C in dark condition.

30
Sample Sample + Geosmin
Blank Blank with geosmin
Figure 11. Scheme of sample loading in MTT plate. Samples were loaded in rows, from
left to right: F1 Bosea sp., F2 Bosea sp., F4 Mycobacterium sp., F9
Roseomonas sp., F10 Brevundimonas sp.
After 4 hours, formazan crystals precipitate on the side of the well. Therefore, the
suspension was removed from each well, taking care not to disturb the formazan
crystal that were formed. 100µL DMSO was added to each well and mixed well to
dissolve the formazan crystals. The plates were incubated for 5 minutes, followed
by optical density measurement at 570nm wavelength. A purple color forms if
metabolic activity had taken place.
3.3.6. Growth and geosmin degradation activity of isolated strains.
The aim of this experiment is to determine the growth of the selected single strains
micro-organism in media with geosmin as the only carbon source. Furthermore,
the ability to degrade geosmin was also evaluated.
3.3.6.1. Micro-organism preparation.
Pure cultures of selected micro-organism were cultured in LB broth for the duration
of 5 days at 28°C and continuous shaking. The microbe cells were separated from
the media by centrifugation at 4000rpm for 15 minutes at room temperature and
discarding the supernatant. The pellets were resuspended in sterile mineral media
(table 12) and further centrifuged to wash the cells. The supernatant was
A
B
C
D
E
F
G
H
1 2 3 5 4 7 6 9 8 10 12 11

31
discarded, and pellet resuspended in 1mL sterile mineral media. A serial dilution
was made, and live bacteria enumerated on the flow cytometer following
procedure of “3.1.4” to determine the cell density.
3.3.6.2. Assay.
7 treatments of 5 strains, 1 mixture and 1 blank control were prepared in
triplicates using 21 sterilized capped glass vials, containing 10mL mineral media,
0. 033µg.L-1 geosmin and 105 cells.mL-1 single strain micro-organism. The reactors
were then incubated at 28°C on a rotator. Sampling was made initially, at 24H,
48H, 96H and 144H respectively using sterile syringes and needles. Cell density
in the samples was then analyzed using flow cytometer, Tecan reader and plating
on LB agar plates.
Figure 12. Reactors on rotator.
To measure the geosmin degradation capacity of each strain, samples were
collected according to the protocol described in “3.1.2” at the start of the
experiment and after 96H. All samplings were made in triplicate.
3.4. Section 4: Evaluation of geosmin and 2-MIB removal capacity of
zeolite filter using different flow rates.
The aim of this experiment is to test the capability of a zeolite filter to remove
geosmin and 2-MIB from a RAS system.
The filter was design following Figure 13, with the inlet pipe divided into two 0.6L
chambers, each having an independent valve for flow rate control. One chamber
was filled with 200g granulated zeolite material with maximum size of 6mm, the
other was left empty.
32
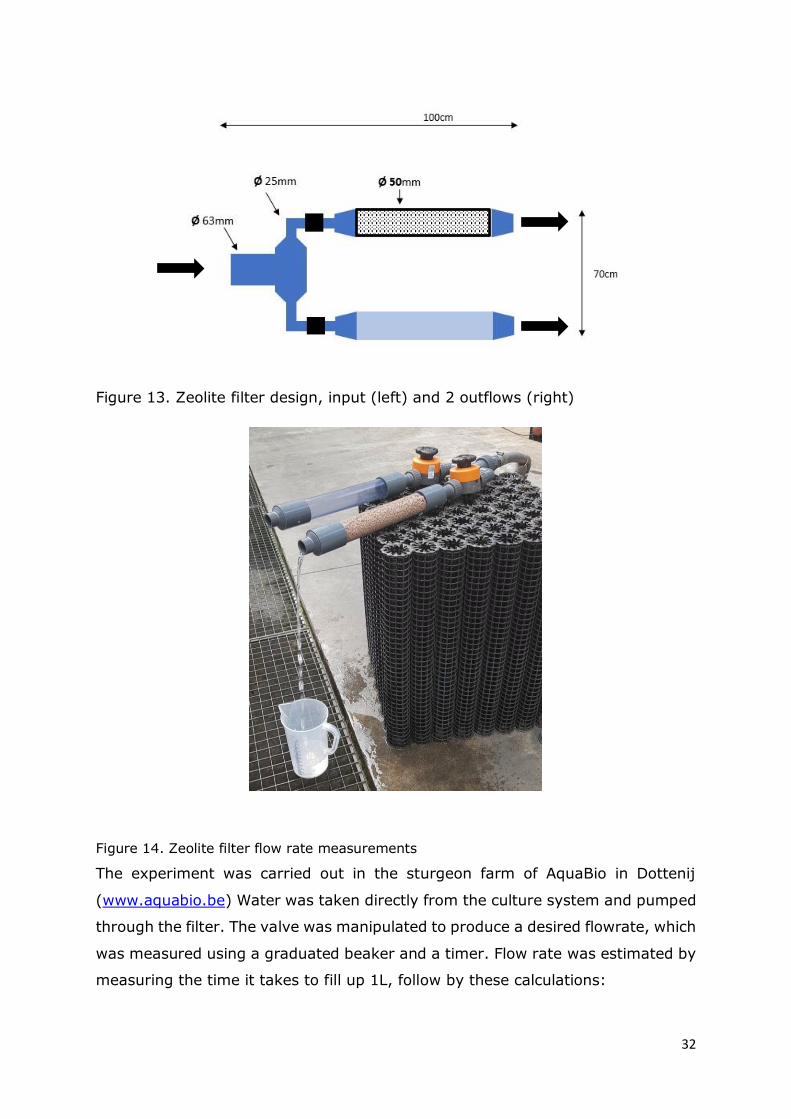
Figure 13. Zeolite filter design, input (left) and 2 outflows (right)
Figure 14. Zeolite filter flow rate measurements
The experiment was carried out in the sturgeon farm of AquaBio in Dottenij
(www.aquabio.be) Water was taken directly from the culture system and pumped
through the filter. The valve was manipulated to produce a desired flowrate, which
was measured using a graduated beaker and a timer. Flow rate was estimated by
measuring the time it takes to fill up 1L, follow by these calculations:

33
𝐹𝑙𝑜𝑤 𝑟𝑎𝑡𝑒 (𝐿/𝑠𝑒𝑐) = 1𝐿
𝑇𝑖𝑚𝑒 𝑡𝑜 𝑓𝑖𝑙𝑙 𝑢𝑝 1𝐿 (𝑠𝑒𝑐)
𝑅𝑒𝑡𝑒𝑛𝑡𝑖𝑜𝑛 𝑡𝑖𝑚𝑒 (𝑠𝑒𝑐) =𝑇𝑖𝑚𝑒 𝑡𝑜 𝑓𝑖𝑙𝑙 𝑢𝑝 1𝐿 (𝑠𝑒𝑐) × 𝑧𝑒𝑜𝑙𝑖𝑡𝑒 𝑟𝑒𝑎𝑐𝑡𝑜𝑟 𝑣𝑜𝑙𝑢𝑚𝑒 (𝐿)
1𝐿
The flow rate and associated retention time are shown in Table 12.
Table 12. Different flow rate and retention time used in zeolite experiment
ID Flow rate (Ls-1) Retention time (s)
1 0.16 36
2 0.0038 155
3 0.0022 273
4 0.0014 456
5 0.0003 1983
For each flow rate, water coming out of the zeolite chamber was sampled by totally
filling a glass vial to avoid any air bubble inside. The vial was subsequently capped.
A “blank” sample was taken from the water flowing through the empty chamber.
All sampling was done in triplicate. The samples were then stored at 4°C and sent
for analysis following the protocol described in chapter “3.1.3”
3.5. Section 4: Statistical analysis.
Differences between treatment were analyzed using one-way ANOVA and two-way
ANOVA with significant differences assumed at p < 0.05 level and post-hoc
analysis was performed using Tukey HSD test. Q-Q plot and Levene’s-test were
used to determine homogeneity of variance. All statistical analysis was conducted
using SPSS version 21.

34
Chapter 4. Results
In this chapter, results of the experiments are displayed in 3 major sections in line
with the structure of Chapter 2: Materials and methods. Section 1,2 and 3 explain
the results of the pilot experiment, the main selection experiment and the follow-
up experiments while Section 4 displays the result of geosmin and 2-MIB removal
using zeolite filter.
4.1. Section 1: Pilot experiment.
During the pilot experiment the method for selecting micro-organisms that can
degrade geosmin, was verified. Bacterial growth was monitored during the course
of the 14 days enrichment with geosmin.
4.1.1. Growth monitoring.
The microbial density during the experiment was monitored by flow cytometry and
is shown in Figure 15. Only treatment with sludge inoculum and geosmin are
shown.
Figure 15. Microbial density in fresh mineral water (F++) and salt mineral water (S++)
with geosmine as sole carbon source (33 ng.L-1) monitored by flowcytometry
during 2 weeks.
F++: mineral media, fresh water sludge, geosmin; S++ mineral media, seawater sludge,
geosmin.
1.00E+05
1.00E+06
1.00E+07
0 1 2 3 4 5 6 7 8 9 10 11 12 13 14 15
Den
sity
(cel
l/m
L)
Time (day)
F++ S++

35
From Figure 15. It is shown that the initial density of fresh water (F++) and sea
water (S++) is higher than the intended 105 CFU.mL-1. Microbial density is
relatively stable throughout the entire experiment duration with the dilution on
day 10 seemed ineffective on fresh water microbial density. During the culture
period, small particles of flocculant were observed to form inside the both
treatment reactors (Figure 16), although unable to be measured, this can be an
interesting indicator of microbial activity.
Figure 16. flocculant forming in treatment reactor (right) and no flocculant forming in
blank (left)
4.1.2. Geosmin degradation test.
In this experiment, geosmin was spiked into all reactors after the selection period
of 15 days, water samples were taken immediately at 0H, 24H and 96H
respectively. Sample from each reactor was used to fill up a capped glass vial,
avoiding air contact. The vials were then analyzed for geosmin using protocol in
chapter 3.1.3.

36
Figure 17. Potential of mixed bacterial population to breakdown geosmin (0.8µg at 0H)
after 15 days of growth on selective media.
Presence of standard deviation indicate the average value of 3 technical replicates. Treatment
S++ has geosmin concentration below detection level at 96H, therefore is not shown in this graph.
F++: mineral medium, fresh water sludge, geosmin; F+: mineral medium, fresh water sludge; F:
mineral medium; S++: mineral medium, sea water sludge, geosmin; S+: mineral medium, sea
water sludge; S: sea water mineral medium.
Over the course of the experiment, it is observed that geosmin concentration has
gradually reduced over time in all treatment, except for the seawater blank. The
most prominent reduction was seen in treatment “S++”, which has significantly
decreased (p<0.05) to below detection limit. “F++” treatment also shown
significantly reduction (p<0.05), but at a smaller magnitude as compared to the
seawater samples, reaching 36% compared to the original concentration.
Interestingly, geosmin was detected going as high as 144% in sea water blank.
As all treatment shown reduction in geosmin between 24 and 96H, the effect of
microbial activity on geosmin is not proven.
4.1.3. Testing bacteria growth on different agar media.
After 15 days after first inoculation, micro-organisms were plated on 4 different
media: NA, LB, MA and CASO to indicate what media can best be used for isolation
of organisms.
0
20
40
60
80
100
120
140
160
S++ S+ S F++ F+ F
Geo
smin
co
nce
ntr
atio
n (%
)
Treatment
0H 24H 96H

37
Figure 18. Bacterial count on 4 different agar media after 72H of culture, starting after
15 days of selection.
MA: marine agar, LB: Luria-Bertani, NA: nutrient agar, CASO: tryptic soy agar. Small letter denotes
differences in sea water (S++) treatments while capital letter denotes differences in fresh water
(F++) treatments. F++: mineral medium, fresh water sludge, geosmin; F+: mineral medium, fresh
water sludge; F: mineral medium; S++: mineral medium, sea water sludge, geosmin; S+: mineral
medium, sea water sludge; S: sea water mineral medium.
Results from the media test are shown in Figure 18. It is clearly shown that Luria
Bertani is a superior media for growing bacteria from water selected on geosmin,
exhibiting significantly higher bacteria count in freshwater samples (p<0.05),
while showing comparable performance with NA and MA in sea water samples. On
the other hand, nutrient agar shown good colony forming potential for species
selected from seawater biofilter. CASO, while a very popular general-purpose
media, shows virtually no microbial growth.
4.2. Section 2: Selection for geosmin-degrading fresh water micro-
organism.
In this experiment, geosmin-degrading freshwater micro-organisms were selected
using the method verified by the pilot experiment. The fresh water micro-
organisms were chosen on the ground of practicality and the fact that off-flavour
problem is more severe in fresh water than sea water RAS. The selected micro-
a
A
a
B
a
C
b C
1.00E+00
1.00E+04
2.00E+04
3.00E+04
4.00E+04
5.00E+04
6.00E+04
S++ F++
Mic
rob
es c
ou
nt
(CFU
/mL)
Sample type
MA LB NA CASO

38
organisms were then isolated, identified and put on several screening test in order
to determine their toxicity for Artemia franciscana nauplii, the ability to utilize
different carbon sources, the ability to metabolize geosmin and finally to degrade
geosmin test.
4.2.1. Selection experiment.
1.00E+04
1.00E+05
1.00E+06
1.00E+07
0 1 2 3 4 5 6 7 8 9 10 11 12 13 14 15 16
Mic
rob
ial d
ensi
ty (
cells
.mL-1
)
Time (days)
B
F++ F
1.00E+03
1.00E+04
1.00E+05
1.00E+06
1.00E+07
1.00E+08
0 1 2 3 4 5 6 7 8 9 10 11 12 13 14 15 16
Mic
rob
ial d
ensi
ty (
cells
.mL-1
)
Time (days)
A
F++ F

39
Figure 19. Microbial density of freshwater treatment monitored by flow cytometry (A),
plate counting (B) and OD (C), with addition of geosmin (0.8µg) at 6th and
12th day.
Data point which microbial density was too low to be detected were not shown. F++: mineral
medium, fresh water sludge, geosmin; F+: mineral medium, fresh water sludge; F: mineral
medium; S++: mineral medium, sea water sludge, geosmin; S+: mineral medium, sea water
sludge; S: sea water mineral medium
Microbial density of the fresh water treatment reactor (F++) and the control
reactor (F) are shown in Figure 19. Overall, it is observed that both methods of
monitoring show similar trends, with plate counting displaying 1 log lower than
flowcytometry. Optical density (figure 19 C), on the other hand, did not gave much
information, showing a slight increase at the 12th day. A contamination in all 3
replicates was detected in the control treatment immediatly after experiment
started and increased up to more 107 before stabilizing on the 6th day.
Similar with the pilot experiment, flocculant formation was observed in the
treatment (F++) reactors but not in the control. Plating also reaveals that there
are different types of colonies in F++ samples while only 1 single type of colony
formed in F samples.
4.3. Section 3: Applicability of isolated strains.
4.3.1. Growth of the selected micro-organism.
From the reactors, 14 strains were isolated by plating the mixture on LB plates,
single colonies were picked out based on external morphology. The isolated strains
were labeled F1 to F13. During the experiment, contamination occurred with strain
0
0.05
0.1
0.15
0.2
0.25
0.3
0 1 2 3 4 5 6 7 8 9 10 11 12 13 14 15 16
OD
Time (days)
C
F++ F

40
F7, so the strain was again isolated and re-named using the same number but
with different letter (F7a and F7b).
Growth curves of all the isolated strains were constructed to estimate the duration
it takes for each strain to reach stationary phase, so we were able to harvest the
highest possible number of cells to be used in toxicity tests with Artemia
franciscana nauplii.
The growth curves of fresh water strains are shown in Figure 20. From the curves,
we can see that after 96 hours, all the strains have reached stationary phase.
Some strains possess particularly fast growth compared to others such as F6, F7b
and F11, reaching a plateau after 36 hours. On the other hand, strain F8 grew
very slowly, only picking up after 96 hours. It is also observed that some strains
have very similar growth pattern such as F7b and F11, indicating that these could
be the same strains displaying different morphological differences.

41
Figure 20. Growth curves in LB of isolated strains. Strain F1 to F6 (A) and Strains F7a to
F13 (B)
4.3.2. Preliminary toxicity screen of selected strains using Artemia.
Survival rate of Artemia nauplii challenged with different isolated strains is shown
in Figure 21.
In general, mortality rates varied widely both between different strains and
between repeated experiments. Among the strains tested, strains F1, F2, F4, F9
0
0.2
0.4
0.6
0.8
1
1.2
0H 12H 24H 36H 48H 60H 72H 84H 96H
OD
Time (H)
A
F1 F2 F3 F4 F5 F6 Blank
0
0.2
0.4
0.6
0.8
1
1.2
1.4
1.6
0H 12H 24H 36H 48H 60H 72H 84H 96H
OD
Time (H)
B
F7a F7b F8 F9 F10 F11 F12 F13 blank

42
and F10 have consistently shown significant higher survival rate (p<0.05)
throughout 3 experiment replicates. Therefore, they were selected for further
testing.
Figure 21. Survival rate of Artemia franciscana nauplii challenged with isolated
microbiastrains after 24 hours (A) and 48 hours (B) (n=3).
Strains F3 and F8 is unable to be regrown from cryostorage so thereforediscarded. Small letters
denotes difference in experiment 1, capital letters denotes differences in experiment 2, numbers
denotes differences in experiment 3.
50
60
70
80
90
100
110
1 2 4 5 6 7a 7b 9 10 11 12 13 Control LB
Surv
ival
rat
e (%
)
Strains
A
EXP1 EXP2 EXP3
d d d b
a
bc cdd d
cdcd cd d d
B B B B
B
AB
B BA
B
B B B4
4 342
234
23 4 4
1
2323 23 4
0
10
20
30
40
50
60
70
80
90
100
110
120
1 2 4 5 6 7a 7b 9 10 11 12 13 Control LB
%
Strains
B
EXP1 EXP2 EXP3

43
4.3.3. Identification of isolated strains.
Result from 16S identification from different selected strains are shown in Table
13. The 16S rRNA sequence of each strains can be found in ANNEX IV
Table 13. Identification result of the selected 5 bacterial strains.
No Strain Genus
1 F1 Bosea sp.
2 F2 Bosea sp.
3 F4 Mycobacterium sp.
4 F9 Roseomonas sp.
5 F10 Brevundimonas sp.
Figure 22. 5 isolated strains cultured in LB broth. From left to right: Bosea sp. F1; Bosea
sp. F2; Mycobacterium sp.; Roseomonas sp. and Brevundimonas sp.
4.3.4. BIOLOG™ assay.
Result from BIOLOG is shown in table 14.
Table 14. BIOLOG™ result of 5 isolated and identified strains
Strain Genus Carbon source utilized
F1 Bosea sp. ▪ Pyruvic Acid Methyl Ester
▪ L-Asparagine
▪ L-Serine
▪ γ-Amino Butyric Acid
▪ Glycyl-L Glutamic Acid
F2 Bosea sp. ▪ L-Arginine
▪ Pyruvic Acid Methyl Ester

44
▪ D Galacturonic Acid
▪ L-Asparagine
▪ L-Serine
▪ L-Threonine
▪ Glycyl-L Glutamic Acid
▪ α-Keto Butyric Acid
▪ D-Malic Acid
F4 Mycobacterium sp. ▪ L-Arginine
▪ Pyruvic Acid Methyl Ester
▪ Tween 40
▪ i-Erythritol
▪ Tween 80
▪ D-Mannitol
▪ α-Keto Butyric Acid
▪ Putrescine
F9 Roseomonas sp. ▪ D-Galactonic Acid γ-Lactone
▪ Pyruvic Acid Methyl Ester
▪ D-Xylose
▪ D Galacturonic Acid
▪ D-Mannitol
▪ 4-Hydroxy Benzoic Acid
▪ α-Amino Butyric Acid
▪ Glycyl-L Glutamic Acid
▪ α-Keto Butyric Acid
F10 Brevundimonas sp. ▪ γ-Amino Butyric Acid
▪ Glycyl-L Glutamic Acid
▪ α-Keto Butyric Acid
Identification and subsequence BIOLOG assay have yield some interesting results.
Overall, we identified 5 different strains of bacteria, with each strain utilizing a
different carbon source. There are similarities between strains in term of carbon
source utilization. 4 in 5 strains can metabolize α-Keto Butyric Acid with strain
Bosea sp. F1 being the exception. Glycyl-L Glutamic Acid is also a common carbon
source for all except for Mycobacterium sp. Interestingly, strains F1 and F2 are

45
identified to be from the same genus of Bosea sp.. However, BIOLOG™ assay has
shown that they are able to metabolize different Carbon source, with strain F2
being more flexible in carbon utilization.
4.3.5. MTT Formazan Assay.
The result from MTT-Formazan assay is shown in Figure 23 and 24
Figure 23. MTT formazan results of 2 different treatments: cells suspended in mineral
media (upper left), cells suspended in distilled water (upper right) and
positive controls (lower).
Strains were loaded from left to right: Boseasp. F1; Bosea sp. F2; Mycobacterium sp. F4,
Roseomonas sp. F9 and Brevundimonas sp. F10

46
Figure 24. Optical density at 570nm of treatment with cells suspended in 2 different
media: mineral medium (A) and distilled water (B).
Negative control: bacteria cells suspended in mineral media or distiled water, Positive control:
bacterial cells suspended in LB media. F1: Bosea sp., F2 Bosea sp., F4: Mycobacterium sp., F9:
Roseomonas sp., F10: Brevundimonas sp., M: Media. Differences in growth on the different media
for each strain are denoted by different small letters
It is clearly shown that all strains show a significantly higher metabolic activity
when grown in LB media (p<0.05) compared to the negative control and compared
to geosmin enriched media with the exception for F4. Strain F1 (Bosea sp.) and
F10 (Brevundimonas sp.) show no significant metabolic change in the precence of
geosmin. Strain F4 (Mycobacterium sp.) shown significantly higher metabolic
a
A
1
I
*
a
A
2
I
*
b
B
3
II
**
0
0.5
1
1.5
2
2.5
3
3.5
4
F1 F2 F4 F9 F10 M
OD
Strains
A
negativecontrol
geosminenrichment
positive control
a
A 1
I
*a
B
2
II
*
b
C
3
III
**
0
0.5
1
1.5
2
2.5
3
3.5
F1 F2 F4 F9 F10 M
OD
Strains
B
negativecontrol
geosminenrichment
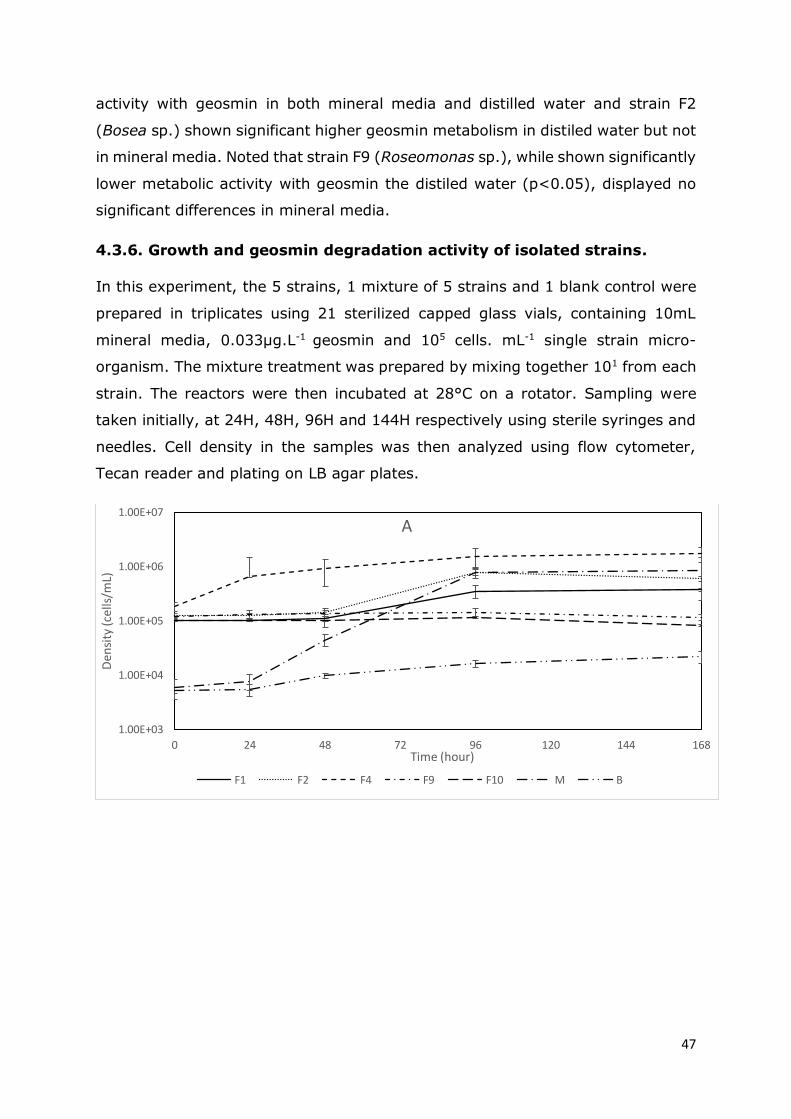
47
activity with geosmin in both mineral media and distilled water and strain F2
(Bosea sp.) shown significant higher geosmin metabolism in distiled water but not
in mineral media. Noted that strain F9 (Roseomonas sp.), while shown significantly
lower metabolic activity with geosmin the distiled water (p<0.05), displayed no
significant differences in mineral media.
4.3.6. Growth and geosmin degradation activity of isolated strains.
In this experiment, the 5 strains, 1 mixture of 5 strains and 1 blank control were
prepared in triplicates using 21 sterilized capped glass vials, containing 10mL
mineral media, 0.033µg.L-1 geosmin and 105 cells. mL-1 single strain micro-
organism. The mixture treatment was prepared by mixing together 101 from each
strain. The reactors were then incubated at 28°C on a rotator. Sampling were
taken initially, at 24H, 48H, 96H and 144H respectively using sterile syringes and
needles. Cell density in the samples was then analyzed using flow cytometer,
Tecan reader and plating on LB agar plates.
1.00E+03
1.00E+04
1.00E+05
1.00E+06
1.00E+07
0 24 48 72 96 120 144 168
Den
sity
(cel
ls/m
L)
Time (hour)
A
F1 F2 F4 F9 F10 M B

48
Figure 25. Microbial density of different single strain monitored by flow cytometry (A),
plate counting (B) and OD (C).
F1: Bosea sp., F2 Bosea sp., F4: Mycobacterium sp., F9: Roseomonas sp., F10: Brevundimonas
sp., M: Mixture of 5 strains, B: blank
5 bacteria strains that shown low toxicity toward Artemia were chosen for culturing
in media spiked with geosmin. Growth of the 5 strains were monitored by flow
cytometry, plate counting and OD and is shown in figure 25. All strain displays
slow growth compared to the growth curves (figure 20) in LB; reaching stationary
-2.00E+05
0.00E+00
2.00E+05
4.00E+05
6.00E+05
8.00E+05
1.00E+06
1.20E+06
0 24 48 72 96 120 144 168
Den
sity
(CFU
/mL)
Time (hour)
B
F1 F2 F4 F9 F10 M B
0.1
0.15
0.2
0.25
0.3
0.35
0.4
0 24 48 72 96 120 144 168
OD
Time (h)
C
F1 F2 F4 F9 F10 M B

49
phase only after 96 hours. Strain Mycobacterium sp. (F4) having slighly higher
initial density shows best growth performance, reaching approximately
1.5±0.6*106 cells.mL-1. Strain Bosea sp. (F2) and treatment containing the mixed
community show poorer performance, reaching stationary phase only at
7.9±1.8*105 and 7.8±1.1*105 cells.mL-1 respectively. Noted that the mixture
being inoculated 1 log less than other treatment. Strains Roseomonas sp. (F9)
and Brevundimonas sp. (F10) shown no growth while strain Bosea sp. (F1), being
from the same genus with strain Bosea sp. (F2) shown significantly lower growth,
reaching only 3.5±0.9*105 at stationary phase. Contaminations was detected in
the blank by flow cytometry, however this was not picked up by plate counting.
Growth curves monitored by plate counting show similar trends compared to
growth measured by flow cytometry. Comparable to the previous results, strain
F4 shows the best growth, reaching 4.5±0.6*105after 96 hours followed by Bosea
sp. (F2) and the mixture of 5 strains, reaching 2.6±0.8*105 and 4.8±1.3*104
cells.mL-1 respectively. Noted that the colonies formed in the mixture plates is
dominated by F4 type. Strains Roseomonas sp. (F9) and Brevundimonas sp. (F10),
in accordance with flow cytometry results, shown no growth. It is noted that plate
counting method cannot detect growth in the first 48 hours, even when initial
inoculation is 105 cells.mL-1. Viable count result are nearly always 10 times lower
that result given by flow cytometry.
A small ammount of flocculant was observed in F4 treatment but was not present
in any other treaments.
As opposed to flow cytometry and plate counting method, optical density has
yielded no result regarding the growth of the bacteria, showing no significant
differences.

50
Figure 26. Changes in geosmin concentration over 96 hours (n=3).
F1: Bosea sp., F2 Bosea sp., F4: Mycobacterium sp., F9: Roseomonas sp., F10: Brevundimonas
sp., M: Mixture of 5 strains, B: blank. Letters denotes significant difference between strains, “*”
symbol denotes significant differences in geosmine concentration for 1 strain.
Results from geosmin degradation test show that among the 5 selected strains,
only F4 (Mycobacterium sp.) and F10 (Brevundimonas sp.) show a significant
reduction (p<0.05) in geosmin to 65.45±10.70 and 48.60±26.67, respectively.
Strains F9 (Roseomonas sp.) and the Mixed population shown no reduction while,
curiously strains F1 (Bosea sp.) and the Blank show significant increase in geosmin
concentration as much as 350 %
b
a
a*
aa*
a
b
0.00
50.00
100.00
150.00
200.00
250.00
300.00
350.00
400.00
450.00
F1 F2 F4 F9 F10 M B
geo
smin
co
nce
ntr
atio
n (%
)
Treatment
0H 96H

51
4.4. Section 4: Evaluation of geosmin and 2-mib removal capacity of
zeolite filter using different flow rate.
Figure 27. Geosmin and 2-MIB levels after zeolite filter at different flow rate.
Surprisingly, the zeolite filter was unable to remove either geosmin or 2-MIB,
showing no significant different between the 5 different flow rate and the blank.
0.00
10.00
20.00
30.00
40.00
50.00
60.00
70.00
80.00
1 2 3 4 5 blank
Co
nce
ntr
atio
n (n
g/L)
Flow rate
Geosmin
MIB

52
Chapter 5. Discussion
In this chapter, the results of the experiments are discussed in 3 major sections.
This is done in accordance with the ordering of the Material and Methods and
Result chapter. An additional section, translating findings of this study to
application in aquaculture, is added to this chapter.
Section 1 discusses the practicalities of selecting geosmin degrading bacteria via
the pilot experiment.
Section 2 discusses the selection of geosmin-degrading bacteria from fresh water
RAS sludge.
Section 3 discusses the isolation and different tests on the isolated strains to
evaluate: toxicity on Artemia nauplii, metabolic activities and growth and geosmin
degradation test.
Section 4 discusses the performance of a zeolite filter to eliminate geosmin and
2-mib from cultivation water.
Section 5 elaborates on the possible application of the findings of this study.

53
5.1. Section 1: Pilot experiment.
Selecting microbes to degrade a substance by using it as the only carbon source
has been used successfully in many instances such as pesticides (Aislabie & Lloyd-
Jones, 1995; Chaudhry & Ali, 1988; Singh & Walker, 2006) and the hardly
degradable lignin (López et al., 2004). Recently, scientists have been fairly
successful in isolating microbes that degrade geosmin, both in aerobic and
anaerobic condition (Azaria & van Rijn, 2018; Guttman & van Rijn, 2012; Hoefel
et al., 2009).
Results from microbial density monitoring show that flow cytometry is effective in
measuring density fluctuation. As shown in Figure 15, microbial density stabilized
post-inoculation around the initial value of 105 cells.mL-1 in freshwater. Sea water
treatment, however shows a continuous decrease of density until the dilution on
the 10th day These observations prove that the selection process was happening.
Strains that are unable to adapt to geosmin were eliminated while strains that can
utilize geosmin to growth or maintain density remains. This observation is shared
with Guttman & van Rijn (2012), on whose protocol this study is based.
Furthermore, the presence of flocculant (Figure 16) in the treatment of both sea
water and fresh water further indicate that micro-organism growth was taking
place. Using the remaining microbes after the selection period, we were able to
reduce geosmin level in some cases to beyond detection level (Figure 17).
Furthermore, the treatments with sludge inoculum shows faster reduction of
geosmin. Geosmin reduction was observed however in all the treatment, except
the seawater control. This can be explained by the fact that geosmin is a very
volatile substance and loss via evaporation is expected.
The results from this experiment show that the selection procedure was successful
displaying stable microbial density after geosmin spiking, furthermore, there was
a formation of flocculant in the reactor with micro-organism. It further implies the
presence of geosmin-degrading micro-organism in the ARC’s RAS system. The
results also mean that this protocol adapted from Guttman & van Rijn (2012) is
feasible in our condition. However, geosmin degradation test was inconclusive as
all the treatment shown decrease in geosmin levels

54
5.1.1. Flow cytometry measurement.
Flow cytometry has seen applications in various fields of research, including
bacteria enumeration (Gunasekera et al., 2000; Van Nevel et al., 2013). During
the pilot experiment, results have shown that flow cytometry is a robust method
to estimate microbial density in water sample. However, some limitations have
been identified. Staining by Thiazole Orange (TO) and Propidium Iodide (PI) varied
between different strains (ANNEX II), requiring case by case gating. Furthermore,
accurate estimation can only be achieved if the bacteria density is within the range
of 105 to 107 cells.mL-1 (ANNEX III). This may explain the inability to detect density
reduction of fresh water microbes after spiking in the pilot experiment, since
concentrations fell below 105 cells.mL-1.
Observations during the experiment show the presence of flocculant in the
reactors spiked with geosmin (figure 16). As flow cytometry require a homogenous
sample to work accurately (Falcioni et al., 2006), flocculants can cause error in
reading. In order to better visualize and quantify this phenomenon, measurement
of optical density of samples was needed. Measurement via optical density at
550nm has been proposed as an effective method for flocculant quantification
(Kurane et al., 1986; Toeda & Kurane, 1991; Yokoi et al., 1996). Furthermore, as
flow cytometry is prone to errors when measuring unhomogenized samples, plate
counting was also included as a third method.
5.1.2. Testing bacteria growth on different agar media.
Results from the media test show that LB is clearly more suitable for growing
bacteria from the selection experiment as it provided significantly higher colony
counts and higher variation in micro-organism. LB has been the media of choice
in many selections for microbes degrading various substances such as
trichloroethylene (Shields & Reagin, 1992), petroleum (Ueno et al., 2006) and
geosmin (Guttman & van Rijn, 2012). Marine agar, although showing similar
performance as LB for marine microbes, lags significantly in the case of freshwater
microbes. This can be explained by the fact that the osmotic stress is simply too
much for some fresh water bacteria to grow, regardless of the nutrient provided.
Interestingly, CASO, which is a very popular general-purpose media showed little
growth for both sea water and freshwater inoculum. The poor performance of
CASO media can be due to several reason such as the very slow growth rate of

55
the microbes and the unsuitability of the nutrients provided. Overall, LB media
was chosen by the virtue of its performance as well as to simplify logistics
5.2. Section 2: Selection for geosmin-degrading freshwater microbes
5.2.1. Selection experiment.
Based on Figure 19A, we can see that bacterial density increased immediately post
innoculation, reaching 2 log increment after 48H. This proves that the selection
process is working. The stabilization after 2 days coincides with the formation of
flocculants which further indicates microbial growth. Figure 19B also shows similar
trends to Figure 24A, however, only asmall increment of bacteria density was
observed immediately post-spiking of geosmin. This trend was picked up by flow
cytometry but undetectable via plate counting. Furthermore, plate counting, while
producing a similar trend as with flow cytometry, always gives results at least 1
log lower. This phenomenon is also observed by Hoefel et al. (2003) whose results
show that flow cytometry reading is 2 to 4-log higher than viable count. As flow
cytometry relies on homogenized samples and enumerates cells individually, while
plate counting may count clumping cells as a single colony, this difference in
reading is understandable. Furthermore, colony forming is an energy demanding
process and will not be carried out by the bacteria when in less than optimum
shape. Overall, all 3 measurements enforced each other and indicated that there
was microbial growth in the selecting reactors. However, flowcytometry is shown
to give the most detail.
A contamination was detected by both flow cytometry and plate counting, reaching
densities equivalent to the treatment. However, there were some fundamental
differences: There were no flocculants forming in the blank reactors, even though
the microbial density is comparable to the treatment. Furthermore, plating also
revealed differences in microbial community as the sample from the treatment
reactor yielded several different types of colonies while the blank samples only
yielded 1 single type of colony.
This result is shared by Guttman & van Rijn (2012) and is possibly the result of
lack of nutrients from the mineral media as well as oxygen limitation. Replacing
the mineral media with LB was an option as LB spiked with geosmin provided at
least 4 times faster bacteria growth (Guttman & van Rijn, 2012). However, doing
this comes with a risk of selecting non-related bacteria, as stated by the same

56
author. Oxygen limitation can be eliminated by aeration but as geosmin is a very
volatile substance (Buttery et al., 1976; Gerber & Lechevalier, 1965; Sunesson et
al., 1995), aeration may cause non-bio mediated decrease in geosmin as was
observed by Guttman & van Rijn (2012). In our experiment, loss via evaporation
was prevented by using air tight reactors, with large headspace to provide enough
oxygen without aeration.
5.3. Section 3: Applicability of isolated strains.
5.3.1. Isolation and growth of geosmin degrading bacteria in LB media.
The mixture of selected bacteria was plated on LB and the different strains were
selected based on external colony morphology. Especially color, growth speed
(size of colony) and colony surface pattern was used as parameters for
characterization. The selected strains were grown in LB as this medium was proved
to the be most optimal (see 4.1.3). A growth curve for each strain was constructed
with the aim of determining the time taken for each strain to reach stationary
phase, in preparation for the toxicity screen. Overall, the tested strains show a
typical exponential growth curve with stationary phase achieved at different time
points and different optical densities. Growth time of different strains also varied,
with most strains requiring at least 60 hours to reach stationary phase. As this is
a part of the screening process, standard curves were not needed. The logic behind
this is that the density obtained growing in LB would be the highest possible
density for each strain, highly unlikely to be achieved in normal RAS circumstances
– as observed in the selection experiment.
5.3.2. Toxicity screen on Artemia.
This experiment is carried out to eliminate the toxic strains and select the non-
toxic ones that could be useful for application in an aquaculture context. The logic
behind this is that maximum growth was obtained on LB medium and Artemia
nauplii were exposed to these high densities of bacteria. If the strain fails to kill
Artemia, which is LB broth and sterile seawater, we can be assured that it is non-
toxic for other aquatic organisms.
Artemia has been used as the subject organism for toxicity study for a long time
(Kiviranta et al., 1991; Lewan et al., 1992; Marques et al., 2006) mainly due to
the convenience of its easy hatching from dry cysts and year round availability
(Sorgeloos et al., 1978). The use of pure bacteria culture in challenge test is due

57
to practicality reason, as this is a preliminary screening, analyzing and extracting
toxins from those strains means unnecessary complications. Furthermore, using
bacterial culture make it easier to repeat the screening process. In the toxicity
screen, strains F1, F2, F4, F9 and F10 were selected as they showed significant
higher or comparable with the control treatment. Strain 13 while giving the same
positive result, could not be regrown after cryo-storage and therefore was
discarded.
The results show that survival rate of Artemia nauplii exposed to different isolated
strains varied both between strains and between replicate experiments. There
was no significant mortality at 24 hours post exposure, while mortality increased
dramatically for some strains after 48 hours. This result indicates that these
strains do not possess high toxicity as oppose to other strains such as the
cyanobacteria Oscillatoria agardhii and the bacteria Vibrio harveyii, which cause
mortality even after 24 hours (Kiviranta & Abdel-Hameed, 1994; Kiviranta et al.,
1991; Lee et al., 1999; Soto-Rodriguez et al., 2003). However, it must be noted
that Artemia is a hardy animal and its sensitivity decreases as it grow (Sorgeloos
et al., 1978). Furthermore, most study on toxicity done with artemia as a test
subject use pure toxin as the treatment. As pure toxin potency and dosage is
much higher than live bacteria, along with the fact that bacteria only produce toxin
in some conditions, further in-depth test should be carried out to give definite
confirmation of these strains’ toxicity. Apart from artemia, different animals have
been used as model organism for toxicity screening; such as rotifer (Juchelka &
Snell, 1994; Preston & Snell, 2001; Snell & Janssen, 1995), Daphnia (Buikema et
al., 1980; Nizan et al., 1986) and zebrafish (Parng, 2005; Sipes et al., 2011).
5.3.3. Identification.
Results from 16S sequencing show that the isolated bacteria strains belong to 4
different genera, with strain 1 and 2 belonging to the same genus Bosea sp., while
strains 4,9,10 are identified to be Mycobacterium sp., Roseomonas sp. and
Brevundimonas sp. respectively. These strains have not been listed in previous
studies (Azaria & van Rijn, 2018; Guttman & van Rijn, 2012; Lindholm-Lehto &
Vielma, 2019).
Bosea is a genus of recently discovered and scarcely studied gram-negative
bacteria from the family Bradyrhizobiaceae (Marcondes de Souza et al., 2014).

58
Bosea strains are isolated from various water and waste water sources (Das et al.,
1996; La Scola et al., 2003; Thomas et al., 2007) as well as from soil, they are
also isolated in symbiotic relationship with legumes (Das et al., 1996; De Meyer
& Willems, 2012; Safronova et al., 2015). Although they are strictly aerobic, Bosea
minatitlanensis is proven to be able to survive in anaerobic digestor (Ouattara et
al., 2003), this trait may help this strains to out-compete others in the condition
of this experiment, in which oxygen maybe limited due to the tightly capped
reactors. Interestingly, some species of Bosea sp. are proven to be able to reduce
sulfur substances (Das et al., 1996).
Mycobacterium is a genus of Actinobacteria and consists of more than 190 species
(King et al., 2017). This genus contains some serious pathogens for mammals and
humans such as tuberculosis and leprosy (Ryan & Ray, 2004). The discovery of
this species from the biofilter sludge of the ARC is a surprise. However, this is not
unprecedented as there are reports of Mycobacterium presence in tropical aquaria
(Barrow & Hewitt, 1971; Edelstein, 1994; Von Reyn et al., 1993). Interestingly,
the Mycobacterium sp. strains isolated is proven to be non-toxic to Artemia (Figure
21). On the other hand, the presence of non-tuberculous Mycobacterium is
becoming more and more understood with the advances in molecular
biotechnology (Turenne, 2019). To better understandthis strain, a whole genome
sequencing is reccomended.
Roseomonas is a genus of Gram -negative bacteria, this genus is named after the
pink color of their colonies, a fact that was also observed in this study.
Roseomonas sp. is proven to be an opportunistic pathogen for human (Rihs et al.,
1993). An interesting fact regarding this genus is that it can adapt to extreme
conditions such as gamma radiation (Kim et al., 2018) and acid (Guazzaroni et
al., 2013). One species of Roseomonas sp. is proven to be able to survive on Mars
(Cheptsov et al., 2018).
Brevundimonas is a genus of Gram-negative, aerobic bacteria, mainly isolated
from the environment. Being an opportunistic pathogen, there has been cases of
antibiotic resistance reported (Chi, Fung, Wong, & Liu, 2004; Gilad et al., 2000;
Han & Andrade, 2005). Along with Roseomonas sp., this genus is also proven to
be an extremophile, able to withstand exposure simulated Martian environment of
high solar radiation, low temperature and desiccation (Dartnell et al., 2010). This

59
genus have shown promise in water treatment such as removal of nitrate and
heavy metal (Kavitha et al., 2009; Resmi et al., 2010)
5.3.4. BIOLOG™ assay.
Result from BIOLOG assay show that different strains have different degrading
capability for different carbon source. The ability to utilize different carbon sources
can indicate the flexibility of the microbes. In this case, strain Bosea sp.,
Mycobacterium sp. and Roseomonas sp. seems to be the most flexible and
promising (Table 15). Noticeably, strains F1 and F2, while both belongs to genus
Bosea, have a different behavior in carbon utilization, indicating that they are two
different species. This observation us further backed up by the difference in
morphological feature (Figure 22). Mycobacterium stands out as it is the only
strain that can utilize Tween 40, Tween 80 and Putrescine, this was stated in
literature (Michaels & Kim, 1966; Smith et al., 1993). The ability to utilize
inexpensive substrates such as manitol can be an advantage in enriching the
microbes to the desired density. On the other hand, this is only a preliminary
result done on ECO Plate™ with a limited amount of carbon sources (31 sources).
Further in-depth study using specifically BIOLOG™ plate for identification of
bacteria and applying mixed community in BIOLOG™ test may yield more
interesting results.
5.3.5. MTT-formazan assay.
This experiment is designed to detect differences in metabolic activity between
the basal metabolic rate in a lean environment and the metabolic rate in an
environment where geosmin is added. The logic behind this is that geosmin
utilization capability may be detected by the strains’ heightened metabolic activity
in geosmin spiked media as MTT can detect slight metabolic increases which other
methods like density monitoring and geosmin concentration measurement cannot
detect.
From the result of Figure 24, we can see that the strains of interest are
Mycobacterium sp. and Bosea sp. F2, which show significantly higher metabolic
activity in the presence of geosmin. Strain Mycobacterium sp. shows higher
geosmin metabolism in both distiled water and mineral media. Furthermore,
geosmin metabolism of this strain in mineral media is significantly higher than in
distiled water. Strain Bosea sp. F2 shows significantly higher metabolic activity in

60
the presence of geosmin (p<0.05) in distilled water. However, metabolic activity
of this strain is comparable to the negative control where geosmin is suspended
in mineral media. The behavior of strain F2 (Bosea sp.) and F4 (Mycobacterium
sp.) can be explained as the result of co-metabolism. It was proven that geosmin
is better utilized when another carbon source, such as ethanol, was added (Saito
et al., 1999). An idea about the underlying mechanism of geosmin degrading of
these strains can be that Bosea sp. F2 can utilize geosmin as sole the carbon
source while Mycobacterium sp. use geosmin as a single carbon source as well as
in a co-metabolic pathway with other organic substances, mostly from dead
bacterial cells, or even the mineral itself. The presence of mineral media can
accelerate the metabolism activity as reported by (Zhong et al (2007).
Mycobacterium, shown to be the most flexible as it can utilized geosmin both
singly and co-metabolically, with co-metabolism greatly enhancing the process.
Same observations have been reported with Mycobacterium able to degrade
phenolic-ring substances both singly and co-metabolically (Guerin & Jones, 1988;
Leys, Bastiaens, Verstraete, & Springael, 2005; Ren et al., 2016; Solano-Serena
et al., 2000; Zeng, Lin, Zhang, & Li, 2010).
5.3.6. Growth and geosmin degradation activity of isolated strains
Results from the culture of pure strains in media with geosmin continues to show
that flow-cytometry is a robust and sensitive method of detecting and monitoring
microbial density. When comparing plate counting to flowcytometry during all
growth experiments, it became clear that flow-cytometry cell counts show 1 log
higher density than CFUs, in line with previous observations. Optical density still
cannot detect flocculant formation, this may be due to the low-density nature of
the experiment, preventing significant flocculant formation. Unsurprisingly,
Mycobacterium sp. shows highest and fastest growth, reaching 1 log increment
within 96 hours. This may partially be due to the slightly higher initial
concentration of this strain compared to others. Furthermore, the observation of
flocculants forming inside Mycobacterium sp.reactors and the fact that this strain
is dominant in the mixture treatment, indicate that this strain can metabolize
geosmin.
In line with previous BIOLOG™, MTT test and growth curve (Figure 20, 24; table
15), Mycobacterium is shown to be a very flexible microbe, able to metabolize
many carbon sources, including geosmin. Mycobacterium sp. can remove 35%
61
geosmin within 96 hours (Figure 26), showing strong geosmin utilization ability.
This is backed up by the MTT result (Figure 23), which shows Mycobacterium sp.
As a very promising strain, as it can work efficiently in close to real-life conditions
in the presence of geosmin and other substances. Furthermore, Mycobacterium
has been proven to be able to degrade substances with phenolic ring, similar to
geosmin (Boldrin et al., 1993; Ren et al., 2016; Zeng et al., 2010).
Interestingly, strain Brevundimonas sp., while showing no capability in MTT test
and virtually no density increase during the experimental period, shows highest
reduction of geosmin of more than 50 %. This can be due to the ability to adsorb-
a process in which substances are taken up but not metabolized by the micrio-
organism- a trait that has been proven be previous studies (Resmi et al., 2010).
On the other hand, it must be noted that the geosmin measurement in this study
has repeatedly shown increased geosmin level of more than 100% and up to 300%
during degradation test, this put a doubt on the reliability of the analytic method
used.
The geosmin-removal capacity of our strain Mycobacterium , while high in this
study’s context, is actually lower than for other strains that have been reported.
Guttman & van Rijn (2009) reported reduction of 89 % after 48 hours and
complete removal of maximum 250 µg.L-1within 10 days in unidentified sludge
culture.
To sum up, 3 strains have been proven to degrade geosmin via 2 tests of
metabolic activity and geosmin degradation. However, only Mycobacterium sp.
passed both of the test, while Bosea sp. F2 failed the degradation test and
Brevundimonas sp. showed no interesting result in the metabolic activity test.
5.4. Section 4: Evaluation of geosmin and 2-mib removal capacity of
zeolite filter using different flow rates.
This experiment is carried out as a follow-up of the previous experiment by
INAGRO, whereby the level of geosmin and 2-MIB were reducedsignificantly even
in shorter retention time (ANNEX IV). It is a surprising result that the use of zeolite
cannot reduce geosmin and 2-MIB level in this experiment at Aquabio. Zeolite has
been proven to be effective to remove both geosmin and 2-MIB in water (Ellis &
Korth, 1993; Ghasemi et al., 2018; Wee et al., 2015). The failure to remove off-
tasting substances in this experiment can be due to the failure to regenerate

62
zeolite material, as the zeolite pellet in this experiment was the same used in the
previous test in INAGRO. To regenerate, zeolite pellets were heated to 540°C for
1H (Wang et al., 2006) but maybe this process was not successful. Studies have
shown that zeolite’s capacity reduced dramatically to 42% (Azaria et al., 2017)
and 60% (Wang et al., 2006) post regeneration. To better understand this, further
studies should be carried out to determine the most optimum method for zeolite
regeneration.
5.5. Section 5: Implication for application in aquaculture
This study has yielded interesting results including the identification of 3 bacterial
strains that are able to degrade geosmin. However, for these to be able to apply
in aquaculture, there are a few considerations.
All the strains selected have low growth rate, even in nutrient rich media like LB
(Figure 20). This gives them a disadvantage when inoculated into the biofilter. It
is highly unlikely that these geosmin-degrading strains can compete with the
faster growing nitrification bacteria, thus preventing them to reach a high enough
density to make a difference. This, combined with the fact that some of these
strains are opportunistic pathogens (Gilad et al., 2000; Han & Andrade, 2005),
makes their use problematic. Although the Mycobacterium sp. strains isolated in
this study is proven to be non-toxic for Artemia (Figure 21), extra precaution must
be taken as random mutation can take place and cause the strain to become
pathogenic. Furthermore, although non-toxic towards Artemia, Mycobacterium sp.
can still cause serious health problems in humans (Barrow & Hewitt, 1971;
Edelstein, 1994). As stated, further testing on different model animals is needed
to give definite result on this strain. A better strategy is to sequence the entire
genome of this strain.
The strains Mycobacterium sp., Bosea sp. F2 and Brevundimonas sp. have been
proven to be able to reduce geosmin. On the other hand Figure 26 shows that
the rate of removal is still lower than those reported by Guttman & van Rijn
(2009). This can be mitigated by sheer density of the bacteria in the biofilter,
which can only be achieved by using a separate bio-reactor to enrich these strains.
It must be noted that the mixed treatment of this study showed poor performance
both in growth and in geosmin degradation, a problem that may be caused by
inter-species competition, therefore, a further study should be carried out to

63
determine the best combination of species that can achieve highest growth plus
highest geosmin reduction.
Another proposition would be the use of a combined zeolite/biofilter, as proposed
by Lindholm-Lehto & Vielma (2019)who were utilizing zeolite’s high surface area
as a substrate for bacterial growth. Although the result from this study show that
zeolite has no effect on geosmin and 2-mib removal, this result is probably
incidental, caused by the poor regeneration process of zeolite material. A
combination of zeolite adsorption with microbial degradation can achieve good
performance and help to reduce the frequency of renewal of zeolite materials.
To sum up, the application of the result from this study in aquaculture is
promising. Although there are several gaps to fill in, the general scenario should
be a separate bio-reactor in combination with aa zeolite filter and bacterial strains
Mycobacteria sp., Bosea sp. and Brevundimonas sp. in pure or mixed community.
Disinfection by UV light should be complemented or replaced by ozonation as
Brevundimonas sp. is proven to be UV resistance. Before that, a thorough test on
toxicity should be carried out to give confirmation of the toxicity of these strains.
64
Chapter 6 General conclusion
In the present study, the micro-organisms, capable of degrading geosmin, were
selected, identified, and evaluated on applicability in RAS systems. Furthermore,
a small test on the removal capacity of zeolite was also carried out.
Overall, this study’s procedure to select microbes capable of degrading geosmin
is feasible. A total of 14 pure strains were isolated from the biofilter of the ARC
which can utilize geosmin as the only carbon source. Using toxicity screening with
Artemia, the selection was narrowed down to 5 strains belonging to 4 genera:
Bosea, Mycobacterium, Roseomonas and Brevundimonas. All selected strains
show slow growth both in LB and mineral media spiked with geosmin, reaching
stationary phase at 1 log density increase after 96 hours.
BIOLOG assay shows that these strains can utilize different carbon sources, with
the most flexible bacteria being Mycobacterium. Strains F1 and F2, belonging to
the same genus Bosea, display different carbon utilization which confirms they are
different species. The ability of Mycobacterium to utilize cheap carbon sources like
mannitol can be useful for enrichment.
MTT results imply different geosmin utilization pathway. Mycobacterium can utilize
geosmin both singly and co-metabolically, with co-metabolism greatly enhancing
the process. On the other hand, Bosea sp. F2 is most likely only able to degrade
geosmin singly.
Regarding geosmin degrading capability, Mycobacterium and Brevundimonas have
the best performance, able to reduce 35 and 50 % geosmin respectively within 96
hours. However, a different mechanism is implied as only Mycobacterium has
increase in density while Brevundimonas shows no growth and no metabolic
activity in the presence of geosmin.
In this study, zeolite pellets have been shown to be unable to significantly reduce
geosmin and 2-MIB from RAS water, despite previously positive tests. This can be
the result of a poor regeneration procedure.
Regarding analysis methods, flow cytometry has been proven to be both a
sensitive and robust technique to detect microbial density in water. Flowcytometry
consistently gave result at least 1 log higher than viable plate counting, with a
suitable density ranging between 103 to 106. A protocol for using the cytoFLEX

65
flow cytometer has also been produced. SPME method to analyze geosmin
concentration in aqueous sample has some inconsistency in reading, giving very
high result of more than 300 %.
To conclude, results from this study is promising, with at least 3 strains proven to
be able to degrade geosmin. However, to be able to apply this in aquaculture
require further research on toxicity and mechanism of action.

66
Chapter 7: Recommendations for further research
Flowcytometry is a robust method, however, further tests and studies should be
carried out to further develop this technique, especially in staining. In this study,
flocculant proved to be very problematic for flowcytometry to measure. A method
to break down and homogenize flocs should be developed.
Although proven to be non-toxic towards artemia, all strains proven as geosmin-
degrading from this study should be test further on other model animals such as
rotifer, daphnia or on fish. A full genome sequencing should be carried out on
Mycobacterium strain to ensure it is safe for human.
Zeolite has been proven to be unable to remove geosmin and 2-mib. However,
this is due to poor regeneration performance. Future research should be focus on
how to efficiently regenerate zeolite. A combine adsorption-biodegradation of
zeolite materials acting as both adsorption and bacteria substrate should also be
notice and developed.
To be able to apply in aquaculture, a new bioreactor should be designed to
accommodate these strains as their slow growth means they are unable to
compete with bacteria living in biofilter.

67
8. List of references
Agricultural, M., & Station, F. E. (n.d.). Mississippi Agricultural and Forestry Experiment Station Technical Bulletin. Mississippi State University/MAFES.
Aislabie, J., & Lloyd-Jones, G. (1995). A review of bacterial-degradation of pesticides. Soil Research, 33(6), 925–942.
Auffret, M., Pilote, A., Proulx, É., Proulx, D., Vandenberg, G., & Villemur, R. (2011). Establishment of a real-time PCR method for quantification of geosmin-producing Streptomyces spp. in recirculating aquaculture systems. Water Research, 45(20), 6753–6762. https://doi.org/10.1016/j.watres.2011.10.020
Auffret, M., Yergeau, É., Pilote, A., Proulx, É., Proulx, D., Greer, C. W., … Villemur, R. (2013). Impact of water quality on the bacterial populations and off-flavours in recirculating aquaculture systems. FEMS Microbiology Ecology, 84(2), 235–247.
Azaria, S., Nir, S., & van Rijn, J. (2017). Combined adsorption and degradation of the off-flavour compound 2-methylisoborneol in sludge derived from a recirculating aquaculture system. Chemosphere, 169, 69–77.
Azaria, S., & van Rijn, J. (2018). Off-flavour compounds in recirculating aquaculture systems (RAS): Production and removal processes. Aquacultural Engineering, 83, 57–64.
Barrow, G. I., & Hewitt, M. (1971). Skin infection with Mycobacterium marinum from a tropical fish tank. British Medical Journal, 2(5760), 505.
Boldrin, B., Tiehm, A., & Fritzsche, C. (1993). Degradation of phenanthrene, fluorene, fluoranthene, and pyrene by a Mycobacterium sp. Appl. Environ. Microbiol., 59(6), 1927–1930.
Breheret, S., Talou, T., Rapior, S., & Bessière, J.-M. (1999). Geosmin, a sesquiterpenoid compound responsible for the musty-earthy odor of Cortinarius herculeus, Cystoderma amianthinum, and Cy. carcharias. Mycologia, 91(1), 117–120.
Buikema, A. L., Geiger, J. G., & Lee, u D. R. (1980). Daphnia toxicity tests. In Aquatic invertebrate bioassays. ASTM International.
Burr, G. S., Wolters, W. R., Schrader, K. K., & Summerfelt, S. T. (2012). Impact of depuration of earthy-musty off-flavours on fillet quality of Atlantic salmon, Salmo salar, cultured in a recirculating aquaculture system. Aquacultural Engineering, 50, 28–36.
Buttery, R. G., Guadagni, D. G., & Ling, L. C. (1976). Geosmin, a musty off-flavour of dry beans. Journal of Agricultural and Food Chemistry, 24(2), 419–420.
Chaudhry, G. R., & Ali, A. N. (1988). Bacterial metabolism of carbofuran. Appl. Environ. Microbiol., 54(6), 1414–1419.
Chen, G., Dussert, B. W., & Suffet, I. H. (1997). Evaluation of granular activated carbons for removal of methylisoborneol to below odor threshold concentration in drinking water. Water Research, 31(5), 1155–1163.
Chen, R., Xue, Q., Zhang, Z., Sugiura, N., Yang, Y., Li, M., … Lei, Z. (2011). Development of long-life-cycle tablet ceramic adsorbent for geosmin removal from water solution. Applied Surface Science, 257(6), 2091–2096. https://doi.org/10.1016/j.apsusc.2010.09.055
Cheptsov, V. S., Vorobyova, E. A., Osipov, G. A., Manucharova, N. A., Polyanskaya, L., Gorlenko, M. V,

68
… Lomasov, V. N. (2018). Microbial activity in Martian analog soils after ionizing radiation: Implications for the preservation of subsurface life on Mars. AIMS Microbiol, 4, 541–562.
Chi, C., Fung, C., Wong, W., & Liu, C. (2004). Brevundimonas bacteremia: two case reports and literature review. Scandinavian Journal of Infectious Diseases, 36(1), 59–61.
Chung, S.-W., Chong, S.-A., & Park, H.-S. (2016). Development and applications of a predictive model for geosmin in North Han River, Korea. Procedia Engineering, 154, 521–528.
Collivignarelli, C., & Sorlini, S. (2004). AOPs with ozone and UV radiation in drinking water: contaminants removal and effects on disinfection byproducts formation. Water Science and Technology, 49(4), 51–56.
Cook, D., Newcombe, G., & Sztajnbok, P. (2001). The application of powdered activated carbon for MIB and geosmin removal: Predicting PAC doses in four raw waters. Water Research, 35(5), 1325–1333. https://doi.org/10.1016/S0043-1354(00)00363-8
Cross, T. (1981). Aquatic actinomycetes: a critical survey of the occurrence, growth and role of actinomycetes in aquatic habitats. Journal of Applied Bacteriology, 50(3), 397–423.
Danglot, C., Amar, G., & Vilagines, R. (1983). Ability of bacillus to degrade geosmin. Water Science and Technology, 15(6–7), 291–299.
Darriet, P., Pons, M., Lamy, S., & Dubourdieu, D. (2000). Identification and quantification of geosmin, an earthy odorant contaminating wines. Journal of Agricultural and Food Chemistry, 48(10), 4835–4838.
Dartnell, L. R., Hunter, S. J., Lovell, K. V, Coates, A. J., & Ward, J. M. (2010). Low-temperature ionizing radiation resistance of Deinococcus radiodurans and Antarctic Dry Valley bacteria. Astrobiology, 10(7), 717–732.
Das, S. K., Mishra, A. K., Tindall, B. J., Rainey, F. A., & Stackebrandt, E. (1996). Oxidation of thiosulfate by a new bacterium, Bosea thiooxidans.(strain BI-42) gen. nov., sp. nov.: analysis of phylogeny based on chemotaxonomy and 16S ribosomal DNA sequencing. International Journal of Systematic and Evolutionary Microbiology, 46(4), 981–987.
Davidson, J., Schrader, K., Ruan, E., Swift, B., Aalhus, J., Juarez, M., … Summerfelt, S. T. (2014). Evaluation of depuration procedures to mitigate the off-flavour compounds geosmin and 2-methylisoborneol from Atlantic salmon Salmo salar raised to market-size in recirculating aquaculture systems. Aquacultural Engineering, 61, 27–34.
De Meyer, S. E., & Willems, A. (2012). Multilocus sequence analysis of Bosea species and description of Bosea lupini sp. nov., Bosea lathyri sp. nov. and Bosea robiniae sp. nov., isolated from legumes. International Journal of Systematic and Evolutionary Microbiology, 62(10), 2505–2510.
Dickschat, J. S., Bode, H. B., Mahmud, T., Müller, R., & Schulz, S. (2005). A novel type of geosmin biosynthesis in myxobacteria. The Journal of Organic Chemistry, 70(13), 5174–5182.
Dissanayake Mudiyanselage Anusha Edirisinghe. (2018). SUPPRESSION OF GEOSMIN AND 2-MIB PRODUCTION IN RAS BY BIOFLOCS. Master Thesis.
Drikas, M., Dixon, M., & Morran, J. (2009). Removal of MIB and geosmin using granular activated carbon with and without MIEX pre-treatment. Water Research, 43(20), 5151–5159.
69
Du, K., Liu, J., Zhou, B., & Yuan, R. (2016). Isolation of bacteria capable of removing 2-methylisoborneol and effect of cometabolism carbon on biodegradation. Environmental Engineering Research, 21(3), 256–264.
Eaton, R. W. (2012). Dehydration of the off-flavour chemical 2-methylisoborneol by the R-limonene-degrading bacteria Pseudomonas sp. strain 19-rlim and Sphingomonas sp. strain BIR2-rlima. Biodegradation, 23(2), 253–261.
Eaton, R. W., & Sandusky, P. (2009). Biotransformations of 2-methylisoborneol by camphor-degrading bacteria. Appl. Environ. Microbiol., 75(3), 583–588.
Eaton, R. W., & Sandusky, P. (2010). Biotransformations of (+/−)-geosmin by terpene-degrading bacteria. Biodegradation, 21(1), 71–79.
Edelstein, H. (1994). Mycobacterium marinum skin infections: report of 31 cases and review of the literature. Archives of Internal Medicine, 154(12), 1359–1364.
Ellis, J., & Korth, W. (1993). Removal of geosmin and methylisoborneol from drinking water by adsorption on ultrastable zeolite-Y. Water Research, 27(4), 535–539. https://doi.org/10.1016/0043-1354(93)90162-B
Engle, C. R., Pounds, G. L., & van der Ploeg, M. (1995). The cost of off‐flavour. Journal of the World Aquaculture Society, 26(3), 297–306.
Falcioni, T., Manti, A., Boi, P., Canonico, B., Balsamo, M., & Papa, S. (2006). Comparison of disruption procedures for enumeration of activated sludge floc bacteria by flow cytometry. Cytometry Part B: Clinical Cytometry: The Journal of the International Society for Analytical Cytology, 70(3), 149–153.
From, J., & Hørlyck, V. (1984). Sites of uptake of geosmin, a cause of earthy-flavour, in rainbow trout (Salmo gairdneri). Canadian Journal of Fisheries and Aquatic Sciences, 41(8), 1224–1226.
Gerber, N. N., & Lechevalier, H. A. (1965). Geosmin, an earthy-smelling substance isolated from actinomycetes. Appl. Environ. Microbiol., 13(6), 935–938.
Ghasemi, Z., Sourinejad, I., Kazemian, H., & Rohani, S. (2018). Application of zeolites in aquaculture industry: a review. Reviews in Aquaculture, 10(1), 75–95. https://doi.org/10.1111/raq.12148
Gilad, J., Borer, A., Peled, N., Riesenberg, K., Tager, S., Appelbaum, A., & Schlaeffer, F. (2000). Hospital-acquired Brevundimonas vesicularis septicaemia following open-heart surgery: case report and literature review. Scandinavian Journal of Infectious Diseases, 32(1), 90–91.
Grace, W. R. (2010). Co. Enriching Lives, Everywhere. Zeolite Structure.
Guazzaroni, M., Morgante, V., Mirete, S., & González‐Pastor, J. E. (2013). Novel acid resistance genes from the metagenome of the T into R iver, an extremely acidic environment. Environmental Microbiology, 15(4), 1088–1102.
Guerin, W. F., & Jones, G. E. (1988). Mineralization of phenanthrene by a Mycobacterium sp. Appl. Environ. Microbiol., 54(4), 937–944.
Gunasekera, T. S., Attfield, P. V, & Veal, D. A. (2000). A Flow Cytometry Method for Rapid Detection and Enumeration of Total Bacteria in Milk. Applied and Environmental Microbiology, 66(3), 1228 LP – 1232. https://doi.org/10.1128/AEM.66.3.1228-1232.2000
Gutierrez-Wing, M. T., & Malone, R. F. (2006). Biological filters in aquaculture: trends and research

70
directions for freshwater and marine applications. Aquacultural Engineering, 34(3), 163–171.
Guttman, L., & van Rijn, J. (2008). Identification of conditions underlying production of geosmin and 2-methylisoborneol in a recirculating system. Aquaculture, 279(1–4), 85–91. https://doi.org/10.1016/j.aquaculture.2008.03.047
Guttman, L., & van Rijn, J. (2009a). 2-Methylisoborneol and geosmin uptake by organic sludge derived from a recirculating aquaculture system. Water Research, 43(2), 474–480. https://doi.org/10.1016/j.watres.2008.10.018
Guttman, L., & van Rijn, J. (2009b). 2-Methylisoborneol and geosmin uptake by organic sludge derived from a recirculating aquaculture system. Water Research, 43(2), 474–480.
Guttman, L., & van Rijn, J. (2012a). Isolation of bacteria capable of growth with 2-methylisoborneol and geosmin as the sole carbon and energy sources. Applied and Environmental Microbiology, 78(2), 363–370. https://doi.org/10.1128/AEM.06333-11
Guttman, L., & van Rijn, J. (2012b). Isolation of bacteria capable of growth with 2-methylisoborneol and geosmin as the sole carbon and energy sources. Appl. Environ. Microbiol., 78(2), 363–370.
Han, X. Y., & Andrade, R. A. (2005). Brevundimonas diminuta infections and its resistance to fluoroquinolones. Journal of Antimicrobial Chemotherapy, 55(6), 853–859.
Hanson, T. R., & In, T. R. KK Schrader, A. R. (eds). (2003). Off-flavours in Aquaculture. ACS Symposium Series, 848, 13–29.
HAYES, S. J., HAYES, K. P., & ROBINSON, B. S. (1991). Geosmin As an Odorous Metabolite In Cultures of A Free‐Living Amoeba, Vannella Species (Gymnamoebia, Vannellidae). The Journal of Protozoology, 38(1), 44–47.
Herzing, D. R., Snoeyink, V. L., & Wood, N. F. (1977). Activated Carbon Adsorption of the Odorous Compounds 2‐Methylisoborneol and Geosmin. Journal‐American Water Works Association, 69(4), 223–228.
Ho, L., Hoefel, D., Bock, F., Saint, C. P., & Newcombe, G. (2007). Biodegradation rates of 2-methylisoborneol (MIB) and geosmin through sand filters and in bioreactors. Chemosphere, 66(11), 2210–2218. https://doi.org/10.1016/j.chemosphere.2006.08.016
Ho, L., Sawade, E., & Newcombe, G. (2012). Biological treatment options for cyanobacteria metabolite removal–A review. Water Research, 46(5), 1536–1548.
Hoefel, D, Ho, L., Aunkofer, W., Monis, P. T., Keegan, A., Newcombe, G., & Saint, C. P. (2006). Cooperative biodegradation of geosmin by a consortium comprising three gram‐negative bacteria isolated from the biofilm of a sand filter column. Letters in Applied Microbiology, 43(4), 417–423.
Hoefel, Daniel, Grooby, W. L., Monis, P. T., Andrews, S., & Saint, C. P. (2003). Enumeration of water-borne bacteria using viability assays and flow cytometry: a comparison to culture-based techniques. Journal of Microbiological Methods, 55(3), 585–597.
Hoefel, Daniel, Ho, L., Monis, P. T., Newcombe, G., & Saint, C. P. (2009). Biodegradation of geosmin by a novel Gram-negative bacterium; isolation, phylogenetic characterisation and degradation rate determination. Water Research, 43(11), 2927–2935. https://doi.org/10.1016/j.watres.2009.04.005

71
Howgate, P. (2004). Tainting of farmed fish by geosmin and 2-methyl-iso-borneol: A review of sensory aspects and of uptake/depuration. Aquaculture, 234(1–4), 155–181. https://doi.org/10.1016/j.aquaculture.2003.09.032
Hsieh, S.-T., Lin, T.-F., & Wang, G.-S. (2010). Biodegradation of MIB and geosmin with slow sand filters. Journal of Environmental Science and Health Part A, 45(8), 951–957.
Izaguirre, G. (1992). A copper-tolerant Phormidium species from Lake Mathews, California, that produces 2-methylisoborneol and geosmin. Water Science and Technology, 25(2), 217–223.
Izaguirre, George, Wolfe, R. L., & Means, E. G. (1988). Degradation of 2-methylisoborneol by aquatic bacteria. Appl. Environ. Microbiol., 54(10), 2424–2431.
Jo, C. H., Dietrich, A. M., & Tanko, J. M. (2011). Simultaneous degradation of disinfection byproducts and earthy-musty odorants by the UV/H2O2 advanced oxidation process. Water Research, 45(8), 2507–2516.
Johnsen, P. B., & Lloyd, S. W. (1992). Influence of fat content on uptake and depuration of the off-flavour 2-methylisoborneol by channel catfish (Ictalurus punctatus). Canadian Journal of Fisheries and Aquatic Sciences, 49(11), 2406–2411.
Juchelka, C. M., & Snell, T. W. (1994). Rapid toxicity assessment using rotifer ingestion rate. Archives of Environmental Contamination and Toxicology, 26(4), 549–554.
Jüttner, F. (1988). Biochemistry of biogenic off-flavour compounds in surface waters. Water Science and Technology, 20(8–9), 107–116.
Jüttner, F. (1995). Physiology and biochemistry of odorous compounds from freshwater cyanobacteria and algae. Water Science and Technology, 31(11), 69–78.
Jüttner, Friedrich, & Watson, S. B. (2007). Biochemical and ecological control of geosmin and 2-methylisoborneol in source waters. Appl. Environ. Microbiol., 73(14), 4395–4406.
Kavitha, S., Selvakumar, R., Sathishkumar, M., Swaminathan, K., Lakshmanaperumalsamy, P., Singh, A., & Jain, S. K. (2009). Nitrate removal using Brevundimonas diminuta MTCC 8486 from ground water. Water Science and Technology, 60(2), 517–524.
Kawamura, K., Jornitz, M. W., & Meltzer, T. H. (n.d.). Brevundimonas diminuta.
Kelly, A. M., Holmes, W. E., & Schultz, T. P. (2006). An environmentally benign method for reducing off-flavour terpenoids in aquaculture: Initial laboratory studies. North American Journal of Aquaculture, 68(3), 249–252.
Kenefick, S. L., Hrudey, S. E., Prepas, E. E., Motkosky, N., & Peterson, H. G. (1992). Odorous substances and cyanobacterial toxins in prairie drinking water sources. Water Science and Technology, 25(2), 147–154.
Kim, J.-Y., Kim, D.-U., Kang, M.-S., Jang, J. H., Kim, S. J., Kim, M. J., … Lim, S. (2018). Roseomonas radiodurans sp. nov., a gamma-radiation-resistant bacterium isolated from gamma ray-irradiated soil. International Journal of Systematic and Evolutionary Microbiology, 68(8), 2443–2447.
King, H. C., Khera-Butler, T., James, P., Oakley, B. B., Erenso, G., Aseffa, A., … Courtenay, O. (2017). Environmental reservoirs of pathogenic mycobacteria across the Ethiopian biogeographical landscape. PloS One, 12(3), e0173811.

72
Kinnucan, H., Sindelar, S., Wineholt, D., & Hatch, U. (1988). Processor demand and price-markup functions for catfish: a disaggregated analysis with implications for the off-flavour problem. Journal of Agricultural and Applied Economics, 20(2), 81–92.
Kiviranta, J., & Abdel-Hameed, A. (1994). Toxicity of the blue-green alga Oscillatoria agardhii to the mosquito Aedes aegypti and the shrimp Artemia salina. World Journal of Microbiology & Biotechnology, 10(5), 517–520.
Kiviranta, J., Sivonen, K., Niemelä, S. I., & Huovinen, K. (1991). Detection of toxicity of cyanobacteria by Artemia salina bioassay. Environmental Toxicology and Water Quality, 6(4), 423–436.
Kumar, V., Baruah, K., Nguyen, D. V., Smagghe, G., Vossen, E., & Bossier, P. (2018). Phloroglucinol-mediated Hsp70 production in crustaceans: protection against Vibrio parahaemolyticus in Artemia franciscana and Macrobrachium rosenbergii. Frontiers in Immunology, 9, 1091.
Kurane, R., Toeda, K., Takeda, K., & Suzuki, T. (1986). Culture conditions for production of microbial flocculant by Rhodococcus erythropolis. Agricultural and Biological Chemistry, 50(9), 2309–2313.
Kurtböke, D. İ., Exley, P., Brooks, P. R., Jonns, J. A., & Poole, S. (2017). Streptophage-mediated control of off-flavour taint producing streptomycetes isolated from barramundi ponds. Synthetic and Systems Biotechnology, 2(2), 105–112. https://doi.org/10.1016/j.synbio.2017.04.002
La Guerche, S., Chamont, S., Blancard, D., Dubourdieu, D., & Darriet, P. (2005). Origin of (−)-geosmin on grapes: on the complementary action of two fungi, Botrytis cinerea and Penicillium expansum. Antonie Van Leeuwenhoek, 88(2), 131–139.
La Scola, B., Mallet, M.-N., Grimont, P. A. D., & Raoult, D. (2003). Bosea eneae sp. nov., Bosea massiliensis sp. nov. and Bosea vestrisii sp. nov., isolated from hospital water supplies, and emendation of the genus Bosea (Das et al. 1996). International Journal of Systematic and Evolutionary Microbiology, 53(1), 15–20.
Lalezary‐Craig, S., Pirbazari, M., Dale, M. S., Tanaka, T. S., & McGuire, M. J. (1988). Optimizing the removal of geosmin and 2‐methylisoborneol by powdered activated carbon. Journal‐American Water Works Association, 80(4), 73–80.
Lanciotti, E., Santini, C., Lupi, E., & Burrini, D. (2003). Actinomycetes, cyanobacteria and algae causing tastes and odours in water of the River Arno used for the water supply of Florence. Journal of Water Supply: Research and Technology-Aqua, 52(7), 489–500.
Lauderdale, C. V., Aldrich, H. C., & Lindner, A. S. (2004). Isolation and characterization of a bacterium capable of removing taste- and odor-causing 2-methylisoborneol from water. Water Research, 38(19), 4135–4142. https://doi.org/10.1016/j.watres.2004.08.014
Lee, T.-H., Chen, Y.-M., & Chou, H.-N. (1999). Toxicity assay of cyanobacterial strains using Artemia salina in comparison with the mouse bioassay. Acta Zoologica Taiwanica, 10(1), 1–9.
Lewan, L., Andersson, M., & Morales-Gomez, P. (1992). Use of Artemia salina in toxicity testing. Alternatives to Laboratory Animals: ATLA.
Leys, N. M., Bastiaens, L., Verstraete, W., & Springael, D. (2005). Influence of the carbon/nitrogen/phosphorus ratio on polycyclic aromatic hydrocarbon degradation by Mycobacterium and Sphingomonas in soil. Applied Microbiology and Biotechnology, 66(6), 726–736.

73
Li, Y. (2015). Estimating the Remaining GAC Removal Capacity for Geosmin and MIB.
Lindholm-Lehto, P. C., & Vielma, J. (2019). Controlling of geosmin and 2-methylisoborneol induced off-flavours in recirculating aquaculture system farmed fish—A review. Aquaculture Research, 50(1), 9–28. https://doi.org/10.1111/are.13881
Lisanti, M. T., Gambuti, A., Genovese, A., Piombino, P., & Moio, L. (2014). Earthy off-flavour in wine: Evaluation of remedial treatments for geosmin contamination. Food Chemistry, 154, 171–178. https://doi.org/10.1016/j.foodchem.2013.12.100
López, M. J., Nichols, N. N., Dien, B. S., Moreno, J., & Bothast, R. J. (2004). Isolation of microorganisms for biological detoxification of lignocellulosic hydrolysates. Applied Microbiology and Biotechnology, 64(1), 125–131.
Lovell, R. T., Lelana, I. Y., Boyd, C. E., & Armstrong, M. S. (1986). Geosmin and musty-muddy flavours in pond-raised channel catfish. Transactions of the American Fisheries Society, 115(3), 485–489.
Lukassen, M. B., Saunders, A. M., Sindilariu, P. D., & Nielsen, J. L. (2017). Quantification of novel geosmin-producing bacteria in aquaculture systems. Aquaculture, 479(May), 304–310. https://doi.org/10.1016/j.aquaculture.2017.06.004
Luo, G., Wang, J., Ma, N., Liu, Z., & Tan, H. (2016). Effects of inoculated bacillus subtilis on geosmin and 2-methylisoborneol removal in suspended growth reactors using aquacultural waste for biofloc production. Journal of Microbiology and Biotechnology, 26(8), 1420–1427.
Ma, N., Luo, G., Tan, H., Li, L., & Wang, X. (2016). Removal of geosmin and 2-methylisoborneol by bioflocs produced with aquaculture waste. Aquaculture International, 24(1), 345–356.
MacDonald, J. C., Bock, C. A., & Slater, G. P. (1987). Evaluation of bacillus as a practical means for degradation of geosmin. Applied Microbiology and Biotechnology, 25(4), 392–395.
Mallevialle, J., & Suffet, I. (1987). Treatment of tastes and odours in potable water supplies. Identification and Treatment of Tastes and Odours in Drinking Water, 211.
Marcondes de Souza, J. A., Carareto Alves, L. M., de Mello Varani, A., & de Macedo Lemos, E. G. (2014). The family bradyrhizobiaceae. The Prokaryotes: Alphaproteobacteria and Betaproteobacteria, 135–154.
Marques, A., Ollevier, F., Verstraete, W., Sorgeloos, P., & Bossier, P. (2006). Gnotobiotically grown aquatic animals: opportunities to investigate host–microbe interactions. Journal of Applied Microbiology, 100(5), 903–918.
Martin, J. F., Bennett, L. W., & Graham, W. H. (1988). Off-flavour in the channel catfish (Ictalurus punctatus) due to 2-methylisoborneol and its dehydration products. Water Science and Technology, 20(8–9), 99–105.
Matsui, Y., Ando, N., Sasaki, H., Matsushita, T., & Ohno, K. (2009). Branched pore kinetic model analysis of geosmin adsorption on super-powdered activated carbon. Water Research, 43(12), 3095–3103.
McDowall, B., Hoefel, D., Newcombe, G., Saint, C. P., & Ho, L. (2009). Enhancing the biofiltration of geosmin by seeding sand filter columns with a consortium of geosmin-degrading bacteria. Water Research, 43(2), 433–440. https://doi.org/10.1016/j.watres.2008.10.044
Medsker, L. L., Jenkins, D., Thomas, J. F., & Koch, C. (1969). Odorous compounds in natural waters. 2-

74
Exo-hydroxy-2-methylbornane, the major odorous compound produced by several actinomycetes. Environmental Science & Technology, 3(5), 476–477.
Michaels, R., & Kim, K.-H. (1966). Comparative studies of putrescine degradation by microorganisms. Biochimica et Biophysica Acta (BBA)-General Subjects, 115(1), 59–64.
Nam-Koong, H., Schroeder, J. P., Petrick, G., & Schulz, C. (2016). Removal of the off-flavour compounds geosmin and 2-methylisoborneol from recirculating aquaculture system water by ultrasonically induced cavitation. Aquacultural Engineering, 70, 73–80. https://doi.org/10.1016/j.aquaeng.2015.10.005
Narayan, L. V, & III, W. J. N. (1974). Biological control: isolation and bacterial oxidation of the taste‐and‐odor compound geosmin. Journal‐American Water Works Association, 66(9), 532–536.
Newcombe, G., Morrison, J., Hepplewhite, C., & Knappe, D. R. U. (2002). Simultaneous adsorption of MIB and NOM onto activated carbon: II. Competitive effects. Carbon, 40(12), 2147–2156.
Nizan, S., Dimentman, C., & Shilo, M. (1986). Acute toxic effects of the cyanobacterium Microcystis aeruginosa on Daphnia magna 1. Limnology and Oceanography, 31(3), 497–502.
Ouattara, A. S., Assih, E. A., Thierry, S., Cayol, J.-L., Labat, M., Monroy, O., & Macarie, H. (2003). Bosea minatitlanensis sp. nov., a strictly aerobic bacterium isolated from an anaerobic digester. International Journal of Systematic and Evolutionary Microbiology, 53(5), 1247–1251.
Palmeri, G., Turchini, G. M., Caprino, F., Keast, R., Moretti, V. M., & De Silva, S. S. (2008). Biometric, nutritional and sensory changes in intensively farmed Murray cod (Maccullochella peelii peelii, Mitchell) following different purging times. Food Chemistry, 107(4), 1605–1615.
Parng, C. (2005). In vivo zebrafish assays for toxicity testing. Current Opinion in Drug Discovery & Development, 8(1), 100–106.
Persson, F., Heinicke, G., Hedberg, T., Hermansson, M., & Uhl, W. (2007). Removal of geosmin and MIB by biofiltration-an investigation discriminating between adsorption and biodegradation. Environmental Technology, 28(1), 95–104.
Persson, P.-E. (1980). Sensory properties and analysis of two muddy odour compounds, geosmin and 2-methylisoborneol, in water and fish. Water Research, 14(8), 1113–1118.
Persson, P.-E. (1984). Uptake and release of environmentally occurring odorous compounds by fish. A review. Water Research, 18(10), 1263–1271.
Pirbazari, M., Borow, H. S., Craig, S., Ravindran, V., & McGuire, M. J. (1992). Physical chemical characterization of five earthy-musty-smelling compounds. Water Science and Technology, 25(2), 81–88.
Polak, E. H., & Provasi, J. (1992). Odor sensitivity to geosmin enantiomers. Chemical Senses, 17(1), 23–26.
Preston, B. L., & Snell, T. W. (2001). Full life-cycle toxicity assessment using rotifer resting egg production: implications for ecological risk assessment. Environmental Pollution, 114(3), 399–406.
Ren, L., Jia, Y., Ruth, N., Qiao, C., Wang, J., Zhao, B., & Yan, Y. (2016). Biodegradation of phthalic acid esters by a newly isolated Mycobacterium sp. YC-RL4 and the bioprocess with environmental samples. Environmental Science and Pollution Research, 23(16), 16609–16619.

75
Resmi, G., Thampi, S. G., & Chandrakaran, S. (2010). Brevundimonas vesicularis: A novel bio-sorbent for removal of lead from wastewater. International Journal of Environmental Research, 4(2), 281–288.
Rihs, J. D., Brenner, D. J., Weaver, R. E., Steigerwalt, A. G., Hollis, D. G., & Yu, V. L. (1993). Roseomonas, a new genus associated with bacteremia and other human infections. Journal of Clinical Microbiology, 31(12), 3275–3283.
Robertson, R. F., Jauncey, K., Beveridge, M. C. M., & Lawton, L. A. (2005). Depuration rates and the sensory threshold concentration of geosmin responsible for earthy-musty taint in rainbow trout, Onchorhynchus mykiss. Aquaculture, 245(1–4), 89–99.
Rurangwa, E., & Verdegem, M. C. J. (2015). Microorganisms in recirculating aquaculture systems and their management. Reviews in Aquaculture, 7(2), 117–130.
Ryan, K. J., & Ray, C. G. (2004). Medical microbiology. McGraw Hill, 4, 370.
S. Tucker, C. (2000). Off-Flavour Problems in Aquaculture. Reviews in Fisheries Science - REV FISH SCI (Vol. 8). https://doi.org/10.1080/10641260091129170
Safferman, R. S., Rosen, A. A., Mashni, C. I., & Morris, M. E. (1967). Earthy-smelling substance from a blue-green alga. Environmental Science & Technology, 1(5), 429–430.
Safronova, V. I., Kuznetsova, I. G., Sazanova, A. L., Kimeklis, A. K., Belimov, A. A., Andronov, E. E., … Popov, K. P. (2015). Bosea vaviloviae sp. nov., a new species of slow-growing rhizobia isolated from nodules of the relict species Vavilovia formosa (Stev.) Fed. Antonie van Leeuwenhoek, 107(4), 911–920.
Saito, A., Tokuyama, T., Tanaka, A., Oritani, T., & Fuchigami, K. (1999). Microbiological degradation of (-)-geosmin. Water Research, 33(13), 3033–3036. https://doi.org/10.1016/S0043-1354(99)00155-4
Schrader, K. K., Davidson, J. W., Rimando, A. M., & Summerfelt, S. T. (2010). Evaluation of ozonation on levels of the off-flavour compounds geosmin and 2-methylisoborneol in water and rainbow trout Oncorhynchus mykiss from recirculating aquaculture systems. Aquacultural Engineering, 43(2), 46–50.
Schrader, K. K., & Rimando, A. M. (2003). Off-Flavours in Aquaculture: An Overview. Off-Flavours in Aquaculture, 848(848), 1–12. https://doi.org/doi:10.1021/bk-2003-0848.ch00110.1021/bk-2003-0848.ch001
Schrader, K. K., & Summerfelt, S. T. (2010). Distribution of off-flavour compounds and isolation of geosmin-producing bacteria in a series of water recirculating systems for rainbow trout culture. North American Journal of Aquaculture, 72(1), 1–9.
Schram, E., Schrama, J., Kusters, K., Kwadijk, C., & Palstra, A. (2016). Effects of exercise and temperature on geosmin excretion by European eel (Anguilla anguilla). Aquaculture, 451, 390–395.
Seto, H., Orihara, N., & Furihata, K. (1998). Studies on the biosynthesis of terpenoids produced by actinomycetes. Part 4. Formation of BE-40644 by the mevalonate and nonmevalonate pathways. Tetrahedron Letters, 39(51), 9497–9500.
Seto, H., Watanabe, H., & Furihata, K. (1996). Simultaneous operation of the mevalonate and non-mevalonate pathways in the biosynthesis of isopentenly diphosphate in Streptomyces

76
aeriouvifer. Tetrahedron Letters, 37(44), 7979–7982.
Shields, M. S., & Reagin, M. J. (1992). Selection of a Pseudomonas cepacia strain constitutive for the degradation of trichloroethylene. Appl. Environ. Microbiol., 58(12), 3977–3983.
Silvey, J. K. G., Henley, A. W., Nunez, W. J., & Cohen, R. C. (1970). Biological control: control of naturally occurring taste and odors by microorganisms. In Proceedings of the National Biological Congress, Detroit, USA.
Silvey, J. K. G., & Roach, A. W. (1964). Studies on microbiotic cycles in surface waters. Journal‐American Water Works Association, 56(1), 60–72.
Singh, B. K., & Walker, A. (2006). Microbial degradation of organophosphorus compounds. FEMS Microbiology Reviews, 30(3), 428–471.
Sipes, N. S., Padilla, S., & Knudsen, T. B. (2011). Zebrafish—As an integrative model for twenty‐first century toxicity testing. Birth Defects Research Part C: Embryo Today: Reviews, 93(3), 256–267.
Smith, J. L., Boyer, G. L., & Zimba, P. V. (2008). A review of cyanobacterial odorous and bioactive metabolites: impacts and management alternatives in aquaculture. Aquaculture, 280(1–4), 5–20.
Smith, M., Zahnley, J., Pfeifer, D., & Goff, D. (1993). Growth and cholesterol oxidation by Mycobacterium species in Tween 80 medium. Appl. Environ. Microbiol., 59(5), 1425–1429.
Snell, T. W., & Janssen, C. R. (1995). Rotifers in ecotoxicology: a review. Hydrobiologia, 313(1), 231–247.
Solano-Serena, F., Marchal, R., Casarégola, S., Vasnier, C., Lebeault, J.-M., & Vandecasteele, J.-P. (2000). A Mycobacterium strain with extended capacities for degradation of gasoline hydrocarbons. Appl. Environ. Microbiol., 66(6), 2392–2399.
Sorgeloos, P., Remiche-Van Der Wielen, C., & Persoone, G. (1978). The use of Artemia nauplii for toxicity tests—a critical analysis. Ecotoxicology and Environmental Safety, 2(3–4), 249–255.
Soto-Rodriguez, S. A., Roque, A., Lizarraga-Partida, M. L., Guerra-Flores, A. L., & Gomez-Gil, B. (2003). Virulence of luminous vibrios to Artemia franciscana nauplii. Diseases of Aquatic Organisms, 53(3), 231–240.
Spörle, J., Becker, H., Allen, N. S., & Gupta, M. P. (1991). Occurrence of (-)-Geosm in and Other Terpenoids in an Axenic Culture of the Liverwort Symphyogyna brongniartii. Zeitschrift Für Naturforschung C, 46(3–4), 183–188.
Srinivasan, R., & Sorial, G. A. (2011). Treatment of taste and odor causing compounds 2-methyl isoborneol and geosmin in drinking water: A critical review. Journal of Environmental Sciences, 23(1), 1–13. https://doi.org/10.1016/S1001-0742(10)60367-1
Stanier, R. Y., Kunisawa, R., Mandel, M., & Cohen-Bazire, G. (1971). Purification and properties of unicellular blue-green algae (order Chroococcales). Bacteriological Reviews, 35(2), 171.
Suffet, I. H. M., Khiari, D., & Bruchet, A. (1999). The drinking water taste and odor wheel for the millennium: beyond geosmin and 2-methylisoborneol. Water Science and Technology, 40(6), 1–13.
Sunesson, A. L., Vaes, W., Nilsson, C., Blomquist, G., Andersson, B., & Carlson, R. (1995). Identification of volatile metabolites from five fungal species cultivated on two media. Appl.

77
Environ. Microbiol., 61(8), 2911–2918.
Tabachek, J.-A. L., & Yurkowski, M. (1976). Isolation and identification of blue-green algae producing muddy odor metabolites, geosmin, and 2-methylisoborneol, in saline lakes in Manitoba. Journal of the Fisheries Board of Canada, 33(1), 25–35.
Tanaka, A., Oritani, T., Uehara, F., Saito, A., Kishita, H., Niizeki, Y., … Fuchigami, K. (1996). Biodegradation of a musty odour component, 2-methylisoborneol. Water Research, 30(3), 759–761.
Tango, M. S., & Gagnon, G. A. (2003). Impact of ozonation on water quality in marine recirculation systems. Aquacultural Engineering, 29(3–4), 125–137.
Thomas, V., Casson, N., & Greub, G. (2007). New Afipia and Bosea strains isolated from various water sources by amoebal co-culture. Systematic and Applied Microbiology, 30(7), 572–579.
Toeda, K., & Kurane, R. (1991). Microbial flocculant from Alcaligenes cupidus KT201. Agricultural and Biological Chemistry, 55(11), 2793–2799.
Troussellier, M., Bouvy, M., … C. C.-A. M., & 1997, undefined. (n.d.). Variation of carbon content among bacterial species under starvation condition. Int-Res.Com. Retrieved from http://www.int-res.com/articles/ame/13/a013p113.pdf
Troussellier, M., Bouvy, M., Courties, C., & Dupuy, C. (1997). Variation of carbon content among bacterial species under starvation condition. Aquatic Microbial Ecology, 13(1), 113–119.
Tsuchiya, Y., & Matsumoto, A. (1999). Characterization of Oscillatoria f. granulata producing 2-methylisoborneol and geosmin. Water Science and Technology, 40(6), 245–250.
Turenne, C. Y. (2019). Nontuberculous mycobacteria: Insights on taxonomy and evolution. Infection, Genetics and Evolution.
Ueno, A., Ito, Y., Yamamoto, Y., Yumoto, I., & Okuyama, H. (2006). Bacterial community changes in diesel‐oil‐contaminated soil microcosms biostimulated with Luria–Bertani medium or bioaugmented with a petroleum‐degrading bacterium, Pseudomonas aeruginosa strain WatG. Journal of Basic Microbiology, 46(4), 310–317.
Van Nevel, S., Koetzsch, S., Weilenmann, H.-U., Boon, N., & Hammes, F. (2013). Routine bacterial analysis with automated flow cytometry. Journal of Microbiological Methods, 94(2), 73–76. https://doi.org/10.1016/J.MIMET.2013.05.007
Von Reyn, C. F., Waddell, R. D., Eaton, T., Arbeit, R. D., Maslow, J. N., Barber, T. W., … Lähdevirta, J. (1993). Isolation of Mycobacterium avium complex from water in the United States, Finland, Zaire, and Kenya. Journal of Clinical Microbiology, 31(12), 3227–3230.
Wang, S., Li, H., Xie, S., Liu, S., & Xu, L. (2006). Physical and chemical regeneration of zeolitic adsorbents for dye removal in wastewater treatment. Chemosphere, 65(1), 82–87.
Watson, S B, Charlton, M., Rao, Y. R., Howell, T., Ridal, J., Brownlee, B., … Millard, S. (2007). Off flavours in large waterbodies: physics, chemistry and biology in synchrony. Water Science and Technology, 55(5), 1–8.
Watson, Susan B., Monis, P., Baker, P., & Giglio, S. (2016). Biochemistry and genetics of taste- and odor-producing cyanobacteria. Harmful Algae, 54, 112–127. https://doi.org/10.1016/j.hal.2015.11.008

78
Wee, L. H., Janssens, N., Vercammen, J., Tamaraschi, L., Thomassen, L. C. J., & Martens, J. A. (2015). Stable TiO 2–USY zeolite composite coatings for efficient adsorptive and photocatalytic elimination of geosmin from water. Journal of Materials Chemistry A, 3(5), 2258–2264.
Wu, J. T., & Jüttner, F. (1988). Effect of environmental factors on geosmin production by Fischerella muscicola. Water Science and Technology, 20(8–9), 143–148.
Xue, Q., Shimizu, K., Sakharkar, M. K., Utsumi, M., Cao, G., Li, M., … Sugiura, N. (2012). Geosmin degradation by seasonal biofilm from a biological treatment facility. Environmental Science and Pollution Research, 19(3), 700–707.
Yamprayoon, J., & Noomhorm, A. (2000). Geosmin and off-flavour in Nile tilapia (Oreochromis niloticus). Journal of Aquatic Food Product Technology, 9(2), 29–41.
Yokoi, H., Shiraki, M., Hirose, J., Hayashi, S., & Takasaki, Y. (1996). Flocculation properties of xanthan produced by Xanthomonas campestris. Biotechnology Techniques, 10(10), 789–792.
YOSHINO, H., GRUENBERG, D. E., WATANABE, I., MIYAJIMA, K., & SATOH, O. (1999). Changes in water quality and performance of a closed recirculating seawater aquaculture system for rearing pejerrey, Odonthestes bonariensis. Aquaculture Science, 47(2), 289–297.
Yu, J., Yang, M., Lin, T. F., Guo, Z., Zhang, Y., Gu, J., & Zhang, S. (2007). Effects of surface characteristics of activated carbon on the adsorption of 2-methylisobornel (MIB) and geosmin from natural water. Separation and Purification Technology, 56(3), 363–370. https://doi.org/10.1016/j.seppur.2007.01.039
Yuan, R., Zhou, B., Shi, C., Yu, L., Zhang, C., & Gu, J. (2012). Biodegradation of 2-methylisoborneol by bacteria enriched from biological activated carbon. Frontiers of Environmental Science & Engineering, 6(5), 701–710.
Yurkowski, M., & Tabachek, J.-A. L. (1974). Identification, analysis, and removal of geosmin from muddy-flavoured trout. Journal of the Fisheries Board of Canada, 31(12), 1851–1858.
Zeng, J., Lin, X., Zhang, J., & Li, X. (2010). Isolation of polycyclic aromatic hydrocarbons (PAHs)-degrading Mycobacterium spp. and the degradation in soil. Journal of Hazardous Materials, 183(1–3), 718–723.
Zhong, Y., Luan, T., Wang, X., Lan, C., & Tam, N. F. Y. (2007). Influence of growth medium on cometabolic degradation of polycyclic aromatic hydrocarbons by Sphingomonas sp. strain PheB4. Applied Microbiology and Biotechnology, 75(1), 175–186.
Zhou, B., Yuan, R., Shi, C., Yu, L., Gu, J., & Zhang, C. (2011). Biodegradation of geosmin in drinking water by novel bacteria isolated from biologically active carbon. Journal of Environmental Sciences, 23(5), 816–823. https://doi.org/10.1016/S1001-0742(10)60458-5
Zoschke, K., Engel, C., Börnick, H., & Worch, E. (2011). Adsorption of geosmin and 2-methylisoborneol onto powdered activated carbon at non-equilibrium conditions: Influence of NOM and process modelling. Water Research, 45(15), 4544–4550. https://doi.org/10.1016/j.watres.2011.06.006

79
9. Appendixes
ANNEX I. Geosmin needed for cell growth calculations
Carbon content in one bacteria cells (Troussellier et al., 1997)
𝐶𝑎𝑟𝑏𝑜𝑛 𝑖𝑛 1 𝑐𝑒𝑙𝑙 = 26𝑓𝑔 = 26 × 10−15𝑔 = 2.17 × 10⁻¹⁵𝑚𝑜𝑙𝑒
Number of cells needed
107 − 105 = 9900000 𝑐𝑒𝑙𝑙𝑠
Weight of carbon needed
𝑚𝐶 = 9900000 × 26 × 10−15 = 2.574 × 10⁻⁷𝑔 = 2.145 × 10⁻⁸𝑚𝑜𝑙𝑒
Amount of geosmin needed
𝑛𝐺𝑒𝑜𝑠𝑚𝑖𝑛 =2.145 × 10⁻⁸
12= 1.7875 × 10⁻⁹ 𝑚𝑜𝑙𝑒
𝑚𝐺𝑒𝑜𝑠𝑚𝑖𝑛 = 1.7875 × 10−9 × 182 = 3.3 × 10⁻⁷𝑔 = 0.33µ𝑔
ANNEX II. Flow cytometry protocol for cytoFLEX machine
• Dye preparation
➢ Thiazole orange (TO) dye 17 μM (BD Biosciences Catalog No. 349483
or 349480), or equivalent at 8.1 μg/mL (FW 476.6) in DMSO
➢ Propidium iodide (PI) dye, 1.9 mM (BD Biosciences Catalog No.
349483 or 349480), or equivalent, at 1.3 mg/mL (FW 668.4) in
Phosphate buffered saline (PBS)
• Sample preparation
➢ Sample should be well homogenized and diluted to within 103 to 106
cells.mL-1
➢ Avoid using nutrient media, cells should be suspended in distilled
water instead.
• Sample loading
➢ add 5µL of thiazole orange and 5µL of propidium iodide to each well.
Dye must be protected from direct light and must be stored back to
4°C immediately
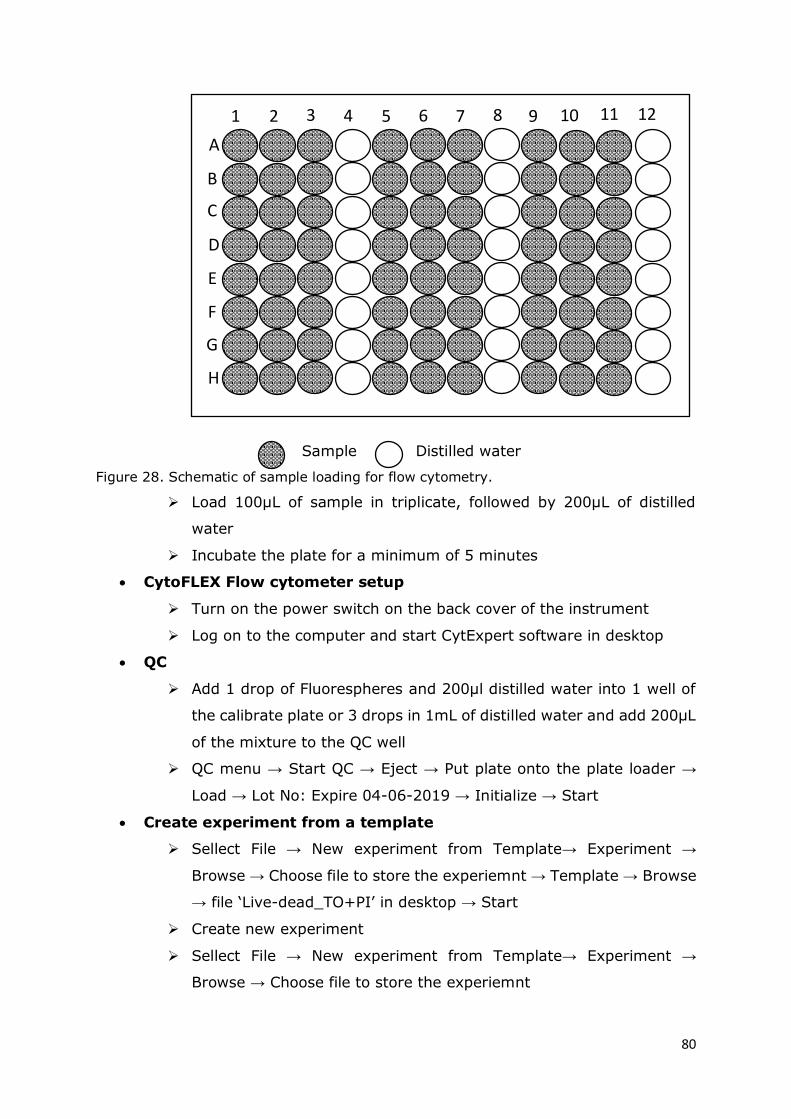
80
Sample Distilled water
Figure 28. Schematic of sample loading for flow cytometry.
➢ Load 100µL of sample in triplicate, followed by 200µL of distilled
water
➢ Incubate the plate for a minimum of 5 minutes
• CytoFLEX Flow cytometer setup
➢ Turn on the power switch on the back cover of the instrument
➢ Log on to the computer and start CytExpert software in desktop
• QC
➢ Add 1 drop of Fluorespheres and 200µl distilled water into 1 well of
the calibrate plate or 3 drops in 1mL of distilled water and add 200µL
of the mixture to the QC well
➢ QC menu → Start QC → Eject → Put plate onto the plate loader →
Load → Lot No: Expire 04-06-2019 → Initialize → Start
• Create experiment from a template
➢ Sellect File → New experiment from Template→ Experiment →
Browse → Choose file to store the experiemnt → Template → Browse
→ file ‘Live-dead_TO+PI’ in desktop → Start
➢ Create new experiment
➢ Sellect File → New experiment from Template→ Experiment →
Browse → Choose file to store the experiemnt
A
B
C
D
E
F
G
H
1 2 3 5 4 7 6 9 8 10 12 11

81
• Plate setting:
➢ Select ‘Add new plate’ → Select option of Plate type corresponding to
the used plate → Choose wells containing samples → ‘Set as sample
wells’
➢ Threshold setting:
➢ Threshold: Channel FITC → Manual: 1000 → Height
• Gain setting
➢ Use default machine setting or as follows
Table 15. Gain setting for flow cytoFLEX flowcytometer
Gain Setting
FSC 106
SSC 73
FITC 111
PE 119
PC 5.5 525
➢ Set up plots to monitor the measurement
➢ All plots are set on logarithmic scale

82
Figure 29. Screenshot of a typical flowcytometry measurement
Label Plot Reading
A SSC-H versus FSC-H Total population
B Count of FITC TO dye intensity consistency
C Count of PC5.5 PI dye intensity consistency
D Count versus time Sample flow consistency
E Time versus FITC Sample TO dye flow consistency
F Time versus PC5.5 Sample PI dye flow consistency
G PC5.5-A versus FITC-A Live and dead cells in different populations
H PC5.5-H versus FITC-H Live and dead cells in different populations
H Statistics table Shown number of different populations
• Load plate to machine and measure
A B
E
C D
F H G
I

83
➢ Select ‘Eject’→ Put plate onto plate loader → Load → Initialize → Auto
record
➢ Select ‘Stand by’ when the measurement is finished
• Cleaning and shut down
➢ Add 200µl distilled water (x5 wells)
➢ Add 200µl cleaning solution (x5 wells)
➢ Select ‘Cytometer’→ Daily clean…→ Set the default wells as ‘Empty
wells’ → Set distilled water wells as ‘Deionized water wells’ → Set
cleaning solution wells as ‘Cleaning reagent wells’
➢ Select ‘Run’
➢ Wait until cleaning is finished
➢ Turn off the CytoFLEX
ANNEX III. Flow cytometry optimization
Carry over effect
Figure 30. Normal sample flow (left), distilled water cleaning well (right)
We can see that the flow of normal sample is stable and horizontal. The flow of
distilled water cleaning sample is shown gradually decreasing, indicating the carry
over effect from previous sample.
Dye versus no dye
Table 15 Reading from dye and no dye sample with different dilutions (from a
density of 10 cells.mL-1)

84
Dilution Dye (cells.mL-1) No dye (cells.mL-1)
10-3 8520 7
10-4 1034 7
10-5 105 6
10-6 11 8
We can see that reading from undyed sample is significantly lower than that of
dyed samples
Figure 31. Strain F1, dye (left) versus no dye (right)
Figure 32. Strain F2, dye (left) versus no dye (right)

85
Figure 33. Strain F4, dye (left) versus no dye (right)
Figure 34. Strain F9, dye (left) versus no dye (right)
Figure 35. Strain F10, dye (left) versus no dye (right)
Dilutions

86
Table 16. Bacteria density at different dilutions from a density of 109 cells.mL-1
Dilution cells.mL-1
1 716
10-1 733
10-2 8043
10-3 8520
10-4 1034
10-5 105
10-6 11
10-7 2
10-8 2
10-9 1
10-10 4
From the table, it is clear that readings are consistent with dilution level only
between the range of 10-3 to 10-6
ANNEX IV. 16S sequences of selected strains
F1
TGCAAGTCGAACGGGCACTTCGGTGCTAGTGGCAGACGGGTGAGTAACGCGTGGGAA
CGTGCCTTTCGGTTCGGAATAATCCAGGGAAACTTGGACTAATACCGGATACGCCCTTC
GGGGGAAAGATTTATCGCCGAAAGATCGGCCCGCGTCTGATTAGCTAGTTGGTGAGGT
AATGGCTCACCAAGGCGACGATCAGTAGCTGGTCTGAGAGGATGATCAGCCACATTGG
GACTGAGACACGGCCCAAACTCCTACGGGAGGCAGCAGTGGGGAATATTGGACAATG
GGCGCAAGCCTGATCCAGCCATGCCGCGTGAGTGATGAAGGCCTTAGGGTTGTAAAGC
TCTTTTGTCCGGGAAGATAATGACTGTACCGGAAGAATAAGCCCCGGCTAACTTCGTGC
CAGCAGCCGCGGTAATACGAAGGGGGCTAGCGTTGCTCGGAATCACTGGGCGTAAAG
GGCGCGTAGGCGGACTCTTAAGTCGGGGGTGAAAGCCCAGGGCTCAACCCTGGAATT
GCCTTCGATACTGGGAGTCTTGAGTTCGGAAGAGGTTGGTGGAACTGCGAGTGTAGAG
GTGAAATTCGTAGATATTCGCAAGAACACCGGTGGCGAAGGCGGCCAACTGGTCCGAA
ACTGACGCTGAGGCGCGAAAGCGTGGGGAGCAAACAGGATTAGATACCCTGGTAGTC
CACGCCGTAAACGATGAATGCCAGCCGTTGGGGAGCTTGCTCTTCAGTGGCGCAGCTA
ACGCTTTAAGCATTCCGCCTGGGGAGTACGGTCGCAAGATTAAAACTCAAAGGAATTGA
CGGGGGCCCGCACAAGCGGTGGAGCATGTGGTTTAATTCGAAGCAACGCGCAGAACC
TTACCAGCTTTTGACATGTCCGGTTTGATCGGCAGAGATGCCTTTCTTCAGTTCGGCTG

87
GCCGGAACACAGGTGCTGCATGGCTGTCGTCAGCTCGTGTCGTGAGATGTTGGGTTAA
GTCCCGCAACGAGCGCAACCCTCGCCCCTAGTTGCCATCATTCAGTTGGGAACTCTAG
GGGGACTGCCGGTGATAAGCCGCGAGGAAGGTGGGGATGACGTCAAGTCCTCATGGC
CCTTACAGGCTGGGCTACACACGTGCTACAATGGCGGTGACAATGGGCAGCGAAAGG
GCGACCTCGAGCTAATCCCAAAAAGCCGTCTCAGTTCAGATTGTACTCTGCAACTCGAG
TACATGAAGGTGGAATCGCTAGTAATCGTGGATCAGCATGCCACGGTGAATACGTTCC
CGGGCCTTGTACACACCGCCCGTCACACCATGGGAGTTGGGTTTACCCGAAGGCGTCG
CGCTAACCGCAAGGA
F2
GGAATAATTCAGGGAAACTTGGACTAATACCGGATACGCCCTTCGGGGGAAAGATTTAT
CGCCGATAGATCGGCCCGCGTCTGATTAGCTAGTTGGTGAGGTAATGGCTCACCAAGG
CGACGATCAGTAGCTGGTCTGAGAGGATGATCAGCCACATTGGGACTGAGACACGGCC
CAAACTCCTACGGGAGGCAGCAGTGGGGAATATTGGACAATGGGCGCAAGCCTGATCC
AGCCATGCCGCGTGAGTGATGAAGGCCTTAGGGTTGTAAAGCTCTTTTGTCCGGGAAG
ATAATGACTGTACCGGAAGAATAAGCCCCGGCTAACTTCGTGCCAGCAGCCGCGGTAA
TACGAAGGGGGCTAGCGTTGCTCGGAATCACTGGGCGTAAAGGGCGCGTAGGCGGAC
TCTTAAGTCGGGGGTGAAAGCCCAGGGCTCAACCCTGGAATTGCCTTCGATACTGGGA
GTCTTGAGTTCGGAAGAGGTTGGTGGAACTGCGAGTGTAGAGGTGAAATTCGTAGATA
TTCGCAAGAACACCAGTGGCGAAGGCGGCCAACTGGTCCGATACTGACGCTGAGGCG
CGAAAGCGTGGGGAGCAAACAGGATTAGATACCCTGGTAGTCCACGCCGTAAACGATG
AATGCCAGCCGTTGGGGAGCTTGCTCTTCAGTGGCGCAGCTAACGCTTTAAGCATTCC
GCCTGGGGAGTACGGTCGCAAGATTAAAACTCAAAGGAATTGACGGGGGCCCGCACA
AGCGGTGGAGCATGTGGTTTAATTCGAAGCAACGCGCAGAACCTTACCAGCTTTTGAC
ATGTCCGGTTTGATCGGCAGAGATGCCTTTCTTCAGTTCGGCTGGCCGGAACACAGGT
GCTGCATGGCTGTCGTCAGCTCGTGTCGTGAGATGTTGGGTTAAGTCCCGCAACGAGC
GCAACCCTCGCCCCTAGTTGCCATCATTCAGTTGGGAACTCTAGGGGGACTGCCGGTG
ATAAGCCGCGAGGAAGGTGGGGATGACGTCAAGTCCTCATGGCCCTTACAGGCTGGG
CTACACACGTGCTACAATGGCGGTGACAATGGGCAGCGAAAGGGCGACCTCGAGCTAA
TCCCAAAAAGCCGTCTCAGTTCAGATTGTACTCTGCAACTCGAGTACATGAAGGTGGAA
TCGCTAGTAATCGTGGATCAGCATGCCACGGTGAATACGTTCCCGGGCCTTGTACACC
CCCCCCGTCACACCATGGGAGTTGGGTTTACCCGAAG
F4

88
TGCAAGTCGCACGGGCAGCAATGTCAGTGGCGGACGGGTGAGTAACGCGTAGGAAC
GTGTCCTGAGGTGGGGGACAACCCCGGGAAACTGGGGCTAATACCGCATATGGGCTG
AGGCCCAAAGCCGAGAGGCGCCTTTGGAGCGGCCTGCGTCCGATTAGGTAGTTGGTG
GGGTAAAGGCCTACCAAGCCTGCGATCGGTAGCTGGTCTGAGAGGACGACCAGCCAC
ACTGGGACTGAGACACGGCCCAGACTCCTACGGGAGGCAGCAGTGGGGAATATTGGA
CAATGGGCGAAAGCCTGATCCAGCAATGCCGCGTGGGTGAAGAAGGTCTTCGGATCG
TAAAGCCCTTTCGACGGGGACGATGATGACGGTACCCGTAGAAGAAGCCCCGGCTAA
CTTCGTGCCAGCAGCCGCGGTAATACGAAGGGGGCTAGCGTTGCTCGGAATTACTGG
GCGTAAAGGGCGCGTAGGCGGCGGCCCAAGTCAGGCGTGAAATTCCTGGGCTCAACC
TGGGGACTGCGCTTGATACTGGGTTGCTTGAGGATGGAAGAGGCTCGTGGAATTCCC
AGTGTAGAGGTGAAATTCGTAGATATTGGGAAGAACACCGGTGGCGAAGGCGGCGAG
CTGGTCCATTACTGACGCTGAGGCGCGACAGCGTGGGGAGCAAACAGGATTAGATAC
CCTGGTAGTCCACGCCGTAAACGATGTGCGCTGGATGTTGGGGCCCATAGGGTCTCA
GTGTCGTAGCCAACGCGGTAAGCGCACCGCCTGGGGAGTACGGCCGCAAGGTTGAAA
CTCAAAGGAATTGACGGGGGCCCGCACAAGCGGTGGAGCATGTGGTTTAATTCGAAG
CAACGCGCAGAACCTTACCAGCCCTTGACATGGTCACGACCGGTCCAGAGATGGACTT
TCCTAGCAATAGGCGTGATGCACAGGTGCTGCATGGCTGTCGTCAGCTCGTGTCGTGA
GATGTTGGGTTAAGTCCCGCAACGAGCGCAACCCTCGCCTCTAGTTGCCAGCATGTTC
GGGTGGGCACTCTAGAGGAACTGCCGGTGACAAGCCGGAGGAAGGTGGGGATGACG
TCAAGTCCTCATGGCCCTTATGGGCTGGGCTACACACGTGCTACAATGGCGGTGACAG
AGGGAAGCCAGGTCGCGAGGCCGAGCCGATCCCGAAAAGCCGTCTCAGTTCGGATTG
CACTCTGCAACTCGGGTGCATGAAGGTGGAATCGCTAGTAATCGCGGATCAGCACGC
CGCGGTGAATACGTTCCCGGGCCTTGTACACACCGCCCGTCACACCATGGGAGTTGG
TTCTACCTTAAGTCGTTGCGCTAACCAGCGATGGG
F9
TGCAAGTCGCACGGGCAGCAATGTCAGTGGCGGACGGGTGAGTAACGCGTAGGAACG
TGTCCTGAGGTGGGGGACAACCCCGGGAAACTGGGGCTAATACCGCATATGGGCTGA
GGCCCAAAGCCGAGAGGCGCCTTTGGAGCGGCCTGCGTCCGATTAGGTAGTTGGTGG
GGTAAAGGCCTACCAAGCCTGCGATCGGTAGCTGGTCTGAGAGGACGACCAGCCACAC
TGGGACTGAGACACGGCCCAGACTCCTACGGGAGGCAGCAGTGGGGAATATTGGACA
ATGGGCGAAAGCCTGATCCAGCAATGCCGCGTGGGTGAAGAAGGTCTTCGGATCGTAA
AGCCCTTTCGACGGGGACGATGATGACGGTACCCGTAGAAGAAGCCCCGGCTAACTTC
GTGCCAGCAGCCGCGGTAATACGAAGGGGGCTAGCGTTGCTCGGAATTACTGGGCGT
AAAGGGCGCGTAGGCGGCGGCCCAGTCAGGCGTGAAATTCCTGGGCTCAACCTGGGG

89
ACTGCGCTTGATACTGGGTTGCTTGAGGATGGAAGAGGCTCGTGGAATTCCCAGTGTA
GAGGTGAAATTCGTAGATATTGGGAAGAACACCGGTGGCGAAGGCGGCGAGCTGGTC
CATTACTGACGCTGAGGCGCGACAGCGTGGGGAGCAAACAGGATTAGATACCCTGGTA
GTCCACGCCGTAAACGATGTGCGCTGGATGTTGGGGCCCATAGGGTCTCAGTGTCGTA
GCCAACGCGGTAAGCGCACCGCCTGGGGAGTACGGCCGCAAGGTTGAAACTCAAAGG
AATTGACGGGGGCCCGCACAAGCGGTGGAGCATGTGGTTTAATTCGAAGCAACGCGCA
GAACCTTACCAGCCCTTGACATGGTCACGACCGGTCCAGAGATGGACTTTCCTAGCAAT
AGGCGTGATGCACAGGTGCTGCATGGCTGTCGTCAGCTCGTGTCGTGAGATGTTGGGT
TAAGTCCCGCAACGAGCGCAACCCTCGCCTCTAGTTGCCAGCATGTTCGGGTGGGCAC
TCTAGAGGAACTGCCGGTGACAAGCCGGAGGAAGGTGGGGATGACGTCAAGTCCTCA
TGGCCCTTATGGGCTGGGCTACACACGTGCTACAATGGCGGTGACAGAGGGAAGCCA
GGTCGCGAGGCCGAGCCGATCCCGAAAAGCCGTCTCAGTTCGGATTGCACTCTGCAAC
TCGGGTGCATGAAGGTGGAATCGCTAGTAATCGCGGATCAGCACGCCGCGGTGAATAC
GTTCCCGGGCCTTGTACACACCGCCCGTCACACCATGGGAGTTGGTTCTACCTTAAGTC
GTTGCGCTAACCAGCGATGGG
F10
TCTTCGGACTTAGTGGCGGACGGGTGAGTAACACGTGGGAACGAGCCTTTAGGTTCGG
AATAACTCAGGGAAACTTGTGCTAATACCGAATGTGCCCTTCGGGGGAAAGATTTATCG
CCTTTAGAGCGGCCCGCGTCTGATTAGCTAGTTGGTGAGGTAAAGGCTCACCAAGGCG
ACGATCAGTAGCTGGTCTGAGAGGATGATCAGCCACATTGGGACTGAGACACGGCCCA
AACTCCTACGGGAGGCAGCAGTGGGGAATCTTGCGCAATGGGCGAAAGCCTGACGCA
GCCATGCCGCGTGAATGATGAAGGTCTTAGGATTGTAAAATTCTTTCACCGGGGACGAT
AATGACGGTACCCGGAGAAGAAGCCCCGGCTAACTTCGTGCCAGCAGCCGCGGTAATA
CGAAGGGGGCTAGCGTTGCTCGGAATTACTGGGCGTAAAGGGAGCGTAGGCGGACAT
TTAAGTCAGGGGTGAAATCCCGGGGCTCAACCTCGGAATTGCCTTTGATACTGGGTGT
CTTGAGTGTGAGAGAGGTATGTGGAACTCCGAGTGTAGAGGTGAAATTCGTAGATATT
CGGAAGAACACCAGTGGCGAAGGCGACATACTGGCTCATTACTGACGCTGAGGCTCGA
AAGCGTGGGGAGCAAACAGGATTAGATACCCTGGTAGTCCACGCCGTAAACGATGATT
GCTAGTTGTCGGGATGCATGCATTTCGGTGACGCAGCTAACGCATTAAGCAATCCGCCT
GGGGAGTACGGTCGCAAGATTAAAACTCAAAGGAATTGACGGGGGCCCGCACAAGCG
GTGGAGCATGTGGTTTAATTCGAAGCAACGCGCAGAACCTTACCACCTTTTGACATGCC
CGGACCGCCACAGAGATGTGGCTTTCNCTTCGGAGACTGGGACACAGGTGCTGCATG
GCTGTCGTCAGCTCGTGTCGTGAGATGTTGGGTTAAGTCCCGCAACGAGCGCAACCCT
CGCCATTAGTTGCCATCATTCAGTTGGGAACTCTAATGGGACTGCCGGTGCTAAGCCG

90
GAGGAAGGTGGGGATGACGTCAAGTCCTCATGGCCCTTACAGGGTGGGCTACACACGT
GCTACAATGGCGACTACAGAGGGTTAATCCTTAAAAGTCGTCTCAGTTCGGATTGTCCT
CTGCAACTCGAGGGCATGAAGTTGGAATCGCTAGTAATCGCGGATCAGCATGCCGCGG
TGAATACGTTCCCGGGCCTTGTACACACCGCCCGTCACACCATGGGAGTTGGTCTACC
CGAAGGCGCTGCGCTGACCGCTAAGGAG
ANNEX V. Preliminaty test on zeolite
Table 16. result from zeolite filter test in INAGRO
Sample Geosmine (ng/L) 2-MIB (ng/L)
Zeolite filter (160sec/l) 7.16 5.57
Zeolite filter (60sec/l) 10.35 5.73
Growout after biofilter 3.23 8.26
Broodstock after biofilter 4.90 <4.37
Control 14.36 9.51