ntrs.nasa.gov j. gladden, freder1ck c. yeh, and denn1s l. fronek nat10nal aeronaut1cs and space...
TRANSCRIPT

. .
NASA Technical Memorandum 86890 . NASA-TM-86890 19850006824 I I
~~----------------
Heat Transfer Results and Operational Characteristics of the NASA Lewis Research Center Hot Section Cascade Test Facility
Herbert J. Gladden, Frederick C. Yeh, and Dennis L. Fronek Lewis Research Center Cleveland, Ohio
Prepared for the
DEC 1 21985 '- ',C -:., f<:"'SU\RCrJ CetnCR
~ICflAm. N;\SA
• !A"'1~iON, VIf\GINIA
Thirtieth International Gas Turbine Conference and Exhibit sponsored by the American Society of Mechanical Engineers Houston, Texas, March 17-21, 1985
NJ\SI\ I 111111111111111111111111111111111111111111111
NF00100
https://ntrs.nasa.gov/search.jsp?R=19850006824 2018-05-29T14:10:46+00:00Z

..... L!' M N
I W
HEAT TRANSFER RESULTS AND OPERATIONAL CHARACTERISTICS OF THE NASA LEWIS RESEARCH CENTER HOT SECTION CASCADE TEST FACILITY
by
Herbert J. Gladden, Freder1ck C. Yeh, and Denn1s L. Fronek Nat10nal Aeronaut1cs and Space Adm1n1strat1on
Lew1s Research Center Cleveland, Oh10 44135
ABSTRACT
The NASA Lew1s Research Center gas turb1ne hot sect10n test fac1l1ty has been developed to prov1de a Ireal-eng1ne" env1ronment w1th well known boundary cond1t1ons for the aerothermal performance evaluat1on/ ver1f1cat1on of computer des1gn codes. The 1n1t1al aerothermal research data obta1ned at th1S fac1l1ty are presented and the operat1onal character1st1cs of the fac1l1ty are d1scussed. Th1S fac1l1ty lS capable of test1ng at temperatures and pressures up to 1600 K and 18 atm Wh1Ch corresponds tg a vane eX1t Reynolds number range of 0.5x10⁶ to 2.5x10 based on vane chord. The component cool1ng a1r temperature can be 1ndependently modulated between 330 and 700 K prov1d1ng gas-tocoolant temperature rat10s slm1lar to current eng1ne appl1cat1on. Research 1nstrumentat1on of the test components prov1de convent1onal pressure and temperature measurements as well as metal temperatures measured by IR-photography. The pr1mary data acqu1S1t1on mode 1S steady state through a 704 channel mult1plexer/ d1g1t1zer. The test fac1l1ty was conf1gured as an annular cascade of full coverage f1lm cooled vanes for the 1n1t1al ser1es of research tests. These vanes were tested over a w1de range of gas Reynolds number, eX1t gas Mach number and heat flux levels. The range of test cond1t1ons was used to represent both actual operat1ng cond1t1ons and slm1lar1ty state cond1t1ons of a gas turb1ne eng1ne. The results are presented for the aerothermal performance of the fac1l1ty and the full coverage f1lm cooled vanes.
NOMENCLATURE
C gc 1
L
P P1-P6
Q/A R Re
vane true chord length grav1tat1onal constant local measurement p01nt total d1stance along vane surface, on pressure
or suctlOn slde pressure measurement 10cat1ons 1 to 6 on pressure
surface heat flux gas constant Reynolds number
rad1us r 51-56 measurement 10cat1ons 1 through 6 on suct10n
surface 5P T
measurement at lead1ng edge stagnat10n p01nt temperature
V /Vcr W
rat10 of local veloc1ty to cr1t1cal veloc1ty we1ght flow
X x
sum of d1stances between measurement p01nts surface d1stance measured from the lead1ng
edge stagnat10n p01nt d1stance between rad1us at temperature
measurement 10cat1on and vane 1nner rad1us y spec1f1c heat rat10 n combustor eff1c1ency ~ V1SCOS1ty p dens1ty ~ cool1ng effect1veness Subscr1pts c coolant cal calculated C1 coolant 1nlet e stator eX1t or stat10n 5 g gas 1n combustor 1nlet meas measured o outs1de theo theoret1cal W metal wall 4,5,6 aX1al stat10n 4, 5, or 6 (combustor eX1t,
stator eX1t, or rotor eX1t) Supercrl pts
average total
INTRODUCTION
Improved performance of turboJet and turbofan eng1nes 1S tYP1cally accompan1ed by 1ncreased cycle pressure rat10 and combustor eX1t gas temperature. Gas pressure levels of 25 to 30 atm and gas temperatures of 1600 K eX1st 1n some current operat1onal eng1nes wh1le pressure levels up to 40 atm w1th temperatures of 1800 K are ant1c1pated 1n advanced commerc1al englnes. These cont1nu1ng 1ncreases 1n the turb1ne entry gas pressure and temperature of the modern gas turb1ne
/\/f5-/5/33
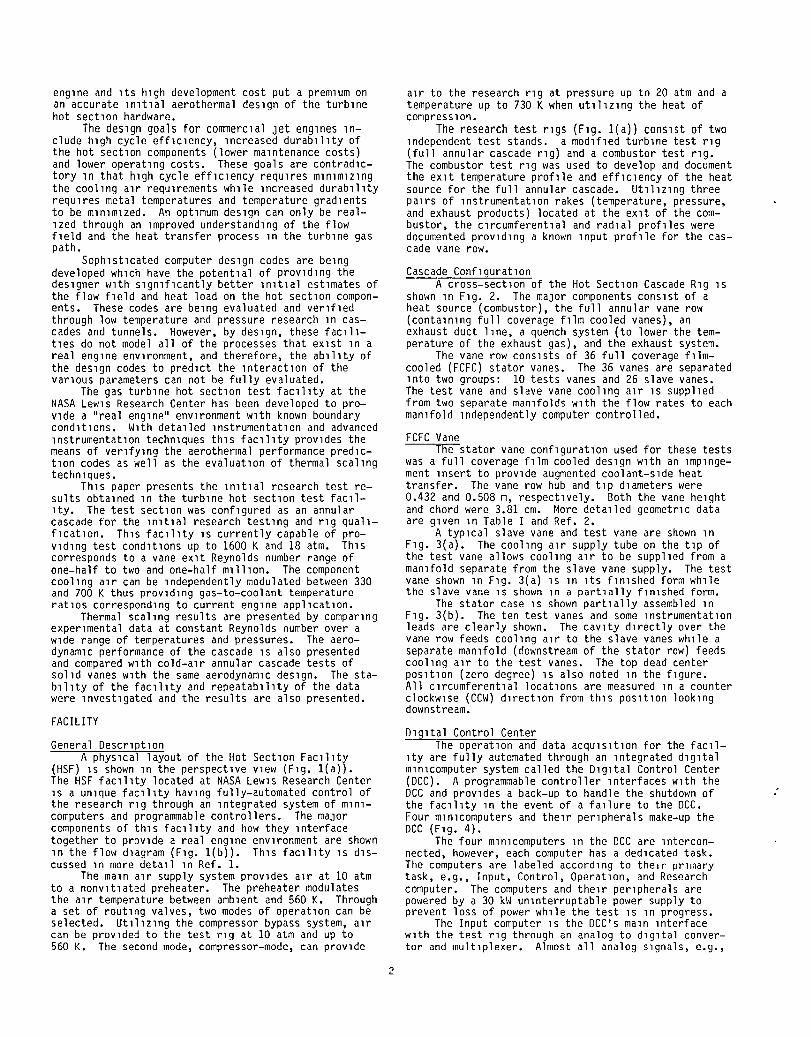
eng1ne and 1tS h1gh development cost put a prem1um on an accurate 1n1t1al aerothermal des1gn of the turb1ne hot sect10n hardware.
The deslgn goals for commerclal Jet englnes Include h1gh cycle eff1c1ency, 1ncreased durab1l1ty of the hot sect10n components (lower ma1ntenance costs) and lower operat1ng costs. These goals are contrad1ctory In that h1gh cycle eff1c1ency requ1res m1n1m1zlng the cool1ng a1r requ1rements wh1le 1ncreased durab1l1ty requ1res metal temperatures and temperature grad1ents to be m1n1m1zed. An opt1mum des1gn can only be real-1zed through an 1mproved understand1ng of the flow f1eld and the heat transfer process 1n the turb1ne gas path.
SOph1st1cated computer des1gn codes are be1ng developed Wh1Ch have the potent1al of prov1d1ng the des1gner w1th slgn1f1cantly better 1n1t1al est1mates of the flow f1eld and heat load on the hot sect10n components. These codes are be1ng evaluated and ver1f1ed through low temperature and pressure research 1n cascades and tunnels. However, by des1gn, these fac111-t1es do not model all of the processes that eX1st 1n a real eng1ne env1ronment, and therefore, the ab1l1ty of the des1gn codes to pred1ct the lnteractlon of the var10US parameters can not be fully evaluated.
The gas turb1ne hot sect10n test fac1l1ty at the NASA Lew1s Research Center has been developed to provlde a "real eng1ne" enVlronment wlth known boundary cond1t1ons. W1th deta1led 1nstrumentat1on and advanced 1nstrumentat1on techn1ques th1S fac1l1ty prov1des the means of ver1fY1ng the aerothermal performance pred1ct10n codes as well as the evaluat10n of thermal scal1ng techn1ques.
Th1S paper presents the 1n1t1al research test results obta1ned 1n the turb1ne hot sect10n test fac11-1ty. The test sect10n was conf1gured as an annular cascade for the 1n1t1al research test1ng and r1g qual1-f1cat1on. Th1S fac1l1ty 1S currently capable of provld1ng test cond1t1ons up to 1600 K and 18 atm. Th1S corresponds to a vane eX1t Reynolds number range of one-half to two and one-half m1ll1on. The component cool1ng a1r can be 1ndependently modulated between 330 and 700 K thus prov1d1ng gas-to-coolant temperature rat10s correspond1ng to current eng1ne appl1cat1on.
Thermal scal1ng results are presented by compar1ng exper1mental data at constant Reynolds number over a w1de range of temperatures and pressures. The aerodynam1c performance of the cascade 1S also presented and compared w1th cold-a1r annular cascade tests of SOlld vanes w1th the same aerodynam1c des1gn. The stab1l1ty of the fac1l1ty and repeatab1l1ty of the data were 1nvest1gated and the results are also presented.
FACILITY
General Descr1pt1on A phys1cal layout of the Hot Sect10n Fac1l1ty
(HSF) 1S shown 1n the perspect1ve V1ew (F1g. l(a)). The HSF fac1l1ty located at NASA Lew1s Research Center 1S a un1que fac1l1ty hav1ng fully-automated control of the research r1g through an 1ntegrated system of m1n1-computers and programmable controllers. The maJor components of th1S fac1l1ty and how they 1nterface together to prov1de a real eng1ne env1ronment are shown 1n the flow d1agram (F1g. l(b)). Th1S fac1l1ty 1S d1Scussed 1n more deta11 1n Ref. 1.
The ma1n a1r supply system prov1des a1r at 10 atm to a nonv1t1ated preheater. The preheater modulates the a1r temperature between amb1ent and 560 K. Through a set of rout1ng valves, two modes of operat1on can be selected. Ut1l1z1ng the compressor bypass system, a1r can be prov1ded to the test r1g at 10 atm and up to 560 K. The second mode, compressor-mode, can prov1de
2
a1r to the research r1g at pressure up to 20 atm and a temperature up to 730 K when ut1l1z1ng the heat of compreSS1on.
The research test rlgs (Flg. l(a)) conslst of two 1ndependent test stands. a mod1f1ed turb1ne test r1g (full annular cascade r1g) and a combustor test r1g. The combustor test r1g was used to develop and document the eX1t temperature prof1le and eff1clency of the heat source for the full annular cascade. Ut1l1z1ng three pa1rs of 1nstrumentat1on rakes (temperature, pressure, and exhaust products) located at the eX1t of the combustor, the c1rcumferent1al and rad1al prof1les were documented prov1d1ng a known 1nput prof1le for the cascade vane row.
Cascade Conf1gurat1on A cross-sect1on of the Hot Sect10n Cascade R1g 1S
shown 1n F1g. 2. The maJor components cons1st of a heat source (combustor), the full annular vane row (conta1n1ng full coverage f1lm cooled vanes), an exhaust duct 11ne, a quench system (to lower the temperature of the exhaust gas), and the exhaust system.
The vane row cons1sts of 36 full coverage f1lmcooled (FCFC) stator vanes. The 36 vanes are separated 1nto two groups: 10 tests vanes and 26 slave vanes. The test vane and slave vane cool1ng a1r 1S suppl1ed from two separate man1folds w1th the flow rates to each man1fold lndependently computer controlled.
FCFC Vane The stator vane conf1gurat1on used for these tests
was a full coverage f1lm cooled des1gn w1th an 1mp1ngement 1nsert to prov1de augmented coolant-s1de heat transfer. The vane row hub and t1P d1ameters were 0.432 and 0.508 m, respect1vely. Both the vane he1ght and chord were 3.81 cm. More deta1led geometr1c data are glven 1n Table I and Ref. 2.
A tYP1cal slave vane and test vane are shown 1n F1g. 3(a). The cool1ng a1r supply tube on the t1P of the test vane allows cool1ng a1r to be suppl1ed from a man1fold separate from the slave vane supply. The test vane shown 1n F1g. 3(a) 1S 1n 1tS f1n1shed form wh1le the slave vane 1S shown 1n a part1ally f1n1shed form.
The stator case 1S shown part1ally assembled 1n F1g. 3(b). The ten test vanes and some 1nstrumentat1on leads are clearly shown. The cav1ty d1rectly over the vane row feeds cool1ng a1r to the slave vanes wh1le a separate man1fold (downstream of the stator row) feeds cool1ng a1r to the test vanes. The top dead center pos1t1on (zero degree) 1S also noted 1n the f1gure. All c1rcumferent1al locat1ons are measured 1n a counter clockw1se (CCW) d1rect1on from th1S pos1t1on 100k1ng downstream.
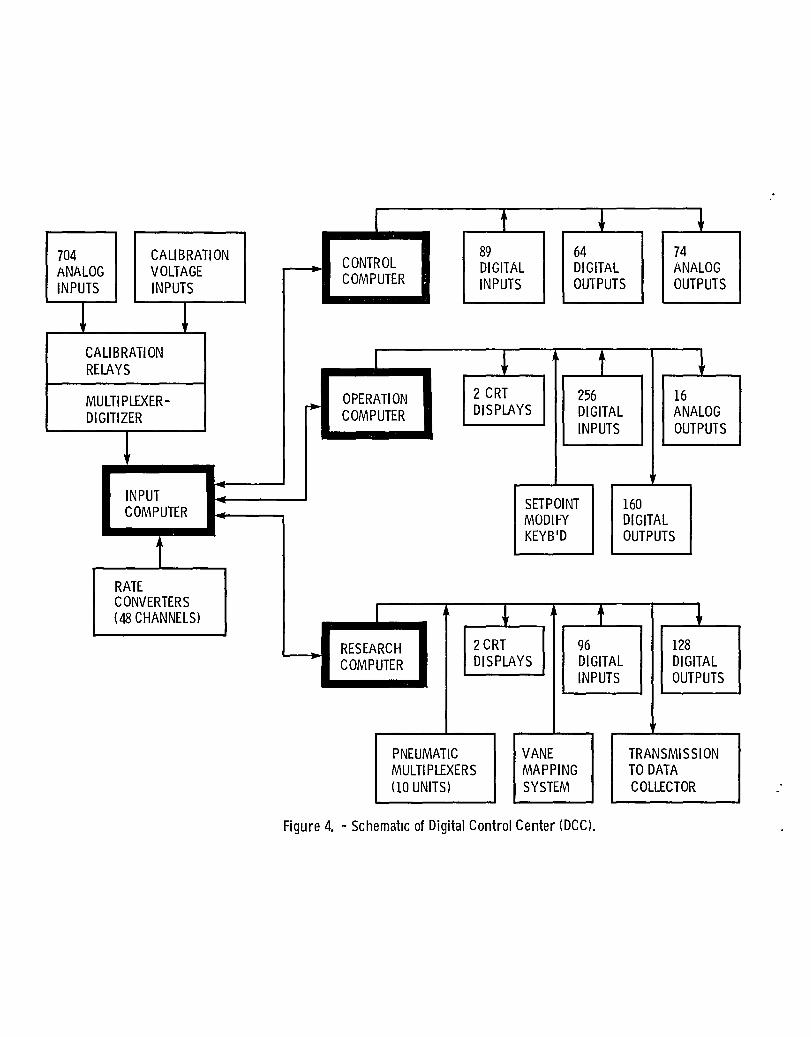
D1g1tal Control Center The operat1on and data acqu1s1t1on for the fac11-
1ty are fully automated through an 1ntegrated d1g1tal m1n1computer system called the D1g1tal Control Center (DCC). A programmable controller 1nterfaces w1th the DCC and prov1des a back-up to handle the shutdown of the fac1l1ty 1n the event of a fa1lure to the DCC. Four m1n1computers and the1r per1pherals make-up the DCC (F1g. 4).
The four m1n1computers 1n the DCC are 1nterconnected, however, each computer has a ded1cated task. The computers are labeled accord1ng to the1r pr1mary task, e.g., Input, Control, Operat10n, and Research computer. The computers and the1r per1pherals are powered by a 30 kW un1nterruptable power supply to prevent loss of power wh1le the test 1S 1n progress.
The Input computer 1S the DCC's ma1n 1nterface w1th the test r1g through an analog to d1g1tal convertor and mult1plexer. Almost all analog slgnals, e.g.,
straln gages, pressure transducers, temperatures, and posltlon slgnals enter the DCC through the multlplexer. The multlplexer lS a 704 channel (expandable to 1024) ampllfler-per-channel dlgltlzer wlth mlxed ranges between 5 mV and 10 V full scale. Callbratlon voltages can be sWltched lnto each channel prlor to a test run, thus, verlfYlng proper operatlon of the system. The maln task of the Input computer lS to act as a data gatherlng buffer and lntermachlne communlcatlons buffer.
The Control computer's task lS to control 19 hlghly lnteractlve process varlables at update rates of 20 to 150 tlmes/second. ThlS computer has perhaps the most demandlng task of the DCC because of the large number of control loops that must be servlced and the speed at WhlCh they must be servlced. The Control computer performs the task of 19 separate process controllers.
The thlrd computer, the Operatlons computer, provldes the communlcatlons llnk and lnterface wlth the test rlg operator. Its prlmary functlons are to provlde the operator wlth control loop status lnformatlon and health lnformatlon on the test hardware. All test condltlons are prestored In the Operatlons computer prlor to a test run. These set-polnts are passed to the Control computer when the operator requests a change In condltlons. The DCC has the capablllty to modlfy the set-polnts on-llne through the Setpolnt Entry Keyboard. The health of the hardware lS constantly monltored by the Operatlons computer durlng a test, and correctlve actlon lS automatlcally taken by the computer lf a maJor llmlt vlolatlon occurs. An example of correctlve actlon mlght be to turn off the combustor because of an over-temperature.
Research Data System The fourth computer of the DCC lS the Research
computer. Its dedlcated task lS to gather large volumes of research data. The Research computer provldes, through cathode ray tube (CRT) dlsplays In almost real tlme, lnformatlon on the progress of the experlment. The Research computer acqulres the raw data from the Input computer WhlCh lS then converted to englneerlng unlts and calculated values for dlsplay.
The Research computer also controls the data gatherlng process on command of the research englneer. Durlng the data taklng cycle, the Research computer preposltlons the radlal probes, records and stores the raw data, lncrements the probes to a new posltlon and repeats the process. ThlS lS repeated untll the data cycle lS complete. The raw data lS then converted to englneerlng unlts, packaged, tagged wlth a unlque number and transferred to the NASA Lewls Research Center's Central Data Collector for permanent storage.
The Data Collector lS llnked to a larger host computer. ThlS computer lS used to further process the data, solvlng more complex and tlme consumlng equatlons, e.g., graphlcs. A return llnk back to the Hot Sectlon Faclllty provldes the graphlcs data for vlewlng on CRT dlsplays.
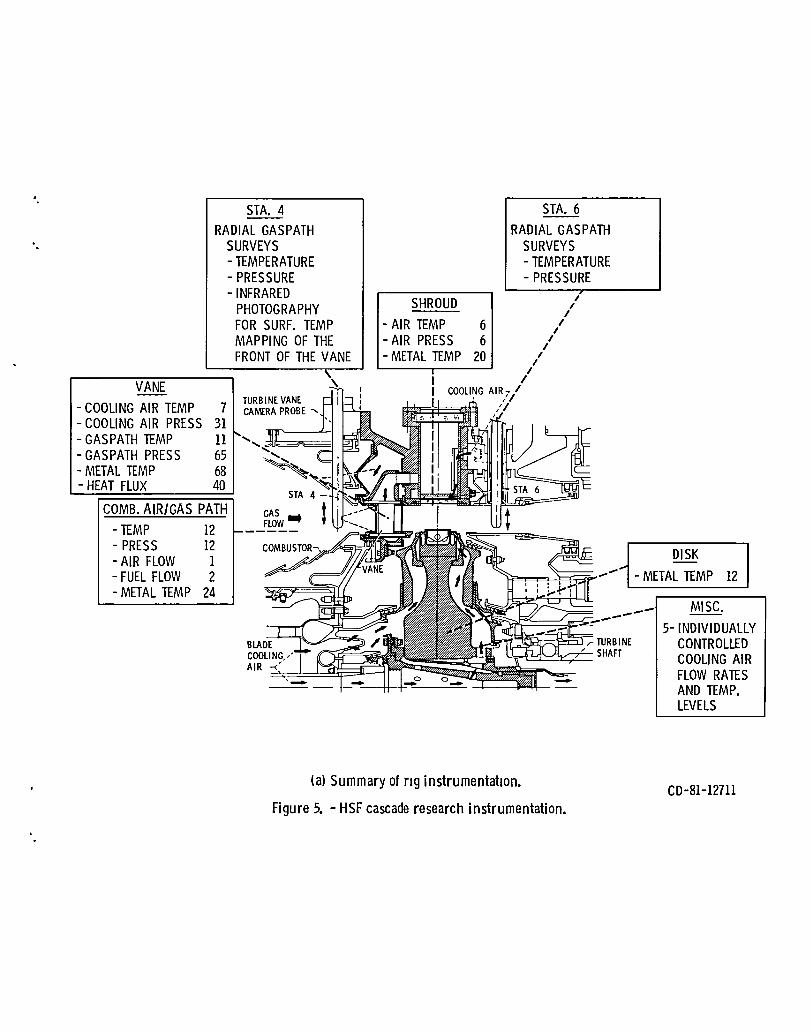
Instrumentatlon Research lnstrumentatlon In the HSF lS prlmarlly
the conventlonal steady state pressure and temperature measurements. In addltlon to the conventlonal transducer per channel pressure measurement, the HSF uses a pressure measurlng system that multlplexes the pneumatlc slgnals. ThlS system uses a slngle transducer to measure 48 pressure channels. SlX of the pressure channels are used for callbratlon. The Cascade rlg has three of these systems provldlng 126 pressure measurements.
3
A summary of the Cascade Research lnstrumentatlon lS shown on Flg. 5(a). Gas path condltlons (e.g., temperature and pressure) are monltored and recorded at aXlal statlons 4, 5, and 6. The coollng alr flow to each of the cooled components lS welght flow controlled and measured by venturlS In each of the supply llnes. Both coollng alr temperatures and pressures are measured In the lnternal manlfolds of each coollng alr system. The vanes have thermocouples and pressure senslng tubes to sense gas stream condltlons, gas-slde metal temperatures, and coollng-alr slde pressures and temperatures.
Statlons 4 and 6 have three flxed probe ports each for mountlng radlally-actuated water cooled probes. Radlal gas-path surveys of both temperature and pressure are recorded from vane hub to tlp. Statlon 4 can also utlllze an optlcal probe for lnfrared photography for surface temperature mapplng of the vanes. The lnfrared data recordlng and data reductlon procedure lS dlscussed In Ref. 3.
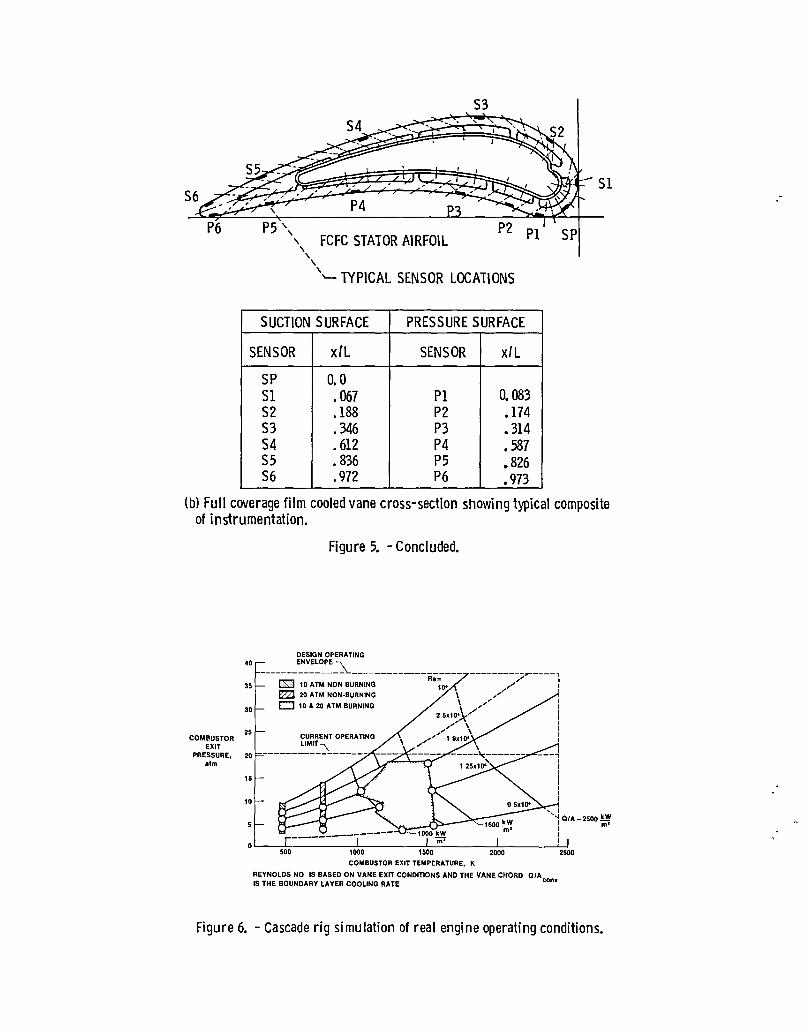
A cross-sectlonal schematlc of the vane alrfoll lS shown In Flg. 5(b). Also shown lS a composlte summary of lnstrument locatlons on the alrfoll. The locatlons shown In Flg. 5(b) represent elther metal temperature or statlc pressure measurements. And, because each alrfoll could accommodate only a llmlted number of lnstrument grooves, the temperature or pressure dlstrlbutlons reported are composed of measurements from several alrfolls In the test vane sector of the annulus.
ANALYTICAL PROCEDURES
Gas Temperature Proflle The combustor eXlt radlal gas total temperature
proflle was obtalned by averaglng temperatures from two traverslng probes. The thlrd traverslng probe was used to measure gas total pressure. The probes were located one vane chord In front of the cascade vane row at statlon 4. Data were taken at flve speclflc radlal steps from vane hub to vane tlp. An average radlal total temperature proflle and an overall average gas total temperature were determlned from these measurements.
The average gas temperature, as obtalned from two traverslng probes, lS not representatlve of the true average combustor eXlt temperature Slnce two radlal proflles from the clrcumference are not sufflclent to deflne actual total temperature. To allevlate thlS problem, a theoretlcal gas temperature, Tg theo, was calculated, based on fuel/alr ratlo, combustlon alr lnlet temperature, measured total and statlc pressures, lnlet temperature, and enthalpy for the fuel (4). A combustor efflclency was then applled to the theoretlcal temperature to obta1n the true combustor eXlt total temperature. The combustor efflclency 1S obtalned from a set of curves generated from exper1ments on a slm11ar and extenslvely 1nstrumented research combustor ln a Combustor Research Faclllty (5).
The temperature correctlon WhlCh takes 1nto account the combustor eff1c1ency has the followlng form.
T' - (T' T' ) + T' g,cal - n g,theo - 1n In
where n 1S the combustlon efflc1ency.
( 1)
A radlal proflle was 1mposed on the calculated total temperature by uSlng the ratlo of the measured radlal temperature to the average measured temperature.

T' (r)g,cal
Coollng Effectlveness
T' g,cal
T' g,meas
T' (r)g,meas (2)
Coollng effectlveness, ~, lS used to compare the vane performance and thermal scallng at varlOUS combustor eXlt temperatures, coolant flow rates, Mach numbers and Reynolds numbers. The local coollng effectlveness, ~, lS deflned as:
T'(r)g,cal - T(l)w (3)
T'(r)g,cal - TCl
where T(l)W refers to local metal temperature on the test vane surface, and T'(r) callS the calculated total gas temperature at a SP~~ltlC radlal locatlon. An average coollng effectlveness,~, lS also calculated, uSlng_ln place of T(l)W an averaqed metal temperature Tw, deflned as:
13 T = w L
1=2
[T(l)W + T(l-l)w][X(l) - x(l-I)] 2X (4)
where (1) refers to a speclflc temperature measurement pOlnt on the vane surface, X(l) the dlstance along the vane surface measured from the leadlng edge stagnatlon pOlnt, and X the sum of dlstances between measurement pOlnts.
Reynolds Number The eXlt gas Reynolds number lS based on the vane
row lnlet total temperature and pressure, the vane row eXlt statlc pressure and the vane true chord length. The qas propertles are based on eXlt statlc gas temperature derlved from the eXlt statlc-to-lnlet total pressure ratlO.
( 5)
where
Crltlcal Veloclty Ratlo The eXlt crltlcal veloclty ratlo, llke the
Reynolds number, lS based on the vane row eXlt statlc pressures and the vane row lnlet total pressure.
[
y + 1 (, (P5)(Y-l)/Y)~1/2 (V/Vcrt = ~ ~ -\PI ~ (6)
EXPERIMENTAL PROCEDURE
There were two baslc modes of faclllty operatlon: 10- and 20-atm. Wlthln each mode the research rlg was operated wlth the combustor operatlnq (burnlng) or wlthout combustor operatlon (lsothermal). The research
4
obJectlves were to lnvestlgate the aerothermal performance of thlS cascade over a range of Reynolds numbers, and at a constant Reynolds number, over a range of combustor eXlt temperatures and pressures. The varlOUS operatlng modes of thlS faclllty permlt a great deal of flexlblllty ln settlng operatlng condltlons. ThlS flexlblllty lS shown ln Flg. 6 and Table II.
The gas condltlons were establlshed by settlng the combustor lnlet total pressure, the vane eXlt outer radlus statlc pressure, and the combustor fuel/alr ratlo through predetermlned lnput values stored ln the operatlons computer. The coolant flow rate and temperature were varled systematlcally at flxed gas condltlons elther through predetermlned lnput values or through the "set-polnt entry panel." The vane row eXlt crltlcal veloclty ratlo was also varled systematlcally by dlscrete changes ln the eXlt statlc pressure.
RESULTS AND DISCUSSION
The results of thlS lnvestlgatlon are summarlzed ln thlS sectlon. Typlcal boundary condltlon measurements are presented and then the thermal scallng and aerodynamlc performance results are dlscussed. The lnfrared temperature data capabllltles of thlS faclllty are presented. Flnally, the operatlng stablllty of the faclllty, and the data repeatablllty are presented and dlscussed.
Boundary Condltlons The combustor eXlt (cascade lnlet) and stator row
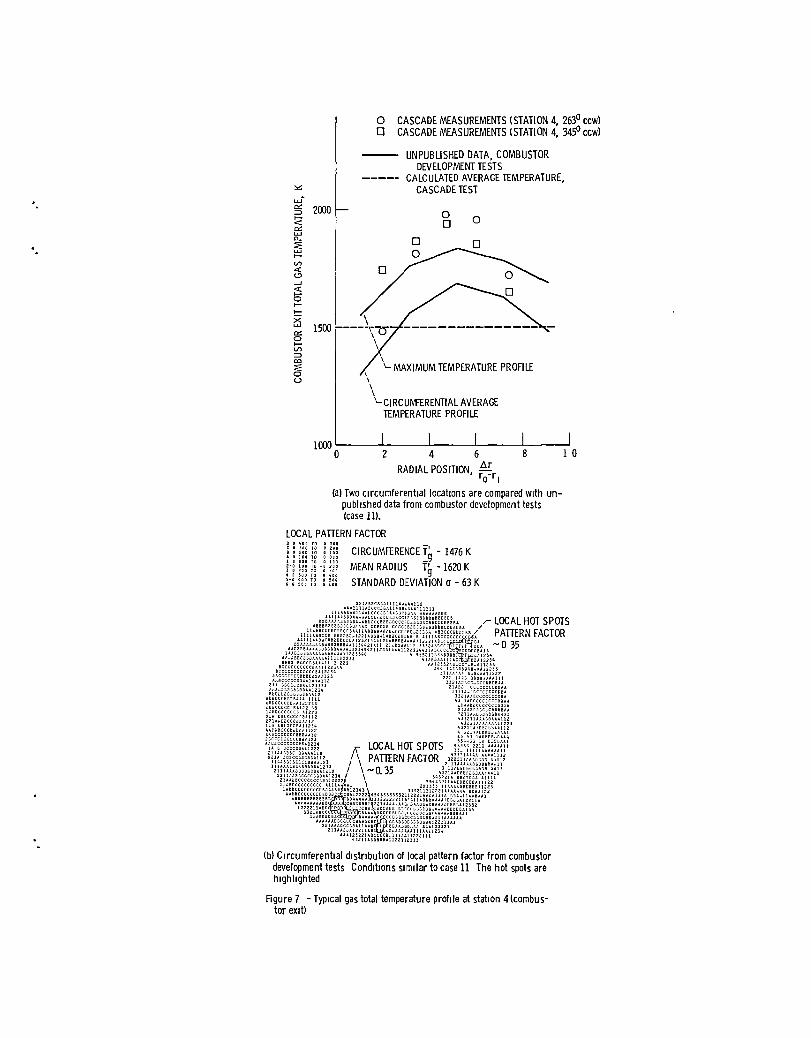
eXlt gas flow condltlons are lmportant to the evaluatlon of research results. In addltlon, they can be used to compare rlg performance wlth the deslgn goals. The gas total temperature proflle at statlon 4 lS shown ln Flg. 7. Measured temperature data from the cascade tests are compared wlth the results of the combustor development tests conducted at slmllar condltlons. The combustor test data represent a complete clrcumferentlal and radlal survey of the combustor eXlt plane (5).
Flgure 7(a) shows the radlal total temperature -proflle measured by the two traverslng probes at statlon 4. An average radlal total temperature proflle and a maXlmum total temperature proflle obtalned from the combustor development tests (unpubllshed) are also shown ln the flgure. In addltlon, the calculated average gas temperature for the cascade test condltlons lS shown by the dashed llne. The calculated average gas temperature (Eq. (1)) appears to represent that obtalned ln the combustor development tests. In addltlon, the measured temperature proflles correspond reasonably well to the maXlmum temperature proflle obtalned durlng the combustor development tests. Therefore, the use of a radlal proflle lmposed on the calculated average gas temperature (Eq. (2)) was consldered approprlate for subsequent data analysls.
The pattern factor for the combustor development tests was approxlmately 0.35. However, the clrcumferentlal temperature dlstrlbutlon, as shown ln Flg. 7(b) by a local pattern factor dlstrlbutlon (unpubllshed data) lS relatlvely unlform. The local hot spots occur ln three small dlscrete locatlons. The Clrcumferentlal average total temperature at the mean radlus was 1620 K wlth a standard devlatlon of 63 K.
The combustor eXlt total pressure as measured by the radlally traversed probe was essentlally constant. Inner radlus and outer radlus statlc pressure measurements were constant lndlcatlng the vane row lnlet crltlcal veloclty ratlo was also constant, both radlally and clrcumferentlally, at the nomlnal deslgn value of 0.23.
The cascade eXlt total condltlons could not be measured accurately because the probes were not deslgned for the large tangent1al component at the stator eXlt. However, based on the outer radlus statlc pressure measurements and the combustor eXlt total pressure, the crltlcal veloclty ratlo at the outer radlus compared well wlth the deslgn value of 0.728. The lnner radlus statlc pressure measurements also lndlcated the veloclty ratlo compared well wlth the deslgn value of 0.834.
Thermal Scallng Durlng the development of an englne the turblne
components are frequently tested at reduced temperature and pressure 1n cascades and tunnels to verlfy the heat transfer deslgn. There has been a concern for the valldlty of these data and whether the thermal scallng laws are sufflclently satlsfled between the rlg tests and the actual englne. Data were taken over a wlde range of temperatures and pressures In both lsothermal (nonburnlng) and burnlng mode to lnvestlgate the thermal scallng phenomena. The prlmary parameters held constant were Reynolds number and Mach number. The results are shown In Flg. 8. A mldspan average coollng effect1veness parameter, ~, for the full coverage fllm cooled vane lS shown as a functlon of the coolant-togas flow ratlo. The gas total temperature used In the effectlveness calculat10n was the mean radlus value obtalned from Eq. (2).
The lowest Reynolds number data taken (O.5x106) are presented In Flg. 8(a). Two gas total temperature levels for the "burnlng mode" are shown. A trend lS shown by these data where the hlgher gas temperature data (case 8) have a lower coollng effectlveness compared wlth the lower gas temperature data (case 7). ThlS dlfference In coollng effectlveness values lS about 0.02 at a coolant-to-gas flow ratlo of 0.113.
The data shown In F~g. 8(b) represents a h1gher Reynolds number (l.25x10 ) as well as both "burnlng" and "lsothermal" modes of testlng. These data are characterlstlC of both englne operatlon (hlgh gas temperature) and rlg tests (low gas temperature). These data show a trend slmllar to the data 1n Flg. 8(a). That lS, the low gas temperature data (rlg tests) have a Sllghtly hlgher coollng effectlveness when compared to h1gher gas temperature data (eng1ne condltlons). The dlfference In coollng effectlveness values lS about 0.02 at a coolant-to-gas flow ratlo of 0.11.
Even though a trend lS shown by the data of F1gS. 8(a) and (b) the dlfferences are small. The estlmated experlmental error for ~ lS ±0.9 percent for the "lsothermal mode" data and ±1.7 percent for the "burnlng mode" data. ThlS level of error could not reverse the data trend shown but could enhance the coollng effectlveness dlfferences.
Reference 6 predlcts up to 0.04 lncrease In coollng effectlveness from englne condltlons to lower temperature rlg test condltlons. ThlS phenomenon was shown to result from the lnablllty to thermally scale the materlal thermal conductlvlty. ThlS trend lS shown by both Reynolds number data sets. It can be concluded from these data and Ref. 6 that low temperature rlg tests are somewhat optlmlst1c ln predlctlng the coollng performance of a deslgn prototype operatlng at englne condltlons.
The hlghest Reynolds number data taken are shown ln Flg. 8(c). The prlmary observatlon lS that at the hlgh blowlng rates of these tests the cool1ng effect1veness was not affected by an lncreased heat flux (Reynolds number). These results are also shown ln Flg. 8(d) where constant gas temperature cool1ng effectlveness data are compared for Reynolds numbers coverlng a range of 0.5x10b, 1.25x10⁶, and 1.90x10⁶•
5
Assumlng that the heat flux lS proportlonal to (Re)0.8 then the data shown ln F1g. 8(d) represents a range of heat flux of 2.9 to one. The good agreement of these data lndlcate that the flow reglme lS unchanged (probably turbulent) and that the level of heat flux lS not an 1ndependent functlon.
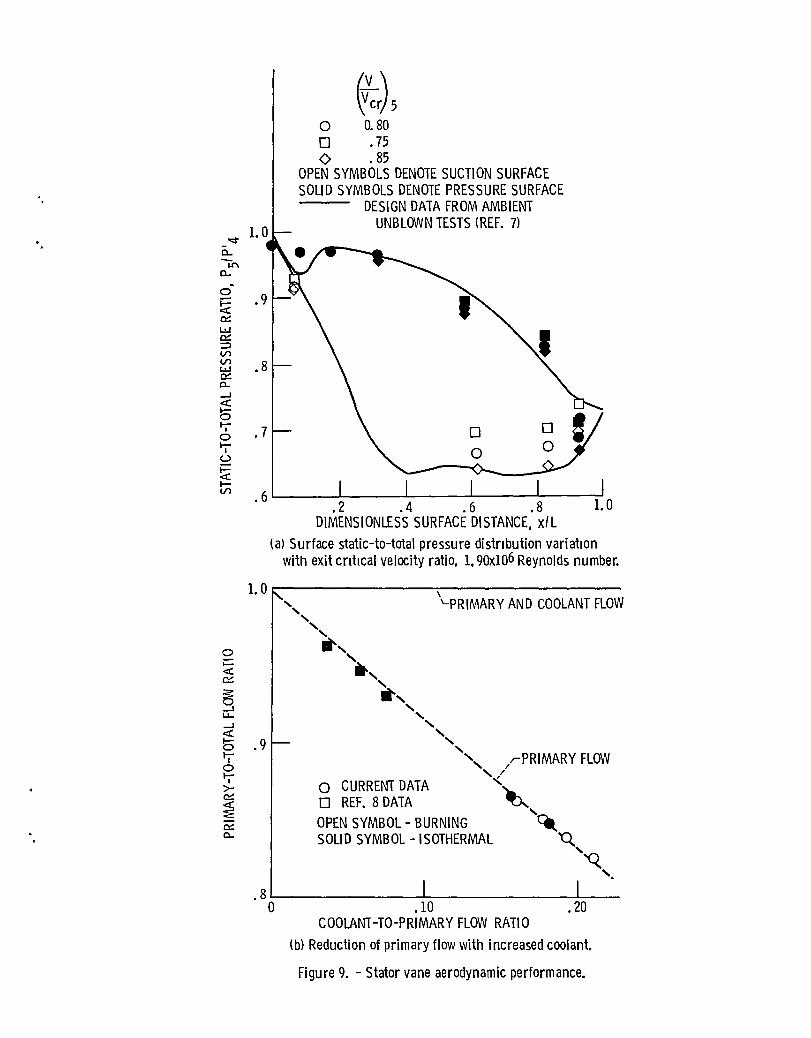
Aerodynamlc Performance The aerodynamlc performance of the full coverage
f11m cooled cascade lS characterlzed by the surface stat1c pressure dlstrlbutlon shown 1n Flg. 9(a). Data are plotted for three dlfferent eX1t crltlcal veloclty ratlos (deslgn, less than and greater than deslgn). Also shown lS the unblown des19n pressure dlstr1butlon for thlS alrfo11 reported In Ref. 7. The pressure dlStr1butlon on the pressure surface compares favorably wlth the des1gn obJectlve. However, the pressure dlStrlbutlon on the suctlon surface tralllng edge was about 7 percent hlgher than the deslgn values. ThlS lndlcates that the gas stream was not accelerated to deslred veloclty.
The total mass flow through the cascade lS also 1mportant to the overall performance of the stator (and subsequent turblne stage). When full or partlal fllm coollng lS used ln the stator deslgn one effect of the coolant lS to reduce the prlmary gas flow through the combustor. ThlS effect lS shown In Flg. 9(b). The pr1mary-to-total gas flow ratlo 1S shown as a functlon of the coo1ant-to-prlmary flow where the total flow lS the sum of the prlmary and the coolant. The data reported here1n follows the same trends as that reported In Ref. 8. Some of Ref. 8 data have been Included for comparlson. These results show the same trend as Ref. 8 even though these tests were conducted at substantlally hlgher coolant blowlng rates. The prlmary effect of lnJect1ng coolant 1nto the gas stream upstream of the stator vane throat lS to create blockage and reduce the prlmary flow through the combustor.
Alrfo11 Temperature A thermal lmage of an alrfoll leadlng edge and
pressure surface are shown ln Flg. 10. The gray tones represent the temperature of the alrfoll through ltS thermal energy output. The 11ghtest reglons are hlgh temperature whlle the dark reg10ns are cooler. The procedures for record1ng and lnterpretlng thermal 1mage lS dlscussed ln Ref. 3. The gray tones ln the flgure lndlcate a hot leadlng edge and a relatlvely unlform and lower temperature on the pressure surface. The pattern of dark spots on the leadlng edge of vane 3 are the f11m cool1ng holes.
Faclllty Operatlonal Characterlstlcs The operatlng character1stlcs and, ln partlcular,
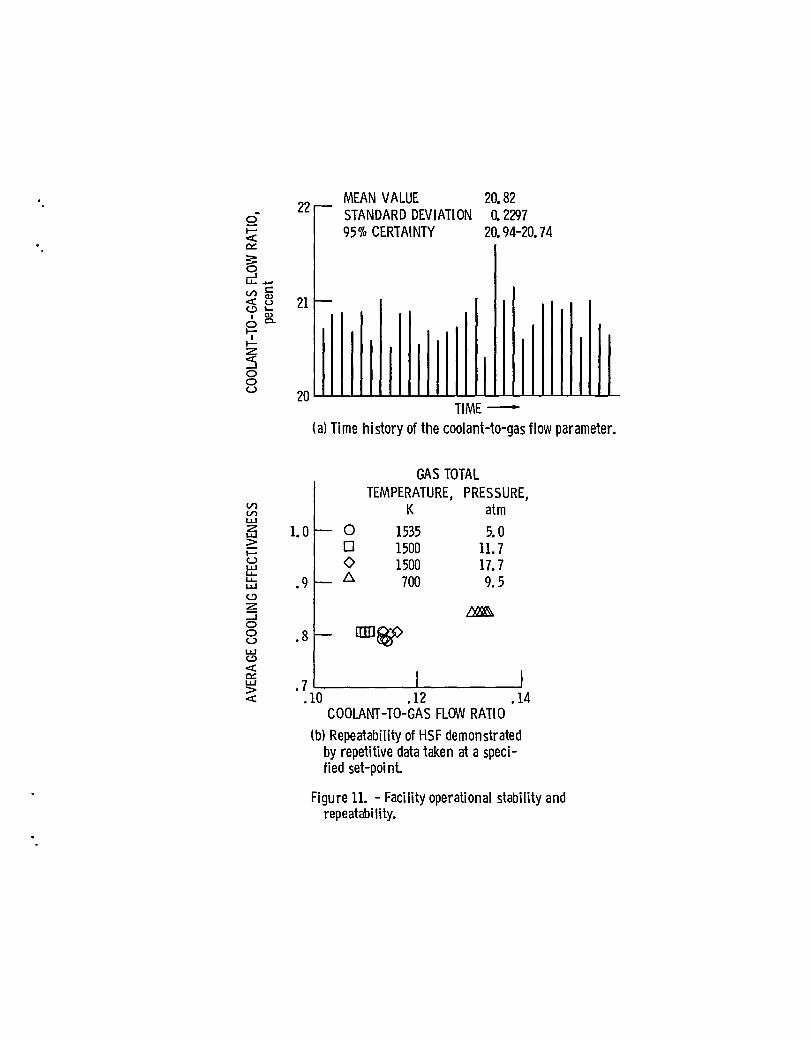
the stablllty of automatlc controls and the repeatablllty of the data have been of concern durlng the development of thlS faclllty. Durlng quallflcatlon tests attent10n was focused on the 20 atm mode of testlng when some alr flow lnstablllty was noted. Modlflcatlons of the faclllty and the controls have lmproved the sltuat10n. Flow stab111ty can be shown by plottlng the ratlo of the coolant flow and the pr1mary flow wlth t1me. The phase Shlft between these systems should ampllfy the lnstablllty at dlscrete tlmes. The data shown In Flg. 11(a), taken over a 1 mln tlme perlod dur1ng 20-atm mode operatlon, do not show any Slgnlflcant flow lnstablllty. The maJorlty of the data fall wlthln the 95 percent uncertalnty band.
The data repeatablllty lS shown ln Flg. 11(b). The average coollng effectlveness was determlned for several data p01nts taken at f1xed condlt10ns over a perlod of about 30 mln. Each data pOlnt requlred about

1.5 m1n to record. Both 10- and 20-atm mode of operat10n were stud1ed. The data for two sets of cond1t1ons show a h1gh degree of repeatab1l1ty. However, at the maX1mum pressure cond1t1ons of the 20-atm mode the data shows some nonrepeatab1l1ty 1n the coolant to gas flow rat10 (case 6 and case 12, F1g. II(b)). The fac1l1ty was operatlng at essentlally full flow condltlons wlth control valves at the1r upper llm1t. In general, the operat1onal stab1l1ty of the fac1l1ty 1S marg1nally acceptable.
CONCLUDING REMARKS
The 1n1t1al results of research test1ng 1n the NASA Lew1s Research Center turb1ne hot sect10n fac1l1ty are presented. The thermal scal1ng results show that cool1ng effect1veness data taken at low temperature r1g cond1t1ons are somewhat opt1m1st1c when used to pred1ct cool1ng performance at eng1ne cond1t1ons. As the heat load 1S 1ncreased by 1ncreas1ng Reynolds number at a constant gas temperature the coolant effect1veness 1S not affected because of the h1gh blow1ng rates. The cr1t1cal veloc1ty rat10 d1str1but1on (based on the pressure d1str1but1on) around the stator a1rfo1l 1S comparable w1th the des1gn d1str1but1on w1th the except10n of the suct10n surface tra1l1ng edge. The veloc-1ty rat10 1n th1S reg10n 1S about 7 percent less than des1gn. However, the 1nner rad1us eX1t veloc1ty rat10 and the outer rad1us veloc1ty rat10 compared well w1th the des1gn values. In the 10-atm mode of operat1on the fac1l1ty 1S very stable and the data repeatab1l1ty 1S good. The fac1l1ty operat1onal stab1l1ty 1n the 20-atm mode shows some degradat10n compared w1th the 10-atm mode. Th1S, 1n turn, has an adverse 1mpact on the repeatab1l1ty of the data part1cularly near the maX1mum pressure level. However, the fac1l1ty operat1ng stab1l1ty 1n the 20-atm mode 1S marg1nally acceptable.
6
REFERENCES
1. Cochran, R.P., Norr1s, J.W., and Jones, R.E., "A H1gh-Pressure, H1gh-Temperature Combustor and Turb1ne-Cool1ng Test Fac1l1ty," ASME Paper 76-WA/GT-4, Dec. 1976.
2. Moff1tt, T.P. and Wh1tney, W.J., "Aerodynam1c Effect of a Honeycomb Rotor T1P Shroud on a 50.8 Cent1meter-T1p-D1ameter Core Turb1ne," NASA TP-2112, Jan. 1983.
3. Pollack, F.G., and Cochran, R.P., "Temperature and Pressure Measurement Techn1ques for an Advanced Turb1ne Test Fac1l1ty," Measurement Methods 1n Rotat1ng Components of Turbomach1nery, B. Lakshm1narayana, and P. Runstadler, Jr., eds., ASME, 1980, pp. 319-326.
4. Svehla, R.A. and McBr1de, B.J., "Fortran IV Computer Program for Calculat10n of Thermodynam1c and Transport Propert1es of Complex Chem1cal Systems," NASA TN-D-7056, 1973.
5. Wear, J.D., et al., "Prel1mlnary Tests of an Advanced H1gh-Temperature Combustlon System," NASA TP-2203, 1983.
6. Gladden, H.J., "Extenslon of Slm1larlty Test Procedures to Cooled Englne Components W1th Insulat1ng Ceram1c Coat1ngs," NASA TP-1615, 1980.
7. Wh1tney, W.J., et al., "Cold-A1r Invest1gat1on of a Turb1ne for H1gh-Temperature-Eng1ne Appl1catlon. I. Turb1ne Des1gn and Overall Stator Performance," NASA TN-D-3751, 1967.
8. Stabe, R.G., and Kl1ne, J.F., "Aerodynam1c Performance of a Fully F1lm Cooled Core Turb1ne Vane Tested w1th Cold A1r 1n a Two-D1mens1onal Cascade," NASA TM-X-3177, 1975.
..
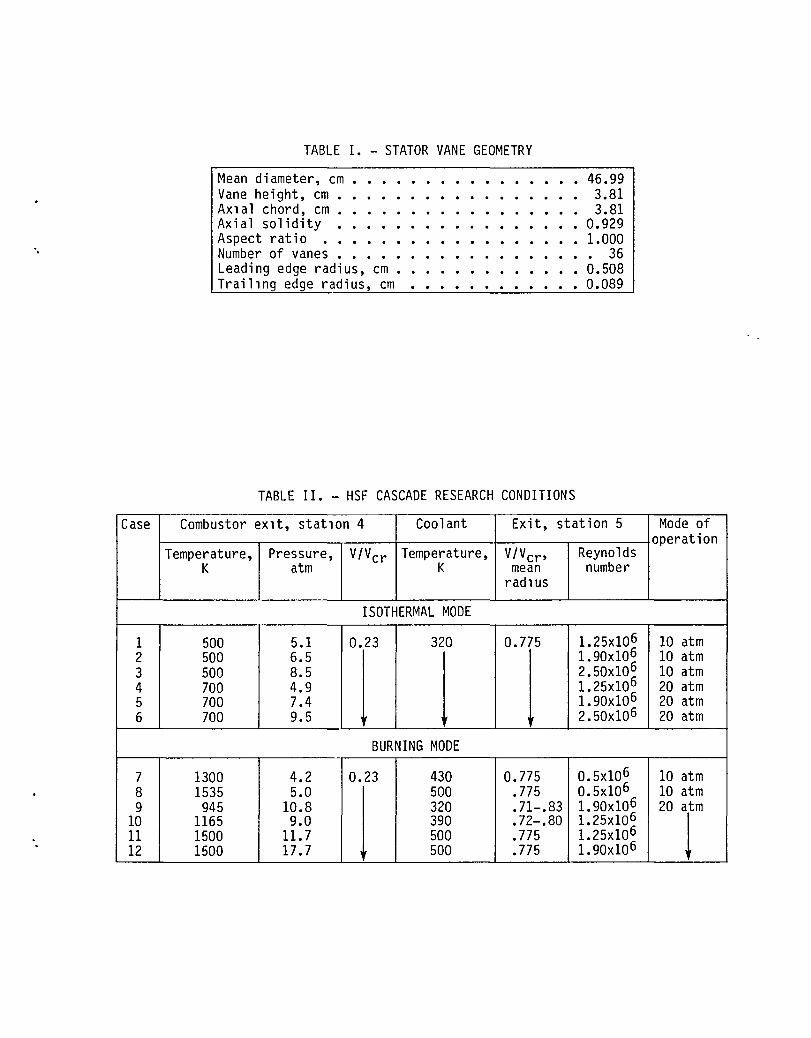
TABLE I. - STATOR VANE GEOMETRY
Mean diameter, cm • • • •••••••••• 46.99 Vane height, cm • • • • •• 3.81 AXlal chord, cm • • • • • • • • • • • • • • • 3.81 Axial solidity • • • • • • • • • ••• 0.929 Aspect ratio • • • • • • • • • • •• 1.000
'. Number of vanes • • • • • • • • • • • 36 Leading edge radius, cm • • ••••••••• 0.508 Traillng edge radius, cm •••••••••••• 0.089
TABLE II. - HSF CASCADE RESEARCH CONDITIONS
Case Combustor eXlt, statlon 4 Coolant Exit, station 5 Mode of operation
Temperature, Pressure, V/Vcr Temperature, V/Vcr ' Reynolds K atm K mean number
radlus
ISOTHERMAL MODE
1 500 5.1 0.23 320 0.775 1.25x10⁶ 10 atm 2 500 6.5
I 1 I 1.90x10⁶ 10 atm
3 500 8.5 2.50x10~ 10 atm 4 700 4.9 1.25x10 20 atm 5 700 7.4 1. 90xl06 20 atm 6 700 9.5 2.50x10⁶ 20 atm
BURNING MODE
7 1300 4.2 0.23 430 0.775 0.5x10⁶ 10 atm 8 1535 5.0
1
500 .775 0.5x10⁶ 10 atm 9 945 10.8 320 .71-.83 1.90x10⁶ 20 atm
10 1165 9.0 390 .72-.80 1.25xl06
1 11 1500 11.7 500 .775 1.25xl06 12 1500 17.7 500 .775 1.90x10⁶

HIGH PRESSURE AIR
(a) Perspective view.
10 atm AMB - 560 K 10 atm /560 K
I ,2 COMPRES- ,2 COMPRES-MAIN AIR - PRE-HEATER SOR SOR SUPPLY ! 'I
BYPASS V'I
BYPASS SYSTEM SYSTEM
9. COMPRES- -£. (FUTURE) COIW'RES-
v ~ SOR f-SOR
NO 1 NO 2 20 atm/73O K 40 atm/890 K
-
1
I I I I I \ I I \
9, V'I
FULL ANNULAR CASCADE
r COOLING AIR SYSTEMS
330-730 K
rf. MAIN AIR EXHAUST
I SYSTEM
1 I I 1 1
--MAIN AIR SYSTEM ---1\ ...... --- HIGH PRESSURE AIR SYSTEM ----tl ..... · -- TEST RIG --I--£EXHAUST -
(b) HSF flow schematic
Figure 1. - Hot sectIOn test faCIlity.
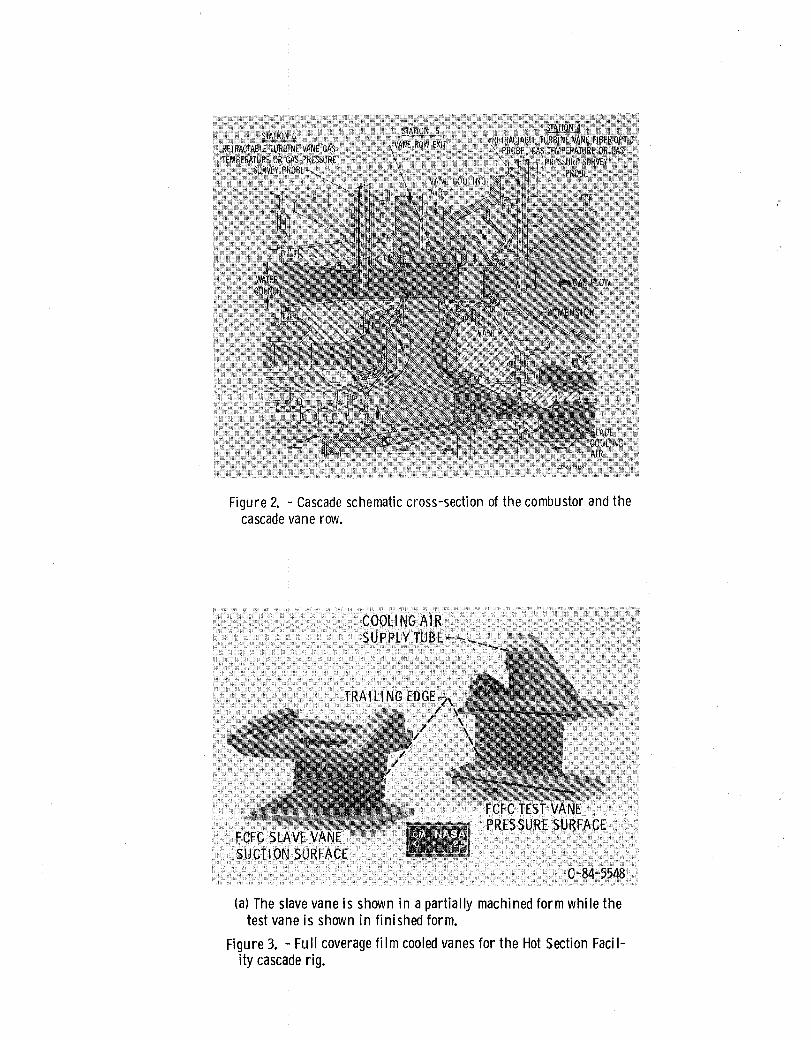
Figure 2. - Cascade schematic cross-section of the combustor and the cascade vane row.
COOLING AIR SUPPLY TUBE-",, __
' ....
C TEST VANE PRES SURE SURFACE
C-84-5548
(a) The slave vane is shown in a partially machined form while the test vane is shown in finished form.
Figure 3. - Full coverage film cooled vanes for the Hot Section Facility cascade rig.
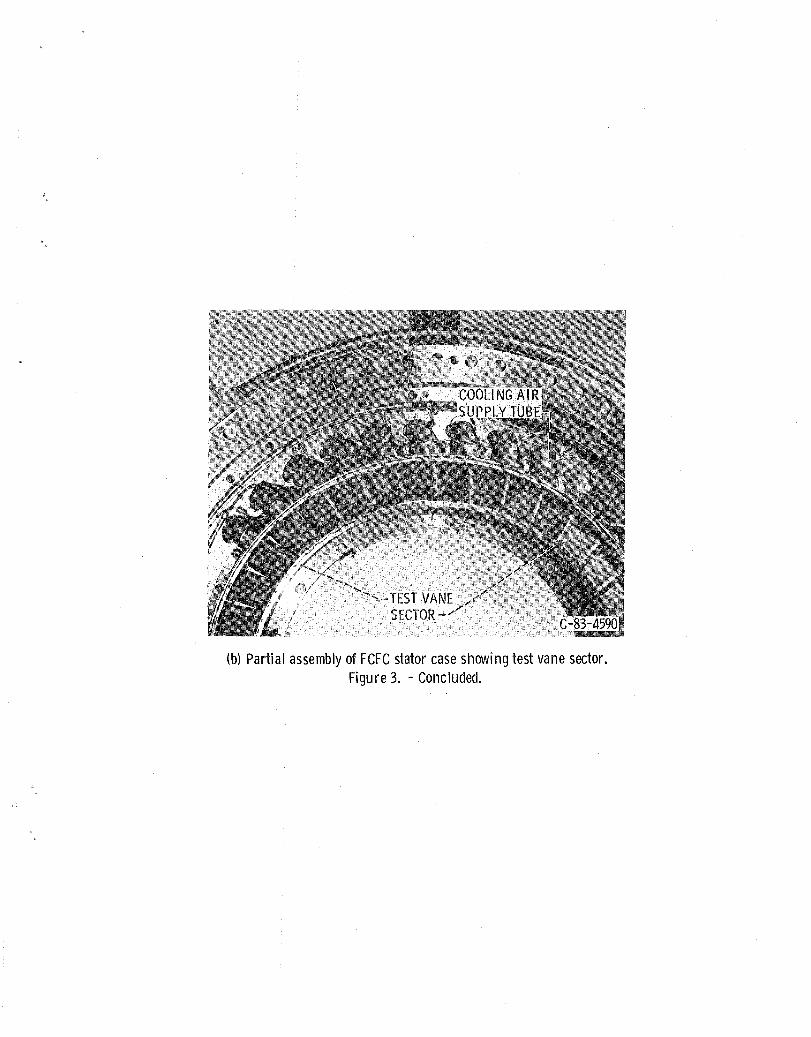
(b) Partial assembly of FCFC stator case showing test vane sector. Figure 3. - Concluded.
t ~ ~ 704 CALIBRATION CONTROL
89 64 74 ANALOG VOLTAGE DIGITAL DIGITAL ANALOG INPUTS INPUTS
COMPUTER INPUTS OUTPUTS OUTPUTS
! ! CALIBRATION RELAYS J t ~ MULTIPLEXER- OPERATION 2 CRT 256 16
DIGITIZER ...
COMPUTER DISPLAYS DIGITAL ANALOG INPUTS OUTPUTS
INPUT COMPUTER SETPOINT 160
MODIfY DIGITAL KEYB'D OUTPUTS
RATE CONVERTERS (48 CHANNELS)
, t , RESEARCH 2 CRT 96 128 COMPUTER DISPLAYS DIGITAL DIGITAL
INPUTS OUTPUTS
PNEUMATIC VANE TRANSMISSION MULTIPLEXERS MAPPING TO DATA no UNITS) SYSTEM COLLECTOR
Figure 4. - Schematic of Digital Control Center (DCC).
STA. 4
RADIAL GASPATH SURVEYS
VANE
- COOLING AIR TEMP 7 - COOLING AIR PRESS 31 - GASPATH TEMP 11 - GASPATH PRESS 65 - METAL TEMP 68 - HEAT FLUX 40
COMB. AIRIGAS PATH
- TEMP 12 - PRESS 12 - AIR FLOW 1 - FUEL FLOW 2 - METAL TEMP 24
- TEMPERATURE - PRESSURE -INFRARED
PHOTOGRAPHY FOR SURF. TEMP MAPPING OF THE FRONT OF THE VANE
TURBINE VANE CAw{RA PROBE
SHROUD
- AIR TEMP 6 - AIR PRESS 6 - METAL TEMP 20
STA.6
RADIAL GASPATH SURVEYS - TEMPERATURE - PRESSURE
, , I
I , I
I , I
DISK
~...,.".,.,~~~ ............ -METAL TEMP 12
MISC.
5-INDIVIDUALLY CONTROLLED COOUNG AIR FLOW RATES AND TEMP. LEVELS
(al Summary of ng instrumentation. CD-81-12711
Figure 5. - HSF cascade research instrumentation.
P6
S3
P5 '\ , FCFC STATOR AIRFOIL PI , , ,
'~ TYPICAL SENSOR LOCATIONS
SUCTION SURFACE PRESSURE SURFACE
SENSOR xfL SENSOR x/L
SP 0.0 Sl .067 PI 0.083 S2 .188 P2 .174 S3 .346 P3 .314 S4 .612 P4 .587 S5 .836 P5 .826 S6 .972 P6 .973
Sl
SP
(b) Full coverage film cooled vane cross-section showing typical composite of instrumentation.
COMBUSTOR EXIT
PRESSURE, 11m
40
35
30
25
15
10
Figure 5. - Concluded.
DESIGN OPERATING ENVELOPE ~,
---------------~-------------------~ 10 ATM NON BURNING
ILZl 20 ATM NON-BURNING
D 10 & 20 ATM BURNING
Re= 10'
COMBUSTOR EXIT TEMPERATURE, K
REYNOLDS NO IS BASED ON VANE EXIT CONDITIONS AND THE VANE CHORD alA IS THE BOUNDARY LAYER COOLING RATE con.
Figure 6. - Cascade rig simulation of real engine operating conditions.
o CASCADE MEASUREMENTS (STATION 4, 2630 ccw\ o CASCADE MEASUREMENTS (STATION 4, 3450 ccw\
UNPUBLISHED DATA, COMBUSTOR DEVELOPMENT TESTS
CALCULATED AVERAGE TEMPERATURE, ><: CASCADE TEST w-~ => ~ ~ w "-~ I-V> ...: c.:> -' ...: 13 I-I--
S ~ o I-V> => CD ::E o t.)
2000
1500
\ \ \ \
\
o o o
'- MAXIMUM TEMPERATURE PROFILE
'-CIRCUM'ERENTIAL AVERAGE TEMPERATURE PROFILE
1000 L... __ L--_-----lL.-_----t __ ----L:--_--:-' o 2 4 6
RADIAL POSITION, ~:r o I
(a) Two Circumferential locations are compared With unpublished data from combustor development tests (case 1lI.
LOCAL PAmRN FACTOR DOloOO TO 0300 CO.lOO 10 0200 B 0 zoo TO 0100 A 0 laO TO 0000 1 0 000 TO 0 I O~ 2-0 IDa 10-0 200 1 0 20Q TO 0 ~oo ~ 0 300 TO 0 400 5-040010-0500 60 SOD TO otOO
CIRCUMFERENCE!g - 1476 K
MEAN RADIUS T9 -1620 K
STANDARD DEVIATION a - 63 K
(b\ Circumferential distribution of local pattern factor from combustor development tests Conditions Similar to case 11 The hot spots are highlighted
Figure 7 - Typical gas total temperature profile at station 4 (combustor eXIt)

GAS TOTAL
GAS TOTAL TENfERATURE, PRESSURE,
K atm 1.0 TEMPERATURE, PRESSURE
0 1500 11. 7 K atm 0 1165 9.0
0 1535 5.0 0 700 4.9 .9 0 1300 4.2 ~ 500 5.1
~ O@ c2~ tB 0 0 0 V')
~ 0 V')
~ 00) l.J.J Z .8 l.J.J > t= u 0 l.J.J u..
.7 u.. l.J.J
(al Reynolds number = 0.5x10⁶• (bl Reynolds number = 1. 25x106• c.!) z ::::i
1.0 0 0 1535 5.0 0 u 0 500 8.5 0 1500 9.0 l.J.J 0 1500 17.7 c.!)
<C .9 0:::
l.J.J
~ o GOOD OJ o(Q;P 0 IDD&> ~Q) .8
0 .7
.09 .10 .11 .12 .13 .14 .15 .08 .09 .10 .11 .12 .13 .14 .15 COOLANT -TO-GAS FLOW RATIO
(cl Reynolds number = 2.5x10⁶. (dl Constant gas temperature = 1500 K.
Figure 8. - Thermal scaling results from the full coverage film cooled vane cascade tests.
'<:t 1.0
a..
'" a..
0
!< ~
L.I.I ~ :::l en en L.I.I ~ a.. --' « b 'I 0 'I u ~ I-en
1.0
0 ;=: « c::
~ --' u.. --' « b .9 .. 0 'I >-a:: « :E: 02 a..
. 8
~cr)5 o 0.80 o .75 o .85
OPEN SYMBOLS DENOTE SUCTION SURFACE SOUD SYMBOLS DENOTE PRESSURE SURFACE
DESIGN DATA FROM AMBIENT UNBLOWN TESTS (REF. 71
.2 .4 .6 .8 DIMENSIONLESS SURFACE DISTANCE, x/L
(al Surface static-to-total pressure distnbution variation with exit cntlcal velocity ratio, 1. 90x106 Reynolds number.
\ , '-PRIMARY AND COOLANT FLOW " , .. ,
'., .. , , "
" , " /-PRIMARY FLOW
' / o CURRENT DATA "-~ o REF. 8 DATA
OPEN SYMBOL - BURNING 'ce. SOUD SYMBOL -ISOTHERMAL 'Q.,
~ ' .
0 .10 .20 COOLANT -TO-PRIMARY FLOW RATIO
(bl Reduction of primary flow with increased coolant.
Figure 9. - Stator vane aerodynamic performance.

Figure 10. - Thermal i mage of the leading edge and pressure surface of vane 2 (3300 CCW).
en en UJ
a:i > ~ u ~ u.. UJ (!)
z ::::i o o u UJ (!)
<%: ~
MEAN VALUE 20.82 22 r- STANDARD DEVIATION 0. 2?97
950/0 CERTAINTY 20.94-20.74
21 f-
TIME-(al Time history of the coolant-to-gas flow parameter.
1.0
.9
.8
GAS TOTAL TEMPERATURE, PRESSURE,
K atm o 1535 5.0 o 1500 H.7 o 1500 17.7 6 700 9.5
~ .7~--------~--------~ <%: .10 .12 .14
COOLANT-TO-GAS FLOW RATIO
(bl Repeatability of HSF demonstrated by repetitive data taken at a specified set-poi nt.
Figure 11. - Facility operational stability and repeatabi lity.
1. Report No 2 Government Accession No
NASA TM-86890 4 Title and Subtitle
Heat Transfer Results and Operational Characteristics of the NASA Lewis Research Center Hot Section Cascade Test Facility
7 Author(s)
Herbert J. Gladden, Frederick C. Yeh, and Dennis L. Fronek
9 Performing Organization Name and Address
National Aeronautics and Space Administration Lewis Research Center Cleveland, Ohio 44135
12 Sponsonng Agency Name and Address
National Aeronautics and Space Administration Washington, D.C. 20546
15 Supplementary Notes
3 Recipient's Catalog No
5 Report Date
6 Performing Organization Code
533-04-1 D 8 Performing Organization Report No
E-2357
10 Work Unit No
11 Contract or Grant No
13 Type of Report and Penod Covered
Technical Memorandum
14 Sponsonng Agency Code
Prepared for the Thirtieth International Gas Turbine Conference and fixhibit sponsored by the American Society of Mechanical Engineers, Houston, Texas, March 17-21, 1985.
16 Abstract
The NASA Lewis Research Center gas turbine hot section test facility has been developed to provide a ureal-engineU environment with well known boundary conditions for the aerothermal performance evaluation/verification of computer design codes. The initial aerotherma1 research data obtained at this facility are presented and the operational characteristics of the facility are discussed. This facility is capable of testing at temperatures and pressures up to ~600 K and ~8 atm which corresponds to a vane exit Reynolds number range of 0.5xlO to 2.5xlO based on vane chord. The component cooling air temperature can be independently modulated between 330 and 700 K providing gas-to-coolant temperature ratios similar to current engine application. Research instrumentation of the test components provide conventional pressure and temperature measurements as well as metal temperatures measured by IR-photography. The primary data acquisition mode is steady state through a 704 channel multiplexer/digitizer. The test facility was configured as an annular cascade of full coverage film cooled vanes for the initial series of research tests. These vanes were tested over a wide range of gas Reynolds number, exit gas Mach number and heat flux levels. The range of test conditions was used to represent both actual operating conditions and simllarity state conditions of a gas turbine engine. The results are presented for the aerothermal performance of the facility and the full coverage film cooled vanes.
17 Key Words (Suggested by Author(s»
Heat transfer Film cooling Turbine cooling
19 Security Classlf (of this report)
Unc1 assi fi ed
18 Dlstnbutlon Statement
Unclassified - unlimited STAR Category 34
20 Secunty Classlf (of this page)
Unclassified 21 No of pages
"For sale by the National Technical Information Service, Springfield, Virginia 22161
22 Pnce"

End of Document