nw culturalcompetency 062320f...•plan interventions taking latinos attitudes and behaviors in...
TRANSCRIPT

6/22/20
1
Welcome!
1
Event MaterialsVisit the event page to download a copy of the presentation slides and any additional resources.
Let’s Chat!Select All Panelists & Attendees from the drop-down when commenting in the chat pod.
Tech SupportEmail us if you need tech support or have [email protected]
Event Page: https://militaryfamilieslearningnetwork.org/event/64660
1
2
Building Cultural Competence in Nutrition and Dietetics
Event MaterialsVisit the event page to download a copy of the presentation slides and any additional resources.
This webinar has been approved to offer continuing education credit. Please stay tuned for more information!
Continuing Education
Gerard Altman/ CC0 via Pixabay
Event Page: https://militaryfamilieslearningnetwork.org/event/64660/
2

6/22/20
2
Connecting military family service providers and Cooperative Extension professionals to
research and to each other through engaging online learning opportunities
https://militaryfamilieslearningnetwork.org
This material is based upon work supported by the National Institute of Food and Agriculture, U.S. Department of Agriculture, and the Office of Military Family Readiness Policy, U.S. Department of
Defense under Award Numbers 2015-48770-24368 and 2019-48770-30366.
3
Henna Muzaffar, PhD, RD, FAND
Today’s Presenters
4
Assistant Professor and EDOC FacilitatorCollege of Health and Human SciencesNorthern Illinois University
Specialty: Obesity prevention and healthy lifestyle nutrition education interventions with children and their families in the schools and the community
Karina Diaz Rios, PhD, RDCooperative Extension SpecialistDivision of Agriculture & Natural ResourcesUniversity of California, Merced
Specialty: Development and evaluation of culturally relevant nutrition education for communities vulnerable to malnutrition
4

6/22/20
3
Objectives
5
1 Explain the need for attaining cultural competence in nutrition and dietetics
2 Describe the steps to develop cultural competence in research and counseling
3 Identify strategies to achieve cultural sensitivity in nutrition research and dietetics practice
5
Poll
6
Which of the following best describes you?
a. Student
b. Dietitian
c. Researcher
d. Educator
e. Other
6

6/22/20
4
Culture and Diversity
7
Culture: The integrated pattern of human knowledge, belief, and behavior that depends upon man’s capacity for learning and transmitting knowledge to succeeding generationsDiversity: Means dissimilarity and variance between things or people. Cultural diversity is the recognition that people come from a variety of ethnic, geographic, economic, and religious backgrounds. Multicultural: It is a term often used to describe an organization which promotes an environment free of discrimination and promotes policies, processes, and procedures that recognize and value cultural diversity.
7
Melting Pot or Salad Bowl
8
• Currently, 25% of the US population consists of ethnic subpopulations.
• By 2050, 47.5% of the US population will consist of ethnic subpopulations.
• By 2065, Non-Hispanic whites will most likely be a minority.
• Melting pot effect• Multicultural marketing
8

6/22/20
5
Cultural Competency
9
• Cultural Competency: It is the acceptance and tolerance of different backgrounds and their associated traits, beliefs, etc., and absence of prejudice against unfamiliar cultures.
• Cultural Sensitivity: Cultural sensitivity means recognizing subtle but important facets of another person’s culture, and accepting their expression of their culture.
• Salad bowl effect
9
Culture Matters
10
• When culture is ignored, families are at risk of not getting the support they need.
• Cultures gives context and meaning:• It is a filter through which people process their
experiences • It influences people’s values, actions, and
expectations of themselves• It impacts people’s perceptions and
expectations of others
10
6/22/20
6
Steps Involved in Developing Cultural Competency
11
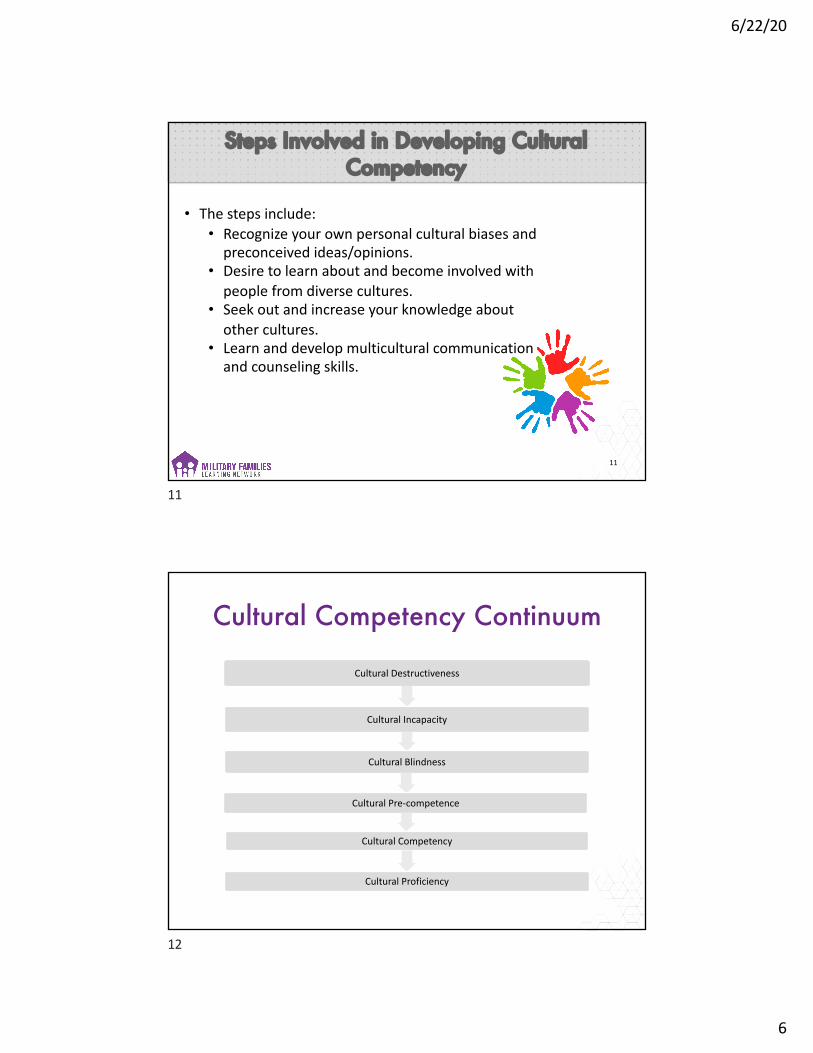
• The steps include:• Recognize your own personal cultural biases and
preconceived ideas/opinions.• Desire to learn about and become involved with
people from diverse cultures.• Seek out and increase your knowledge about
other cultures.• Learn and develop multicultural communication
and counseling skills.
11
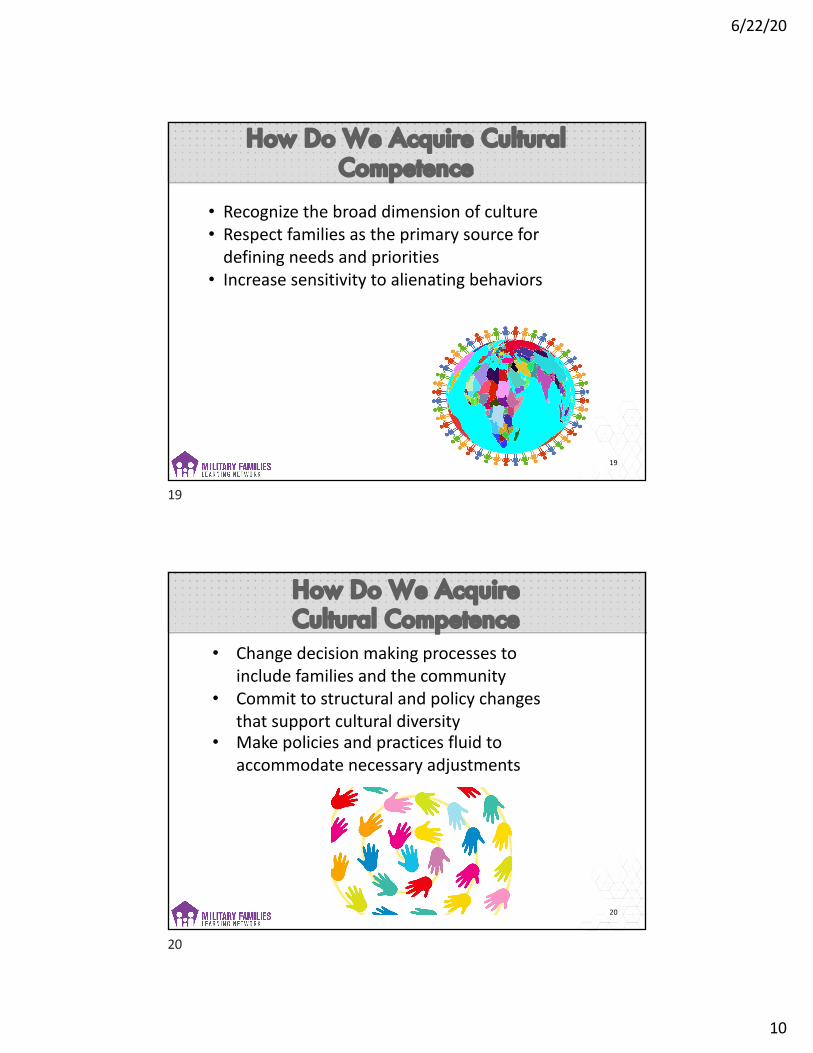
Cultural Competency Continuum
Cultural Destructiveness
Cultural Incapacity
Cultural Blindness
Cultural Pre-competence
Cultural Competency
Cultural Proficiency
12

6/22/20
7
Cultural Competency Continuum
13
1. Cultural Destructiveness• Attitudes, policies and practices
which are destructive to cultures and individuals within them• Purposeful destruction of a
culture• Assumes one race superior
13
Cultural Competency Continuum
14
2. Cultural Incapacity• Intent not to be intentionally
culturally destructive• Lack of capacity to work with
minorities• Extreme bias and belief in racial
superiority of dominant group
14

6/22/20
8
Cultural Competency Continuum
15
3. Cultural Blindness:• Midpoint on the continuum• Systems/agencies provide services
with philosophy of being unbiased• Belief that color or culture make no
difference• Belief that dominant culture
approaches are universally applicable
15
Cultural Competency Continuum
16
4. Cultural Pre-competence• Implies movement• Weaknesses recognized in working
with minorities• Attempts to improve practices and
increase knowledge• Danger of tokenism
16

6/22/20
9
Cultural Competency Continuum
17
5. Cultural Competency• Acceptance and respect for
difference• Continuing self-assessment
regarding culture• Careful attention to
dynamics of difference• Continuous expansion of
cultural knowledge and resources
17
Cultural Competency Continuum
18
6. Cultural Proficiency• Culture held in high esteem• Knowledge base of cultural competence sought by• Conducting culture-based research• Developing new approaches based on culture• Publishing and disseminating results of culturally
sensitive/competent research
18
6/22/20
10
How Do We Acquire Cultural Competence
19
• Recognize the broad dimension of culture• Respect families as the primary source for
defining needs and priorities• Increase sensitivity to alienating behaviors
19
How Do We Acquire Cultural Competence
20
• Change decision making processes to include families and the community
• Commit to structural and policy changes that support cultural diversity
• Make policies and practices fluid to accommodate necessary adjustments
20

6/22/20
11
Cultural Differences
21
• Six Cultural Phenomenon• Communication• Personal space• Social organization• Time• Environmental control• Biological variations
21
Cultural Differences
22
• General assessment and teaching strategies• Establish rapport• Assessment
• Readiness to learn, considering cultural background
• Determine health beliefs, values, and practices
• Use client’s primary language
22

6/22/20
12
Acquiring Cultural Competence
23
• Individually:• Do you have close personal
relationships with people who are culturally and socioeconomically different?
• Do you have the desire, knowledge, and skill to integrate culturally relevant considerations into your work?
23
Acquiring Cultural Competence
24
• Organizationally:• Value diversity• Conduct cultural self-assessment• Identify cross-cultural dynamics• Institutionalize cultural knowledge• Adapt service delivery to diversity within
and between cultures
24

6/22/20
13
Movement Towards Cultural Competence
25
• Attitudes must change• Policies must change• Practices must become more congruent
with cultures
25
Culturally Competent Research
26
• Commitment to provide culturally competent research• Must include• Awareness of cultural differences• Awareness of own cultural values• Understanding of dynamics of difference• Basic knowledge of research participants’
environment(s)• Ability to adapt research methods, evaluation, data
collection and analysis to participants’ cultural context
26

6/22/20
14
Research with Latinos
27
• Focus group study with Latino mothers (n=41)• Attitudes• Behaviors
• Cultural viewpoints around feeding and cooking and feeding strategies was explored.
• Plan interventions taking Latinos attitudes and behaviors in consideration.
Martinez et al. J Acad Nutr Diet. 2014;114(2):230-237.
27
Culturally Competent Health Care
28
• Health care providers should understand:• Beliefs, values, traditions and practices of a
person’s culture• Family structure and the roles within the family in
making decisions• Health related needs of individuals, families, and
communities• Cultural beliefs about health and the etiology of
diseases• Cultural beliefs about healing and disease
treatments• Attitudes about seeking help from health care
providers
28

6/22/20
15
Values of Anglo-American Culture
29
• High value on individualism, privacy, and personal responsibility and control.
• Emphasis is placed on the nuclear family.• Extended family does not play a role in major
decision making.• Value direct, open and honest communication.• Informality is considered synonymous with
friendliness.• Anglo-Americans are future oriented and place value
on promptness.
29
Values of Traditional Cultures
30
• Believe that fate, God or other supernatural factors determine a person’s destiny.
• Personal relationships determine self-worth and take priority over time schedules.
• Family almost always includes extended family.• Family hierarchy in many traditional cultures.• Informality is often associated with rudeness in certain
cultures.• Traditional cultures are polychronistic as opposed to
Anglo-Americans, who are monochronistic.• Traditional cultures prefer cooperation, traditions, and
idealism.
30

6/22/20
16
Case Study
31
Mary, the outpatient dietitian at a large teaching hospital, was extremely annoyed when Juan Martinez, a 44-year-old man recently diagnosed with hypertension and type 2 diabetes arrived 20 minutes late for his appointment. She became more agitated when he arrived with three other adults and two children. In order to keep to her schedule, Mary asked the family members to sit in the outer office and omitted taking a diet history. She got “right to the point” and immediately began explaining how to count carbohydrates, frequently asking “Juan, do you understand?” Mary was satisfied when Juan responded yes. Mary was able to finish Juan’s diet instruction in a record 30 minutes. Rather than seeing Juan to the door and shaking his hand, Mary explained that she had another meeting and gestured for Juan and his relatives to exit. Two weeks later Mary was surprised when Juan did not return for his follow-up appointment. Why did Juan most likely not return for his follow-up appointment? Simply, Mary failed to “connect” to Juan and his family through cultural blindness.
31
Questions???
32
“Cultural and linguistic
competence is a life’s journey not a
destination”!
32

6/22/20
17
Poll Question
33
Do you work with/for clients whose cultural background is different than yours?
a. Yes, often
b. Yes, occasionally
c. No, but I have or will do
d. No, I am just curious
e. I don’t know
33
cultural competence
diaz rios | 34Bruening M, et al. J Acad Nutr Diet. 2015;115:1699-1709
ability to productively engage clients from different cultural
backgrounds
34

6/22/20
18
culturelearned beliefs, traditions, and values that guide behavior
diaz rios | 35
Brislin RW, 2001.Gannon M. J Organiz Behav. 1995;16:497Weaver GR, 1986
acquired through interpersonal interactions
widely shared among group members
framework for interacting with the world
35
appearance
tools & utensilslanguage
behavior
practicespreferences
norms
valuesbeliefs
attitudes
expectationsstressors
coping style
Weaver GR, 1986
Chapman-Novakofski K & Diaz Rios LK. In: Krause and Mahan’s Food & The Nutrition Care Process. 15th ed. Elsevier; 2021. Ch 13, pg 229-30 diaz rios | 36
deepcultureout of awareness
surfaceculturein awareness
surfaceculturein awareness
deepcultureout of awareness
36
6/22/20
19
diaz rios | 37
we are what we eat
37
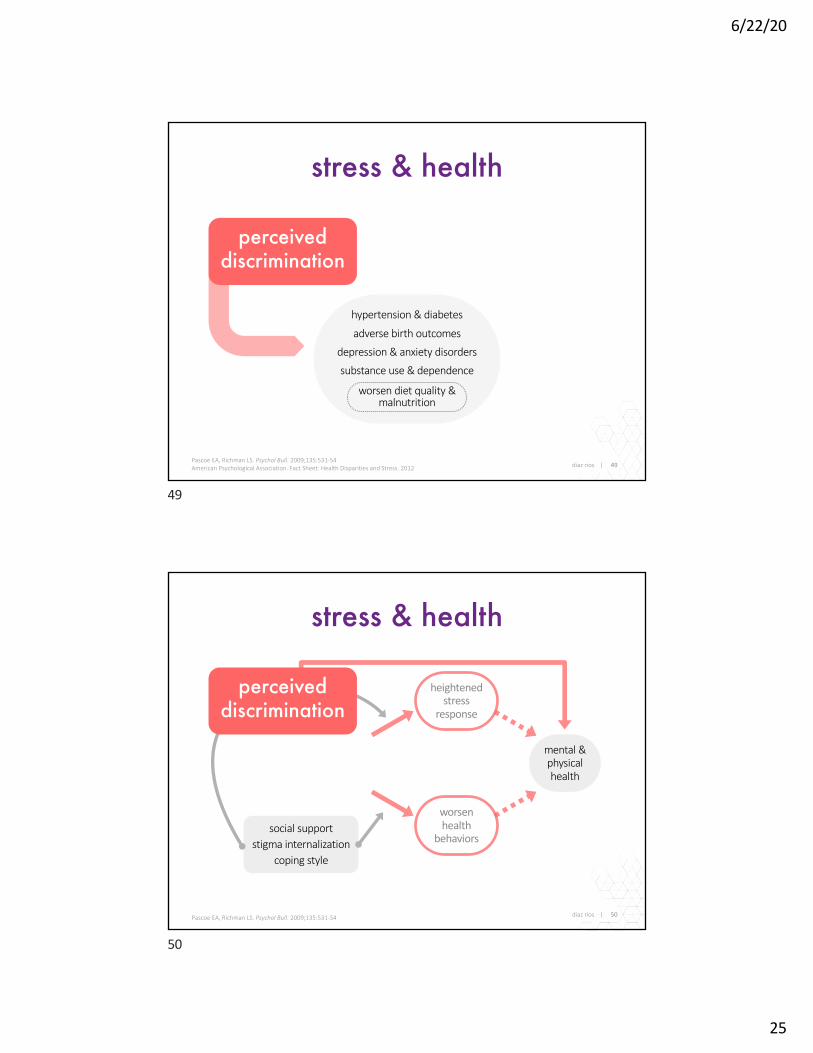
principles
38Chapman-Novakofski K & Diaz Rios LK. In: Krause and Mahan’s Food & The Nutrition Care Process. 15th ed. Elsevier; 2021. Ch 13, pg 229-30
of cultural competence in dietetics practice
actively practice cultural awareness, centeringclient’s cultural perspectives, needs, and wants
integrate deep structure attributes of eating choices & evidence-based recommendations into advice
survey client’s deep structure attributes affecting their eating choices & perceived nutritional status
explore internalized assumptions, beliefs, & attitudes informing your perception of client’s practices
38

6/22/20
20
cultural competence
Chapman-Novakofski K & Diaz Rios LK. In: Krause and Mahan’s Food & The Nutrition Care Process. 15th ed. Elsevier; 2021. Ch 13, pg 229-30 39
cultural competence
explore internalized assumptions, beliefs, & attitudes informing your perception of client’s practices
explore internalized assumptions, beliefs, & attitudes informing your perception of client’s practices
39
cultural competence
Nutrition care process and model. J Am Diet Assoc. 2008;108:1113-17Chapman-Novakofski K & Diaz Rios LK. In: Krause and Mahan’s Food & The Nutrition Care Process. 15th ed. Elsevier; 2021. Ch 13, pg 229-30
in the nutrition care process
40
personal relationship inventorydifferent cultural background?
closeness to you & your family?
can you write their biography?
explore internalized assumptions, beliefs, & attitudes informing your perception of client’s practices
40

6/22/20
21
cultural competencein the nutrition care process
41
National Center for Health Statistics,Maternal mortality in the United States, 2018
maternal mortalitydeaths per 100,000 live births
37.1
14.7
11.8
Black
White
Hispanic
weight biasperceived bias & healthcare engagement: themes
Rubino F, et al. Nat Med. 2020;26:485-97
opioid prescription
treat opioid dependence, such as methadone and buprenor-phine, were not included in counts of opioid prescriptions.Patient zip code of residence was mapped onto ZCTAs!" byusing a previously described crosswalk.!#
Counts of patients receiving prescriptions were com-bined with population counts from the American Commu-nity Survey!! to create estimates of prevalence. We also usedAmerican Community Survey data to obtain sociodemo-graphic information for each ZCTA, including the percentageof individuals identifying as non-Hispanic white and the meanper-person income. Shapefiles were obtained from the US Cen-sus Bureau!$,!% and used for mapping. We obtained zip code–level data describing the rate of age-standardized opioid over-dose mortality per "&& &&& persons for #&"" through #&"% byusing publicly available files from the California Departmentof Public Health.!'
We evaluated trends in racial/ethnic and income patternsat the state level by classifying all ZCTAs in quintiles of the per-centage of residents identifying as non-Hispanic white and ofper-person income and by calculating the prevalence of eachquintile as well as all #% race/ethnicity–income quintile com-binations. We decided to use a dichotomous index of racial/ethnic composition after observing that the main racial/ethnic differences in prescription prevalence were capturedusing a white/nonwhite scale (eFigure " in the Supplement).Geographic trends were explored with maps at the ZCTA levelfor the southern portion of Los Angeles County. We chose thisarea as the site for a more detailed case study analysis be-cause it represents a large, heavily populated city with sub-stantial socioeconomic and racial/ethnic diversities.
We conducted all data preparation and analyses betweenJanuary and May #&"( using R, version !.$." (The R Project forStatistical Computing).!) More information regarding data
preparation and completeness is provided in the eTable andeAppendix in the Supplement.
ResultsThe CURES database contains unique records for #*.) millionindividuals who received a prescription for a Drug Enforce-ment Administration–scheduled substance from #&"" to #&"%.Among these individuals, the mean (SD) age was $'.% (#&.')years, and %).&% were female.
Opioid Overdose Mortality and PrescriptionsFrom #&"" through #&"%, there were *%!$ reported opioid over-dose deaths in California. These deaths included overdosesattributed to any opioid, including prescription medication,heroin, and synthetic opioids, such as fentanyl. Overdosedeaths were highly concentrated in lower-income and mostlywhite areas. We observed an approximate "&-fold differencein overdose rates across the race/ethnicity–income gradient inCalifornia (Figure !A). Per "&& &&& people in age-standard-ized rates, there were *.' opioid overdose deaths each yearin the highest proportion–white/lowest-income quintile ofZCTAs compared with ".! in the lowest proportion–white/highest-income quintile. This racial/ethnic and income gradi-ent is consistent with prior research describing the uniqueconcentration of the opioid epidemic in low-income and ma-jority-white areas.#,!
In California, #!.'% of all individuals "% years or olderreceived a prescription for an opioid medication each year dur-ing the study period. Opioid prescriptions were concentratedamong ZCTAs with a higher proportion–white/lower-incomepopulation, with a mean annual prevalence of $$.#% among
Figure 1. Opioid Overdose Deaths and Prescription Prevalence
HighestProportion
White
Q4
Q3
Q2
LowestProportion
White
Opioid overdose deathsA
LowestIncome
Q2 Q3 Q4 HighestIncome
3.7 2.54.0 1.31.6
5.6 5.0 4.0
4.35.25.5
5.3
3.8
6.6
6.8
8.4
6.77.812.2
6.4
7.29.411.9
15.6
9.6Highestdeath rate
Lowestdeath rate
HighestProportion
White
Q4
Q3
Q2
LowestProportion
White
Opioid prescription prevalenceB
LowestIncome
Q2 Q3 Q4 HighestIncome
20.3 18.621.2 16.116.9
26.7 23.7 21.4
21.624.727.2
24.3
17.9
25.5
28.2
28.6
37.2
25.4
44.2
30.1 27.7
29.7
30.5
35.4
34.5Highestprescriptionprevalence
Lowestprescriptionprevalence
A, Annual age-standardized opioid overdose death rates per 100 000 people.B, Annual prevalence of receiving at least 1 prescription for an opioid amongindividuals 15 years or older. Both figures represent the entire state of California,showing quartiles of mean annual rates during the 2011 through 2015 studyperiod. The y-axis represents the percentage of individuals in each zip code
tabulation area identifying as non-Hispanic white, by quintiles (Qs). The x-axisrepresents quintiles of the mean per capita annual income at the zip codetabulation area level. Values for all 25 quintile-quintile pairs are shown withcolor and text.
Assessment of Racial/Ethnic and Income Disparities in the Prescription of Controlled Medications in California Original Investigation Research
jamainternalmedicine.com (Reprinted) JAMA Internal Medicine April 2019 Volume 179, Number 4 471
© 2019 American Medical Association. All rights reserved.
Downloaded From: https://jamanetwork.com/ by a University of California - Davis User on 06/05/2020
Friedman J, et al. JAMA Intern Med. 2019;179:469-76
explore internalized assumptions, beliefs, & attitudes informing your perception of client’s practices
41
cultural competencein the nutrition care process
42
explore internalized assumptions, beliefs, & attitudes informing your perception of client’s practices
Chapman-Novakofski K & Diaz Rios LK. In: Krause and Mahan’s Food & The Nutrition Care Process. 15th ed. Elsevier; 2021. Ch 13, pg 229-30
“It is not enough to know the past of the people you interpret. You must know your own past”
—Michael W. Twitty in The Cooking Gene
42

6/22/20
22
cultural competence
Nutrition care process and model. J Am Diet Assoc. 2008;108:1113-17Chapman-Novakofski K & Diaz Rios LK. In: Krause and Mahan’s Food & The Nutrition Care Process. 15th ed. Elsevier; 2021. Ch 13, pg 229-30
in the nutrition care process
43
motivational interviewingpartnershipacceptancecompassionevocation
survey client’s deep culture attributes affecting their eating choices & perceived nutritional status
43
diaz rios | 44Based on BMI-for-age & sex ≥ 95th %ileHales CM, et al. NCHS Data Brief. 2017;(288):1-8.
nutrition indicators
FPL, Federal Poverty LevelColeman-Jensen et al, 2019 (USDA-ERS 2018)
0%
5%
10%
15%
20%
25%
30%
All Boys Girls
White non-Hispanic Asian non-Hispanic
Black non-Hispanic Hispanic
child obesityU.S. prevalence 2-19 years old, 2015-16
food insecuritypercent of U.S. households, 2018
6.5
31.3
34.4
38.3
16.8
25.2
10.4
21.1
≥ 1.85 FPL
< 1.85 FPL
< 1.30 FPL
< 1.00 FPL
Hispanic
Black non-Hispanic
White non-Hispanic
All households
44

6/22/20
23
diaz rios | 45U.S. Census Bureau. Income and Poverty in the United States: 2018
incomehousehold median, 1967–2018
U.S. Census Bureau Income and Poverty in the United States: 2018 5
($84,464), followed by household-ers aged 35 to 44 ($80,743), house-holders aged 55 to 64 ($68,951), and householders aged 25 to 34 ($65,890). Householders aged 65 and over ($43,696) and household-ers aged 15 to 24 ($43,531) had the lowest median incomes.19
19 The difference between the 2018 median household income among those with house-holders aged 15 to 24 ($43,531) and house-holders aged 65 and over ($43,696) was not statistically different.
Nativity20
Between 2017 and 2018, the real median income of households maintained by a native-born person increased 1.4 percent, from $63,377 to $64,243, the fourth consecutive annual increase in median household
20 Native-born households are those in which the householder was born in the United States, Puerto Rico, the U.S. Island Areas of Guam, the Commonwealth of the Northern Mariana Islands, American Samoa, the Virgin Islands of the United States, or was born in a foreign country but had at least one parent who was a U.S. citizen. All other households are considered foreign-born regardless of the date of entry into the United States or citizenship status. The CPS does not interview households in Puerto Rico. Of all householders, 84.4 percent were native-born; 8.6 percent were foreign-born, naturalized citizens; and 7.0 percent were not U.S. citizens.
income for native-born households. The 2018 real median income of households maintained by a foreign-born person ($58,776) was not statistically different from 2017 (Figure 1 and Table A-1). The foreign-born can be classified into two cat-egories: those who are naturalized U.S. citizens and those who are not U.S. citizens. Neither group expe-rienced a statistically significant change in their median household income between 2017 and 2018.21
21 The difference between the 2017–2018 percent changes in median income for house-holds by specific nativity status were not statistically significant.
!
"!#!!!
$!#!!!
%!#!!!
&!#!!!
'!#!!!
(!#!!!
)!#!!!
*!#!!!
+!#!!!
$!"*$!"!$!!'$!!! "++'"++!"+*'"+*!"+)'"+)!"+('"+'+
Figure $,Real Median Household Income by Race and Hispanic Origin! "#$% to &'"(
Notes: The data for 2017 and beyond reflect the implementation of an updated processing system. See Appendix D for more information. The data for 2013 and beyond reflect the implementation of the redesigned income questions. See Table A-2 for historical footnotes. The data points are placed at the midpoints of the respective years. Median household income data are not available prior to 1967. For more information on recessions, see Appendix A. For more information on confidentiality protection, sampling error, nonsampling error, and definitions, see <https://www2.census.gov/programs-surveys/cps/techdocs/cpsmar19.pdf>.
Source- U,S, Census Bureau# Current Population Survey# "+(* to $!"+ Annual Social and Economic Supplements,
$!"* dollars Recession
$*)#"+&
$)!#(&$
$(%#")+
$'"#&'!
$&"#%("All races
White# not Hispanic
Black
Asian
Hispanic (any race)
45
diaz rios | 46Values are percentagesU.S. Census Bureau. Income and Poverty in the United States: 2018
povertyrate, 2018
nativ
ityra
ce /
eth
nici
ty
17.5%
9.9%
13.8%
11.4%
17.6%
10.1%
20.8%
8.1%
10.1%
11.8%
Not a cit izen
Naturalized cit izen
Foreign-born
Native-born
Hispanic (any race)
Asian
Black
White, not Hispanic
White
Tota l
46

6/22/20
24
diaz rios | 47U.S. Bureau of Labor Statistics. Labor Force Characteristics by Race and Ethnicity, 2018
labor force participationrate, 2018
68.5%
59.6%
66.3%
63.5%
62.3%
62.8%
62.9%
Native Hawaiian, Pacific Islander
American Indian, Alaska Nat ive
Hispanic, Lat ino
Asian
Black, African American
White
Tota l
47
diaz rios | 48U.S. Bureau of Labor Statistics. Labor Force Characteristics by Race and Ethnicity, 2018
occupationemployed people, 2018
0%
25%
50%
75%
100%
Total Whi te Black, AfricanAmerican
As ian Hispanic, Latino
Production, transportation, and material moving occupationsNatural resources, construction, and maintenance occupationsSales and office occupationsService occupationsManagement, profess ional, and related occupations
48
6/22/20
25
stress & health
diaz rios | 49Pascoe EA, Richman LS. Psychol Bull. 2009;135:531-54American Psychological Association. Fact Sheet: Health Disparities and Stress. 2012
hypertension & diabetes
adverse birth outcomes
depression & anxiety disorders
substance use & dependence
worsen diet quality & malnutrition
perceived discrimination
49
stress & health
diaz rios | 50Pascoe EA, Richman LS. Psychol Bull. 2009;135:531-54
mental & physical health
heightened stress
response
worsen health
behaviorssocial support
stigma internalizationcoping style
perceived discrimination
50

6/22/20
26
stress & health
diaz rios | 51Pascoe EA, Richman LS. Psychol Bull. 2009;135:531-54American Psychological Association. Fact Sheet: Health Disparities and Stress. 2012
acculturativestress
hypertension & diabetes
adverse birth outcomes
depression & anxiety disorders
substance use & dependence
worsen diet quality & malnutrition
perceived discrimination
51
diaz rios | 52Adapted from: Satia JA. Appl Physiol Nutr Metab. 2010;35(2):219-223
dietary acculturation
beliefs, attitudes, values
ethnocultural norms
religion & spirituality
living in ethnic enclave
taste preferences
knowledge, attitudes, beliefs related to diet & disease
traditional eating patterns vs. assimilation values
availability, accessibility, affordability of traditional ingredients, foods, meals
convenience of consumption
advertising & media access
food choices & food preparation:
maintainedadoptedbicultural
migration: status, wave, war
policy: international, national, local, organizationalsex, age, education, income,
employment, household composition, marital status
age at immigration, years in the United States, country of origin, area of residence, host language fluency
acculturative
52

6/22/20
27
cultural competence
Nutrition care process and model. J Am Diet Assoc. 2008;108:1113-17Chapman-Novakofski K & Diaz Rios LK. In: Krause and Mahan’s Food & The Nutrition Care Process. 15th ed. Elsevier; 2021. Ch 13, pg 229-30
in the nutrition care process
PES 1: Inconsistent CHO intake related to CHO-counting knowledge deficit as evidenced by wide variations of blood glucose levels
PES 2: Limited access to culturally appropriate food related to lack of time to plan meals as evidenced by limited supply of nutrient-dense food in home
53
survey client’s deep culture attributes affecting their eating choices & perceived nutritional status
Mary, the outpatient dietitian at a large teaching hospital, was extremely annoyed when Juan Martinez, a 44-year-old man recently diagnosed with hypertension and type 2 diabetes arrived 20 minutes late for his appointment. She became more agitated when he arrived with three other adults and two children. In order to keep to her schedule, Mary asked the family members to sit in the outer office and omitted taking a diet history. She got “right to the point” and immediately began explaining how to count carbohydrates, frequently asking “Juan, do you understand?” Mary was satisfied when Juan responded yes. Mary was able to finish Juan’s diet instruction in a record 30 minutes. Rather than seeing Juan to the door and shaking his hand, Mary explained that she had another meeting and gestured for Juan and his relatives to exit. Two weeks later Mary was surprised when Juan did not return for his follow-up appointment.
53
cultural competence
Chapman-Novakofski K & Diaz Rios LK. In: Krause and Mahan’s Food & The Nutrition Care Process. 15th ed. Elsevier; 2021. Ch 13, pg 229-30 54
integrate deep structure attributes of eating choices & evidence-based recommendations into advice
54

6/22/20
28
cultural competence
Nutrition care process and model. J Am Diet Assoc. 2008;108:1113-17Chapman-Novakofski K & Diaz Rios LK. In: Krause and Mahan’s Food & The Nutrition Care Process. 15th ed. Elsevier; 2021. Ch 13, pg 229-30
in the nutrition care process
55
integrate deep structure attributes of eating choices & evidence-based recommendations into advice
55
cultural competence
Nutrition care process and model. J Am Diet Assoc. 2008;108:1113-17Chapman-Novakofski K & Diaz Rios LK. In: Krause and Mahan’s Food & The Nutrition Care Process. 15th ed. Elsevier; 2021. Ch 13, pg 229-30
in the nutrition care process
56
actively practice cultural awareness, centering client’s cultural perspectives, needs, and wants
56
6/22/20
29
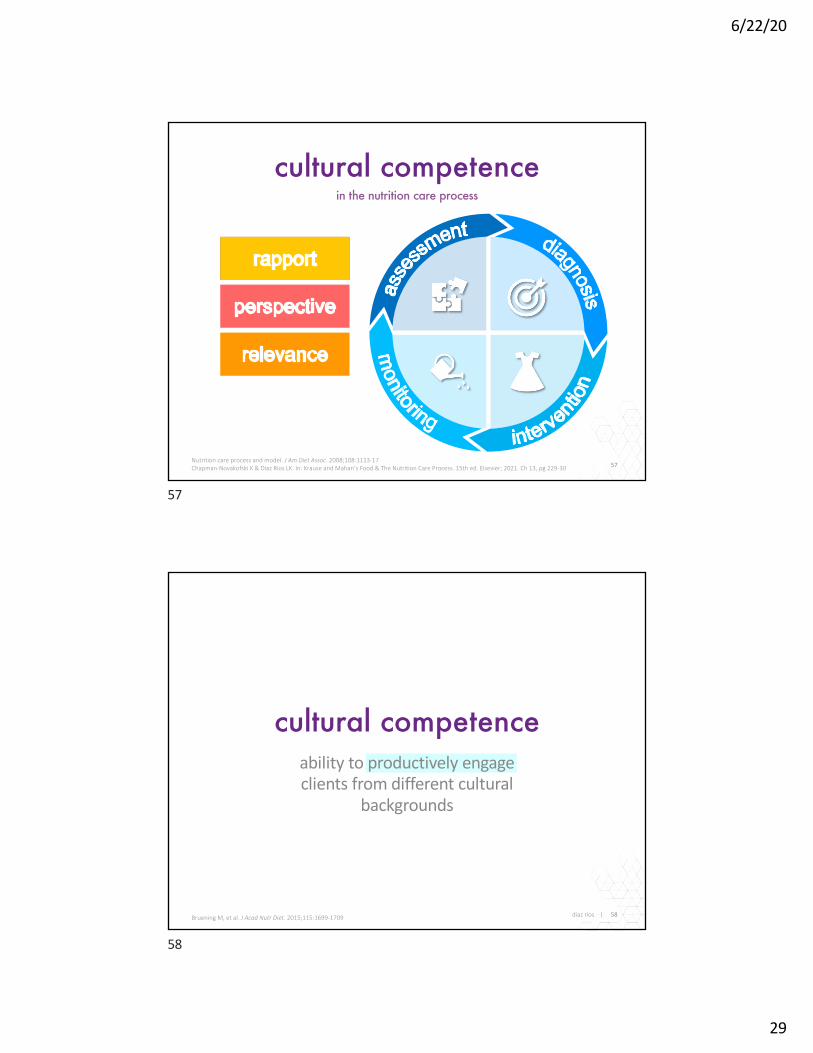
cultural competence
Nutrition care process and model. J Am Diet Assoc. 2008;108:1113-17Chapman-Novakofski K & Diaz Rios LK. In: Krause and Mahan’s Food & The Nutrition Care Process. 15th ed. Elsevier; 2021. Ch 13, pg 229-30
in the nutrition care process
57
57
cultural competence
diaz rios | 58Bruening M, et al. J Acad Nutr Diet. 2015;115:1699-1709
ability to productively engage clients from different cultural
backgrounds
58

6/22/20
30
diaz rios | 59Adapted from: Academy of Nutrition and Dietetics, Code of Ethics for the Nutrition and Dietetics Profession, 2018
code of ethics
professionalism“Contribute to decisions that affect the well-being of
patients/clients“Demonstrate respect, constructive dialogue, civility and
professionalism in all communications“Communicate at an appropriate level to promote health literacy
social responsibility for local, regional, national,global nutrition and well-being
“Collaborate with others to reduce health disparities and protect human rights
“Promote fairness and objectivity with fair & equitable treatment
“Contribute time and expertise to activities that promote respect, integrity, and competence of the profession
competence & professional development in practice
“Act in a caring and respectful manner, mindful of individual differences, cultural, and ethnic diversity
integrity in personal and organizational behaviorsand practices
“Respect patient/ client’s autonomy
59
diaz rios | 60
readings +
The Spirit Catches You and You Fall Downby Anne Fadiman
The Cooking Geneby Michael W. Twitty
Cuisine & Empireby Rachel Laudan
Pressure Cookerby Sarah Bowen,Joslyn Benton, Sinikka Elliott
Freedom Farmersby Monica M. White
Podcastsequitable healthcare consulting services
Body and Soulby Alondra Nelson
60

6/22/20
31
¡gracias!
karina díaz rios, PhD, RD
@DrDiazRios
61
Upcoming Event
62
Tuesday, August 25, 202011:00 a.m. – 12:00 p.m. EST
Event Page: MilitaryFamiliesLearningNetwork.org/event/69340
This webinar will present strategies for nourishment to promote healthy brain aging.
Continuing education credit will be available for this webinar!
Keeping Our Brains Healthy as We Age
For archived and upcoming webinars visit: MilitaryFamiliesLearningNetwork.org/AllEvents/
Gerd Altmann / Pixabay CC0
Canva / CC0
62

6/22/20
32
Evaluation & Continuing Education
63
This webinar has been approved for the following continuing education (CE) credits:
• 1.0 CPEU from the Commission on Dietetic Registration for Registered Dietitians and Dietetic Technicians
Go to the event page for evaluation and post-test link.
Evaluation Link
Questions?Email Kristin DiFilippoat [email protected]
Event Page: https://militaryfamilieslearningnetwork.org/event/64660/
63
Subscribe and Stay Connected!
64
Quarterly Newsletter• Upcoming Events• Nutrition & Wellness Tips• Articles of Interest
Topics of Interest:• Nutrition• Physical Health• Overall Wellbeing
Subscribe Here!
MilitaryFamiliesLearningNetwork.org/Nutrition-and-Wellness/
@MFLNNW
64

6/22/20
33
Explore upcoming events, articles, resources, and more https://militaryfamilieslearningnetwork.org
Connect with the MFLN
65
65