occupations migration indigenous people education ... · 2017 annual alberta labour market review...
TRANSCRIPT
2017 Annual AlbertaLabour Market ReviewEmployment . Unemployment . Economic Regions
Migration . Indigenous People . Industries
Occupations . Education . Demographics
1
Employment
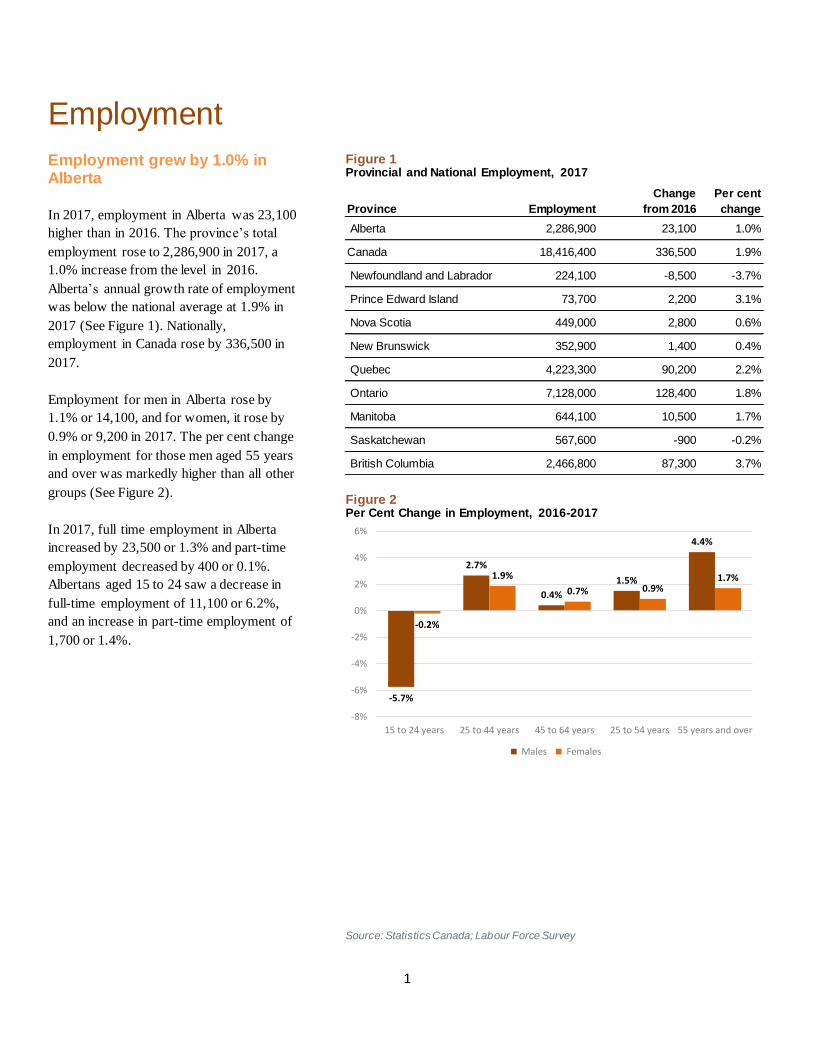
Employment grew by 1.0% in Alberta
In 2017, employment in Alberta was 23,100
higher than in 2016. The province’s total
employment rose to 2,286,900 in 2017, a
1.0% increase from the level in 2016.
Alberta’s annual growth rate of employment
was below the national average at 1.9% in
2017 (See Figure 1). Nationally,
employment in Canada rose by 336,500 in
2017.
Employment for men in Alberta rose by
1.1% or 14,100, and for women, it rose by
0.9% or 9,200 in 2017. The per cent change
in employment for those men aged 55 years
and over was markedly higher than all other
groups (See Figure 2).
In 2017, full time employment in Alberta
increased by 23,500 or 1.3% and part-time
employment decreased by 400 or 0.1%.
Albertans aged 15 to 24 saw a decrease in
full-time employment of 11,100 or 6.2%,
and an increase in part-time employment of
1,700 or 1.4%.
Figure 1 Provincial and National Employment, 2017
Figure 2 Per Cent Change in Employment, 2016-2017
Source: Statistics Canada; Labour Force Survey
Province
Per cent
change
Alberta 1.0%
Canada 1.9%
Newfoundland and Labrador -3.7%
Prince Edward Island 3.1%
Nova Scotia 0.6%
New Brunswick 0.4%
Quebec 2.2%
Ontario 1.8%
Manitoba 1.7%
Saskatchewan -0.2%
British Columbia 3.7%
2,200
2,800
1,400
2,286,900
18,416,400
224,100
73,700
449,000
352,900
2,466,800 87,300
90,200
128,400
10,500
-900
Employment
Change
from 2016
4,223,300
7,128,000
644,100
567,600
23,100
336,500
-8,500
-5.7%
2.7%
0.4%
1.5%
4.4%
-0.2%
1.9%
0.7% 0.9%1.7%
-8%
-6%
-4%
-2%
0%
2%
4%
6%
15 to 24 years 25 to 44 years 45 to 64 years 25 to 54 years 55 years and over
Males Females
2
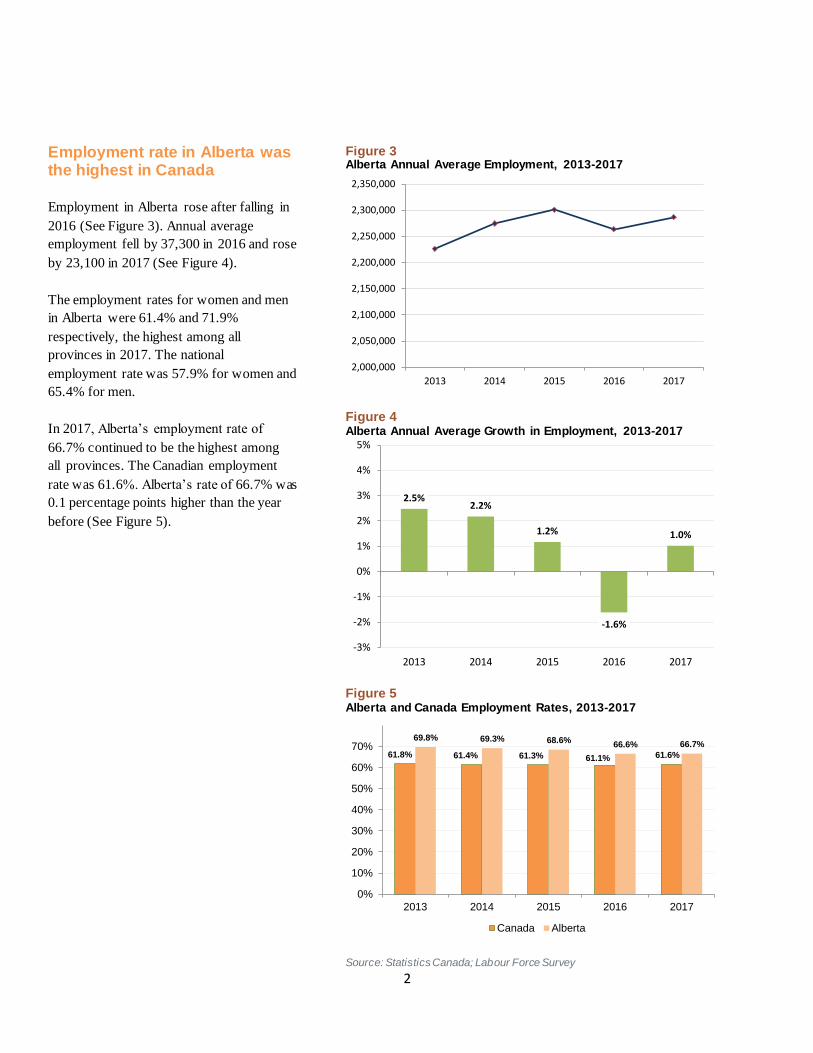
Employment rate in Alberta was the highest in Canada
Employment in Alberta rose after falling in
2016 (See Figure 3). Annual average
employment fell by 37,300 in 2016 and rose
by 23,100 in 2017 (See Figure 4).
The employment rates for women and men
in Alberta were 61.4% and 71.9%
respectively, the highest among all
provinces in 2017. The national
employment rate was 57.9% for women and
65.4% for men.
In 2017, Alberta’s employment rate of
66.7% continued to be the highest among
all provinces. The Canadian employment
rate was 61.6%. Alberta’s rate of 66.7% was
0.1 percentage points higher than the year
before (See Figure 5).
Figure 3 Alberta Annual Average Employment, 2013-2017
Figure 4 Alberta Annual Average Growth in Employment, 2013-2017
Figure 5 Alberta and Canada Employment Rates, 2013-2017
Source: Statistics Canada; Labour Force Survey
2,000,000
2,050,000
2,100,000
2,150,000
2,200,000
2,250,000
2,300,000
2,350,000
2013 2014 2015 2016 2017
2.5%2.2%
1.2%
-1.6%
1.0%
-3%
-2%
-1%
0%
1%
2%
3%
4%
5%
2013 2014 2015 2016 2017
61.8% 61.4% 61.3% 61.1% 61.6%
69.8% 69.3% 68.6%66.6% 66.7%
0%
10%
20%
30%
40%
50%
60%
70%
2013 2014 2015 2016 2017
Canada Alberta
3
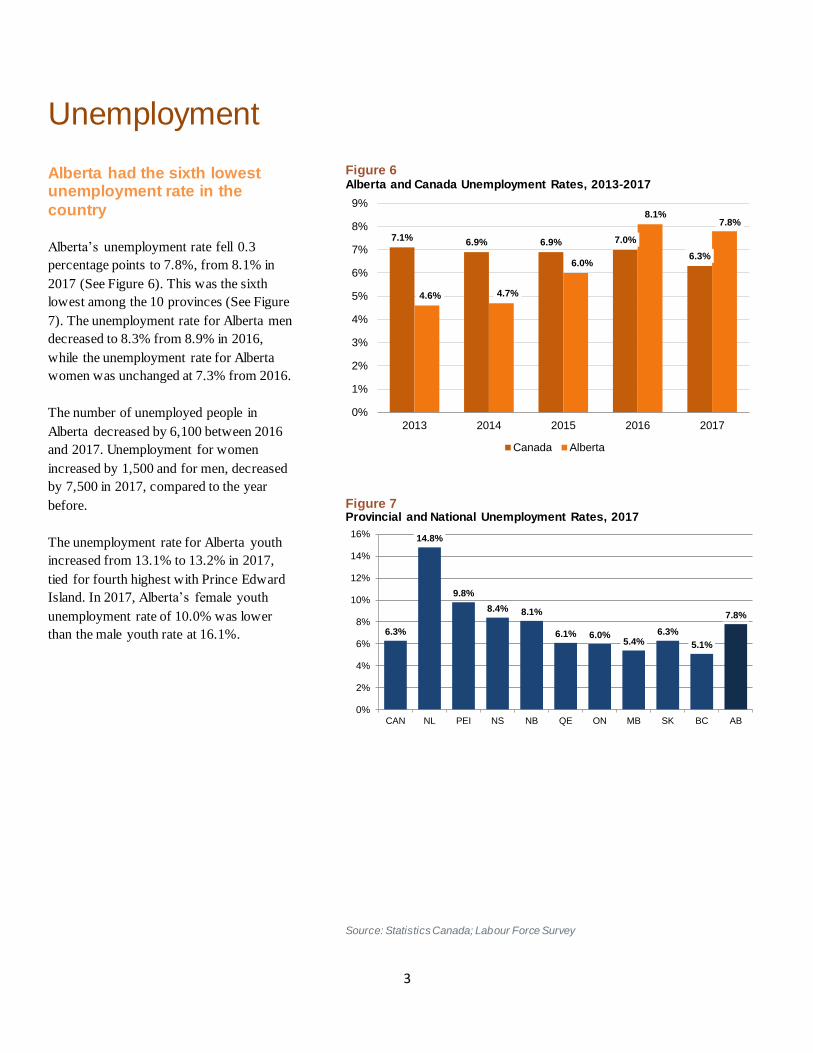
Unemployment Alberta had the sixth lowest unemployment rate in the
country
Alberta’s unemployment rate fell 0.3
percentage points to 7.8%, from 8.1% in
2017 (See Figure 6). This was the sixth
lowest among the 10 provinces (See Figure
7). The unemployment rate for Alberta men
decreased to 8.3% from 8.9% in 2016,
while the unemployment rate for Alberta
women was unchanged at 7.3% from 2016.
The number of unemployed people in
Alberta decreased by 6,100 between 2016
and 2017. Unemployment for women
increased by 1,500 and for men, decreased
by 7,500 in 2017, compared to the year
before.
The unemployment rate for Alberta youth
increased from 13.1% to 13.2% in 2017,
tied for fourth highest with Prince Edward
Island. In 2017, Alberta’s female youth
unemployment rate of 10.0% was lower
than the male youth rate at 16.1%.
Figure 6 Alberta and Canada Unemployment Rates, 2013-2017
Figure 7 Provincial and National Unemployment Rates, 2017
Source: Statistics Canada; Labour Force Survey
7.1%6.9% 6.9% 7.0%
6.3%
4.6% 4.7%
6.0%
8.1%7.8%
0%
1%
2%
3%
4%
5%
6%
7%
8%
9%
2013 2014 2015 2016 2017
Canada Alberta
6.3%
14.8%
9.8%
8.4% 8.1%
6.1% 6.0%5.4%
6.3%
5.1%
7.8%
0%
2%
4%
6%
8%
10%
12%
14%
16%
CAN NL PEI NS NB QE ON MB SK BC AB
4
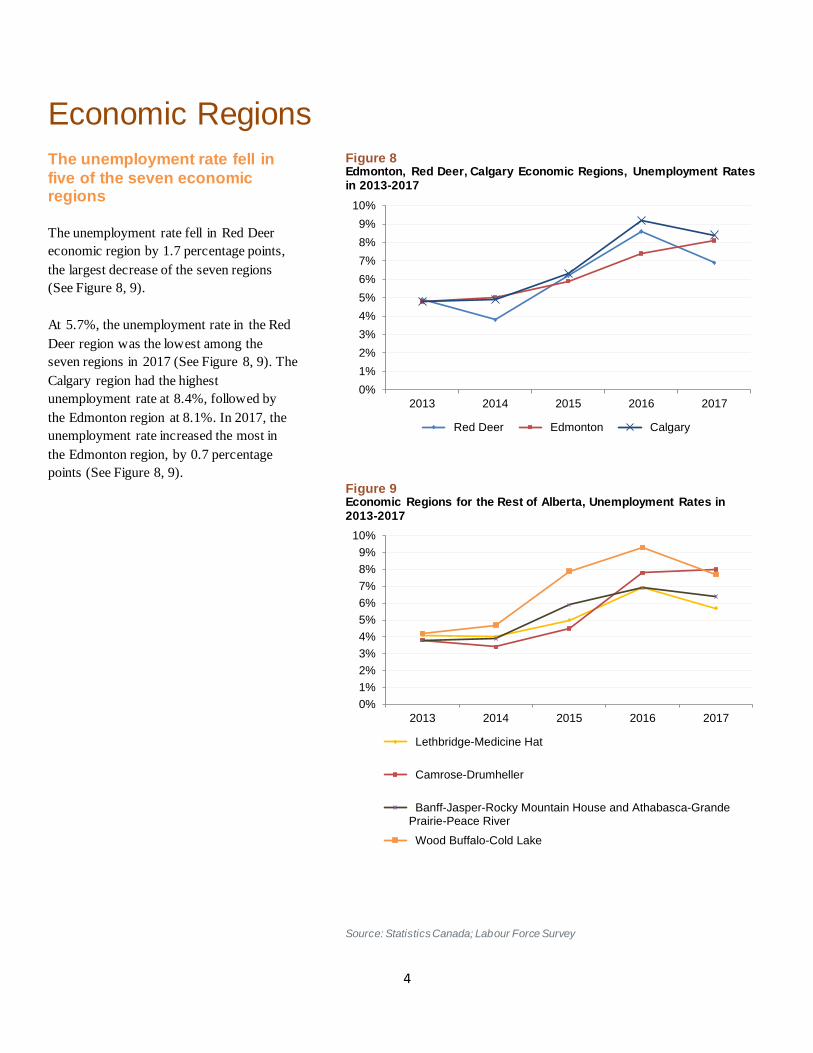
Economic Regions The unemployment rate fell in
five of the seven economic regions
The unemployment rate fell in Red Deer
economic region by 1.7 percentage points,
the largest decrease of the seven regions
(See Figure 8, 9).
At 5.7%, the unemployment rate in the Red
Deer region was the lowest among the
seven regions in 2017 (See Figure 8, 9). The
Calgary region had the highest
unemployment rate at 8.4%, followed by
the Edmonton region at 8.1%. In 2017, the
unemployment rate increased the most in
the Edmonton region, by 0.7 percentage
points (See Figure 8, 9).
Figure 8 Edmonton, Red Deer, Calgary Economic Regions, Unemployment Rates in 2013-2017
Figure 9 Economic Regions for the Rest of Alberta, Unemployment Rates in 2013-2017
Source: Statistics Canada; Labour Force Survey
0%
1%
2%
3%
4%
5%
6%
7%
8%
9%
10%
2013 2014 2015 2016 2017
Red Deer Edmonton Calgary
0%
1%
2%
3%
4%
5%
6%
7%
8%
9%
10%
2013 2014 2015 2016 2017
Lethbridge-Medicine Hat
Camrose-Drumheller
Banff-Jasper-Rocky Mountain House and Athabasca-GrandePrairie-Peace River
Wood Buffalo-Cold Lake
5
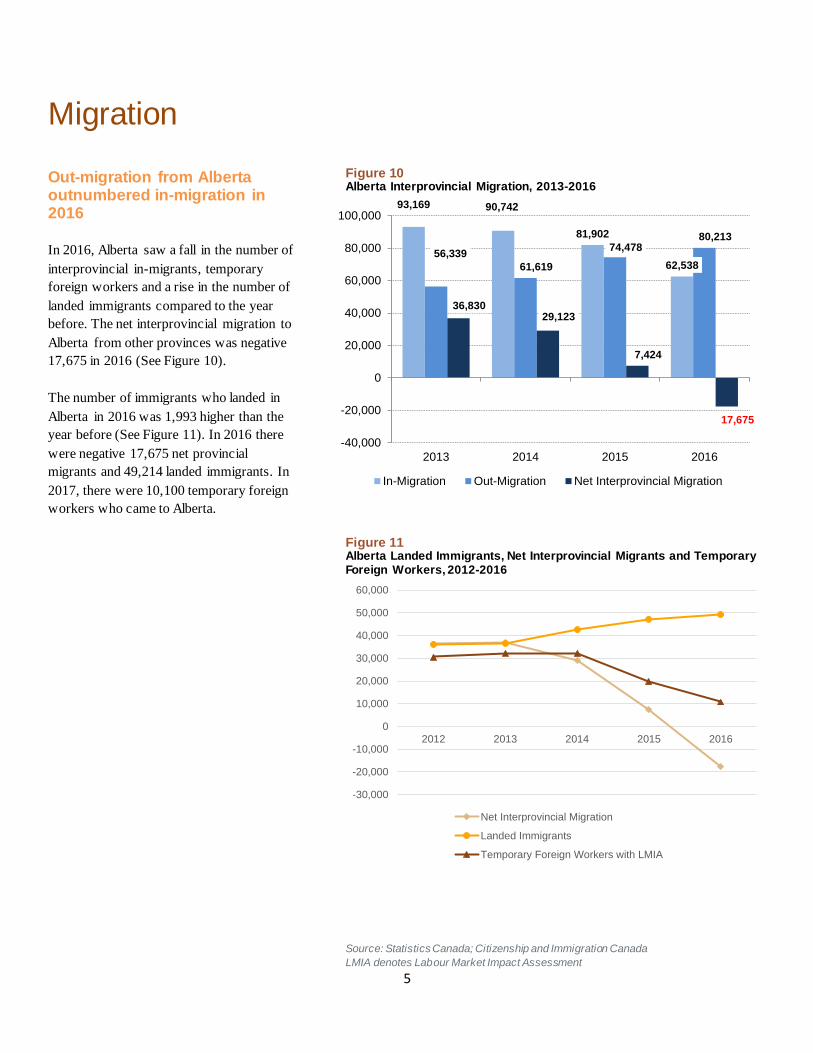
Migration
Out-migration from Alberta outnumbered in-migration in 2016
In 2016, Alberta saw a fall in the number of
interprovincial in-migrants, temporary
foreign workers and a rise in the number of
landed immigrants compared to the year
before. The net interprovincial migration to
Alberta from other provinces was negative
17,675 in 2016 (See Figure 10).
The number of immigrants who landed in
Alberta in 2016 was 1,993 higher than the
year before (See Figure 11). In 2016 there
were negative 17,675 net provincial
migrants and 49,214 landed immigrants. In
2017, there were 10,100 temporary foreign
workers who came to Alberta.
Figure 10 Alberta Interprovincial Migration, 2013-2016
Figure 11 Alberta Landed Immigrants, Net Interprovincial Migrants and Temporary Foreign Workers, 2012-2016
Source: Statistics Canada; Citizenship and Immigration Canada LMIA denotes Labour Market Impact Assessment
93,169 90,742
81,902
62,53856,339
61,619
74,47880,213
36,83029,123
7,424
17,675
-40,000
-20,000
0
20,000
40,000
60,000
80,000
100,000
2013 2014 2015 2016
In-Migration Out-Migration Net Interprovincial Migration
-30,000
-20,000
-10,000
0
10,000
20,000
30,000
40,000
50,000
60,000
2012 2013 2014 2015 2016
Net Interprovincial Migration
Landed Immigrants
Temporary Foreign Workers with LMIA
6
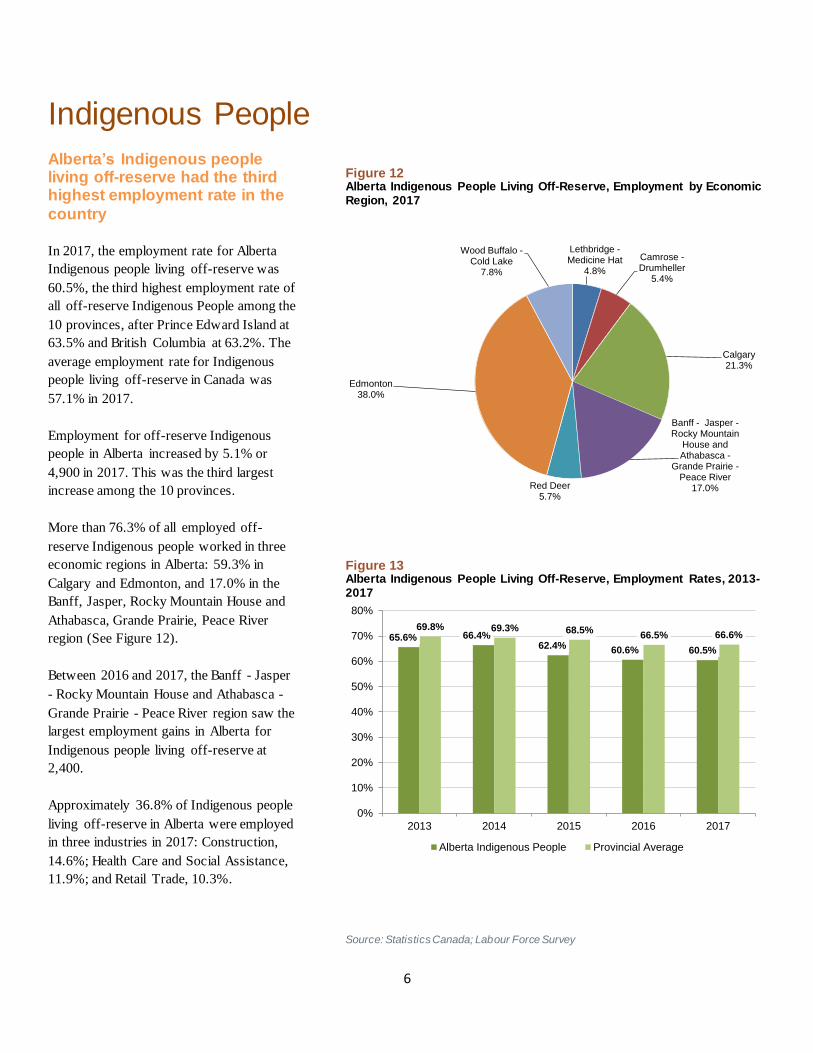
Indigenous People
Alberta’s Indigenous people living off-reserve had the third highest employment rate in the
country
In 2017, the employment rate for Alberta
Indigenous people living off-reserve was
60.5%, the third highest employment rate of
all off-reserve Indigenous People among the
10 provinces, after Prince Edward Island at
63.5% and British Columbia at 63.2%. The
average employment rate for Indigenous
people living off-reserve in Canada was
57.1% in 2017.
Employment for off-reserve Indigenous
people in Alberta increased by 5.1% or
4,900 in 2017. This was the third largest
increase among the 10 provinces.
More than 76.3% of all employed off-
reserve Indigenous people worked in three
economic regions in Alberta: 59.3% in
Calgary and Edmonton, and 17.0% in the
Banff, Jasper, Rocky Mountain House and
Athabasca, Grande Prairie, Peace River
region (See Figure 12).
Between 2016 and 2017, the Banff - Jasper
- Rocky Mountain House and Athabasca -
Grande Prairie - Peace River region saw the
largest employment gains in Alberta for
Indigenous people living off-reserve at
2,400.
Approximately 36.8% of Indigenous people
living off-reserve in Alberta were employed
in three industries in 2017: Construction,
14.6%; Health Care and Social Assistance,
11.9%; and Retail Trade, 10.3%.
Figure 12 Alberta Indigenous People Living Off-Reserve, Employment by Economic Region, 2017
Figure 13 Alberta Indigenous People Living Off-Reserve, Employment Rates, 2013-2017
Source: Statistics Canada; Labour Force Survey
Lethbridge -Medicine Hat
4.8%
Camrose -Drumheller
5.4%
Calgary21.3%
Banff - Jasper -Rocky Mountain
House and Athabasca -
Grande Prairie -Peace River
17.0%Red Deer5.7%
Edmonton38.0%
Wood Buffalo -Cold Lake
7.8%
65.6% 66.4%62.4% 60.6% 60.5%
69.8% 69.3% 68.5%66.5% 66.6%
0%
10%
20%
30%
40%
50%
60%
70%
80%
2013 2014 2015 2016 2017
Alberta Indigenous People Provincial Average
7
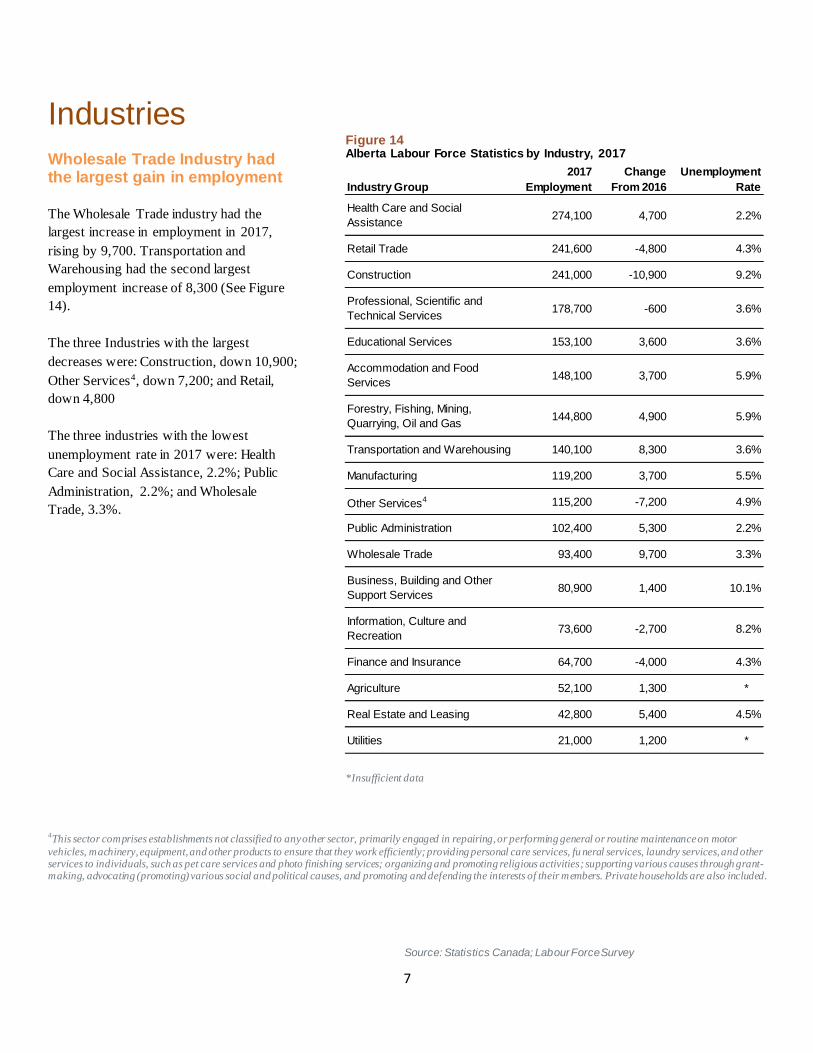
Industries
Wholesale Trade Industry had the largest gain in employment
The Wholesale Trade industry had the
largest increase in employment in 2017,
rising by 9,700. Transportation and
Warehousing had the second largest
employment increase of 8,300 (See Figure
14).
The three Industries with the largest
decreases were: Construction, down 10,900;
Other Services4, down 7,200; and Retail,
down 4,800
The three industries with the lowest
unemployment rate in 2017 were: Health
Care and Social Assistance, 2.2%; Public
Administration, 2.2%; and Wholesale
Trade, 3.3%.
Figure 14 Alberta Labour Force Statistics by Industry, 2017
*Insufficient data
4This sector comprises establishments not classified to any other sector, primarily engaged in repairing, or performing general or routine maintenance on motor
vehicles, machinery, equipment, and other products to ensure that they work efficiently; providing personal care services, fu neral services, laundry services, and other services to individuals, such as pet care services and photo finishing services; organizing and promoting religious activities; supporting various causes through grant-making, advocating (promoting) various social and political causes, and promoting and defending the interests of their members. Private households are also included.
Source: Statistics Canada; Labour Force Survey
2017 Change
Industry Group Employment From 2016
Health Care and Social
Assistance274,100 4,700 2.2%
Retail Trade 241,600 -4,800 4.3%
Construction 241,000 -10,900 9.2%
Professional, Scientific and
Technical Services178,700 -600 3.6%
Educational Services 153,100 3,600 3.6%
Accommodation and Food
Services148,100 3,700 5.9%
Forestry, Fishing, Mining,
Quarrying, Oil and Gas144,800 4,900 5.9%
Transportation and Warehousing 140,100 8,300 3.6%
Manufacturing 119,200 3,700 5.5%
Other Services4 115,200 -7,200 4.9%
Public Administration 102,400 5,300 2.2%
Wholesale Trade 93,400 9,700 3.3%
Business, Building and Other
Support Services80,900 1,400 10.1%
Information, Culture and
Recreation73,600 -2,700 8.2%
Finance and Insurance 64,700 -4,000 4.3%
Agriculture 52,100 1,300 *
Real Estate and Leasing 42,800 5,400 4.5%
Utilities 21,000 1,200 *
Unemployment
Rate

8
Occupations
Natural resources, agriculture and related production
occupations had the largest employment gain
In 2017, employment rose for six of the 10
occupational groups in Alberta. Natural
resources, agriculture and related
production occupations had the largest
increase at 14,300, followed by
Management occupations with an increase
of 13,600 (See Figure 15).
The four occupational groups with decline
in employment in 2017 were: Trades,
transport and equipment operators and
related occupations, down 4,500; Art,
culture, recreation and sport, down 4,100,
Health, down 3,600, and Business, finance
and administration, down 3,000.
Three occupational groups had
unemployment rates below 3.0%:
Management occupations, at 1.8%;
occupations in Health, 1.8%; and
Education, law and social, community and
government services occupations, at 2.6%.
Figure 15 Alberta Labour Force Statistics by Occupation, 2017
*Insufficient data
Source: Statistics Canada; Labour Force Survey
2017
Occupations Employment
Management 217,700 13,600 1.8%
Business, finance and
administration365,600 -3,000 4.1%
Natural and applied
sciences and related
occupations
183,700 5,200 4.9%
Health 160,800 -3,600 1.8%
Education, law and
social, community and
government services
236,700 200 2.6%
Art, culture, recreation
and sport47,800 -4,100 6.3%
Sales and service 515,500 3,500 5.6%
Trades, transport and
equipment operators and
related occupations
403,500 -4,500 8.1%
Natural resources,
agriculture and related
production occupations
88,700 14,300 7.2%
Occupations in
manufacturing and
utilities
67,000 1,600 4.6%
Change Unemployment
from 2016 Rate
9
Education
The proportion of Alberta’s labour force with diplomas or
degrees continues to rise
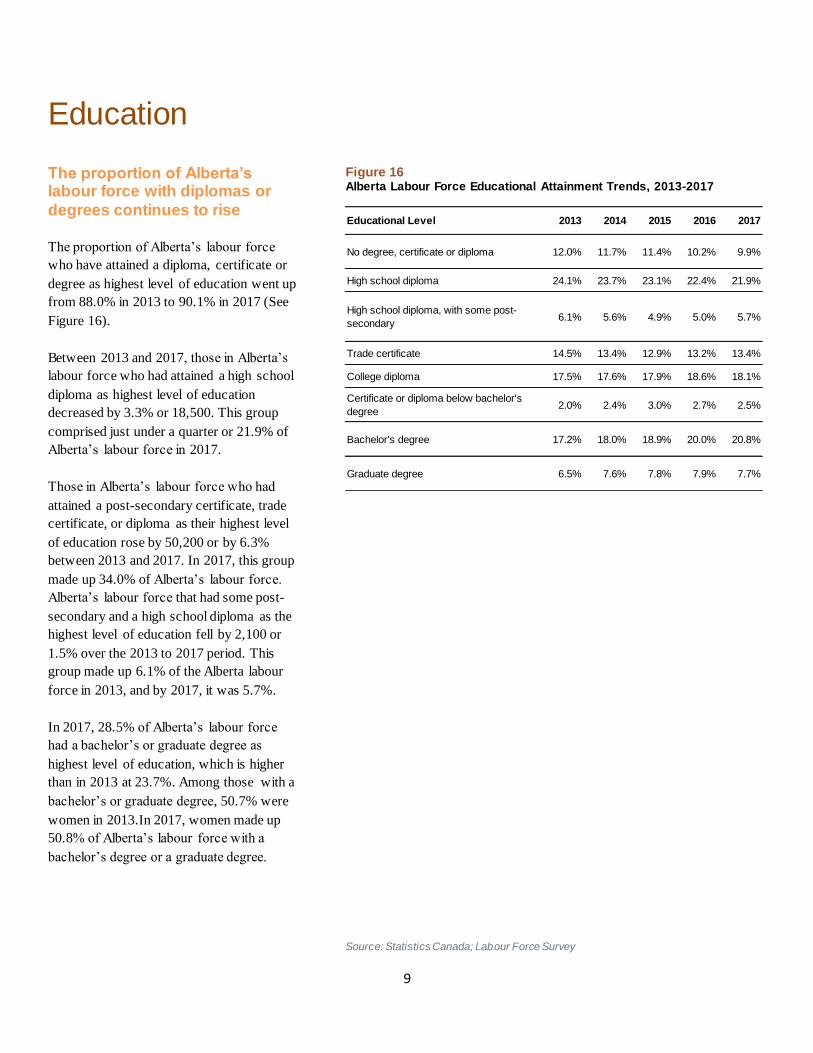
The proportion of Alberta’s labour force
who have attained a diploma, certificate or
degree as highest level of education went up
from 88.0% in 2013 to 90.1% in 2017 (See
Figure 16).
Between 2013 and 2017, those in Alberta’s
labour force who had attained a high school
diploma as highest level of education
decreased by 3.3% or 18,500. This group
comprised just under a quarter or 21.9% of
Alberta’s labour force in 2017.
Those in Alberta’s labour force who had
attained a post-secondary certificate, trade
certificate, or diploma as their highest level
of education rose by 50,200 or by 6.3%
between 2013 and 2017. In 2017, this group
made up 34.0% of Alberta’s labour force.
Alberta’s labour force that had some post-
secondary and a high school diploma as the
highest level of education fell by 2,100 or
1.5% over the 2013 to 2017 period. This
group made up 6.1% of the Alberta labour
force in 2013, and by 2017, it was 5.7%.
In 2017, 28.5% of Alberta’s labour force
had a bachelor’s or graduate degree as
highest level of education, which is higher
than in 2013 at 23.7%. Among those with a
bachelor’s or graduate degree, 50.7% were
women in 2013.In 2017, women made up
50.8% of Alberta’s labour force with a
bachelor’s degree or a graduate degree.
Figure 16 Alberta Labour Force Educational Attainment Trends, 2013-2017
Source: Statistics Canada; Labour Force Survey
Educational Level 2013 2014 2015 2016 2017
No degree, certificate or diploma 12.0% 11.7% 11.4% 10.2% 9.9%
High school diploma 24.1% 23.7% 23.1% 22.4% 21.9%
High school diploma, with some post-
secondary6.1% 5.6% 4.9% 5.0% 5.7%
Trade certificate 14.5% 13.4% 12.9% 13.2% 13.4%
College diploma 17.5% 17.6% 17.9% 18.6% 18.1%
Certificate or diploma below bachelor's
degree2.0% 2.4% 3.0% 2.7% 2.5%
Bachelor's degree 17.2% 18.0% 18.9% 20.0% 20.8%
Graduate degree 6.5% 7.6% 7.8% 7.9% 7.7%
10
Demographics
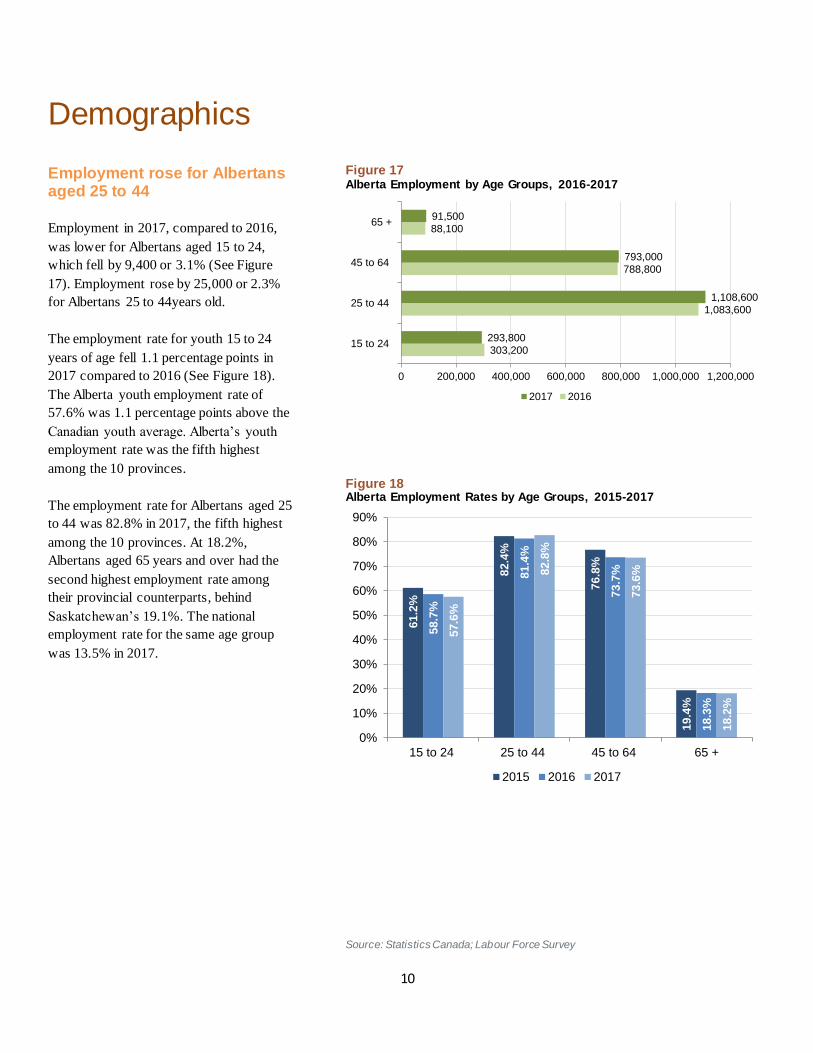
Employment rose for Albertans aged 25 to 44
Employment in 2017, compared to 2016,
was lower for Albertans aged 15 to 24,
which fell by 9,400 or 3.1% (See Figure
17). Employment rose by 25,000 or 2.3%
for Albertans 25 to 44years old.
The employment rate for youth 15 to 24
years of age fell 1.1 percentage points in
2017 compared to 2016 (See Figure 18).
The Alberta youth employment rate of
57.6% was 1.1 percentage points above the
Canadian youth average. Alberta’s youth
employment rate was the fifth highest
among the 10 provinces.
The employment rate for Albertans aged 25
to 44 was 82.8% in 2017, the fifth highest
among the 10 provinces. At 18.2%,
Albertans aged 65 years and over had the
second highest employment rate among
their provincial counterparts, behind
Saskatchewan’s 19.1%. The national
employment rate for the same age group
was 13.5% in 2017.
Figure 17 Alberta Employment by Age Groups, 2016-2017
Figure 18 Alberta Employment Rates by Age Groups, 2015-2017
Source: Statistics Canada; Labour Force Survey
303,200
1,083,600
788,800
88,100
293,800
1,108,600
793,000
91,500
0 200,000 400,000 600,000 800,000 1,000,000 1,200,000
15 to 24
25 to 44
45 to 64
65 +
2017 2016
61
.2%
82.4
%
76.8
%
19.4
%
58.7
%
81.4
%
73.7
%
18.3
%
57
.6%
82.8
%
73.6
%
18.2
%0%
10%
20%
30%
40%
50%
60%
70%
80%
90%
15 to 24 25 to 44 45 to 64 65 +
2015 2016 2017
11
Call us or visit our website for more information or to find the following publications: • Annual Alberta Regional Labour Market Review • Monthly Alberta Labour Force Statistics Highlights and Packages • Alberta’s Occupational Demand and Supply Outlook • Alberta Labour Force Profiles • Alberta Industry Profiles
http://work.alberta.ca/labour.html (see Labour Market Information) In Edmonton: 780.422.4266 Long distance: 1.800.661.3753 © 2017 Gov ernment of Alberta.
Published: February 2018.
ISBN 978-1-4601-3764-2 ISSN 1704-2925