ocean thermal advective effect on the annual range of...
TRANSCRIPT

Ocean thermal advective effect on the annual range of sea surface
temperature
Qinyu Liu,1 Shang-Ping Xie,1,2,3 Lijuan Li,1 and Nikolai A. Maximenko2
Received 1 September 2005; revised 31 October 2005; accepted 8 November 2005; published 17 December 2005.
[1] Spatial variations in the seasonal cycle of sea surfacetemperature (SST) are studied over the western NorthPacific using a high-resolution climatology. In addition tomonsoon, bathymetry and tidal mixing, western boundarycurrents and their extensions/branches are found to have asignificant effect on the annual range of SST, with reducedvalues on the paths of warm currents and increased ones onthe paths of cold currents. This is due to the asymmetriceffect of ocean currents on SST in time: small in summerbut large in winter when both the deepened mixed layer andincreased SST gradients enhance the relative importance ofocean thermal advection to balance the heat flux to theatmosphere. Along with recent studies of decadalvariability, our results reaffirm the role of ocean dynamicsin climate. Citation: Liu, Q., S.-P. Xie, L. Li, and N. A.
Maximenko (2005), Ocean thermal advective effect on the annual
range of sea surface temperature, Geophys. Res. Lett., 32, L24604,
doi:10.1029/2005GL024493.
1. Introduction
[2] The seasonal cycle is the largest and best observedclimate variation on Earth. To first order, it is a direct resultof the seasonal variation in incoming solar radiation butsignificantly modified by additional factors such as thesurface properties, the circulation and interaction of theocean and atmosphere. The seasonal cycle in surface airtemperature (SAT) is generally much larger over continentsthan over the oceans of the same latitudes because the heatcontent of soil involved in seasonal variations is muchsmaller than that of the ocean. This land-sea contrast is solarge that one does not need a world map to identify majorcontinents in the extratropics from a map of the annual SATrange [e.g., Gill, 1982]. Here the annual range is defined asthe difference between the maximum and minimum valuesof a long-term climatology.[3] Ocean currents transport large amounts of heat and
are considered as an important mechanism for sea surfacetemperature (SST) variations. This effect of ocean currentson SST’s seasonal cycle has not been adequately mappedand studied because the paucity of ship-based observationsdoes not resolve major currents that are generally only
100 km wide. The advent of space-borne Advanced VeryHigh Resolution Radiometer (AVHRR) in 1981 makesroutine SST measurements possible over the global ocean.The frequent presence of clouds poses a serious challengefor infrared SST measurements but long-term accumulationof AVHRR observations now allows the compilation of areliable and high-resolution SST climatology. Here, weanalyze such a high-resolution SST climatology and studythe spatial structure of the SST annual range and the effectsof major ocean currents in particular.[4] The paper is organized as follows. Section 2
introduces the datasets. Section 3 describes the generalfeatures of the SST annual range while Section 4 focuseson the advective effect by major ocean currents in thewestern North Pacific and its marginal seas. Section 5 isa summary.
2. Data
[5] The global SST climatology of Armstrong andVazquez-Cuervo [2001], based on satellite AVHRR mea-surements for a 15-year period of 1985–1999 and availableat a pentad (5 days) interval and on a 9 km grid, is used forthe SST annual range analysis.[6] To calculate surface geostrophic current, we use the
Aviso sea level anomaly (SLA) dataset that merges Euro-pean Remote Sensing (ERS) and TOPEX/Poseidon (T/P)altimetry observations [Ducet et al., 2000], available at a10-day interval on a 0.25� � 0.25� grid for the period fromOctober 1992 to August 2001. To obtain the full sea surfaceheight (SSH) we add the 1992–2002 mean dynamic topog-raphy derived from a synthesis of the GRACE, Aviso,drifter and NCAR/NCEP wind data based on a momentumbalance requirement [Maximenko and Niiler, 2005; Niiler etal., 2003].[7] The COADS (Comprehensive Ocean and Atmo-
sphere Dataset) surface net heat flux climatology on a 1�grid is also used here. To calculate the ocean advectiveeffect on SST, we use the Naval Research Laboratorymixed-layer depth monthly climatology derived from his-torical hydrographic data on a 1� grid [Kara et al., 2003;http://www7320.nrlssc.navy.mil/nmld/nmld.html].
3. SST Annual Range
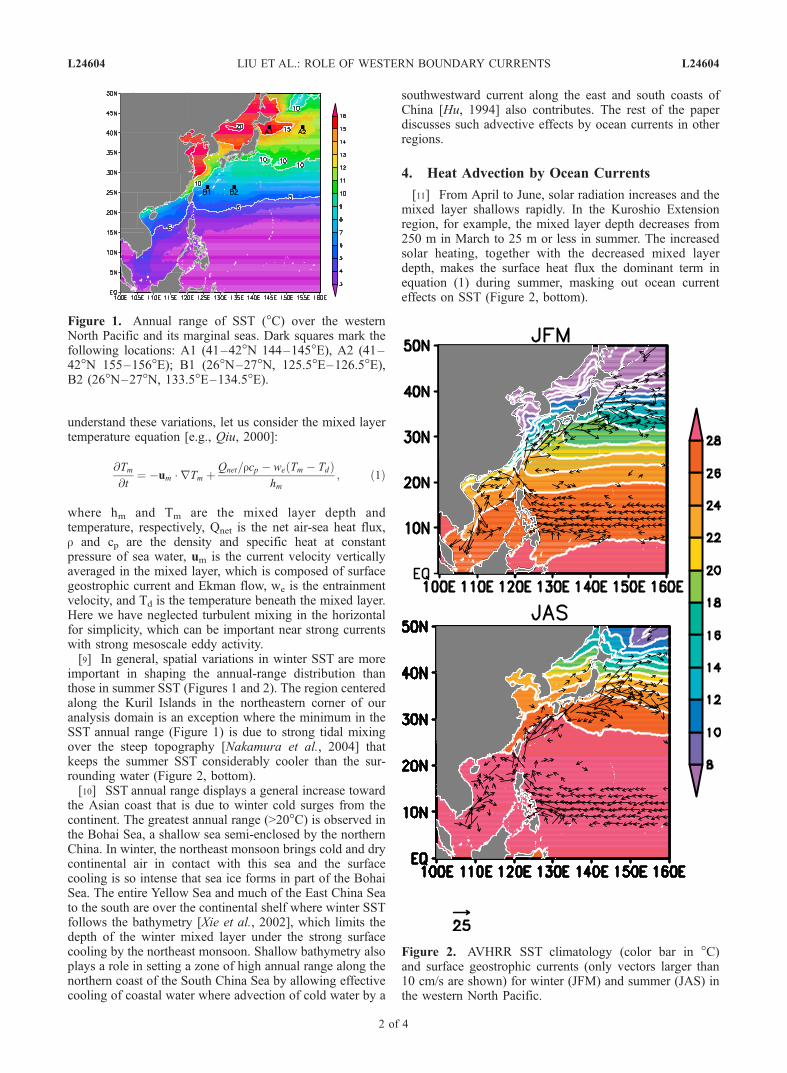
[8] Figure 1 shows the SST annual range based on theAVHRR observations over the western North Pacific andsurrounding seas. Over the open ocean, the annual rangeincreases northward up to 40�N with little zonal variations,as one would expect from the seasonal cycle in solarforcing. The annual range displays rich variations in themarginal seas near the continent, however. In order to
GEOPHYSICAL RESEARCH LETTERS, VOL. 32, L24604, doi:10.1029/2005GL024493, 2005
1Physical Oceanography Laboratory and Ocean-Atmosphere Interactionand Climate Laboratory, Ocean University of China, Qingdao, China.
2International Pacific Research Center, School of Ocean and EarthScience and Technology, University of Hawaii at Manoa, Honolulu,Hawaii, USA.
3Department of Meteorology, University of Hawaii at Manoa,Honolulu, USA.
Copyright 2005 by the American Geophysical Union.0094-8276/05/2005GL024493$05.00
L24604 1 of 4
understand these variations, let us consider the mixed layertemperature equation [e.g., Qiu, 2000]:
@Tm@t
¼ �um � rTm þ Qnet=rcp � we Tm � Tdð Þhm
; ð1Þ
where hm and Tm are the mixed layer depth andtemperature, respectively, Qnet is the net air-sea heat flux,r and cp are the density and specific heat at constantpressure of sea water, um is the current velocity verticallyaveraged in the mixed layer, which is composed of surfacegeostrophic current and Ekman flow, we is the entrainmentvelocity, and Td is the temperature beneath the mixed layer.Here we have neglected turbulent mixing in the horizontalfor simplicity, which can be important near strong currentswith strong mesoscale eddy activity.[9] In general, spatial variations in winter SST are more
important in shaping the annual-range distribution thanthose in summer SST (Figures 1 and 2). The region centeredalong the Kuril Islands in the northeastern corner of ouranalysis domain is an exception where the minimum in theSST annual range (Figure 1) is due to strong tidal mixingover the steep topography [Nakamura et al., 2004] thatkeeps the summer SST considerably cooler than the sur-rounding water (Figure 2, bottom).[10] SST annual range displays a general increase toward
the Asian coast that is due to winter cold surges from thecontinent. The greatest annual range (>20�C) is observed inthe Bohai Sea, a shallow sea semi-enclosed by the northernChina. In winter, the northeast monsoon brings cold and drycontinental air in contact with this sea and the surfacecooling is so intense that sea ice forms in part of the BohaiSea. The entire Yellow Sea and much of the East China Seato the south are over the continental shelf where winter SSTfollows the bathymetry [Xie et al., 2002], which limits thedepth of the winter mixed layer under the strong surfacecooling by the northeast monsoon. Shallow bathymetry alsoplays a role in setting a zone of high annual range along thenorthern coast of the South China Sea by allowing effectivecooling of coastal water where advection of cold water by a
southwestward current along the east and south coasts ofChina [Hu, 1994] also contributes. The rest of the paperdiscusses such advective effects by ocean currents in otherregions.
4. Heat Advection by Ocean Currents
[11] From April to June, solar radiation increases and themixed layer shallows rapidly. In the Kuroshio Extensionregion, for example, the mixed layer depth decreases from250 m in March to 25 m or less in summer. The increasedsolar heating, together with the decreased mixed layerdepth, makes the surface heat flux the dominant term inequation (1) during summer, masking out ocean currenteffects on SST (Figure 2, bottom).
Figure 1. Annual range of SST (�C) over the westernNorth Pacific and its marginal seas. Dark squares mark thefollowing locations: A1 (41–42�N 144–145�E), A2 (41–42�N 155–156�E); B1 (26�N–27�N, 125.5�E–126.5�E),B2 (26�N–27�N, 133.5�E–134.5�E).
Figure 2. AVHRR SST climatology (color bar in �C)and surface geostrophic currents (only vectors larger than10 cm/s are shown) for winter (JFM) and summer (JAS) inthe western North Pacific.
L24604 LIU ET AL.: ROLE OF WESTERN BOUNDARY CURRENTS L24604
2 of 4
[12] In winter, ocean advective heat transport generallyintensifies as SST gradients increase with the enhancedmeridional gradient in solar radiation and in the presenceof the cold Asian continent. This increased ocean heat
transport, together with the deepened mixed layer (increasedhm in equation (1)), increases the relative importance of theadvection term, enabling it to imprint on winter SST andhence the SST annual range (e.g., along the Kuroshio;Figures 1 and 2, top). (See a related discussion on advectiveeffects on interannual SST variability by Tomita et al.[2002].) A warm current flowing down the SST gradientreduces the annual range by keeping winter SST higher thanthe surrounding while a cold current increases the annualrange. The following analysis supports this asymmetriceffect of ocean heat advection on SST between winter andsummer.[13] Surface geostrophic current vectors are superim-
posed in Figure 2 to infer their advective effects. Alongthe continental shelf break south of Vietnam that separatesthe shallow Sunda shelf to the west and the deep SouthChina Sea basin to the east, a strong southward current—which Liu et al. [2004] call the Sunda Slope Current—develops in winter as the western boundary current inresponse to wind stress curls of the northeast monsoon,advecting cold water from the north and producing a coldtongue (Figure 2, top) [Liu et al., 2004]. This contrasts withsummer SST that is nearly uniform in the horizontal. Thusthe cold advection leaves a distinct maximum in SST annualrange along the continental slope near the Sunda shelf.[14] The Kuroshio is the major warm current in the
western North Pacific, beginning its northward flow westof the Philippines, continuing north along the continentalbreak in the East China Sea, and finally separating from theJapanese coast at around 35�N. The Kuroshio’s effect onSST is most readily seen in snapshot satellite images as astream of warm water. It also leaves a visible signature inthe climatological SST annual range as a local minimumthat is about 1�C less in value than over the open ocean atthe same latitudes. At the Tokara Strait south of Japan’sKyushu Island, the Kuroshio’s main stream exits the EastChina Sea but a minor branch continues northwest ofKyushu and enters the Sea of Japan through the TsushimaStrait between Korea and Japan. This minor Tsushimabranch of the Kuroshio leaves a tongue of minimum annualrange on its path in the East China Sea, in the TsushimaStrait, and off the coast of Honshu Island in the Sea ofJapan.[15] Next we carry out a local analysis of the seasonal
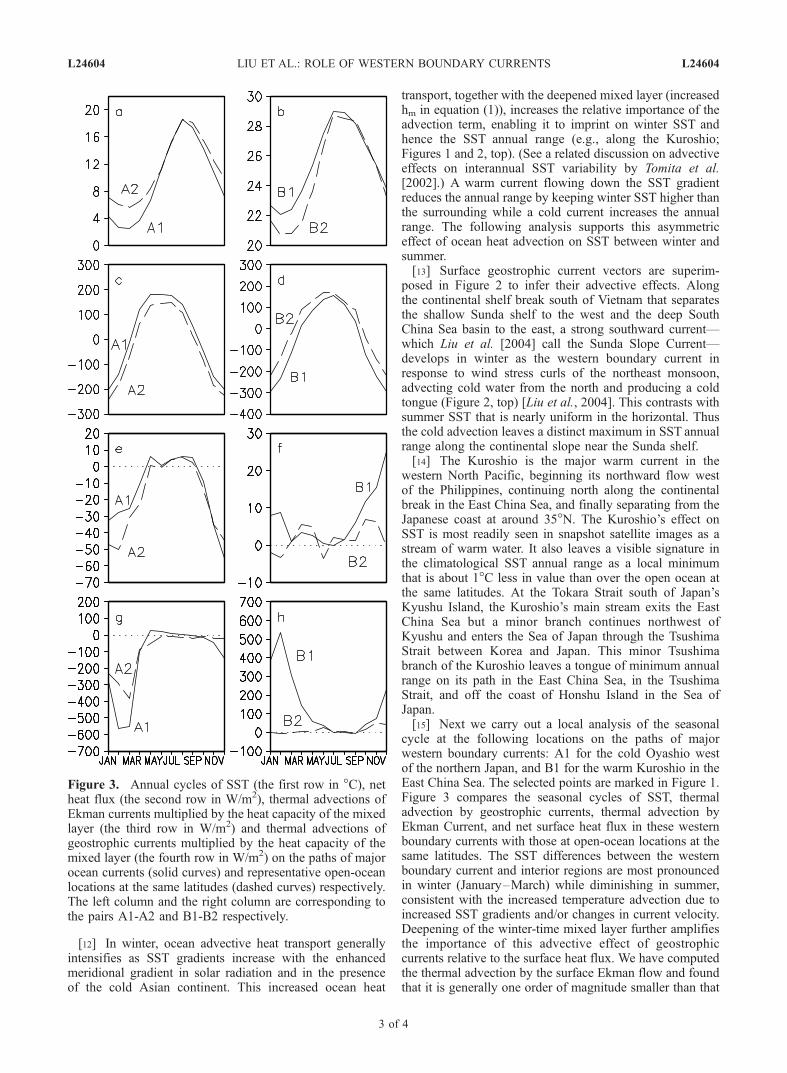
cycle at the following locations on the paths of majorwestern boundary currents: A1 for the cold Oyashio westof the northern Japan, and B1 for the warm Kuroshio in theEast China Sea. The selected points are marked in Figure 1.Figure 3 compares the seasonal cycles of SST, thermaladvection by geostrophic currents, thermal advection byEkman Current, and net surface heat flux in these westernboundary currents with those at open-ocean locations at thesame latitudes. The SST differences between the westernboundary current and interior regions are most pronouncedin winter (January–March) while diminishing in summer,consistent with the increased temperature advection due toincreased SST gradients and/or changes in current velocity.Deepening of the winter-time mixed layer further amplifiesthe importance of this advective effect of geostrophiccurrents relative to the surface heat flux. We have computedthe thermal advection by the surface Ekman flow and foundthat it is generally one order of magnitude smaller than that
Figure 3. Annual cycles of SST (the first row in �C), netheat flux (the second row in W/m2), thermal advections ofEkman currents multiplied by the heat capacity of the mixedlayer (the third row in W/m2) and thermal advections ofgeostrophic currents multiplied by the heat capacity of themixed layer (the fourth row in W/m2) on the paths of majorocean currents (solid curves) and representative open-oceanlocations at the same latitudes (dashed curves) respectively.The left column and the right column are corresponding tothe pairs A1-A2 and B1-B2 respectively.
L24604 LIU ET AL.: ROLE OF WESTERN BOUNDARY CURRENTS L24604
3 of 4
by geostrophic western boundary currents. The South ChinaSea south of 10�N is an exception where the Ekmanadvection is strong because of low latitudes, displacing thecold tongue west of the Sunda Slope that steers a strongsouthward cold current in winter (Figure 2, top) [Liu et al.,2004]. Surface heat flux is a damping that acts to reduce theocean advective effect in winter, by cooling the ocean moreover the warm Kuroshio Current than the interior and viceversa over the cold Oyashio. Thus, the effect of the westernboundary current on SST annual range is mainly due to itseffect on winter SST. Cold currents (A1 in Figure 1) enhancethe annual range while warm currents (B1) reduce it.
5. Discussion
[16] We have analyzed the annual range of SST over thewestern North Pacific using a high-resolution climatologybased on long-term satellite observations. While the annualrange over the open ocean is relatively zonally uniform, itincreases toward the Asian coast and displays rich varia-tions in the marginal seas because of bathymetry and/ortidal mixing. The thermal advection by ocean currents isshown to have a significant effect on SST annual range, byits asymmetrically large influence on winter SST butwithout changing summer SST much. As a result, warmcurrents such as the Kuroshio and its Tsushima branchreduce the annual range of SST while cold currents suchas the Oyashio and the South China Sea’s Sunda SlopeCurrent increases it.[17] The ocean advection effect on SST and its annual
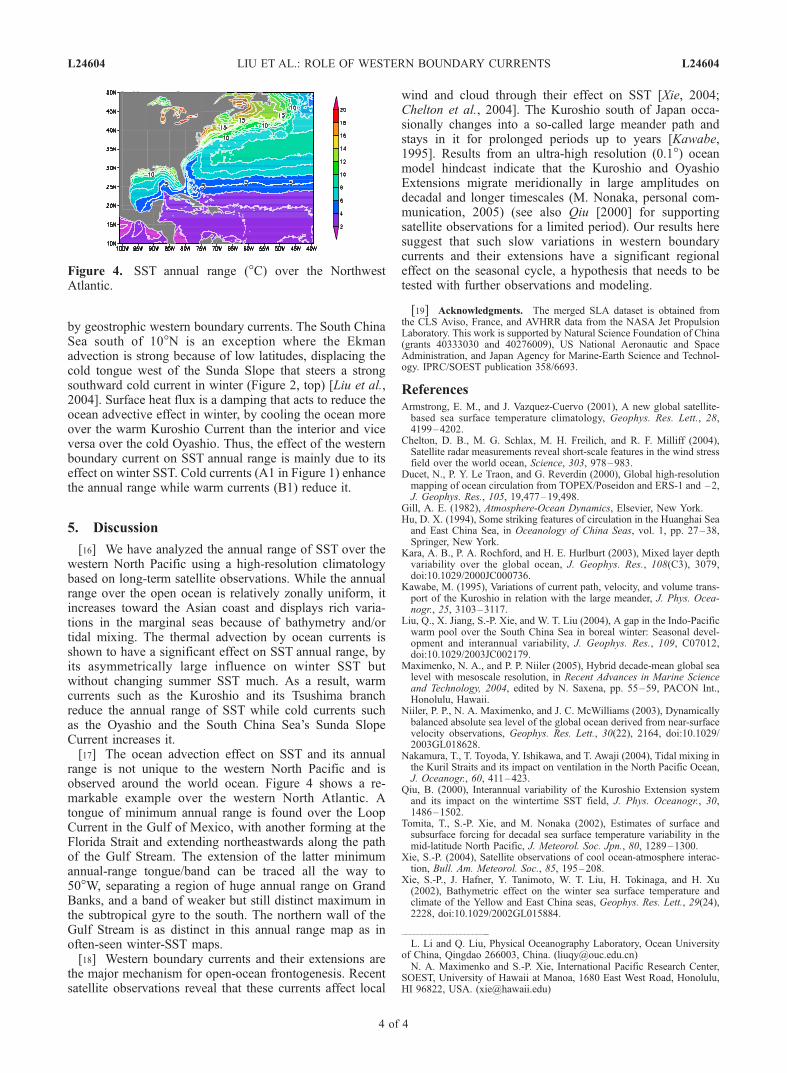
range is not unique to the western North Pacific and isobserved around the world ocean. Figure 4 shows a re-markable example over the western North Atlantic. Atongue of minimum annual range is found over the LoopCurrent in the Gulf of Mexico, with another forming at theFlorida Strait and extending northeastwards along the pathof the Gulf Stream. The extension of the latter minimumannual-range tongue/band can be traced all the way to50�W, separating a region of huge annual range on GrandBanks, and a band of weaker but still distinct maximum inthe subtropical gyre to the south. The northern wall of theGulf Stream is as distinct in this annual range map as inoften-seen winter-SST maps.[18] Western boundary currents and their extensions are
the major mechanism for open-ocean frontogenesis. Recentsatellite observations reveal that these currents affect local
wind and cloud through their effect on SST [Xie, 2004;Chelton et al., 2004]. The Kuroshio south of Japan occa-sionally changes into a so-called large meander path andstays in it for prolonged periods up to years [Kawabe,1995]. Results from an ultra-high resolution (0.1�) oceanmodel hindcast indicate that the Kuroshio and OyashioExtensions migrate meridionally in large amplitudes ondecadal and longer timescales (M. Nonaka, personal com-munication, 2005) (see also Qiu [2000] for supportingsatellite observations for a limited period). Our results heresuggest that such slow variations in western boundarycurrents and their extensions have a significant regionaleffect on the seasonal cycle, a hypothesis that needs to betested with further observations and modeling.
[19] Acknowledgments. The merged SLA dataset is obtained fromthe CLS Aviso, France, and AVHRR data from the NASA Jet PropulsionLaboratory. This work is supported by Natural Science Foundation of China(grants 40333030 and 40276009), US National Aeronautic and SpaceAdministration, and Japan Agency for Marine-Earth Science and Technol-ogy. IPRC/SOEST publication 358/6693.
ReferencesArmstrong, E. M., and J. Vazquez-Cuervo (2001), A new global satellite-based sea surface temperature climatology, Geophys. Res. Lett., 28,4199–4202.
Chelton, D. B., M. G. Schlax, M. H. Freilich, and R. F. Milliff (2004),Satellite radar measurements reveal short-scale features in the wind stressfield over the world ocean, Science, 303, 978–983.
Ducet, N., P. Y. Le Traon, and G. Reverdin (2000), Global high-resolutionmapping of ocean circulation from TOPEX/Poseidon and ERS-1 and –2,J. Geophys. Res., 105, 19,477–19,498.
Gill, A. E. (1982), Atmosphere-Ocean Dynamics, Elsevier, New York.Hu, D. X. (1994), Some striking features of circulation in the Huanghai Seaand East China Sea, in Oceanology of China Seas, vol. 1, pp. 27–38,Springer, New York.
Kara, A. B., P. A. Rochford, and H. E. Hurlburt (2003), Mixed layer depthvariability over the global ocean, J. Geophys. Res., 108(C3), 3079,doi:10.1029/2000JC000736.
Kawabe, M. (1995), Variations of current path, velocity, and volume trans-port of the Kuroshio in relation with the large meander, J. Phys. Ocea-nogr., 25, 3103–3117.
Liu, Q., X. Jiang, S.-P. Xie, and W. T. Liu (2004), A gap in the Indo-Pacificwarm pool over the South China Sea in boreal winter: Seasonal devel-opment and interannual variability, J. Geophys. Res., 109, C07012,doi:10.1029/2003JC002179.
Maximenko, N. A., and P. P. Niiler (2005), Hybrid decade-mean global sealevel with mesoscale resolution, in Recent Advances in Marine Scienceand Technology, 2004, edited by N. Saxena, pp. 55–59, PACON Int.,Honolulu, Hawaii.
Niiler, P. P., N. A. Maximenko, and J. C. McWilliams (2003), Dynamicallybalanced absolute sea level of the global ocean derived from near-surfacevelocity observations, Geophys. Res. Lett., 30(22), 2164, doi:10.1029/2003GL018628.
Nakamura, T., T. Toyoda, Y. Ishikawa, and T. Awaji (2004), Tidal mixing inthe Kuril Straits and its impact on ventilation in the North Pacific Ocean,J. Oceanogr., 60, 411–423.
Qiu, B. (2000), Interannual variability of the Kuroshio Extension systemand its impact on the wintertime SST field, J. Phys. Oceanogr., 30,1486–1502.
Tomita, T., S.-P. Xie, and M. Nonaka (2002), Estimates of surface andsubsurface forcing for decadal sea surface temperature variability in themid-latitude North Pacific, J. Meteorol. Soc. Jpn., 80, 1289–1300.
Xie, S.-P. (2004), Satellite observations of cool ocean-atmosphere interac-tion, Bull. Am. Meteorol. Soc., 85, 195–208.
Xie, S.-P., J. Hafner, Y. Tanimoto, W. T. Liu, H. Tokinaga, and H. Xu(2002), Bathymetric effect on the winter sea surface temperature andclimate of the Yellow and East China seas, Geophys. Res. Lett., 29(24),2228, doi:10.1029/2002GL015884.
�����������������������L. Li and Q. Liu, Physical Oceanography Laboratory, Ocean University
of China, Qingdao 266003, China. ([email protected])N. A. Maximenko and S.-P. Xie, International Pacific Research Center,
SOEST, University of Hawaii at Manoa, 1680 East West Road, Honolulu,HI 96822, USA. ([email protected])
Figure 4. SST annual range (�C) over the NorthwestAtlantic.
L24604 LIU ET AL.: ROLE OF WESTERN BOUNDARY CURRENTS L24604
4 of 4