ocr as and a level physics a delivery guide - · pdf filephysics a as and a level delivery...
TRANSCRIPT

PHYSICS A
AS and A LEVELDelivery Guide
H156/H556
Theme: WavesAugust 2015

We will inform centres about any changes to the specification. We will also publish changes on our website. The latest version of our specification will always be the one on our website (www.ocr.org.uk) and this may differ from printed versions.
Copyright © 2015 OCR. All rights reserved.
Copyright OCR retains the copyright on all its publications, including the specifications. However, registered centres for OCR are permitted to copy material from this specification booklet for their own internal use.
Oxford Cambridge and RSA Examinations is a Company Limited by Guarantee. Registered in England. Registered company number 3484466.
Registered office: 1 Hills Road Cambridge CB1 2EU
OCR is an exempt charity.
3
CONTENTS
Introduction Page 4
Curriculum Content Page 5
Thinking Conceptually Page 10
Thinking Contextually Page 21
Learner Resources Page 23
Teacher Answers Page 35
AS and A LEVELPHYSICS A
4
Delivery guides are designed to represent a body of knowledge about teaching a particular topic and contain:
• Content: a clear outline of the content covered by the delivery guide;
• Thinking Conceptually: expert guidance on the key concepts involved, common difficulties students may have, approaches to teaching that can help students understand these concepts and how this topic links conceptually to other areas of the subject;
• Thinking Contextually: a range of suggested teaching activities using a variety of themes so that different activities can be selected that best suit particular classes, learning styles or teaching approaches.
If you have any feedback on this Delivery Guide or suggestions for other resources you would like OCR to develop, please email [email protected].
KEYClick to view associated resources within this document.
Click to view external resources
Introduction
only AS Level content only

5
Section 4.4 WavesThis section provides knowledge and understanding of wave properties, electromagnetic waves, superposition and stationary waves. The wavelength of visible light is too small to be measured directly using a ruler. However, superposition experiments can be done in the laboratory to determine wavelength of visible light using a laser and a double slit.
There are opportunities to discuss how the double-slit experiment demonstrates the wave-like behaviour of light (HSW7).
The breadth of the topic covering sound waves and the electromagnetic spectrum provides scope for students to appreciate the wide-ranging applications of waves and their properties (HSW1, 2, 5, 8, 9, 12).
Students should be able to demonstrate and apply their knowledge and understanding of:
4.4.1 Wave motion(a) progressive waves; longitudinal and transverse waves
(b) (i) displacement, amplitude, wavelength, period, phase difference, frequency and speed of a wave
(ii) techniques and procedures used when employing an oscilloscope to determine frequency
(c) the equation
f = 1T
(d) the wave equation v = f λ
(e) graphical representations of transverse and longitudinal waves
(f ) (i) reflection, refraction, polarisation and diffraction of all waves
(ii) techniques and procedures used to demonstrate wave effects using a ripple tank
(iii) techniques and procedures used to observe polarising effects using microwaves and light
(g) intensity of a progressive wave;
I = P
A; intensity ∝ (amplitude)2.
Curriculum Content

6
Section 4.4.1 acts as an introduction to the topic of waves and is an excellent ‘bridge’ between GCSE physics and the A Level. The material covers some of the different ways of defining the different types of wave and considers the way we may discuss this motion and properties.
In particular, waves are distinguished by their:
• Oscillation phenomena (electromagnetic, sound, surface water (i.e. ripples))
• Oscillation direction (transverse and longitudinal)
• Energy transfer (progressive/travelling vs stationary/standing).
Note: The details of standing waves are considered in a later section.
Basic definitions are presented along with the general formulas which apply to all waves. Again, most are from GCSE although the material is significantly extended by considering the concept of phase/phase difference, the energy of a wave and its intensity.
The section finishes with a basic consideration of wave effects (reflection, refraction, diffraction and polarisation). These will make use of the ideas presented earlier in the section and aim to show the practical side of the material leading to the use of the physics through application.
4.4.2 Electromagnetic waves(a) electromagnetic spectrum; properties of electromagnetic waves
(b) orders of magnitude of wavelengths of the principal radiations from radio waves to gamma rays
(c) plane polarised waves; polarisation of electromagnetic waves
(d) (i) refraction of light; refractive index;
n = C
V; n sin θ = constant at a boundary where θ is the angle to the normal
(ii) techniques and procedures used to investigate refraction and total internal reflection of light using ray boxes, including transparent rectangular and semi-circular blocks
(e) critical angle; sin
C = 1
n; total internal reflection for light.
Curriculum Content

7
This section considers electromagnetic waves from radio through to gamma. The work has three main parts:
• The full EM spectrum. Students need to be familiar with the order (from low f to high and in reverse) alongside general wavelength values, general uses of the different regions and the dangers (typical of GCSE knowledge). Their familiarity with the EM spectrum should also extend to exactly what these waves are felt to be; i.e. a wave consisting of oscillating electric and magnetic fields which are both perpendicular and in-phase – obviously making use of the material from section 4.4.1 on phase and also allowing electromagnetic waves to be given as an example of transverse waves.
• The speed of light. This is considered a very important quantity (an understatement if there ever was one!) and all students should be aware that light is fastest in a vacuum and all parts of the EM spectrum travel at this same highest speed. Students should be aware that light normally interacts with materials through electric or magnetic fields and the net effect of this interaction is a change of speed.
It should be emphasised that the importance of the speed of light in a material necessitates it having its own constant – the refractive index (n) – and students should be aware of how this is defined and how it can be measured through practical investigation (not a discrete measurement).
• Refraction. This extends from the previous part, where the implications of the change of speed as light moves from one material to another are considered. The effect on wavelength should be considered as a consequence of the frequency remaining the same. The work considers the details of this effect and allows the importance of rays to be discussed in that they make the refraction angles easier to see. It is also important for students to be aware that the term refraction is referring to the direction change, not the speed change, hence there is no refraction when a wave travels along the normal or enters a material with exactly the same refractive index.
The details of this effect are considered in some depth, including the extension into total internal reflection.
4.4.3 Superposition(a) (i) the principle of superposition of waves
(ii) techniques and procedures used for superposition experiments using sound, light and microwaves
(b) graphical methods to illustrate the principle of superposition
(c) interference, coherence, path difference and phase difference
(d) constructive interference and destructive interference in terms of path difference and phase difference
Curriculum Content

8
(e) two-source interference with sound and microwaves
(f ) Young double-slit experiment using visible light
(g) (i)
l = ax
D for all waves where a << D
(ii) techniques and procedures used to determine the wavelength of light using (1) a double-slit, and (2) a diffraction grating.
This section of work considers superposition of waves (of the same type, in the same space at the same time) and its use in explaining many wave effects. There is a particular emphasis on diffraction (single-slit and multi-slit).
The basic idea of superposition being the simple addition of waves should be extended to the specific definition of the principle of superposition. This principle can be then used with the idea of phase to develop the idea of constructive and destructive interference, linking these effects to the phase difference.
Interference effects should be demonstrated with sound (e.g., beats), EM radiation (diffraction with visible light and microwaves) but could also be shown on strings, linking the work to section 4.4.4 (on standing waves).
The link between the phase difference for two sources of a wave, having the same origin, can also be used to discuss the different ways that phase can be measured. Explicitly, phase can be measured as an angle (degrees and radians) or fractions/proportions of a wavelength or period for the wave. This draws the link between phase difference, path difference and the importance of coherence.
4.4.4 Stationary Waves(a) stationary (standing) waves using microwaves, stretched strings and air columns
(b) graphical representations of a stationary wave
(c) similarities and differences between stationary and progressive waves
(d) nodes and antinodes
(e) (i) stationary wave patterns for a stretched string and for air columns in closed and open tubes
(ii) techniques and procedures used to determine the speed of sound in air by formation of stationary waves in a resonance tube
Curriculum Content

9
Curriculum Content
(f ) the idea that the separation between adjacent nodes (or antinodes) is equal to l/2, where l is the wavelength of the progressive wave
(g) fundamental mode of vibration (first harmonic); harmonics.
Standing waves are considered as an interference effect produced by the end conditions of the system. The classic systems of waves on strings and waves in pipes (open and closed) are considered with the obvious connection/context to musical instruments. EM radiation can also be considered with its application to the microwave oven.
The section requires a good understanding of how the standing wave is produced, how and why the motion along the medium changes with position in the way it does and how this allows us the distinguish between different allowed frequencies with the terms fundamental and harmonic.

10
Approaches to teaching the contentThis topic area is often considered by students to be quite dry or boring. This perception seems to often come from the fact that they have done a considerable amount on waves in previous years (e.g. GCSE) and that the work starts by considering much of the same material. When it then extends beyond that, it becomes tricky and mathematical almost instantly, and the concepts are tough because superposition of waves for example, usually requires the students to imagine the waves, that are interfering because they cannot actually see them.
This is a great shame since the topic of waves can be considered as one of the most important, they being the way that we communicate with the world around us. We not only use sound to communicate with others, but we also use electromagnetic radiation for wider communication with TV and radio. In addition, electromagnetism is effectively how electrons communicate or interact with other electrons.
The basic introduction to waves can be done through a revision of what was learnt for GCSE, continuing with the wave equation. One way of doing this could be to use a Slinky stretched across the whole lab. This necessitates moving lab furniture to create a line across the lab of between 5 and 8 m. A set of standing waves can be generated across the room from 1 half wave to 6. Some students can generate the waves while others time 10 oscillations. Another student at the board fills in a table of data, listing: wave shape, wavelength, time for 10 osc, period, frequency, f x λ. This would allow the frequency to be plotted against wavelength and then the inverse of the wavelength, to allow the wave equation to be developed experimentally.
Reflection
The law of reflection could be stated. This should be expanded, however, to include the fact that the wavefronts have the same spacing (i.e. the wavelength does not change). It is useful to develop the idea of the so-called wave effects which will become important when the students meet quantum physics. A discussion about the experimental details of reflection allows the phase difference on reflection to be discussed. This can easily be shown by looking at the PhET simulation:
https://phet.colorado.edu/sims/wave-on-a-string/wave-on-a-string_en.html
By fixing the end, the 180° phase change can be seen, while having the end free produces a 0° phase change.
Refraction
Refraction could start with a discussion of what refraction is – the bending of a wave as it moves from one material into another. It is worth pointing out that the effect is due to a speed change, usually (but not always) caused by a density change. The speed change happens without refraction if the wave moves along the normal.
The wavelength reduces when the speed reduces. A way of discussing this would be to consider three equally spaced cars moving along a country road at 60mph. The spacing of the cars would then be reduced as they drive through a village at 30mph, to then move back to their original spacing as they leave the village at 60mph again. The wavefronts would be the same as the cars – showing that the wavefronts squeeze together when the wave speed is reduced.
Thinking Conceptually
Click here

11
Thinking Conceptually
An interesting way of also showing refraction is to fill a fish tank with saturated saline. If the water is left overnight, there will be a density gradient through the depth of the water. By shining a laser pen through the liquid, the beam will be seen to follow a curved path – also a good demonstration for anyone discussing seismic waves through the Earth.
The refractive index can then be defined as being connected to the wave speed. This leads to a discussion and statement of Snell’s law.
An alternative discussion of Snell’s law could be to discuss reflection then refraction using Feynman’s many paths (see Physics B (Advancing Physics) section 4.1(a)(vii)). This would allow the conclusion that light always takes the path of shortest time and Snell’s law can be developed.
Phase and Interference
Phase can be discussed by simply considering two waves which are separated along the x-axis, using an Excel spreadsheet to add up the two waves. This also enables constructive and destructive interference to be shown.
An exercise is given which shows 12 different phases of two waves – one phase per each page. Students choose a page and then work out the phase difference to the nearest 0.1°.
Standing waves
It is important to discuss the end conditions of the standing wave. The crucial difference between a standing wave and a travelling wave is that the standing waves requires two overlapping waves to be travelling in opposite directions. The end conditions are then crucial in determining the allowed waves.
String instruments are a good example to discuss for waves on strings. The shapes can then be drawn and wavelengths calculated. Normally, the first three waves shapes are enough to allow students to see the pattern emerging in the mathematics. The wavelengths are written down, followed by the frequencies. This allows the terms fundamental and harmonic to be defined.
For waves in pipes, the same string is used but an open and a closed pipe are needed. The open pipe (or open-open) should be used first because this has an antinode at each end. This produces exactly the same equations as the guitar string, because the ends are the same.
The closed pipe (or closed-open) has an antinode and a node. This results in the loss of the even harmonics – easily shown by writing down the formulas for the allowed waves.
The above can be supported through experimentation by looking at an oscillating, tensioned string. The harmonics can be shown by adjusting the frequency from the generator. If the motion is not clear, then shining a laser pen downwards against the string also shows the motion of the string.
An investigation where the frequency and wavelength are measured as a function of tension is also easily carried out. There are numerous instruments which can be purchased that do a FFT of a voltage. One of these could be used to take a signal from either a microphone or an electric pickup – in this way, the output from a guitar can be viewed and the fundamental and harmonics measured. This would easily form the basis of some quite extensive investigations (possibly for an EPQ for example).

12
Thinking Conceptually
Rubens tube
Waves in pipes could be shown with a Rubens tube. Once started, feeding the tube with a sinusoid is a good way of showing the effect of the tube. Music can then be fed through the tube – selecting the right music is important if standing waves are to be shown. The tube is also very sensitive to bass, so music which has a strong bass can also produce interesting effects.
Chladni figures
These can be created by attaching a 20cm x 20cm aluminium plate to a vibrator and adjusting the drive frequency. The shapes produced are more easily seen if the plate is sprayed black and fine white sand is used.
Beats
Although not a formal part of the syllabus, beats is a good example of interference of two waves – travelling in the same direction, but with slightly different frequencies. It is suggested that phase is, again, the way to explain this. The difference in the period or frequency of the waves effectively changes the phase between the two waves with time. This leads to a movement from constructive to destructive interference with time – an Excel spreadsheet has been produced to show this.
The effect can also be produced by having two speakers, independently fed from their own frequency generator. Adjusting the frequencies can show the effect. It is also interesting to point out that one frequency is heard when the two frequencies are close together, but when they are far apart, the two individual frequencies are clearly distinguished. This can be shown in an Excel spreadsheet but also heard
from the two speakers. It would be good to slowly move the two frequencies apart and ask the students when they feel they can hear two frequencies rather than one.
Diffraction – single-slit
Typically, a teacher will show single-slit diffraction by shining light from a laser pen through a single slit. It is however, interesting to show the effect with a single edge first. The process could be:
• Shine an approved laser from the back of a lab onto a white board.
• Hold a piece of card with a straight edge in a retort stand (+ boss and clamp). Move the edge of the piece of card to the edge of the beam of light by moving the retort stand and then watch the diffraction effect on the board.
• Put a single slit in the way of the laser and see the full single-slit diffraction pattern – make sure it is horizontal on the board.
• Ask students to stand next to the board and draw an x-axis just under the pattern. Then asked them to try to sketch what they feel the intensity pattern looks like. They should be able to see the peaks and troughs.
• Take a photo of their pattern, then remove it from the board and also take a photo of the actual laser pattern.
• Using a program such as ImageJ, the diffraction image can be analysed and the intensity variation shown to be like those given in the text books.
The above is an interactive way for the students to learn about the single-slit diffraction pattern and should thus help to give them a better chance of recalling its features. It also allows the students to take their own photos (with a smart phone) of the pattern and analyse it themselves (using Image J).

13
Thinking Conceptually
• The work can then be used to move onto two slits and Young’s experiment.
Multi-slit diffraction can be described as a set of equal intensity peaks which have their intensity then reduced by the single-slit pattern acting on them as an envelope. Visually, the effect could also be shown using a pin art frame – create a set of equal height peaks in the pins and then use a cereal bowl to lower them.
Young’s pattern should be discussed in light of the single-slit pattern by asking how the single-slit pattern is able to produce equal intensity peaks. This leads to the idea that the two slits should be the same size (or the pattern becomes more complex) and the slit width should be very small.
Experimentally, a diffraction pattern can be set up with a laser pen shining through a grating. The diverging beams can be seen by using a sheet of white photocopy paper in front of the grating – the beams are shown on the surface of the paper and, by moving the paper away from the grating, the diverging nature of the beams is clear. A fogger could also be used to see the beams through the lab – students like foggers!
If practicable, attach the diffraction grating to a motor and rotate the grating – this produces a set of nested cones which are impressive when seen with a fogger.
The explanation of multi-slit diffraction can be approached from the point of view that this is a wave effect which produces maximum and minimum effects and, like all such wave effects, phase explains the result through the condition for constructive and destructive interference. Applying this to the single-slit is more complex because it does not seem
that there is anything to produce interference. Explaining that the single slit can be considered as having a set of (Huygens) wavelets across it, and that these are producing the interference pattern, is not easy for students to follow.
Polarisation
Polarisation is a relatively simple effect which students do find quite complex. This may be because they need to consider the electric and magnetic nature of the EM wave and also the horizontal and vertical components – none of which can actually be seen, of course. Describing the effect with a flexible rubber hose or a Slinky, oscillating through an letterbox, would be a standard way of showing this. Focusing on the fact that the electric field strength is a vector quantity and therefore it has components, is also very useful. It allows the explanation of two polarisers to be discussed along with producing a fairly simple explanation of the effect of introducing a third piece of Polaroid between the first two.
Experimentally, students can play with Polaroid sheets so as to investigate Malus’s law .
Discussions of how polarised light is made from either unpolarised light or at source, allow LCD screens to be discussed and a single sheet of Polaroid can then be shown to make an LCD screen appear to be giving out no light.
Common misconceptions or difficulties students may haveThe numbered points given below are some of the typical problems students have with this topic area. In each case, the problem is stated and then briefly discussed. Each one could be the basis of a class discussion, a piece of homework research or a class assessment. It is suggested that:

14
Thinking Conceptually
• A statement/question/problem is presented to the class.• The students are given 5 minutes to write down their
thoughts and answers.• The next 10–15 minutes are used to allow students to
read out what they have written to the rest of the class, their thoughts and comments then being discussed by the class.
• Finally, the students are give another 5 minutes to write down a new answer to the problem, based on the discussion.
The above process allows the students to realise that their first thoughts are rarely their best. Discussion and the use of additional sources of information (in this case their peers) is a good method of considering problems. They MUST think before they put pen to paper to explain something.
1) What is the difference between a wave, an oscillation and a vibration?
In some senses, there is no difference between these terms. However, the word wave is often used to refer to the whole wave that has been created – something that keeps getting larger and larger as it travels through a medium. The terms vibration, oscillation and cycle refer to one repetition within the wave. In this way, the definitions for period and wavelength should refer to cycles, vibrations or oscillations, not waves.
2) What is the standing wave shape telling me about the motion of particles in air?
The standing wave shapes for ‘waves on strings’ are fairly easy to interpret and a simple Excel spreadsheet has been
produced to show this in slow motion. A point on the string can be seen to oscillate in a way that produces the extremes of the shape, namely the wave amplitude. For ‘waves in pipes’ however, the situation is more complex to imagine because the waves are longitudinal. The standing wave shape, in both longitudinal and transverse situations, shows the different sizes of the amplitude of the motion at different points on the wave. The oscillations in pipes, however, are along the length of the pipe rather than at right angles to it.
3) Why does light change speed when it moves from one material to another?
Light interacts with any matter that can interact with an electric and/or magnetic field. This is obviously because light has these two components as part of it (i.e. electromagnetic waves). Typically:
- Magnetic fields interact with other magnetic fields – due to magnetic dipoles (and current flow).
- Electric fields interact with other electric fields – due to charges.
There is little magnetic material around us (at least not in the sense of ferromagnetic or ferrimagnetic materials) and so, the magnetic effect is not strong. There are however, huge amounts of charged material around us – anything made of atoms will have electrons and protons inside it and these particles are charged – hence they will be affected (i.e. interact) with the electric part of an electromagnetic wave. This is why, for the purposes of explaining phenomena, it is often easier to think of an electromagnetic wave as simply an electric wave.

15
Thinking Conceptually
When the light moves through a medium, the electric component is affected by the presence of the charged objects in the material and this interaction slows the wave down. This effect is complex, depending on factors such as the value of the charges, the spacing between them. This is why dispersion happens; the interaction of the different colours of light with glass (for example) depends on the different wavelengths of the different colours, and so the different colours have slightly different speeds – hence the colours split up / follow different paths.
4) Why is coherence important? Coherence is a reference to the phase difference between two or more waves. Two waves are coherent if the phase between them (whatever value it has) is unchanging in time. The importance of this to multi-slit diffraction patterns is seen when you consider the condition needed to produce the points for maximum and minimum intensity:
- Maximum intensity: Constructive interference requires a phase difference of 0° and this is produced on the screen when the path difference for the two waves produces a 0° phase.
- Minimum intensity: Destructive interference requires a phase difference of 180° and this is produced on the screen when the path difference for the two waves produces a 180°.
If the phase between the two waves suddenly changes, the position on the screen for the maximum and minimum also changes – a diffraction pattern is still produced but the locations of the peaks and troughs change. If the waves are not coherent, the positions for the peaks
and troughs change rapidly and the effect is to blur the pattern, producing an average effect seen as a uniformly illuminated screen with no diffraction/interference pattern.
5) Where are the two waves that are needed in order to produce a standing wave? Standing waves require two waves of the same frequency travelling in opposite directions. This situation is easily created by confining the wave to a fixed region, e.g. having a wave travel along a medium until it reaches the end, where it then reflects back. If such reflection happens at both ends (e.g. think of a plucked guitar string), then the waves will overlap along the length of the string and the standing wave is created. This is not easy to imagine because we do not actually see the two waves – we see the combination (or superposition) of them, which is the standing wave.
6) Why is there a reflection from an open end of a pipe? This is not a question that is required of the specification. However, it is interesting nonetheless. When a sound wave passes through a medium and meets a boundary, the energy of the wave splits up – some of it is transmitted into the next material and some of it is reflected back (this links to the material in the medical physics part of the specification, being the way that ultrascans work). The amount of energy in the reflected wave is determined by the acoustic impedance of the two mediums. The point here is that the acoustic impedance of air in an open space is different to the acoustic impedance of trapped air (i.e. the air in the pipe). This difference in acoustic impedance is the reason why energy is reflected back down the tube from the open end.

16
Thinking Conceptually
It should be noted that the difference in acoustic impedance is not huge but obviously it is enough to allow a standing wave to be set up.
7) Why is there a 180° phase change when a wave reflects from a barrier?
There is a good simulation of the effect of reflections at free and fixed ends of a string on the PhET website:
https://phet.colorado.edu/en/simulation/wave-on-a-string
If the end if fixed, then the wave needs to stop (obviously!). This means that as the wave reaches the end of the string, the reaction with the fixing at the end of the string must be to produce a wave that will cancel out the movement of the end point. For example, if the wave is trying to make the end point rise upwards, then the fixing must create a force that tries to make the end move downwards, in order to cancel out the wave’s effect. This reaction at the end of the string must be an oscillating force because it is opposing the oscillation that is moving along the string. This then causes a wave to travel back down the string with a phase difference of 180°.
Conceptual links to other areas of the specification – useful ways to approach this topic to set students up for topics later in the courseThis section of work makes use of, and links to information from, a range of areas of the specification. For example:
• 3.1.2 Linear motion The motion of a progressive wave along a medium obeys the laws of motion and equations of motion. The
motion could be uniform or accelerated.
• 3.4.2 Mechanical properties of materials The speed of a wave on or through a material depends on the properties of the material. For example, the density of the material, the bulk modulus, the mass per unit length of a string. In this way, the equations for the harmonic frequencies depend on such properties.
• 5.3.1 Simple harmonic motion The motion of the particles oscillating in a wave can be considered to a first approximation as simple harmonic. There will be damping effects which will reduce the energy (and damped SHM is not SHM), but an analysis of the motion of the particles oscillating on a string using SHM, for example, can give meaningful information.
• 4.5.3 Wave-particle duality When matter waves are considered, there is a discussion of de Broglie’s ideas about their wavelength and the fact that the probability criteria require any wave to have zero displacement of the edges of the confining system, i.e. at the walls of the container. This will then make use of the standing waves discussed in section 4.4.4. This in turn allows the quantum energy equation to be generated for a confined object that is described as being free within the confining space (but obviously not free in the sense that there are confining walls).
• 6.5.2 and 6.5.3 Diagnostic methods in medicine and using ultrasound Medicine has been revolutionised in the last 30 years or so by the increasing focus it has gained from
Click here

17
Thinking Conceptually
physicists. In particular, the application of physics to the development of a range of non-invasive techniques is nothing short of revolutionary. As such, the links to sound and electromagnetic radiation are fairly clear.
The discussion of sound waves links to the use of ultrasound in medicine; the reflection of waves and
the dissipation of energy as the wave travels through a medium is the basis of ultrascans.
The work on the electromagnetic spectrum ties in to the medical applications of X-rays.

18
Thinking Conceptually
Activities Resources
Phase differences Using Excel, 12 different examples of a phase difference have been shown – each on its own page. The first page gives the phase differences to the nearest 0.1°. It is suggested that phase is discussed and then a page is given to each student (if there are more than 12 students in the class, simply repeat pages but do not inform the students of this). Ask the students to calculate the phase difference to the nearest 0.1° – this should take no more than five minutes.
A chocolate bar of their choice, could be the prize for the student with the closest answer.
This exercise is remarkably good at identifying basic errors in understanding what phase means.
http://www.ocr.org.uk/Images/250315-exercise-phase-differences-learner-resource.pdf
Click here
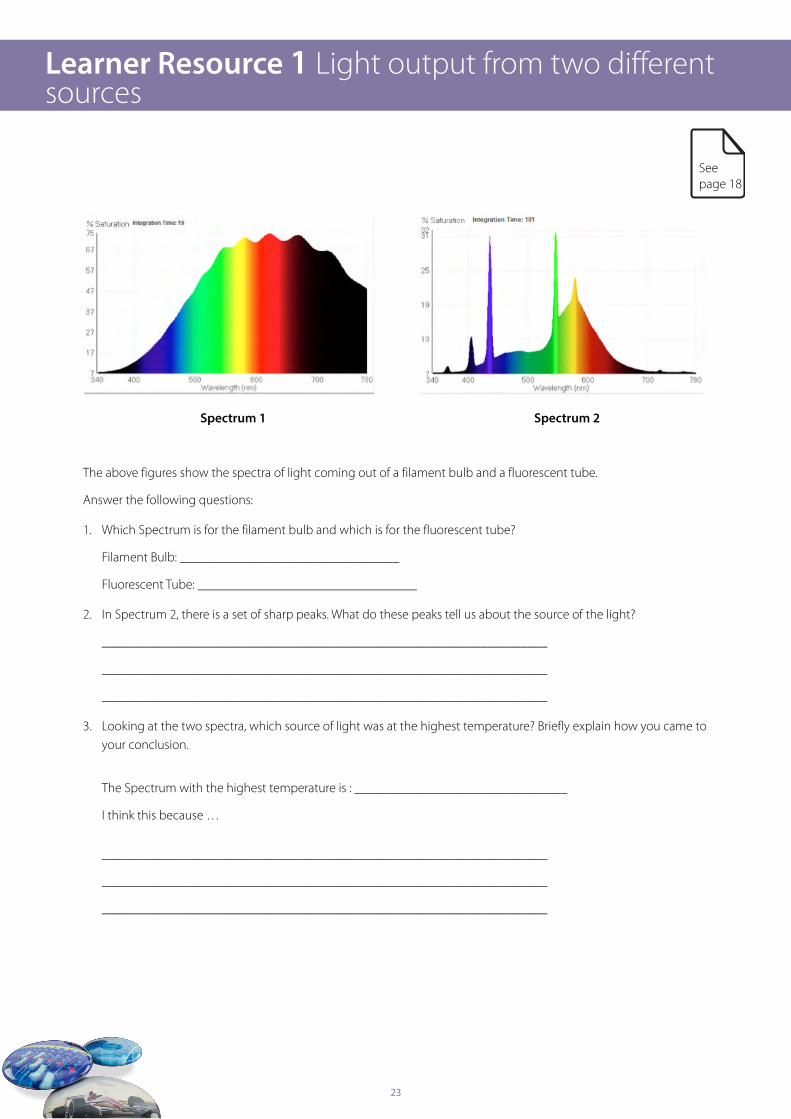
Light output from two different sources – Learner Resource 1This short exercise gives two emission spectra using a spectrophotometer. If such equipment is available, the scans can be shown in real time and then the sheet discussed. If not, the differences between the output from a filament bulb and a fluorescent tube can be discussed first.
This worksheet clearly has a link with the EM spectrum and quantum physics.
Learner Resource 1
Fundamental frequency vs tension – Learner Resource 2A short worksheet setting up an investigation into how, for a guitar string, the first harmonic depends on tension. It requires the use of a PicoScope or some other equipment that can give the harmonic frequencies. Note that there are various SMART apps for mobile phones that can also do this. Learner
Resource 2
Standing wavesThis is a simple spreadsheet where the teacher selects how many half-waves they wish to show on the graph and, by moving the slider, the movement of the imaginary string can be shown and discussed.
A remote mouse left on the end of the scroll bar would allow the movement to be controlled slowly, pausing for discussion.
The sheet shows some of the key differences between standing and progressive waves:
• Standing waves have points of no movement• Adjacent particles in a standing wave have 0°
http://www.ocr.org.uk/Images/250316-standing-waves-learner-resource.xls
Click here

19
Thinking Conceptually
Activities Resources
Snell’s lawA very simple analysis of the angles taken from a measurement of Snell’s law, i.e. angles of incidence and refraction. Students would be expected to do this analysis but it allows the teacher to very quickly produce the graphs to show what should be expected and calculate the value for n.
http://www.ocr.org.uk/Images/250317-snell-s-law-learner-resource.xls
Click here
BeatsBeats is a good example of an interference effect that also produces a clear and easily achieved sensory experience. By setting up two speakers, independently fed with their own signal generators, they can be adjusted to the same frequency at which one note is heard. A slight adjustment then allows the beats to be heard.
A simple explanation of beats is the movement on the one wave across the other, changing phase as it does so. The spreadsheet shows this.
There are two sine waves set up with slightly different periods – one blue and one red.
By Changing the ‘1’s at the top of the columns to ‘0’, that wave will be removed from the plot. It is recommended that:
• The blue wave is shown first (set the values as 1 0 0).• The blue is removed (0 0 0) and the red is shown on its own (0 1 0).• Both red and blue waves are put together (1 1 0). By having the red and blue together, it is easy to see where they seem to
have a phase of 0° and 180° – points for constructive and destructive interference.• All three waves are now shown together (1 1 1) and the red and blue are then removed just showing the beats effect
(0 0 1).
The spreadsheet also shows that if the periods are very close the output simply looks like (and sounds like) a single wave, with a single frequency but a varying amplitude. However, if the periods are wide apart (e.g. by making the red wave have a frequency of 10) the output (0 0 1) is seen to be a sine wave with a second sine wave on top of it. By creating this situation with the signal generators, students will hear that both waves are present and can be distinguished. It is interesting to try changing the frequency difference to see how close the frequencies have to be before they cannot be distinguished, and to ask whether this frequency difference depends on frequency.
http://www.ocr.org.uk/Images/250318-beats-learner-resource.xls
Click here
20
Thinking Conceptually
Activities Resources
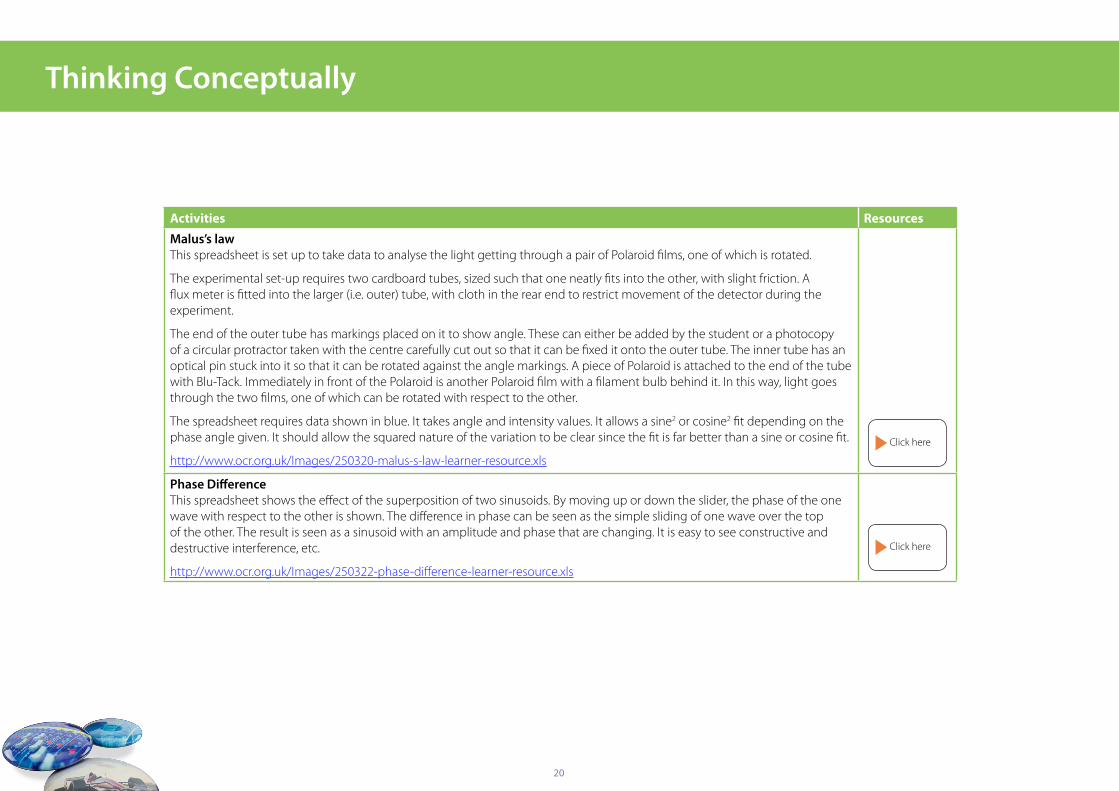
Malus’s lawThis spreadsheet is set up to take data to analyse the light getting through a pair of Polaroid films, one of which is rotated.
The experimental set-up requires two cardboard tubes, sized such that one neatly fits into the other, with slight friction. A flux meter is fitted into the larger (i.e. outer) tube, with cloth in the rear end to restrict movement of the detector during the experiment.
The end of the outer tube has markings placed on it to show angle. These can either be added by the student or a photocopy of a circular protractor taken with the centre carefully cut out so that it can be fixed it onto the outer tube. The inner tube has an optical pin stuck into it so that it can be rotated against the angle markings. A piece of Polaroid is attached to the end of the tube with Blu-Tack. Immediately in front of the Polaroid is another Polaroid film with a filament bulb behind it. In this way, light goes through the two films, one of which can be rotated with respect to the other.
The spreadsheet requires data shown in blue. It takes angle and intensity values. It allows a sine2 or cosine2 fit depending on the phase angle given. It should allow the squared nature of the variation to be clear since the fit is far better than a sine or cosine fit.
http://www.ocr.org.uk/Images/250320-malus-s-law-learner-resource.xls
Click here
Phase DifferenceThis spreadsheet shows the effect of the superposition of two sinusoids. By moving up or down the slider, the phase of the one wave with respect to the other is shown. The difference in phase can be seen as the simple sliding of one wave over the top of the other. The result is seen as a sinusoid with an amplitude and phase that are changing. It is easy to see constructive and destructive interference, etc.
http://www.ocr.org.uk/Images/250322-phase-difference-learner-resource.xls
Click here

21
The obvious areas of context for this topic area include:
Wave motion – Ranging – Detecting the distance to an object remotely, through the use of sound or electromagnetic waves, is important in many areas. Students could be asked to review this and write a short report on an application for sound and/or electromagnetic radiation. The report should focus on the application, the wave used and an explanation of the physics being used.
This is useful for speed guns (although other techniques are used), finding objects underground or in the sea, acoustic tape measures.
Interference – The CD and the DVD can be considered. Both use interference from the edge of the pits in the surface of the disc. Students could be asked to produce a short report on the use of electromagnetic waves for storing and reading data from a disk. Why are particular wavelengths used, what are the limitations for the data storage and how can we improve the data storage facility (i.e. get more onto a disk)? It is also interesting to discuss recent reports about the problems of storing data on CDs and DVDs because the data may become corrupted after a few decades.
Diffraction – the Monochromator. A diffraction grating is an easy way of producing a rainbow. To break up the light in this way, a monochromator can be made – a card with a hole in it to allow only a small range of wavelengths through. The monochromator can be the basis of any experiment that investigates effects which are influenced by EM wavelength (including spectrometers).
The Electromagnetic Spectrum:
• Communications
• The microwave oven
• Intruder alarms
• Fluorescence
• Medical imaging.
The list of uses for the electromagnetic spectrum is so large it could almost be defined as without limit. Its use is a requirement for many physics specifications at most levels and students could be given projects whereby they identify a use for each area of the spectrum. This should require them to make some comment not only about the physics of the application but also why the particular area of the spectrum is used. This would allow students to consider some of the problems with the different regions (not just dangers): for example, radio waves spread out more than microwaves because of their larger wavelength and as such, are not always desired.
Reflection – Mirrors. This could be an extension where students look at the effects of curved mirrors for focusing, leading to the use of such shapes for transmitting and absorbing in telescopes. The differences between parabolic and spherical dishes can be investigated with a view to looking at satellite TV.
Refraction – Lenses. This is clearly one of the most used aspects of refraction. There are a number of experiments that use lenses but the main investigation would be how the lens-to-image distance is affected by the lens-to-object distance. Although lenses may not be on the specification, this is still an interesting investigation to carry out since the analysis of the data suggests that a 1/x-type graph is produced whereas it is actually 1/y vs 1/x – introducing a discussion of proportionalities and the importance of the addition of a constant into the defining formula.
Note that total internal reflection is a (kind of ) mixture of reflection and refraction and has clear and important applications to optical communications systems and optical computing.
Interference – Beats. An easy effect to show and explain (see above) and used for tuning guitars and pianos.
Standing Waves – Musical instruments. This is clearly one of the most important applications for standing waves – ‘on strings’ and ‘in pipes’ covers most musical instruments.
Thinking Contextually

22
Thinking Contextually
Activities Resources
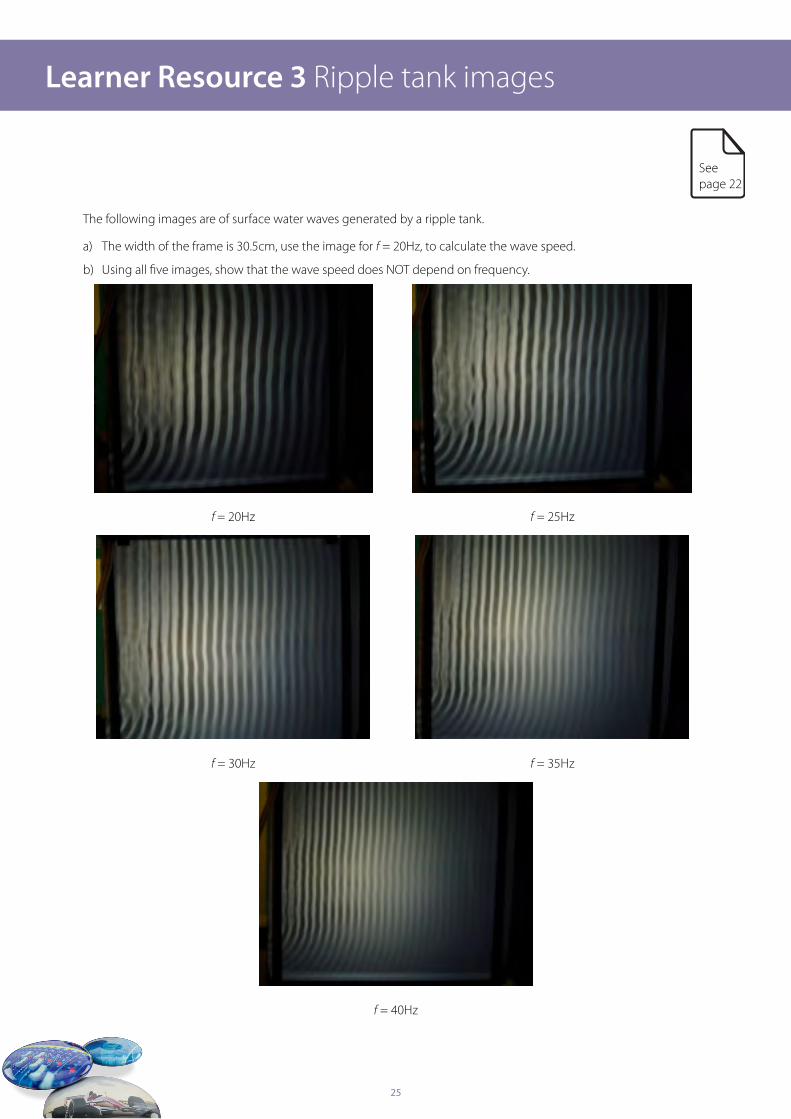
Ripple tank images – Learner Resource 3A ripple tank can be set up with a camera above it to take photos of the wavefronts. In this exercise, the frequency is changed and the images allow the wavelength to be measured.
The data allows the wave equation to be investigated, although the actual aim in this exercise is to show that the wave speed does not depend on frequency.
Learner Resource 3
Waves on a string or a Slinky – Learner Resource 4A worksheet for investigating how the speed of a wave on a string changes with the tension. The sheet gives an image of the set-up, which could be changed depending on the available equipment. It tells the students what to do in some detail but does not indicate exactly how to analyse the data – this is left to them and would be the main part of the teacher’s assessment. Learner
Resource 4
Wave speed vs depth – Learner Resource 5This worksheet links to the wave equation and refraction. Refraction is usually discussed with light. However ripples can also show the speed change effect (the actual changing of direction is harder to show clearly).
The set-up is very simple and by taking an appropriate photo of the wavefronts (also provided), the speed vs depth can be shown.
Learner Resource 5
Period of an oscillating metal rod – Learner Resource 6This worksheet has two versions within it – giving different amounts of information. It is a modification of an OCR piece of Quant CW and considers the motion of an oscillating rod. Although the area of interest for this work might be considered as SHM, the worksheet is useful in that it clearly has a link to Waves and allows the teacher to develop and assess the students’ ability to manipulate data.
Learner Resource 6
Measuring the refractive index – Learner Resource 7Worksheets giving two different ways of taking students through the data collection and processing for the measurement of n – one using a rectangular prism and the other a semicircular prism.
Learner Resource 7
23
Learner Resource 1 Light output from two different sources
Spectrum 1 Spectrum 2
The above figures show the spectra of light coming out of a filament bulb and a fluorescent tube.
Answer the following questions:
1. Which Spectrum is for the filament bulb and which is for the fluorescent tube?
Filament Bulb: _________________________________
Fluorescent Tube: _________________________________
2. In Spectrum 2, there is a set of sharp peaks. What do these peaks tell us about the source of the light?
___________________________________________________________________
___________________________________________________________________
___________________________________________________________________
3. Looking at the two spectra, which source of light was at the highest temperature? Briefly explain how you came to your conclusion.
The Spectrum with the highest temperature is : ________________________________
I think this because …
___________________________________________________________________
___________________________________________________________________
___________________________________________________________________
Seepage 18

24
Learner Resource 2 Fundamental frequency vs tension
How does the fundamental frequency of a guitar string vary with applied tension?
You are to investigate a tensioned guitar string. Clamp the string and use a pulley-wheel to apply mass to the end. In this way, tension can be applied.
Vary the tension and use a PicoScope (connected to a PC) to measure the value of the fundamental frequency.
Your investigation should enable you to say something about the guitar string.
When you have appropriate data, analyse it in any way you wish such that you can clearly demonstrate the type of variation you observe.
If you have time, you should make any conclusions you feel appropriate.
Please note that your report should include brief details of your methodology including details on:
• The aim of the investigation
• The input and output variables – what they are and how they are measured
• Safety issues
• Fair testing
• Data reliability.
Seepage 18
25
Learner Resource 3 Ripple tank images
The following images are of surface water waves generated by a ripple tank.
a) The width of the frame is 30.5cm, use the image for f = 20Hz, to calculate the wave speed.
b) Using all five images, show that the wave speed does NOT depend on frequency.
f = 20Hz f = 25Hz
f = 30Hz f = 35Hz
f = 40Hz
Seepage 22

26
Learner Resource 4 Waves on a string or a Slinky
Investigating waves on strings
You are to investigate standing waves on string.
The equipment is shown below and will be provided for you, already set up. Ensure you study it well before and during your investigation so you can assess where your uncertainties may lie and so that you can evaluate the experimental design.
This investigation will consider how the speed of a wave on a string depends on the tension in the string.
Plan
• The set-up is basically a piece of string attached to a vibrator at one end and over a pulley at the other. The vibration of the string is controlled by the frequency generator which controls the oscillator. The frequency can be read from the screen on the front panel.
• The tension in the string is controlled by adding masses to the end of the string.
• Start the investigation with 70g on the string – you need to think about what tension this produces.
• Slowly raise the frequency of the generator (starting at 10Hz) and watch the movement of the string. At certain values of frequency, standing waves will be set up. This should be apparent from the nodes and antinodes which are formed along the length of the string.
• Chose a standing wave pattern which you are happy with – this is the pattern you will keep for the whole investigation.
• Measure the wavelength of the wave with a ruler and make a note of the frequency.
• Vary the mass on the end of the string and measure the new frequency required to achieve the same standing wave.
• Repeat this as many times as you feel necessary.
You should process the data as you see fit.
Seepage 22

27
Learner Resource 4
Investigating waves on a Slinky
You are to investigate the propagation of waves on a Slinky. You are to set up standing waves on a Slinky which is stretched across the length of the lab.
By considering the different standings waves that can be created, you can measure the wavelength and period of oscillation. From this, you can assess the wave equation and test its validity.
Carry out your investigation.
If you have time, you may process your data and make any conclusions you feel appropriate.

28
Learner Resource 5 Wave speed vs water depth
The following investigation uses waves generated by an oscillator to show that the speed of surface water waves decreases as the depth of the water decreases.
The basic set-up is shown below.
Oscillator
Gloss ramp
Depth
As the waves move into shallower water, the frictional effects become greater and the wave slows down. This will be seen as a reduction in the wavelength.
The reduced wavelength can be seen by choosing a wave crest and following it with your eyes as it moves along the ramp. Peripheral vision will show you that the wavelength is getting smaller.
Once the waves are generated a digital camera can be used to photograph the waves along the ramp.
In this image, the changing wavelength can be easily seen and the wavelength can be estimated along with the depth. By knowing the frequency of the wave, the speed can be calculated.
Seepage 22

29
Learner Resource 6 Period of an oscillating metal rod
You are to investigate a metal strip with a mass attached to its end.
The strip has two 50g masses attached to the end. These masses are not to be removed from the strip.
The strip should be clamped to the edge of a table and the length of the strip over the end of the clamp measured.
You are to investigate how the period (T) of the strip depends on the length (L).
The amplitude of the oscillations should only be a few mm.
Notes:
The analysis of this data requires a knowledge of the mechanical properties of materials. It is worth noting that the period (T) of such strip oscillations can be related to the length (L) by:
T =
4πd
M
b d E Ln
Where:
M = mass attached to the end of the strip.
b = width of the strip
d = thickness of the strip
E = Young’s modulus of the metal strip (carbon steel)
n = constant
Seepage 22

30
Learner Resource 6
You are to investigate a metal strip with a mass attached to its end.
The strip has two 50g masses attached to the end. These masses are not to be removed from the strip.
The strip should be clamped to the edge of a table and the length of the strip over the end of the clamp measured.
You are to investigate how the period (T) of the strip depends on the length (L).
The amplitude of the oscillations should only be a few mm.
Notes:
The frequency (f) of such strip oscillations can be empirically related to the length (L) by:
f = k Ln
where k and n are constants. Further, the value of k is related to the Young’s modulus (E) of the metal strip by:
E =
16 π2 M k2
b d3
Where:
M = mass attached to the end of the strip
b = width of the strip
d = thickness of the strip
You may wish to consider this if you intend to process data to a full conclusion.

31
Semicircular prismRefraction is the name given to the bending of a wave when it moves from one material to another. This happens because the wave moves at different speeds in the two media. In the case of light, the size of this effect is given by the refractive index (n).
Light of all wavelengths (or frequencies) travels faster in a vacuum than in any other medium. The refractive index tells us how much slower light moves in one medium in relation to its speed in a vacuum i.e.:
Refractive Index, nx =
speed of light in a vacuum
speed of light in x
For example, if the refractive index of a material were ‘3’, this would mean that light travels three times slower in that material than in a vacuum.
To measure the refractive index of a material, we pass a beam of light through a boundary between the material and air and measure the angle of refraction. As in any experiment, to reduce the possibility of making a mistake we should take several measurements. We try to plan experiments which will allow us to plot a graph. We can then identify a trend or spot any weird or interesting points.
ExperimentTo measure the refractive index of glass or plastic, we will use a semicircular block.
1. Place the semicircular block on a piece of paper, somewhere around the middle of the sheet, and draw carefully around its edge.
2. On your drawing, measure the length of the straight edge and place a mark at its centre.
3. Line up a protractor with the straight edge, putting the centre of the protractor at the centre of the edge, and mark the 90° point. Draw a line between this point and the middle of the straight edge. Continue this line down below the straight edge. Mark this line as ‘0°’.
4. Next, set the protractor on the straight edge again and add a mark every 5° until you reach a largest angle of 50°. Mark these lines 5°, 10°, 15°, … etc.
Your sheet of paper should look similar to the one shown here, but for clarity, only the 0° and the 45° lines have been drawn – yours should contain all 11 lines from 0° to 50°.
You will be shining light along the various angles you have drawn – these will be your different angles of incidence. Do not forget that these angles are always measured with respect to the normal. One problem with this experiment is that when light travels through the block, it is moving between two boundaries:
a) the air-glass interface as it enters the block
b) the glass-air interface as it leaves the block.
In this experiment, the light beam is always shone towards the centre of the straight edge. For the 0° and 45° angles, this is shown in the diagram. The zero angle is drawn going straight through the block.
Learner Resource 7 Measuring the refractive index
Seepage 22
32
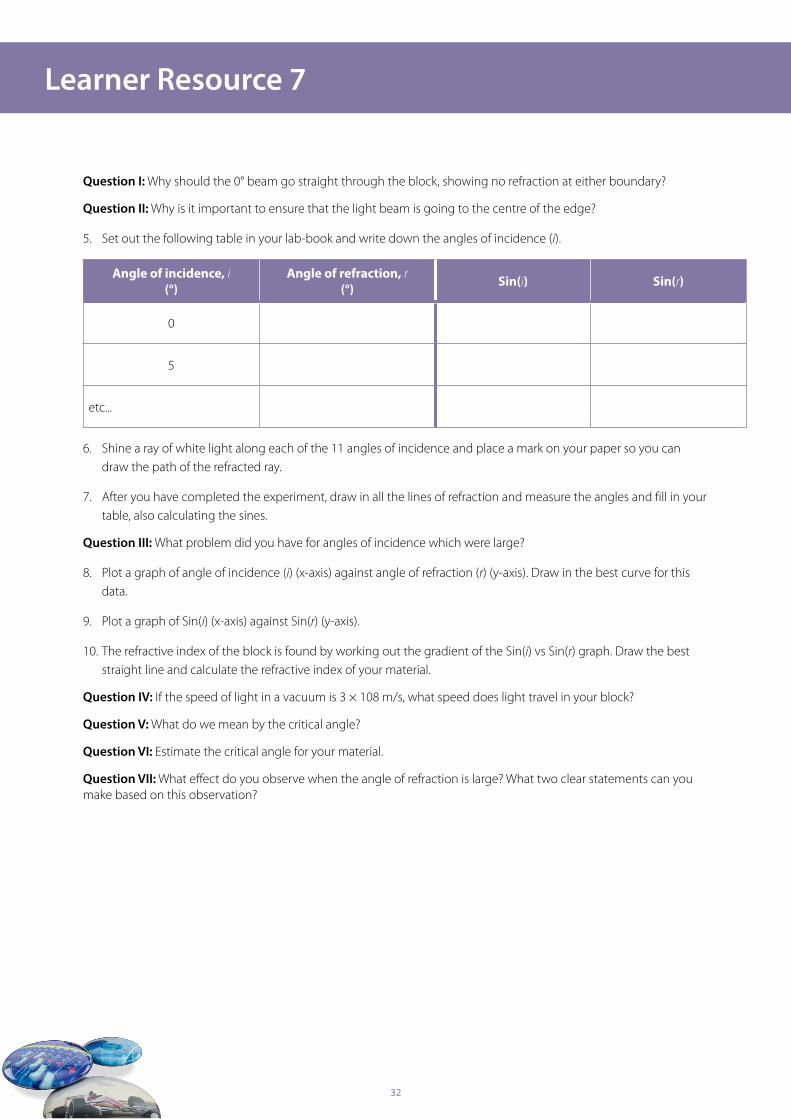
Question I: Why should the 0° beam go straight through the block, showing no refraction at either boundary?
Question II: Why is it important to ensure that the light beam is going to the centre of the edge?
5. Set out the following table in your lab-book and write down the angles of incidence (i).
Angle of incidence, i(°)
Angle of refraction, r(°) Sin(i) Sin(r)
0
5
etc...
6. Shine a ray of white light along each of the 11 angles of incidence and place a mark on your paper so you can draw the path of the refracted ray.
7. After you have completed the experiment, draw in all the lines of refraction and measure the angles and fill in your table, also calculating the sines.
Question III: What problem did you have for angles of incidence which were large?
8. Plot a graph of angle of incidence (i) (x-axis) against angle of refraction (r) (y-axis). Draw in the best curve for this data.
9. Plot a graph of Sin(i) (x-axis) against Sin(r) (y-axis).
10. The refractive index of the block is found by working out the gradient of the Sin(i) vs Sin(r) graph. Draw the best straight line and calculate the refractive index of your material.
Question IV: If the speed of light in a vacuum is 3 × 10⁸ m/s, what speed does light travel in your block?
Question V: What do we mean by the critical angle?
Question VI: Estimate the critical angle for your material.
Question VII: What effect do you observe when the angle of refraction is large? What two clear statements can you make based on this observation?
Learner Resource 7

33
Learner Resource 7
Rectangular prismRefraction is the name given to the bending of a wave when it moves from one material to another. This happens because the wave moves at different speeds in the two media. In the case of light, the size of this effect is given by the refractive index (n).
Light of all wavelengths (or frequencies) travels faster in a vacuum than in any other medium. The refractive index tells us how much slower light moves in one medium in relation to its speed in a vacuum i.e.:
Refractive Index, nx =
speed of light in a vacuum
speed of light in x
For example, if the refractive index of a material were ‘3’, this would mean that light travels three times slower in that material than in a vacuum.
To measure the refractive index of a material, we pass a beam of light through a boundary between the material and air and measure the angle of refraction. As in any experiment, to reduce the possibility of making a mistake we should take several measurements. We try to plan experiments which will allow us to plot a graph. We can then identify a trend or spot any weird or interesting points.
ExperimentTo measure the refractive index of glass or plastic, we will use a rectangular block.
1. Place the rectangular block on a piece of paper, somewhere around the middle of the sheet, and draw carefully around its edge.
2. On your drawing, place a pencil mark somewhere around a quarter of the way along the top edge.
3. Line up a protractor with the straight edge, putting the centre of the protractor at the centre of the edge and mark the 90° point. Draw a line straight down. Mark this line as ‘0°’.
4. Next, set the protractor on the straight edge again and add a mark every 10° until you reach a largest angle of 80°. Mark each line with its angle.

34
5. Put the rectangular block back in place and shine a ray along each line. For each angle, place a mark on the other side of the block where the ray is refracted.
Once this has been done for all the different angles of incidence, the block can be removed and the protractor used to measure the angles of refraction.
Set out the following table in your lab-book and write down the angles of incidence (i).
Angle of incidence, i(°)
Angle of refraction, r(°) Sin(i) Sin(r)
0
10
etc...
Plot a graph of angle of incidence (i) (x-axis) against angle of refraction (r) (y-axis). Draw in the best curve for this data.
Plot a graph of Sin(r) (x-axis) against Sin(i) (y-axis).
The refractive index of the block is found by working out the gradient of the Sin(i) vs Sin(r) graph. Draw the best straight line and calculate the refractive index of your material.
Question: If the speed of light in a vacuum is 3 × 10⁸ m/s, what speed does light travel in your block?
Learner Resource 7

35
Teacher Answers Learner Resource 3
a) In each image, there is a scale factor to relate a size in the image to its size in the ‘real word’.
Wave speed: v = fλ
f = 20Hz 8λ ≡ 28mm ⇒ λ = 28
8
mm = 3.50mm
λreal
= 3.50 ×
305
54
= 19.8mm
∴ v = fλ = 20 × 19.8 × 10-3
v = 0.396 ms-1

36
Teacher Answers Learner Resource 3
b)
37
Teacher Answers Learner Resource 3
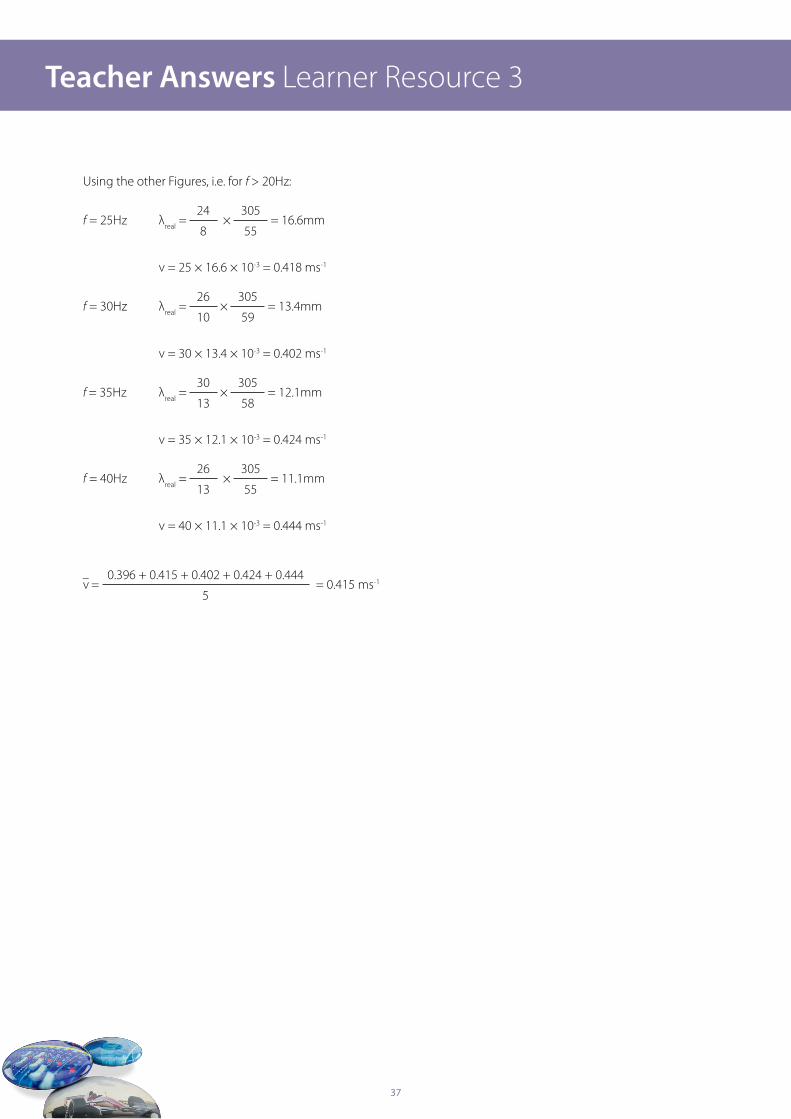
Using the other Figures, i.e. for f > 20Hz:
f = 25Hz λreal
= 24
8
×
305
55
= 16.6mm
v = 25 × 16.6 × 10-3 = 0.418 ms-1
f = 30Hz λreal
=
26
10
×
305
59
= 13.4mm
v = 30 × 13.4 × 10-3 = 0.402 ms-1
f = 35Hz λreal
=
30
13
×
305
58
= 12.1mm
v = 35 × 12.1 × 10-3 = 0.424 ms-1
f = 40Hz λreal
= 26
13
×
305
55
= 11.1mm
v = 40 × 11.1 × 10-3 = 0.444 ms-1
v – = 0.396 + 0.415 + 0.402 + 0.424 + 0.444
5
= 0.415 ms-1

38
Teacher Answers Learner Resource 3
Ripple Speed(m/s)
Frequency(Hz)
0.396 200.415 25
0.402 30
0.424 35
0.444 40

39
OCR Resources: the small printOCR’s resources are provided to support the teaching of OCR specifications, but in no way constitute an endorsed teaching method that is required by the Board and the decision to use them lies with the individual teacher. Whilst every effort is made to ensure the accuracy of the content, OCR cannot be held responsible for any errors or omissions within these resources. We update our resources on a regular basis, so please check the OCR website to ensure you have the most up to date version.
© OCR 2015 - This resource may be freely copied and distributed, as long as the OCR logo and this message remain intact and OCR is acknowledged as the originator of this work.
Please get in touch if you want to discuss the accessibility of resources we offer to support delivery of our qualifications: [email protected]
We’d like to know your view on the resources we produce. By clicking on the ‘Like’ or ‘Dislike’ button you can help us to ensure that our resources work for you. When the email template pops up please add additional comments if you wish and then just click ‘Send’. Thank you.
If you do not currently offer this OCR qualification but would like to do so, please complete the Expression of Interest Form which can be found here: www.ocr.org.uk/expression-of-interest

For staff training purposes and as part of our quality assurance programme your call may be recorded or monitored.
©OCR 2015 Oxford Cambridge and RSA Examinations is a Company Limited by Guarantee. Registered in England. Registered office 1 Hills Road, Cambridge CB1 2EU. Registered company number 3484466. OCR is an exempt charity.
OCR customer contact centreGeneral qualificationsTelephone 01223 553998Facsimile 01223 552627Email [email protected]