ocr as and a level physics b delivery guide - theme · 2018-03-20 · as and a level delivery guide...
TRANSCRIPT

PHYSICS B(ADVANCING PHYSICS)
AS and A LEVELDelivery Guide
H156/H556
Theme: Imaging and signallingApril 2015

We will inform centres about any changes to the specification. We will also publish changes on our website. The latest version of our specification will always be the one on our website (www.ocr.org.uk) and this may differ from printed versions.
Copyright © 2015 OCR. All rights reserved.
Copyright OCR retains the copyright on all its publications, including the specifications. However, registered centres for OCR are permitted to copy material from this specification booklet for their own internal use.
Oxford Cambridge and RSA Examinations is a Company Limited by Guarantee. Registered in England. Registered company number 3484466.
Registered office: 1 Hills Road Cambridge CB1 2EU
OCR is an exempt charity.

3
CONTENTS
Introduction Page 4
Curriculum Content Page 5
Thinking Conceptually Page 8
Thinking Contextually Page 10
Learner Resources Page 12
AS AND A LEVELPHYSICS B (ADVANCING PHYSICS)

4
Delivery guides are designed to represent a body of knowledge about teaching a particular topic and contain:
• Content: a clear outline of the content covered by the delivery guide;
• Thinking Conceptually: expert guidance on the key concepts involved, common difficulties students may have, approaches to teaching that can help students understand these concepts and how this topic links conceptually to other areas of the subject;
• Thinking Contextually: a range of suggested teaching activities using a variety of themes so that different activities can be selected that best suit particular classes, learning styles or teaching approaches.
If you have any feedback on this Delivery Guide or suggestions for other resources you would like OCR to develop, please email [email protected].
KEYClick to view associated resources within this document.
Click to view external resources
Introduction
only AS Level content only

5
The theme splits into two main concept areas.
Firstly there is the propagation of waves. The main focus of this is on lenses and their use in cameras and telescopes.
Secondly there is digitisation and the use of digital signals. The key point here is that digitisation takes something with an infinite number of possible levels and reduces it to a set number of levels which can then be encoded into binary. Sampling and encoding are covered in detail.
3.1 CommunicationThese sections are about waves, images, simple optics and electric circuits. The physics of the imaging and signalling section is approached through how information is gathered, processed, transmitted and presented. Learners have opportunities to develop IT skills through the use of image processing, data capture and data analysis software. The material can be taught using contexts such as smart phones, data streaming, medical scanning and remote sensing. There are opportunities to address human and social concerns, for example, consequences of the growth of worldwide digital communications (HSW9) and the ethical issues of sharing information (HSW10).
3.1.1 Imaging and signalling(a) Describe and explain:
(i) the formation of a real image by a thin converging lens, understood as the lens changing the curvature of the incident wave-front (HSW9)
(ii) the storage of images in a computer as an array of numbers that may be manipulated to enhance the image (vary brightness and contrast, reduce noise, detect edges and use false colour)
Learners are not expected to carry out numerical manipulations in the examination; an understanding of the nature of the processes will be sufficient.
(iii) digitising a signal (which may contain noise); advantages and disadvantages of digital signals (HSW12)
(iv) evidence of the polarisation of electromagnetic waves.
(b) Make appropriate use of:
(i) the terms: pixel, bit, byte, focal length and power, magnification, resolution, sampling, signal, noise, polarisation (HSW8)
by sketching and interpreting:
Curriculum Content

6
(ii) diagrams of the passage of light through a converging lens using both wave-fronts and rays
(iii) diagrams of wave-forms.
(c) Make calculations and estimates involving:
(i) the amount of information in an image = no. of pixels x bits per pixel
(ii) power of a converging lens P = 1/f, as change of curvature of wave-fronts produced by the lens (HSW10, M0.3, M1.1, M2.2, M2.4, M3.2)
(iii) use of
1=
1+
1
v u f(Cartesian convention).
Restricted to thin converging lenses and real images (M0.3, M1.1, M2.2, M2.4, M3.2)
(iv) linear magnification
(v) ν = fλ including the use of f = 1/T
(vi) number of bits, b, provides N = 2b alternatives; b = log2N (M0.5)
(vii) minimum rate of sampling > 2 × maximum frequency of signal (M2.1)
(viii) rate of transmission of digital information = samples per second × bits per sample
(ix) the graphical representation of the digitisation of an analogue signal for a given number of levels of resolution (M3.1)
(x) Use of b = log2 (V
total/V
noise)
(d) Demonstrate and apply knowledge and understanding of the following practical activities (HSW4):
(i) determination of power or focal length of a converging lenses using 3.1.1c(iii) (links to 3.1.1c(ii)(iii))
(ii) observing polarising effects using microwaves and light (links to 3.1.1a(iv))
Curriculum Content

7
Curriculum Content
Activities Resources
Sampling SHMLearner Resource 2
A worksheet to illustrate the effect of different sampling rates on the data produced. A mass is set to oscillate on a spring (due to differing springs you may need to change the number or the mass to get a period of about 8s). The student is then asked to record the displacement at different sample rates and plot the results.
Learner Resource 2
DefinitionsLearner Resource 3
A matching exercise to consolidate the meanings of key words. Learner Resource 3

8
Approaches to teaching the contentThis theme addresses ideas of light and digitisation. The main thrust should be on how these can be used for modern communications. The ability to explain how a TV programme is recorded, broadcast and displayed could be seen as an immediate goal. Discussion of the advantages and disadvantages of using digital signals should be encouraged.
Students should be given opportunities to become confident using terms such as pixel, bit, byte, focal length, power of a lens, magnification, resolution, sampling, sample rate, signal, noise and polarisation. They should also investigate image manipulation on a computer.
The primary practical goal would be to accurately determine the power of a lens by measuring the curvature of the light before and after. It is also worth building on previous work on experimental techniques by stressing the effect of sample rate and resolution on reliability of data.
Common misconceptions or difficulties students may haveThe concept of curvature is quite tricky, especially the sign convention. It is worth spending some time building these ideas before introducing the lens formula.
There is not much in the way of direct experimental work on digitisation. Some students find it hard to grasp the intangible processes which happen far too fast to observe in real
applications. However there are plenty of opportunities for modelling what is happening at human speed. Sampling often causes problems for students. With the common belief that digital is best for everything it is hard for some to grasp that information is lost when sampled.
Whenever it is met students find estimation to be hard, mostly because it appears to lack rigour. Some work on estimating and approximating values for calculations would help.
Conceptual links to other areas of the specification – useful ways to approach this topic to set students up for topics later in the courseThe waves section provides an opportunity to consolidate work done at GCSE ready for when it is used in 4.1 Waves and Quantum Behaviour. Examples include mentioning refraction when dealing with lenses and making sure concepts of wavelength and frequency are solid when doing wave equation.
Treating cameras as sensors can help ease the way into 3.1.2 which is all about sensors.
Graphs from later on in the course, esp. exponential decay and simple harmonic motion, could be used as examples from which to sample. This will not only mean that they have seen them but also allow discussion about how taking results is sampling.
Thinking Conceptually

9
Activities Resources
Finding the Power of a Lens (BBOP School Physics Resources)https://www.youtube.com/watch?v=_LbniV4KL7Q
A video demonstrating how to find the power of a convex lens. Alternatively the teacher could demonstrate the experiment using a digitiser. Having watched, students should carry out their own measurements of lenses with a range of powers.
Click here
Noisy Transmission (University of Auckland Computer Science Department)https://www.cs.auckland.ac.nz/courses/compsci314s1c/resources/Coding/
An applet to work on encoding and transmitting a signal in the presence of noise.
Click here
Digitising a Signal (BBOP School Physics Resources)http://www.archaeoroutes.co.uk/edphys/worksheets/Communication/Digitising%20a%20Signal.pdf
Instructions and data for a simulation of digitising a signal. Students take turns to digitise a signal and decode it.
Click here
Thinking Conceptually

10
Digital cameras provide a great way to put this topic into context. Firstly the lens must focus the image onto the CCD. Then the image is digitised and stored as an array of numbers. The size of the file will depend on the number of pixels and how many bits of information are stored for each.
This can be extended to the cameras used for remote sensing. You could work out the resolution and magnification of a camera on a satellite. This could be an infra-red device so you can bring in false colour.
DAB radios are useful for discussing sample rates and transmission rates. First the sound wave must be sampled, taking care to have a sample rate at least twice the highest frequency in the sound.
Another application is an optician. Firstly look at how the lens in the eye produces a real image. You can also examine how correcting lenses work. This would lead to interpreting the prescription which gives the power of the lens in dioptres. Finally you could look at the effects of polarising filters and why they are often used for driving or lifeguarding (they cut down glare because reflected light is polarised).
Thinking Contextually

11
Activities Resources
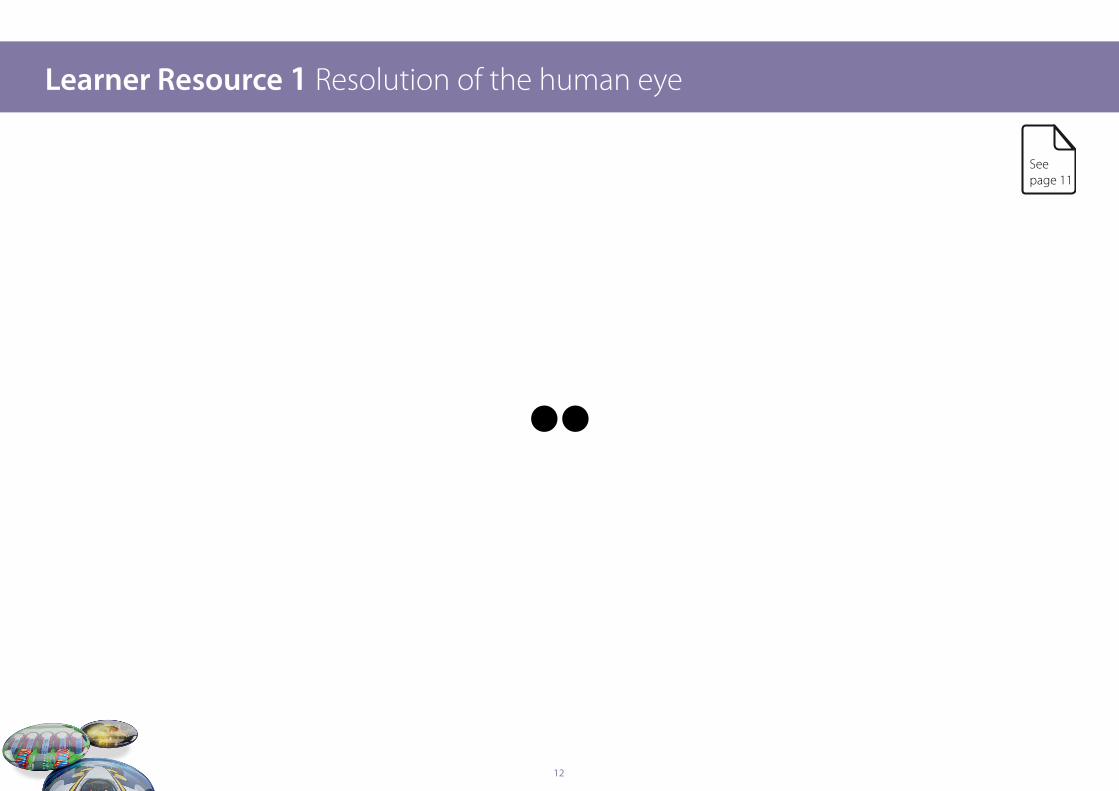
Resolving PowerLearner Resource 1
Print out the two sheets. One has two dots, the other one. Gather the students at one end of a large space, eg. a football pitch. Walk away from them along a tape measure. Every 5m turn and hold up a card. They raise two hands if they think it has two dots, one hand if they think it has one dot or leave them down if they can’t tell. Repeat until the majority can’t tell or get it wrong – this can be taken as the limit of resolving.
The students should then measure the distance between the dots and the distance at the limit of resolving and work out the resolution of their eyes.
Relate this to an eye test chart (http://www.i-see.org/block_letter_eye_chart.pdf ) or compare to telescopes.Click here
Satellite Imagery (various)https://www.youtube.com/watch?v=fCrB1t8MncY
https://www.youtube.com/watch?v=fdxHAggOmB4
Watch the above videos as a starting point for discussion on resolution and false colour.
Click here
Click here
File Compression (JISC Digital Media)Detailed and informative guide to different ways to compress digital image and sound files. Good illustration of pixels. Listen to a piece of music at different sample rates and different number of sample levels.
Thinking Contextually
12
Learner Resource 1 Resolution of the human eye
Seepage 11

13
Learner Resource 1 Resolution of the human eye

14
Learner Resource 2 Sampling SHM
When carrying out any experiment it is important to choose an appropriate interval between your readings. If your dependent variable is time the frequency of these readings is called the sample rate. If your sample rate is too low you will miss something.
This experiment will give you an idea of how to choose a sensible sample rate.
Set up a 1kg mass on a pair of springs as shown below. Find the frequency by measuring the time period and using
f =1
T
Make sure that the zeros on the two rulers are level with the bottom of the mass when it is hanging still (this is called the equilibrium position).
1kg
Pull the mass down 10cm and release, starting the stop watch at the same time. Record the displacement every 30s. Values on the top ruler are positive, values on the bottom ruler are negative.
Now repeat the experiment several times. Record the displacement every 20s, every 10s, every 5s and every 2s respectively.
Plot a graph of your results. Each set of data should be presented on the same axes; mark the points and curves in different colours.
Find the frequency of each curve by reading off the time period.
• What do you notice about the quality of the graphs as you went to shorter sample rates?
• At what point could you accurately measure the frequency of the oscillation from the graph?
In order to capture all the information the sample rate should be at least twice the frequency of the source. If there are multiple frequencies it needs to be at least twice the highest frequency.
clamp stand
heavy weight or G-clamp to desk
Two rulers, zeroes meeting
Seepage 7

15
Learner Resource 3 Definitions
Match the word to its definition.
pixel The distance beyond a lens that parallel incident rays would meet.
bit The smallest element of an image.
byte The ratio of the size of the image and the size of the object.
focal length Random, unwanted fluctuations added to a signal.
power of a lens A binary digit.
magnification Change of curvature to a wave front.
resolutionThe smallest separation at which two objects can be seen as separate.
sampling 8 bits.
signal Lining up the planes of oscillation of waves.
noise The information being transmitted.
polarisation Taking readings at set time periods.
Seepage 7

16
OCR Resources: the small printOCR’s resources are provided to support the teaching of OCR specifications, but in no way constitute an endorsed teaching method that is required by the Board and the decision to use them lies with the individual teacher. Whilst every effort is made to ensure the accuracy of the content, OCR cannot be held responsible for any errors or omissions within these resources. We update our resources on a regular basis, so please check the OCR website to ensure you have the most up to date version.
© OCR 2015 - This resource may be freely copied and distributed, as long as the OCR logo and this message remain intact and OCR is acknowledged as the originator of this work.
Please get in touch if you want to discuss the accessibility of resources we offer to support delivery of our qualifications: [email protected]
We’d like to know your view on the resources we produce. By clicking on the ‘Like’ or ‘Dislike’ button you can help us to ensure that our resources work for you. When the email template pops up please add additional comments if you wish and then just click ‘Send’. Thank you.
If you do not currently offer this OCR qualification but would like to do so, please complete the Expression of Interest Form which can be found here: www.ocr.org.uk/expression-of-interest

For staff training purposes and as part of our quality assurance programme your call may be recorded or monitored.
©OCR 2015 Oxford Cambridge and RSA Examinations is a Company Limited by Guarantee. Registered in England. Registered office 1 Hills Road, Cambridge CB1 2EU. Registered company number 3484466. OCR is an exempt charity.
OCR customer contact centreGeneral qualificationsTelephone 01223 553998Facsimile 01223 552627Email [email protected]