october 2010 report - department of planning, lands and ... · pdf fileforecast dwelling...
TRANSCRIPT

October 2010

iiiiiiii
Forecast Dwelling Starts in Western Australia, October 2010 Report ii
Disclaimer
This document has been published by the Housing Industry and Forecasting Group.
Any representation, statement, opinion or advice expressed or implied in this publication is made in good faith and on the basis that the members or their representatives are not liable for any damage or loss whatsoever which may occur as a result of action taken or not taken, as the case may be, in respect of any information, statement, opinion or advice referred to here.
Professional advice should be obtained before applying the information contained in this document to particular circumstances.
Published November 2010
website: www.hifg.net.au
email: [email protected]

1111
Forecast Dwelling Commencements in Western Australi a, October 2010 Report 1
1 Executive Summary This is the third annual report on the short-term prospects for Western Australia’s residential land and housing sectors since the re-establishment of the Housing Industry Forecasting Group in February 2008. The report and forecasts will be updated in April 2011.
1.1 Economic Outlook
The WA economy has continued its recovery in June 2010, driven by strong increases in government investment, consumer spending and household consumption. The local labour market has also improved. WA’s unemployment rate stood at 4.5% in August 2010 – well below its peak of 5.7% in September 2009. Labour shortages are once again becoming an issue. Looking forward, the prospects for the WA economy remain strong, with growth expected to accelerate over the next two years, on the back of continued strong demand from the developing Asian nations. With the domestic economy picking up growth, the Reserve Bank has been increasing its cash rate to more normal levels, raising it to 4.75% in November of this year. With continued growth in the domestic economy, the future direction for interest rates appears to be upwards with an expectation that rates will increase by a further 25-50 basis points by this time next year. Credit supply continues to remain an issue for many Australian businesses, particularly for land developers and builders.
1.2 Land
While there is an adequate supply of undeveloped land to meet future housing needs, there remains the critical issue of how quickly that land can be brought to market.
1.3 Building Activity
While building approvals in Western Australia increased strongly by 31% to 25,276 in 2009/10, attributable to the pull forward of first home buyer demand as a result of the Boost in the First Home Owner Grant and the Social Housing Stimulus, trend figures of approvals have been declining since the start of 2010. Dwelling commencements in 2009/10 at 25,276 were up 37% on the previous year, just below the peak achieved in 2005/06.
The Group notes that whilst some members believe a shortage of affordable land currently exists for first homebuyers and in some preferred locations, a number of measures indicate overall there is an adequate land supply to meet housing commencements into at least 2011/12. The capacity of HIFG to fully understand the state of land supply remains a constant source of frustration without an accurate assessment of demolition activity and lot absorption by built strata activity, which is presently not captured by WAPC. A full understanding of land supply, its creation, flow in and out of the market and its absorption should be a key priority for the State Government in 2010-11.

2222
Forecast Dwelling Commencements in Western Australi a, October 2010 Report 2
The price index of building materials used in housing construction in Perth increased by 0.9% in the year to the September quarter 2010, compared with a 1.8% increase for the six major capital cities. Labour supply is reported to be in moderate short supply in Perth and regional WA. Some HIFG members are reporting that while plenty of people are visiting sales offices they are exhibiting a cautious approach and taking a long time to sign contracts to build.
1.4 Housing Market Trends
The volume of sales of established dwellings in WA for the September quarter of 2010 is estimated to be down 25% on the 15-year average and the number of listings (including land) in the metropolitan area has climbed dramatically in 2010, reaching 15,500 in September, the highest level since December 2008 and well above the market equilibrium of 12,000. Applications for the First Home Owners Grant (FHOG) reached a peak of 2,946 in May 2009, stimulated by the FHOG Boost in October 2008. As expected, the number of FHOG applications has now fallen to less than 1,000 per month in 2010, which compares to a long-term average of 1,500 since the scheme’s inception in July 2000. The latest preliminary data from REIWA indicates the Perth private rental market is tightening with the vacancy rate falling to 3.4% in the September quarter of 2010 but is still above the generally accepted vacancy rate of 3% signifying a balance between demand and supply. REIWA attributes some of the decline in Perth’s vacancy rate to a retreat in investor activity due to low yields and the likelihood of limited capital growth in the foreseeable future.
HIFG Forecast of Dwelling Comm encements in WA, 20 10-11 & 2011-12
Financial Year Dwelling Commencements % change
2009-10 (actual) 25,340 2010-11 (forecast) 20,000 -21%
2011-12 (forecast) 20,000 – 21,000 0 to +5%
Based on the forecast commencements and projected population growth, new housing supply will fall short of underlying demand over the next two years, which should allow prices and rents to stabilise and demand for new dwellings to pickup beyond the forecast period.

3333
Forecast Dwelling Commencements in Western Australi a, October 2010 Report 3
Table of contents
1 Executive Summary 1
1.1 Economic Outlook 1 1.2 Land 1 1.3 Building Activity 1 1.4 Housing Market Trends 2
Table of figures 4 2 Introduction 5 3 Housing Industry Drivers 5
3.1 Economic Overview 5 3.2 Finance Sector 5 3.3 Population Growth 6
4 Land Supply 7 4.1 Lot Potential and Production 7 4.2 Residential Land Sales 9
5 Building Industry Activity and Trends 10 5.1 Building Approvals 10 5.2 Dwelling Commencements and Completions 12 5.2.1 Dwelling Commencements 12 5.2.2 Completions 14 5.2.3 Work under Construction 14 5.2.4 Housing Finance 15
6 Housing Market Trends 17 6.1 New Homes Market 17 6.2 Established Dwelling Market 17 6.3 First Home Buyers Market 18 6.4 Home Loan Affordability 20 6.5 Private Rental Market 21 6.6 Public Sector 21
7 Housing Industry Resources 21 7.1 Construction Costs, Building Materials and Labour Supply 21
8 Underlying Demand for Housing 22 8.1 Underlying Housing Requirements 22
9 Forecast of Dwelling Commencements 0 9.1 Other Forecasts of Dwelling Commencements 0 9.2 HIFG’s Forecast of Dwelling Commencements 0
9.3 Land Supply Assessment 1 Appendix A – Regional Land and Housing Activity 2 Appendix B – Housing Industry Forecasting Group 7

4444
Forecast Dwelling Commencements in Western Australi a, October 2010 Report 4
Table of figures Figure 1: Components of WA Population Growth, June 2000 - Mar 2010.............................. 6 Figure 2: REIWA Land listings in Perth and Mandurah, March 2008 - September 2010 ........ 9 Figure 3: Building approvals in WA, July 2000 - Sept 2010 ................................................. 11 Figure 4: Finance commitments for new construction and private sector building approvals, July 2000 - August 2010...................................................................................................... 11 Figure 5: WA seasonally adjusted dwelling commencements, June 2000 - June 2010........ 12 Figure 6: Total dwelling commencements in WA, June 2000 - June 2010 ........................... 13 Figure 7: WA Commencements, construction and completions, 1984/85 - 2009/10 ............ 14 Figure 8: Total dwellings and % of unit dwellings under construction in WA, 1969/70 - 2009/10 ............................................................................................................................... 15 Figure 9: WA home loan approvals, July 2000 - July 2010 .................................................. 16 Figure 10: Private house sales and approvals in WA, July 2006 - Sept 2010 ...................... 17 Figure 11: Quarterly indexes of Perth house prices, Mar 2002 - Sept 2010......................... 18 Figure 12: Number of FHOG applications in WA, July 2000 - Sept 2010 ............................. 19 Figure 13: FHOG Grants as Proportion of Commencements and Sales .............................. 20 Figure 14: Net dwelling starts and cumulative surplus/shortfall of dwellings, WA, Perth & ROS .................................................................................................................................... 23 Figure 15: Building approvals in Perth and regional WA, 1991/92 - 2009/10 ......................... 2 Figure 16: Land listings in Perth, March 2008 - Sept 2010 .................................................... 3 Figure 17: Land listings by metropolitan regions, March 2008 - Sept 2010............................ 3 Figure 18: Building approvals by metropolitan regions, 2009/10............................................ 4 Figure 19: Building approvals for four southern regions, 1991/92 - 2009/10 .......................... 6 Figure 20: Building approvals for remaining regions, 1991/92 - 2009/10 ............................... 6

5555
Forecast Dwelling Commencements in Western Australi a, October 2010 Report 5
2 Introduction This is the Group’s third annual report, containing its forecast of dwelling commencements for 2010-11 and 2011-12. The WA housing market in 2009-10 was very much a two-tier market, with a very active first homebuyers sector and a slow demand from repeat buyers. After the low out-turn for 2008-09 with 18,436 dwelling commencements, housing starts rebounded very strongly in 2009-10 with a 37% increase over the previous year. The strong growth was stimulated by a combination of the Boost in the First Home Owners Grant and the Social Housing Stimulus.
3 Housing Industry Drivers
3.1 Economic Overview The WA economy has continued its recovery in June 2010, with the domestic economy (as measured by state final demand) growing by 3% during the quarter, and 7.9% over the year. During the quarter, growth was driven by strong increases in government investment, consumer spending and household consumption.
The local labour market has also improved. WA’s unemployment rate stood at 4.5% in August 2010 – well below its peak of 5.7% in September 2009. Labour shortages are once again becoming an issue, with around a third of WA businesses already describing labour as "scarce".
Looking forward, the prospects for the WA economy remain strong, with growth expected to accelerate over the next two years, on the back of continued strong demand from the developing Asian nations. Despite the positive outlook for the state, some uncertainty has returned to the local economy in recent months. Recent surveys of WA business and consumer sentiment have found that confidence in the WA economy over the next three months has deteriorated. The less optimistic outlook reflects concerns about the recovery in the global economy, as well as domestic issues such as higher interest rates and rising costs. However, expectations for the WA economy over the next 12 months are still very favourable.
3.2 Finance Sector With the domestic economy picking up growth, the Reserve Bank has been increasing its cash rate to more normal levels and by November of this year had raised the rate to 4.75%, an increase of 1.75 percentage points from the low point of 3.0% reached in April 2009. With continued growth in the domestic economy, the future direction for interest rates appears to be upwards with an expectation that rates will increase by a further 25-50 basis points by this time next year. The major banks are making strong noises about the need to raise their interest rates to home borrowers over and above increases in the cash rate to offset increases in their cost of funds.

6666
Forecast Dwelling Commencements in Western Australi a, October 2010 Report 6
Credit supply continues to remain an issue for many Australian businesses, particularly for land developers and builders. Bank constraints on the level of presales required is resulting in smaller land developments. Major developers are reported to be returning to offshore sources of non-bank finance as wholesale credit markets thaw and it may be another 12 months before banks regain their pre-credit crunch appetite for lending to land developers.
3.3 Population Growth The latest demographic data to the March quarter of 2010 (see Figure 1) indicated: � While WA’s population continued to grow at a higher rate than for Australia as a whole,
growth has noticeably moderated since March 2009 with a large fall in net overseas migration.
� The preliminary estimate of WA’s annual population increase to March 2010 was 51,600, nearly 19,000 less than for the year to March 2009.
� Net overseas migration in the year to March 2010 at 31,063 was down 37% (18,402) on the year to March 2009.
Figure 1: Components of WA Population Growth, June 2000 - Mar 2010 Source: ABS Cat No. 3101.0 Table 2
-5000
0
5000
10000
15000
20000
25000
Jun-0
0
Dec-0
0
Jun-0
1
Dec-0
1
Jun-0
2
Dec-0
2
Jun-0
3
Dec-0
3
Jun-0
4
Dec-0
4
Jun-0
5
Dec-0
5
Jun-0
6
Dec-0
6
Jun-0
7
Dec-0
7
Jun-0
8
Dec-0
8
Jun-0
9
Dec-0
9
Natural increase Net overseas Net interstate Total change
The fall in overseas migration figures should not have come as a surprise as the Federal Government indicated last May that Australia’s overseas migrant intake in 2009-10 would be down 20%. This decline translates to an obvious reduction in the demand for property.

7777
Forecast Dwelling Commencements in Western Australi a, October 2010 Report 7
The latest ABS household projections for 2006 – 2031 published in June 20101 estimated that by June 2010 household numbers in WA had increased by between 79,548 and 83,802 households since the 2006 Census. The ABS projection is for an annual growth in the number of households over the next four years to June 2014 to be within the range of 2.3 – 2.4% or just over 20-21,500 households per annum.
4 Land Supply
4.1 Lot Potential and Production The latest copy of the Urban Growth Monitor from the WA Planning Commission2 reported that there was sufficient zoned land available in the Perth metropolitan and Peel regions to meet anticipated demand at current rates of urbanisation for approximately the next 27 years. While there is an adequate supply of undeveloped land to meet future housing needs, there remains the critical issue of how quickly that land can be brought to market. The current estimate of the time required to change undeveloped land to building lots is currently 4-5 years. In the June quarter 2010, developers lodged a total of 808 applications to create 9,097 residential lots across the state, an increase over the previous quarter of 39% and 68% respectively. At the end of June 2010, 14,984 proposed lots were under assessment, a fall of 8% over the same quarter of 20093. Conditional residential lot approval was given to 6,205 lots; a 28% increase from the same quarter of 2009. Final residential lot approval was given to 2,546 lots; down 5% from the June quarter 2009. At the end of June 2010, the number of proposed residential lots with current conditional approval totalled 74,148 lots across the state; down 2% on the stock number for the previous quarter but up 1% on the June quarter 2009.
1 Household and Family Projections, Australia, 2006 to 2031, June 2010, ABS Cat No 3236.0 2 Urban Growth Monitor, August 2010, WAPC 3State Lot Activity, June Quarter 2010, WAPC
HIFG has adopted the population growth rate projections used by the Department of Treasury and Finance from the 2010 State Budget as a basis for calculating its short term dwelling demand. The population growth has been calculated by applying the percentage growth rate to the June 2009 Estimated Resident Population (ERP) of 2.245 million. The 2009-10 DTF growth projection of 2.6% has been scaled down to 2.3%, reflecting the likely outcome based on the March 2010 data. Net Increase Projected ERP
• 2009-10 2.3% 51,600 2,296,7000 • 2010-11 2.3% 52,800 2,349,500
• 2011-12 2.2% 51,700 2,401,200 Note: the projected ERP figures are higher than the ABS Series1 - High Growth Scenario figures due to the strength of the growth in the post 2006 Census period.

8888
Forecast Dwelling Commencements in Western Australi a, October 2010 Report 8
Based on industry data, there appears to be less land in the development pipeline with UDIA(WA) members reporting4 that as at 30 June 2010 there were 4,495 lots under construction for release within 12 months in Perth, up 47% on the same quarter of 2009. This was after an all-time low in September 2008. In regional WA, the UDIA survey found members had 599 lots under construction for release in 12 months, with most activity occurring in Mandurah and Capel.5 However, data provided by the Water Corporation to the Department of Planning indicates that in June 2010 there were 16,000 residential lots where the developer had a servicing agreement with the Water Corporation. These lots can be considered close to being available over the next 12-18 months. Of the 16,000, 11,200 (70%) were located in the metropolitan area and 4,800 in the rest of WA, representing increases of 3% and 45% respectively in the year to June 2010.6 Recent data on vacant lots in the Perth, Peel and Greater Bunbury regions showed that the total grew from 34,400 in July 2004 to a peak of 45,500 in 2008 before falling to 42,200 by July 20097. Based on an outer sector average of 1.1 dwellings per lot, the report estimates that this stock of vacant lots would accommodate approximately 46,400 new dwellings. The same report also analyses the length of vacancy and found of the total stock of 42,200 as at July 2009 approximately 25% were lots first identified in 2009 compared with 39% in last year’s report. It is suggested that the fall in new vacant lots “.. adds weight to the notion that the drop in stock of vacant lots in 2009 is largely due to the reduction in the number of final approvals in that year.”8 The proportion of lots that have remained vacant since before 2005 has fallen from 26% to 24% suggesting little change in the older stock of vacant lots and the existence of a bank of long-term vacant stock that is likely to remain so for the foreseeable future, unless some incentives or measures are introduced. The following chart (Figure 2) shows land listings by REIWA members in the Perth/Peel regions rising by 46% since the low point in December 2009 to 2,948 in September 2010. Land listings in Greater Bunbury eased to 235 in September 2010, a 6% fall since the start of the year while listings in Geraldton/Greenough have been rising since the beginning of the year and totalled 395 in September 2010, a 106% increase compared to February 2010.
4 Urban Development Index, June quarter 2010, UDIA (WA). Survey covers the 42 major land developers only. 5 Ibid 6 See: Land Supply & Housing Activity Western Australia, June Quarter 2010, WAPC 7 Urban Growth Monitor, August 2010, WAPC 8 Ibid, page 24

9999
Forecast Dwelling Commencements in Western Australi a, October 2010 Report 9
Figure 2: REIWA Land listings in Perth and Mandurah , March 2008 - September 2010 Source: Real Estate Institute of WA
0
500
1,000
1,500
2,000
2,500
3,000
3,500
Mar-08
May-08
Jul-08
Sep-08
Nov-08
Jan-09
Mar-09
May-09
Jul-09
Sep-09
Nov-09
Jan-10
Mar-10
May-10
Jul-10
Sep-10
Perth Metro Mandurah-Murray
The Housing Industry Association reports that many of their members are seeing a shortage of titled building lots and supply is becoming an issue in certain preferred locations and market segments such as first homebuyers.
4.2 Residential Land Sales The index number of lots sold by UDIA (WA) members in the June quarter of 2010 was up 6% on the previous quarter and up 2% on the June quarter of 2009. The average price of lots sold was $245,532 in the June quarter 2010, 11% higher than the previous year but down 2% on the previous quarter. UDIA (WA) reported that the index of lots on the market for the metropolitan area had decreased for the third quarter in a row and was “a reflection of the decrease in construction activity during the market slowdown in 2007 and 2008.”9 The highest proportion of lots on the market were reported to be in Rockingham, Wanneroo and Cockburn. Latest land sales data reported by REIWA shows the following trends:
• Latest settled annual residential land sales for WA in 2009-10 at the end of October was 15,250, up an estimated 8% on 2008-09.
• Annual sale of lots in Perth in 2009-10 to date is 10,270, on a par with 2008-09 but is likely to increase as pre-sold sales are settled.
• Annual land sales in regional WA in 2009-10 were up nearly 32% to 4,980 Preliminary data for the June quarter 2010 has the Perth median land price now trending down, falling 4% from $250,000 in the March quarter 2010 to $240,000 but up 9% on June 2009. The latest peak in the median land price in the March quarter is still below the
9 Urban Development Index, June quarter 2010, UDIA (WA)

10101010
Forecast Dwelling Commencements in Western Australi a, October 2010 Report 10
$265,000 median price achieved in 2007. Analysis of land price square metre rates by REIWA shows the overall market land price peaked at $656 per m² in Dec 2007, which dropped to $435 in March 2009 and was $540 per m² in June 2010. Suburb level analysis is more revealing with four of the top ten land sales suburbs in Perth with current rates per square metre still below their peak in 2006-07. The latest regional land price for the June quarter was $160,000, a fall of 1.5% on the March quarter but up 7.4% on June 2009. Despite the overall fall in the June quarter, most major regional markets, other than Busselton, are showing an increase in their median land price over the year. An often overlooked component of land supply is the reselling of land back into the market. Analysis undertaken by REIWA of all settled land sales indicates there has been an increase in the level of land reselling as prices have recovered. Preliminary analysis indicates reselling represented 19% of sales in 2009-10, up from 16% in 2008-09 but still well short of the 23% of lots resold in 2007-08 and 22% in 2006-07 as speculators tried to off-load lots purchased and warehoused during the boom years of 2004-07. The increased level of reselling activity is also reflected in the level of land currently listed for sale, which is dominated by the South East and South West Corridors
5 Building Industry Activity and Trends
5.1 Building Approvals Building approvals in Western Australia increased by 31% to 25,276 in 2009/10. The latest data for September 2010 showed the seasonally adjusted number of total dwelling approvals were down 2% on the previous month and down 18% on the same month of 2009. Figure 3 clearly shows the trend estimates for private sector houses and total dwellings have both been declining since the beginning of 2010. The recovery in building approvals during 2009 was clearly attributable to the increased demand and pull forward of first home buyer demand as a result of the Boost in the First Home Owner Grant (FHOG). In addition, public sector building approvals at 2,613 were three times higher than the total for 2008/09.
The capacity of HIFG to fully understand the state of land supply remains a constant source of frustration without an accurate assessment of demolition activity and lot absorption by built strata activity, which is presently not captured by WAPC. A full understanding of land supply, its creation, flow in and out of the market and its absorption should be a key priority for the State Government in 2010-11.

11111111
Forecast Dwelling Commencements in Western Australi a, October 2010 Report 11
Figure 3: Building approvals in WA, July 2000 - Sep t 2010 Source: ABS Cat. No. 8731.0 Table 5
0
500
1000
1500
2000
2500
3000
Jul-0
0
Jan-
01
Jul-0
1
Jan-
02
Jul-0
2
Jan-
03
Jul-0
3
Jan-
04
Jul-0
4
Jan-
05
Jul-0
5
Jan-
06
Jul-0
6
Jan-
07
Jul-0
7
Jan-
08
Jul-0
8
Jan-
09
Jul-0
9
Jan-
10
Jul-1
0
Private sector houses (s.adj) Total dwellings (s.adj)
Private sector houses (trend) Total dwellings (trend)
Multi-residential approvals recorded a large 48% increase in 2009/10 resulting in a small improvement in their share of total approvals to 19%, following figures of 17% in 2008/09 and 24% in 2007/08. Perth continued to account for just over 70% of approvals (14,176 houses and 3,539 other dwellings), with multi-residential units representing 20% of total approvals in Perth compared with 19% in 2008/09 and 26% in 2007/08. Figure 4: Finance commitments for new construction and private sector building approvals, July 2000 - August 2010 Source: ABS Cat No. 8731.0 Table 5 & 5609.0 Table 10a
0
500
1000
1500
2000
2500
Jul-0
0
Nov
-00
Mar
-01
Jul-0
1
Nov
-01
Mar
-02
Jul-0
2
Nov
-02
Mar
-03
Jul-0
3
Nov
-03
Mar
-04
Jul-0
4
Nov
-04
Mar
-05
Jul-0
5
Nov
-05
Mar
-06
Jul-0
6
Nov
-06
Mar
-07
Jul-0
7
Nov
-07
Mar
-08
Jul-0
8
Nov
-08
Mar
-09
Jul-0
9
Nov
-09
Mar
-10
Jul-1
0
Finance commitments Building approvals

12121212
Forecast Dwelling Commencements in Western Australi a, October 2010 Report 12
Figure 4 above shows the relationship between finance commitments for new construction and purchase of new dwellings compared with private sector building approvals. The most recent peak in finance commitments took place four months before the peak in building approvals and suggests that building approvals will continue downwards until October 2010 followed by a continuance at a low level. HIFG secretariat will further examine this relationship between finance commitments and building approvals.
5.2 Dwelling Commencements and Completions
5.2.1 Dwelling Commencements Dwelling commencements10 in 2009/10 at 25,276 were up 37% on the previous year and just below the peak achieved in 2005/06. The number of private sector houses increased by an estimated 4,719 over the year (+33%) to a total of 19,144, while private sector commencements of other dwellings also increased, by 473 to a total of 3,643 (+15%). Figure 5: WA seasonally adjusted dwelling commencem ents, June 2000 - June 2010 Source: ABS Cat No 8752 Table 34
0
1000
2000
3000
4000
5000
6000
7000
8000
Jun-0
0
Dec
-00
Jun-0
1
Dec
-01
Jun-0
2
Dec
-02
Jun-0
3
Dec
-03
Jun-0
4
Dec
-04
Jun-0
5
Dec
-05
Jun-0
6
Dec
-06
Jun-0
7
Dec
-07
Jun-0
8
Dec
-08
Jun-0
9
Dec
-09
Jun-1
0
Total public Houses private Other private
Figure 6 below shows quarterly data for total commencements, which has been exhibiting a rising trend for the last six quarters. However, seasonally adjusted dwelling commencements appear to have started to decline from the March 2010 peak.
10 Excluding alterations and additions.

13131313
Forecast Dwelling Commencements in Western Australi a, October 2010 Report 13
Figure 6: Total dwelling commencements in WA, June 2000 - June 2010 Source: ABS Cat No 8752.0 Table 34
0
1000
2000
3000
4000
5000
6000
7000
8000
Jun-00
Dec
-00
Jun-01
Dec
-01
Jun-02
Dec-02
Jun-03
Dec
-03
Jun-04
Dec
-04
Jun-05
Dec
-05
Jun-06
Dec
-06
Jun-07
Dec-07
Jun-08
Dec
-08
Jun-09
Dec
-09
Jun-10
Seasonally adjusted Trend
The table below shows that the distribution of dwelling commencements between Perth and regional WA has declined marginally from a ratio of 75:25 at the beginning of the decade to 69:31 in 2009/10. The table also indicates that dwellings other than houses have been accounting for a greater proportion of total dwellings compared to houses, rising from 15% of the total in 2001/02 to 25% in 2007/08 but was back down to 21% in 2009/10.
Table 1: Distribution of Dwelling Commencements in WA11
Source: ABS Cat No 8752 – Unpublished data & includes conversions
Perth Regional WA WA
Houses Other Total Houses Other Total Houses Other Total 2001/02 11,824 2,338 14,162 4,417 528 4,945 16,241 2,866 19,107 (74%) (15%) 2002/03 12,435 2,649 15,084 4,381 765 5,146 16,816 3,414 20,230 (75%) (17%) 2003/04 13,359 2,974 16,333 5,215 927 6,142 18,574 3,901 22,475 (73%) (17%) 2004/05 12,845 3,611 16,456 5,397 1,071 6,468 18,242 4,647 22,835 (72%) (20%) 2005/06 14,864 3,130 17,994 6,677 1,051 7,728 21,541 4,181 25,722 (70%) (16%) 2006/07 13,360 3,787 17,147 6,379 1,293 7,672 19,739 5,080 24,819 (69%) (20%) 2007/08 11,615 4,442 16,057 5,101 1,173 6,274 16,716 5,615 22,331 (72%) (25%) 2008/09 10,335 3,116 13,451
(73%) 4,411 548 4,959 14,749 3,664
(20%) 18,413
2009/10 13,979 3,545 17,524 (69%)1
6,030 1,750 7,780 20,009 5,295 (21%)²
25,304
Notes: 1. Perth total as % of WA total. 2. WA other dwellings as % of total dwellings..
11 Unlike building approvals, data on commencements and completions are drawn from a 10% sample of industry activity and are subject to sampling error.

14141414
Forecast Dwelling Commencements in Western Australi a, October 2010 Report 14
5.2.2 Completions
The level of completions reached an annualised peak of 25,717 dwellings at the end of December 2007 but the downward trend since then bottomed out during 2009 as the backlog of work was completed (see Figure 7 below). The annualised level of completions is expected to increase later this year with the strong increases in annualised commencements and dwellings under construction in the first half of calendar 2010 and evident in Figure 7. Figure 7: WA Commencements, construction and comple tions, 1984/85 - 2009/10 Source: ABS Cat No 8752 Tables 34, 38 & 77
0
5000
10000
15000
20000
25000
30000
Jun-1985
Jun-1987
Jun-1989
Jun-1991
Jun-1993
Jun-1995
Jun-1997
Jun-1999
Jun-2001
Jun-2003
Jun-2005
Jun-2007
Jun-2009
Annualised commencements Under construction
Annualised completions
5.2.3 Work under Construction
After an all-time high of 23,351 in the March quarter 2007, the backlog of work reflected by the number of dwellings under construction in the June quarter 2010 was 15% higher at 19,083 than the low point of 16,576 as at the June quarter 200912.
The following chart (Figure 8) shows the total dwellings under construction and the percentage of units since the data was collected starting in 1969. After two peaks of close to 50% in the early 1970s and 1980s, the percentage of units in total dwellings under construction has fluctuated around 30%. The percentage rose strongly in 2008 to reach 39% in the September quarter of 2008 but has eased back to 32% as at the June quarter 2010.
As at the June quarter of 2010, the value of residential work under construction totalled $3.17 billion13, 9% higher than 12 months previously.
12 ABS Cat 8752.0 Table 77 13 ABS Cat No 8752.0 Table 50

15151515
Forecast Dwelling Commencements in Western Australi a, October 2010 Report 15
Figure 8: Total dwellings and % of unit dwellings u nder construction in WA, 1969/70 - 2009/10 Source: ABS Cat No 8752.0 Table 77
0
2000
4000
6000
8000
10000
12000
14000
16000
18000
Sep-1969
Sep-1971
Sep-1973
Sep-1975
Sep-1977
Sep-1979
Sep-1981
Sep-1983
Sep-1985
Sep-1987
Sep-1989
Sep-1991
Sep-1993
Sep-1995
Sep-1997
Sep-1999
Sep-2001
Sep-2003
Sep-2005
Sep-2007
Sep-2009
0%
10%
20%
30%
40%
50%
60%
Total dwellings under construction Percentage of units
5.2.4 Housing Finance
The impact of the ending of the First Home Owners Grant Boost can be clearly seen in finance lending commitments (see Figure 9 below). In the year to August 2010, the number of loans to first home buyers was 24% lower and despite a 8% increase in lending commitments to non-first homebuyers (excluding refinancing of established homes), total commitments overall were down 10%. Since April 2010, the ending of the boost has seen the share of loan commitments to first home buyers of total loans (excluding refinancing) slip from a high of over 40% in 2009 back to the long-term average of 20-25%. The average loan amount for first home buyers was just over $280,000 in August 2010, down 3% on the August 2009 average. The average loan amount for other buyers at $286,700 was virtually unchanged from the average figure in August 2009.

16161616
Forecast Dwelling Commencements in Western Australi a, October 2010 Report 16
Figure 9: WA home loan approvals, July 2000 - July 2010 Source: ABS Cat No 5609.0 Tables 9b & 10a
0
1000
2000
3000
4000
5000
6000
7000
8000
Jul-0
0
Nov
-00
Mar
-01
Jul-0
1
Nov
-01
Mar
-02
Jul-0
2
Nov
-02
Mar
-03
Jul-0
3
Nov
-03
Mar
-04
Jul-0
4
Nov
-04
Mar
-05
Jul-0
5
Nov
-05
Mar
-06
Jul-0
6
Nov
-06
Mar
-07
Jul-0
7
Nov
-07
Mar
-08
Jul-0
8
Nov
-08
Mar
-09
Jul-0
9
Nov
-09
Mar
-10
Jul-1
0
First home buyers Other buyers (excl. refinance)

17171717
Forecast Dwelling Commencements in Western Australi a, October 2010 Report 17
6 Housing Market Trends
6.1 New Homes Market New home sales by the major builders in WA have been falling since the beginning of 2010 with new home sales down 18% in the three months to September compared to the same period of 2009. The following chart shows HIA data on house sales and seasonally adjusted building approvals for private sector houses as recorded by ABS. Figure 10: Private house sales and approvals in WA, July 2006 - Sept 2010 Source: New Home Sales, September 2010, HIA & ABS Cat No 8731.0
0
200
400
600
800
1000
1200
1400
1600
1800
2000
Jul-0
6
Oct-06
Jan-
07
Apr-0
7
Jul-0
7
Oct-07
Jan-
08
Apr-0
8
Jul-0
8
Oct-08
Jan-
09
Apr-0
9
Jul-0
9
Oct-09
Jan-
10
Apr-1
0
Jul-1
0
House sales (s.adj) House approvals (s.adj)
The index of project home prices in Perth increased by 3% in the year to the June quarter 2010 (see Figure 11 below), which was marginally above the increase for the consumer price index over the same period.
6.2 Established Dwelling Market REIWA data14 showed the following:
• The volume of sales of established dwellings in WA for the September quarter of 2010 is estimated to be down 25% on the 15 year average
• The number of listings (including land) reported by REIWA members in the metropolitan area, has climbed dramatically across 2010, reaching 15,500 in
14 REIWA Market Update, September Quarter 2010, REIWA

18181818
Forecast Dwelling Commencements in Western Australi a, October 2010 Report 18
September, the highest level since December 2008 and well above the market equilibrium of 12,000.
• The number of days between listing and exchange of contracts was 63 days in the September quarter of 2010, virtually on a par with the same time last year but well above the 45 days considered as a normal market.
Preliminary data from REIWA indicated that the Perth median house price fell 4% in the September quarter of 2010 to $480,000 from the previous quarter to $500,000 but was 4% higher than a year ago. The median house price in regional WA in the September quarter 2010 at $365,000 was down 3.6% compared to the previous quarter and up just 0.6% on the previous year. The fall in the index of prices for established homes in Perth between the December quarter of 2007 and the March quarter of 2009 has reversed since September 2009. The index for the September quarter of 2010 was up 9% on the same quarter of 2009 but has been virtually flat during the last three quarters of 2010. Figure 11: Quarterly indexes of Perth house prices, Mar 2002 - Sept 2010 Source: ABS Cat No 6416.0
0.0
50.0
100.0
150.0
200.0
250.0
Jun-02
Dec-02
Jun-03
Dec-03
Jun-04
Dec-04
Jun-05
Dec-05
Jun-06
Dec-06
Jun-07
Dec-07
Jun-08
Dec-08
Jun-09
Dec-09
Jun-10
Established Perth Project homes Perth Established 8 capital cities Project homes 8 cap cities
6.3 First Home Buyers Market REIWA estimates the proportion of first homebuyers accounted for 24% of the established market in the June quarter 2010, which is marginally above the 10-year average of 23%. This is despite the number of established first homebuyers falling to near record lows after the pull forward effects of the First Home Owners Grant (FHOG) (see Figure 12 below).

19191919
Forecast Dwelling Commencements in Western Australi a, October 2010 Report 19
Applications for FHOG reached a peak of 2,946 in May 2009, stimulated by the announcement of the FHOG Boost in October 2008. Figure 12 below demonstrates clearly the reaction of first homebuyers to the boost in the grant, particularly in grant applications for new construction. As expected, the number of FHOG applications has fallen to just less than 1,000 per month in 2010, which compares to a long-term average of 1,500 since the scheme’s inception in July 2000. Out of 21,556 grants paid in 2009/10, 8,681 were for new dwellings representing 40% of total grants. With the finish of the additional FHOG boost for new construction, this percentage is expected to return to its long-term proportion of 25%. If the current number of grants paid is maintained at around 1,000 per month then the number of grants paid for new dwellings for first homebuyers is likely to fall to around 3,000 in 2010/11, a reduction of around 5,500 compared to the previous year. Application data suggest first homebuyers building a new home will return to the pre FHOG Boost level of around 15% of new dwelling construction during 2010-11. Figure 12: Number of FHOG applications in WA, July 2000 - Sept 2010 Source: Office of State Revenue
0
200
400
600
800
1,000
1,200
1,400
1,600
1,800
2,000
Jul-00
Jan-01
Jul-01
Jan-02
Jul-02
Jan-03
Jul-03
Jan-04
Jul-04
Jan-05
Jul-05
Jan-06
Jul-06
Jan-07
Jul-07
Jan-08
Jul-08
Jan-09
Jul-09
Jan-10
Jul-10
$0
$5,000
$10,000
$15,000
$20,000
$25,000
Est homes New dwellings Grant for new Grant for est

20202020
Forecast Dwelling Commencements in Western Australi a, October 2010 Report 20
Figure 13: FHOG Grants as Proportion of Commencemen ts and Sales Source: Calculations based on data from Office of State Revenue, REIWA and ABS Cat No 8752.0
The demand from first time buyers is likely to remain low due to the upward trend in interest rates. First time buyers are having to take on higher and higher housing cost burdens in order to access housing. Households on median incomes that owned a median priced property prior to 2006 have a current housing cost burden of around 28%. First time buyers on a median household income purchasing a median priced property in 2010 with a 20% deposit face a housing cost burden of 48%. With 30% of income spent on housing costs being the standard measure of housing stress the problems faced by first time buyers first accessing, and then staying within the owner occupied sector are significant. Such high housing cost burdens have implications for the economic and social participation of households. Raising the deposit is another challenge facing first time buyers. For those on a median income purchasing a median priced house it would take just over four years to save a 20% deposit assuming that household is able to save 30% of its income; a challenge if the household is within the private rental market.
6.4 Home Loan Affordability
According to the latest HIA – Commonwealth Bank housing affordability report, Perth’s housing affordability dropped by 2% in the June 2010 quarter and by 27% compared to the June 2009 quarter. However, affordability improved by 12% in Regional WA in the June quarter.15 The moderation in established house prices and increasing incomes will help to improve housing affordability. However, much will depend on the trend in interest rates, both the
15 HIA – Commonwealth Bank Housing Affordability Report, June Quarter 2010, HIA
0%
10%
20%
30%
40%
50%
60%
Sep
-00
Mar
-01
Sep
-01
Mar
-02
Sep
-02
Mar
-03
Sep
-03
Mar
-04
Sep
-04
Mar
-05
Sep
-05
Mar
-06
Sep
-06
Mar
-07
Sep
-07
Mar
-08
Sep
-08
Mar
-09
Sep
-09
Mar
-10
New FHOG as % of Commencements Established FHOG as % of Sales

21212121
Forecast Dwelling Commencements in Western Australi a, October 2010 Report 21
cash rate and whether or not the major banks follow the cash rate or increase rates above changes in the cash rate.
6.5 Private Rental Market The latest preliminary data from REIWA indicates Perth private rental market is tightening with the vacancy rate falling to 3.4% in the September quarter of 2010, still above the generally accepted vacancy rate of 3% signifying a balance between demand and supply. REIWA attributes some of the decline in Perth’s vacancy rate to a retreat in investor activity due to low yields and the likelihood of limited capital growth in the foreseeable future. Perth’s median rent has remained flat now for 18 months at $370 per week.16 REIWA data also reported softening private rental markets in several major regional centres. With vacancy rates above 3% in most regional centres (with the exception of Bunbury and Broome), it is anticipated that median rent levels will remain below increases in the consumer price index.
Table 2: Median Weekly Rent for Major Regional Cen tres, Sept Quarter 2010
Region Median Weekly Rent
% Change over previous Quarter
Vacancy Rate
Mandurah $300 n.c. 2.4% Greater Bunbury $320 +2% 2.2% Geraldton $320 n.c. 3.7% Kalgoorlie $330 +3% 2.2% Albany $300 +4% 4.1% Broome $600 +9% 1.9%
Source: Market Update, June Quarter 2010 REIWA
6.6 Public Sector The peak activity in the housing stimulus packages announced by the Federal and State government in February 2009 has passed with the large increase in number of dwelling commencements in 2009/10 over the previous year. Public sector dwelling starts will see a significant downturn in 2010-11 and in the following financial year.
7 Housing Industry Resources
7.1 Construction Costs, Building Materials and Lab our Supply The Project Home Price Index for Perth remained slightly above the increase in the consumer price index with an increase of 3.3% in the year to September 2010, and slightly above the weighted average for the Eight Capital Cities of 2.6%.
16 Market Update, September Quarter 2010, REIWA

22222222
Forecast Dwelling Commencements in Western Australi a, October 2010 Report 22
The price index of building materials used in housing construction in Perth increased by 0.9% in the year to the September quarter 2010, compared with a 1.8% increase for the six major capital cities17. A survey of HIA trade subcontractor members18 in the September quarter 2010, reported the availability of trades in Perth and regional WA was in moderate short supply and has been worsening since September 2009. The Master Builders Association’s Building Industry Employment Monitor, which monitors the number of advertised job vacancies, has improved considerably in 2010. However, demand for bricklayers has been the key driver as projects commenced but more recently demand for ceiling fixers and plasterers has accelerated as projects move through their production phase. The HIA Trade Contractor Price Index19 in the September quarter 2010 increased 5.8% in Perth and 3.5% in regional WA compared with 12 months ago.
8 Underlying Demand for Housing
8.1 Underlying Housing Requirements Despite the downturn in the previous high levels of net overseas migration, the Group believes the underlying dwelling requirement in WA based solely on demographic factors is running at around 27,000 dwellings per annum. This estimate is based on a population growth of around 2.2% per annum and a ratio of 2.6 persons per household. An un-occupied factor of 5.3% and a demolitions rate of 14.41% was adopted, which were based on figures calculated by the National Housing Supply Council20 from inter-censal stock figures between 2001 and 2006. Our preference would be to use actual demolitions data and we will continue to work with the Department of Planning on obtaining such data in the future. An important component of this demographic-based model is the rate of household formation, which does not take into account the ability of a household to actually form a separate household. A lack of available and affordable housing is one barrier to household formation. Declining affordability resulting from rising interest rates and/or rising house prices will slow the rate of new household formation. Rising rents in the private rental market will have the same affect with young people forced to say within the family home. Other economic variables such as unemployment will also have an impact on the ability to form new households. The increase in the number of people per household between the 2001 and 2006 Censuses suggests that these economic considerations resulted in many putting off forming a new household. The latest ABS household projections for 2006 – 2031 published in June 201021 estimated that by June 2010 household numbers in WA had increased by between 79,548 and 83,802
17 ABS Cat 6427.0 Tables 16 & 17. 18 Trades Report, HIA Austral Bricks, June Quarter 2010 19 ibid 20 2nd State of Supply Report, April 2010, NHSC. 21 Household and Family Projections, Australia, 2006 to 2031, June 2010, ABS Cat No 3236.0

23232323
Forecast Dwelling Commencements in Western Australi a, October 2010 Report 23
households since the 2006 Census. The ABS projection is for an annual growth in the number of households over the next four years to June 2014 to be within the range of 2.3 – 2.4% or just over 20-21,500 households per annum.
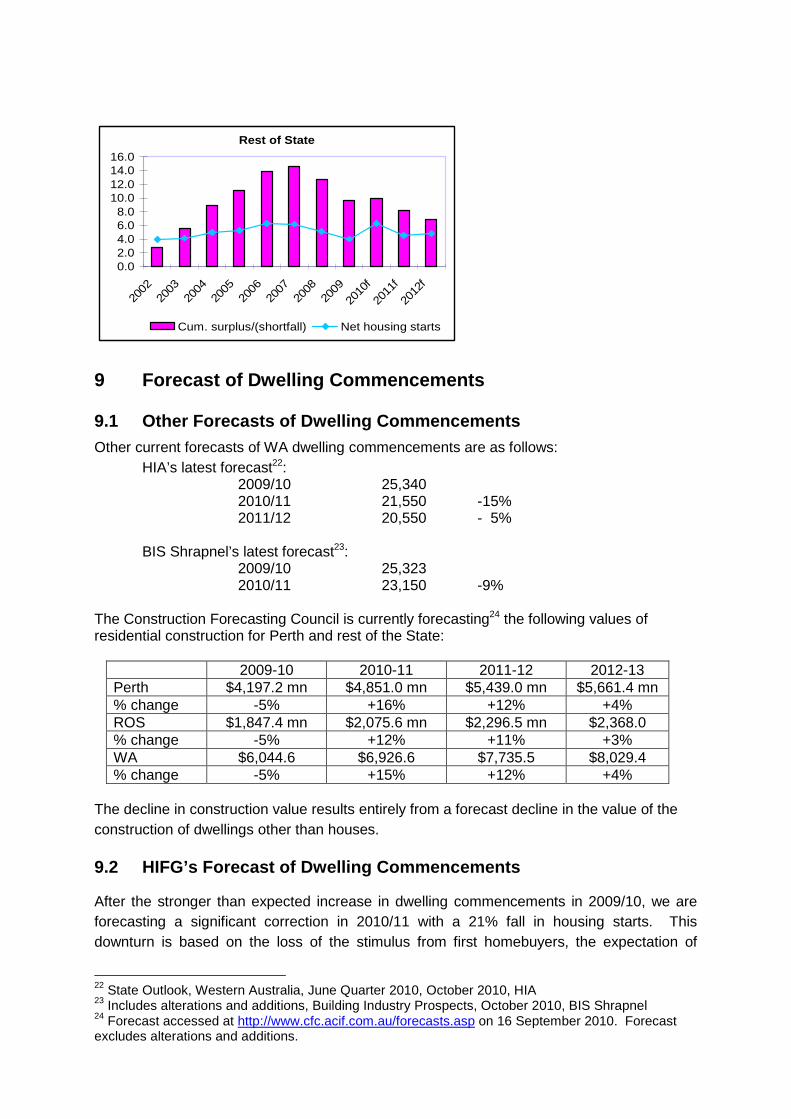
8.2 State of Supply In terms of the state of housing supply, the HIFG has adopted the National Housing Supply Council model updated to reflect the increase in persons per household indicated in the latest ABS household projections. This presents a dramatic turnaround in the state of housing supply in WA as at June 2009 whereby the NHSC suggested a shortfall of some 30,000, the model based on completions suggest the housing system was in virtual equilibrium in June 2009. Despite there being 25,200 new commencements in 2009-10, the volume of completions was only 22,200, which resulted in the supply balance turning negative and a theoretical shortfall of 5,000 in WA in 2010. However, the approach of using completions fails to acknowledge the increase in dwellings under construction, which has increased by 15% across the year, providing a buffer in terms of new dwellings to become available to meet demand. The alternate approach of using commencements, which has been the traditional method of assessing the state of supply, allows for the inclusion of projected commencements to forecast the state of supply over the short term. With the benefit of disaggregated commencement data below the state level provided by ABS along with historic population data and projections, the HIFG is able to make a more informed assessment of housing supply in WA. Using this methodology, Figure 14 below charts the estimated surplus/shortfall of dwellings in WA, Perth and the rest of the State for 2002 to 2012 against the number of dwelling commencements net of demolitions and an adjustment for un-occupied properties. Figure 14: Net dwelling starts and cumulative surpl us/shortfall of dwellings, WA, Perth & ROS
WA
-20.0
-10.0
0.0
10.0
20.0
30.0
40.0
20022003
20042005
20062007
20082009
2010f2011f
2012f
Cum. Surplus/shortfall Net dwelling starts
Perth
-20.0-15.0-10.0
-5.00.05.0
10.015.020.025.0
2002
2003
2004
2005
2006
2007
2008
2009
2010
f
2011
f
2012
f
Cum. surplus/shortfall Net housing starts
Rest of State
0.02.04.06.08.0
10.012.014.016.0
2002
2003
2004
2005
2006
2007
2008
2009
2010
f
2011
f
2012
f
Cum. surplus/(shortfall) Net housing starts
9 Forecast of Dwelling Commencements
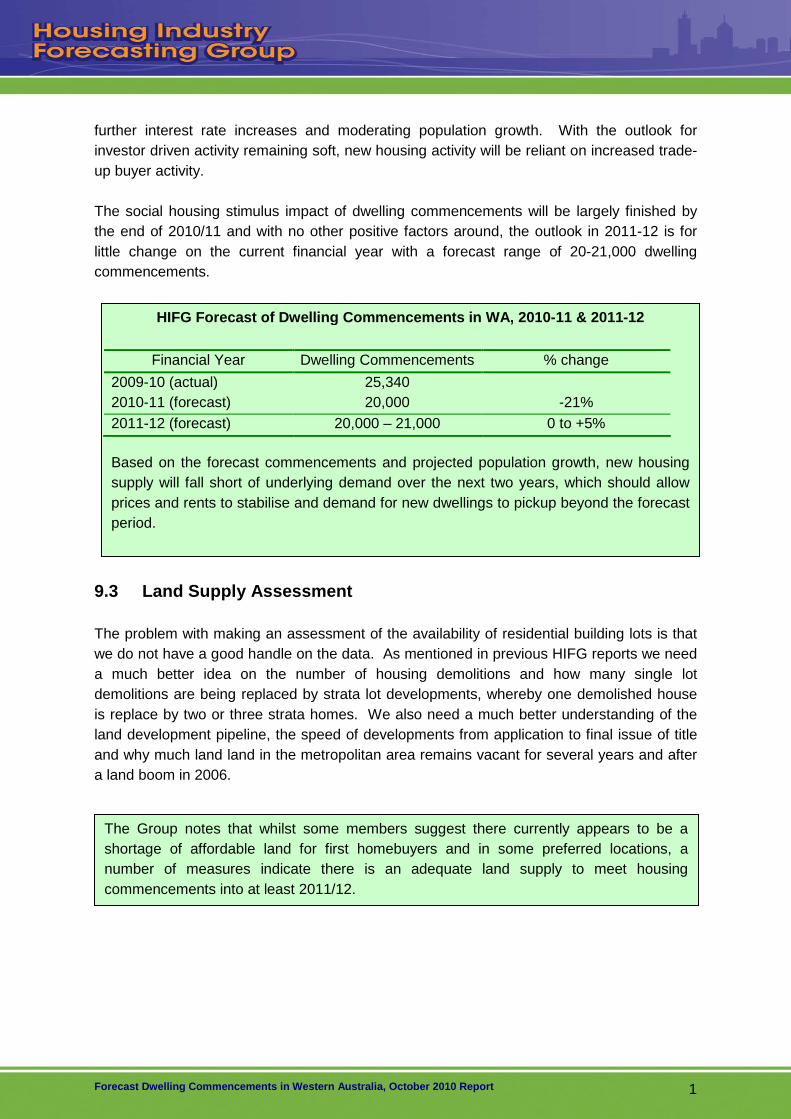
9.1 Other Forecasts of Dwelling Commencements Other current forecasts of WA dwelling commencements are as follows:
HIA’s latest forecast22: 2009/10 25,340 2010/11 21,550 -15% 2011/12 20,550 - 5%
BIS Shrapnel’s latest forecast23:
2009/10 25,323 2010/11 23,150 -9%
The Construction Forecasting Council is currently forecasting24 the following values of residential construction for Perth and rest of the State:
2009-10 2010-11 2011-12 2012-13 Perth $4,197.2 mn $4,851.0 mn $5,439.0 mn $5,661.4 mn % change -5% +16% +12% +4% ROS $1,847.4 mn $2,075.6 mn $2,296.5 mn $2,368.0 % change -5% +12% +11% +3% WA $6,044.6 $6,926.6 $7,735.5 $8,029.4 % change -5% +15% +12% +4%
The decline in construction value results entirely from a forecast decline in the value of the construction of dwellings other than houses.
9.2 HIFG’s Forecast of Dwelling Commencements
After the stronger than expected increase in dwelling commencements in 2009/10, we are forecasting a significant correction in 2010/11 with a 21% fall in housing starts. This downturn is based on the loss of the stimulus from first homebuyers, the expectation of
22 State Outlook, Western Australia, June Quarter 2010, October 2010, HIA 23 Includes alterations and additions, Building Industry Prospects, October 2010, BIS Shrapnel 24 Forecast accessed at http://www.cfc.acif.com.au/forecasts.asp on 16 September 2010. Forecast excludes alterations and additions.
1111
Forecast Dwelling Commencements in Western Australi a, October 2010 Report 1
further interest rate increases and moderating population growth. With the outlook for investor driven activity remaining soft, new housing activity will be reliant on increased trade-up buyer activity. The social housing stimulus impact of dwelling commencements will be largely finished by the end of 2010/11 and with no other positive factors around, the outlook in 2011-12 is for little change on the current financial year with a forecast range of 20-21,000 dwelling commencements.
9.3 Land Supply Assessment The problem with making an assessment of the availability of residential building lots is that we do not have a good handle on the data. As mentioned in previous HIFG reports we need a much better idea on the number of housing demolitions and how many single lot demolitions are being replaced by strata lot developments, whereby one demolished house is replace by two or three strata homes. We also need a much better understanding of the land development pipeline, the speed of developments from application to final issue of title and why much land land in the metropolitan area remains vacant for several years and after a land boom in 2006.
The Group notes that whilst some members suggest there currently appears to be a shortage of affordable land for first homebuyers and in some preferred locations, a number of measures indicate there is an adequate land supply to meet housing commencements into at least 2011/12.
HIFG Forecast of Dwelling Commencements in WA, 20 10-11 & 2011-12
Financial Year Dwelling Commencements % change
2009-10 (actual) 25,340 2010-11 (forecast) 20,000 -21% 2011-12 (forecast) 20,000 – 21,000 0 to +5%
Based on the forecast commencements and projected population growth, new housing supply will fall short of underlying demand over the next two years, which should allow prices and rents to stabilise and demand for new dwellings to pickup beyond the forecast period.

2222
Forecast Dwelling Commencements in Western Australi a, October 2010 Report 2
Appendix A – Regional Land and Housing Activity B1 Introduction This appendix provides a summary of land development and building activity in regional Western Australia, using available data and reports from HIFG member organisations. B2 State Overview Figure 13 shows the trend in building approvals between Perth and regional Western Australia since 1991/92. Perth’s share of building approvals was 70% in 2009/10, slightly below the long-term average of 71%, varying from a low of 69% in 1997/98 to a high of 76% in 1991/92 and 1993/94. Figure 15: Building approvals in Perth and regional WA, 1991/92 - 2009/10 Source: ABS Cat No 8731.0
0
5,000
10,000
15,000
20,000
25,000
30,000
91/9
292
/93
93/9
494
/95
95/9
696
/97
97/9
898
/99
99/0
000
/01
01/0
202
/03
03/0
404
/05
05/0
606
/07
07/0
808
/09
09/1
0
Perth - Houses Perth - other Regional - Houses Regional - other
Other dwellings as a percentage of total building approvals varied between 14% and 27% over the period, with a figure of 19% in 2009/10. Perth accounted for 72% of ‘other’ building approvals in WA in 2009/10, down from 81% in the previous year. B3 Perth Metropolitan Region Land supply has being decreasing in most areas across the metropolitan region. Figure 14 shows land listings held by REIWA members since March 2008 and the increase in listings since the low point in December 2009 as at September 2010, listings were 48% higher compared to December 2009.

3333
Forecast Dwelling Commencements in Western Australi a, October 2010 Report 3
Figure 16: Land listings in Perth, March 2008 - Sep t 2010 Source: REIWA
0
500
1,000
1,500
2,000
2,500
3,000
Mar-08
May-08
Jul-08
Sep-08
Nov-08
Jan-09
Mar-09
May-09
Jul-09
Sep-09
Nov-09
Jan-10
Mar-10
May-10
Jul-10
Sep-10
Figure 15 shows the trend in land listings by metropolitan regions since March 2008. All sectors of Perth have seen increases in listings since December 2009 although the south east corridor has had a decline over couple of months. Figure 17: Land listings by metropolitan regions, M arch 2008 - Sept 2010 Source: REIWA
0
100
200
300
400
500
600
700
800
900
Mar
-08
Apr
-08
May
-08
Jun-
08Ju
l-08
Aug
-08
Sep
-08
Oct
-08
Nov
-08
Dec
-08
Jan-
09F
eb-0
9M
ar-0
9A
pr-0
9M
ay-0
9Ju
n-09
Jul-0
9A
ug-0
9S
ep-0
9O
ct-0
9N
ov-0
9D
ec-0
9Ja
n-10
Feb
-10
Mar
-10
Apr
-10
May
-10
Jun-
10Ju
l-10
Aug
-10
Sep
-10
NW SE SW
NE INNER & MIDDLE NORTH & CITY INNER & MIDDLE SOUTH
MANDURAH MURRAY

4444
Forecast Dwelling Commencements in Western Australi a, October 2010 Report 4
The following table is derived from the UDIA(WA) member survey for the June quarter of 2010 and shows the spread of lots on the market and lot potential from lots not currently on the market and lots under construction and to be released within the next 12 months. Table B1: Lots on Market and Lot Potential by Metro Region , June quarter 2010 Perth Regional Sectors Lots on Market Lots not on
market Lots within 12 months
North West 458 171 888 South East 230 90 604 South West 873 215 1,113 North East 109 16 370 Inner and Middle North & City 44 0 90 Inner and Middle South 11 7 0 Total 1,725 499 3,065 Source: Urban Development Index, June Quarter 2010, UDIA(WA)
Building approvals data by Perth regions for 2009/10 are shown in the following chart. Figure 18: Building approvals by metropolitan regio ns, 2009/10 Source: ABS Cat no. 8731.0
0
500
1000
1500
2000
2500
3000
3500
4000
NW NE SE SW Inner & MiddleNorth + city
Inner & MiddleSouth
Houses Other
Building approvals continue to show the trends of houses in the corridors and other dwelling approvals mainly in the inner and middle suburbs of Perth. While other dwellings represented 20% of total approvals, this proportion reached 46% in the inner and middle North and 25% if Inner and middle south suburbs with the figure reducing to 6% in the south east corridor of the metropolitan area.

5555
Forecast Dwelling Commencements in Western Australi a, October 2010 Report 5
B4 Regional Western Australia – Activity 2009-10 Data on land development from the WA Planning Commission summarised in table B2 indicates that while there are plenty of residential building lots under assessment and with conditional approval there is a low level of lots with final approval. As discussed in section 9.1 above, it can take a considerable time to process the various conditions and if a sudden increase in demand for lots happens then land shortages could eventuate.
Table B2: State Lot Activity, June Quarter 2010
Region Applications lodged by
Developers: proposed
lots
Applications under
assessment: proposed
lots
Conditional approvals: proposed
lots
Developers’ stock of
conditional approvals: proposed
lots
Final approvals:
lots
Peel 560 343 188 6,671 139 South West 328 1,595 1,023 9,183 233 Great Southern 226 981 191 4,196 65 Mid-West 745 1,717 85 3,775 11 Wheatbelt 325 542 321 2,897 7 Goldfields-Esp 44 7 4 1,423 67 Gascoyne 4 77 3 107 24 Pilbara 375 21 303 1,654 161 Kimberley 323 21 12 728 9 Total 2,930 5,304 2,130 30,634 716 Source: State Lot Activity, June Quarter 2010, WAPC Regional members of the Master Builders Association report plentiful land supply in Albany, Kalgoorlie and Esperance. In the South West, while land supply is currently reasonable, new land developments are needed to meet future demand but financial constraints are being placed on developers requiring percentage of presales. Building construction was described as slow but steady in most areas with activity picking up in Esperance and expected to pick up in Kalgoorlie in the next six months and in Bunbury not until next year. Building activity in the regions has shown substantial falls in 2008/09 compared to the previous financial year, except for the Pilbara where building approvals were 52% higher. Gascoyne had an 11% increase in approvals over the year but this was from a very low base figure.

6666
Forecast Dwelling Commencements in Western Australi a, October 2010 Report 6
Figure 19: Building approvals for four southern reg ions, 1991/92 - 2009/10 Source: ABS Cat No. 8731.0
0
500
1000
1500
2000
2500
3000
91/92 92/93 93/94 94/95 95/96 96/97 97/98 98/99 99/00 00/01 01/02 02/03 03/04 04/05 05/06 06/07 07/08 08/09 09/10
Peel South West Gt Southern Wheatbelt
Figure 17 demonstrates the increase in building approvals in 2009/10 in all of the southern regions with the exception of the Wheatbelt. Figure 20: Building approvals for remaining regions , 1991/92 - 2009/10 Source: ABS Cat No. 8731.0
0
100
200
300
400
500
600
700
800
91/92 92/93 93/94 94/95 95/96 96/97 97/98 98/99 99/00 00/01 01/02 02/03 03/04 04/05 05/06 06/07 07/08 08/09 09/10
Goldfields/Esp Gascoyne Midwest Pilbara Kimberley
Figure 18 shows the movement in building approvals for the regions other than Perth and the four southern regions. Despite a fall in 2009/10, building approvals remained at a historically high level in the Pilbara region. Building approvals in the Midwest and Kimberley both witnessed very strong growth in approvals for the year.

7777
Forecast Dwelling Commencements in Western Australi a, October 2010 Report 7
Appendix B – Housing Industry Forecasting Group The Group is a joint industry and government body re-established in February 2008 to provide independent commentary on the housing sector in WA. The Department of Planning and the Department of Housing jointly provide the HIFG secretariat and research function.
Membership of the Group is drawn from major organisations associated with the housing and land development industry in Western Australia and from government. Through its diverse membership, the Group has access to considerable expertise and knowledge of the sector, including land development, real estate, the private rental market, social housing, building statistics, demographics, building resources and home finance.
HIFG Members – as at October 2010
Member Organisation Represented
Stewart Darby (Chair) Real Estate Institute of WA Alan Langford Bankwest Wavne Rikkers Australian Bureau of Statistics Dana Mason Chamber of Commerce and Industry WA John Dastlik Housing Industry Association Gavan Forster Master Builders Association Damian Callachor Chamber of Minerals and Energy Debra Goostrey Urban Development Institute of Australia (WA) Glen Kar Department of Housing Michael Eckermann Department of Treasury and Finance Steven Rowley Housing and Urban Research Institute of WA Brett Coombes Water Corporation Marcus Devenish Department of Premier and Cabinet Stuart McKnight Department of Planning Erwin Swasbrook Department of Planning Observers Marion Thompson Urban Development Coordinator Secretariat Ian Hafekost

8888
Forecast Dwelling Commencements in Western Australi a, October 2010 Report 8