of certified physician - microsoft · pdf file · 2017-09-30about the data and...
TRANSCRIPT

Certified Physician Assistants
2015
Statistical
ofProfile
© 2016 NCCPA All Rights Reserved
an Annual Report of the National Commission on Certification of Physician Assistants

Message from the President and CEODawn Morton-Rias, Ed.D, PA-C
Dear Colleagues:
As the PA profession’s certification body, we believe that all people should have access to affordable, high quality health care and that certified PAs are vital to the delivery of that care. We work to support certified PAs and their patients by advancing the credibility and capabilities of the PA workforce through certification and recertification processes that reflect standards of knowledge, skills and behaviors required upon entry into practice and throughout the PA career.
The work of the certification body complements that of the educational programs that prepare PA students for entry to practice and that of medical education program providers that offer continuous professional development activities. Together we are advancing the multiplying force of certified PAs working in collaboration with physicians across the health care landscape to make affordable, high quality care more accessible. From rural health clinics to urban hospitals, from Alaska to Florida, in the US and abroad, certified PAs are meeting the needs of patients whatever and wherever they may be.
This report documents the current state of PA practice in terms of geographic distribution, practice patterns and demographic characteristics. Our hope is that those who develop policies, make hiring decisions and report on matters related to health care and health care providers will find this and other NCCPA reports and to be indispensable resources on the growing PA profession.
Sincerely,
Dawn Morton-Rias, Ed.D, PA-C
© 2016 NCCPA All Rights Reserved Message from the President and CEO | 2

About the Data and Collection Methodology
IntroductionSince certifying the first physician assistants (PAs) in 1975, NCCPA has collected data on the PA profession as PAs completed various processes related to obtaining initial certification and then maintaining certification by earning and logging continuing medical education credits and passing recertification examinations. In May 2012, NCCPA’s data gathering efforts were significantly enhanced with the launch of the PA Professional Profile. This data gathering instrument is presented to PAs through a secure portal within NCCPA’s website. The Profile was launched with two modules: ”About Me” and ”My Practice.” In December 2012, NCCPA added a “Recently Certified” module delivered online to PAs who have been certified for less than six months. Data from that module can be found in another report (2014 Statistical Profile of Recently Certified Physician Assistants) and will be updated yearly.
Data Editing and AnalysisData reflected in this report includes responses from PAs who were certified as of December 31, 2015 and completed at least a portion of the Profile between May 2012 and December 31, 2015. In addition, some data was obtained from other NCCPA data collection strategies. As of December 31, 2015, there were 108,717 certified PAs, and 101,739 provided responses for at least a portion of the PA Professional Profile, yielding an overall response rate of 93.6%. The data provided in this report has been aggregated from the individual response data provided by PAs through the PA Professional Profile or other NCCPA data gathering efforts. Responses were examined for consistency and potential errors. In cases of obvious error or inconclusive data, the responses were not included in the analysis. The number of responses to individual items varies due to differing response rates or due to the data being removed for reasons previously noted. Analyses of the data consist primarily of descriptive statistics.
About NCCPANCCPA is the only certifying organization for PAs in the United States. Established as a not-for-profit organization in 1974, NCCPA is dedicated to providing certification programs that reflect standards for clinical knowledge, clinical reasoning and other medical skills and professional behaviors required upon entry into practice and throughout the careers of PAs. All U.S. states, the District of Columbia and the U.S. territories have decided to rely on NCCPA certification as one of the criteria for licensure or regulation of PAs. More than 130,000 physician assistants have been certified by NCCPA since 1975.
For more information about NCCPA, visit our website: www.nccpa.net.
© 2016 NCCPA All Rights Reserved Data and Collection Methodology | 3

Table of ContentsMESSAGE FROM THE PRESIDENT/CEO . . . . . . . . . . . . . . . . . . . . . . . . . . . . . . . . . . . . . . . . . 2ABOUT THE DATA AND COLLECTION METHODOLOGY . . . . . . . . . . . . . . . . . . . . . . . . . . . . . 3Introduction . . . . . . . . . . . . . . . . . . . . . . . . . . . . . . . . . . . . . . . . . . . . . . . . . . . . . . . . . . . . . . . . . . . 3Data Editing and Analysis . . . . . . . . . . . . . . . . . . . . . . . . . . . . . . . . . . . . . . . . . . . . . . . . . . . . 3About NCCPA . . . . . . . . . . . . . . . . . . . . . . . . . . . . . . . . . . . . . . . . . . . . . . . . . . . . . . . . . 3GEOGRAPHIC DISTRIBUTION. . . . . . . . . . . . . . . . . . . . . . . . . . . . . . . . . . . . . . . . . . . 5-8Distribution of PAs by State . . . . . . . . . . . . . . . . . . . . . . . . . . . . . . . . . . . . . . . . . . . . . 5Distribution of PAs per 100,000 Population . . . . . . . . . . . . . . . . . . . . . . . . . . . . . . . . . . . . 6PAs by State, Number, Percent, and Rate . . . . . . . . . . . . . . . . . . . . . . . . . . . . . . . . . 7-8GENDER AND AGE . . . . . . . . . . . . . . . . . . . . . . . . . . . . . . . . . . . . . . . . . . 9RACE AND ETHNICITY . . . . . . . . . . . . . . . . . . . . . . . . . . . . . . . . . . . . . . . . . . 10EDUCATION . . . . . . . . . . . . . . . . . . . . . . . . . . . . . . . . . . . . . . . . . . . . . . . . . . 11LANGUAGE OTHER THAN ENGLISH SPOKEN WITH PATIENTS . . . . . . . . . . . . . . . . . 12CLINICAL PRACTICE . . . . . . . . . . . . . . . . . . . . . . . . . . . . . . . . . . . . . . . 13-19Top PA Practice Areas (Principal Clinical Position) . . . . . . . . . . . . . . . . . . . . . . . . . . . . 13Principal Clinical Position . . . . . . . . . . . . . . . . . . . . . . . . . . . . . . . . . . . . . . . . . 14Primary Care and Non-Primary Care by State . . . . . . . . . . . . . . . . . . . . . . . . . . . . 15-16Practice Setting . . . . . . . . . . . . . . . . . . . . . . . . . . . . . . . . . . . . . . . . . . . 17Planning to Leave Principal Clinical Position . . . . . . . . . . . . . . . . . . . . . . . . . . . . . 18Distribution Working in More than One Position . . . . . . . . . . . . . . . . . . . . . . . . . . 19NON-CLINICAL PRACTICE . . . . . . . . . . . . . . . . . . . . . . . . . . . . . . . . . . . . . . . . 20INCOME . . . . . . . . . . . . . . . . . . . . . . . . . . . . . . . . . . . . . . . . . . . . . . . . 212016 AND BEYOND . . . . . . . . . . . . . . . . . . . . . . . . . . . . . . . . . . . . . . . . . 22
© 2016 NCCPA All Rights Reserved | 4

5 © NCCPA. 2016. All rights reserved.
Distribution of Certified Physician Assistants in the U.S.
Number of PAs by state; Rate of PAs per 100,000 population by state (divided by quartiles); Actual
number, percentage of total population of certified PAs, and number per 100,000 people by state with state
rankings.
continues to grow and the number of PA programs is expected to increase by 30%.
Figure 1: Distribution of PAs by State (Divided by Quartiles)
Noteworthy:
There were approximately
80,019 certified PAs at the
end of 2010; the profession
grew 35.9% over the next
5 years reaching 108,717
certified PAs at the end of
2015.
Mississippi and Arkansas
experienced the highest
percentage growth
between 2014 and 2015
(18.6% and 15.4%
respectively). North
Dakota experienced the
lowest growth of 0.7%.
Fig. 1 highlights the states with the
greatest numbers of certified
PAs based on state of residence as
reported to NCCPA.
On Dec. 31, 2015, there were
108,717 certified PAs. The number
of PAs has grown 6.6% between
2014 and 2015.
Geographic Distribution

6 © NCCPA. 2016. All rights reserved.
Figure 2: Distribution of PAs per 100,000 Population
Fig. 2 depicts the
number of certified
PAs per 100,000
residents of each state
(based on 2015 US
Census Bureau
estimates).
Noteworthy:
In 2015, there were
34 PAs per 100,000
population in the
U.S.
The Accreditation
Review
Commission on
Education for the
Physician Assistant
(ARC-PA) expects
that the number of
PA educational
programs will grow
from 199 today to
273 by 20201.
Geographic Distribution
1 ARC-PA Accreditation Standards for Physician Assistant Education©,http://www.arc-pa.com/documents/current%20and%20project%.20growth%204.17.15.pdf

7 © NCCPA. 2016. All rights reserved.
Table 1: PAs by State, Number, Percent, Rate and Rank
State Number Percent of
Total
(Rank)
Rate*
(Rank)
Alabama 677 0.6 % (38) 13.9 (49)
Alaska 526 0.5% (41) 71.2 (1)
Arizona 2,377 2.2% (17) 34.8 (26)
Arkansas 329 0.3% (44) 11.0 (50)
California 8,605 8.0% (2) 22.0 (44)
Colorado 2,855 2.6% (11) 52.3 (9)
Connecticut 1,918 1.8 % (20) 53.4 (7)
Delaware 299 0.3% (47) 31.6 (34)
D.C. 232 0.2% (50) 34.5 (27)
Florida 6,765 6.3% (5) 33.4 (31)
Georgia 3,240 3.0% (8) 31.7 (33)
Hawaii 290 0.3% (48) 20.3 (46)
Idaho 855 0.8% (34) 51.7 (12)
Illinois 2,964 2.7% (9) 23.0 (43)
State Number Percent of
Total
(Rank)
Rate*
(Rank)
Indiana 1,173 1.1% (26) 17.7 (47)
Iowa 1,026 0.9% (29) 32.8 (32)
Kansas 1,050 1.0% (28) 36.1 (25)
Kentucky 1,230 1.1% (25) 27.8 (36)
Louisiana 1,009 0.9% (30) 21.6 (45)
Maine 735 0.7% (35) 55.3 (4)
Maryland 2,661 2.5% (14) 44.3 (16)
Massachusetts 2,710 2.5% (13) 39.9 (18)
Michigan 4,461 4.1% (7) 45.0 (15)
Minnesota 2,180 2.0% (19) 39.7 (21)
Mississippi 172 0.2% (51) 5.7 (51)
Missouri 951 0.9% (32) 15.6 (48)
Montana 548 0.5% (40) 53.1 (8)
Nebraska 991 0.9% (31) 52.3 (10)
*Rate per 100,000 population based on 2015 US Census estimate (continued)
Noteworthy:
Certified PAs
practice
medicine in all
50 states and
D.C.
The top five states
ranked by the
number of
certified PAs are:
1. New York
2. California
3. Texas
4. Pennsylvania
5. Florida
The top five states
ranked by
concentration per
100,000
population are:
1. Alaska
2. South Dakota
3. Pennsylvania
4. Maine
5. New York
Geographic Distribution

8 © NCCPA. 2016. All rights reserved.
State Number Percent of
Total
(Rank)
Rate*
(Rank)
Nevada 714 0.7% (36) 24.7 (41)
New Hampshire 653 0.6% (39) 49.1 (14)
New Jersey 2,451 2.3% (16) 27.4 38)
New Mexico 708 0.7% (37) 34.0 (29)
New York 10,843 10.0% (1) 54.8 (5)
North Carolina 5,236 4.8% (6) 52.1 (11)
North Dakota 304 0.3% (46) 40.2 (17)
Ohio 2,858 2.6% (10) 24.6 (42)
Oklahoma 1,337 1.2% (24) 34.2 (28)
Oregon 1,454 1.3% (22) 36.1 (24)
Pennsylvania 7,143 6.6% (4) 55.8 (3)
Rhode Island 315 0.3% (45) 29.8 (35)
South Carolina 1,352 1.2% (23) 27.6 (37)
South Dakota 522 0.5% (42) 60.8 (2)
State Number Percent of
Total
(Rank)
Rate*
(Rank)
Tennessee 1,744 1.6% (21) 26.4 (40)
Texas 7,335 6.8% (3) 26.7 (39)
Utah 1,169 1.1% (27) 39.0 (22)
Vermont 335 0.3% (43) 53.5 (6)
Virginia 2,806 2.6% (12) 33.5 (30)
Washington 2,623 2.4% (15) 36.6 (23)
West Virginia 947 0.9% (33) 51.4 (13)
Wisconsin 2,296 2.1% (18) 39.8 (19)
Wyoming 233 0.2% (49) 39.8 (20)
TOTAL 108,207 100%
Table 1: PAs by State, Number, Percent, Rate and Rank, continued
*Rate per 100,000 population based on 2015 US Census estimate
Noteworthy:
An additional 510 certified PAs were living abroad
in 2015, bringing the total number of certified
PAs at the end of 2015 to 108,717.
Geographic Distribution

9 © NCCPA. 2016. All rights reserved.
Gender and Age of Certified Physician Assistants
Distribution of certified PAs by age and gender; Number by gender; Number by age group.
Figure 3: Distribution of Certified PAs by Age and Gender
Table 2: Number of PAs by Gender
Gender Number Percent
Male 35,648 32.8%
Female 73,055 67.2%
Total 108,703 100.0%
In Table 2, the total
numbers are less than the
total number of certified
PAs (see Table 3) due to
the decision of some not
to report a gender.
Age Group Number Percent
<30 19,157 17.6%
30-39 40,236 37.0%
40-49 25,119 23.1%
50-59 15,406 14.2%
60+ 8,799 8.1%
TOTAL 108,717 100.0%
Table 3: Number of PAs by Age Group
Noteworthy:
The median age of certified PAs was
38 in 2015.
In 1980 36% of PAs were female1
Today 67.2% of all certified PAs are
female.
42.0% of all certified PAs were
female and under 40 years old
1 He, Xiaoxing Z., Ellen Cyran, and Mark Salling. "National Trends in the United States of America Physician Assistant Workforce from 1980 to 2007." Human Resources
for Health Hum Resour Health 7.1 (2009): 86. Web
Age and Gender
10 © NCCPA. 2016. All rights reserved.
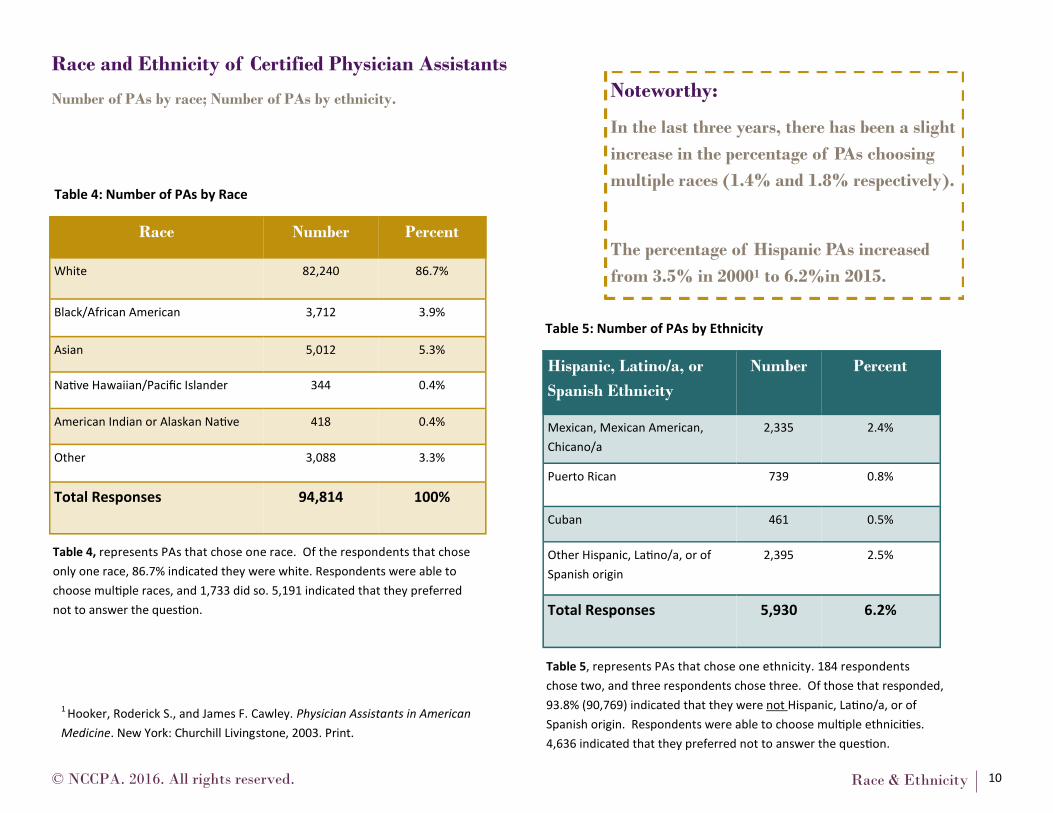
Race and Ethnicity of Certified Physician Assistants
Number of PAs by race; Number of PAs by ethnicity.
continues to grow and the number of PA programs is expected to increase by
30%.
Race Number Percent
White 82,240 86.7%
Black/African American 3,712 3.9%
Asian 5,012 5.3%
Native Hawaiian/Pacific Islander 344 0.4%
American Indian or Alaskan Native 418 0.4%
Other 3,088 3.3%
Total Responses 94,814 100%
Hispanic, Latino/a, or
Spanish Ethnicity
Number Percent
Mexican, Mexican American,
Chicano/a
2,335 2.4%
Puerto Rican 739 0.8%
Cuban 461 0.5%
Other Hispanic, Latino/a, or of
Spanish origin
2,395 2.5%
Total Responses 5,930 6.2%
Table 5: Number of PAs by Ethnicity
Table 4: Number of PAs by Race
Table 4, represents PAs that chose one race. Of the respondents that chose
only one race, 86.7% indicated they were white. Respondents were able to
choose multiple races, and 1,733 did so. 5,191 indicated that they preferred
not to answer the question.
Table 5, represents PAs that chose one ethnicity. 184 respondents
chose two, and three respondents chose three. Of those that responded,
93.8% (90,769) indicated that they were not Hispanic, Latino/a, or of
Spanish origin. Respondents were able to choose multiple ethnicities.
4,636 indicated that they preferred not to answer the question.
Race & Ethnicity
Noteworthy:
In the last three years, there has been a slight
increase in the percentage of PAs choosing
multiple races (1.4% and 1.8% respectively).
The percentage of Hispanic PAs increased
from 3.5% in 20001 to 6.2%in 2015.
1 Hooker, Roderick S., and James F. Cawley. Physician Assistants in American
Medicine. New York: Churchill Livingstone, 2003. Print.

11 © NCCPA. 2016. All rights reserved.
Educational Profile of Certified Physician Assistants
Number of PAs by highest degree completed.
Table 6: Number of PAs by Highest Degree Completed
Degree Number Percent
Certificate program 1,993 2.0%
Associate’s degree 1,778 1.7%
Bachelor’s degree 25,341 24.9%
Master’s degree 69,843 68.6%
PhD 533 0.5%
Ed.D 50 <0.1%
Professional doctorate (e.g.,
MD, DO, DrPh, PsyD)
1,193 1.2%
Other 1,007 1.0%
TOTAL 101,738 100%
Noteworthy:
The average PA educational program is 26.9
months long.1 Over time, programs have
trended towards the graduate level, and by
2020 all PA programs must confer a graduate
degree to be accredited by the Accreditation
Review Commission on Education for the
Physician Assistant (ARC-PA).2 This is
evident as the percentage of master’s degree
certified PAs has increased from 66.2% in
2013 to 68.6% in 2015.3
Forbes ranked physician assistant as #1 of
the 10 most promising jobs of 2015, and The
Bureau of Labor Statistics estimates it will
grow 30.4% between 2014 and 2024.
1 PAEA Physician Assistant Educational Programs in the United States, 30th Report on Physician Assistant Educational Programs in the
United States; 2015.
2 ARC-PA Accreditation Standards for Physician Assistant Education©, 4th edition. 2010 Approved March 2010, updated September 2014
3 NCCPA 2013 Statistical Profile of Certified Physician Assistants, An Annual Report of the National Commission on Certification of
Physician Assistants. 2014.
Education

12 © NCCPA. 2016. All rights reserved.
Languages Other than English Spoken with Patients
Top 10 languages other than English spoken with patients.
Noteworthy:
22.6% of certified PAs can
communicate with patients in a
language other than English
3.5% of certified PAs speak two
or more languages other than
English.
Of the PAs who communicate
with patients in a language
other than English, 81.5% do
so in Spanish.
Figure 4: Percent of Certified PAs that Communicate with Patients in Other Languages
*For PAs that responded “other” to language, the highest number included were: Hebrew, American Sign Language,
Punjabi, Ukrainian, and Malayalam.
Fig. 4 shows the percentage of certified PAs who communicate with patients in languages other than English by the
top 10 most frequently identified languages. A total of 22.6% of respondents indicated they could communicate with
patients in a language other than English.
Language

13 © NCCPA. 2016. All rights reserved.
Current Practice Area of Principal Clinical Position
Top 10 practice areas; All practice areas; Primary care vs non-primary care practice by state; Practice
setting; Intent to leave clinical practice; PAs employed in more than one position.
Figure 5: Top PA Practice Areas by Percent
The Profile asked PAs to identify their practice area and other practice characteristics for both a principal clinical position and — for those working in more than one
clinical setting — for a secondary clinical position. The data shown in this section is based only on responses to the question regarding the principal clinical position. 94.6%
or 86,615 of Profile respondents indicated they practice in at least one clinical position.
Clinical Practice

14 © NCCPA. 2016. All rights reserved.
Table 7: Number and Percent of PAs by Principal Clinical Position *
Area of Practice Number Percent
Adolescent Medicine 167 0.2%
Anesthesiology 362 0.4%
Critical Care Medicine 1,060 1.3%
Dermatology 3,270 4.0%
Emergency Medicine 10,876 13.4%
Family Medicine / General
Practice
17,090 21.0%
Gynecology 323 0.4%
Hospital Medicine 2,654 3.3%
Internal Medicine– General
Practice
4,290 5.3%
Internal Medicine– Subspecialty 7,046 8.6%
Neurology 688 0.8%
Obstetrics and Gynecology 1,024 1.3%
Occupational Medicine 1,280 1.6%
Ophthalmology 60 0.1%
Area of Practice Number Percent
Otolaryngology 730 0.9%
Pathology 11 <.1%
Pediatrics 1,631 2.0%
Pediatrics– Subspecialties 842 1.0%
Physical Medicine / Rehabilita-
tion
821 1.0%
Preventive Medicine / Public
Health
147 0.2%
Psychiatry 1,033 1.3%
Radiation Oncology 147 0.2%
Radiology 578 0.7%
Surgery– General 2,434 3.0%
Surgery– Subspecialties 15,124 18.6%
Urology 958 1.2%
Other 6,628 8.2%
TOTAL 81,274 100.0%
Noteworthy:
28.3% of certified PAs
work in primary care:
family
medicine/general
practice, general internal
medicine, and general
pediatrics.
The pediatric
subspecialties with the
greatest number of PAs
include: neonatal-
perinatal medicine (238),
pediatric emergency
medicine (157) and
pediatric
hematology/oncology
(108).
Clinical Practice
*All clinical positions are listed and are in alphabetical order.
Table 7 shows the number percentage of certified PAs by principal clinical position. Cardiology and gastroenterology were the
two largest internal medicine subspecialties with 2,273 and 1,305 respectively. Surgical subspecialties with the highest number of
PAs include: orthopedic surgery (9,071), cardiothoracic vascular surgery (2,738) and neurosurgery (1,803).

15 © NCCPA. 2016. All rights reserved.
Table 8: Number and Percent of PAs Practicing in Primary Care and Non-Primary Care by State
State Primary
Care*
Number
(percent)
Non-Primary
Care
Number
(percent)
Total
Alabama 104 (22.1%) 367 (77.9%) 471
Alaska 220 (55.8%) 174 (44.2%) 394
Arizona 559 (31.2%) 1,234 (66.8%) 1,793
Arkansas 89 (39.2%) 138 (60.8%) 227
California 2,112 (35.1%) 3,900 (64.9%) 6,012
Colorado 869 (38.3%) 1,398 (61.7%) 2,267
Connecticut 227 (15.8%) 1,211 (84.2%) 1,438
Delaware 47 (20.7%) 180 (79.3%) 227
D.C. 32 (19.3%) 134 (80.7%) 166
Florida 1,187 (23.7%) 3,822 (76.3%) 5,009
Georgia 638 (25.3%) 1,886 (74.7%) 2,524
Hawaii 80 (37.4%) 134 (62.6%) 214
Idaho 266 (40.8%) 386 (59.2%) 652
Illinois 578 (26.1%) 1,639 (73.9%) 2,217
State Primary
Care*
Number
(percent)
Non-Primary
Care
Number
(percent)
Total
Indiana 166 (19.4%) 689 (80.6%) 855
Iowa 344 (42.4%) 467 (57.6%) 811
Kansas 324 (38.7%) 513 (61.3%) 837
Kentucky 261 (27.8%) 677 (72.2%) 938
Louisiana 143 (19.3%) 597 (80.7%) 740
Maine 177 (29.7%) 419 (70.3%) 596
Maryland 359 (18.4%) 1,597 (81.6%) 1,956
Massachusetts 372 (18.3%) 1,658 (81.7%) 2,030
Michigan 900 (26.6%) 2,485 (73.4%) 3,385
Minnesota 567 (32.7%) 1,168 (67.3%) 1,735
Mississippi 31 (26.1%) 88 (73.9%) 119
Missouri 165 (22.8%) 560 (77.2%) 725
Montana 149 (36.5%) 259 (63.5%) 408
Nebraska 354 (43.6%) 458 (56.4%) 812
Clinical Practice

16 © NCCPA. 2016. All rights reserved.
Table 8: Number and Percent of PAs Practicing in Primary Care and Non-Primary Care by State (continued)
State Primary
Care*
Number
(percent)
Non-Primary
Care
Number
(percent)
Total
Nevada 174 (33.5%) 345 (66.5%) 519
New Hampshire 141 (27.8%) 367 (72.2%) 508
New Jersey 308 (17.5%) 1,452 (82.5%) 1,760
New Mexico 212 (41.5%) 299 (58.5%) 511
New York 1,471 (19.2%) 6,183 (80.8%) 7,654
North Carolina 1,271 (31.5%) 2,759 (68.5%) 4,030
North Dakota 112 (48.1%) 121 (51.9%) 233
Ohio 335 (15.7%) 1,801 (84.3%) 2,136
Oklahoma 344 (33.0%) 698 (67.0%) 1,042
Oregon 437 (38.3%) 705 (61.7%) 1,142
Pennsylvania 1,230 (22.7%) 4,197 (77.3%) 5,427
Rhode Island 46 (18.8%) 199 (81.2%) 245
South Carolina 262 (26.2%) 738 (73.8%) 1,000
South Dakota 193 (45.5%) 231 (54.5%) 424
State Primary
Care*
Number
(percent)
Non-Primary
Care
Number
(percent)
Total
Tennessee 418 (33.6%) 825 (66.4%) 1,243
Texas 2,102 (37.9%) 3,447 (62.1%) 5,549
Utah 298 (34.8%) 559 (65.2%) 857
Vermont 89 (33.6%) 176 (66.4%) 265
Virginia 561 (26.7%) 1,537 (73.3%) 2,098
Washington 678 (33.9%) 1,321 (66.1%) 1,999
West Virginia 270 (37.5%) 450 (62.5%) 720
Wisconsin 462 (25.7%) 1,338 (74.3%) 1,800
Wyoming 111 (57.8%) 81 (42.2%) 192
TOTAL 22,845 (28.3%) 58,067 (71.8%) 80,912
*Primary Care: Family Medicine, General Internal Medicine, and General Pediatrics
Noteworthy:
125 certified U.S. military PAs responded. 80 (64.0%) were practicing primary care, and
45 (36.0%) were practicing in a non-primary care specialty.
221 certified PA practicing abroad responded. 86 (38.9%) were practicing primary care
and 135 (61.1%) were practicing in a non-primary care specialty.
Clinical Practice

17 © NCCPA. 2016. All rights reserved.
Table 9: Number of PAs by Principal Clinical Practice Setting
Practice Setting Number Percent
Office-based private practice 34,059 43.6%
Hospital 29,430 37.7%
Federal government facility/hospital/unit 4,817 6.2%
Community health center 2,861 3.7%
Rural health clinic 1,987 2.5%
Public or community health clinic (non-federally
qualified)
1,274 1.6%
Occupational health setting 950 1.2%
School-based or college-based health center or
school clinic
805 1.0%
Extended care facility/nursing home 555 0.7%
Behavioral/mental health facility 391 0.5%
Ambulatory surgical center 325 0.4%
Rehabilitation facility 253 0.3%
Free clinic 252 0.3%
Home health care agency 97 0.1%
Hospice 7 <0.1%
TOTAL 78,063 100.0%
Noteworthy:
The majority of PAs (81.3%) practice
in either an office-based private
practice or a hospital setting.
Average number of hours worked per
week for all PAs in their principal
clinical position: 40.65
Average number of patients seen per
week for all full-time (40+ hours per
week) PAs, that see patients in their
principal clinical position: 75
Clinical Practice
18 © NCCPA. 2016. All rights reserved.
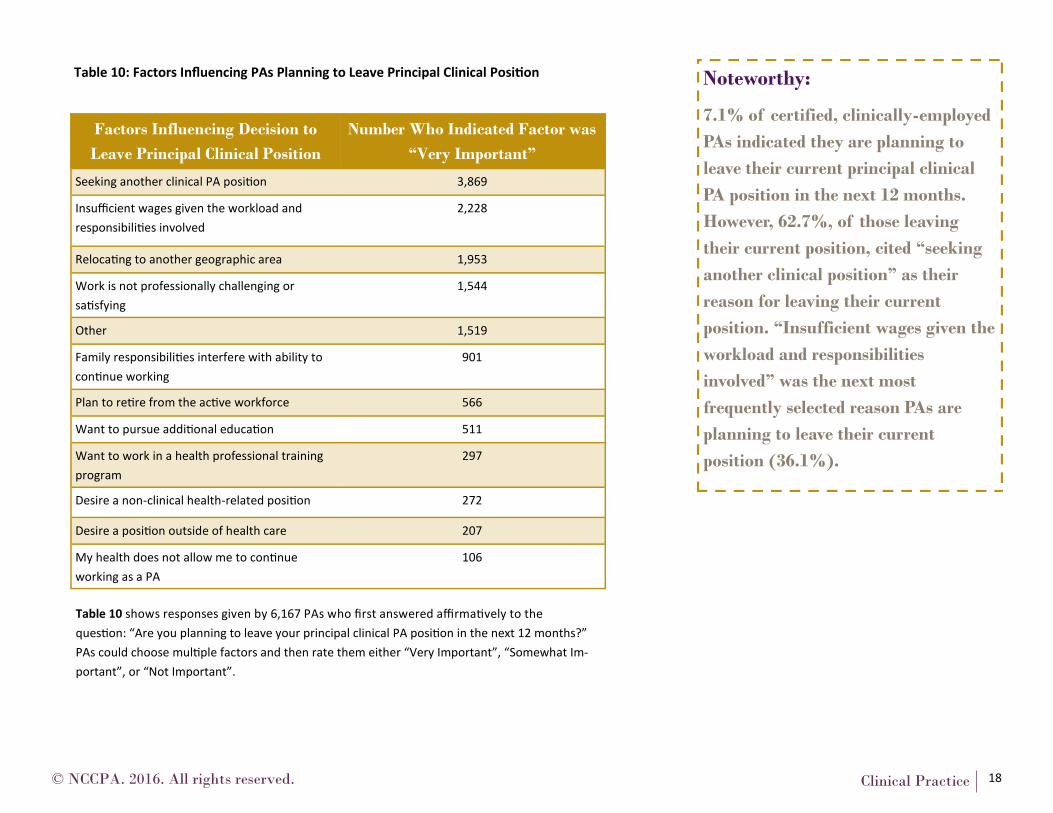
Table 10: Factors Influencing PAs Planning to Leave Principal Clinical Position
Factors Influencing Decision to
Leave Principal Clinical Position
Number Who Indicated Factor was
“Very Important”
Seeking another clinical PA position 3,869
Insufficient wages given the workload and
responsibilities involved
2,228
Relocating to another geographic area 1,953
Work is not professionally challenging or
satisfying
1,544
Other 1,519
Family responsibilities interfere with ability to
continue working
901
Plan to retire from the active workforce 566
Want to pursue additional education 511
Want to work in a health professional training
program
297
Desire a non-clinical health-related position 272
Desire a position outside of health care 207
My health does not allow me to continue
working as a PA
106
Noteworthy:
7.1% of certified, clinically-employed
PAs indicated they are planning to
leave their current principal clinical
PA position in the next 12 months.
However, 62.7%, of those leaving
their current position, cited “seeking
another clinical position” as their
reason for leaving their current
position. “Insufficient wages given the
workload and responsibilities
involved” was the next most
frequently selected reason PAs are
planning to leave their current
position (36.1%).
Table 10 shows responses given by 6,167 PAs who first answered affirmatively to the
question: “Are you planning to leave your principal clinical PA position in the next 12 months?”
PAs could choose multiple factors and then rate them either “Very Important”, “Somewhat Im-
portant”, or “Not Important”.
Clinical Practice

19 © NCCPA. 2016. All rights reserved.
Figure 6: Distribution of PAs Working in More than One Clinical Position Noteworthy:
Certified PAs are
overwhelmingly employed in
only one clinical position
(83.0%). The number one
reason cited by PAs that are
employed in more than one
clinical position was to
supplement their earnings
(44.0%).
PAs that have a secondary
position work an average of
10.8 hours per week and see
an average of 22 patients per
week in their secondary
clinical position.
Figure 7: Top Five Specialty Areas of PAs with More than One Clinical Position *Non-clinical position
does not provide direct
patient care (i.e.
education, research,
administration)
21.1% of PAs working
in a secondary clinical
position are working in
a primary care
specialty in that
position
Clinical Practice

20 © NCCPA. 2016. All rights reserved.
PAs Not in Clinical Practice
Figure 8: Why PAs Do Not Practice Clinically
Noteworthy:
The most selected
reason leaving
clinical practice was
due to family
responsibilities. For
those that chose
“other”, the most
common reason was
they were currently
searching for a
clinical position.
Of the 4,992 PAs that
indicated they were
not employed as a PA
in a clinical position,
13.3% indicated they
are retired from the
active workforce.
For the data shown in Fig. 8,
PAs were encouraged to
check all contributing
factors that applied. A total
of 6,237 factors were
chosen by 4,982 PAs.
Non-Practicing PAs

21 © NCCPA. 2016. All rights reserved.
Income from PA Positions by Principal Clinical Position
Table 11: Total Income in Last Calendar Year from PA Positions
Specialty Number Mean Median
Adolescent Medicine 156 $79,103 $85,000
Anesthesiology 335 $98,940 $95,000
Critical Care Medicine 975 $111,903 $105,000
Dermatology 2,911 $116,958 $105,000
Emergency Medicine 9,942 $114,443 $115,000
Family Medicine / General
Practice
15,902 $94,613 $95,000
Gynecology 293 $84,317 $85,000
Hospital Medicine 2,463 $103,733 $105,000
Internal Medicine– General
Practice
3,952 $94,496 $95,000
Internal Medicine–
Subspecialty
6,624 $95,803 $95,000
Neurology 636 $93,381 $95,000
Obstetrics and Gynecology 938 $87,505 $85,000
Occupational Medicine 1,175 $99,460 $95,000
Ophthalmology 55 $92,636 $95,000
Otolaryngology 673 $95,149 $95,000
Specialty Number Mean Median
Pathology 11 $114,091 $105,000
Pediatrics 1,507 $87,960 $85,000
Pediatrics– Subspecialties 801 $97,047 $95,000
Physical Medicine /
Rehabilitation
766 $94,752 $95,000
Preventive Medicine / Public
Health
136 $90,441 $95,000
Psychiatry 945 $98,206 $95,000
Radiation Oncology 135 $97,296 $95,000
Radiology 535 $102,888 $105,000
Surgery– General 2,224 $104,335 $105,000
Surgery– Subspecialties 13,930 $111,719 $105,000
Urology 882 $100,522 $95,000
Other 6,064 $99,091 $95,000
Noteworthy:
The average salary of certified PAs was $102,163 with the highest
paid to those working in dermatology, emergency medicine,
pathology, surgery subspecialties, and critical care medicine.
Income

22 © NCCPA. 2016. All rights reserved.
2016 and Beyond
NCCPA pursues a research agenda that focuses on its core activities and the ongoing evaluation and improvement of its exams and certification
program. NCCPA is also committed to collaborating with external researchers to share data in appropriate and ethical ways to further advance the
health and safety of the public or otherwise conduct useful research related to PAs. To facilitate research collaborations, NCCPA developed Policies for
the Review of Requests for Data and External Research Collaboration and guidelines that describe the process external researchers will need to follow for
submitting requests for data and how those requests will be reviewed. The policies and guidelines are provided on NCCPA’s web site at
http://www.nccpa.net/Research.
This Statistical Profile will be updated and published annually. In addition, there are supplementary reports that are currently available or scheduled for
release later this year. Those reports include:
Statistical Profile of Recently Certified Physician Assistants (first published 2014)
Statistical Profile of Certified Physician Assistants by State (first published in 2016)
Statistical Profile of Certified Physician Assistants by Specialty (scheduled for release in 2016)
Please cite this report as follows:
National Commission on Certification of Physician Assistants, Inc. (2016, March). 2015 Statistical Profile of Certified Physician Assistants: An Annual
Report of the National Commission on Certification of Physician Assistants. Retrieved Date, from http://www.nccpa.net/research
This study is exempt from IRB review pursuant to the terms of the U.S. Department of Health and Human Service’s Policy for Protection of Human
Research Subjects at 45 C.F.R. §46.101(b).
NCCPA would like to acknowledge the following contributors:
Colette Jeffery, M.A., Research Analyst
Dawn Morton-Rias, EdD, PA-C, President and CEO
Sheila Mauldin, M.N.M., Vice President of Exam Development and Administration
Ragan Cohn, C.A.E., Vice President, Governance & Communications
Please address questions or comments to [email protected].